The Peer-Authored Management Source for Lab Professionals since 1969
types and clinical applications Page 8
LAB INNOVATOR
James
H. Nichols, PhD, DABCC, FAACC
Medical Director of Clinical Chemistry, Point-of-Care Testing, and Special Testing Vanderbilt University Medical Center
The case for advancing preeclampsia screening Page 14
OSHA’s Bloodborne Pathogen standard Page 16
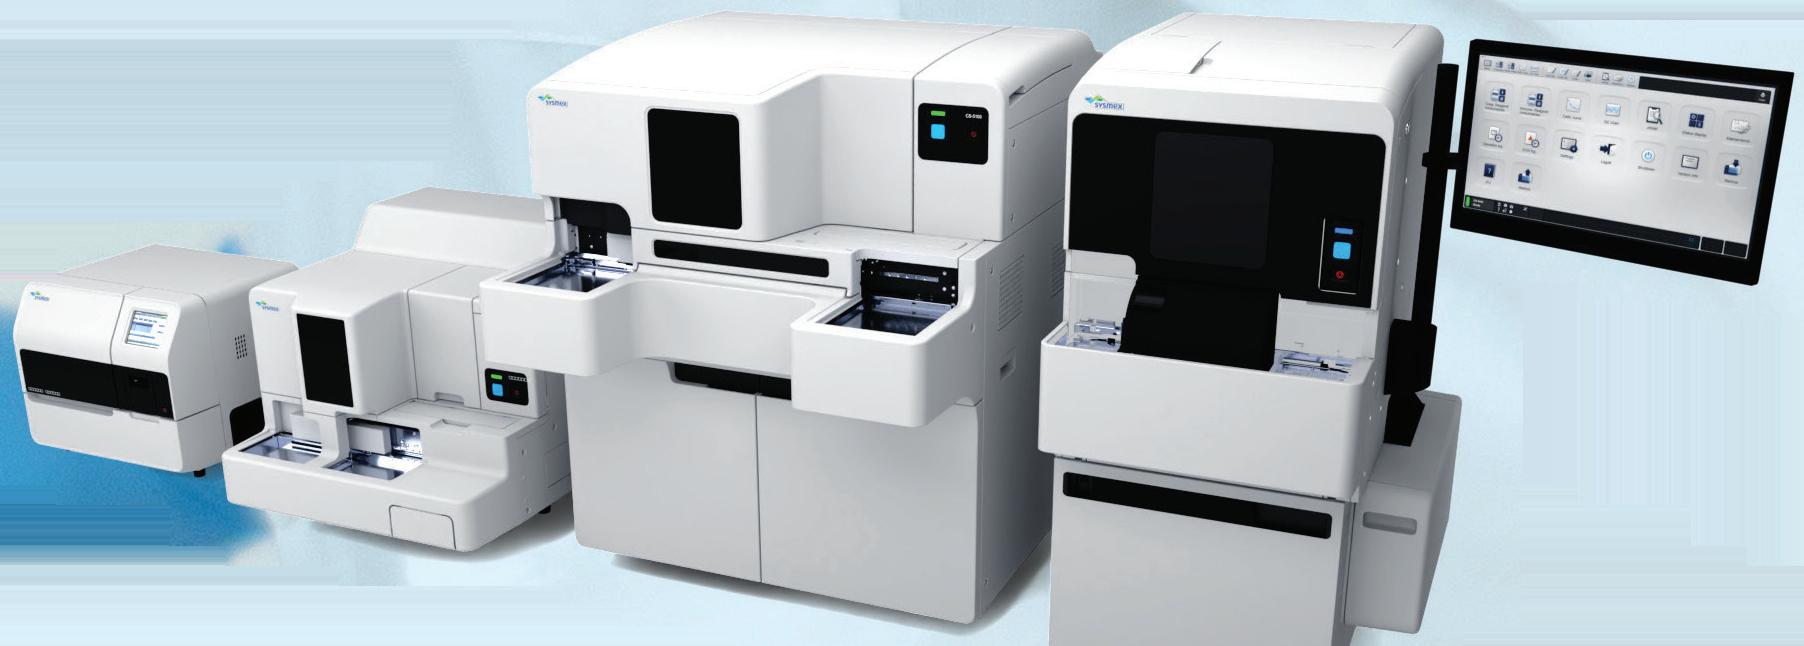
Hemostasis Solutions by Sysmex Reliability is built into ever y thing we do It begins with the winning combination of advanced technology and reagents and is backed by proven reliability and best-inclass ser vice. Par tnering with Sysmex gives you all of that and more, allowing you to clot smar ter, not harder www.sysmex.com/us
Rajasri Chandra, MS,
Telle Ukonaho, M.Sc.,
Lauren N. Hunt, PharmD, BCIDP and Brandon Hill, PharmD, BCIDP
Jeroen Bursens,
Vol. 57, No. 8
Blood culture contamination in U.S. hospitals
By Christina Wichmann
in Chief
Laboratory analysis of blood cultures is the gold standard for diagnosing bloodstream infections, especially for patients with suspected sepsis or septic shock. But contamination during collection poses major challenges. Blood culture contamination can compromise quality of care and lead to unnecessary antibiotic use and prolonged length of hospitalization. Clinical and Laboratory Standards Institute (CLSI) guidelines recommend contamination rates of ≤ 3%, with ≤ 1% considered optimal.
The CDC’s Blood Culture Contamination factsheet1 outlines both the harms of contamination—false-positive sepsis diagnoses, unnecessary antibiotics, C. difficile infections, extended hospital stays, and increased costs—and the strategies to prevent contamination. Recommended strategies include the following:
• Obtaining blood cultures for the right patients, in the right settings, and at the right time (diagnostic stewardship).
• Prioritizing peripheral venipuncture over line draws.
• Employing dedicated phlebotomy teams
• Using skin antisepsis, bottle disinfection, and diversion devices
• Monitoring rates monthly, stratified by unit and collector, and sharing data across stewardship and infection prevention teams.
In this issue of MLO, we have articles on both antimicrobial stewardship (“Antimicrobial stewardship: Empowering labs to drive clinical impact through diagnostics,” page 18) and sepsis (“The need for earlier detection and reliable intervention monitoring for managing sepsis,” page 22). This week I started thinking about blood culture contamination after reading an interesting study published in the Journal of Microbiology that analyzed over 362,000 blood cultures from 52 hospitals across 19 states (2019–2021).2 Contamination rates averaged 1.38% in ICUs and 0.96% on wards when defined by College of American Pathologists (CAP) criteria. Rates were slightly higher when broader CDC/NHSN definitions were applied, underscoring how benchmarks shift with definitions.
The study also found wide variation in practice. Nearly all hospitals tracked contamination rates, yet only 21% monitored single-draw cultures and 39% tracked positivity rates. Few shared data outside the laboratory, limiting quality improvement efforts. Facilities that avoided central line draws, used electronic prompts, or engaged in stewardship interventions reported lower contamination rates. Competency training for blood cultures for nonphlebotomy staff was provided in 40 of the 52 hospitals.
An important element stressed in this study was the variability in how blood culture contamination was defined. Hospitals used CAP (65%), CLSI (17%), and NHSN (17%) criteria to define BCC. However, there is no nationally standardized definition for blood culture contamination. Without it, hospitals may underestimate their true rates or fail to meet best practice thresholds.
With standardization and adoption of proven practices, hospitals can meaningfully reduce contamination, avoid unnecessary antibiotic exposure, cut costs, and improve outcomes for patients with suspected bloodstream infections.
I welcome your comments and questions — please send them to me at cwchmann@mlo-online.com.
References are available online at mlo-online.com/55314900.
EDITOR IN CHIEF Christina Wichmann cwichmann@mlo-online.com
John Brunstein, PhD, Biochemistry (Molecular Virology) President & CSO PathoID, Inc., British Columbia, Canada
Lisa-Jean Clifford, COO & Chief Strategy Officer Gestalt, Spokane, WA
Barbara Strain, MA, SM(ASCP), CVAHP Principal, Barbara Strain Consulting LLC, Formerly Director, Value Management, University of Virginia Health System, Charlottesville, VA
Jeffrey D. Klausner, MD, MPH Professor of Preventive Medicine in the Division of Disease Prevention, Policy and Global Health, Department of Preventive Medicine at University of Southern California Keck School of Medicine. Donna Beasley, DLM(ASCP), Director, Huron Healthcare, Chicago, IL
Anthony Kurec, MS, H(ASCP)DLM, Clinical Associate Professor, Emeritus SUNY Upstate Medical University, Syracuse, NY
Paul R. Eden, Jr., MT(ASCP), PhD, Lt. Col., USAF (ret.), (formerly) Chief, Laboratory Services, 88th Diagnostics/Therapeutics Squadron, Wright-Patterson AFB, OH
Daniel J. Scungio, MT (ASCP), SLS, CQA (ASQ), Consultant at Dan the Lab Safety Man and Safety Officer at Sentara Healthcare, Norfolk, VA CORPORATE TEAM
CEO Chris Ferrell
COO Patrick Rains
CRO Paul Andrews
CDO Jacquie Niemiec
CALO Tracy Kane
CMO Amanda Landsaw
EVP INFRASTRUCTURE & PUBLIC SECTOR GROUP Kylie Hirko
VP OF CONTENT STRATEGY, INFRASTRUCTURE & PUBLIC SECTOR GROUP Michelle Kopier 30 Burton Hills Blvd., Suite 185 Nashville, TN 37215 800-547-7377 | www.mlo-online.com
Medical Laboratory Observer USPS Permit 60930, ISSN 0580-7247 print, ISSN 2771-6759 online is published 10 times annually (Jan, Mar, Apr, May, Jul, Aug, Aug-CLR, Sep, Oct, Nov) by Endeavor Business Media, LLC. 201 N Main St 5th Floor, Fort Atkinson, WI 53538. Periodicals postage paid at Fort Atkinson, WI, and additional mailing offices. POSTMASTER: Send address changes to Medical Laboratory Observer, PO Box 3257, Northbrook, IL 60065-3257. SUBSCRIPTIONS: Publisher reserves the right to reject non-qualified subscriptions. Subscription prices: U.S. $160.00 per year; Canada/Mexico $193.75 per year; All other countries $276.25 per year. All subscriptions are payable in U.S. funds. Send subscription inquiries to Medical Laboratory Observer, PO Box 3257, Northbrook, IL 60065-3257. Customer service can be reached toll-free at 877-382-9187 or at MLO@ omeda.com for magazine subscription assistance or questions. Printed in the USA. Copyright 2025 Endeavor Business Media, LLC.
Editor
LIAISON PLEX® Bloodstream Infection Portfolio
Diasorin empowers you to enhance diagnostic stewardship with smarter bloodstream infection testing
• Gram stain driven, designed for seamless laboratory integration, while minimizing unnecessary testing.
• A strategic, cost-effective solution reinforcing diagnostic and antimicrobial stewardship.
Fast Facts
Current measles status in the U.S.
The Centers for Disease Control and Prevention (CDC) has updated their measles surveillance page. While the West Texas outbreak is over, there are still additional outbreaks across the U.S.
2025 MEASLES STATS AS OF SEPTEMBER 3:
1,431 cases of measles have been confirmed in the U.S.
35 different outbreaks of measles have been reported in the U.S. across 42 states.
92% of cases are among unvaccinated individuals or individuals who don’t know their vaccination status.
FAU says to stop overtreating diabetes in older adults
Joseph G. Ouslander, M.D., a professor of geriatric medicine at Florida Atlantic University’s Charles E. Schmidt College of Medicine, and his collaborator are urging health providers to stop overtreating diabetes and hypertension in older adults. Aggressive treatment “can do more harm than good,” according to an FAU release.1
Dr. Ouslander and his collaborator recently published a paper in the Journal of the American Geriatrics Society calling for healthcare accountability. Overtreating these diseases in older adults can cause “dangerously low blood sugar or blood pressure, emergency visits, hospitalizations, disability or even death.” Dr. Ouslander emphasized that these outcomes are preventable, and prescribers should “be actively encouraged” to offer personalized treatment.
The paper includes recommendations from Dr. Ouslander and co-author Michael Wasserman, M.D. for better caring for older adults with diabetes and hypertension:
• Review new treatment strategies
• Make quality a priority
• Mitigate risks by observing data
• Report personalized treatment plans used
• Work with other researchers, policymakers, and clinicians
12% of cases have been hospitalized.
3 people have died from measles.
Source: https://www.cdc.gov/
• Record data
• Continue research
Alzheimer’s Association publishes blood-based biomarker guidance
The Alzheimer’s Association has published guidance regarding blood-based biomarker tests. The association announced the guidelines at their International Conference and in a release.2
The Alzheimer’s Association recognized a need for “clear evidence-based, brand-agnostic recommendations to support more accurate and accessible diagnosis of Alzheimer’s using blood-based biomarker tests.” The standards, written by 11 clinicians and aided by public comments, will be revised as needed. The current draft covers the following tests: “plasma phosphorylated-tau (p-tau) and amyloid-beta (A β ) tests measuring the following analytes: p-tau217, ratio of p-tau217 to non-p-tau217 ×100 (%p-tau217), p-tau181, p-tau231, and ratio of β42 to Aβ40.”
Key points:
• For patients experiencing cognitive impairment who are being observed in specialized care for memory disorders: 1) blood-based biomarker tests with ≥90% sensitivity and ≥75% specificity can serve as a tool for diagnosing Alzheimer’s, but should be followed up with another methodology if a positive result is shown. 2) blood-based biomarker tests with ≥90% and specificity can replace PET amyloid imaging or CSF Alzheimer’s biomarker testing.
• Alzheimer’s Association warns that “there is significant variability in diagnostic test accuracy and many commercially available BBM tests do not meet these thresholds.”
• Blood-based biomarker tests should not replace clinical assessment.
West Texas measles outbreak update
After 42 days without a confirmed case, The Texas Department of State Health Services has declared their current measles outbreak over, according to an announcement.3
The outbreak consisted of 762 known cases in 2025, more than half of confirmed measles cases nationwide. The Department warned that even though the current outbreak is over, there are still other outbreaks across the country, and it is probable that there will be additional cases in Texas in 2025. They recommend that health providers continue testing for measles in suspected patients. They also recommend vaccination as the best prevention strategy.
The Department’s Commissioner Jennifer A. Shuford, MD, MPH expressed her gratitude towards Texas’s healthcare professionals in the following statement: “I want to highlight the tireless work of the public health professionals across the state who contributed to the containment of one of the most contagious viruses.”
Connection found between certain sweeteners and cognitive decline
Recent research found a connection between certain sweeteners and cognitive decline, especially in diabetes patients. The findings are summarized in an American Academy of Neurology (AAN) press release.4
According to AAN, the researchers investigated aspartame, saccharin, acesulfame-K, erythritol, xylitol, sorbitol, and tagatose in over 12,000 adults over eight years. They discovered that the more artificial sweeteners participants consumed, the quicker they experienced “declines in overall thinking and memory skills.” Specifically, their cognitive decline showed to be “62% faster” than those who used less sweetener.
Additionally, participants under 60 and participants with diabetes who consumed more sweeteners displayed quicker cognitive decline. The researchers “did not find links in people over 60.”
Tagatose was the only studied sweetener that did not speed cognitive decline. AAN emphasized that,“While the study showed a link between the use of some artificial sweeteners and cognitive decline, it did not prove that they were a cause.”
The study is published in AAN’s journal, Neurology.
IU scientists take step to improve kidney disease diagnosis
The Indiana University School of Medicine is working on a human kidney cell roadmap. A group of researchers from the school made a discovery that could change disease diagnosis, according to an announcement.5
Specifically, this new understanding could aid kidney disease staging. Two subtypes of proximal tubule cells were found by the scientists,“one regenerative type plentiful in healthy kidneys, and another featuring a genetic marker that signals disease.” If the amount of these cells is calculated in kidney tissue, “the researchers can more accurately map the level of disease present.”
The researchers hope these findings lead to better life quality for kidney disease patients.
Study findings in favor of condensing common syphilis treatment
Recent study findings found a way to streamline syphilis treatment, hopefully encouraging more patients to seek care. The findings are summarized in a National Institutes of Health (NIH) press release.6
Benzathine penicillin G (BPG) is an antibiotic commonly used to treat syphilis, but it is facing a shortage. Additionally, not all patients complete treatment. BPG is customarily administered in
three separate doses, requiring patients to schedule follow-ups with their provider.
The study investigated the effectiveness of one dose of BPG vs. three in participants with early syphilis. Findings showed similar success rates in both groups (76% vs. 70%, respectively). It is important to note that most of the study participants (97%) were men.
Carolyn Deal, Ph.D., chief of the enteric and sexually transmitted infections branch of NIH’s National Institute of Allergy and Infectious Diseases (NIAID) said in a press release, “Benzathine penicillin G is highly effective against syphilis, but the three-dose regimen can be burdensome and deter people from attending follow-up visits with their healthcare providers. The new findings offer welcome evidence for potentially simplifying treatment with an equally effective one-dose regimen, particularly while syphilis rates remain alarmingly high.”
Mayo Clinic’s AI detects blood mutations early, study finds Mayo Clinic has built an artificial intelligence (AI) tool that can aid in the detection of clonal hematopoiesis of indeterminate potential (CHIP), according to a release.7
The tool, UNISOM, stands for UNIfied SOmatic calling and Machine learning. In an analysis of UNISOM’s functionality, the tool was able to successfully “detect nearly 80% of CHIP mutations using whole-exome sequencing, which analyzes the protein-coding regions of DNA.” When using UNISOM on Mayo Clinic Biobank’s whole-genome sequencing data,“it detected early signs of CHIP, including mutations present in fewer than 5% of blood cells.”
CHIP puts patients at higher risk of developing leukemia and heart disease, regardless of their overall health. Patients with CHIP experience no symptoms, according to Mayo Clinic. This underscores the need for a tool that can diagnose the condition.
UCLA shares strategies for combatting antibiotic resistance UCLA experts shared the steps they took to combat an outbreak of an antibiotic-resistant strain of Pseudomonas aeruginosa in a recent American Journal of Infection Control article. The strategies are summarized in a press release.8
The strain contained ‘New Delhi metallo- β -lactamase’ (NDM-1) and affected eight patients in a Southern
California hospital. According to UCLA, “The cases appeared unrelated, spread out across time and hospital units, defying traditional outbreak patterns.”
Upon connecting the outbreak to a sink in the ICU (with whole genome sequencing), microbiology and infection prevention scientists from UCLA took the following steps to resolve the issue:
1. Cleaned with Virasept every week.
2. Re-did the plumbing in the affected sink.
3. Trained the hospital’s employees “to keep all patient care supplies out of the sink’s splash zone.”
Steps one and three are now permanently implemented in the hospital’s ICU, in addition to modifying all sinks to prevent ‘splash-back.’ According to UCLA, “No additional infections have been reported since these interventions were implemented.”
REFERENCES
1. Galoustian G. Do no harm: Rethink treating Diabetes, hypertension in frail older adults. FAU. August 20, 2025. Accessed September 9, 2025. https://www.fau.edu/ newsdesk/articles/diabetes-hypertensiontreatment-older-adults.php.
2. Alzheimer’s Association releases its first clinical practice guideline for blood-based biomarker tests. Alzheimer’s Association. Accessed September 9, 2025. https://aaic. alz.org/releases-2025/clinical-practiceguideline-blood-based-biomarkers.asp.
3. Texas announces end of West Texas measles outbreak. Texas Department of State Health Services. August 18, 2025. Accessed September 9, 2025. https://www.dshs. texas.gov/news-alerts/texas-announcesend-west-texas-measles-outbreak.
4. Not so sweet: Some sugar substitutes linked to faster cognitive decline. American Academy of Neurology. September 3, 2025. Accessed September 9, 2025. https://www.aan.com/PressRoom/Home/ PressRelease/5281.
5. IU researchers classify kidney cell types that may lead to better disease treatment. Indiana University School of Medicine. August 18, 2025. Accessed September 9, 2025. https://medicine.iu.edu/news/2025/08/ ashkar-kidney-mapping-disease-treatment.
6. One dose of antibiotic treats early syphilis as well as three doses. NIH. September 3, 2025. Accessed September 9, 2025. https:// www.nih.gov/news-events/news-releases/ one-dose-antibiotic-treats-early-syphiliswell-three-doses.
7. Mayo Clinic AI tool finds early signs of blood mutations linked to cancer and heart disease. Mayo Clinic via Newswise. August 25, 2025. Accessed September 9, 2025. https:// www.newswise.com/articles/mayo-clinicai-tool-finds-early-signs-of-blood-mutationslinked-to-cancer-and-heart-disease.
8. These techniques stopped the outbreak of an antibiotic-resistant bacteria in a SoCal hospital. UCLA Health. August 26, 2025. Accessed September 9, 2025. https://www.uclahealth.org/news/ article/these-techniques-stopped-outbreakantibiotic-resistant.
Cancer biomarker types and clinical applications
By Rajasri Chandra, MS, MBA
The National Cancer Institute defines a biomarker as a biological molecule found in blood, other body fluids, or tissues that indicates if a process, or a condition or a disease such as cancer is normal or abnormal. A biomarker is also called a molecular marker or signature molecule.1 Cancer
biomarkers are classified in different ways based on their use (See Figure 1). Cancer biomarkers are used to:3,4
• Assess patients in multiple clinical settings to identify, estimate risk of disease, screen for occult primary cancers, distinguish benign from malignant type, characterize one
Cancer biomarker types and clinical applications
See test online at https://ce.mlo-online.com/courses/ cancer-biomarker-types-and-clinical-applications
Passing scores of 70 percent or higher are eligible for 1 contact hour of P.A.C.E. credit.
LEarning oBJECtiVEs
Upon completion of this article, the reader will be able to:
1. Define how cancer biomarkers are used and list their types or biomolecules.
Scan code to go directly to the CE test.
2. Discuss how genetic and epigenetic biomarkers are used and the latest emerging tests in this category.
3. Discuss the advantages and disadvantages of protein biomarkers and the mechanisms of action related to testing for them.
4. Discuss the mechanisms and types of metabolic biomarker testing to aid in cancer care.
type of malignancy from another type (for example, BRCA1 germline mutation for breast and ovarian cancer 5 and prostate-specific antigen (PSA) for prostate cancer 6)
• Determine prognosis and predict chance of survival or recurrence for patients who have been diagnosed with cancer (for example, 21 gene in Oncotype Dx for breast cancer8)
• Monitor status of the disease
• Inform individualized treatment plans (for example, immunohistochemistry for various cancers7 and KRAS mutations in Exon 2, 3 and 4 for colorectal cancer 9)
• Detect recurrence or determine response or progression to therapy (for example, 22 gene in Decipher Prostate10 and cancer antigen 15-3 (CA 15-3) and carcinoembryonic antigen (CEA) for breast cancer11)
• Anticipate and manage negative medication reactions
Cancer biomarkers based on the type of biomolecules
Cancer biomarkers can be broadly categorized into their biological nature
— genetic, epigenetic, transcriptomic, proteomic, and metabolic.3
Genetic biomarkers
Genetic biomarkers for cancer are specific genes, gene mutations, or gene expression patterns that can indicate the presence and stage of cancer or the potential for cancer development. Gene mutations and gene alterations can provide valuable information about the underlying genetic changes driving the development and progression of cancer. Table 1 provides a few examples of gene mutation– and gene alteration–based cancer biomarkers. Gene expression profiles provide insights into tumor behavior, prognosis, and treatment response. Table 2 provides a few examples of gene expression profile–based cancer biomarkers.
DNA as a cancer biomarker
Cancer cells release nucleic acids, freely or associated with other structures such as vesicles into body fluids, including blood. Among these nucleic acids, circulating tumor DNA (ctDNA) has emerged as a minimally invasive biomarker for cancer.19 Circulating tumor DNA (ctDNA) has now emerged as a very promising noninvasive biomarker for cancer diagnosis, prognosis, and therapeutic monitoring, providing significant potential for real-time insights into tumor dynamics.20 The circulating tumor DNA (ctDNA) is a key component of liquid biopsy tests. Table 3 provides examples of a few FDAapproved liquid biopsy ctDNA tests.
RNA as a cancer biomarker
RNA molecules, including messenger RNA (mRNA), microRNA (miRNA), long non-coding RNA (lncRNA), and circular RNA (circRNA), are emerging as promising cancer biomarkers due to their dynamic nature and potential for non-invasive detection in bodily fluids. Their levels can indicate the presence, stage, and progression of various cancers, providing valuable information for early diagnosis, prognosis, and
Cancer Biomarkers
treatment monitoring. Like circulating tumor DNA, RNAs are also detected in liquid biopsy tests. That said, RNA-based liquid biopsy tests are not yet that prevalent as DNA-based liquid biopsy tests. Researchers at the University of Chicago for the first time used RNA modifications to develop a liquid biopsy test for colorectal cancer that was more sensitive than DNA-based liquid biopsy test.24
Epigenetics as a cancer biomarker
Epigenetic changes including DNA methylation, histone modifications, nucleosome positioning, and noncoding RNAs, particularly microRNAs are essential for normal gene expression
and proper cellular functioning. Any disruption of this mechanism results in a change in gene function and eventually development of cancer. Hence detection of aberrant epigenetic patterns can serve as biomarkers for early detection, prognosis, and potential targets for therapeutic intervention.25 Table 4 provides examples of a few epigenetics biomarkers for cancer.
Protein as cancer biomarker
Protein biomarkers are specific proteins present in biological fluids (such as blood, urine, or saliva) or tissues that provide valuable information about the presence and progression of cancer.32 A
Genetic biomarker Cancer type Use
BraF V600E mutation
EgFr mutation (Exon 19 deletion, L858r point mutation in Exon 21)
kras mutations in Exon 2, 3 and 4
BrCa1/BrCa2
HEr2/neu amplification/ overexpression
melanoma12 to guide targeted therapy selection
non-small-cell lung cancer13 increases sensitivity to EgFr inhibitors
Colorectal cancer9 to guide targeted therapy selection
Breast/ovarian cancer14 to inform risk of cancer and guide therapy selection
Bladder, breast, ovarian, pancreatic, stomach15 to inform treatment decisions
idH1/idH2 glioma16 to diagnose and inform treatment decisions
Assay name Cancer type
oncotype dx8 Breast cancer
Number of genes Use
21 genes to predict the likelihood of breast cancer recurrence and guide treatment decisions for earlystage, hormone-receptor-positive breast cancer.
mammaPrint17 Breast cancer
70 genes
decipher Prostate10 Prostate cancer
ColoPrint18 Colon cancer
Prognostic and predictive diagnostic test that assesses the risk of recurrence.
22 genes to predict the likelihood of disease recurrence after prostate surgery and guide decisions regarding adjuvant therapy.
18 genes aids in determining prognosis and guides on treatment decisions.
Figure 1. Based on their use, cancer biomarkers can be broadly classified as shown.2
Table 1. gene mutation– and gene alteration–based cancer biomarkers.
Table 2. gene expression profile–based cancer biomarkers.
Cobas EgFr mutation test v221 non-small-cell lung cancer (nsCLC) EgFr Exon 19 deletions, L858r, t790m
guardant360 Cdx22 non-small-cell lung cancer (nsCLC) 74 genes and EgFr Exon 19 deletions, L858r, t790m
Foundationone Liquid Cdx23
non-small-cell lung cancer (nsCLC), prostate cancer, breast cancer, solid tumors, colorectal cancer
Table 3. Fda-approved liquid biopsy ctdna tests.
majority of the tumor markers are either protein or peptides. Tumor biomarkers have revolutionized cancer diagnostics as they are non-invasive and can be used for the following:33
• Screening and early detection of cancer
• Aid in the diagnosis of cancer
• Determine response to therapy
• Prognostic indicator of disease progression
• Indicate relapse during follow-up period
That said, tumor markers also have disadvantages as below:
• They have very low concentrations or may not be present for earlystage cancer.
• Not standardized as proteins and/ or modified proteins; may vary among individuals, between cell types, and even within the same cell under different stimuli or different disease states.
• Tumor markers may be present even in noncancerous conditions, hence not very specific for cancer.
The different types of protein biomarkers are as follows:
• Oncofetal antigens
• Tumor-associated antigens
• Hormones and hormone receptors
• Enzymes and isoenzymes
• Serum and tissue proteins
• Cancer stem cells
Mechanisms behind cancerrelated protein biomarkers
Cancer cells undergo several molecular and genetic changes that result in the overproduction, alteration, or loss of normal proteins. These changes result in new proteins or modified versions of existing proteins that are released into the bloodstream or other bodily fluids, which act as diagnostic or prognostic biomarkers. Some key mechanisms include the following:
• Overexpression of growth factors: Cancer cells often overproduce growth factors, leading to uncontrolled cell proliferation.
311 genes
• Altered post-translational modifications: Changes in protein modifications such as phosphorylation, glycosylation, or cleavage can produce altered protein isoforms detectable in blood samples. Table 5 provides Test name
Companion diagnostic for nsCLC
tumor profiling and companion diagnostics for nsCLC
Companion diagnostics for targeted therapy
Epigenetic cancer marker Cancer type Use
gstP1 –methylation26
BmP3 and ndrg4 methylation27
sHoX2 and PtgEr4 methylation28
tWist1, otX1 and onECut229
Prostate cancer diagnostic and prognostic biomarker. gstP1 methylation is frequently observed in prostate cancer tissue but is rare in normal prostate tissue.
Colorectal cancer (CrC)
Lung cancer
Bladder cancer
BraCa1 methylation30 Breast and ovarian cancer
mgmit methylation31 glioblastoma
Table 4. Epigenetics biomarkers for cancer. Protein biomarker
Prostate-specific antigen (Psa)
Carcinoembryonic antigen (CEa)
HEr2/neu
alpha-fetoprotein (aFP)
Prostate cancer
Hypermethylation is an indicator for early detection and diagnosis for CrC.
increased methylation of sHoX2/PtgEr4 promoter is an indicator for lung cancer development.
Hypermethylation of tWist1, otX1 and onECut2 genes indicate presence and progress of bladder cancer.
BraCa1 methylation is a therapeutic biomarker. When methylated the cancer cells become vulnerable to chemotherapy particularly platinum-based drugs and ParP inhibitors.
mgmt promoter methylation is a therapeutic marker, particularly in glioblastoma, as it indicates a tumor’s sensitivity to alkylating chemotherapy agents like temozolomide.
Early detection, monitoring response EgFr non-small-cell lung cancer
BCr-aBL fusion protein
Cyclin d1
Chronic myelogenous leukemia (CmL)
Breast, prostate, lymphoma
Table 5. Protein biomarkers for cancer.
• Loss of tumor suppressor proteins: Tumor suppressor proteins, such as p53, are often mutated or down regulated in cancer cells, contributing to uncontrolled cell growth.
Prognostic marker, guides EgFr-targeted therapy
diagnosis, treatment monitoring
Prognosis, identifies tumor progression
The only FDA-cleared Lp-PLA 2 activity test: The PLAC ® Activity Test identifies vascular-specific inflammation, providing critical insights even for patients with normal cholesterol or no prior cardiovascular history.
Clinically Validated:
Backed by multicenter studies using a clear clinical cut point (225 nmol/min/mL) tied to CHD and stroke outcomes.
Easy integration:
Designed for use with most automated clinical chemistry analyzers—no complex workflows required.
examples of a few protein biomarkers for cancer. 32
Metabolic biomarkers
Cancer has an effect on metabolic pathways and causes alterations in metabolites resulting in inappropriate proliferation of cancer cells and adaptation to the tumor microenvironment. The aberrant metabolites play pivotal roles in tumor formation and metastasis and thus serve as potential biomarkers for personalized cancer therapy.34 Table 6 provides a few examples of metabolic biomarkers for cancer.3
Due to the risk of false positive or negative results, it is advisable to combine a test for a cancer biomarker with another method such as tissue biopsy or endoscopy to improve the effectiveness of screening for cancer.36,37 A study showed that the combined detection of alpha-fetoprotein (AFP) with cell-free DNA (cfDNA) can improve the specificity of hepatocellular carcinoma (HCC) diagnosis to 94.4%, which was superior to that of AFP alone in terms of higher sensitivity and better clinical correlation.38
Methods of detection of cancer biomarkers
The traditional method for detection of cancer has been the detection of tissue biopsy and cytology to examine tissue and imaging techniques like positron emission tomography scan (PET Scan), computed tomography scan (CT Scan) and magnetic resonance imaging (MRI) to assess tumors. However, the various cancer biomarkers can be detected using a variety of methods, including immunoassays (like ELISA) for proteins; molecular techniques such as polymerase chain reaction (PCR), real-time quantitative PCR (qRT-PCR), digital PCR (dPCR), microarrays, and next-generation sequencing (NGS) for genetic alterations; mass spectrometry to identify proteins and metabolites; and advanced biosensors and nanomaterialbased methods for rapid, highly sensitive detection. The non-invasive liquid biopsy technique that detects circulating tumor cells (CTC), cell-free DNA (cfDNA) extracellular vesicles (EV), or circulating tumor DNA (ctDNA) in body fluids has also become very promising in detecting cancer biomarkers.
Conclusion
Despite the emergence of various newer techniques and technological advancements, on average, 1,700 deaths
Metabolite Sample type Cancer type
Glucose metabolism
glucose serum/plasma ↑ ↓ kidney cancer diffuse large lymphoma
urine ↓ Prostate cancer
Pyruvate serum/plasma ↑ Esophageal cancer, non-small cell lung cancer
occur daily from cancer in the United States.39 Hence, the fight against cancer is still not over. Artificial intelligence (AI) has revolutionized various fields including healthcare, and it can help to reshape how we understand, diagnose, and treat patients. By using emerging multi-omics technology in combination with AI, we hope to provide personalized treatment to cancer patients and save lives in ways that were never possible before.
Scan code to go directly to the CE test.
REFERENCES
1. Definition of biomarker- NCI Dictionary of Cancer Terms. National Cancer Institute. Accessed August 26, 2025. https://www.cancer.gov/ publications/dictionaries/cancer-terms/def/biomarker.
2. Carlomagno N, Incollingo P, Tammaro V, et al. Diagnostic, predictive, prognostic, and therapeutic molecular biomarkers in third millennium: A breakthrough in gastric cancer. Biomed Res Int. 2017;2017:7869802. doi:10.1155/2017/7869802.
3. Das S, Dey MK, Devireddy R, Gartia MR. Biomarkers in cancer detection, diagnosis, and prognosis. Sensors (Basel). 2023;24(1):37. doi:10.3390/s24010037.
4. Henry NL, Hayes DF. Cancer biomarkers. Mol Oncol. 2012;6(2):140-6. doi:10.1016/j.molonc.2012.01.010.
5. Easton DF, Ford D, Bishop DT. Breast and ovarian cancer incidence in BRCA1-mutation carriers. Breast Cancer Linkage Consortium. Am J Hum Genet. 1995;56(1):265-71.
6. Lin K, Lipsitz R, Miller T, Janakiraman S; U.S. Preventive Services Task Force. Benefits and harms of prostate-specific antigen screening for prostate cancer: An evidence update for the U.S. Preventive Services Task Force. Ann Intern Med. 2008;149(3):192-9. doi:10.7326/0003-481 9-149-3-200808050-00009.
7. Duraiyan J, Govindarajan R, Kaliyappan K, Palanisamy M. Applications of immunohistochemistry. J Pharm Bioallied Sci. 2012;4(Suppl 2):S307-9. doi:10.4103/0975-7406.100281.
8. Bernhardt SM, Dasari P, Wrin J, et al. Discordance in 21-gene recurrence scores between paired breast cancer samples is inversely associated with patient age. Breast Cancer Res. 2020;22(1):90. doi:10.1186/ s13058-020-01327-1.
9. Zenonos K, Kyprianou K. RAS signaling pathways, mutations and their role in colorectal cancer. World J Gastrointest Oncol. 2013;5(5):97-101. doi:10.4251/wjgo.v5.i5.97.
11. Hasan D. Diagnostic impact of CEA and CA 15-3 on chemotherapy monitoring of breast cancer patients. J Circ Biomark. 2022;11:57-63. doi:10.33393/jcb.2022.2446.
12. Tangella LP, Clark ME, Gray ES. Resistance mechanisms to targeted therapy in BRAF-mutant melanoma - A mini review. Biochim Biophys Acta Gen Subj. 2021;1865(1):129736. doi:10.1016/j.bbagen.2020.129736.
13. Passaro A, Mok T, Peters S, et al. Recent advances on the role of EGFR tyrosine kinase inhibitors in the management of NSCLC with uncommon, non exon 20 insertions, EGFR mutations. J Thorac Oncol 2021;16(5):764-773. doi:10.1016/j.jtho.2020.12.002.
14. Pujol P, Barberis M, Beer P, et al. Clinical practice guidelines for BRCA1 and BRCA2 genetic testing. Eur J Cancer. 2021;146:30-47. doi:10.1016/j. ejca.2020.12.023.
15. Amisha F, Malik P, Saluja P, et al. A comprehensive review on the role of human epidermal growth factor receptor 2 (HER2) as a biomarker in extra-mammary and extra-gastric cancers. Onco (Basel) 2023;3(2):96-124. doi:10.3390/onco3020008.
16. Ma R, de Pennington N, Hofer M, Blesing C, Stacey R. Diagnostic and prognostic markers in gliomas - an update. Br J Neurosurg 2013;27(3):311-5. doi:10.3109/02688697.2012.752432.
17. MammaPrint – Breast Cancer Testing. Agendia. Accessed August 26, 2025. https://agendia.com/mammaprint/.
18. Agendia announces launch of ColoPrint for colon cancer prognosis and prediction. Agendia. June 1, 2012. Accessed August 26, 2025. https://agendia.com/agendia-announces-launch-of-coloprint-forcolon-cancer-prognosis-and-prediction/.
19. Sánchez-Herrero E, Serna-Blasco R, Robado de Lope L, et al. Circulating tumor DNA as a cancer biomarker: An overview of biological features and factors that may impact on ctDNA analysis. Front Oncol. 2022;12:943253. doi:10.3389/fonc.2022.943253.
20. Asnaghi R, Marsicano RM, Fuorivia V, et al. Circulating tumor DNA: a
biomarker for oncology drug development in phase I clinical trials? Expert Rev Mol Diagn. Published online 2025:1-9. doi:10.1080/1473715 9.2025.2531065.
21. Torres S, González Á, Cunquero Tomas AJ, et al. A profile on cobas EGFR Mutation Test v2 as companion diagnostic for first-line treatment of patients with non-small cell lung cancer. Expert Rev Mol Diagn 2020;20(6):575-582. doi:10.1080/14737159.2020.1724094.
22. Jatkoe T, Wang S, Odegaard JI, et al. Clinical validation of companion diagnostics for the selection of patients with non-small cell lung cancer tumors harboring epidermal growth factor receptor exon 20 insertion mutations for treatment with amivantamab. J Mol Diagn 2022;24(11):1181-1188. doi:10.1016/j.jmoldx.2022.07.003.
23. FoundationOne Liquid CDX Technical Specifications. Foundation Medicine. March 2025. Accessed August 26, 2025. https://www. foundationmedicine.com/sites/default/files/media/documents/2025-06/ F1LCDx_Tech%20Specs_SPEC-01746_R4.pdf.
24. Ju CW, Lyu R, Li H, et al. Modifications of microbiome-derived cell-free RNA in plasma discriminates colorectal cancer samples. Nat Biotechnol. Published online 2025:1-7. doi:10.1038/s41587-025-02731-8.
25. Tiwari N, Mishra J, Singh N, et al. Epigenetics and cancer stem cells-The world of cancer genesis: A review. J Cancer Res Ther 2025;21(1):5-9. doi:10.4103/jcrt.jcrt_388_24.
26. Ye J, Wu M, He L, et al. Glutathione-S-transferase p1 gene promoter methylation in cell-free DNA as a diagnostic and prognostic tool for prostate cancer: A systematic review and meta-analysis. Int J Endocrinol. 2023;2023:7279243. doi:10.1155/2023/7279243.
27. Müller D, Győrffy B. DNA methylation-based diagnostic, prognostic, and predictive biomarkers in colorectal cancer. Biochim Biophys Acta Rev Cancer. 2022;1877(3):188722. doi:10.1016/j.bbcan.2022.188722.
28. Weiss G, Schlegel A, Kottwitz D, König T, Tetzner R. Validation of the SHOX2/PTGER4 DNA methylation marker panel for plasma-based discrimination between patients with malignant and nonmalignant lung disease. J Thorac Oncol. 2017;12(1):77-84. doi:10.1016/j. jtho.2016.08.123.
29. van Kessel KE, Van Neste L, Lurkin I, Zwarthoff EC, Van Criekinge W. Evaluation of an epigenetic profile for the detection of bladder cancer in patients with hematuria. J Urol. 2016;195(3):601-7. doi:10.1016/j. juro.2015.08.085.
30. Stefansson OA, Hilmarsdottir H, Olafsdottir K, et al. BRCA1 promoter methylation status in 1031 primary breast cancers predicts favorable outcomes following chemotherapy. JNCI Cancer Spectr 2019;4(2):pkz100. doi:10.1093/jncics/pkz100.
31. Butler M, Pongor L, Su YT, et al. MGMT status as a clinical biomarker in glioblastoma. Trends Cancer. 2020;6(5):380-391. doi:10.1016/j. trecan.2020.02.010.
32. Damodar SV, Shukla VK, Kumar V, Deshmukh MV. The importance of protein biomarkers in cancer detection - the use of specific proteins as biomarkers for early cancer diagnosis and prognosis. doi:10.53555/ AJBR.v28i1S.6406.
33. Nagpal M, Singh S, Singh P, Chauhan P, Zaidi MA. Tumor markers: A diagnostic tool. Natl J Maxillofac Surg. 2016;7(1):17-20. doi:10.4103/0975-5950.196135.
34. Wang W, Rong Z, Wang G, Hou Y, Yang F, Qiu M. Cancer metabolites: promising biomarkers for cancer liquid biopsy. Biomark Res 2023;11(1):66. doi:10.1186/s40364-023-00507-3.
35. Wang W, Zhen S, Ping Y, Wang L, Zhang Y. Metabolomic biomarkers in liquid biopsy: accurate cancer diagnosis and prognosis monitoring. Front Oncol. 2024;14:1331215. doi:10.3389/fonc.2024.1331215.
36. Calabrese F, Lunardi F, Pezzuto F, et al. Are there new biomarkers in tissue and liquid biopsies for the early detection of non-small cell lung cancer? J Clin Med. 2019;8(3):414. doi:10.3390/jcm8030414.
37. Bresalier RS, Grady WM, Markowitz SD, et al. Biomarkers for early detection of colorectal cancer: The early detection research network, a framework for clinical translation. Cancer Epidemiol Biomarkers Prev. 2020;29(12):2431-2440. doi:10.1158/1055-9965.EPI-20-0234.
38. Ye Q, Ling S, Zheng S, Xu X. Liquid biopsy in hepatocellular carcinoma: circulating tumor cells and circulating tumor DNA. Mol Cancer 2019;18(1):114. doi:10.1186/s12943-019-1043-x.
39. Siegel RL, Kratzer TB, Giaquinto AN, Sung H, Jemal A. Cancer statistics, 2025. CA Cancer J Clin. 2025;75(1):10-45. doi:10.3322/caac.21871
Rajasri Chandra, MS, MBA is a global marketing leader with expertise in managing upstream, downstream, strategic, tactical, traditional, and digital marketing in biotech, in vitro diagnostics, life sciences, and pharmaceutical industries. raj is an orchestrator of go-to-market strategies driving complete product life cycle from ideation to commercialization.
Maternal and fetal health diagnostics: The case for advancing preeclampsia screening
By Telle Ukonaho, M.Sc., MBA
Current maternal and fetal health diagnostics — more commonly referred to as prenatal care — have their roots in the late 1800s and early 1900s. During this time, physicians began to gain insights into what is now known as preeclampsia or eclampsia (“toxemia”), identifying hypertension as an early indicator of the condition.1 These discoveries laid the foundation for future prenatal interventions. The primary goal of prenatal care, “to have the pregnancy end with a healthy baby and mother,” has remained unchanged for over a century.
Current practices and persistent challenges
Today, by identifying risk factors for pregnancy complications and maternal
health concerns, healthcare providers aim to optimize pregnancy outcomes. Through a combination of screening and diagnostic tests, along with serial monitoring of physical examination components, providers assess the ongoing health of the pregnancy. While the ability to screen and intervene has improved significantly over the past century, and the scope of assessments has expanded, the prevalence of preeclampsia—the condition that originally prompted the development of prenatal care—has not decreased.2
Global impact of preeclampsia
Preeclampsia affects approximately 10 million pregnancies worldwide each year resulting in 2.5 million babies born prematurely.3,4 In the United States, its
prevalence has been increasing.5 Despite advances in medical interventions, we continue to invite women to maternity visits to detect the same conditions as we did a century ago.6 In high-income countries, current medical interventions can save most mothers and babies, while in low-income countries, many still die from this condition.4
Understanding preeclampsia: Risks, symptoms, and consequences of preeclampsia
Preeclampsia can affect any pregnancy. The clinical symptoms that define preeclampsia —hypertension and maternal organ failure (including proteinuria) — are not always perceptible. Other symptoms may include upper abdominal pain, vomiting, severe headaches, and visual
disturbances, which can be difficult to identify. As a result, preeclampsia can progress rapidly into a life-threatening state. If it develops before 37 weeks of gestation, early delivery is often necessary, resulting in premature birth. Both mother and baby are affected, even if they survive. Prematurity can have long-term consequences for the baby’s health and development, and mothers who experience preeclampsia are at increased risk for chronic diseases such as cardiovascular disease and diabetes mellitus later in life. Therefore, better means to improve maternal and neonatal outcomes are essential.7
Advancements in prediction and management
Over the past two decades, significant progress has been made in developing tools to predict and manage pregnancies at risk for preeclampsia. Since the early 2000s, innovations in preeclampsia testing—driven by global collaboration among experts in obstetrics and gynecology and industry — have led to the identification of biomarkers that predict adverse pregnancy outcomes related to poor placental function, including preterm preeclampsia.8,9,10
Placental growth factor (PlGF) and its role: Impactful studies and evidence
Placental growth factor (PlGF) is a protein found in low concentrations in maternal blood during pregnancy. When there is a risk of preeclampsia, PlGF levels are even lower. Highly sensitive PlGF assays have been developed to maximize detection rates using firsttrimester prediction protocols.11
PlGF-based assays have been used in milestone studies such as ASPRE, which demonstrated the performance of the competing screening model by the Fetal Medicine Foundation to identify women at high risk for placental insufficiency-related conditions like preterm preeclampsia. This study also showed the efficacy of aspirin prophylaxis. The ASPRE randomized controlled trial demonstrated an 89% reduction in preeclampsia before 32 weeks and a 62% reduction before 37 weeks, along with a 70% decrease in neonatal intensive care stays for babies born before 32 weeks—highlighting the impact of early detection.12, 13 The SPREE study showed that screening performance improves significantly when biomarkers like PlGF are used alongside maternal factors, which are currently recommended by
ACOG (US) and NICE (UK).14 PlGF has also shown value as a marker for fetal growth restriction and stillbirth.15, 16 The performance of the FMF competing screening model has been replicated in many local and national studies globally, showing its superiority over standard care practices based on maternal factors alone.
Timing
of screening and preventive actions
PlGF-based screening is performed at early pregnancy, between 11–14 weeks of gestation. Timing is critical, as starting low-dose aspirin prophylaxistreatment before 16 weeks—ideally before 14—is essential for maximum effectiveness. Testing after this window can still provide insights into placental function, but preventive actions are limited to monitoring and managing the condition if it develops.12,13
Early identification of at-risk pregnancies is key to reducing both shortand long-term adverse outcomes. As demonstrated by ASPRE and subsequent studies, the majority of severe preterm preeclampsia cases can be prevented.18, 19 Screening offers a significant opportunity to reduce healthcare costs while protecting the health of mothers and babies.20
Diagnostic and monitoring applications
Beyond prediction and prevention, PlGF—alone or in combination with soluble fms-like tyrosine kinase-1 (sFlt-1)—can aid in diagnosis when symptoms arise and help monitor disease progression and severity. When time is critical, these markers can accelerate diagnosis and care, ultimately improving outcomes.20-23
Implementation to current workflows
Looking beyond the clinical markers, the implementation of enhanced screening and aid in diagnosis with PlGF-based tools is straightforward. At a practical level, performing the screening is very similar to aneuploidy screening, which has been standard practice for decades. These models are usually supported by easy-to-use screening software that supports optimal workflows for both clinicians and laboratories. Aid in diagnosis does not differ from various clinical chemistry tests performed on a daily basis. Preeclampsia screening has been developed to integrate with existing infrastructures.23-25
Barriers to adoption and the call for change
Despite strong clinical evidence, implementation of these tools remains slow. Concerns about performance, cost-effectiveness, prophylaxis, and insufficient evidence remain common arguments against adoption. It appears the decision
Looking beyond the clinical markers, the implementation of enhanced screening and aid in diagnosis with PlGF-based tools is straightforward.
makers as well as the medical community are waiting for a perfect solution or for others to take the lead. While further scientific evidence is needed to refine identification and management strategies, using available markers is the best way to learn how to maximize their potential. These tools do not increase pregnancy risk, even in cases of false positives—unlike aneuploidy screening. Meanwhile, delays in implementation continue to affect women and babies. Those who survive may live with long-term consequences. Isn’t it time to make a change?
Conclusion: Time to act
The evidence is clear: early screening and intervention can save lives and improve outcomes. While further research will enhance these tools, starting to use them now is the best way to learn and refine their application—while saving lives and improving outcomes for mothers and babies.
Telle Ukonaho, M.Sc., MBA is Global Business Development manager, reproductive Health, Revvity she leads maternal and fetal health, especially with preeclampsia related market development and innovation activities at revvity’s reproductive Health business unit. With 20 years’ experience in r &D and business, she now leads collaborations with medical societies and experts around the world willing to fight the burden of pre-eclampsia and other pregnancy-related complications.
References are available online at mlo-online.com/55315280.
The anatomy of OSHA’s Bloodborne Pathogen standard
By Jason P. Nagy, PhD, MLS(ASCP)CM, QLS
Whether you are a safety professional or drafting your first bloodborne pathogen exposure control plan, you will inevitably need to reference OSHA’s Bloodborne Pathogen (BBP) standard. The standard can be challenging to navigate, as its requirements are not always laid out in a linear fashion. Readers often need to jump between sections to fully understand their intent. This article summarizes the key components of the nine primary sections (see Table 1) and provides guidance to help ensure compliance.
Scope and application
The first section, Scope and application, simply states that OSHA’s BBP standard, codified as 29 CFR 1910.1030, is applied to all employees with an occupational exposure. The purpose is simple yet comprehensive: to identify and mitigate occupational exposure risks, thereby preventing transmission of bloodborne diseases such as HBV, HCV, and HIV. But how can an employer determine if their staff falls under this regulation? The answer lies in the standard’s next section.
Definitions
Section 2, Definitions, lays the groundwork for compliance by specifying key terms. One of which is occupational exposure: any reasonably anticipated skin, eye, mucous membrane, or parenteral contact with blood or other potentially infectious material (OPIM) that may result from the performance of an employee’s duties.
What makes this definition so important is that the entire standard is based off how an employer determines if their employee has this risk in their work areas.
Exposure control
At the heart of OSHA’s standard is the Exposure Control Plan (ECP) — a living document pivotal to preventing workplace infection. In the third section, OSHA states what it takes for employees to operate in an unsafe environment safely. The BBP standard mandates that the employers’ ECP list tasks and job classifications where exposure may occur, along with what preventative steps must be in place, identified as Methods of compliance (this just so happens to be the next section of the BBP standard). The lab is a dynamic environment. Therefore, OSHA requires employers to review and update their ECP annually and when changes are made in the lab that redefine the risks in the lab.
Methods of compliance
The fourth section of the standard, Methods of compliance, is one of the larger segments covering various practices employees must follow to keep themselves safe (see Table 2). So, what must an employer do to help protect staff? The best method of compliance is to utilize universal precautions
(now referred to as standard precautions), “an approach to infection control... where all human blood and certain human body fluids are treated as if known to be infectious for HIV, HBV, and other bloodborne pathogens.”
Engineering and work practice controls are two crucial components of the “Methods of compliance” section. Engineering controls refer to items that physically isolate or remove the risk of working with bloodborne pathogens. They can be as complex as a biological safety cabinet or as simple as a sharps container. Work practice controls are rules and regulations and steps taken by employees that reduce the likelihood of exposure by altering the way a task is performed (e.g., prohibiting recapping of needles by a two-handed technique). OSHA also requires the employer to provide handwashing facilities or an antiseptic hand cleanser that employees must use as soon as possible after removing their PPE.
In the middle of the “Methods of compliance” section are OSHA’s requirements pertaining to PPE. Here, the standard mandates that appropriate PPE shall be offered to employees at no cost when there is a risk of occupational
Section Topics
1910.1030(a) scope and application
1910.1030(b) definitions
1910.1030(c) exposure control
1910.1030(d) Methods of compliance
• Universal precautions
• engineering controls and work practice controls
• Personal protective equipment (PPe)
• housekeeping
• regulated medical waste
• sharps
1910.1030(e) hIV and hbV research Laboratories and Production Facilities
1910.1030(f) hepatitis b vaccination and post-exposure evaluation and follow-up
1910.1030(g) Communication of hazards to employees
• Labels and signs
• Information and training
1910.1030(h) recordkeeping
1910.1030(i) dates – effective dates
Table 1. bbP section breakdown.
Component Compliance Requirements
Universal precautions (now referred to as standard precautions)
treat all human blood and certain body fluids as if known to be infectious for hIV, hbV, and other bloodborne pathogens.
engineering controls
engineering controls and Work practice controls
Personal protective equipment
• devices that physically separate the user from exposure risk
Work practice controls
• rules and regulations, policies, and procedures that employees must follow to stay safe
employers must provide compliant PPe (gloves, coats, goggles, masks, face shields) at no cost, train staff in proper use, and enforce compliance.
housekeeping regulated medical waste sharps
Laundry
Table 2. section 1910.1030(d): Methods of compliance.
exposure. The standard also requires employers to ensure staff are trained how to use their PPE and enforce its use. This section elaborates on gloves, masks, eye protection, and face shields. When selecting PPE, refer to the specific requirements for each type to ensure an OSHA compliant item is selected.
The Housekeeping portion of Methods of compliance provides guidance on regulated medical waste (RMW), sharps, and contaminated laundry. OSHA considers all work surfaces that come in contact with blood or other potentially infectious materials to be contaminated. Decontamination must be completed with an approved disinfectant immediately after a spill and at the end of the shift. As with PPE, OSHA has strict requirements when selecting containers for RMW and sharps. OSHA also describes how these types of waste must be stored and moved off site in ways that reduce the risk of exposure to staff. Finally, if a facility decides to launder contaminated items such as PPE or linens, OSHA provides specific handling steps to keep these items isolated from the user and environment.
HIV and HBV research laboratories
The fifth section of the standard is specific to research laboratories that experiment with or manipulate hepatitis B and HIV. It does not apply to clinical laboratories that analyze samples that may contain HIV or Hepatitis B. These research facilities must adhere not only to the regulations mentioned in the other sections of the standard, but also to this particular section of enhanced standards around decontamination, biosecurity, and training.
Hepatitis B vaccination and postexposure protocol
The sixth section covers requirements about hepatitis B vaccination and post-exposure evaluation and follow-up should an employee become exposed. OSHA requires employers to offer the hepatitis B vaccine and vaccine series to all staff with occupational exposure. It also mandates that there be post-exposure evaluation and follow up and prophylaxis
that are available at no cost to the employee if an exposure occurs. These actions not only protect affected workers but also demonstrate an employer’s commitment to regulatory compliance and employee health.
Communication of hazards to employees
Effectively communicating hazards is essential. This is accomplished through signs, labels, and training. OSHA requires employers to clearly label all containers holding blood, other potentially infectious materials, or contaminated items (including waste containers and refrigerators) with the approved biohazard symbol in an orange or orange-red color.
OSHA also requires employers to maintain and update training programs that explain risks, safeguards, and procedures for exposure response. This training must take place at the time of hire or assignment to an area where occupational exposures exist, and then annually. Staff awareness is non-negotiable—OSHA mandates these steps to ensure every employee understands the risks and proper responses, regardless of familiarity or previous experience. To ensure this, the training must include a segment where staff have a chance to ask questions.
Recordkeeping
Thorough recordkeeping practices are the organization’s best defense during an audit or regulatory review. Employers are required to maintain training records for three years that include the date of training, the contents covered, the trainer’s name and qualifications, and a list of attendees. If an employee is exposed or experiences a sharps injury, there
Effectively communicating hazards is essential. This is accomplished through signs, labels, and training .
are many other items the employee must capture, along with an extended record retention requirement of 30 years after the employee leaves the organization.
Dates
The closing section of the standard catalogues the effective date of the regulation and all subsequent amendments or revisions. Staying informed about updates is crucial, as the regulatory landscape can and does evolve in response to emerging workplace hazards or technological advances.
Conclusion
While OSHA’s Bloodborne Pathogen Standard can feel dense and non-linear, its purpose is clear: to safeguard employees from preventable occupational exposure risks. By developing and maintaining a strong exposure control plan, training employees thoroughly, enforcing proper use of PPE, and documenting compliance, employers can align with OSHA’s requirements and protect their staff.
Jason P. Nagy, PhD, MLS(ASCP) CM , QLS is the Laboratory safety support Coordinator at Sentara Health, a multi-hospital system in Virgina and north Carolina. Jason brings almost 20 years of laboratory experience to the lab as a medical laboratory scientist (ML s) and more recently in laboratory safety and education roles.
Antimicrobial stewardship: Empowering labs to drive clinical impact through diagnostics
By Lauren N. Hunt, PharmD, BCIDP and Brandon Hill, PharmD, BCIDP
In the global fight against antimicrobial resistance (AMR), some healthcare systems are not just keeping pace — they are forging the path forward. By championing laboratory innovation, multidisciplinary collaboration, and leveraging data and analytics, three bioMérieux Centers of Excellence are redefining what is possible in antimicrobial stewardship (AMS). Their results-driven strategies and experiences offer a blueprint for the next wave of stewardship success.
The state of antimicrobial stewardship in U.S. hospitals
AMS can be defined as a coordinated, multidisciplinary initiative designed to optimize the use of antimicrobial agents, ensuring patients receive the most appropriate drug, at the correct dose, by the right route, and for the optimal duration.1 In the United States, antimicrobial stewardship has become a healthcare standard, driven by regulatory and accreditation bodies. The Centers for Medicare & Medicaid Services (CMS) now requires all
hospitals, including critical access hospitals, to implement formal stewardship programs as part of their Conditions of Participation, mandating leadership, education, monitoring, and integration into quality improvement.2 These requirements align with stewardship frameworks from the Centers for Disease Control and Prevention (CDC),3 Infectious Diseases Society of America (IDSA),4 and The Joint Commission,5 reinforcing AMS as an essential component of safe, accountable patient care. The National Healthcare Safety Network (NHSN) Annual Hospital Survey reflected that 96% of acute care hospitals in the United States are adhering to the CDC framework for AMS.3 However, the journey is far from complete. While hospitals may follow the same baseline recommendations for an antimicrobial stewardship program (ASP), it does not negate the real-world challenges that influence ultimate success. Some of these include siloed workflows, interdepartmental communication gaps, and a lack of resources needed to improve stewardship decision-making.6 Stewardship is not just about following guidelines — it is about empowering individuals and creating a culture where everyone, from the lab to the bedside and up to leadership, feels responsible for diagnostic and antimicrobial optimization.
The power of collaboration: Real-world success stories
While the principles of AMS are well established, it is the integration of laboratory, pharmacy, and clinical expertise that distinguishes today’s most effective programs.4 Nowhere is this more evident than in the bioMérieux Antimicrobial Stewardship Centers of Excellence program, where collaborative stewardship is not just a goal — it is engrained in the culture. Comprised of 15 healthcare systems across the globe (including three in the United States), this network of AMS leaders is showcasing how to overcome barriers and redefine what is possible.7 These relationships leverage and scale combined strengths to innovate diagnostic tests to fight AMR.
Texas Children’s Hospital, Tampa General Hospital, and Henry Ford Health: Optimizing blood culture workflows
A breakthrough in collaborative stewardship is the multi-center initiative led by Texas Children’s Hospital, Tampa General Hospital, and Henry Ford Health. This project focused on optimizing blood culture workflows by leveraging data analytics and laboratory expertise to determine when blood culture reports could be finalized after the first bottle flags positive, rather than waiting for both aerobic and anaerobic bottles to result.
The findings were striking across all three sites; the majority of positive blood cultures (79–85%) grew a single organism, and the incidence of a second organism appearing more than 24 hours after the
first was extremely low (0.9–1.4%). 8
This evidence supports the practice of finalizing reports after the first positive bottle, reducing turnaround time and enabling faster, more targeted antimicrobial therapy or the complete discontinuation of therapy in the case of blood culture contamination.
This is a clear example of how lab-driven data streamlines clinical workflows and empowers stewardship teams to act more decisively. It’s about giving clinicians the right information at the right time to make the best decisions.
Henry Ford Health: The nudge that makes a difference
An inspiring example of collaborative stewardship comes from Henry Ford Health in Detroit, Michigan. Their team has pioneered the use of “microbiology nudges,” which are strategic comments appended to microbiology results in the electronic health record (EHR) that guide prescribers toward optimal antibiotic use while preserving clinical autonomy. These nudges are more than passive suggestions; they are the result of close collaboration between microbiology, pharmacy, and infectious disease teams.
For example, the ASP recognized approximately 50% of Stenotrophomonas maltophilia in clinical respiratory cultures may represent colonization. The team implemented a nudge describing S. maltophilia as a frequent colonizer of the respiratory tract, suggesting clinical correlation should be considered to avoid unnecessary treatment. This intervention led to a statistically significant reduction in unnecessary antibiotic treatment, from 77% to 22% of cases, without compromising patient safety.9
Similarly, a nudge for non-meningitis Streptococcus pneumoniae blood stream infections was implemented with the intent to change prescribing practices to use narrower spectrum therapy. The nudge comment indicated the drugs of choice for S. pneumoniae bacteremia are IV ampicillin or penicillin, also noting the preferential therapy for meningitis (IV ceftriaxone plus vancomycin) should be used until susceptibilities are known. Optimal de-escalation in less than 48 hours occurred in 30% of cases in the pre-intervention and 67% in the post-intervention group, a statistically significant difference, with no observed differences in 30-day all cause readmission or mortality.10
What’s remarkable about Henry Ford’s approach is how it has embedded
the lab’s voice into the clinical decision-making process. The microbiology team is not just reporting results; they are actively shaping prescribing behavior.
Tampa General Hospital: Accelerating susceptibility testing
Timely initiation of optimal antimicrobial therapy is essential for patients with bloodstream infections, yet traditional phenotypic methods can delay susceptibility results by several days, particularly for multi-drug-resistant organisms. As new, innovative technologies are developed to shorten time to susceptibility results, the actionability of the tests’ results are often used to assess their potential impact on patient care. Tests do not directly lead to an intervention; therefore, decision-making and actions by a clinician are considered primary determinants of the effect these technologies have on antibiotic use and patient outcomes.11 At Tampa General Hospital, the laboratory team took stewardship to the next level by evaluating the time to result of fast antimicrobial susceptibility testing (AST) systems directly from positive blood cultures. In a head-to-head comparison of VITEK REVEAL (bioMérieux, US) and Accelerate Pheno (Accelerate Diagnostics, US), a total of 127 gram-negative positive blood cultures were analyzed, including P. aeruginosa (10.2%) and a range of Enterobacterales (89.8%). Overall, the two systems demonstrated high categorical agreement (93.7%) and decreased time to results (under eight hours for both systems).12 To be actionable, fast AST results must provide accurate and sufficient information for clinicians to assess appropriateness of antibiotic therapy and determine what is the most optimal antibiotic regimen for the patient and causative pathogen.11 This could allow clinicians to de-escalate or optimize therapy much earlier, reducing unnecessary broad-spectrum antibiotic use.
The ability to provide actionable susceptibility data within hours, not days, is a game-changer for stewardship. It’s about closing the loop between the lab and the bedside as quickly as possible.
Texas Children’s Hospital: Optimization of the urine culture process
Urinary tract infections are among the most common infections across the globe.13 Delays in urine culture turnaround times (TAT) can hinder effective patient management and compromise antimicrobial stewardship efforts. For instance, in today’s era or rising antimicrobial resistance a patient may be on an ineffective or inactive antibiotic for their UTI. Fast, actionable information for antibiotic changes is an important initiative to consider in our fight against AMR.13 Conventional laboratory workflows—often limited to culture reading during a single daily shift—contribute to prolonged reporting times for both positive and negative results. Texas Children’s Hospital has achieved measurable, long-term improvements in clinical laboratory performance through a urine culture laboratory optimization initiative. The kaizen project, grounded in time-based process analysis and strategic implementation of advanced technologies, such as MALDI-TOF, has significantly enhanced TATs for urine cultures.
By introducing time-based microbiology practices and streamlining workflows, the laboratory reduced TATs for positive urine cultures by 15 hours and achieved a median reduction of more than 20 hours for negative cultures.14 These improvements have been sustained over a seven-year period, underscoring the initiative’s effectiveness and durability. Efficiency in the lab has a critical role in timely patient care, and Texas Children’s emulates this translation of value to patient care.
The future of stewardship: What’s next?
The successes of these AMS Centers of Excellence demonstrate that when laboratories are empowered as equal partners in stewardship, the results can be transformative. Fast diagnostics, innovative workflows, and collaborative result reporting are not just theoretical best practices; they are proven strategies for improving patient care and combating resistance.
As we look to the future of AMS, the path forward is clear: collaboration, innovation, and laboratory leadership must take center stage. The challenges of rising AMR, evolving pathogens, and increasingly complex healthcare systems demand a united, forward-thinking response. The bioMérieux AMS Centers of Excellence continue to serve as powerful examples of what can be achieved when health systems align clinical excellence with diagnostic innovation. But sustaining and expanding this progress will require a broader collective effort. It’s up to all of us—clinicians, laboratorians, pharmacists, infection preventionists, public health, industry, government officials, health system leaders, and patients—to build on
their example, advancing stewardship and safeguarding the efficacy of antibiotics for future generations.
When partners across disciplines work together with shared purpose, we strengthen the culture of accountability and open communication that is foundational to successful stewardship. No single group can combat AMR in isolation. It is only through intentional collaboration that we can identify opportunities for improvement, close practice gaps, and support behavior change at scale.
Looking ahead, several key priorities will shape the next era of stewardship:
Expanding diagnostic stewardship
Diagnostics and microbiological data are essential to ensuring timely, appropriate therapy. Integrating laboratory insights into clinical decision support tools can help frontline providers make informed treatment decisions at the point of care. This includes leveraging technologies such as MALDI-TOF, syndromic panels, and fast antimicrobial susceptibility testing, as well as building protocols that link results to guideline-driven interventions.
Enhancing interdepartmental collaboration
Effective AMS requires breaking down traditional silos between departments. By aligning on shared goals, holding regular interdisciplinary meetings, and launching joint education initiatives, teams can create an environment of mutual respect and collective ownership over stewardship practices. Such collaboration not only improves patient outcomes but also fosters a culture of continuous improvement.
Leveraging data analytics
Harnessing the power of real-time data allows stewardship teams to move from reactive to proactive intervention. Advanced analytics can help monitor prescribing patterns, detect outliers, and prioritize areas for action. By integrating antibiogram trends, diagnostic utilization data, and clinical outcomes, institutions can refine stewardship strategies and measure their impact with greater precision.
Building laboratory leadership
Laboratory professionals are uniquely positioned to drive AMS forward. Their expertise in diagnostic testing, result interpretation, and workflow efficiency
is invaluable to stewardship programs. By encouraging lab leaders to actively participate in stewardship committees, clinical rounds, and quality improvement projects, we can ensure that diagnostics are not just tools, but strategic assets in the fight against AMR.
As we push forward, the need for bold thinking and sustained partnership is more urgent than ever. The opportunity to transform stewardship into a fully integrated, data-informed, and patient-centered practice is within reach.
A call to action for laboratory leaders
As demonstrated by the bioMérieux AMS Centers of Excellence, the most successful programs are those that harness the power of diagnostics, data, and teamwork to optimize antibiotic use and improve patient outcomes.
Laboratory leaders: now is your time. Antimicrobial stewardship needs your expertise to advance from good to great. By embracing your role as stewards, you can help lead the charge against AMR — one nudge, one blood culture, and one AST result at a time.
REFERENCES
1. Shrestha J, Zahra F, Cannady P Jr. Antimicrobial stewardship. In: StatPearls. StatPearls Publishing; 2025.
2. Infection prevention and control and antibiotic stewardship program interpretive guidance update. CMS. July 6, 2022. Accessed August 28, 2025. https://www.cms.gov/ medicareprovider-enrollment-and-certificationsurveycertificationgeninfopolicy-and-memosstates-and/infection-prevention-and-control-and-antibiotic-stewardship-programinterpretive-guidance-update.
3. Core elements of hospital antibiotic stewardship programs. CDC. December 5, 2024. Accessed August 28, 2025. https://www.cdc.gov/antibiotic-use/hcp/core-elements/hospital.html.
4. Dellit TH, Owens RC, McGowan JE, et al. SHEA/IDSA guidelines for developing an institutional program to enhance antimicrobial stewardship. Idsociety.org. Accessed August 28, 2025. https://www.idsociety.org/practice-guideline/antimicrobial-stewardship/.
5. Jointcommission.org. Accessed August 28, 2025. https://www.jointcommission.org/en-us/ standards/r3-report/r3-report-35.
6. Kapadia SN, Abramson EL, Carter EJ, et al. The expanding role of antimicrobial stewardship programs in hospitals in the United States: Lessons learned from a multisite qualitative study. Jt Comm J Qual Patient Saf. 2018;44(2):68-74. doi:10.1016/j.jcjq.2017.07.007.
7. Antimicrobial Stewardship Centers of Excellence. bioMérieux. Accessed August 28, 2025. https://www.biomerieux.com/corp/en/our-offer/strategic-partnerships/ams-centersof-excellence.html.
8. Initial Blood Culture Bottle Positivity: Insights from a Three-Center Retrospective Review. Poster presented at: ASM Microbe 2025; June 22, 2025; Los Angeles, CA; Rapid-Fire Poster.
9. Boettcher SR, Kenney RM, Arena CJ, et al. Say it ain’t Steno: A microbiology nudge comment leads to less treatment of Stenotrophomonas maltophilia respiratory colonization. Infect Control Hosp Epidemiol. 2024:1-5. doi:10.1017/ice.2024.195.
10. Akon M, et al. Internal Communication, Henry Ford Health Antimicrobial Stewardship Program. 2025.
11. MacVane SH, Dwivedi HP. Evaluating the impact of rapid antimicrobial susceptibility testing for bloodstream infections: a review of actionability, antibiotic use and patient outcome metrics. J Antimicrob Chemother. 2024;79(12 Suppl 2):i13-i25. doi:10.1093/jac/dkae282.
12. Simmons Williams C, Becker D, Lima A, et al. Evaluation of the VITEK REVEAL AST system vs Accelerate Pheno for antimicrobial susceptibility testing of Gram-negative bacteria directly from positive blood cultures. Global. Published online 2025. Presented at: ESCMID Global 2025; April 14, 2025; Vienna, Austria. Poster P1447. Abstract 986.
13. Foxman B, Bangura M, Kamdar N, Morgan DM. Epidemiology of urinary tract infection among community-living seniors aged 50 plus: Population estimates and risk factors. Ann Epidemiol. 2025;104:21-27. doi:10.1016/j.annepidem.2025.02.010.
14. Dunn JJ, Niles DT. Optimization of the urine culture process at Texas Children’s Hospital. In: Presented at: Southwest Association of Clinical Microbiologists (SWACM) Conference 2024.
Lauren N. Hunt, PharmD, BCIDP is a board-certified infectious diseases pharmacist who has dedicated her career to antimicrobial and diagnostic stewardship, in an effort to slow the progression of antimicrobial resistance. she currently serves as the senior Marketing Manager for clinical s t rategic Partnerships & Value-based Healthcare at bioMérieux
Brandon Hill, PharmD, BCIDP is the Field Medical Director for U.s . Medical a f fairs at bioMérieux brandon is a board-certified infectious diseases pharmacist who spent several years in clinical practice as an infectious diseases and antimicrobial stewardship clinical pharmacist before transitioning to the in vitro diagnostics industry.
powered by
Efficiency in every test. Trust in every result.
THAT’S HEMOSTASIS TESTING WITH THE ACL TOP FAMILY 70 SERIES + HEMOHUB INTELLIGENT DATA MANAGER.
Introducing an end-to-end frictionless workflow in Hemostasis testing. Powerful automation and centralized data management deliver consistent, quality-assured results while reducing manual steps and optimizing workflow.
Efficiency that performs
Experience system-wide standardization with the same software and reagents across all instruments, plus automated performance verification and continual loading with no system interruption.
Advanced quality management
Streamline quality control (QC) management with real-time HemoHub synchronization. Auto-generated reports ensure audit readiness. And optical LED technology prevents errors before they happen.
One reagent menu. Total confidence.
The HemosIL comprehensive reagent menu offers the most liquid ready-to-use routine and specialty reagents, including the only FDA-cleared liquid ready-to-use PT reagents.
Scan QR code or visit Werfen.com/70Series to learn more
The need for earlier detection and reliable intervention monitoring for managing sepsis
By Jeroen Bursens, Sr.
Remarkably resilient in protecting against disease, the wonders of the human body inspire medical scholars and nascent students alike. But when immune responses overreact to infection, a dangerous process begins, potentially resulting in organ damage and even death.
Sepsis, regarded as the number one cause of preventable death worldwide, garners nearly 49 million cases and 11 million deaths annually, representing approximately 20% of global fatalities.1 In the United States, at least 1.7 million adults contract sepsis every year.2 Of this population, 350,000 will die in the course of care, accounting for approximately one third of national hospital deaths.2 Sepsis remains a critical global concern, but advances in microbiology research and diagnostics are helping advance earlier intervention to help improve patient outcomes.
In alignment with the second strategic pillar of the 2030 Global Agenda for Sepsis, a key element in reducing this critical risk is health system investment in education, training, and tools to
prevent adverse patient outcomes.4 This initiative begins with adopting robust early detection and active monitoring measures.
A story of sepsis survival
Despite far-reaching advances in clinical delivery, sepsis remains a formidable medical challenge due to both its rapid onset and lack of awareness. Individuals who acquire sepsis require urgent intervention as treatment delays set the stage for often irreversible bodily harm and heightened mortality risks.
This is a truth I know all too well due to my own near-fatal experience with this infection.
In 2024, after having routine thyroid surgery, I spent the next 24 hours in a medically induced coma as physicians attempted to subdue a rapidly spreading infection that took hold in my upper body. After three procedures to remove the tissues damaged by necrotizing fasciitis, I learned that the infection spread to my abdomen—a disheartening prognosis for me and my loved ones. Fortunately, I was administered
antibiotics that helped fight off the infection, reversing an ill-fated trajectory.
In my case, the first signs of sepsis occurred only hours after I was discharged from surgery. My recovery is attributed to the timely action of clinicians who accurately recognized my symptoms and quickly routed me to a larger hospital skilled in treating serious infections.
Other patients are not as fortunate. Across the world, early symptoms are much too often ignored or attributed to less severe illnesses. When sepsis enters the equation, timely treatment is not only a medical best practice, but a matter of survival.
The imperative for early detection
Sepsis occurs when infection enters the bloodstream triggering mass inflammation. In its most advanced stages—septic shock—with every hour of delayed treatment, a patient’s risk of mortality increases by 8%.5
Early detection is key to preventing adverse patient outcomes, as it
paves the way for prompt, life-saving treatment, reducing the risk of organ failure, necrosis, and death. However, in resource-constrained settings, such as emergency rooms or intensive care units, clinicians have a limited number of methodologies to accurately identify sepsis at the point of care.
Current clinical evaluation protocols, including the systemic inflammatory response syndrome (SIRS) criteria, provide a starting point to identify common sepsis indicators. However, to confirm sepsis using this protocol, symptoms must meet SIRS criteria and microbial infection must be highly suspected or confirmed through laboratory testing. The quick Sequential Organ Failure Assessment (qSOFA) is similarly an initial screening tool to identify patients who meet sepsis risk criteria. This tool has notable drawbacks due to limited diagnostic sensitivity in select patient populations.6
The accuracy and flexibility challenges of sepsis screening tools underscore the need for faster, reliable diagnostic solutions for versatile care settings.
Reliable
monitoring: The role of laboratory medicine
Leading diagnostic tools are fundamental to both the early identification and ongoing management of sepsis. These tools complement clinical evaluations, enabling more objective assessments.
Biomarkers like procalcitonin (PCT), serum lactate, and MR-proADM have proven utility in detecting clinically relevant bacterial infections and determining infection severity. PCT testing is a powerful intervention for not only revealing the level of infection found in the body, but informing treatment decisions, such as antibiotic administration.
Using PCT, clinicians can determine whether administered antibiotics are effective at combating infections and how long to continue antibiotic treatment. Research suggests that daily PCT testing may significantly reduce antibiotic treatment duration in sepsis patients compared to standard care protocols.7 In a time of rising antimicrobial resistance (AMR), PCT deters antibiotic overuse advancing antibiotic stewardship.8 Additional clinical benefits from decreased antimicrobial exposure include reduction in adverse drug events, C. difficile infections, 30-day readmissions, length of hospital stay, and hospital costs.
Microbiology testing methodologies, such as culture media, are also central to effective sepsis management.
Utilizing prepared media, medical laboratory professionals can grow microbial colonies from positive blood samples and subsequently identify the specific pathogen(s) present. After pathogen identification, antimicrobial susceptibility testing (AST) is performed on the isolated colonies to determine the lowest concentration—minimum inhibitory concentration (MIC)—of antimicrobials that inhibit microorganism growth.
AST guides the selection of the most effective antibiotic to treat infections, and in doing so, may also identify antimicrobial resistance. These methods inform more precise diagnoses and targeted therapies. Additionally, molecular diagnostics, including PCR (polymerase chain reaction) tests, make rapid, accurate pathogen identification possible with a high degree of sensitivity.
With biomarker testing paired with clinical microbiology solutions, clinicians are equipped with the tools to increase diagnostic accuracy, accelerate care, and monitor treatment responses— all key to optimizing clinical delivery and transforming sepsis patient outcomes.
Systemic change and crossdisciplinary collaboration In sepsis management, the role of microbiology is not limited to individual diagnoses. From guiding disease control initiatives to informing antimicrobial stewardship, clinical microbiology influences all levels of the infection management continuum. This link between microbiology and clinical care points to an integral element of sepsis management: cross-disciplinary collaboration.
Clinicians can administer care at the highest level when equipped with reliable, accurate tools to augment clinical judgement and complement manual evaluations. In effect, close collaboration between microbiologists and laboratory management professionals ensures that point-of-care insights inform diagnostic development and likewise, microbiology discoveries enhance clinical care.
As the global medical community seeks to combat rising sepsis rates, collaboration between microbiology and medical laboratories will also strengthen health system investment in sepsis prevention and detection measures. These measures, formalized in the 2021 Surviving Sepsis Campaign (SSC) guidelines, include standardized screening protocols for high-risk patients, rapid diagnostic testing for suspected infections, and as advised, immediate
administration of antimicrobials following diagnosis.9 Leveraging the latest diagnostic insights, hospitals, health systems, and emergency care facilities also have an opportunity to incorporate sepsis awareness into ongoing patient education and public health initiatives. The cumulative effect of collaboration is one of continuous improvement. When clinicians, laboratory management professionals, and microbiologists engage around latest findings and best practices, the need to track infection rates, compliance metrics, and patient outcomes is even more pronounced. Cross-disciplinary collaboration is essential to the widespread adoption of sepsis prevention and management protocols, as well as diagnostic innovation and quality care.
The path forward
As a sepsis survivor, I know firsthand how quickly a bacterial infection can escalate into a dire emergency. For both myself and patients around the world, early detection of infection and active monitoring of sepsis symptoms made the difference between life and death. While there are countless challenges in healthcare that often appear insurmountable, combatting the rise of sepsis is one goal that is well within reach.
Through the dissemination of new findings and sharing of best practices, collaboration between medical laboratories and microbiology partners is instrumental to lowering sepsis incidence globally. Further, by integrating diagnostic tools and microbiology testing with clinical evaluation, clinicians are empowered with a robust toolkit to manage sepsis in a variety of care settings.
When we shift our focus to view early identification and active monitoring of sepsis as a critical priority, rather than an afterthought, we provide patients with not only the best chance of recovery, but another shot at life.
Jeroen Bursens, Sr. is a senior scientific a ffairs Manager at Thermo Fisher Scientific. With over 25 years of experience in specialty diagnostics and clinical microbiology, Jeroen is an advocate for public health education and awareness.
References are available online at mlo-online.com/55314659
Are you doing diagnostics —or logistics?
By Thomas Coulson
This simple question cuts to the heart of a fundamental principle refined over centuries in healthcare: prioritization based on need, not just arrival time. Think about the emergency room. Inspired by figures like Jean Dominique De Larrey on the battlefield in the late 18th century,1 medical professionals have employed the concept of triaging patients based upon need. This system doesn’t process patients based on the order they walk through the door (First In, First Out: FIFO). Instead, a patient’s condition is rapidly assessed and routed according to severity, ensuring priority to those needing immediate attention. It isn’t just about managing a queue; it’s about applying intelligence for timely and accurate outcomes no matter what the workload. Shifting from a simple
chronological FIFO process—or, as we might call it in a modern context, moving towards a “First In, Smart Out” (FISO), where the “Smart Out” is defined by clinical urgency, availability, and impact—allowing for dynamic prioritization.
Let’s look at the clinical laboratory from the perspective of FIFO. Every tube arriving in the lab represents a patient, their family, and physician who are anxiously awaiting results to inform critical decisions about care.Yet, for too long, laboratory automation, while well positioned for handling large volumes of samples and reducing manual steps, has operated primarily as FIFO to improve logistics. Automation can efficiently transport samples from point A to point B, processing them largely based on the order that they are loaded. While
a significant improvement over purely manual processing, the FIFO approach falls short of the dynamic, intelligent prioritization characterized by modern patient care methods. It raises the question: Are labs truly advancing diagnostics or merely improving logistics?
Modern labs are dealing with multiple pressing challenges. Globally, they are contending with continuously rising sample volumes, increasing test complexity, and the persistent drive by healthcare organizations to standardize workflows across their networks. All of this comes alongside an escalating demand for faster, more accurate results. Simultaneously, labs must navigate significant resource constraints, including labor shortages, budgetary pressures, and limited physical space.2 These compounding pressures create bottlenecks, extending the time
Education :: Laboratory Workf
between sample collection and result delivery, potentially delaying diagnosis and treatment, impacting patient outcomes, and straining costs.
Applying an intelligent approach
Addressing these challenges effectively requires a new approach leveraging flexible instrumentation, scalable automation, and integrated, intuitive informatics solutions, designed for labs to handle the demands of modern patient care. This powerful combination is key to achieving what can be termed Advantaged Workflows.
How do we turn standard workflows into Advantaged Workflows? By focusing on four key areas: optimized workflows, flexible instrumentation with scalable automation, integrated, intuitive IT and middleware, and advancing clinical capabilities. While scalable automation handles the physical movement and processing of samples—reducing repetitive tasks, minimizing human error, and increasing throughput—it’s the integration with sophisticated clinical informatics, particularly through powerful middleware, that inspires the automation system with the intelligence required
for a truly Advantaged Workflow.
Unlike traditional automation’s sequential FIFO processing, Advantaged Workflows leverage the intelligence of both the automation system combined with middleware—the “embedded intelligence.” Advantaged Workflows harness this embedded intelligence to understand not just where a sample needs to go, but how it can get there and how quickly it can be processed.
This is where the shift from FIFO to FISO—priority-driven logic, the laboratory equivalent of clinical triage— becomes possible. Advanced automation and middleware process beyond “first loaded” to understand each tubes origins, use sample tracking events to write workflow rules, and consider lab defined priorities.
Imagine the automation track as a complex network, like a city’s road system. Traditional FIFO is like every car following the exact same path in the order they entered the highway. The challenges with this approach are the roadblocks or extended travel time impacting the car’s ability to reach its destination on time. Advantaged Workflow’s use of intelligent routing,
on the other hand, is similar to employing a sophisticated GPS system that continuously analyzes traffic conditions, prioritizing emergency vehicles (STATs), and dynamically calculating the most efficient route for every car based on its destination and urgency. If one route (analyzer) is congested or temporarily unavailable (due to QC drift, for example), the system’s intelligence immediately detects this and reroutes samples around the issue, ensuring minimal delay, especially for high-priority tubes. Similarly, if a different route (assay) is unavailable (due to an empty vial, for example), available testing is done until that assay is refilled. This algorithmic approach provides truly “Intelligent Sample Routing.”
Turning intelligence into real-world impact
The impact of intelligent routing on turnaround time (TAT) is profound, extending beyond mere speed to focus on vital consistency and clinical relevance. By prioritizing urgent samples and dynamically managing the workflow based on real-time conditions, the
system delivers rapid and predictable TATs, often eliminating cumbersome manual STAT processes. Real-world examples underscore this impact: In a study undertaken by Beckman Coulter, Bethesda North saw significant TAT reductions, achieving 98% of samples completed in under 40 minutes.3 Even more strikingly, an observational study by Beckman Coulter at Worcestershire Acute Hospitals, in Worcestershire, UK demonstrated dramatic decreases not only in mean TAT for both STAT samples (from 59 to 26 minutes) and routine samples (from 1 hour 25 minutes to 35 minutes) but also a remarkable 91% reduction in the standard deviation of STAT TATs (from 42 to just 4 minutes).3 This sharp drop in variability is a powerful indicator of predictable, reliable service—ensuring clinicians have results when they expect them.
The sophisticated integration creating the Advantaged Workflow means automation no longer needs to be simply a logistics system confined to improving sample transport efficiency. Powered by the intelligent synergy between automation and informatics, Advantaged Workflow elevates laboratory automation from a processing system focused primarily on logistics to a dynamic, intelligent partner in patient care. With embedded intelligence mirroring clinical triage logic, it can optimize, automate, and simplify processes, delivering precise, comprehensive data tailored to each patient’s unique needs. This transition from simple FIFO logistics to FISO operations—intelligent, priority-driven processing—is not just an operational improvement; it is a fundamental shift that directly impacts the speed and accuracy of diagnosis, enabling clinicians to make faster, more informed treatment decisions for patients who need it most.
By embracing Advantaged Workflows, labs can confidently navigate the complexities of modern diagnostics, ensuring that every sample is treated with the intelligence and prioritization it deserves, ultimately helping to power the moments that matter most for patients.
REFERENCES
1. Turner MD, Shah MH. Dominique-Jean Larrey (1766-1842): The founder of the modern triage system. Cureus. 2024;16(6):e62375. doi:10.7759/cureus.62375.
2. ASCLS. Addressing the Clinical Laboratory Workforce Shortage . The American Society for Clinical Laboratory Science. July 2, 2020. Accessed September 2, 2025. https://
3. Beckman Coulter. Breaking Status Quo—Continuing Success at Bethesda North with Total Lab Automation: A case study. 2025. Accessed September 2, 2025. 2025-13854-auto-dxa5000-cs-glb-en--bethesda-r4.pdf.
4. Beckman Coulter, Inc. Advancing Patient Healthcare in Worcestershire: One-Year Impact of DxA 5000 Track Installation (2025) Available upon request. Accessed September 2, 2025. https://www.beckmancoulter.com/learning-and-events/ webinars/automation-and-cimt-webinars/ advancing-patient-healthcare-in-worcestershire.
Thomas Coulson a senior Global Product Marketing Manager at Beckman Coulter, specializes in Workflow and it solutions (W its) within diagnostics. Leveraging his extensive experience in product marketing and strategic planning and drawing on his background as a biomedical scientist, he is passionate about developing and delivering innovative solutions that enhance laboratory efficiency and ultimately improve patient care. He always aims to make a real difference for both laboratories and patients.
AUTION Urinalysis Solution
Smart transfer system allows for a compact footprint: The AUTION EYE connects with the AUTION MAX AX-4060, and results in a very small footprint (41.9" x 25.6" x 23.6").
Blood gases and pH measurement
By Robert F. Moran, PhD, FCCM, FIUPAC
As described in last month’s first part of this two-part article,1 lung dysfunction may be categorized as an airway-based, tissue-based, or blood circulation–based disease. These are intimately linked to renal functioning, both leading to the measurements we refer to as ‘blood gases.’ When oxygen (O 2) reaches tissues, it enables the production of energy from carbon compounds and in doing so produces carbon dioxide (CO 2) and water. As a gas, the CO 2 , diffuses from the tissue cells into the blood and is transported to the lungs where it dilutes the O 2 in the incoming air and thus inhibits O 2 transfer to the tissues. The primary measured gases, O 2 and CO 2, are essentially linked — each gas pressure is the driving ‘force’ in its environment. For a more comprehensive overview, I suggest the monograph by John Toffaletti, Blood Gases and Electrolytes 2
Oxygenation assessment in blood gas analysis
Complete laboratory evaluation of oxygenation often requires much more than simple blood gas measurements — most notably CO-oximetry plus analysis of specimens collected under specified conditions. Nevertheless, many patients can be evaluated and treated successfully using blood gases alone if clinical observations and patient history are considered. Clinically, measurement of oxygen partial pressure (pO2) is performed on whole blood, usually an arterial specimen. However, since other anatomic sources are clinically useful, a complete symbol should include that additional information. (See MLO August 2024 continuing education article,“Point-ofcare testing: Managing change when you are not in charge.”)
Measurement of pO2 is based on the Clarke polarographic electrode and modified by Severinghaus and Bradley to include a semi-permeable membrane such that only the diffusible oxygen is measured in the electrode’s buffer based on the current flow produced at a set millivoltage characteristic for only oxygen.
O2 + 4e- + 4H+ à 2H2O
The oxygen partial pressure (tension) of arterial blood, pO2(aB) is the indicator of O2 diffusion into the pulmonary circulation — the driving force in moving O 2 from one compartment to another (e.g., alveoli of the lungs to the pulmonary capillaries). Typical levels for pO2(aB) in a young, healthy adult is >95 mm Hg (12.7 kPa). Nevertheless, clinical action for hypoxemia is usually not taken unless the pO2 is <80 mmHg (10.7 kPa). Oxygen levels are decreased in cases of impaired lung function (chronic obstructive pulmonary disease [COPD]) or when there is low-inspired oxygen pressure (e.g., at high altitudes or in the presence of other gases). With age, the pO2(aB) lowers by about 1 mm Hg(0.13kPa) for each year beyond 60. Measures to improve pO2(aB) include optimizing mechanical ventilation (reduces pCO2) and increasing inspired O2 percentage - F1O2. Along with the total hemoglobin, the pO2 of arterial blood is the primary sign of oxygenation status for most patients.
Evaluating the blood gases alone in a healthy young adult living near sea level, the reference value for p O2(aB) is about 95 mmHg (12.7 kPa). As with pCO2 and pH, however, a wider
range of values may occur before any therapeutic action is shown. A pO2 of 80mmHg (10.7kPa) signals therapeutically significant hypoxemia (low blood oxygen). Above 80mmHg, there is slight change in oxygen saturation or oxygen content with changes in oxygen partial pressure, but below 80 mm Hg, decreases in saturation occur rapidly. Normal deterioration of lung function with increasing age (over 60) causes a decrease in expected pO2 values of approximately 1.0 mmHg (0.13 kPa) per year.
Oxygen status is commonly defined based on a patient’s pO2 while breathing room air (21% O2). Estimates of hypoxemia can be made, even if the patient’s ventilation and oxygen are being supported. An estimate of the expected pO2(aB) used by many clinicians for patients receiving oxygen therapy is based on multiplying the fraction of inspired oxygen (FIO2) by five (mmHg). If measurements are in kPa (SI), the FIO2 should be multiplied by two thirds (0.67). If a patient’s measured value is lower than the estimated, hypoxemia on room air may be assumed, or a collection/measurement error may be suspected (See Table 1).
Clinically, if cardiac output and peripheral perfusion are considered adequate, then one or more of the following may be associated with a decreased tissue oxygenation: a.) oxygen saturation (gas exchange/shunting), b.) oxyhemoglobin fraction and total oxygen content of the blood (gas exchange and functional hemoglobin vs dyshemoglobins) or c.) P50 changes (indicates a tendency to accept and release oxygen from the blood hemoglobin.)
Oxygen saturation
Oxygen ‘saturation’ (sO2) is a common means of assessing oxygenation status, especially with the widespread use of peripheral or ‘pulse’ oximetry. While such devices give a true ‘saturation’ value, the use of their data to determine oxygen content or adequacy of oxygenation is inadvisable unless there is a clear understanding of the patient’s total hemoglobin (cHbt or c tHb) and dyshemoglobins such as carboxy and methemoglobin (COHb, MetHb), neither of which carries oxygen.
There are significant caveats in the clinical application of sO2 values. Consider the following:
decision criteria
* Values <40/5.3 = severe
Table 1. Hypoxemia decision criteria.
• odc shape/position influenced by: -pH, pco2, etc.
• p50 = po2 @ 50% saturation - indicates Hb - o2 affinity, through odc position
• increases in p50 = ‘right shift’ = less affinity
• p50 reference range: 25 to 29 mmHg (3.4-3.8 kPa)
• The p O 2 – s O 2 relationship or ‘curve’ itself. The oxyhemoglobin dissociation ‘curve’ (ODC) (see Figure 1) is derived from the oxygen content- p O 2 diagram in which there was no adjustment for the factors which affect the ‘curve.’ The result is the neatly smoothed and familiar sigmoid or s-shape seen in the ODC figure. Note the steep drop in the value for p O 2 below s O 2 of 90%. A small percentage change of s O 2 can correspond to a substantial change in p O 2 , differences that are highly significant, but might not be recognized as such if monitoring the s O 2 alone. Further, the p 50 (partial pressure at 50% s O 2), shows the tendency of hemoglobin to bind/release oxygen.
• Devices measuring only oxygen saturation (and pulse rate) cannot measure the presence of depleted oxygenation resulting from dyshemoglobins. In fact, consider carbon monoxide poisoning, treated at the scene of exposure with 100% oxygen, could result in a p O 2 of >>100mmHg and a saturation of >>95%, while at the same time the patient is clinically severely hypoxic.
• Using the estimated saturation as found on standalone blood gas systems may be valid for healthy people. This approach was the consequence of early (1960s–1970s) attempts to explain partial pressure of oxygen versus the true saturation as was explained in textbooks of the time; unfortunately, some still report that ‘saturation.’ It’s a nice curve-fitting computation, but the variables and assumptions involved limit its utility except as a teaching tool, rather than clinical usefulness.
True oxyhemoglobin saturation
Before the development of dedicated photometric technology (CO-oximetry), oxygen saturation was measured by first extracting oxygen gas manometrically from a patient’s blood specimen (to determine oxygen content), and then repeating
Figure 1. oxyhemoglobin dissociation curve.
Best Practices :: Blood Gases
the measurement after the same specimen was exposed to pure oxygen.
Actual specimen oxygen
Fully oxygenated specimen oxygen x 100 s02 =
CO-oximetry, the multi-wavelength photometers dedicated to measuring many hemoglobin derivatives simultaneously give results equivalent to the old and slow technique, but in seconds rather than in hours.
The key to understanding the estimated ‘saturation’ from standalone blood gas analyzers is that it was made available to explain p O2 values relative to the true saturation values, but not as a substitute for a measured saturation clinically. While some manufacturers of blood gas analyzers still include the estimated value, it should not be reported since it is likely to add to confusion when comparing with measured values.
Summary: Gas exchange, oxygen quantities
Blood gases (pCO2 and pO2) and pH and the relationships and definitions described relate to the laboratorian’s ability to assess the quality of results obtained before they are recorded/ reported, so the values obtained can be better evaluated. If they do not make sense, reanalysis or other consultation may be proper. By understanding these concepts and reviewing the data prior to reporting the results, an overall improvement in the quality of these most critical values can be obtained and delays minimized.Evaluation of a patient’s oxygenation status is best done while the patient is breathing room air, however, estimates of hypoxemia can be made if the patient’s
ventilation is being supported. If cardiac output and peripheral perfusion are considered adequate, then one or more of the following participate in the decreased tissue oxygenation: oxygen saturation, oxyhemoglobin fraction, total oxygen content, or P50. Measurements of COHb, MetHb, sulfhemoglobin, and 2,3-DPG can help find which parameter is tied to the decreased oxygenation. These additional measurements are essential for the rapid and complete evaluation necessary in the emergency/trauma environment.
REFERENCES
1. Moran RF. Blood gases and pH: Measurement and clinical overview. Medical Laboratory Observer. August 25, 2025. Accessed September 3, 2025. https://www. mlo-online.com/diagnostics/hematology/article/55306204/ blood-gases-and-ph-measurement-and-clinical-overview.
2. Toffaletti, John D, Blood Gases and Electrolytes, AACC Press, 2009 (2nd Ed), ISBN 13: 978-1-59425-097-2 and ISBN-10: 1-59425-097-9.
3. Moran RF, Liesching TN, The ABC’s of ABG’s: A Cyclopedic Dictionary of the Testing Terms Used in Critical Care. Momentum Press®, LLC, ISBN-13: 978-1-94708-348-6 (print), ISBN-13: 978-1-94708-349-3 (e-book).
Robert F. Moran, PhD, FCCM, FIUPAC is the Principal scientist at mviSciences, a consulting and educational services organization and President of accutest™ Proficiency testing services. dr. Moran served multiple terms on the Nc cls (Now clsi) Board of directors and was an active participant or chairholder in several of their blood gas and electrolyte standards-writing teams. a lso active in clinical chemistry internationally, he is an appointed Fellow of the in ternational Union of Pure and a pplied chemistry (F iUPac). He is a retired professor of chemistry and physics from Wentworth institute of technology but remains active in consulting work and writing.
SHINE A LIGHT ON A HIDDEN PROBLEM
HEMOLYSIS ACCOUNTS FOR UP TO 70% OF PREANALYTICAL ERRORS.1
The NEW GEM Premier 7000* with iQM3 is the first and only blood gas system to provide lab-quality hemolysis detection right at the point of care. 2 Hemolysis elevates potassium by up to 152%—tackle the #1 preanalytical error and elevate patient care.3–5
Express Hemolysis
Detection
Blood gas results with hemolysis detection in 45 seconds at the point of care, which may reduce the need to send samples to the lab for recheck, saving blood and time.6
Effective and efficient
Whole blood hemolysis detection can help reduce unnecessary sample collection, delays, and inappropriate treatment. Ultimately, it can help optimize staff time, reduce costs, and improve patient management.
Track-to-Train
Go beyond detection. Lower preanalytical error rates due to hemolysis with GEMweb® Plus 500 Custom Connectivity by tracking operators and locations to identify where further training is required. Plus, Werfen Academy can provide the necessary content for instruction.
References 1. Lippi G, Salvagno GL, Favaloro EJ, Guidi GC. Survey on the prevalence of hemolytic specimens in an academic hospital according to collection facility: opportunities for quality improvement. Clin Chem Lab Med. 2009;47(5):616–618. doi:10.1515/CCLM.2009.132. 2. Balasubramanian S, McDowell EJ, Laryea ET, et al. Novel in-line hemolysis detection on a blood gas analyzer and impact on whole blood potassium results. Clin Chem. 2024;70(12):1485-1493. doi:10.1093/clinchem/hvae135. 3. Lippi G, Fontana R, Avanzini P, Sandei F, Ippolito L. Influence of spurious hemolysis on blood gas analysis. Clin Chem Lab Med. 2013;51(8):1651–1654. doi:10.1515/cclm-2012-0802. 4. Lippi G, von Meyer A, Cadamuro J, Simundic A-M. Blood sample quality. Diagnosis. 2018;6(1):25–31. doi:10.1515/dx-2018-0018. 5. O’Hara M, Wheatley EG, Kazmierczak SC. The impact of undetected in vitro hemolysis or sample contamination on patient care and outcomes in point-of-care testing: a retrospective study. J Appl Lab Med. 2020;5(2):332–341. doi:10.1093/jalm/jfz020. 6. Werfen. GEM Premier 7000 with iQM3 Operators Manual. P/N 00000026407. Rev 00. Aug 2023. 7. Phelan MP, Hustey FM, Good DM, Reineks EZ. Seeing red: blood sample hemolysis is associated with prolonged emergency department throughput. J Appl Lab Med. 2020;5(4):732–737. doi:10.1093/jalm/jfaa073. 8. Wilson M, Adelman S, Maitre JB, et al. Accuracy of hemolyzed potassium levels in the emergency department. West J Emerg Med. 2020;21(6):272–275. doi:10.5811/westjem.2020.8.46812. 9. Milutinović D, Andrijević I, Ličina M, Andrijević L. Confidence level in venipuncture and knowledge on causes of in vitro hemolysis among healthcare professionals. Biochem Med. 2015;25(3):401–409. doi:10.11613/BM.2015.040. 10. Phelan MP, Ramos C, Walker LE, et al. The hidden cost of hemolyzed blood samples in the emergency department. J Appl Lab Med. 2021;6(6):1607–1610. doi:10.1093/jalm/jfab035.
AI-assisted Gram stain analysis
Upgraded automation for latent tuberculosis testing
t he F dA-approved Auto-Pure 2400 liquid handling platform is designed to automate the t- s P ot t B test, improving laboratories’ productivity while maintaining superior clinical performance in latent tuberculosis detection. t he Auto-Pure 2400 combines liquid handling with magnetic cell isolation technology, reduces hands-on time, and delivers accurate, high-throughput t B testing — for in vitro diagnostic use. Revvity
Critical test results wherever they’re needed
t he epoc Blood Analysis s ystem from s iemens Healthineers is a handheld solution that provides labaccurate blood gas, electrolyte, and metabolite results at the patient’s bedside or in the field in less than one minute. t he single-use test c ard has 13 analytes and requires no refrigeration.
Siemens Healthineers
t he Fusion Bacteriology suite: Gram stain solution streamlines bacteriology workflows by digitizing Gram-stained slides. Features include AI-assisted organism detection with automatic calculation of presence, prevalence, and predominance, automated rejection criteria, digital archiving and storage, and an open API for LIs integration. Techcyte
In vitro quality control panel
Birlinn c oV2-Flu- rs V c ontrol Panel M509 is intended for use as a quality control to monitor the performance of in vitro laboratory nucleic acid testing procedures for the qualitative detection of target gene segments in Influenza A, Influenza B, r espiratory s yncytial Virus A/B, and s A rs - c oV-2. Maine Molecular Quality Controls
Arterial and venous blood gas syringes
Bd A-line and Bd Preset (needleless) syringes preserve sample integrity, minimize preanalytical errors, and improve diagnostic accuracy, designed for collecting whole blood specimens from arterial and venous line draws, empowering critical care decisions. t he airtight Hemogard tip cap and self-venting filter of Bd Preset expels residual air while maintaining specimen integrity. BD
Streamline your QC, the smart way
t he Acusera s mart controls range is designed to fit directly onto a wide range of test systems without the need to aliquot material, streamlining the Q c process by minimizing human error and optimizing workflow. For more information visit: https://www. randox.com/acusera-smart-quality-control/. Randox
Unified, automated, and compliant sample management
s apio LIM s supports end-to-end sample management for clinical labs, from digital accessioning to final reporting. Features include automated sample lineage tracking, barcode/ r FId integration, environmental condition capture, and audit-ready traceability. t he no-code platform helps labs enforce soPs, reduce errors, and maintain compliance with c LIA, Gc P, and 21 c F r Part 11. Sapio Sciences
Multiplex LC-MS/MS system
s himadzu’s nexera QX incorporates dedicated sample introduction streams for continuous operation of the mass spectrometer, maximizing productivity. t he system’s autosamplers, stream-dedicated injection valves and washing pumps deliver ultra-fast performance with ultralow carryover, while dedicated software offers a single point of control and ensures robust operation for prolonged unattended analysis. Shimadzu
Collect, preserve, and transport viral samples
Puritan uni tranz- rt transport s ystem, with universal transport medium, for the collection, preservation, and transport of viral samples. uni tranz- rt preserves the sample at room temperature and in refrigerated settings. Available with a variety of sterile swabs, including PurFlock ultra flocked swabs, and as media-only. Visit us in-person at AMP Booth #1129.
Puritan Medical Products
Blood gas analyzer with advanced test menu for critical care
n ova’s s tat Profile Prime Plus offers significant clinical value in a blood gas/ critical care analyzer by providing unique critical care tests. Blood oxygenation, tissue perfusion status, acid/ base balance, electrolyte balance, fluid balance, glycemic control, and kidney function tests are available from two drops of blood in about 90 seconds at the point of care. Nova Biomedical
Ready-to-Use reagent for the quantitative measurement of cholesterol
t he s EKIsuI diagnostics s EK ur E c Ho LE st E ro L- s L reagent is an enzymatic assay that uses cholesterol esterase and cholesterol oxidase as reliable determinants for the quantitative measurement of c holesterol in serum. t his one-part, liquid stable assay comes ready-touse, saving clinical laboratories time on having to perform additional preparation steps. t he s EK ur E c Ho LE st E ro L- s L A ss AY is adaptable for a broad range of clinical chemistry analyzers. Sekisui Diagnostics
Rapid ESBL detection
Hardy diagnostics released the new F dA-cleared n G-t E st ct X-M Multi, an in vitro, rapid, and visual immunoassay for the qualitative detection of ct X-M enzymes (groups 1, 2, 8, 9, and 25) for the rapid detection of E s BL’s. using ct X-M Multi provides detection in just 15 minutes from isolated colonies.
Hardy Diagnostics
Molecular controls for HPV testing
ZeptoMetrix n At trol Human Papillomavirus (HPV) c ontrols are non-infectious, refrigerator-stable molecular controls formulated with purified, intact whole organisms. Each control contains target concentration of 1,000,000 copies/mL and is intended for use in molecular assay workflows to support accurate and reliable test results. ZeptoMetrix
Automated CSF cell counts in 5 minutes
Even a few cells in cerebrospinal fluid can indicate serious conditions such as metastatic cancer or meningitis. Gloc yte automates total nucleated cell ( tnc) and red blood cell (r B c) counts in under 5 minutes using fluorescence imaging, detecting down to 0 cells/µL and eliminating manual variability. Advanced Instruments
High-throughput integrated chemistry and immunoassay system
VI tros X t 7600 Integrated s ystem combines chemistry/ immunoassay testing, processes 1,320 tests hourly with Microt ip, MicroWell, Micro s ensor technologies and X t Micro s lides. Features digital c hemistry optics for precise diagnostics from 2.7 µL samples, 160-test menu, E- conn E ct IVI t Y technology and automation options. *Maximum theoretical throughput. Actual results will vary by test mix and sample workflow. QuidelOrtho
FDA cleared digital cytology system
Hologic’s Genius digital diagnostics s ystem is the first and only F dA cleared digital cytology solution, developed to help detect precancerous lesions and cervical cancer cells on a t hinPrep Pap test. t he system combines AI and volumetric imaging technology to increase disease detection, enhance screening efficiency, and optimize workflows and resources. Hologic
Early detection, better outcomes Advancing
diagnosis in men’s health
By Lisa-Jean Clifford
Fast, accurate diagnosis of men’s most pressing health issues can dramatically improve outcomes, reduce treatment complexity, and enhance overall quality of life. By identifying conditions early—from heart disease to cancers—clinicians can initiate timely interventions that save lives, preserve function, and lower long-term healthcare costs.
Of these conditions, all but diabetes and unintentional injury are most often being diagnosed, and treatment plans being determined, based upon information coming from the laboratory. Although, diabetes can lead to health problems that would also land in the direct purview of the laboratory as well. So, let’s dive into each of these a bit.
Lung cancer
Men are more likely to be diagnosed with lung cancer and less likely to survive it compared to women. The rate of new cases in 2019 was 23% higher in men than women (59 versus 48 per 100,000, respectively), and the five-year survival rate was 39% higher among women than men (30% versus 21%, respectively).1
Skin cancer
Skin cancer is the most common of all human cancers. About 1 in 5 Americans will get some type of skin cancer in their lifetime, and more than two people die of skin cancer every hour in the United States. Skin cancer affects people of all skin colors. There are three major types of skin cancers: basal cell carcinoma, squamous cell carcinoma (SCC), and
melanoma. The first two skin cancers are grouped together as nonmelanoma skin cancers.2
Colorectal cancer
• By 2030, cases of colorectal cancer in people under 50 are expected to double. 3
• The death rate from colorectal cancer for people ages 20 to 54 rose between 2004 and 2014. Before then the death rate had been going down (American Cancer Society).
• Most people under 50 with colorectal cancer do not have a family history of the disease (American Cancer Society).
• Black people of all ages, including young adults, are more likely to get and to die from it than any other group.
• Colon and rectal cancers are both cancers of the intestine. However, their treatments are quite different.
Colon cancer
Colon cancer is the third most common type of cancer in the United States. However, it is also one of the most curable, and survival rates have been increasing over the past several years. Awareness and early detection are key—colon cancer can often be caught in its early stages, when treatment can be most effective. There are several different ways to test for colon cancer. After reviewing clinical history and doing a basic medical exam, a physician will most likely perform a colonoscopy. Treatment often involves surgery, chemotherapy, and/or radiation.
Rectal cancer
The rectum sits in a tight space in the body, narrowly separated from other organs and structures in the pelvic cavity. As a result, complete surgical removal of rectal cancer is challenging and complex. There are several different ways to test rectal cancer. The most common path for diagnosis will include an ultrasound to see how far through the rectal wall a cancer has grown and a colonoscopy.
Rectal cancer often requires more than one type of treatment and much like colon cancer usually involves surgery and a combination of chemotherapy and/or radiation treatments. However, given the complex nature of the rectum, it also often involves partial or total reconstructive surgery or will result in a colostomy bag.
Testicular cancer
The American Cancer Society’s estimates for testicular cancer in the United States for 2025 are:
• About 9,720 new cases of testicular cancer diagnosed
• About 600 deaths from testicular cancer
The incidence rate of testicular cancer has been increasing in the United States and many other countries for several decades. The increase is mostly in seminomas. Testicular cancer is not common: about 1 of every 250 males will develop testicular cancer at some point during their lifetime.
The average age of males when first diagnosed with testicular cancer is about 33. This is largely a disease of young to middle-aged men, but approximately 6% of cases occur in children and teens and approximately 8% occur in men over 55. Because testicular cancer usually can be treated successfully, the mortality rate for this type of cancer is very low: about 1 in 5,000.
Artificial intelligence and machine learning: AI algorithms now analyze ECGs, imaging scans, and clinical data to flag subtle abnormalities faster than traditional methods. Predictive models can forecast disease progression and personalize follow-up intervals.
Prostate cancer
Prostate cancer ranks among the top cancers in men, especially those over 50. It often grows slowly, allowing many men to remain asymptomatic for years. Early and precise diagnosis of prostate cancer relies on identifying molecular signals—biomarkers—that distinguish healthy tissue from malignancy. Biomarkers guide decisions about who needs a biopsy, what treatments to pursue, and how to monitor treatment response and disease progression. Advances in molecular testing and imaging now allow clinicians to tailor care based on each man’s unique cancer profile.
The role of biomarkers in prostate cancer: A biomarker is any measurable molecule in the body that reflects normal or disease processes. In prostate cancer, biomarkers can indicate tumor presence, aggressiveness, and likelihood of recurrence. Incorporating these markers into routine evaluation helps avoid unnecessary biopsies, reduces overtreatment, and pinpoints the most effective therapies for each patient.
Mesothelioma
Men are significantly more affected by mesothelioma, a rare type of cancer that develops in a layer of tissue that covers most internal organs. Men are over four times more likely to contract mesothelioma, because 80 percent of people with this cancer report at least one exposure to asbestos. Men over 65 who have worked in trade occupations or the military are at the highest risk for this kind of cancer.
Idiopathic pulmonary fibrosis
Idiopathic pulmonary fibrosis (IPF) is another type of cancer found predominantly in men — 70% of all cases. It is a disease that causes scarring of the lungs. Idiopathic means it has no known cause. IPF symptoms usually appear later in life, with most people being diagnosed over age 50. Symptoms most often include shortness of breath, a dry cough, weight loss, and fast, shallow breathing. IPF does not have a cure and is progressive but can be slowed with medication and treatment, which may also alleviate symptoms for the patient.
Viruses
In the laboratory, viral infections can be confirmed by multiple methods. Diagnostic virology has changed a great deal due to the increase in molecular techniques and increased clinical sensitivity of serological assays. A large variety of samples can be used for virological testing. The type of sample sent to the laboratory often depends on the type of viral infection being diagnosed and the test required.
Cardiovascular disease (CVD)
The diagnosis of CVD often begins with identifying clinical symptoms that may indicate underlying heart problems. While some individuals may experience obvious warning signs such as chest pain, shortness of breath, or palpitations, others may have no or atypical symptoms that impede early detection. Fatigue, dizziness, swelling in the legs, and unexplained weakness can also be indicative of cardiovascular issues. In some cases, symptoms appear only during physical exertion, while in others, they occur unpredictably at rest.
Beyond traditional diagnostic tests, advanced imaging techniques have revolutionized the early detection of cardiovascular disease. Coronary artery calcium scoring performed using computed tomography (CT) helps assess the presence and extent of calcified plaques in the coronary arteries. This test is useful for identifying those who are not
Replacement Reagents for your chemistry analyzer
a-1 Microglobulin
Anti-Streptolysin O
Apolipoproteins:
AI, AII, B, CII, CIII, E
b-2 Microglobulin
Complement C3, C4
CRP, hs-CRP
Cystatin C
D-Dimer
Factor XIII
Ferritin
Fibrinogen
H. pylori
Haptoglobin
Hemoglobin A1c
IgA, IgG, IgM
Insulin
Krebs von den Lungen-6
Lipoprotein(a)
Microalbumin
Prealbumin
Remnant Lipoprotein Chol.
Rheumatoid Factor
Transferrin
UIBC
KAMIYA BIOMEDICAL COMPANY
yet displaying symptoms of heart disease. Magnetic resonance imaging (MRI) offers high-resolution images of the heart’s structure and function, making it a valuable tool for diagnosing congenital heart disease, myocarditis, and fibrosis. Similarly, cardiac computed tomography angiography (CCTA) provides detailed images of coronary arteries, allowing clinicians to detect narrowing or blockages with high precision.
Laboratory tests and biomarkers for CVD diagnosis: Blood tests play a key role in diagnosing and monitoring the progression of cardiovascular disease. High levels of cholesterol, triglycerides, and inflammatory markers such as C-reactive protein indicate an increased risk of atherosclerosis. Similarly, tests measuring levels of troponin are essential for diagnosing acute myocardial infarction. Other biomarkers, such as B-type natriuretic peptide (BNP), help
Early diagnosis reduces hospital stays, emergency care, and long-term management expenses.
assess heart failure severity, while glucose and hemoglobin A1c levels provide insights into diabetes-related cardiovascular risks.
Latest advancements in the diagnosis of CVD: The diagnosis of CVD has evolved significantly with the integration of leading-edge technologies such as artificial intelligence, machine learning, and advanced imaging techniques. AI-powered algorithms now assist in analyzing ECGs and imaging scans, allowing for faster and more accurate diagnosis. Wearable devices with real-time monitoring identify irregular heart rhythms and provide early indication of heart disease. Genetic testing enables physicians to assess hereditary risks and predict cardiovascular conditions before symptoms are present. All of these advancements improve how CVD is diagnosed, leading to more personalized and proactive healthcare.
Genetic testing helps in the diagnosis of CVD: Genetic testing plays a key role in identifying individuals at risk of developing cardiovascular disease. By analyzing specific gene mutations associated with inherited heart conditions, such as hypertrophic cardiomyopathy and familial hypercholesterolemia, physicians can
detect heart disease before symptoms appear. Genetic profiling can also help determine an individual’s response to medications, allowing for more personalized treatment plans.
Artificial intelligence improves the accuracy of diagnosis: Artificial intelligence is transforming how cardiovascular disease is diagnosed by enhancing the interpretation of medical imaging, ECGs, and patient data. AI-driven algorithms analyze large volumes of clinical data to identify patterns that can be missed by humans, leading to earlier and more accurate diagnoses. Machine learning models can also predict the likelihood of heart disease progression, enabling proactive treatment plans. AI applications in radiology help improve the detection of arterial blockages through automated image analysis. As AI continues to evolve, it will play an increasingly vital role in refining how to diagnose heart disease with greater speed and accuracy.
Conclusion
The power of early, accurate diagnosis results in the following:
• Improved survival rates: Detecting disease at a treatable stage increases survival and remission rates for cancers and chronic illnesses.
• Reduced treatment intensity: Early intervention often requires less aggressive therapy, sparing men from extensive surgeries or highdose, often toxic medications.
• Enhanced quality of life: Preventing complications maintains physical function, mental health, and independence.
• Cost savings: Early diagnosis reduces hospital stays, emergency care, and long-term management expenses.
The integration of biomarkers into prostate cancer care is transforming diagnostic pathways from one-size-fits-all to highly personalized algorithms. Ongoing research aims to combine biomarker profiles with advanced imaging and artificial intelligence to detect cancer even earlier and more accurately. As these tools mature, men will benefit from fewer invasive procedures, smarter treatment choices, and better long-term outcomes.
Early recognition of symptoms, a thorough understanding of risk factors,
and the integration of traditional and innovative diagnostic tools are reshaping men’s health in both diagnosis and care. By leveraging advanced imaging, biomarker profiling, AI analytics, genetic insights, and wearable monitoring, physicians can detect disease earlier, initiate precise treatments, and significantly improve men’s health trajectories. Proactive screening and personalized diagnostics pave the way to longer, healthier lives.
REFERENCES
1. American Lung Association. Four diseases threatening men’s lung health. Lung.org. Accessed September 3, 2025. https://www.lung.org/blog/ lung-diseases-threatening-men.
2. Ellis RR. An overview of skin cancer. WebMD. December 31, 2006. Accessed September 3, 2025. https://www.webmd.com/ melanoma-skin-cancer/skin-cancer.
3. Bailey CE, Hu CY, You YN, et al. Increasing disparities in the age-related incidences of colon and rectal cancers in the United States, 1975-2010. JAMA Surg. 2015;150(1):17-22. doi:10.1001/jamasurg.2014.1756.
Lisa-Jean Clifford has been a noteworthy leader in the high-tech healthcare solutions space for more than two decades. l isa-Jean’s passion for making a positive impact on the lives of patients through technology can be traced back to her tenure at McKesson and iDX, now ge Healthcare, where she served in vital business development and marketing roles, and to Psyche s ystems, an lis solution provider, where she was the ceo for eleven years. she is currently the President at Gestalt Diagnostics
LABORATORY INNOVATOR
James H. Nichols, PhD, DABCC, FADLM is a Professor of Pathology, Microbiology, and Immunology, Medical Director of Clinical Chemistry and Point-of-Care Testing, and Medical Director of Special Testing at Vanderbilt University Medical Center in Nashville, Tennessee. Dr. Nichols received his B.A. in General Biology/Premedicine from Revelle College, University of California at San Diego. He went on to complete a Master’s and Doctorate in Biochemistry from the University of Illinois, Urbana-Champaign, and then he was a fellow in the Postdoctoral Training Program in Clinical Chemistry at the Mayo Clinic, Rochester, Minnesota. He is board certified in both Clinical Chemistry and Toxicological Chemistry by the American Board of Clinical Chemistry. Dr. Nichols spent several years as Associate Director of Clinical Chemistry, Director of Point-ofCare Testing, and an Associate Professor of Pathology at Johns Hopkins Medical Institutions. Jim later served as Medical Director of Clinical Chemistry for Baystate Health in Springfield, Massachusetts and was a Professor of Pathology at Tufts University School of Medicine. Dr. Nichols is currently the President-Elect for the Clinical and Laboratory Standards Institute (CLSI). Dr. Nichols’ research interests span evidence-based medicine, information management, laboratory automation, point-of-care testing, and toxicology.
Safeguarding accuracy in clinical testing
By Christina Wichmann
Can you share how you became interested in laboratory medicine and what led you to focus on hemolysis in particular?
I first got interested in laboratory medicine during graduate school while studying vaccine development. That curiosity really deepened during my postdoc in Clinical Chemistry at the Mayo Clinic. Over the past 33 years, I’ve worked at places like Johns Hopkins, Bay State Medical Center, and now at Vanderbilt University, where I serve as a Professor of Pathology, Microbiology, and Immunology and I am Medical Director of Clinical Chemistry and Point-of-Care Testing.
My background in chemistry and lab automation naturally led me to focus on hemolysis because it’s such a widespread issue that directly affects the accuracy of lab testing, and ultimately, patient care in some of the most high-risk areas of the hospital.
How does hemolysis affect test results, and what are the most clinically significant consequences of inaccurate results due to hemolyzed specimens?
Hemolysis happens when red blood cells rupture, releasing their contents into the sample. This can really interfere with lab tests, leading to falsely elevated potassium levels, possibly leading to serious misdiagnosis or inappropriate treatment. Even when potassium looks normal, hemolysis might still be present and skew results. It’s a subtle but critical problem we have to stay ahead of.
What role do phlebotomy practices and staff training play in reducing hemolysis, and are there tools or metrics that help track this effectively?
Phlebotomy practices are huge when it comes to preventing hemolysis. Training staff properly, especially those working with neonates or patients with difficult venous access, is essential.
At our lab, we look at hemolysis rates by unit and patient population so we can provide feedback and improve collection techniques. It’s all about
identifying where the problems are happening and giving teams the right support to fix them.
Can you tell us about a specific technology or approach that’s made a real difference in detecting hemolysis?
Yes, there’s a new blood gas system that’s really promising. Werfen’s GEM Premier 7000 with iQM3 uses acoustic separation of whole blood in real time, which means we can detect hemolysis right away. That’s a big advancement, especially for point-of-care testing, where hemolysis often goes unnoticed. Having that real-time detection and flagging makes a huge difference in both accuracy and response.
How does undetected hemolysis impact patient care and the lab?
Undetected hemolysis can make a patient look like they’re fine when they’re not, or make them look like something’s wrong when everything is actually okay. This can lead to delayed or incorrect treatment. For the lab, it throws off quality metrics and creates a ripple effect across departments. Having protocols and tools in place to catch it early is really important.
Hemolysis can be present in any sample and will affect potassium and other analyte concentrations. In the core lab, our chemistry analyzers automatically measure the hemolysis indices to alert the technologists to the presence of hemolysis as well as the clinician for their interpretation. But for whole blood samples, blood gas analyzers, before the GEM Premier 7000, do not have the means of detecting hemolysis. If suspected due to elevated potassium levels in the sample, the clinician can recollect another sample from the patient to confirm the potassium level, or they can send the remainder of the initial sample to the lab where it can be centrifuged and visually inspected for hemolysis. Both of those options require additional resources and will delay treatment. A blood gas analyzer that detects hemolysis in real-time improves efficiency and ensures quality and reliability of the potassium result.
If a hospital performs one million tests per year and loses one in 1,400 tubes at a cost of $400–600 per tube, then the annual cost could be as much as $428K—not to mention the burden on patients and hospital.1
By implementing Indexor, you can trace samples starting at patient draw, monitor key quality indicators during transportation, and automate time-consuming lab operations.