Western Cape


Western Cape


 A collaboration between the Western Cape Department of Health and Wellness and the DG Murray Trust.
Primary investigators
Prof. Marjanne Senekal and Prof. Nelia Steyn (University of Cape Town)
Prof. Hannelie Nel (Stellenbosch University)
Co-investigators
Dr Janetta Harbron, Dr Fatima Hoosen, Ms Sonia Malczyk and Ms Nophiwe Job (University of Cape Town)
Ms Anna-Marie Müller (DG Murray Trust)
Dr Hilary Goeiman (Western Cape Department of Health)

Funders: Western Cape Department of Health and DG Murray Trust
Team leaders: Judith Jacobus, Bridgette Baatjies
Fieldworkers: Nicolette Gertse, Thanduxolo Hlatshwayo, Nandipha Ma-awu, Anset Mbata, Nazeema Meniers, Abongile Mfaku, Marshant November, Nolusindiso Sonamzi, Gervorne Herbert
All 1 214 participants and their caregivers who were willing to give us some of their time and personal information
Data collection period: 4 June–27 October 2022
The investigators spent countless hours on this study in the hope that the outcomes will make a major contribution to ensuring healthy growth and overall well-being of children in the Western Cape Province and South Africa as a whole.
We dedicate this report to all children in South Africa.
February 2023


Reducing the prevalence of stunting in the province is one of the six main outcomes for the Western Cape Government in line with its Vision-Inspired Priority of Empowering People. It is a key measure of success in achieving childhood well-being. Without adequate nutrition, children cannot be healthy or learn properly, and without learning, our society and economy cannot grow. For this reason, the Western Cape Government: Health and Wellness (WCG: H&W) partnered with the DG Murray Trust (DGMT) and the University of Cape Town (UCT) to conduct a stunting baseline survey in the province as part of its commitment to a data-led and evidence-informed learning culture. If we are to track progress, we need good information.
WCG: H&W supports the full institutionalisation of the multi-sectoral Nurturing Care Framework in order for all children to thrive and reach their full potential. The nurturing care framework outlines five key components that are interrelated and indivisible: good health, adequate nutrition, safety and security, responsive caregiving and opportunities for early learning. Nurturing care refers to a stable environment created by parents and other caregivers which ensures good health and nutrition for children, protects them from threats and gives them opportunities for early learning through responsive, supportive interactions. All these components are important and need to be provided in alignment with each other in order for children to be nurtured in early childhood.
The fieldwork and report-writing for this survey were completed during the 2022/23 financial year. The good news is that since previous surveys, the prevalence of stunting appears to have decreased. However, it is still far too high. The findings also highlight the need for key interventions to address both stunting and obesity simultaneously while optimising the use of limited resources to improve the well-being of individuals and communities.
The Western Cape Government ultimately aims to reduce stunting rates as part of its well-being recovery plan. The representative data derived from this survey helps us understand the drivers of stunting and allows us to plan and strengthen appropriate interventions across the whole government and society, and to inform local targeted interventions.
Practical steps that can be taken include: advocating for public policy reforms (e.g. accurate and easy-to-understand food labelling; stronger controls on the marketing of unhealthy foods, etc.); incentivising the provision of affordable healthy food through viable food supply systems; supporting vulnerable families with food choices; and monitoring child growth specifically supporting children under two years of age whose growth is faltering. The collection, analysis and use of good-quality data and evidence should guide future action and track progress.
WCG: H&W has invested in a range of interventions across the Department as part of the First Thousand Days (FTD) Initiative since 2016, in collaboration with a wide range of partners, including NPOs, CBOs, academic units and other government departments.

This project is an example of what can be done through partnership, and lays the basis for an accelerated joint response to improving the nutrition, health and well-being of the children of the Western Cape.
Dr Keith Cloete Head of the Department of Health and Wellness, Western Cape Dr David Harrison Chief Executive Officer, DG Murray Trust

It is generally acknowledged that stunting is the best indicator of a child’s well-being and that a child’s linear growth potential is largely determined by the time they turn 2 years old. Many countries in subSaharan Africa, including South Africa, also have a high prevalence of overweight and obesity in children, amounting to a double burden of malnutrition. Stunting is associated with many disorders including reduced neurodevelopment, lifelong cognitive deficits, educational and employment challenges, increased risk of obesity and non-communicable diseases (NCDs) in adulthood, and cycles of intergenerational poverty.
In an attempt to address the burden of malnutrition in the Western Cape, the Western Cape Department of Health (WCDoH) and DG Murray Trust (DGMT) in collaboration with investigators from the University of Cape Town (UCT) and Stellenbosch University (SU), conducted a survey to compile a comprehensive anthropometric malnutrition profile (stunting, underweight, thinness, overweight and obesity) in a representative sample of infants and children under 5 years of age in the province. The secondary aims were to investigate potential causes of malnutrition in the Western Cape, including direct causes (dietary intake and disease) and underlying causes (food security, caring capacity of caregivers and environmental hygiene), as well as to assess indicators of early childhood development (ECD).
The sampling frame for this survey includes three EA (enumerator Wealth


The key conclusion of the Western Cape Stunting Baseline Survey (WCSBS) is that a double burden of malnutrition, stunting and overweight/obesity, remains a concern in the province. The prevalence of stunting in the WCSBS (17.5%) was close to the upper cut-off of the medium public-health-concern category of 10–19% for 0–59-month-old children. Stunting in the very vulnerable <2-year-old age group was 19.7%, pushing it into the high public-healthconcern category for this age group. The prevalence of underweight (5.6%) was just above the lower cutoff of the medium (5–9%) and wasting (3.4%) in the low (2.5–<5%) public-health-concern categories for 0–59-month-old children. The prevalence of overweight (15.1%) fell in the very high public-healthconcern category of ≥15%. Stunting-overweight was not common at 2.4%.
The WHO/UNICEF’s (2021) goal is to reduce stunting prevalence in under 5-year-olds by 50% by 2030 (WHO/UNICEF, 2021). The 2022 prevalence of stunting in under 5-year-olds in the Western Cape of 17.5% (WCSBS) is considerably lower than the national prevalence of 27.4% reported in the 2016 SADHS, and is also 5.4% lower than the 22.9% reported for under-five year-olds in the Western Cape in the 2016 SADHS (NDoH, 2018). Moreover, the 2022 prevalence of stunting in the 1 to under 5-year-old children in the WCSBS was 18.2% compared to the 20.8% found in the Western Cape arm of the 2018 Provincial Dietary Intake Survey (PDIS) in the same age group, also reflecting a declining trend in the province. To date, only the 2016 SADHS reported on stunting in children under 6-months-old, where it was found that 32.3% was stunted (NDoH et al., 2018). In the WCSBS the prevalence was 25.2%, thus 7.1% lower than the 2016 national prevalence. Stunting levels in the Western Cape therefore seem to be much lower than in the rest of the country, and further reflect a decreasing trend over the past six years, despite the outbreak of COVID-19 in 2020. This could indicate that the various interventions that have been put in place by the Western Cape Government, civil society organisations and others to address stunting seem to be making a difference. With a 5.4% reduction in stunting over a six-year period (2016 SADHS to 2022 WCSBS), it could be feasible to reduce the stunting prevalence
in the Western Cape by another 7.2% or more from 2022 to 2030, reaching a prevalence of 10.3% or less. o achieve this outcome, current interventions need to continue, and any essential additional initiatives that are identified from deliberations of the WCSBS results by all stakeholders, should be implemented. This could reduce the prevalence of stunting to the low public health level of concern category (prevalence =2.5% -<10%).
The value the WCSBS adds is not only a profile of stunting in under-5-year-old children, but also current drivers of the condition. These include:
› A Wealth Index score in the lowest tertile in the total group of 6-month–<5-year-olds [Odds Ratio (OR) (95% Confidence Interval (CI)) 1.74(1.13–2.67)].
The Wealth Index comprised a score that reflects 10 indicators covering household possessions, dwelling type, main energy source for cooking, Internet access and number of rooms in the dwelling. Initiatives to address poverty in the Western Cape should thus continue to reduce stunting prevalence.
› A Care Index score in the lowest tertile in the total group of 6-month–<5-year-olds [OR(CI) 1.58(1.06–2.35)], and specifically in the vulnerable 6-month–<2-year-olds [OR(CI) 2.08(1.05–4.14)].
This novel Care Index comprised a score that reflects maternal marital status, educational level, current employment, employment status and age when the child was born; paternal educational level and current employment; child attendance of an early childhood care and education (ECCE) programme and availability of children’s books in the household. Importantly, each of the retained variables contributed to the score, and should be addressed in stunting-prevention initiatives.
› A WASH Index score in the lowest tertile in the 2–<3-year-olds [OR(CI) 2.54(1.21–5.34)]. This novel WASH Index score reflects water availability, sanitation and hygiene indicators in the dwelling, inclusive of piped water inside the dwelling, piped water in the yard, handwashing facility available in the dwelling, handwashing facility available in the yard, soap/detergent available for handwashing, water available for handwashing, flush toilet, toilet inside dwelling, toilet shared, bucket toilet, house with clean floor, child with clean clothes, and main source of water from a neighbour’s/public tap. This particular risk may be more prominent in the UI EA-type.
› Smoking, alcohol use and drug use by mothers during pregnancy in the total sample of 6-month–<5-year-olds as reflected in the respective ORs [smoking OR(CI) 1.60(1.07–2.14); alcohol use OR(CI) 1.79(1.19–2.69); drug use OR(CI) 1.59(1.05–2.40)]. This also reflects a specific long-term risk beyond the first 1 000-day window of these risky lifestyle behaviours. These behaviours need urgent attention to reduce the risk of stunting in the Western Cape.
› Low birthweight in the total group of 6-month–<5year-olds [OR(CI) 2.47(1.65–3.71)]. Predictors of low birthweight were a gestational age of <37 weeks [OR(CI) 3.81(2.42–5.960], smoking during pregnancy [OR(CI) 1.73(1.14–2.65)], having a low income [OR(CI) 1.74(1.04–2.91)] and Care Index in the lowest tertile [OR(CI) 3.16(1.34–7.44)].
› Incomplete immunisation in the total group of 6-month–<5-year-olds [OR(CI) 1.89(1.19–2.99)]. Predictors of an incomplete immunisation status were: caregivers ran out of money for food [OR(CI) 1.96(1.25–3.08)], a child went hungry in the past week [OR(CI) 2.05(1.15–3.52)], a child who was never breastfed [OR(CI) 2.6(1.33–5.12)] and living in an UI EA-type [OR(CI) 2.17(1.26–3.73)].
› Living in the RT EA-type in the total groups of 6-month–<5-year-olds [OR(CI) 1.73(1.04–2.87)].
The latter two results may indicate that interventions targeting children living in RT and UI EA-types may need specific attention when considering the way forward with intervention strategies.
No dietary variables were found to be risks for stunting in the WCSBS. Only 18% were being exclusively breastfed (BF), although most mothers did initiate BF at birth. Key reasons for not ever having BF the child were that the mother did not have enough milk, that the baby did not want to take breastmilk and, concerningly, that the mother was advised not to BF by a health worker. There were no predictors for “not having ever BF a child”.
Dietary quality results show that the dietary diversity of 1 in 2 of the total group of 6-month–<5-year-olds is poor, that 1 in 4 may not be consuming sufficient egg and/or a flesh food, 1 in 5 may not be consuming sufficient fruits/vegetables, and 7 in 10 may not be consuming sufficient milk products to meet calcium needs. Furthermore, 4 in 5 of 6-month–<5-year-old
children consumed sweet food items, 3 in 5 consumed salty/fatty food items and 1 in 2 consumed a sugarsweetened beverage in the 24 hours preceding their interview. Predictors of poor dietary diversity in 6-month–<5-year-olds included a Wealth Index in the lowest tertile [OR(CI) 2.23(1.59–3.12)], and a child that had been hungry in the past week [OR(CI) 1.86 (1.06–3.27)].
Although the key focus of the WCSBS was on stunting, the WHO/UNICEF’s (2021b) goal is also to reduce the prevalence of overweight/obesity in children to less than 3% by 2030 (WHO/UNICEF, 2021b). With the prevalence of overweight in the WCSBS sample in the very high public-health-concern category of ≥15%, it should not be ignored, especially as interventions focused on reducing stunting prevalence may inadvertently promote obesity risk in this target population (Tzioumis et al., 2016).
Current drivers of overweight/obesity identified using multiple logistic regression analyses in the study sample include:
› An overweight/obese caregiver [OR(CI) 1.88(1.21–2.91)], specifically also in the 2–<3-year-olds [OR(CI) 2.21(1.31–3.71)]. Caregivers were the mother (71%), grandmother, father or another family member, and more than 50% were overweight or obese. The publication of the updated edition of the 2015–2020 Strategy for the Prevention and Control of Obesity in South Africa is a matter of urgency, as the target of reducing obesity by 10% by 2020 has clearly not been achieved, which, in turn, also impacts negatively on the prevention and control of obesity in children.
› Not ever BF in 6-month–<2-year-olds [OR(CI) 2.95(1.36–6.40)], reflecting the importance of initiatives to promote initiation of BF, excusive BF up to 6 months old and continued BF with the addition of healthy and age-appropriate complementary foods.
› Having consumed sugar in tea/coffee or on porridge in 6-month–<2-year-olds [OR(CI) 2.21(1.23–3.95)]. The fact that this risk factor remained as an independent risk in the multivariate regression model emphasises the gravity of this situation; sugar was given regularly to young children in the WCSBS, and it predicted overweight/obesity in under-2-year-olds.


STRENGTHS of this study include the rigorous sampling structure and execution thereof, resulting in a sample of under-5-year-old children that is representative of this target population. Results in terms of the malnutrition profile and drivers thereof that were identified using multivariate regression models are thus robust and a good baseline for monitoring changes in the malnutrition profile of children in the Western Cape, while also providing good insights in current predictors of both stunting and overweight/obesity that can advise critical assessment of current interventions and the need for, and nature of, additional measures that need to be put in place. A further strength is the richness of the data collected to enable us to reflect on the drivers of malnutrition along the pathways of the UNICEF Framework for malnutrition. For these purposes we also developed indices to investigate the three underlying causes of malnutrition in children, namely a Wealth Index (assets and wealth status) and two novel indices, one that reflects mother and childcare/ caregiving capacity (Care Index) and the other that reflects water availability, sanitation and hygiene in the household (WASH Index). The majority of questions included in the research questionnaire were from internationally standardised instruments for the target age group, which were adapted for use in South Africa as recommended, e.g. the WHO/UNICEF infant and young child feeding questionnaire, as well as the 2022 Census questionnaire.
LIMITATIONS of the study include that two important childhood health intervention indicators, namely whether the vitamin A supplementation was on track and receival of deworming medications were up to date, were not assessed. Finally, as is the challenge in surveys that are dependent on self-reported information, a level of respondent bias may have been present. However, we attempted to minimise this limitation with rigorous training of fieldworkers and quality control measures.


Numerous interventions to prevent and control malnutrition in under-5-year-old children in the Western Cape are presently in place, and, as indicated in the conclusion section, may have resulted in reducing the prevalence of stunting, but not necessarily overweight/obesity.
The two key recommendations for taking this work forward are:

Build a current map of all initiatives/ interventions – whether governmental, civil society organisations, universities and research organisations such as the HSRC and SAMRC – that aim to improve the nutritional status, ECD and general well-being of under-5-year-old children, and capture the goals, strategies, ground-level actions, outcomes and lessons learnt for each of the initiatives.
Conduct a series of workshops with multisectoral stakeholders to consider the outcomes and recommendations of this research within the context of the current intervention map to plan the way forward to address the malnutrition risks for under-5-year-old children identified in the WCSBS.


TABLE 1
Number of households for different levels of power
TABLE 2
Example of selecting EAs in a stratum using PPS
TABLE 3
WHO growth standards for children 0 to <72 months (Cashin & Oot, 2018) TABLE 4
Summary of sections and question focus in the WCSBS questionnaire
underweight and wasting prevalence in under-5-year-old children in the Western Cape
8
Wealth, Care and WASH Index tertile distributions for under-5-year-old children in the Western Cape by EA-type
TABLE 9
Predictors of low birthweight (<2 500g) in 6-month–<5-year-old children in the Western Cape in various age groupings
TABLE 10 52
Predictors of incomplete immunisation in 6-month–<5-year-old children in the Western Cape in various age groupings
TABLE 11 56
Mean (95% CI) and median (95% CI) WHO/UNICEF DDS and prevalence of a low DDS for 6-month–<5-year-old children in the Western Cape
TABLE 12 57
Predictors of poor dietary diversity (consume <4 out of a possible 8 groups) in 6-month–<5-year-old children in the Western Cape in various age groupings
TABLE 13 62
Drivers of stunting (HAZ<–2SD) in 6-month–<5-year-old children in the Western Cape in various age groupings
TABLE 14 63
Drivers of overweight/obesity (BAZ>2SD) in 6-month–<5-year-old children in the Western Cape in various age groupings
FIGURE 1 19
Conceptual Framework for all children surviving and thriving, adapted from the 1990 UNICEF Framework for the drivers of malnutrition and death (from Black et al., 2020)
FIGURE 2
Example of maps of an EA in each of the three EA-types for use by fieldworkers
FIGURE 3
Example of a food card depicting carrots and the various preparations
FIGURE 4
Stunting prevalence (HAZ) in under-5-year-old children in the Western Cape (N=1 202)
FIGURE 5
Underweight prevalence (WAZ) in under-5-year-old children in the Western Cape (N=1 209)
FIGURE 6
Wasting prevalence (BAZ) in under-5-year-old children in the Western Cape (N=1 199)
FIGURE 7
Prevalence of a MUAC in the risk range in under-5-year-old children in the Western Cape (N=1 162)
FIGURE 8 43

Prevalence of risk of overweight (BAZ>1, ≤2SD), overweight (BAZ>2, ≤3SD) and obesity (BAS>3SD) in under-5-year-old children in the Western Cape (N=1 199)
FIGURE 9 46
Summary of results for the three food security questions in households of under-5-year-old children in the Western Cape by EA-type (UF=urban formal, UI=urban informal, RT=rural town)
FIGURE 10 47
Number of days someone in the household and any child was hungry in the past week in households of under-5-year-old children in the Western Cape by EA-type (N=1 214)
FIGURE 11
Prevalence of “ever breastfed and currently breastfeeding” in 6-month–<5-year-old children in the Western Cape (N=1 145)
FIGURE 12
Fluids given to non-exclusively breastfed infants younger than 6 months old in the Western Cape
FIGURE 13
Solid foods given to non-exclusively breastfed infants younger than 6 months old in the Western Cape
FIGURE 14
Prevalence of DDS <4 in 6-month–<5-year-old children in the Western Cape (N=1 145)
FIGURE 15
WHO/UNICEF indicators for healthy and unhealthy dietary food choices other than DDS in 6-month–<5-year-old children in the Western Cape (N=1 145)
FIGURE 16
Dietary patterns for under-5-year-old children in the Western Cape (N=1 145)
54
55
55
57
58
59
FIGURE 17 60
Top ten most frequently consumed items in 6-month–<5-year-old children in the Western Cape (N=1 145)
ACC/SCN UN Administrative Committee on Coordination, Subcommittee on Nutrition
BAZ BMI-for-age Z-score
BF breastfeeding/breastfed
BMI body mass index
CES-D-10 10-item Centre for the Epidemiological Studies of Depression Short Form
CI confidence interval
Covid coronavirus disease
CPF community police forum
DDS dietary diversity score
DGMT DG Murray Trust
EA enumerator area
ECCE early childhood care and education
ECD early childhood development
ELP Early Learning Programme
HAZ height-for-age Z-score
HH household
HSRC Human Sciences Research Council
LMIC low-income and middle-income countries
MAM moderate acute malnutrition
MC multiple comparison
MICS Multiple Indicator Cluster Surveys
MUAC mid-upper arm circumference
NCD non-communicable diseases
NDoH National Department of Health
NFCS National Food Consumption Survey
NGO non-governmental organisation
NIDS National Income Dynamics Study
NIDS–CRAM National Income Dynamics Study –Coronavirus Rapid Mobile Survey
NPO non-profit organisation
OR odds ratio
PDIS Provincial Anthropometric and Dietary Intake Survey
PI principal investigator
PPS probability proportional to size
RT rural town
RtHB Road-to-health booklet
SADHS South African Demographic and Health Survey
SA-IYCFQ South African Infant and Young Child Feeding Questionnaire
SAM severe acute malnutrition
SAMRC South African Medical Research Council
SD standard deviation
SSB sugar-sweetened beverage
SU Stellenbosch University
UCT University of Cape Town
UF urban formal
UI urban informal
UNICEF United Nations International Children's Emergency Fund
USAID United States Agency for International Development
VIF variance inflation factor
WASH water availability, sanitation and hygiene
WAZ weight-for-age Z-score
WC Western Cape
WCDoH Western Cape Department of Health
WCSBS Western Cape Stunting Baseline Survey
WHO World Health Organization
WHZ weight-for-height Z-score
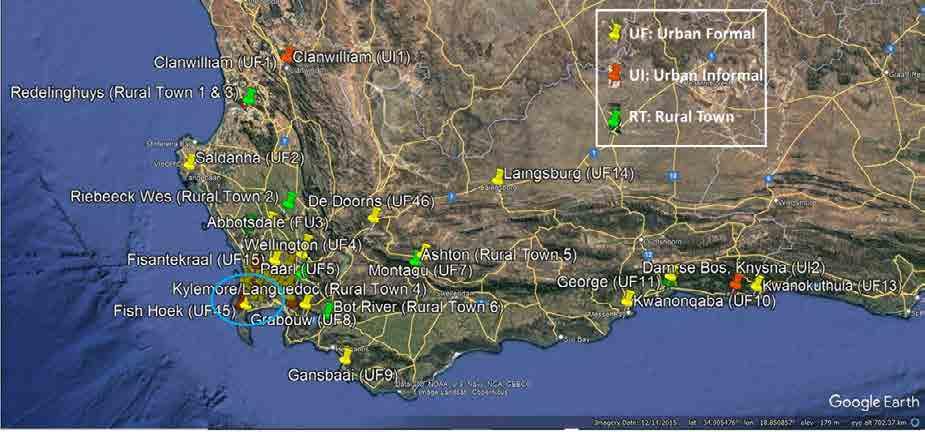

 Map showing the location of the selected EAs in the Western Cape.


Children are the essence of a healthy sustainable society and hence safeguarding the health of every child is imperative (Black et al., 2021). The Food and Nutrition Technical Assistance III Project (Cashin & Oot, 2018) states: “Good nutrition, adequate health care, and a nurturing environment all contribute to children reaching their full growth and development potential. This is especially important during the 1 000 days from the beginning of the mother’s pregnancy to the child’s second birthday, when children are growing and developing most rapidly. To support this growth, young children have relatively high nutritional needs and are more vulnerable to malnutrition and its consequences than other age groups.”
It is generally acknowledged that stunting (height-forage Z-score <–2SD) is the best indicator of a child’s wellbeing (de Onis & Branca, 2016). Children’s linear growth potential is largely determined by the time they turn 2 years old (Tzioumis et al., 2016), and it is a period of rapid brain development when they build foundational skills that define their health and well-being throughout life (Black et al., 2020). Stunting is associated with many disorders, including reduced neurodevelopment (Mendez et al., 1999), lifelong cognitive deficits, educational and employment challenges, increased risk of obesity and non-communicable diseases (NCD) in adulthood, and cycles of intergenerational poverty (Victora et al., 2008; Black et al., 2020). According to Victora et al. (2021) evidence shows that stunting and wasting might already be present at birth, and that the incidence of both conditions peaks in the first 6 months of life.
Victora et al. (2021) writes in the most recent Lancet series on maternal and child undernutrition (progress 1) that, 13 years after the first Lancet series on this topic, a review of progress achieved based on global estimates and new analyses of 50 low-income and middle-income countries (LMIC), shows that the prevalence of childhood stunting has decreased. This decrease was substantial in middle-income countries, but less so in low-income countries. Within the South African context tracking of national surveys from 1994 to 2016 shows that the prevalence of childhood stunting does not seem to have declined nationally (Senekal et al., 2019), but these researchers showed that there may have been a downturn in the curve in the Western Cape and Gauteng provinces between 2016 and 2018 (ibid.).
The drivers of stunting are not limited to an absolute lack of food alone (hunger) but perpetuated by nutrition-specific factors including non-exclusive or no breastfeeding, poor complementary feeding practices, and lack of dietary diversity. Nutritionsensitive factors such as poor pre- and post-natal maternal care, ante- and post-natal maternal mental/ physical health problems and substance abuse, poor childcaring capacity, limited household purchasing power, poor household hygiene, sanitation, and related disease conditions (gastrointestinal infections and/or worms) also contribute (UNICEF, 1990; Said-Mohamed et al., 2015; Hall et al., 2017; Black et al., 2020). The original UNICEF Framework for malnutrition was adapted by Black et al. (2020) to reflect these nuances (Figure 1).
Safe and nutritious food
CHILDREN SURVIVING AND THRIVING
Outcome
Responsive care
Learning opportunities
Health care
Families, communities, services, and politics
Safety and security
Proximal components
Enabling environments
Politics, ideology, economics, and climate
Distal factors

The National Income Dynamics Study (NIDS) reported that 18% of households in South Africa experienced hunger in 2020 and child hunger was prevalent at 16% (Bridgman et al., 2020). Statistics South Africa (2019) indicated that about 1.6 million households experienced hunger in 2017, with more than 60% of these households being in urban areas. These results indicate that many South Africans are not food secure, even though food balance sheets indicate that nationally South Africa is food secure (Statistics SA, 2019). Food-insecure children may have limited access to adequate food because of poverty, amongst other drivers) and this may result in an inadequate and poorquality food intake (Kaur et al., 2015).
The caring capacity of mothers (or alternative primary caregivers), which impacts on most elements that are key to normal growth and development in children, depends on proximate determinants that involve choices they make and the opportunities they have to act on these choices. Factors that influence choices and actionability thereof include mothers’ educational level and relevant knowledge, as well as the physical and social support they receive during pregnancy, childbirth and postpartum. Ultimately, familial factors, medical/healthcare availability, cultural attitudes and norms, demographic and economic conditions and resources, commercial pressures, and national and international policies and norms, moderate the mentioned factors and thus maternal care of infants and young children (ACC/SCN, 2000).
The water availability, sanitation, and hygiene (WASH) profile of households (HHs) where children develop and grow is highly related to their nutritional status. Poor (WASH) conditions have been proposed as one of the main causes of child stunting (Dominguez, 2017). Direct and indirect pathways exist between WASH and stunting. They include diarrheal diseases, environmental enteric dysfunction, socio-economic conditions and time constraints to childcare practices (ibid.). Classic reflections from the 1970s on malnutrition and infection by Mata (1979) still resonate today: “The home (microenvironment) plays a role in the development of malnutrition and infection. Crowded homes with dirty floors, thatched roofs and cracked walls favour transmission of respiratory and enteric
agents, and proliferation of arthropods and rodents. Deficient sanitation is the most important feature of poor housing. Lack of a safe piped-water supply, inadequate disposal of faeces and garbage, inadequate preparation and storage of food, the presence of animals in the home, and deficient personal hygiene, result in large doses of pathogenic agents on hands, and in food and water. Such environments also may deprive the child of psychological and social stimuli beneficial to nutrition and growth.” It is unacceptable that more than forty years later, poor WASH conditions and undernutrition are not close to being eradicated.
In a paper in the 2021 Lancet Series on maternal and child undernutrition (progress 2), Heidkamp et al. (2021) remark: “As the world counts down to the 2025 World Health Assembly nutrition targets and the 2030 Sustainable Development Goals, millions of women, children, and adolescents worldwide remain undernourished (underweight, stunted, and deficient in micronutrients), despite evidence on effective interventions and increasing political commitment to, and financial investment in, nutrition. The Covid-19 pandemic has crippled health systems, exacerbated household food insecurity, and reversed economic growth, which together could set back improvements in undernutrition across LMICs.” In their conclusion they state that: “Our growing evidence base affirms that multi-sector strategies that reach populations during the first 1000 days of life are effective in reducing undernutrition and, with adequate resourcing, can be implemented at large scale. Progress in scaling interventions has been too slow, as evidenced in the health system by low coverage and the failure to introduce several proven interventions. There is no one-size-fits-all strategy for addressing undernutrition. Rather, depending on each nation’s gaps and priorities, countries must decide which direct and indirect actions to scale within and across sectors and how to address specific implementation and utilisation challenges. In all cases, countries need strong nutrition information and accountability systems, coupled with implementation research and programme evaluation. Effective cross-sectoral approaches require the presence of other enabling factors and processes including proactive political leadership, and adequate budgets and financing.”
Any nutrition intervention rolled out to alleviate the burden of undernutrition should be sensitive to the growing problem of obesity, as intervention needs may differ. For example, Tzioumis et al. (2016) caution that interventions which target only stunting, especially those that promote “catch-up” growth, may unintentionally contribute to overweight/obesity risk. Many countries in sub-Saharan Africa, including South Africa, face a high prevalence of overweight and obesity in children, amounting to a double burden of malnutrition in children. Rapid weight gain in infancy is associated with increased risk of adult weight gain and development of NCDs (de Onis et al., 2016; Singhal, 2017). Limited research has examined the association between obesity and child development. According to Black et al. (2020) research in LMICs has shown that children with obesity may have poorer social and emotional behaviour, cognition and language skills, may have lower fine and gross motor skills and fare poorer academically than their normal weight peers. Obesity may influence cognition through altered brain structure and inflammation, as well as through the motor skeletal system, in association with lower motor performance (Wang et al., 2016).

To conclude, for a child to survive and thrive, it should receive safe and nutritious food, responsive care, quality health care, be provided with learning opportunities and be kept safe and secure (Black et al. 2020). In an attempt to address the burden of stunting in the WC, the Western Cape Department of Health (WCDoH) and DG Murray Trust (DGMT), in collaboration with primary investigators from the University of Cape Town and Stellenbosch University, set out to conduct a survey to compile a malnutrition profile and drivers thereof in under-5-year-old children. The Western Cape Stunting Baseline Survey (WCSBS) was conducted to inform the WCDoH on growth problems experienced by infants and young children and drivers thereof. This research serves to inform provincial-level strategic planning to address malnutrition in infants and young children in the province. The survey also serves as a baseline for tracking progress towards the WHO/UNICEF goal of reducing stunting in under-5-year-olds by 50% by 2030 and reducing overweight/obesity in children to less than 3% by 2030 (WHO/UNICEF, 2021b).


The primary aim of this research was to establish a baseline profile of malnutrition (stunting, underweight, thinness/wasting, overweight and obesity) in a representative sample of infants and children under 5 years old in the Western Cape. Secondary aims were to investigate drivers of childhood malnutrition in the province, including direct drivers (dietary intake and disease) and underlying drivers (HH economic profile and food security), mother and childcare/caregiving capacity and WASH indicators.

Malnutrition profile in under-5-year-olds in the Western Cape
› To measure the height, weight and mid-upper arm circumference (MUAC) to determine the prevalence of the following forms of malnutrition in the target population:
› Stunting, underweight, thinness (wasting) and severe acute malnutrition
› Risk for underweight, overweight and obesity.

Indicators reflecting direct drivers of malnutrition in under-5-year-olds in the Western Cape
› To assess breastfeeding indicators.
› To assess complementary feeding practices.
› To assess dietary diversity, unhealthy food choices and identify most commonly consumed foods.
› To assess disease indicators and vaccination status.
Indicators reflecting underlying drivers of malnutrition in under-5-year-olds in the Western Cape
› To assess household demographics, as well as socio-economic and food security indicators.
› To assess perinatal care of the mother.
› To assess the primary caregiver’s caring capacity and practices.
› To assess WASH-related indicators.

Early development in under-5-year-olds in the Western Cape
› To assess age-specific early childhood development (ECD) indicators.
Drivers of malnutrition in under-5-year-olds in the Western Cape
› To identify direct and underlying drivers of stunting and overweight/obesity in under-5-year-old children in the Western Cape.


The target population for this research was under-5-year-old infants and young children living in the Western Cape. The sampling frame included three EA-type domains: (1) urban formal (UF) areas (formal cities and towns characterised by higher population densities, high levels of economic activity and high levels of infrastructure), (2) urban informal areas (UI) (unplanned settlements on land that has not been surveyed or proclaimed as residential, and consists mainly of informal dwellings, also referred to as “shacks”) (Statistics SA, 2012; Statistics SA, 2019) and (3) rural towns (RT) (a small town that was surrounded by farmland). The initial definition of rural areas was in line with the Statistics SA (2012) definition of areas that are sparsely populated in which people farm or are dependent on natural resources, including smallholdings, dispersed villages and small towns. However, after fieldwork commenced it became evident in the case of rural areas that HHs were very scarce in large farmlands, to which access was severely hindered by security measures farmers had put in place. After long distances had been travelled with no success, coverage of this EA-type was obtained by targeting a small RT to replace each rural EA that formed part of the sample. These towns were within a maximum of 16 km radius of the original rural EA and were surrounded by farmland.
urban formal
urban informal rural towns
Additionally, each domain was subdivided into three strata according to age: infants under 6 months old, children 6–<24 months old (2 years) and children 2–<5 years old.
The sample size calculation was done using the Multiple Indicator Cluster Surveys (MICS) sample calculator template for multiple domains, as indicted below (MICS UNICEF.org).
wheren is the required sample size, or in this case the number of households; using stunting as key indicator, this value is calculated as 397;
4 is a factor to achieve 95% level of confidence;
r is the anticipated prevalence of stunting, taken as 0.261;
ƒ is the design effect, estimated as 1.222;

E is the relative sampling error of r, therefore Er = (0.3)(0.26) = 0.078 is the margin of error to be tolerated at the 95% level of confidence;
p is the proportion of the total population upon which r is calculated, P = 0.12;
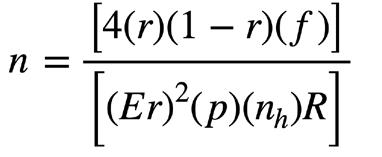
nh is the average household size in the Western Cape, calculated as 3.33; and
R is the anticipated response rate, estimated as 0.98.
1 Derived from prevalence reported in SADHS 2003 (Dhansay et al., 2018), SADHS 2016 (NDoH et al., 2018) and PDIS (Senekal et al., 2019)
2 Derived from the PDIS (Senekal et al., 2019)
3 Calculated using Census 2011: Interactive data in SuperCROSS, Statistics SA (2012), for urban formal, urban informal and rural areas in the Western Cape
The estimated sample size per stratum was determined to be n=398, or approximately 400 households. Therefore, the total number of households proposed for this survey was 400 x 3 age strata = 1 200. HH distribution was expected to vary by region in the sampling frame. For national-level indicators proportional distribution of surveys (children) by region would provide the best precision. However, small rural and urban informal regions would be allocated a sample size that would be too small to achieve the
degree of precision desired for regional or domainlevel estimates. To ensure acceptable estimates across regions, experience shows that a minimum of 150 interviews per stratum (at least 50 per age domain) are needed so that reliable estimations for most of the indicators can be obtained. The final sample allocation reflects a power allocation between the proportional allocation and the equal size allocation, which was a trade-off between the national-level precision and the domain-level precision.
An alpha power allocation with an appropriate power value a (0 ≤ a ≤ 1) was used to guarantee sufficient sample size in small domains/strata. The following formula was used to calculate the sample sizes per stratum for different power levels (USAID, 2012).
nh is the resulting number of households in the stratum h;

n is the total number of households;
Mh is the proportional sample size of stratum h, when the alpha power is equal to 1;
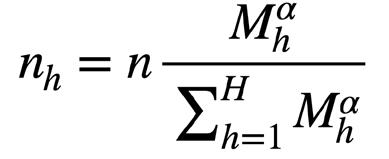
H is the total number of strata; and
a is the power value.
An alpha power of 0.75 was used to achieve the goal of a minimum of 150 households (HHs) per stratum (Table 1). The number of HHs was then divided by 20 and rounded up to the next integer to obtain the
number of enumerator areas (EAs). This ensured that each stratum had at least 150 HHs. Table 1 reflects the sample sizes in terms of number of households and number of EAs for different precision levels.
Table 1
Number of households for different levels of power
At the first stage of the two-stage cluster sampling process, the EAs were selected with probability proportional to size (PPS) in each stratum. The steps suggested by the United States Agency for International Development (USAID, 2012) for selection of EAs were followed:
1 For a given stratum all EAs with their number of HHs were listed.
2 The total number of HHs in that stratum were then calculated.
3 With n set as the number of EAs to be selected from a total of N EAs, the sampling interval I, i.e. the total number of households in all EAs divided by n, was computed.
4 A random number R between 0 and 1 was generated, and R*I, R*I+I, R*I+2*I, …, R*I+(n–1)*I was computed.
5 For each sampling number R*I+(j–1)*I, the jth sampled EA was considered the target EA if the cumulative size was the first cumulative size bigger than the sampling number R*I + (j–1)*I
The following example illustrates this process:
1 Let N=20 EAs, n=5 EAs and the total number of HHs in all the EAs is 4 004.
2 The sampling interval I = 4 004/5 = 801.
3 Let the random number (0.381 was chosen) multiplied by 801 (R*I) be 305.
4 The sampling numbers and the first two selected units are shown in Table 2.
5 Continue until the (in this example) 5 EAs have been selected.
Based on our experience from the 1999 National Food Consumption Survey (NFCS) and the 2018 Provincial Dietary Intake Survey (PDIS), we knew that some of the selected EAs would be from informal or unstructured settlements with no clear demarcation of HHs. To ensure coverage within each of these EAs, segmentation was done. For these purposes, relevant EAs were segmented into multiple segments of about 50 households each and one segment was randomly selected for the survey, after which 20 eligible households were selected randomly. A cluster therefore was either an EA or a segment of an EA. As mentioned, in the case of rural EAs a small town that was surrounded by farmland and was within a 16 km radius of a particular rural EA was surveyed. Qualifying HHs in both formal and informal HHs in the town were targeted.
After the EAs were selected, maps of each of the relevant EAs (see example in Figure 2) were generated and passed on to the respective fieldwork teams for selection of HHs.
The following process was followed for the selection of HHs in each EA:
1 Assuming that there were 400 HHs in a selected EA and, as indicated above, the number of HHs to be surveyed was 20, the team used the map to identify a route to be followed (planned route) though the EA to systematically cover all 400 HHs.


2 Subsequently one HH in the EA was randomly selected as a starting point.
3 The first 20 HHs (400/20=20) on the planned route to be followed from the starting-point HH was then identified on the EA map, and one of these 20 HHs was then selected at random for inclusion in the study. This HH was marked with a circle on the map.

4 The team repeated this process along the planned route, identifying every 20th HH and marking it with a circle on the EA map. By the time all 400 HHs in the EA were covered, there were 20 circled HHs marked on the map.


5 On the first day of data collection in the EA the first HH was visited.
One child was selected per HH. If there was more than one child present in the prescribed age interval in a HH, then all children in the HH were numbered in age order for random selection of one child using a “Random Number Table” designed for these purposes.
Inclusion criteria for HHs were (1) a family having lived in the EA-type for 6 months or longer; (2) child/ children under 5 years old, male or female, present in the HH; (3) a parent/legal guardian/primary caregiver to provide informed, written consent; and (4) a mother/primary caregiver to assist with completion of the research questionnaire. A household was excluded if any one or more of the inhabitants were Covid-19 positive. Exclusion criteria were a child whose mother/caregiver was under 18 years old, a child who did not consume any food or energy-giving drinks over the past 24 hours because he/she was sick, and a child who stayed elsewhere for the 24 hours preceding the fieldworker visit to the HH. Fieldwork teams were extensively trained on the selection of HHs in EAs, as well as selection of a child in the HH.

If access to households in a particular EA was restricted because of people not being at home/not answering the door, safety concerns, heavy security around properties, security measures in gated communities and families living in blocks of flats with communal security gates and measures in place, the following additional recruitment measures were implemented:
1 The study coordinator contacted the owner of activity groups for young children (e.g. Toptots, gym classes, dance schools, swim schools) for permission to distribute an invitation to mothers (or alternative caregivers) to participate in the research. Appointments were then made with the mother (or alternative caregiver).
2 The study coordinator approached nongovernment play/pre-schools in target EAs for permission to distribute an invitation to parents to participate in the research or introduce the study at a parent gathering. Appointments were made with mothers (or alternative caregivers).
3 The principal investigator (PI) obtained UCT permission to recruit participants in university accommodation for families.
4 The fieldworkers placed posters and flyers in key stores in and around the selected EA to alert families in these areas that a research team would be recruiting children in the area.
5 The fieldworkers set up a stall at community markets that catered for children and recruited, obtained consent and assessed children on the spot.

All anthropometric measures that involved infants and children were taken in the presence of the mother/ primary caregiver in accordance with standard procedures (Cashin & Oot, 2018) (Supplementary materials S1: Anthropometric measures).
Infants/children up to 12 months old were weighed using a Scalerite Micro Digital Table Baby scale. Older children were weighed standing up on a Scalerite Micro Glass Digital bathroom scale. Recumbent length was taken to the nearest 0.1 cm for children under 2 years of age on a Seca 210 Mobile Measuring Mat for Babies and standing height to the nearest 0.1 cm for 2–<5-year-olds using a Seca 213 Portable Stadiometer (Cashin & Oot, 2018). The MUAC was measured to the nearest 0.1 cm using a non-flexible MUAC tape.
As standing height is approximately 0.7 cm less than recumbent length, which was considered in developing the WHO Growth Standards, length/height measures were adjusted accordingly. If a child under 2 years of age was not willing to lie down, standing height was measured and 0.7 cm added to convert it to length. If a child 2 years of age or older could not stand, recumbent length was measured, and 0.7 cm subtracted to convert it to height (Cashin & Oot, 2018).
Table 3
WHO growth standards for children 0 to <72 months (Cashin & Oot, 2018)
The WHO (2006) growth standards were used to calculate height-for-age Z-scores (HAZ), weight-forage Z-scores (WAZ), weight-for-height Z-scores (WHZ) and BMI-for-age Z-scores (BAZ). Interpretation of the Z-scores was done using the WHO standards (Cashin & Oot, 2018) (see Table 3).


Interviewee detail Mother or alternative caregiver
Mother: biological, step, adoptive, foster
Mother, father living in HH
Language spoken in HH
Marital status of mother
Head of the HH
Educational level of father and mother and primary caregiver if not a parent
Employment status of father and mother
HH assets
Ownership of livestock
HH and dwelling profile
Vegetable gardening
Internet access
Source of energy for cooking and lights
Characteristics of the dwelling the HH lives in Number of people sleeping in dwelling
Type and number of rooms in dwelling
Experience of stressful events during the past 6 months relating to violence, crime, illness, death, fights/alienation, being arrested (any family member)
Family member with serious physical/mental health condition
Substance abuse by a family member
Main source of drinking water
Main source of water for cooking and handwashing
Sufficiency of drinking water
Main toilet facility and whether shared
Location of toilet facility
Emptying of pit latrine, septic tank or bucket
Water availability, sanitation and hygiene
Location of facility for handwashing
Availability of water and soap at handwashing facility
Handwashing by caregiver
Refuse removal
Disposal of baby/child faeces in nappies
Cleanliness of floors and clothing of child
Use of a dummy
Animals in outside areas where child plays
Care Index
Care Index
Care Index
Care Index
Care Index
Care Index
Wealth Index
Census-Q 2022
NDoH/ MGDT-Q (unpublished)
Census-Q 2022
Wealth Index
Census-Q 2022
NDoH/ MDGT-Q
WASH Index
WASH Index
WASH Index
WASH Index
WASH Index
WASH Index
WASH Index
WASH Index
WASH Index
WASH Index
Adapted from UNICEF/ WHO 2018 for SA using Census-Q 2022
de Villiers et al. (2005)
Child health status
Availability of birth certificate (BC) and Road-to-health booklet (RtHB) – reasons if not available
Age (date of birth), gender, birth order
Gestational age at birth and birthweight
Immunisation status
Disease: upper respiratory tract infections
Disease: diarrhoea and treatment
Care that includes organised learning (all)
Early childhood development
Feeding practices and food intake
Books, picture books, toys in household (all)
Learning/play activities with child in HH (all)
Child development and socialising behaviour (3–<5-year-olds)
Breastfeeding
Complementary feeding
Dietary diversity
Most commonly consumed foods
Methodological detail in Section 3.3.2
Presence of non-communicable and/or communicable disease
Pregnancy history
Current pregnancy: ante-natal care; if not, reasons
Employment at the time of birth of index child
Maternal ante- and post-natal health
SOURCE(S) Table 4 cont.
HH income and hunger
Maternity leave and related income
Smoking, alcohol, and drug use during pregnancy with the index child
Risk of depression
Methodological detail in Section 3.3.3
Physical abuse of mother by husband/partner
All income sources and HH assets
Receipt of specific SA government grants
Estimated total HH income
Food security
PDIS-Q
NDoH/ MDGT-Q
MICS-Q
Care Index
MICS-Q
Never been breastfed and poor diversity entered in regression models as independent variables
Care Index
Care Index
Care Index
Care Index
SA-IYCFQ
NDoH/ MDGT-Q
Care Index
CED-D-10 English version validated in isiXhosa and Afrikaans
NDoH-Q
PDIS-Q
NDoH-Q
Census-Q
2022
NIDS–CRAM Survey instrument
WCSBS=Western Cape Stunting Baseline Survey; NDoH=National Department of Health; Q=Questionnaire; PDIS=Provincial Anthropometric and Dietary Intake Survey; MICS=Multiple Indicator Cluster Surveys; SA-IYCFQ=South African Infant and Young Child Feeding Questionnaire; CED-D-10=Center for the Epidemiological Studies of Depression Short Form; NIDS–CRAM Survey=National Income Dynamics Study –Coronavirus Rapid Mobile Survey, WASH=water availability, sanitation and hygiene
The generic Infant and Young Child Feeding Questionnaire (SA-IYCFQ) was adapted for use in the WCSBS using the recommendations made by WHO/ UNICEF (2021a) for these purposes. The adapted questionnaire was used to assess breastfeeding practices (including reasons for not breastfeeding or cessation of breastfeeding), complementary feeding and dietary quality using WHO/UNICEF feeding indicators. These indicators were formulated for children younger than 2 years old but were also calculated for the older children as relevant:
› Percentage children who were ever breastfed, but are not breastfed anymore (all)
› Exclusive breastfeeding (under 6-month -olds only)
› Mixed-milk (formula/animal milk) feeding (under 6-month -olds only)
› Continued breastfeeding (all)
› Introduction of solid/semi-solid/soft foods from 6 months (6–8-month-olds only)
› Minimum dietary diversity (6-month–<5-year-olds)
› Egg and flesh food consumption (6-month–<5-year-olds)
› Sweetened beverage consumption (all) (includes fruit juice)
› Consumption of sentinel sweet (unhealthy) foods (all)
› Consumption of sentinel salty/fatty (unhealthy) foods (all)
› Zero fruit and vegetable intake (6-month–<5-year-olds).
We added items to the WHO/UNICEF template to determine frequency of intake of oil/fat and sugar added to tea/coffee/porridge. Dietary data was also used to identify the foods most consumed by the children.
The dietary intake assessment method was based on the WHO/UNICEF (2021a) generic questionnaire for assessment of dietary indicators, including the dietary diversity score (DDS), in infants and young children.
The DDS has become a widely used method of determining variety in the diet and, by proxy, nutrient adequacy. “It is a food group diversity indicator that reflects one key dimension of diet quality – micronutrient adequacy – summarised across 11 micronutrients: vitamin A, thiamine, riboflavin, niacin, vitamin B-6, folate, vitamin B-12, vitamin C, calcium, iron, and zinc” (FAO, 2021). A diet lacking in diversity can increase the risk of micronutrient deficiencies, which may have a damaging effect on children’s physical and cognitive development (WHO/UNICEF, 2021a).
Food groups reflected in the dietary intake questionnaire were aligned with the eight groups for infants and young children (WHO/UNICEF, 2021a), as well as the 10 groups for adult women (FAO, 2021), to allow for calculation of the DDS with both the eight and 10 food groups. Cut-offs that signify poor dietary diversity are <4 and <5 respectively (FAO, 2021; WHO/ UNICEF, 2021a).
The food items allocated to food groups in the generic template of the WHO/UNICEF (2021a) were adapted for the WCSBS following the steps they recommend for this process.
1 We first considered the foods included in the 2010 IYCFQ that was adapted by Marjanne Senekal and colleagues for use in a birth cohort in Cape Town and surrounding areas (unpublished).
2 We considered the frequency of intake of all food items consumed by 1–<10-year-old children generated using the PDIS data set (Steyn et al., 2020).
3 We then conducted an expert consultation to allocate mixed dishes, e.g. spaghetti bolognaise, samp and beans, vegetable stews and custard (contains dairy which is healthy, but also sugar which is not healthy), to particular food groups for calculation of the DDS.
A set of 75 food cards depicting food items and their various preparations (as applicable, e.g. boiled cubed carrots, grated raw carrots, carrot puree) were developed and used in the administration of the dietary questionnaire for each food group.


The procedure used to administer the food intake section of the dietary questionnaire was as follows (adapted from WHO/UNICEF, 2021a and FAO, 2021):
1 The fieldworker asked the interviewee to think about the child’s day (activities) over the past 24 hours (from awakening yesterday), and then asked her/him to remember what he/she ate/drank during the day and the night.


2 The fieldworker then gave the interviewee the photocards of the first food group and asked her/ him to sort them according to what the child ate/ drank in the previous 24 hours. If any item on a card was eaten/drunk by the child, the interviewer circled the item on the questionnaire. This process was repeated until all the food groups listed in the questionnaire had been covered.
3 If the child had spent part of the past 24 hours outside the household, fieldworkers contacted the relevant person/caregiver to ascertain what the child ate during his/her time in the school/care facility.
The mental well-being of the mother, or primary caregiver if not the mother, was assessed using the 10-item Centre for the Epidemiological Studies of Depression Short Form (CES-D-10), which is a widely used measure to screen for depression in primary care settings. IsiZulu, isiXhosa and Afrikaans translations of this questionnaire were tested for internal consistency, concurrent, construct and criterion validity of the CES-D-10 among speakers of these languages by Baron et al. (2017). These researchers concluded that the CES-D-10 is a valid, reliable screening tool for depression in isiZulu, isiXhosa and coloured Afrikaansspeaking populations. We obtained the translated versions of the tool from the researchers for use in the WCSBS.
The CES-D-10 includes 10 questions on ways that a respondent may have felt or behaved over the last week. The response options and scoring of the items are as follows: rarely or none of the time (less than 1 day); some or a little of the time (1–2 days); occasionally or a moderate amount of time (3–4 days); and all of the time (5–7 days). Questions 5 and 8 are scored 3, 2, 1, 0, while all other questions are scored 0, 1, 2 and 3. The total score is calculated by adding the score of each of the 10 items. The questionnaire should not be scored if more than two items are missing. The cut-off of ≥ 10 was used, as suggested by Andresen et al. (1994) to reflect risk of depression in English speakers.

The food security (hunger) questions included in the National Income Dynamics Study – Coronavirus Rapid Mobile Survey (NIDS–CRAM) that measure household and child hunger (van der Berg et al., 2022) were used in the WCSBS. The NIDS is a broadly nationally representative panel study following the lives of 28 000 South Africans and those they live with every two to three years since 2008.
The three questions are as follows:
1 In the past month, did your household run out of money to buy food (Y/N)?
2 In the last 7 days, has anyone in your household gone hungry because there wasn’t enough food (Y/N)? If YES, How often did they go hungry? (Frequency options: never, 1 or 2 days, 3 or 4 days, almost every day, every day)
3 In the past 7 days, has any child in your household gone hungry because there wasn’t enough food (Y/N) If YES, how often did they go hungry? (Frequency options: never, 1 or 2 days, 3 or 4 days, almost every day, every day).

The questionnaires and data collection tools were tested for face (formulation and comprehension of questions) and content validity (responses given), and were reviewed by the research team in collaboration with fieldworkers and community members during fieldworker training. Training included role-played interviews with mothers from the target population. A number of changes were made to the questionnaire and photo cards based on the feedback received.
An experienced registered dietician oversaw and coordinated all aspects of data collection, including quality control of completed questionnaires and logistics. Two teams of four fieldworkers led by a team leader were trained, standardised and deployed in the field to conduct the fieldwork. Fieldworkers worked in pairs. Each pair included one fieldworker proficient in English/isiXhosa and one proficient in English/ Afrikaans to allow for interviews to be conducted in the language of choice of respondents.
To ensure team leader and fieldworker safety, local police stations, relevant community leaders and community security/policing forums (CPF) in each EA were contacted/approached either the day before or on the morning when entering an EA to gain insights into any safety concerns in the target areas. If deemed necessary by the police, CPFs were requested and remunerated to accompany fieldworkers. Local community members were identified as chaperones/ facilitators of entry into individual households if necessary. Despite these measures, further safety support was needed and put in place in the form of a security officer for each team who accompanied them throughout the study.
Team leaders and fieldworkers underwent a six-day training programme offered by the study PI and a registered dietician with substantial experience in training fieldworkers in anthropometric measures and dietary intake assessment. The training covered sampling HHs in EAs; doing the necessary introductions when entering HHs; administration of the screening questionnaire; administration of the informed consent procedure; interviewing techniques and administration of the questionnaires; anthropometric measures (using the manual published by Wenhold et al., 2022 as a guide); plotting each of these measures on growth charts; and the study code of conduct. Team leaders received additional training on fieldworker management and checking.
Each fieldworker pair received a kit containing the following items to conduct interviews and measurements: digital adult and baby scales, a stadiometer, a length mat, MUAC tape measure, photocards for administration of the food intake component of the dietary questionnaire and copies of consent forms and questionnaires.
Team leaders knocked on the HH door, introduced themselves and briefly explained the purpose of the survey to the person answering the door. If the HH showed interest in participation, the screening questionnaire was administered. If the HH met the inclusion criteria of the study, a pair of fieldworkers was introduced to the HH, who then completed the informed consent procedure with a parent/ primary caregiver. Fieldworkers then completed the anthropometric measures (child and mother/primary caregiver) and administered the questionnaires. If a child had been in care outside the house for any period during the previous 24 hours, the facility was contacted to check food intake during the time the child was there if the interviewee did not know this information.
Data quality control involved:
› comprehensive training and standardisation of fieldworkers by an expert team led by a registered research dietician with comprehensive experience in fieldworker training for anthropometric and dietary surveys;
› calibration of equipment for anthropometric measures as recommended by Wenhold et al. (2022);
› repeating all anthropometric measures twice and using the average in statistical analyses;
› conducting interviews in the language of choice of mothers/primary caregivers;
› checking completed questionnaires for completeness and clarity of entries while still in the household by the person in the fieldwork pair who did not conduct the interview;


› checking completed questionnaires by the team leader at the conclusion of data collection each day, with the possibility to return to the HH the next day to check anything that was unclear/incomplete;
› regular collection (weekly, as the team’s travel schedule allowed) and checking of all questionnaires by the study coordinator, study PI and data capturer; and
› regular site visits by the study coordinator to oversee data-collection procedures.
Data was analysed using Statistical Analysis Software (SAS) by a statistician with extensive experience in analysis of national malnutrition and dietary intake surveys, including the 1999 NFCS (Labadarios et al., 2005), the 2005 NFCS Fortification Baseline Study (Labadarios et al., 2008), the 2002 Dietary Intake Study (Steyn et al., 2003) and the 2018 PDIS (Senekal et al., 2019; Steyn et al., 2020). Descriptive statistics included mean (95% CI) and median (95% CI) for continuous variables and frequencies were tallied for categorical variables. The complex survey design was considered in all analyses and, consequently, the association between categorical descriptive variables and EAtype, UF, UI and RT was tested using the Rao-Scott Chi-square test. Comparison of continuous variables was done using the Bonferroni multiple comparison (MC) test (continuous variables) or the Kruskal-Wallis test (mostly for count variables, or for extremely skew distributions).
Prevalence of malnutrition amongst the children (stunting, underweight, overweight and obesity) was determined according to the cut-offs listed in Table 5 for different age groupings, including <6-monthold infants, 6-month–<1-year-olds, 1–<2-year-olds, <2-year-olds and 2–<5-year-olds. Associations between malnutrition and age groupings was tested using the Rao-Scott Chi-square test.
Dietary analyses included frequencies for feeding practices, calculation of the DDS for children 6 months and older, classification according to the WHO/UNICEF cut-off of less than four of the eight food groups, and calculation of WHO/UNICEF indicators other than the DDS (analyses were also done according to the cutoff of less than five of the 10 food groups, but results were not included in this report). Frequency of intake of items listed on the dietary questionnaire food list was used to identify the most consumed foods in the different age groupings.
Wealth, Care and WASH Indexes were generated for inclusion in logistic regression analyses using an iterated principal factor analysis process. Detail on the development of the indexes is included in Supplementary Materials 2.1 to 2.3 and variables that were retained in each index are presented in the results.
Five multivariate logistic regression models were constructed to identify potential drivers (predictors) of a DDS<4, a birthweight <2 500 g, incomplete immunisation status, HAZ<–2 (stunting) and BAZ>2 (overweight/ obesity). Independent variables considered for inclusion in the multivariate logistic regression, apart from the Wealth, Care and WASH indexes, were selected based on expert insights of the research team in potential relationships based on their experience in similar studies and from literature. An iterative process was applied to evaluate the multivariate relationship. Variables that did not show any significant relationships in any of the selected age groups in a particular model were eventually discarded. Variables that remained in the final regression models and those that were considered but discarded are presented in relevant results tables. An odds ratio along with 95% confidence intervals were estimated to measure the strength of association. The statistical significance was set at a p value less than 0.05. Variance inflation factors (VIFs) were calculated to establish the presence of multicollinearity.
All analyses were weighted as per the sample design by the statistician.
Ethical approval for this study as well as two amendments was obtained from the UCT Faculty of Health Sciences Human Research Ethics Committee (HREQ-REF292/2022) and from Stellenbosch University (REC: SBE-2022-26176). As the target population was minors, informed consent was obtained from a parent/primary caregiver, who was also interviewed on behalf of the minors. Race (population group) was included in the questionnaire for descriptive purposes and was not included in association analyses. The option to not disclose race was included in the questionnaire.
The length/height-for-age and weight-for-length/ height of each child were plotted on growth charts that were given and explained to mothers/caregivers for educational purposes.

The mean (95% CI) age of children included in the study was 2.5 (2.3–2.6) years, with 17.5% in the 0–<1-year-old, 23.4% in the 1–<2-year-old, 20.7% in the 2–<3-year-old, 21.6% in the 3–<4-year-old and 16.6% in the 4–<5-yearold categories. There was no association between EAtype and child age. Gender representation was equal, with 49.6% males and 50.4% females and there was no association with EA-type and gender (Table S3.12, supplementary materials).
Self-reported categorisation of race of the children as indicated by the interviewee was 33.6% black African, 57.4% coloured (mixed ancestry), 7.8% white (Caucasian), 0.6% Indian and 0.6% other. In the UF EAtype 33.6% were black African, 57.4% coloured, 0.6% Indian/Asian, 7.8% white and 0.6% other. In the UI EAtype 93.4% were black African and 6.6% were coloured. In the RT EA-type 9.2% were black African, 90.2% were coloured and 0.5% were white. Significance of the association between EA-type and race could not be tested due to a zero value in one cell (Table S3.1).
Results on birth order of children is as follows: 39.9% were first born, 30.6% second born, 18.4% third born, 7.5% fourth born, and 3.5% fifth to eight born. There was no association between EA-type and birth order (Table S3.14).


Stunting prevalence in the total study sample was 17.5% (Table 5). This was 25.2% in <6-month-old infants, which dropped to 7.7% in 6-month–<1-yearolds, increased to 23.9% in 1–<2-year-olds, after which it dropped to 18% in 2–<3-year-olds, 14.3% in 3–<4-year-olds and 15.7% in 4–<5-year-olds. The prevalence of stunting was similar in the <2-year-old (19.7%) and 3–<5-year-old (16%) groups (Table 5, Figure 4, Table S3.21).
Stunting, underweight and wasting prevalence in under-5-year-old children in the Western Cape
HAZ=height-for-age Z-score, WAZ=weight-for-age Z-score, BAZ=BMI-for-age Z-score, MAM=moderate acute malnutrition, SAM=severe acute malnutrition
Stunting prevalence (HAZ) in under-5-year-old children in the Western Cape (N=1 202)
Younger children were more likely to be stunted (Rao-Scott Chi-square p<0.001)

Stunting prevalence was significantly associated with EA-type, with stunting being most common in the RT EA-type (25.8%) and least common in the UF (16.5%) EA-type, with the prevalence in the UI EA-type being 20.5% (Table 6).
Stunting prevalence by EA-type in under-5-year-old children in the Western Cape

Underweight prevalence was 5.6% in the total study sample (Table 5). It was 11.4% in the <6-month-old infants, dropped to 7.9% in 6-month–<1-year-olds, 4.2% in 1–<2-year-olds, 5.6% in 2–<3-year-olds, 3.6% in 3–<4-year-olds and then increased to 6.8% in 4–<5-year-olds. The difference between age groups was not significant (Table 5, Figure 5).
HAZ=height-for-age Z-score, SD=standard deviation, CI=95% confidence interval No association between underweight prevalence and age
Table 6
Wasting prevalence (BAZ<–2SD) in the total sample was 3.4% and SAM (BAZ<–3SD) 1.1% (Table 5). Under-1year-olds were most likely to be wasted (almost 10% in under-1-year-olds versus <4% in the other age groups) and there was a non-significant trend for under-1-yearolds to be more likely to have SAM (3.1% for <6 montholds; 3.2% for 6-month–<1-year-olds versus <1.4% in the older groups (Table 5 and Figure 6).
Wasting prevalence (BAZ) in under-5-year-old children in the Western Cape (N=1 199)
Significant association between wasting prevalence (BAZ<–2SD) and age (Rao-Scott Chi-square p<0.001), but not with severe wasting (SAM)

Results for MUAC also indicate that the younger age groups may be more prone to wasting and SAM than older children (Figure 7 and Table S3.21).
Wasting prevalence (BAZ) in under-5-year-old children in the Western Cape (N=1 199)
Prevalence of overweight and obesity are presented in Table 7 and Figure 8. Overweight and obesity prevelance in the total sample were 9.8% and 5.3% respectively. The prevalence increased from birth to peak in the 1–<2-year-old group (26.2% for overweight and obesity combined) and then dropped to 7.8% (combined) in the 4–<5-year-olds (significant association). The combined prevalence of overweight and obesity also differed significantly between under-2-year-olds and 2–<5-yearolds (20.6% and 11.4% respectively) (Table 7).
The combined prevalence of stunting and overweight for the total group was 2.4%. The 1–<2-year-olds were most likely to be stunted-overweight (5.5%), followed by the 2–<3-year-olds (significant association). Prevalence of overweight/obesity was not associated with EA-type (Table S3.11).
In the majority of HHs the person interviewed was the mother of the index child (71.6%), with others interviewed (n=320) being mostly the grandmother and then the father, aunt, older sibling, grandfather, uncle or a non-related person. The mother was significantly more likely to have been the interviewee in the UI than in the UF and RT EA-types (p=0.021) (Table S3.1). Most mothers (93.2%) and 54.1% of fathers lived in the HH four or more nights a week, with no difference between EA-type profiles (Table S3.1).

Prevalence of risk of overweight (BAZ>1, ≤2SD), overweight (BAZ>2, ≤3SD) and obesity (BAS>3SD) in under-5-year-old children in the Western Cape (N=1 199)
A third of mothers were legally married (31.2%), 52.7% had never been married, 13.6% were living together and 2.5% indicated other options. EA-type profiles differed significantly for marital status of the mother (p=0.014). Having never been married was more common in the UI and RT EA-types, with the percentage living together being lower in these areas than in the UF area (Table S3.1).
Fifty-one per cent of HHs were male headed (father: 38.9%, grandfather: 11.3%, uncle 2.6% or mother’s male partner: 0.6%), 43% female headed (grandmother: 24.2%, mother: 16.4%, or aunt: 2.3%) and 5.6% indicated other options. There were no significant differences between EA-type profiles (Table S3.1).
Languages spoken in HHs were Afrikaans (47.4%), isiXhosa (26.7%), English (20.6%) and 5.3% indicated another language (e.g. Shona, Sotho, Chewa, being bilingual, and some others). EA-type profiles differed significantly for language spoken in HHs (p<0.001). IsiXhosa was most spoken in UI (75.1%) and Afrikaans in RT (89.3%). Another language (14.9%) and isiXhosa (7.0%) were the second most commonly spoken languages in UI and RT respectively. Afrikaans was also more commonly spoken in the UF areas (48.3%), with isiXhosa being spoken in 23.1% and English in 24% of HHs in this area (Table S3.1).
As far as educational status is concerned, half of the mothers did not complete Grade 12, with 6.3% having completed primary school or less, 44.5% some high school, 30% Grade 12, 16.4% tertiary training and 2.7% indicating other options (mostly do not know). A third of fathers had not completed Grade 12, with 5.1% having completed primary school or less, 28.7% some high school, 27.9% Grade 12 and 14.3% tertiary training. The educational status of 23.9% of fathers was not known. EA-type profiles differed significantly for educational status of mothers and fathers of index children (RaoScott Chi-square p=0.001 and p<0.001 respectively). Most prominent was that having completed a tertiary training was more common in the UF EA-type and having completed some high school in the UI and RT EA-types (Table S3.2).
Just more than half of mothers were at home not working (54.3%), 30.1% were working full-time, 6.8% were working part-time and 8.8% indicated other options (mostly do not know). There were 21.5% of fathers at home not working, 53.7% were working fulltime, 8.2% were working part-time and 16.5% indicated other options (mostly do not know). EA-type profiles differed significantly for the employment status of mothers as well as fathers of index children (RaoScott Chi-square p=0.001 and p=0.001 respectively). The percentage of mothers at home and not working was the highest, and working full-time the lowest, in the UI EA-type. For fathers the percentage at home not working was almost a quarter across all three EAtypes, while working full-time was lowest and working part-time highest in the UI EA-type (Table S3.2).
More than 80% (82.8%) of dwellings were classified as formal and 17.2% as informal, with 86.9% of the dwellings in UI, 31.3% of the dwellings in RT and 8.5% in UF EA-types classified as informal (profiles significantly different between EA-types Rao-Scott Chi-square p<0.001).
The median (95% CI) number of rooms in dwellings in the total sample was 4.5(4.2–4.8), which was significantly lower in dwellings in UI EA-types [2.5(1.9–3.1)] than in dwellings in UF and RT EA-types (p<0.001). The majority of dwellings had one or more bedrooms (95.1%), a kitchen (89.2%; HHs in UF EA-types were most likely to have a kitchen in UF EA-types, while those in UI EA-types were least likely to have one; Rao-Scott Chi-square p=0.006), and a bathroom (80%; HHs that were most likely to have a bathroom in UF and least likely in UI EA-types p<0.001). An openplan living–dining room was also common (63.2%; most likely in UF areas). The median (95% CI) number of people living in dwellings in the total sample was 4.4 (4.1–4.6). This number was significantly lower for HHs in UI [3.6(3.2–4.0)] than HHs in UF [4.4(4.2–4.7)] and HHs in RT [4.4(4.0–4.8)] EA-types (Bonferroni MC p<0.05) (Table S3.5).
The main energy source for cooking was electricity in 85.8% of HHs, with the main other option being gas. There were no significant associations between EAtype and energy source for cooking. Almost 80% of HHs had access to the Internet, either via a cell phone (48.8%) or a home Internet connection (30.3%). Having no access tended to be higher in RT EA-types, but significance could not be tested due to a 0 value in one cell (Table S3.3).
The main sources of drinking water and water for other uses in HHs were piped water in the dwelling (81.3% and 81.4% respectively), with the most common alternative option being piped water through an onsite tap (11.2% and 11.4% respectively). Other options were mentioned by 7.5% of interviewees, including a public or neighbour’s tap. EA-type was significantly associated with a main source of drinking water and water for other uses (Rao-Scott Chi-square p<0.001 for both variables). Use of piped water (in-dwelling or on-site) was less common and the other options more common in the UI EA-type. Most of all the HHs (96.5%) across the three EA-types indicated that they always had sufficient water (Table S3.3).
Most HHs had access to a flush toilet connected to a public sewerage system/septic tank (79.6%), 5.2% had either a bucket or chemical toilet system and 0.1% had no toilet facility. The majority also had the toilet facility in their own dwelling (79.6%), 14.6% had the toilet in their own yard/plot and 5.9% elsewhere. HHs in the UI EA-type tended to be less likely to have access to a flush toilet (64% versus 98.9% in UF and 83.8% in RT EA-types), but significance could not be tested due to a 0 value in one cell. On the other hand, EA-type was significantly associated with location of the toilet facility (Rao-Scott Chi-square p<0.001). Toilet location was elsewhere for 49.1% of HHs in the UI EA-type versus 1.2% in the UF and 5.5% in the RT EAtypes. Sharing of toilet facilities was prevalent in 18.1% of all HHs, with HHs in the UI EA-type being significantly more likely to be sharing (Rao-Scott Chisquare p<0.001; UF 12.8%, UI 65.5% and RT 19.9%) (Table S3.3).
Availability of a handwashing facility in the dwelling was 65.6%, a fixed facility in the yard 10.1%, none 3.5% and other (not observed, interview elsewhere) 20.8% in the total group of HHs. Not having a facility or a fixed facility in the yard was more common in the UI than UF and RT EA-types (Rao-Scott Chi-square p<0.001). Handwashing results show that 24.3% of interviewees washed their hands before handling food, 60% before feeding the child and 88.2% after going to the toilet. EA-type was significantly associated with handwashing before handling food and before feeding the child (Rao-Scott Chi-square p<0.001 for both associations). Washing hands before handling food was least common in the UI EA-type (67.9%) and most common in the UF and RT EA-types (85.6% and 90.8% respectively). Washing hands before feeding the child was also least common in the UI EA-types (28.2%) and more common in the UF and RT EA-types (65.6% and 52.6% respectively) (Table S3.4).
Refuse collection was done by a local authority from HH premises for 86.9%, collected from a communal collection point for 10.9% and elsewhere for 2.2% of HHs (0.75% dump refuse anywhere). Refuse collection from premises by local authorities was most common in the UF EA-types (Rao-Scott Chi-square p<0.001) (Table S3.3).
Observation of the cleanliness of dwelling floors showed that 4.4% were classified as very dirty, 14.6% as dirty, 64.8% as clean and 16.2% as very clean. The clothes of the child were classified as very dirty for 3.9%, dirty for 11.2%, clean for 68.9% and very clean for 16.0% of children. EA-type was significantly associated with the cleanliness of the child’s clothes (Rao-Scott Chi-square p=0.011), but not the floor of dwellings. The very clean clothes category was least common and the dirty and very dirty categories most common in the UI EA-type (Table S3.4).
Sources of HH income included salaries/wages/ commissions (74%), business income (6.8%), grants of all types (71%) and other options (7.2%). There were no associations between EA-type and sources of income (Table S3.6). Two thirds of HHs received child-support grants, 15.4% old-age grants, 5.6% disability grants, 4.5% social relief of distress grants, 3.3% Covid-19 relief of distress grants, 1% foster-care grants, 0.1% care-dependency grants and a 0% war-veteran’s grant or a grant-in-aid. Significant differences between EA-type profiles for grants received were evident for the child-support grant (UF 64.3%, UI 76.9%, RT 82.6 %; Rao-Scott Chi-square p<0.016), old-age grant (UF 16.4%, UI 4.4%, RT 17.1%; Rao-Scott Chi-square p=0.002) and social relief of distress grant (UF 4.4%, UI 9.0%, RT 0.8%; Rao-Scott Chi -are p=0.004) (Table S3.6).
The estimated total monthly income of HHs was R0–R3 200 for 41.9%, R3 201–R25 600 for 42.7% and more than R25 600 for 9.4%. None of the HHs in the UI or RT EA-types had a total income of more than R25 600, with just more than half of these HHs having an income in the lowest bracket (Table S3.6).
Forty-one per cent of HHs ran out of money to buy food in the month preceding the study, 9.4% reported that a HH member and 5.5% that a child in the HH had gone hungry at least 1–2 days in the week preceding the study (Figures 9 and 10). EA-type was significantly associated with having run out of money for food in the past month (those living in the UI and RT EAtypes were more likely to run out of money; Rao-Scott Chi-square p=0.012) (Table S3.8).

Number of days someone in the household and any child was hungry in the past week in households of under-5-year-old children in the Western Cape by EA-type (N=1 214)

The mean (95% CI) age of mothers was 30.1 (29.4–30.9) years. Less than 1% (0.8%) were under 18 years old, 47.6% were 18–<30 years old, 41.9% 30–<40 years old and 9.7% 40 years and older. There was no association between EA-type and mother’s age (Table S3.9).

The mean (95% CI) age of mothers at the birth of the index child was 27.8 (27.1–28.6); 5.6% were younger than 18 years old when the child was born. There was a strong trend for mothers living in the UF EA-type to be more likely to have been younger than 18 years old at this point (Bonferroni MC p=0.04). The mean (95% CI) age of mothers at the birth of their first child was 22.2(21.3–23.2) years, with 17.3% having been younger than 18 years old at this point (similar across EA-types). Only 2.6% of mothers were pregnant at the time of the study and there was no association with EA-type (Table S3.9).
The majority (94.9%) of mothers received antenatal care when they were pregnant with the index child. Only 6.5% were visited at home by a healthcare worker during their pregnancy and only 9% were visited after the birth of the index child. There were no associations between EA-type and these variables (Table S3.9). Thirty per cent of mothers were employed at the time of birth of the index child. Duration of maternity leave for employed mothers was less than four months for 63.4% and four months or more for 36.6% (Table S3.9).
The mean (95% CI) BMI of mothers was 28.1 (27.3–28.8) with 6.9% underweight, 34.0% normal weight, 22.3% overweight and 36.8% obese. EA-type was significantly associated with mothers’ BMI, with BMI being significantly higher in UI EA-types than in UF or RT EA-types (Bonferroni MC p<0.05). Obesity was most common among mothers in the UI EA-type (55.5%) compared to the UF (34.4%) and the RT (36.4) EA-types (Rao-Scott Chi-square p<0.001) (Table S3.10).
Self-reported diabetes was present in 2.3% of mothers, high blood pressure in 5.2%, heart problems in 0.5%, HIV/AIDS in 6.2%, tuberculosis in 0.3%, while 2.7% indicated other options, including epilepsy. There were 14.6% of mothers classified as being at risk of depression. Physical abuse from husband/ partner was suffered by 1.6% of mothers (0% in the RT
(Table S3.10).

Smoking during pregnancy with the index child was prevalent in 25.2%, alcohol use in 14.4% and drug use in 2.8% of mothers. EA-type was significantly associated with smoking during pregnancy, but not with alcohol or drug use. There were 37.8% of mothers in the RT EA-type who smoked during pregnancy, 26.3% in UF and 6.6% in UI EA-types (Rao-Scott Chisquare p<0.001). Mothers living in the UI EA-type tended to be more likely to use alcohol (UI=18.2%, UF=14.2% and RT=12%) but this was not significant (Table S3.10).
The BMI and depression risk profile of primary caregivers other than the mother was similar to that of the mother (Table S3.11). The mean (95% CI) BMI was 29.2(28.1–30.3) with 6.8% classified as underweight, 30.4% as normal weight, 21.2% as overweight and 41.2% as obese. There were 14.7% who were found to be at risk of depression. There were no associations between EA-type and any of these variables (Table S3.11).
Eighteen indicator variables were considered for calculation of the Wealth Index (Supplementary materials S3.1). The 12 variables that were retained after completion of the development steps using internationally recognised methods (Filmer & Pritchett, 2001) (Supplementary materials S2.1) include:
› household possessions: refrigerator, vacuum cleaner, washing machine, computer or laptop, satellite television, motor car, television;
› Internet access with a connection at home in the dwelling, using a cell phone or any other mobile device;
› the type of dwelling, indicated as a formal brick/ concrete structure OR an informal dwelling such as a shack in a backyard/not in a backyard in an informal settlement; and
› a count variable representing the total number of rooms in the house.
A score in the lowest tertile was defined as a potential risk for stunting, overweight/obesity, as well as poor dietary diversity, low birthweight and incomplete immunisation status.
Tertile distributions for the total group and by EA-type are presented in Table 8. EA-type was significantly associated with the Wealth Index tertile distribution. Being in the lowest tertile was most common in the UI EA-type (80.6%) and least common in the UF EA-type (26.3%).
Table 8
Wealth, Care and WASH Index tertile distributions for under-5-year-old children in the Western Cape by EA-type
Twenty-five indicator variables were considered for calculation of the Care Index (Supplementary materials S2.2). The ten variables retained after completion of the development steps using internationally recognised methods (Filmer & Pritchett, 2001) (Supplementary materials S2.2), include:
› mother: marital status, educational level, current employment, employment status when the child was born, age when the child was born;
› father: educational level and current employment; and

› child-development opportunities: attendance of ECCE programmes and availability of children’s books in the HH.
A score in the lowest tertile was defined as a potential risk for stunting, overweight/obesity, as well as poor dietary diversity, low birthweight and incomplete immunisation status.
Tertile distribution for the total group and by EA-type are presented in Table 8. EA-type was significantly associated with the Care Index. Being in the lowest tertile was most common in the UI EA-type (52.9%) and least common in the UF EA-type (30.1%).

Twenty indicator variables were considered for calculation of the WASH Index (Supplementary materials S2.3). The thirteen variables that were retained after completion of the development steps using internationally recognised methods (Filmer & Pritchett, 2001) (Supplementary materials S2.3), include:
› water availability: piped water inside the dwelling, piped water in the yard, water from a neighbour’s/ public tap;
› handwashing facility: handwashing facility available in the dwelling, handwashing facility available in the yard, soap/detergent available for handwashing, water available for handwashing;
› toilet facility: flush toilet, toilet inside dwelling, toilet shared, bucket toilet; and
› HH and child hygiene: house with clean floors and child with clean clothes.
A score in the lowest tertile was defined as a potential risk for stunting, overweight/obesity, as well as poor dietary diversity, low birthweight and incomplete immunisation status.
Tertile distribution for the WASH index in the total group and by EA-type are presented in Table 8. EAtype was significantly associated with the WASH Index. Being in the lowest tertile was most common in the UI
The majority (85.3%) of interviewees could present the index child’s Road-to-health booklet (RtHB) at the time of the interview (UF=83.8%, UI=93.7% and RT=91.1%). Fourteen per cent indicated that the child had a RtHB but did not have it with them at the time of the interview, with the reason being either that it was with another person or that the child was recruited using alternative strategies, e.g. swim schools, play groups, pre-schools and community markets where parents did not necessarily have the booklet with them. Less than 1% did not have a RtHB, with the most common reason for not having one being that the child was not South African (Table S3.12).
Presence of fast, short and rapid breathing (potential respiratory tract infection) in the past two weeks was reported for 3.9% and presence of diarrhoea for 5.4% of children. EA-type was significantly associated with the presence of a respiratory tract infection, with it being most common in the UF EA-type (UF=4.4%, UI=1.8% and RT=1.5%) (Rao-Scott Chi-square p<0.029). There was no association between living area and presence of diarrhoea.
The mean (95% CI) gestational age of mothers was 38.5 (38.3–38.7) weeks, which did not differ between EA-types. The mean (95% CI) birthweight was 3.0 (2.9–3.0) kg, with birthweight of children living in the RT EAtypes [2.8(2.7–2.8)] being significantly lower than that of children living in UF [3.0(3.0–3.1)] and UI EA-types [3.2(3.1–3.3)] (Bonferroni MC p<0.001). Prevalence of very low birthweight (<1.5kg) was 2%, low birthweight (≥1.5kg, <2.5kg) 15.8% and normal birthweight (≥2.5kg) 82.3%. Low birthweight (low and very low combined)
was more common in the RT EA-type than the other two EA-types (RT=24.4%, UF 17.8% and UI 12.4%) (Rao-Scott Chi-square p<0.001) (Table S3.12).
Predictors of low birthweight for 6-month–<5-yearold children are presented in Table 9. The following increased the risk of a low birthweight: having a Care Index in the lowest tertile in the 2–<3-year-old age grouping; having a low income in 2–<5-year-old and 3–<5-year-old age groupings; having a mother who smoked while pregnant with the index child in all age groupings except the 2–3-year-old age grouping; and a gestational age of <37 weeks in all age groupings (strongest predictor). A protector against a low birthweight was having an overweight/obese caregiver in all age groupings except the 6-month–<2-year-old grouping. Variables included in the model that were not significant predictors of birthweight are listed in the footnote to Table 9.
Table 9
Predictors of low birthweight (<2 500g) in 6-month–<5-yearold children in the Western Cape in various age groupings1
CI=95% confidence interval, BMI=body mass index
1 Multiple logistic regression
2 Variables included in the model that were not significant predictors: RT EA-type, UI EA-type, low Wealth Index, received child grant, no money for food past month, low WASH index, mother used drugs during pregnancy, older age, and ran out of money for food
Immunisations were complete in 72.3% of the sample, incomplete in 13% and 0.7% were not immunised (did not have a RtHB). Immunisation data was not obtained in 14% of the sample as the RtHB was not available to be checked. EA-type was significantly associated with immunisation status. Complete immunisation status was most common in the RT EAtype (RT=83.5%, UF=71.3% and UI=73.5%) (Table S3.12).
Predictors of incomplete immunisation status for 6-month–<5-year-old children are presented in Table 10. The following increased the risk of incomplete immunisation in respective age groups: caregivers ran out of money for food in the past month and HH in an UF EA-type in the 6-month–<5-year-old, 2–<5-year-old and 3–<5-year-old age groupings, child hungry in the
past week in the 6-month–<5-year-old and 2–<3-yearold age groupings, not ever breastfed in the 2–<5-yearold and 4–<5-year-old age groupings and living in the UF EA-type in 6-month–<5-year-old, 2–<5-year-old and 4–<5-year-old age groupings. Protectors against incomplete immunisation were having an overweight/ obese caregiver in the 6-month–<5-year-old and 6-month–<2-year-old age groupings; mother used alcohol during pregnancy and HH in a RT EA-type in the 6-month–<2-year-old age grouping; as well as children being older. Variables included in the model that were not significant predictors of immunisation status are listed in the footnote to Table 10.
CI=95% confidence interval, BMI=body mass index
1 Multiple logistic regression
2 Predictors included but not significant: low Care Index, low income, low Wealth Index, received child grant, low WASH Index, mother smoked during pregnancy, mother used drugs during pregnancy, low dietary diversity score
* , ** , *** Maximum likelihood estimates, t-distribution, p<0.05, p<0.01, p<0.001
Attendance of a care facility outside the HHs by children was 11.4% for a crèche/educare centre; 3.6% for a preschool, nursery school/Grade 00/000 or Grade R; 2.5% for a day mother/gogo /child minder; 1.3% for a home/community play group; 0.7% indicated other options; while 82.3% did not go to any of these facilities. EA-type was not associated with attendance of particular care facilities (Table S3.13). Sixty-five per cent of the HHs did not have children’s books in the HH (story or picture books), 21% had between one and nine books and 13.8% had 10 or more books. EA-type was significantly associated with availability of children’s books (Rao-Scott Chi-square p<0.001). Having no books was most common in the UI EA-type (92.1%), compared to 61.1% in the UF and 77.2% in the RT EAtypes (Table S3.13).
Toys children played with included homemade (50.9%), store-bought (90.2%), household objects (70.3%) and objects found outside (71.5%). There were no associations between EA-type and the type of toys children played with (Table S3.13).
Results on development indicators for 3–<5-year-old children showed that 24.3% were attending organised learning or early childhood education programmes, 49.4% could identify 10 or more letters of the alphabet; 22.7% could read three or more simple, popular words; 68.9% knew the name and recognised the symbol of numbers 1 to 10; 97.6% could pick up a small object with two fingers; 22.1% were sometimes too sick to play; 95.3% could follow simple directions on how to do something correctly; 94.4%, if given something to do, could do it independently; 96.4% got along with other children; and 35.1% got distracted easily. EA-type was associated with five of these indicators. Being too sick sometimes to play was most common in the UI EA-type (37%) and least common in the UF EA-type (16.7%) (RaoScott Chi-square p=0.018). Being able to follow simple directions on how to do something correctly was less common in the UI EA-type (84.8%) than in the UF and RT EA-types (96.5% and 93.9% respectively) (RaoScott Chi-square p=0.001). Being able to do something independently was less common in the UI EA-type (77.8%) than in the UF and RT EA-types (96.2% and 93.9% respectively) (Rao-Scott Chi-square p<0.001). Being able to pick up a small object with two fingers
was less common in the UI EA-type (91.3%) than in the UF and RT EA-types (98.4% and 95.5% respectively) (Rao-Scott Chi-square p=0.001) (Table S3.14).
Stunting was significantly associated with three of the developmental indicators in this age group. Stunted children were more likely to not have attended organised learning or early childhood education programmes, not knowing the name and recognising the numbers 1 to 10, and not being able to follow simple directions on how to do something correctly (Table S3.15). Further results on early childhood learning in the 3–<5-year-olds show that for 31.6% of children, no one in the HH read books to/looked at picture books with them; for 21.6% no one told them stories; for 19.5% no one sang for or with them; for 12.4% no one took them outside the house/compound/yard; for 10.2% no one played with them; and for 21.9% no one drew with them. EA-type was associated with two of these indicators. Not reading with the child was least common in the UF EA-type (28.8%) and most common in the UI area (56.5%), while it was 34.8% in the RT EAtype (Rao-Scott Chi-square p=0.008). Not drawing with the child was least common in the UF and RT EA-types (19.2% and 18.8% respectively) and most common in the UI EA-type (50%), while it was 34.8% in the RT EAtype (Rao-Scott Chi-square p=0.001) (Table S3.14).
At the time of the study, 72% of mothers of younger than 6-month-old infants BF their infant. Exclusive BF was practised by 18.8% of mothers, 20.3% practised mixed milk feeding (breastmilk combined with formula/ cow’s milk), and the balance received either breastmilk or formula/cow’s milk combined with complementary foods (Figure 11, Table S3.16). Of the <6-month-old infants, 7.2% had never been breastfed. The three most common reasons given for not BF a child was not having enough milk (27.7%), the baby not wanting to take breastmilk (20.2%) and being advised not to BF by a health worker (14.3%).
Having ever been breastfed was 89.5% for the total sample and was similar across the age groups (Figure 11). Figure 11 shows that more than half of the
6-month–<1-year-olds, almost a third of 1–<2-year-olds, almost a quarter of 2–<3-year-olds, 11.4% of 3–<4-yearolds, and 1.6% of 4–<5-year-olds were being BF at the time of the study. Of children who had ever been BF, but were not being BF anymore, 31% had been BF longer than 6 months. The three most common reasons given for discontinuation of BF was that the baby did not want
to take breastmilk anymore (26.5%), that the baby is old enough to no longer BF (23.1%), not having enough milk (15.9%) and having to go back to work (11.9%) (Table S3.16).
A multiple logistic regression model was constructed to identify predictors of “child not ever BF” (dependant variable) and the following independent variables: low Wealth Index, low income, no money for food in the past month, child hungry in the past week, receives child grant, low Wash-Index, low Care Index, mother smoked during pregnancy, mother used alcohol during pregnancy, mother used drugs during pregnancy, caregiver overweight/obese, child low birthweight, child incomplete immunisation status, child low DDS, and EA-type. None of these variables were associated with not ever having been BF.
The percentage of non-BF children who had received two or more milk feeds during the previous 24 hours was 23.6% for 6-month–<1-year-olds, 35% for 1–<2-year-olds, 31.8% for 2–<3-year-olds, 34.3% for 3–<4-year-olds, and 28.3% for 4–<5-year-olds (Table S3.16).
The most frequently given fluids other than infant formula were traditional herbal fluids, followed by plain water, very thin, runny porridge in a bottle/cup/ spoon/syringe, sugar water, fruit juice and tea without milk, mageu and clear broth/soup (Figure 12). The most frequently given solid food was baby cereal, with a small percentage receiving a vegetable (pumpkin/ butternut/other), a fruit (apple/pear/banana), sweet biscuits, potatoes and one infant each received sugar in tea, cooked porridge, plant oil (in cooking) and margarine (on bread) (Figure 13).

Fluids given to non-exclusively breastfed infants younger than 6 months old in the Western Cape
Solid
 Figure 12
Figure 13
Figure 12
Figure 13
Dietary diversity scores based on the WHO/UNICEF infant and young child eight food groups (WHO/UNICEF, 2021) is presented in Table 11 and Figure 14 (based on dietary intake over the past 24 hours). It is evident that the median score is below the cut-off of 4 in all age groups. The DDS increased significantly from 6–<12 months, after which it tended to decrease in the 3–<4 and 4–<5-year-old groups. More than half of children in all age groups had a poor DDS (<4). In children 1 year and older the highest prevalence of a poor dietary diversity was in the 4–<5-year-old age group (62.8%)
(Table 12). When categorised into the 6-month–<2year-old and 2–<5-year-old groups, it is evident that more than half of the children in both age groups had poor dietary diversity (58.2% and 58.8% respectively). Results for the WHO/FAO minimum diversity score for adult females (10 food groups) are included in Table S3.18.
Mean (95% CI) and median (95% CI) WHO/UNICEF DDS and prevalence of a low DDS for 6-month–<5-year-old children in the Western Cape
1 WHO/UNICEF infant and young child eight food groups (WHO/UNICEF, 2021a)
2 Detail for other age groupings included in Table S3.18
3 Excluding <6-month-olds as per the WHO/UNICEF guidance
4 Values indicated with the same letter do not differ significantly
Predictors of poor dietary diversity for 6-month–<5-year-old children are presented in Table 12. A low Wealth Index increased the risk in all age groupings, while “the child having been hungry in the past week” was a risk in the 2–<5-year-old and 4–<5-year-old groupings. Having an overweight/obese caregiver protected against a poor dietary diversity in the ≥6-month–<2-year-old age grouping. Greater age was also protective. Variables included in the model that were not significant predictors of DDS are listed in the footnote to Table 12.
Prevalence of DDS <4 in 6-month–<5-year-old children in the Western Cape (N=1 145)
Predictors of poor dietary diversity (consume <4 out of a possible 8 groups) in 6-month–<5-yearold children in the Western Cape in various age groupings1
DDS=dietary diversity score, CI=95% confidence interval
1 Multiple logistic regression
2 Predictors included but not significant: low income, no money for food in the past month, received child grant, low Wash-Index, low Care Index, mother smoked during pregnancy, mother used alcohol during pregnancy, mother used drugs during pregnancy, child low birthweight, child incomplete immunisation status, and EA-type. * , ** , ***Maximum likelihood estimates,


WHO/UNICEF indicators for healthy and unhealthy eating for children other than DDS are depicted in Figure 15 and more detail in Table S3.19 (based on dietary intake over the past 24 hours). More than 80% of children 2 years old and older consumed egg and/ or flesh foods in the past 24 hours. Consumption of no fruits and/or vegetables was evident in approximately a fifth of all age groups. Intake of sweet foods, e.g. sweet biscuits, cake and sugar, increased with age (Rao-Scott Chi-square p<0.001), with 75% or more of 1-year-old and older children having consumed one or more of these foods. Intake of salty/fatty foods such as crisps also increased with age, with 50% or more of 1-year and older children having consumed one or more of these foods. In the 2-year-old and older age groups, 50–60% consumed one or more sugarsweetened beverage (SSB), e.g. fizzy drinks, cooldrink concentrates and fruit juice. Age was significantly associated with all these dietary indicators except zero fruit and/or vegetable intake, with older children being more likely to exhibit the mentioned dietary behaviours.
of ≥15%.
To illustrate changes in dietary patterns across all age groups in children younger than 5 years old in the Western Cape, the pie charts presented in Figure 16 were constructed.
WHO/UNICEF indicators for healthy and unhealthy dietary food choices other than DDS in 6-month–<5-year-old children in the Western Cape
Figure 15The prevalence of overweight (15.1%) in the Western Cape is in the very high public-health-concern category

< 6 months
6 months– < 1 year
1– < 2 years
2– < 3 years
3– < 4 years
4– < 5 years
Breastmilk
Grains
Legumes
Nuts & seeds
Dairy

Flesh foods
Eggs
Green vegetables
Other vit A vegetables
Other vegetables
Other fruit
Fats & oils
Sentinel sweet
Sugar
Sweet beverages
Salty & fatty food
The ten most consumed foods in 6-month–<5-yearold children are presented in Figure 17 (the top 15 are presented in Table S3.20). Milk items (blue tones), namely breastmilk, formula milk and yoghurt, made up three out of the top four items in the 6-month–<1-yearolds. This changed to only amasi and yoghurt in the 1–<2-year-olds, and only dairy milk in tea/coffee in the 2–<5-year-olds. The number of starchy items (green tones) in the top ten list increased from two (breakfast cereal and maize porridge) in the 6-month–<1-yearolds to five in the 1–<2-year-olds and 2–<3-year-olds (bread, maize porridge, rice, noodles and breakfast cereal), four in the 3–<4-year-olds (bread, noodles, rice and breakfast cereal), and three in the 4–<5-year-olds (bread, noodles and rice), with bread being number one in the last three age groups.
The youngest age group had pumpkin (orange tone) in sixth position and banana (yellow tone) in the eighth position. The middle three age groups (1–<4-yearolds) did not have a fruit or vegetable in the top 10 most consumed foods, while the 4–<5-year-olds had oranges (turquoise tone) at number 10. Crisps were number 7 in the 6-month–<1-year-old group, while it was at number two for all four of the older groups. Sugar in tea/coffee appeared on the top ten list of all five age groups, while sweets were included in the four older groups (unhealthy food choices are depicted in red-pink tones).
Results for significant drivers of stunting in 6-month–<5-year-olds are set out in Table 13. The following increased the risk of stunting: low Wealth Index in all age groupings, with the exception of the 6-month–<2-year-old age grouping; low WASH Index in the 2–<3-year-old age grouping; low Care Index in the 6-month–<5-year-old and 6-month–<2-year-old age groupings; mother smoked during pregnancy in the 6-month–<5-year-old and 2–<5-year-old age groupings; mother used alcohol and mother used drugs during pregnancy in the >6-month–<5-year-old, 2–<5-year-old and the 3–<5-year-old age groupings; low birthweight in all age groupings; and incomplete immunisation
status in the >6-month–<5-year-old, 2–<5-year-old and the 3–<5-year-old age groupings. In the 2–<3-yearold group, having consumed sweet foods in the past 24 hours also increased stunting risk; and RT EA-type in the >6-month–<5-year-old age group. There were no protectors against stunting. Variables included in the model that were not significant predictors of stunting are listed in the footnote to Table 13.
Drivers of stunting (HAZ<–2SD) in 6-month–<5-year-old children in the Western Cape in various age groupings1
HAZ=height-for-age Z-score, SD=standard deviation, CI=95% confidence interval
1 Multiple logistic regression (OR)
2 Predictors included but not significant: UI EA-type, low income, no money for food in the past month, child hungry in the past week, received child grant, caregiver overweight/obese, child not ever breastfed, child low dietary diversity3, child consumed sugar3, child consumed sweetened items3, child consumed SSB3, child consumed salty/fatty items3
3 Based on 24-hour recall of frequency of foods consumed
Results for significant drivers of overweight/ obesity in 6-month–<5-year-olds from multiple logistic regression analysis are presented in Table 14. Drivers of overweight/obesity were having an overweight/obese caregiver in the 6-month–<5-yearold and the 6-month–<2-year-old age groupings, as well as “child not ever breasted” and “child consumed sugar” in 6-month–<2-year-olds. Protectors against overweight/obesity were low birthweight in the 6-month–<5-year-old and 2–<5-year-old age groupings, RT EA-type in the 4–<5-year-old grouping and older age.
Table 14
Drivers of overweight/obesity (BAZ>2SD) in 6-month–<5-year-old children in the Western Cape in various age groupings1
BAZ=BMI-for-age Z-score, SD=standard deviation, CI=95% confidence interval
1 Multiple logistic regression
2 Predictors included but not significant: UI EA-type, low WASH score, low income, low Wealth Index, no money for food in the past month, child hungry in the past week, received child grant, low Care Index, mother smoked during pregnancy, mother used alcohol during pregnancy, mother used drugs during pregnancy, incomplete immunisation, child low dietary diversity3, child consumed sweetened foods3, child consumed SSB3, child consumed sentinel salt/fatty items3
3 Based on 24-hour recall of frequency of foods consumed * , ** , *** Maximum likelihood estimates, t-distribution, p<0.05, p<0.01, p<0.001


The WCSBS was commissioned to determine the current (2022) malnutrition profile in under-5-yearold children in the Western Cape province and identify drivers of stunting and overweight/obesity. The first section of this discussion provides a brief overview of the sociodemographic profile of the children included in the sample (Section 5.2). The malnutrition profile of the study sample is discussed in Section 5.3. This is followed by sections on indicators reflecting the three underlying drivers of malnutrition: (1) household socio-economic indicators, food security and Wealth Index (Section 5.4); (2) mother and childcare indicators and Care Index (Section 5.5); and (3) water availability, sanitation and hygiene indicators and the WASH Index (Section 5.6). Sections on indicators reflecting the two direct drivers of malnutrition follow, which include (1) dietary intake: breastfeeding, dietary diversity (and predictors thereof) and healthfulness of food choices (Section 5.7); and (2) child health indicators: birthweight (and predictors thereof), immunisation status (and predictors thereof) and infectious disease (Section 5.8). In the final section the drivers of stunting and multiple regression analysis overweight/obesity derived from, are discussed (Section in 5.9).
For Sections 5.4 to 5.8 integrated snapshots of characteristics were compiled based on overarching trends in the total sample. Any significant divergence from these overarching snapshots in any one of the three EA-types are delineated. Literature was integrated into these sections to provide local context to the results as available. However, a detailed discussion of each characteristic was beyond the scope of this report.
The age profile of children in the study reflects a good representation of under-5-year-old children in the Western Cape. The mean age was 2.5 years and 17.5% of the total sample were 0–<1 years old, 23.4% were 1–<2 years old, 20.7% were 2–<3 years old, 21.6% were 3–<4 years old and 16.6% were 4–<5 years old. Furthermore, gender was equally represented (49.6% males and 50.4% females). Almost 40% of the children were the first-born child, 30.6% the second-born, 18.4% the third-born, 7.5% the fourth-born, and 3.5% fifth, sixth, seventh or eighth-born. These profiles did not differ between UF, UI and RT EA-types.
The race of the total sample of children as indicated by the interviewee was 33.6% black African, 57.4% coloured, 7.8% white, 0.6% Indian and 0.6% other. This compares well with the profile for the Western Cape reported in the 2016 Community Survey (2016 WCCBS) (Statistics SA, 2018) where 35.9% of the sample were black African, 47.2%, coloured, 16% white, 0.8% Indian and 0.1% other. Results on languages spoken in HHs indicated that Afrikaans was most commonly spoken (47.4%), followed by isiXhosa (26.7%), English (20.6%) and then other languages (5.3%; e.g. Shona, Sotho, Chewa, being bilingual and some others). This is also in line with the language profile sketched in the 2016 WC-CBS, namely 46.6% Afrikaans, 30.1% isiXhosa and 19.6% English (Statistics SA, 2018). The WCSBS sample thus seems more representative of the province’s racial profile than the PDIS, where 68% of the 1–<10-year-old participants were coloured, 27.6% black African and 4% other, including Indian, Asian and white children (Senekal et al., 2019).
Findings show that the prevalence of stunting in the total sample (17.5%) of under-5-year-old children in the Western Cape was close to the upper cut-off of the medium public-health-concern category for 0–59-month-old children (10–19%). Stunting in the <2-year-old age group was 19.7%, pushing it into the high public-health-concern category in this age group. In their investigation of malnutrition in children across 36 LMICs between 1990 and 2012, Tzioumis et al. (2016) also showed that children younger than 2 years old were worse off in terms of stunting than those who were older.
Compared to national statistics for stunting in <5-year-olds, the prevalence in the Western Cape is substantially lower. National surveys show that 33.4% of <5-year-olds were stunted in 2003 (SADHS) (Dhansay et al., 2018), 26.4% of 1–<5-year-olds in 2005 (NFCS-Baseline Survey) (Dhansay et al., 2018), 28.2% of <5-year-olds in 2008 (NIDS) (Amusa et al., 2022), 26.5% of 1–<5-year-olds in 2012 (SANHANES) (Dhansay et al., 2018), and 27.4% of <5-year-olds in 2016 (SADHS) (NDoH et al., 2018). Moreover, stunting prevalence in the Western Cape may be on the decrease as the prevalence in under 5-year-olds in the Western Cape declined from 22.9% (2016 SADHS; NDoH, 2018) to 17.5% in 2022 (WCSBS). Moreover, the prevalence also declined in 1-<5-year olds in the Western Cape from 20.8% (PDIS-WC, Senekal et al., 2019) to 18.2% in the WCSBS. The WCSBS further confirms the notion that stunting prevalence decreases as children get older (Senekal et al., 2019; Harper et al., 2022).
At this point in time there is a paucity of information on stunting in <6-month-old infants. Only the 2016 SADHS reported on stunting in this age group, where it was found that 32.3% of the sample was stunted at the time (stunting by age group by province results were not included in the report) (NDoH et al., 2018). In the WCSBS the prevalence was 25.2%, thus 7.1% lower than the 2016 national prevalence.
The 2022 “Thrive by Five Index” reported stunting rates of children aged 50–59 months (between 4 and 5 years old) who were enrolled in Early Learning Programmes (ELPs) in South Africa. The national prevalence was 6% and in the Western Cape 5.2% (Henry & Griese, 2022). Stunting prevalence in 4–<5-year-olds in the PDIS-WC was 11.9% (Senekal et al., 2019) and 15.7% in the current WCSBS. Of note is that Henry and Griese (2022) warned that their sample did not include the 45–55% of children aged 50–59 months who were not enrolled in an ELP, and who were deemed to be at greatest risk of malnutrition. The WCSBS provides a more valid picture of malnutrition problems in this age group, as a structured sampling strategy was implemented to ensure representativeness of the sample were of EA-type and the target age groups. Only 24.3% of 3–<5-year-olds in our representative sample were attending an organised learning institution outside their homes.
The prevalence of underweight (5.6%) was just above the lower cut-off of the medium (5–9%) and wasting (3.4%) in the low (2.5–<5%) public-health-concern categories for 0–59-month-old children. Underweight in the current survey was most common in 0–<6-monthold children at 11.4%, but then decreased to below
9% in all other age groups (prevalence of 5.6% in the total group). This is somewhat higher than the 3.4% reported in the 2018 PDIS-WC (Senekal et al., 2019).
Wasting prevalence was close to 10% in under-1-yearolds and then dropped to below 3% in 2–<5-year-old children in the WCSBS. This profile is in line with results from the PDIS-WC, where wasting prevalence was also recorded to be 3% in 1–<5-year-olds (Senekal et al., 2019). National studies in this age group confirm that wasting has not been of public health concern over the years, except possibly in <1-year-olds (Dhansay et al., 2018).
National and provincial studies conducted in South Africa since 1999 show an increasing trend in the prevalence of overweight and obesity in young children up to 2008, after which a decrease is evident.
Prevalence of overweight and obesity combined was 7.4% of 1–3-year-olds and 5.9% of 4–6-year olds in 1999 (WHZ) (Steyn et al., 2005), 11.3% of <5-year-olds in 2003 (BAZ) (Dhansay et al., 2018), 12.8% of 1–<5-year-olds in 2005 (BAZ) (ibid.), 18.1% of 6-month–4-year-olds in 2008 (BAZ) (Casale et al., 2016), and 16% of 1–<5-yearolds in 2012 (BAZ) (Dhansay et al., 2018). The 2018 PDIS results showed that 14.8% of 1<5-year-olds in Gauteng and 21.3% in the Western Cape were overweight/ obese, compared to the 15.6% of <5-year-olds in the WCSBS, which is more in line with national trends. Interpretation of these trends needs to be done with caution, as sampling frames, indicators used, and age grouping vary across the surveys.
As was evident from the PDIS-WC (Senekal et al., 2019), the that highest prevalence of overweight and obesity in the WCSBS was recorded for the 1–<2-yearolds (16.2% and 10.0% respectively). However, the prevalence in the PDIS (total sample) was much higher at 23.3% and 14.2% respectively. However, importantly, the WHO warns that classification of young children as overweight or obese needs to be done with great caution as children in this group are still growing. Placing young children on energy-restricted diets may contribute to other forms of malnutrition and associated health risks (de Onis, 2010).
Stunting-overweight in the WCSBS sample was not common at 2.4%, which is lower than found in the PDISWC (5.4%) and in line with the 3.1% reported for South African under-5-year-olds in the 2022 Country Specific Nutrition Profile (https://globalnutritionreport.org/ resources/nutrition-profiles/africa/southern-africa/).
It could be argued that implementation of some of the strategies outlined in the 2015–2020 Strategy for the Prevention and Control of Obesity in South Africa, such as the taxation on SSB, contributed to the decreasing trend in overweight/obesity in the under-5 age group (NDoH, 2016). However, the prevalence of overweight and obesity combined (BAZ>2SD) in the WCSBS (15.1%) still falls in the very high public-health-concern category (≥15%) (Cashin & Oot, 2018), indicating that it remains a malnutrition problem of serious concern in the Western Cape.
The overarching snapshot of current living circumstance that emerged for the total sample of <5-year-old children in the WCSBS shows that they lived in a formal dwelling (82.8%) that had four to five rooms, including a kitchen, bathroom, very likely an open-plan living–dining room and one or more bedrooms; used electricity as the main energy source for cooking (85.8%); accessed the Internet either via a cell phone or a home connection; with between four to five people living in the dwelling. There was divergence from this snapshot in the UI EA-type where children typically lived in an informal dwelling that had two to three rooms (a separate kitchen and/or bathroom less common), with two to three people living in the dwelling. Of note is that access to electricity and the Internet was similar between the three EA-types. In comparison, the 2016 WC-CBS reported that 82.4% of respondents lived in formal dwellings, with the HH size being 3.2 people (Statistics SA, 2018). In the PDIS-WC 79.7% of HHs lived in a formal dwelling, with 5.8 people sleeping in the dwelling and the number of rooms per house, excluding the bathroom/toilet, being 2.9.
Interventions targeting children living in rural towns and urban informal areas may need specific attention when considering intervention strategies.

HHs in the WCSBS typically had a monthly income of below R25 600 (either R0–R3 200 or R3 201–R25 600) (the 2022 poverty line in South Africa was R945 per month – Statista, 2022), which was mostly derived from salaries and receiving one or more government grant (71%). They either did (41%) or did not (59%) run out of money to buy food in the past month, with 1 in 10 HHs experiencing hunger at HH level and 1 in 20 children experiencing hunger. There were 46.2% of HHs in the PDIS-WC who indicated that they “did ever” run out of money to buy food using the “Community Child Hunger Identification Project” food security assessment instrument (Wehler et al., 1992). The question in the CCHP, “Do any of your children ever go to bed hungry because there is not enough money to buy food?” was answered yes by 5.6% in the PDIS-WC. This is in line with the 5.5% of children who reportedly went hungry at least once during the past week in the WCSBS. The results of the NIDS–CRAM study showed that the proportion of HHs that had run out of money for food in the past month declined from 47% in 2020 to 35% in 2021. The proportion of children in NIDS–CRAM reported to have been hungry at least once in the past week declined from 15% to 14% respectively (van der Berg et al., 2022). In the 2016 WC-CBS it was reported that 13.2% of HHs in the Western Cape had run out of money to buy food in the last year, compared to 27.6% in the Northern Cape, 26.3% in the Eastern Cape and 25.1% in the North-West (Statistics SA, 2018). The WCSBS results may thus reflect a decline in HHlevel food security.
Many studies that investigate associations between socio-economic indicators and health behaviours and disease outcomes develop a Wealth Index as suggested by the World Bank (Filmer & Pritchett, 2001) and applied in the 2016 SADHS (NDoH et al., 2018). As mentioned in the methods section above, and Supplementary materials S2.1, 12 out of 18 variables considered were retained after iterated principal factor analysis. These included several household assets, type of dwelling and the number of rooms in the home. The index provides a “summary score” that reflects these variables and can be included in association analyses. Wealth Index results cannot be compared between studies, as it is data driven and variables will thus not load similarly in different studies.
The overarching profile that emerged for the total sample of <5-year-old children in the Western Cape shows that they lived in a HH that received a childsupport grant (66.8%) and that was either male (51.4%) or female headed (43%); in which the mother was the primary caregiver, lived in the dwelling at least four nights a week, and was either married/living with the father (44.8%) or had never married (52.7%); had either some high school or less education (51.8%) or Grade 12 or more education (46.6%); and was either at home (54.3%) or employed part-time/full-time during the day (36.9%). The grandmother was second most likely to be the caregiver. The children typically had a father who lived (54.1%) in the dwelling at least four nights a week, had achieved either some high school or less education (33.8%) or Grade 12 or more education (42.2%) and was employed full-time (75.2%). This profile diverged in the RT EA-type where HHs were more likely to receive a child grant (85%) and mothers were more likely to have never been married (61.2%). In the UI EA-type mothers were less likely to be employed (73.3%).
This profile is mostly in line with the sociodemographic profile described for the PDIS-WC sample, where the mother was the primary caregiver of the index child in 72.7% of cases, followed by a grandparent (21.1%). HHs in the PDIS-WC were also either male or female headed, only 41.2% of the mothers were married, 59.8% of mothers had not completed high school and only a third of mothers were employed compared to two thirds of the fathers (Senekal et al., 2019). The 2016 WC-CBS community profile showed that 62% of HHs were male headed and that 56.1% of persons aged 20 years and older had achieved only some high school or less education (Statistics SA, 2018).
Further characteristics of mothers in the total sample show that they were on average 30 years old at the
time of the study; were 22 years old at the birth of their first child (17.3% had been younger than 18 years old at this point; the youngest age at the birth of a first child reported was 10 years); typically did not have diabetes, high blood pressure, heart problems, HIV/AIDS, tuberculosis or other health conditions (<7% for all these conditions respectively); were likely to be overweight or obese (59.1%); had a low risk of depression (<15%) and had not reported physical abuse from a husband/partner (1.2%). The only divergence was that obesity was more common among mothers in the UI EA-type.
The 2016 WC-CBS (Statistics SA, 2018) reported that 12.1% of births recorded were from mothers younger than 19 years old. The NCD and infectious disease profile found in the WCSBS shows a much lower prevalence for these conditions than reported for women in the 2016 SADHS (NDoH et al., 2018). The majority of mothers measured in the PDIS-WC were found to be overweight or obese (71.1%), which is more in line with the national prevalence of 68% reported for females 15 years and older in the 2016 SADHS (ibid.) than the 59.1% in the WCSBS. The 2016 SADHS also showed that 40% of young women aged 15–24 years were overweight or obese (ibid.). The prevalence of mothers who had been physically abused by a partner in the WCSBS was very much lower than the 21% reported by ever-partnered women aged 18+ in the 2016 SADHS (ibid.), but may have been underreported in the WCSBS. Underreporting of abuse is not uncommon, with possible reasons including fieldworker discomfort asking the question, an environment judged to be inappropriate, as well as the educational level and vulnerability of interviewees (Davis et al., 2003; Cullen, 2022). Depression prevalence amongst mothers of <5-year-olds in the NIDS was 16.1%, thus just more than that found in the WCSBS (Harper et al., 2022).
Of note is that exposure to violent crime or related stressful situations seemed to have been uncommon (<5%) in all three EA-types, compared to 9.5% reported in the 2016 WC-CBS (Statistics SA, 2016). The lower levels found in the WCSBS are supported to some extent by results of the South African Governance, Public Safety, and Justice Survey 2021/2022 (Maluleke, 2022), where it was reported that 81.3%
of the population felt safe walking alone in their neighbourhood during the day, although only 36% felt safe walking alone in their neighbourhood during the night. Anecdotally, the research team witnessed a few serious crimes including hijackings, and one team member was held up at gun point by three gun-wielding men, compelling us to put an extra layer of security in place to protect the teams. A comment made by Stein et al. (2015) (Drakenstein study) is worth mentioning: “here is some evidence of social capital in this cohort (e.g. many consider their partners a support), and a considerable number do not show evidence of psychological distress or depression. While clinical and public mental health interventions should be made available to those in need, it is also important to emphasise the resilience of the community and its members”.
The perinatal care and behaviour profile of mothers in the WCSBS while pregnant with the index child shows that almost all of them had attended antenatal care clinics (the number of visits was not asked). However, they did not receive perinatal care in the form of home visits by a healthcare worker. In the 2016 SADHS almost all (94%) women aged 15–49 who had a live birth in the five years before the survey received antenatal care from a skilled provider (doctor, nurse or midwife) (NDoH et al., 2018). A third of the mothers in the WCSBS were employed at the time of the birth of the index child, which is slightly less than the employment rate of caregivers at the time of the study. These mothers typically received less than four months maternity leave (63.4%).
Results on risky lifestyle behaviours among mothers in the WCSBS during their pregnancy with the index child show that 25.2% had smoked, 14.5% had used alcohol and 2.8% had used drugs. Mothers in the RT EA-type were most likely to have smoked (37.8%) and those living in the UI EA-type least likely to do so (6.5%). No provincial or national-level statistics are available for smoking, drinking and drug use during pregnancy. In a localised survey in the Drakenstein sub-district in the Western Cape on pregnant mothers attending either a public clinic serving a black African population or a public clinic serving a mixed-race population in a peri-urban area, it was found that their self-reported lifetime use of tobacco was 37%, alcohol 41%, and
cannabis 10% (Stein et al., 2015). In a study on risk factors for foetal alcohol syndrome in rural areas in the Western Cape, 20% of control mothers drank during pregnancy, which declined to 12.7% by the third trimester (87% of those who had a child with foetal alcohol syndrome had drunk during pregnancy). Moreover, smoking during pregnancy was higher for case versus control mothers (75.5% vs 30.3%) (May et al., 2005). Localised studies in other provinces confirm this trend. There were 18.7% of mothers of infants aged ≤12 months attending select health facilities in Gauteng who used tobacco and 3% who used alcohol during pregnancy (Modjadji & Pitso, 2021). Van Stuijvenberg et al. (2015) reported that 22.7% of mothers in a sample of 2–5-year-old children in a Northern Cape town (500 km from Cape Town) smoked during pregnancy, 2.7% used alcohol and 13.3% both smoked and used alcohol during pregnancy. Although these studies are not representative of the Western Cape population per se, it does support the notion that the presence of these risky behaviours among pregnant women is a major concern.
ECD opportunities provided to children at the HH level reflect an element of childcaring capacity/attitude (Engle et al., 1999). ECD indicators assessed in the total sample of children in the WCSBS showed that most children (82.3%) were not attending an ECCE facility and that 65% lived in HHs that did not own any children’s books (story or picture books). There was a divergence in the UI EA-type where the greater majority of HHs did not own a single children’s book (92.1%). In the 2016 WC-CBS it was recorded that 38.5% of children were attending an ECCE facility (Statsitics SA, 2016). Results from the NIDS–CRAM telephonic survey showed that 39% of adult respondents in their national sample who were living with 6-year-old or younger children had at least one child in the HH who had attended an ECCE facility in February 2020. This fell to 7% in July/August 2020, purportedly as a result of ECCE programme closures and lockdowns, but increased again to 28% in November/December 2020. In early February 2021 it dropped down to 7% again, after which it recovered significantly to 36% by April/May 2021 (Wills & KikaMistry, 2022). The recovery in the Western Cape under5-year-olds (17.7% attended an ECCE facility) seems to
have lagged behind.
Care has been defined as provision in the household and the community of time, attention and support (Engle et al., 1999). These researchers further indicated that the significance of care is best articulated in the UNICEF Framework for malnutrition (ibid.), supporting the value of investigating the determinants of malnutrition along the paths of the framework. Engle et al. (1999) listed the following resources that contribute to care: caregiver education, knowledge and beliefs (represents the capacity of the caregiver to provide appropriate care); caregiver physical health and nutritional status; caregiver mental health and self-confidence (represents self-confidence, and lack of stress and depression); autonomy and control of resources; workload and time availability; and family and community social support (facilitating conditions in the family and community). They conclude: “The concept of ‘care’ as an analytical construct is still new to many outside the nutrition field. Moreover, for those in the field, care is problematic from the measurement point of view” (Engle et al., 1999).
In the WCSBS we set out to use a completely novel approach by developing a Care Index to generate a “summary score” that reflects the integrated effects of care variables assessed. We retained 10 out of 25 indicators considered as potential care indicators after iterated PC analysis for the calculation of the Care Index (Supplementary materials S2.2). These were: maternal marital status, educational level, current employment, employment status, and age when the child was born; paternal educational level and current employment; child attendance of an ECCE facility and availability of children’s books in the household. Importantly, each of the retained variables contributed to the score, and thus to any associations found with dependent variables in regression analyses.
Care indicators that were considered, but were discarded in the iterated PG analysis process, include: head of household was male, received a child grant, one of the parents did not live in the house for at least four nights of the week, father was not employed, mother was unemployed, mother’s current age was less than 18 years, type of toys – homemade toys or toys from a shop, and the mother is currently pregnant.
Only 18% of infants in the study were exclusively breastfed, although most mothers did initiate breastfeeding at birth. This is well below the global target of increasing the exclusive breastfeeding to at least 50% during the first six months.

Overarchingly, the total sample of <5-year-old children in the Western Cape lived in a HH with piped water used for drinking and other purposes (92.5%), a flush toilet connected to a public sewerage system/septic tank (94.6%) and a fixed handwashing facility in the dwelling (75.7%); always had sufficient water (96.5%), and refuse was collected from the premises by a local authority (86.9%). There were a number of divergences for HHs in UI EA-types where children were more likely to not have access to piped water in the dwelling/ on site (47.7%), although they always seemed to have access to sufficient water (94.7%); were more likely to have a toilet facility elsewhere (49%); were more likely to be sharing this facility (65.5%); and were more likely to dispose of refuse in other ways, e.g. communal refuse dump/container (16.1%).
The water and sanitation profile that emerged from the WCSBS results is very much in line with that documented in the 2016 WC-CBS, where 93.2% had access to safe drinking water, only 7.1% experienced water interruptions and 93.4% had a flush toilet (Statistics SA, 2016).
As far as the hygiene indicators are concerned, children lived in HHs where the caregiver washed their hands before handling food (84.3%), before feeding the child (60.9%) and after going to the toilet (88.2%); the floor of the dwelling was clean (81%) and the clothes of the children themselves were clean (84.9%). HHs in UI EA-types diverged from this in that handwashing before handling food (67.9%) and feeding the child (28.2%) was less common, but the clothes of the child were most likely to be clean.
Since 1990 the WHO/UNICEF Joint Monitoring Programme for Water Supply, Sanitation and Hygiene have produced regular estimates of national, regional and global progress on drinking water, sanitation and hygiene (WASH), and have been instrumental in developing global norms to benchmark progress. In the WCSBS we used the WASH questions included in the Census 2022 questionnaire, but added questions on handwashing practices of the caregiver and cleanliness of the dwelling floor and clothes of the child on the day of the survey. As the present study was a baseline survey, assessment of progress in access to particular services/amenities was not an aim.
For the investigation of contributions of water availability, sanitation and hygiene to malnutrition in the Western Cape, we set out to use a novel approach by developing a WASH Index to generate a “summary score” that reflects the integrated effects of water availability, sanitation and hygiene variables assessed (Filmer & Pritchett, 2001). We retained 13 out of 22 variables considered as potential WASH indicators after iterated PC analysis for the calculation of the WASH Index (Supplementary materials S2.3).
Variables retained to calculate the WASH Index include: piped water inside the dwelling, piped water in the yard, handwashing facility available in the dwelling, handwashing facility available in the yard, soap/ detergent available for handwashing, water available for handwashing, flush toilet, toilet inside dwelling, toilet shared, bucket toilet, house floor clean, child’s clothes clean, main source of water from a neighbour’s/ public tap. Importantly, each of the retained variables contribute to the score and thus to any associations found with dependant variables in further analyses.
Variables considered but not used were handwashing behaviours of caregiver (before handling food, before feeding the child, after changing a nappy, after going to the toilet), and refuse removed at least once a week by local authorities.
5.6 INDICATORS REFLECTING UNDERLYING DRIVERS OF MALNUTRITION IN UNDER-5-YEAROLD CHILDREN IN THE WESTERN CAPE: WATER AVAILABILITY,
The BF picture that emerged for 0–<6-month-olds (n=69) is one of low prevalence of exclusive BF (18%), although 92.8% of these mothers had initiated BF and 72% were still BF at the time of the study. This is well below the global target of increasing the exclusive breastfeeding rate up to at least 50% during the first six months (2014 International Conference on Nutrition Rome Declaration on Nutrition and Post-2015 Development Agenda) (FAO/WHO, 2014), with only two more years to go to achieve the goal. Results from the SADHS 2016 showed that nationally 32% of children under 6 months old had been exclusively BF, with the average duration of exclusive BF being about 3 months (NDoH et al., 2018). Provincial-level information on exclusive BF is scarce. In a 2011 localised study in impoverished urban areas in Worcester, Western Cape, 6% (n=8) of the mothers BF exclusively at the time of the interview, while 94% (n=132) applied suboptimal breastfeeding practices (Goosen et al., 2014). In a later study in the same area 59% of mothers of <6-monthold infants (n=99) reported that the infant had received only breastmilk on the day of the interview (Mabaso et al., 2021a). However, this information does not necessarily reflect exclusive BF per se.
Mixed breastmilk and infant formula/animal milk feeding was practised by a fifth of mothers of 6-monthold infants in the WCSBS. The top five fluids other than breastmilk or infant formula given to non-exclusively BF infants were traditional herbal fluids (35.2%), plain water (32.1%), very thin, runny porridge (12.5%), sugar water (7.1%) and fruit juice (5.4%). The top five solid foods given were baby cereal (35.7%), butternut/ pumpkin (10.7%), sweet biscuits (7.1%) banana (5.3%) and apples/pears, potatoes, and other cereal (each 3.6%). According to the SANHANES-1 Survey, the average age for the introduction of solid food in the country was 4.5 months at the time (2012) (Shisana et al., 2014). Results from the 2016 SADHS showed that 14% of younger than 6-month-olds had consumed plain water, 1% non-milk liquids, 11% other milk, and
18% consumed complementary foods in addition to breast milk, while 25% were not breastfed at all (NDoH et al., 2018). In the mentioned 2011 survey in Worcester, water, formula milk and commercial infant cereal were introduced at a young age. In addition, more than two thirds of children were given solid or semi-solid food before the age of 6 months.
The overarching profile for 6-month–<5-year-old children in the WCSBS shows that BF had been initiated in the majority (92%). For these children BF was quite likely to have continued beyond 6 months of age, and for more than a third of the children it continued beyond 2 years of age. National 2016 statistics show that 84% of children born in the 2 years before the survey were ever BF, and that BF continued on average for more than 12 months in 0–35-month-old children (NDoH et al., 2018). The proportion of children in the WCSBS that had “ever been BF” is higher than estimates from the 2016 WC-CBS, where 80.4% of women aged 12–50 reported having breastfed their last child (Statistics SA, 2018). All 6–8-month-old children in the WCSBS sample were receiving complementary foods as recommended. Over 80% of the 6–8-month-old children in the 2016 SADHS received complementary foods (NDoH , 2018).
Key reasons given in the WCSBS for not ever having BF the child was that the mother did not have enough milk, that the baby did not want to take breastmilk and, concerningly, that the mother was advised not to BF by a health worker (14.3%). Key reasons for discontinuation of BF if it had been initiated were that the baby did not want to take breastmilk anymore, that the baby was old enough to no longer BF, that the mother did not have enough milk, and that she had to go back to work. Although others have identified numerous predictors for poor breastfeeding practices (Goosen et al., 2014; Siziba et al., 2015; Goon et al., 2021), no significant predictors of “not ever having BF the index child” were identified in the WCSBS.
Dietary indicators other than BF assessed in the WCSBS in children 6 months and older include dietary diversity, additional WHO/UNICEF indicators of healthy and unhealthy food choices, as well as the top ten most
consumed foods. Dietary quality assessments were based on a single semi-quantified recall of intake of items on a comprehensive food list over the past 24 hours. Results thus need to be interpreted bearing in mind that a single 24-hour recall does not necessarily reflect usual intake (Willett, 2013; UNICEF/ WHO, 2021a).
Dietary diversity has been shown to be positively associated with micronutrient adequacy and is thus deemed to be a good indicator of dietary quality (Molani-Gol et al., 2023). The overarching profile of dietary quality that emerged for 6-month–<5-year-old children is that it may not be sufficiently diverse (57.8% had a DDS<4). This is a worse situation than was found in the localised survey in Worcester where a third of 6–23-month-olds had an inadequate dietary diversity score (Mabaso et al., 2021a). Further food choice indicators show that 1 in 4 may not be consuming sufficient egg and/or flesh foods, 1 in 5 may not be consuming sufficient fruits/vegetables, and 7 in 10 may not be consuming sufficient milk products to meet calcium needs. Considering that a child should be consuming at least 320 g of vegetables and fruit every day (four servings of 80 g) (Naude, 2013), intake of this food group is most probably inadequate in 6-month–<5-year-old children in the Western Cape. This possibility is supported by dietary results from the PDIS-WC (calculated from an adjusted quantified 24-hour recall), which showed that fruit and vegetable intake was approximately 100 g/day in the 1–<6-yearold age range (Senekal et al., 2020). The per capita intake of dairy in the PDIS-WC was also low and decreased from 250g in 1–<3-year-olds to 83g in 3–<6-year-olds (ibid.).
Indicators reflecting poor food choices which are, per WHO/UNICEF (2021a) definition, not considered in the DDS show that 4 in 5 of 6-month–<5-year-old children consumed sweet food items, 3 in 5 salty/ fatty food items and 1 in 2 a SSB (fruit juice, cooldrink concentrate, fizzy drink) in the 24 hours preceding the study. This profile is confirmed by results on the top five foods most consumed by the children. These included salty/fatty crisps, e.g. Simba chips; sugar in tea/coffee or on porridge; and sweets or sweetened foods, e.g. sweet biscuits. Healthy foods such as eggs, flesh foods, dairy products, fruit and vegetables did not feature in the top five. Older children were more
likely to exhibit poor dietary behaviours. The top five foods consumed by 1–<6-year-old children in the PDIS (Western Cape and Gauteng combined) also included three unhealthy options, namely granulated sugar, fatty/salty crisps and SSB (Steyn et al., 2020).
Predictors of poor dietary diversity in the total group of 6-month–<5-year-olds in the WCSBS included a Wealth Index in the lowest tertile [OR(CI) 2.23(1.59–3.12)], and a child that had been hungry in the past week [OR(CI) 1.86(1.06–3.27)]. These two predictors were strongest in the 4–<5-year-old age group, with odds ratios being 3.07(1.90–5.00) and 3.32(1.09–10.14) respectively. Having an overweight/obese caregiver also increased the risk of poor dietary diversity [OR(CI) 1.69(1.12–2.45)]. Older age in the total group of 6-month–<5-year-old children protected against a poor dietary diversity [OR(CI) 0.78(0.67–0.90)].
Faber et al. (2017) reported that food secure HHs in resource-poor peri-urban areas of South Africa had a higher mean DDS and ate more vegetables. Interestingly, they also found that HHs that were receiving social grants were less likely to be food secure – no association between DDS and receiving a child grant was apparent in the WCSBS. Faber et al. (2016) found that less than 25% of 6–24-monthold infants in low socio-economic areas of KwaZuluNatal consumed four or more different food groups, with no urban–rural differences (Faber et al., 2016). The phenomenon of having an undernourished child – including a poor dietary diversity, in a HH where the mother is obese – has been well documented in South Africa and elsewhere (Modjadji & Madiba, 2019; Popkin et al., 2020).
Health status indicators other than anthropometric measures included in the WCSBS were gestational age, birthweight and immunisation status obtained from the RtHB, as well as presence of diarrhoea and respiratory tract infections in the two weeks preceding the interview.
It could be feasible to reduce the stunting prevalence in the Western Cape by 7.2% or more from 2022 to 2030 if current initiatives continue, and with this reduce the prevalence in the province from the medium- to low public health level of concern category.
The overarching health indicator profile for the total WCSBS sample shows that they were born at a gestational age of more than 38 weeks; had a birthweight above 3kg, although 17.8% were classified as having had a low birthweight; that their immunisation status was up to date for their age (72.3% of the sample); and that they did not have either diarrhoea (94.1%) or a respiratory tract infection (96.1%) during the two weeks preceding the study. This profile diverged in the RT EA-type where the child was most likely to have been classified as having had a low birthweight (24.4%). It is further important to note that 13.7% of children for whom immunisation information was available were incompletely immunised.
WCSBS immunisation results show substantially better coverage than in the 2016 SADHS, where only 49.9% of 1-<2-year-olds and 43.5% of 2-<3-year-olds had received all age appropriate vaccinations (NDoH, 2018). In the 2 weeks before the SADHS interviews, 3% of children under 5 had symptoms of acute respiratory infection and 10% had diarrhoea. Similar provincial-level information was not reported in the SADHS report (NDoH, 2018)..
Individuals who were born prematurely, with low birthweight, or small for gestational age are not only at risk of stunting, but have also been shown to present a set of permanent changes that make them more susceptible to develop chronic NCDs, specifically cardiometabolic and glucose metabolism disorders (de Mendonça et al., 2020). The strongest predictor of low birthweight in the WCSBS was a gestational age of <37 weeks in the 6-month–<5-year-olds [OR(CI) 3.81(2.42–5.96)]. Tobacco use, alcohol consumption and illicit drug abuse have been shown to increase the risk of low birthweight, with smoking being the biggest risk (Negrato & Gomez, 2013; Quelhas et al., 2018). It is thus a major concern that smoking during pregnancy emerged as a significant risk for low birthweight in 6-month–<5-year-olds in the WCSBS [OR(CI) 1.73(1.14–2.65)]. Further risks for a low birthweight in the WCSBS were having a low income in 2–<5-year-olds [OR(CI) 1.74(1.04–2.91)] and in the
2–<3-year-olds a Care Index in the lowest tertile [OR(CI) 3.16(1.34–7.44)]. Associations between low-income – which may result in insufficient nutrition, maternal care and caring capacity – and low birthweight have been reported by others (Islam Pollob et al., 2022). A protector against both low birthweight and incomplete immunisation status in 6-month–<5-yearolds was having an overweight/obese caregiver, which was mostly the mother of the child [OR(CI) 0.64(0.42–0.99) and OR(CI) 0.64(0.44–0.93) respectively].
Predictors of incomplete immunisation status in 6-month–<5-year-olds were food insecurity, i.e. ran out of money for food [OR(CI) 1.96(1.25–3.08)], and a child went hungry in the past week [OR(CI) 2.05(1.15–3.52)], as well as a child who was never BF [OR(CI) 2.6(1.33–5.12) in 2–<5-year-olds] and living in an UI EAtype [OR(CI) 2.17(1.26–3.73)]. In a recent systematic review on reasons given for non-vaccination and under-vaccination of children and adolescents in sub-Saharan Africa, the most common reasons given were related to caregiver’s time constraints, lack of knowledge regarding vaccination, the unavailability of vaccines/personnel in healthcare facilities, missed opportunities for vaccination, caregiver’s fear of minor side effects, poor access to vaccination services and caregiver’s vaccination beliefs (Périères et al., 2022).
Investigation of potential drivers of malnutrition in under 5-year-old children in the WCSBS was conducted along the pathways depicted in the UNICEF Framework for the development of malnutrition (UNICEF, 1990), as well as the adapted version thereof by Black et al. (2020) (Conceptual Framework for surviving and thriving of children) using multiple logistic regression analysis. As dietary diversity cannot be calculated for infants under 6 months old, this age group was not included in these regression analyses. The calculated VIF were all below 2.0, confirming the absence of collinearity between variables included in the final regression models.
Low birthweight is a predictor of stunting in under-5-year-old children.
Indicators included in the regression model for identifying drivers of stunting in 6-month–<5-yearold children in the Western Cape were total income; Wealth Index tertiles; food security questions (household run out of money during the past months and child experienced hunger during the past week); Care Index tertiles; receiving a child grant; maternal smoking, alcohol and drug use during pregnancy; WASH Index tertiles; birthweight; immunisation status; ever BF; poor DDS (<4) and unhealthy food choices not considered in the calculation of the DDS, i.e. sugar, sweet and salty/fatty foods. As significant differences between the three EA-types were evident for many of the variables, EA-type was also included in the regression model. Results show that underlying and direct drivers as set out in the UNICEF model (UNICEF, 1990) were in play.
Poverty has long been associated with poor health outcomes for children in South Africa (Willey et al., 2009; Faber et al., 2016). A Wealth Index in the lowest tertile – which comprised a score calculated from 10 household possessions, dwelling type, main energy source for cooking, Internet access and number of rooms in the dwelling – increased the risk of stunting in 6-month–<5-year-olds [OR(CI) 1.74(1.13–2.67)].
Total income (R0–<R3 200) and food-security indicators (ran out of money for food in the past month and hunger at household or child level) were not found to be drivers of stunting. The lack of association between income with HH/child hunger with stunting, despite being predictors of dietary diversity, may be linked to the low prevalence HH/child hunger in the study sample (9.4% and 5.5% respectively). However, the association between stunting and the Wealth Index emphasises that poverty is still one of the drivers of stunting in the Western Cape. Living in the RT EAtype in the total group of 6-month–<5-year-olds was a driver of stunting [OR(CI) 1.73(1.04–2.87)] , indicating that interventions targeting small towns in rural areas may need specific attention when considering the way forward with intervention strategies.
Nurturing care comprises stable environments that promote children’s health and nutrition, protect from threats, provide opportunities for learning, and
responsive, emotionally supportive, developmentally enriching relationships (Engle et al., 1999; Black et al., 2021). A Care Index score in the lowest tertile was found to be a driver of stunting in the WCSBS in the total group of 6-month–<5-year-olds [OR(CI) 1.58(1.06–2.35)] and, specifically, in the vulnerable 6-month–<2year-olds [OR(CI) 2.08(1.05–4.14)]. Children in the later age group are in the critical 1 000-day window of care and development and are highly dependent on adults for all their physical and emotional requirements (Black et al., 2021). Results from a case-control study by de Villiers and Senekal (2002) in 12–24-month-old children attending a day-hospital in an urban informal area in the Eastern Cape, South Africa, confirms the fact that a combination of caregiving influences need to be addressed to improve caring capacity. They reported that risks for growth failure were a mother who: was not the head of the household, was not involved in disciplining her children, was not born in a city, was not able to write or read isiXhosa, had a school education of level of less than Grade 9, had not received nutrition education, smoked and drank beer regularly, showed little interest in her child or had a poor caring attitude towards her child. A further risk was if the child’s clothes were dirty. In the Birth to Twenty study in Johannesburg, protectors of stunting were found to be having an employed mother and having a father who had completed secondary school (Willey et al., 2009).
Indicators retained for calculation of the Care Index score include maternal marital status (not married), educational level (low), current employment (not employed), employment status at the birth of the child (unemployed) and mother’s age when the child was born (>30 years); paternal education (low) and current employment (unemployed); child attendance of an ECCE facility (not attending) and availability of books for children in the household (none). Interventions should therefore aim to address all these risks to provide young children with optimal opportunity to grow and develop. Research shows that interventions which target responsive caregiving and learning among infants with early risks have benefits that extend into adulthood (Black et al., 2021). Improvements in stunting risk in Nigeria from 2011 to 2014 were linked to improvements in nine stunting determinants, including maternal BMI, maternal height, ≥4 antenatal care visits, health facility delivery, reduced child illnesses,
Dietary diversity of half of 6-month–<5-year-olds in the Western Cape is poor: 1 in 5 may not be consuming sufficient egg and/or a flesh food, 1 in 5 may not be consuming sufficient fruits/vegetables, and 7 in 10 may not be consuming sufficient milk products to meet calcium needs.
an asset (Wealth) index, maternal education, paternal education, and preceding birth interval (Adeyemi et al., 2022). Interventions should consider that parents and families rely on communities, services, policies, and laws to support their physical and mental health, safety, access to services and opportunities to obtain financial stability (Black et al., 2021).
The WCSBS results clearly illustrate the risk maternal smoking as well as alcohol and drug use during pregnancy hold for the growth of the foetus and beyond. All three behaviours increased the risk of stunting in the total group of 6-month–<5-year-olds [smoking: OR(CI) 1.60(1.07–2.14); alcohol use OR(CI) 1.79(1.19–2.69); drug use: OR(CI) 1.59(1.05–2.40)], reflecting a specific long-term risk beyond the first 1 000-day window. The association between smoking and stunting has been reported by many others, with a recent systematic review concluding that tobacco use during pregnancy may represent a major preventable cause of impaired child growth (Quelhas et al., 2018). It is important to note that risky behaviours (smoking, drinking and drug use) remained as independent predictors in the multiple regression analysis, even though they were also predictors of low birthweight (as indicated above, the VIF confirmed absence of collinearity). We speculate that the mentioned risky behaviours would be very likely to continue after the birth of the child, impacting childcaring capacity in various ways. In support of this contention, a recent meta-analysis found that children exposed to parents who consume alcohol (both dependent and non-dependent), tobacco, or other psychoactive drugs experience a detrimental long-term effect on their well-being (Kuppens et al., 2020). Identification of lifestyle correlates of exclusive breastfeeding practices among mothers on ART in the Eastern Cape, South Africa, showed that mothers who consumed alcohol were less likely to practice exclusive BF for 6 months [OR 0.54 (0.34–0.85)] (Goon et al., 2021).
It is well established that poor WASH conditions may contribute to child stunting, with pathways contributing to this association including promotion and maintenance of the infection–diarrhoea–malnutrition cycle diseases, poor socio-economic conditions and time constraints to childcare practices (Dominguez, 2017). In the WCSBS, WASH indicators
reflected good coverage of water availability, access to a flush toilet, availability of water at all times, and hygiene practices in the majority of households (Section 4.6). However, it is evident that in households where the WASH Index score was in the lowest tertile, the risk of stunting was increased in the 2–<3-yearolds [OR(CI) 2.54(1.21–5.34)], which may have been the result of one or more of the above-mentioned mechanisms (Dominigue, 2017). This result illustrates that when WASH conditions are not optimal, it could be a driver of stunting.
Although key determinants of stunting, such as wealth quintiles, maternal age and educational level, the child’s birthweight and place of residence, are well recognised, the relative contributions of these are influenced by contextual factors (Slemming et al., 2015). Low birthweight and incomplete immunisation status were confirmed as drivers of stunting in 6-month–<5-year-old children in the WCSBS [OR(CI) 2.47(1.65–3.71) and OR(CI) 1.89(1.19–2.99) respectively].
Multivariate regression analysis of data from the Birth to Twenty Plus longitudinal birth cohort study in Johannesburg, South Africa, showed that a higher birthweight was protective against stunting for both sexes. In their examination of stunting in 2–5-year-old children in an impoverished area in the Northern Cape, in South African, van Stuijvenberg et al. (2015) found that birthweight correlated significantly with heightfor-age Z-scores.
Malnutrition stems from dietary patterns that are not diverse and nutrient dense, consequently resulting in energy and nutrient intakes that do not meet requirements/recommendations. However, neither having never been BF nor poor dietary diversity emerged as drivers of stunting in the WCSBS in any age grouping. This result could be linked to the methodology used to determine dietary diversity, which reflects intake of indicator food groups during the previous 24 hours (adapted WHO/UNICEF 2021 method for infants and young children). As mentioned, this information does not necessarily reflect the children’s current usual intake, nor their intake since birth. However, in the recent localised study in Worcester, a DDS <4 was found to predict stunting in 6–23-month-old children [OR 2.0 (1.18–3.39)], using a similar but less comprehensive method than applied in the WCSBS.
Irrespective of the finding that dietary diversity per se did not predict stunting, the poor diversity in more than half of the 6-month–<5-year-olds is a major concern. The poor diversity can be explained by insufficient frequency of intake of flesh foods/eggs, fruit, vegetables and dairy, combined with frequent intake of unhealthy foods. Although fortification of bread and maize flour may address some of the micronutrient deficiencies inherent to this type of dietary pattern, it does not address the risk of micronutrient deficiencies not included in the fortification mix, for example calcium, vitamin C and other antioxidants present in fruit and vegetables (Senekal et al., 2020). Faber et al. (2016) came to a similar conclusion after investigating the association between stunting and dietary diversity in 6–24-month-old children in urban and rural KwaZuluNatal. “Fewer than 25% of children consumed ≥4 food groups, with no urban/rural differences. Higher dietary diversity was associated with higher nutrient density for protein and several of the micronutrients including calcium, iron, and zinc. The poor nutrient density for key micronutrients can probably be ascribed to lack of dietary variety, and little impact of mandatory fortification of maize meal/wheat flour on infants/ toddlers’ diet.” Improvement of dietary diversity and ensuring that healthy food choices appear in the top five most commonly consumed foods, must be placed on a priority agenda for prevention of stunting (and overweight/obesity) in under-5-year-old children in the Western Cape.
Key obesity risk factors in the first 1 000 days that have been reported to be associated with later childhood obesity include higher maternal pre-pregnancy BMI, prenatal tobacco exposure, excess gestational weight gain, high infant birthweight, accelerated infant weight gain, childcare attendance, low strength of maternal–infant relationship, low socio-economic status, inappropriate bottle use, introduction of solid foods before 4 months of age, and infant antibiotic exposure (Woo & Martin, 2015).
In the WCSBS, the drivers of overweight/obesity in the 6-month–<5-year-olds included an overweight/obese caregiver [OR(CI) 1.88 (1.21–2.91)], specifically also in the 2–<3-year-old. Besides hereditary factors that may explain the link between childhood obesity and caregiver BMI (more than half of caregivers, whether
a mother, father or grandmother were overweight or obese), it is also plausible that unhealthy dietary patterns (energy dense and nutrient poor) of the adults resulted in similar patterns in the children. The results of unhealthy food choices (sugar, sweet and salty/fatty food items) and the most consumed foods in the study sample outlined in a previous section, support the presence of unhealthy dietary patterns.
The effect of BF practices on overweight/obesity risk in the WCSBS sample is evident from the finding that 6-month–<2-year-old children who had not ever been BF were at increased risk of overweight/obesity [OR(CI) 2.95(1.36–6.40)]. However, this association needs to be interpreted with caution, as evidence is still controversial and underlying mechanisms unclear (Marseglia et al., 2015). One possible explanation in our study may lie in the finding that in the same age group, having consumed sugar in tea/coffee or on porridge also increased the risk of overweight/obesity [OR(CI) 2.21 (1.23–3.95)]. This may reflect a feeding pattern where children are, for example, not receiving breastmilk, with one of the replacement drinks given being tea or coffee with sugar, contributing to higher energy but lower nutrient density.
Contrary to the notion that a low birthweight is a risk factor for childhood overweight/obesity (REFS), this indicator was protective against overweight/obesity in the WCSBS [OR(CI) 0.38(0.19–0.78)].
Smoking, alcohol use and drug use during pregnancy reflects a specific long-term risk. These behaviours need urgent attention to reduce the risk of stunting in the Western Cape.


The key conclusion of the WCSBS is that a double burden of malnutrition, stunting and overweight/ obesity remains a concern in the province. The prevalence of stunting in the WCSBS (17.5%) was close to the upper cut-off of the medium publichealth-concern category of 10–19% for 0–59-monthold children. Stunting in the very vulnerable <2-yearold age group was 19.7%, pushing it into the high public-health-concern category for this age group. The prevalence of underweight (5.6%) was just above the lower cut-off of the medium (5–9%) and wasting (3.4%) in the low (2.5–<5%) public-healthconcern categories for 0–59-month-old children. The prevalence of overweight (15.1%) fell in the very high public-health-concern category of ≥15%. Stuntingoverweight was not common at 2.4%.
The WHO/UNICEF’s (2021) goal is to reduce stunting prevalence in under 5-year-olds by 50% by 2030 (WHO/UNICEF, 2021). The 2022 prevalence of stunting in under 5-year-olds in the Western Cape of 17.5% (WCSBS) is considerably lower than the national prevalence of 27.4% reported in the 2016 SADHS, and is also 5.4% lower than the 22.9% reported for under-five year-olds in the Western Cape in the 2016 SADHS (NDoH, 2018). Moreover, the 2022 prevalence of stunting in the 1 to under 5-year-old children in the WCSBS was 18.2% compared to the 20.8% found in
the Western Cape arm of the 2018 Provincial Dietary Intake Survey (PDIS) in the same age group, also reflecting a declining trend in the province. To date, only the 2016 SADHS reported on stunting in children under 6-months-old, where it was found that 32.3% was stunted (NDoH et al., 2018). In the WCSBS the prevalence was 25.2%, thus 7.1% lower than the 2016 national prevalence. Stunting levels in the Western Cape therefore seem to be much lower than in the rest of the country, and further reflect a decreasing trend over the past six years, despite the outbreak of COVID-19 in 2020. This could indicate that the various interventions that have been put in place by the Western Cape Government, civil society organisations and others to address stunting seem to be making a difference. With a 5.4% reduction in stunting over a six-year period (2016 SADHS to 2022 WCSBS), it could be feasible to reduce the stunting prevalence in the Western Cape by another 7.2% or more from 2022 to 2030, reaching a prevalence of 10.3% or less. To achieve this outcome, current interventions need to continue, and any essential additional initiatives that are identified from deliberations of the WCSBS results by all stakeholders, should be implemented. This could reduce the prevalence of stunting to the low public health level of concern category (prevalence =2.5% -<10%).

The value the WCSBS adds is not only a profile of stunting in under-5-year-old children, but also current drivers of the condition. These include:
› A Wealth Index in the lowest tertile in the total group of 6-month–<5-year-olds [OR(CI) 1.74(1.13–2.67)]. The Wealth Index comprised a score that reflects 10 indicators covering household possessions, dwelling type, main energy source for cooking, Internet access and number of rooms in the dwelling. Initiatives to address poverty in the Western Cape should thus continue to reduce stunting prevalence.
› A Care Index score in the lowest tertile in the total group of 6-month–<5-year-olds [OR(CI) 1.58(1.06–2.35)], and specifically in the vulnerable 6-month–<2-year-olds [OR(CI) 2.08(1.05–4.14)]. This novel Care Index comprised a score that reflects maternal marital status, educational level, current employment, employment status and age when the child was born; paternal educational level and current employment; child attendance of an ECCE programme and availability of children’s books in the household. Importantly, each of the retained variables contributed to the score, and should be addressed in stunting prevention initiatives.
› A WASH Index score in the lowest tertile in the 2–<3-year-olds [OR(CI) 2.54(1.21–5.34)]. This novel WASH Index score reflects indicators in the dwelling, inclusive of piped water inside the dwelling, piped water in the yard, handwashing facility available in the dwelling, handwashing facility available in the yard, soap/detergent available for handwashing, water available for handwashing, flush toilet, toilet inside dwelling, toilet shared, bucket toilet, house with clean floor, child with clean clothes, main source of water from a neighbour’s/public tap. This particular risk may be more prominent in the UI EA-type.
› Smoking, alcohol use and drug use during pregnancy in the total sample of 6-month–<5year-olds as reflected in the respective ORs [smoking OR(CI) 1.60(1.07–2.14); alcohol use OR(CI) 1.79(1.19–2.69); drug use: OR(CI) 1.59(1.05–2.40)]. This also reflects a specific long-term risk beyond the first 1 000-day window of these risky lifestyle behaviours. These behaviours need urgent attention to reduce the risk of stunting in the Western Cape.
› Low birthweight in the total group of 6-month–<5year-olds [OR(CI) 2.47(1.65–3.71)]. Predictors of low birthweight were a gestational age of <37 weeks [OR(CI) 3.81(2.42–5.960], smoking during pregnancy [OR(CI) 1.73(1.14–2.65)], having a low income [OR(CI) 1.74(1.04–2.91)] and Care Index in the lowest tertile [OR(CI) 3.16(1.34–7.44)].
› Incomplete immunisation in the total group of 6-month–<5-year-olds [OR(CI) 1.89(1.19–2.99)]. Predictors of an incomplete immunisation status were: caregiver ran out of money for food [OR(CI) 1.96(1.25–3.08)], a child went hungry in the past week [OR(CI) 2.05(1.15–3.52)], a child who was never breastfed [OR(CI) 2.6(1.33–5.12)] and living in an UI EA-type [OR(CI) 2.17(1.26–3.73)].
› Living in the RT EA-type in the total groups of 6-month–<5-year-olds [OR(CI) 1.73(1.04–2.87)].
The latter two results may indicate that interventions targeting children living in RT and UI EA-types may need specific attention when considering the way forward with intervention strategies.
No dietary variables were found to be drivers for stunting in the WCSBS. Only 18% were being exclusively BF, although most mothers did initiate BF at birth. Key reasons for not ever having BF the child was that the mother did not have enough milk, that the baby did not want to take breastmilk and, concerningly, that the mother was advised not to BF by a health worker. There were no predictors for “not ever having BF a child”.
Dietary quality results show that the dietary diversity of 1 in 2 of the total group of 6-month–<5-year-olds is poor, that 1 in 5 may not be consuming sufficient egg and/or a flesh food, 1 in 5 may not be consuming sufficient fruits/vegetables, and 7 in 10 may not be consuming sufficient milk products to meet calcium needs. Furthermore 4 in 5 of 6-month–<5-year-old children consumed sweet food items, 3 in 5 consumed salty/fatty food items and 1 in 2 consumed an SSB in the 24 hours preceding their interview. Predictors of poor dietary diversity in 6-month–<5-year-olds included a Wealth Index in the lowest tertile [OR(CI) 2.23(1.59–3.12)], and a child that had been hungry in the past week [OR(CI) 1.86(1.06–3.27)].
Although the key focus of the WCSBS was on stunting, the WHO/UNICEF’s (2021b) goal is also to reduce the prevalence of overweight/obesity in children to less than 3% by 2030 (WHO/UNICEF, 2021b). With the prevalence of overweight in the WCSBS sample in the very high public-health-concern category of ≥15%, it should not be ignored, especially as interventions focused on reducing stunting prevalence may inadvertently promote obesity risk in this target population (Tzioumis et al., 2016).
Current drivers of overweight/obesity identified using multiple logistic regression analyses in the study sample include:
› An overweight/obese caregiver [OR(CI) 1.88(1.21–2.91)], specifically also in the 2–<3-year-olds [OR(CI) 2.21(1.31–3.71)]. Caregivers were the mother (71%), grandmother, father or another family member, and more th an 50% were overweight or obese. The publication of the updated edition of the 2015–2020 Strategy for the Prevention and Control of Obesity in South Africa is a matter of urgency, as the target of reducing obesity by 10% by 2020 has clearly not been achieved, which, in turn, also impacts negatively on the prevention and control of obesity in children.
› Not ever BF in 6-month–<2-year-olds [OR(CI) 2.95(1.36–6.40)], reflecting the importance of initiatives to promote initiation of BF, excusive BF up to 6 months old and continued BF with the addition of healthy and age-appropriate complementary foods.
› Having consumed sugar in tea/coffee or on porridge in 6-month–<2-year-olds [OR(CI) 2.21(1.23–3.95)]. The fact that this risk factor remained as an independent risk in the multivariate regression model emphasises the gravity of this situation; sugar was given regularly to young children in the WCSBS, and it predicted overweight/obesity in under-2-year-olds.
Initiatives to address poverty in the Western Cape should continue to reduce stunting
prevalence.


STRENGTHS of this study include the rigorous sampling structure and execution thereof, resulting in a sample of under-5-year-old children that is representative of this target population. Results in terms of the malnutrition profile and drivers thereof that were identified using multivariate regression models are thus robust and a good baseline for monitoring changes in the malnutrition profile of children in the Western Cape, while also providing good insights in current predictors of both stunting and overweight/obesity that can advise critical assessment of current interventions and the need for, and nature of, additional measures that need to be put in place. A further strength is the richness of the data collected that enabled us to reflect on the drivers
of malnutrition along the pathways of the UNICEF Framework for malnutrition. For these purposes we also developed indices to investigate the three underlying drivers of malnutrition in children, namely a Wealth Index (assets and wealth status) and two novel indices, one that reflects mother and childcare/ caregiving capacity (Care Index) and the other that reflects water availability, sanitation and hygiene in the household (WASH Index). The majority of questions included in the research questionnaire were from internationally standardised instruments for the target age group, which were adapted for use in South Africa as recommended, e.g. the WHO/UNICEF infant and young child feeding questionnaire, as well as the 2022 Census questionnaire.
LIMITATIONS of the study include that two important childhood health intervention indicators, namely whether the vitamin A supplementation was on track and receival of deworming medications were up to date, were not assessed. Finally, as is the challenge in surveys that are dependent on self-reported information, a level of respondent bias may have been present. However, we attempted to minimise this limitation with rigorous training of fieldworkers and quality control measures.


Numerous interventions to prevent and control malnutrition in under-5-year-old children in the Western Cape are presently in place, and, as indicated in the conclusion section, may have resulted in reducing the prevalence of stunting, but not necessarily overweight/obesity.

The two key recommendations for taking this work forward are:
Build a current map of all initiatives/interventions –whether governmental, NPOs, NGOs, universities and research organisations such as the HSRC and SAMRC – that aim to improve the nutritional status, ECD and general well-being of under-5-year-old children, and capture the goals, strategies, ground-level actions, outcomes and lessons learnt for each of the initiatives.
Conduct a series of workshops with multisectoral stakeholders to consider the outcomes and recommendations of this research within the context of the current intervention map to plan the way forward to address the malnutrition risks for under-5-year-old children identified in the WCSBS.


ACC/SCN (Administrative Committee on Coordination/ Standing Committee on Nutrition). 2000. Fourth report on the world nutrition situation: nutrition throughout the life cycle. Geneva, ACC/SCN in collaboration with IFPRI. http://www.ifpri.org/sites/default/files/pubs/pubs/ books/4thrpt/4threport.pdf
Adeyemi, O., Toure, M., Covic, N., van den Bold, M., Nisbett, N., Headey, D. 2022. Understanding drivers of stunting reduction in Nigeria from 2003 to 2018: a regression analysis. Food Security, 14, pp. 995–1011. https://doi.org/10.1007/s12571-022-01279-8
Amusa, L.B., Bengesai, A.V., Khan, H.T. 2022. Childhood stunting and subsequent educational outcomes: a marginal structural model analysis from a South African longitudinal study. Public Health Nutrition, 25(11), pp. 3016–3024.
Andresen, E.M., Malmgren, J.A., Carter, W.B., Patrick, D.L. 1994. Screening for depression in well older adults: evaluation of a short form of the CES-D (Center for Epidemiologic Studies Depression Scale). American Journal of Preventive Medicine, 10(2), pp. 77–84.
Baron, E.C., Davies, T., Lund, C. 2017. Validation of the 10-item Centre for Epidemiological Studies Depression Scale (CES-D-10) in Zulu, Xhosa and Afrikaans populations in South Africa. BMC Psychiatry, 17(6). https://doi.org/10.1186/s12888-016-1178-x
Black, M.M., Trude, A.C.B., Lutter, C.K. 2020. All children thrive: integration of nutrition and early childhood development. Annual Review of Nutrition, 40, pp. 375–406. https://doi.org/10.1146/annurevnutr-120219-023757
Black, M.M., Behrman, J.R., Daelmans, B. et al. 2021. The principles of nurturing care promote human capital and mitigate adversities from preconception through adolescence. BMJ Global Health, 6(4), p.e004436.
Bridgman, G., van der Berg, S., Patel, L. 2020. Hunger in South Africa during 2020: results from wave 2 of NIDS–CRAM. Stellenbosch economic working papers: a working paper of the Department of Economics and the Bureau at the University of Stellenbosch. Stellenbosch Department of Economics, University of Stellenbosch, ZDB-ID 3048846-1. Vol. WP, 25.
Casale, D. 2016. Analysing the links between child health and education outcomes: evidence from NIDS waves 1–4. South Africa Labour and Development Research Unit: University of Cape Town.
Cashin, K., Oot, L. 2018. Guide to anthropometry: a practical tool for program planners, managers, and implementers. Washington, DC: Food and Nutrition Technical Assistance III Project (FANTA)/FHI 360.
Cullen, C. 2022. Method matters: the underreporting of intimate partner violence. The World Bank Economic Review, 37(1), pp. 49–73.
Davis, J.W., Parks, S.N., Kaups, K.L., Bennink, L.D., Bilello, J.F. 2003. Victims of domestic violence on the trauma service: unrecognised and underreported. Journal of Trauma and Acute Care Surgery, 54(2), pp. 352–355. https://doi.org/10.1097/01 TA.0000042021. 47579.B6
de Mendonça, E.L.S.S., de Lima Macêna, M., Bueno, N.B., de Oliveira, A.C.M., Mello, C.S. 2020. Premature birth, low birth weight, small for gestational age and chronic non-communicable diseases in adult life: a systematic review with meta-analysis. Early Human Development, 149, p. 105154.
de Onis, M., Lobstein, T. 2010. Defining obesity risk status in the general childhood population: which cut-offs should we use? International Journal of Pediatric Obesity, 5(6), pp. 458–460. https://doi.org/10.3109/17477161003615583
de Onis, M. and Branca, F. 2016. Childhood stunting: a global perspective. Maternal & Child Nutrition, 12, pp. 12–26.
de Villiers, A., Koko-Mhlahlo, K., Senekal, M. 2005. Nutritional well-being of young children in Duncan Village, East London, South Africa: accessibility of primary health care clinics. Public Health Nutrition, 8(5), pp. 520–532.
de Villiers, A., Senekal, M. 2002. Determinants of growth failure in 12–24-month-old children in a high-density urban slum community in East London, South Africa. European Journal of Clinical Nutrition, 56(12), pp. 1231–1241.
Dhansay, A., Labadarios, D., Nel, J., Nannan, N., Laubscher, R., Bradshaw, D. 2018. The dual burden of maternal and child malnutrition: evidence from national surveys in South Africa over a decade. In: International Symposium on Understanding the Double Burden of Malnutrition for Effective Interventions. IAEA, Ed., Book of Abstracts: Vienna, Austria, p. 396.
Dominguez, E.I. 2017. A practical package for stunting reduction action against hunger – July 2017 Global Health Professional, Action Against Hunger https://www. globalwaters.org/resources/assets/babywash-and-1000days-practical-package-stunting-reduction
Engle, P.L., Menon, P., Haddad, L. 1999. Care and nutrition: concepts and measurement. World Development, 27(8), pp. 1309–1337.
Faber, M., Laubscher, R., Berti, C. 2016. Poor dietary diversity and low nutrient density of the complementary diet for 6‐to 24‐month‐old children in urban and rural KwaZulu‐Natal, South Africa. Maternal & Child Nutrition, 12(3), pp. 528–545.
Faber, M., Wenhold, F.A., Laurie, S.M. 2017. Dietary diversity and vegetable and fruit consumption of households in a resource-poor peri-urban South African community differ by food security status. Ecology of Food and Nutrition, 56(1), pp. 62–80.
Food and Agriculture Organization (FAO). 2021. Minimum dietary diversity for women. Rome. https://doi.org/10.4060/ cb3434en.
FAO/WHO. 2014. Second International Conference on Nutrition, Rome, 19–21 November. Conference Outcome Document: Rome Declaration on Nutrition. file:///C:/Users/ User/Downloads/a-ml542e%20(1).pdf
Filmer, D., Pritchett, L. 2001. Estimating wealth effects without expenditure, data or tears: with an application to educational enrollments in the states of India. Demography, 38, pp. 115–132.
Goon, D.T., Ajayi, A.I., Adeniyi, O.V. 2021. Sociodemographic and lifestyle correlates of exclusive breastfeeding practices among mothers on antiretroviral therapy in the Eastern Cape, South Africa. International Breastfeeding Journal, 16(18). https://doi.org/10.1186/s13006-021-00366-4
Goosen, C., McLachlan, M.H., Schübl, C. 2014. Infant feeding practices during the first 6 months of life in a low-income area of the Western Cape Province. South African Journal of Child Health, 8(2), pp. 50–54.
Hall, K., Sambu, W., Berry, L., Giese. S., Almeleh, C. 2017. South African Early Childhood Review. file:///C:/Users/User/ Downloads/SA-ECR2017_web.pdf
Harper, A., Goudge, J., Chirwa, E., Rothberg, A., Sambu, W., Mall, S. 2022. Dietary diversity, food insecurity and the double burden of malnutrition among children, adolescents and adults in South Africa: findings from a national survey. Frontiers in Public Health, p. 2952. https://doi.org/10.3389/ fpubh.2022.948090
Heidkamp, R.A., Piwoz, E., Gillespie, S., et al. 2021. Mobilising evidence, data, and resources to achieve global maternal and child undernutrition targets and the Sustainable Development Goals: an agenda for action. The Lancet. https:// doi.org/10.1016/S0140-6736(21)00568-7
Henry, J., Giese, S. 2022. An exploration of updated Thrive by Five Index stunting rates in children aged 50–59 months enrolled in Early Learning Programmes in South Africa 2022. https://thrivebyfive.co.za/insights/
Islam Pollob, S.A., Abedin, M.M., Islam, M.T., Islam, M.M., Maniruzzaman, M. 2022. Predicting risks of low birth weight in Bangladesh with machine learning. PLOS ONE, 17(5), p.e0267190.
Kaur, J., Lamb, M.M., Ogden, C.L. 2015. The association between food insecurity and obesity in children: The National Health and Nutrition Examination Survey. Journal of the Academy of Nutrition and Dietetics, 115(5), pp. 751–758.
Kuppens, S., Moore, S.C., Gross, V., Lowthian, E., Siddaway, A.P. 2020. The enduring effects of parental alcohol, tobacco, and drug use on child well-being: a multilevel meta-analysis. Development and Psychopathology, 32(2), pp. 765–778.
Labadarios D., Steyn, N.P., Maunder, E.M.W., et al. 2005 The National Food Consumption Survey (NFCS): South Africa, 1999. Public Health Nutrition, 8(5), pp. 533–543.
Labadarios, D., Swart, R., Maunder, E.M.W. et al. 2008. Executive summary: National Food Consumption Survey: Fortification Baseline (NFCS–FB) South Africa. South African Journal of Clinical Nutrition, 21(3), pp. 246–300.
Maluleke, R. 2022. Governance, public safety, and justice survey 2021/2022, Statistics SA. https://www.statssa.gov. za/publications/P0340/GPSJS
Marseglia, L., Manti, S., D’Angelo, G. et al. 2015. Obesity and breastfeeding: The strength of association. Women and Birth, 28(2), pp. 81–86.
Mata, L. 1979. The malnutrition–infection complex and its environment factors. Proceedings of the Nutrition Society, 38(1), 29-40. https://doi.org/10.1079/PNS19790006
Mabaso, K.M., Lenhoff, A., Eley, N. et al. L.M. 2021a. Nutritional status of children under five in Worcester, Breede Valley, Western Cape Province, South Africa. Johannesburg: Grow Great Campaign.
Mabaso, K.M., Menyatsoe, M., Manda, S., Müller, A., Gresse, A. 2021b. Nutritional status of children under five in Mqanduli, Eastern Cape Province, South Africa. Johannesburg: Grow Great Campaign.
May, P.A., Gossage, J.P., Brooke, L.E. et al. 2005. Maternal risk factors for fetal alcohol syndrome in the Western Cape province of South Africa: a population-based study. American Journal of Public Health, 95(7), pp. 1190–1199.
Mendez, M.A., Adair, L.S. 1999. Severity and timing of stunting in the first two years of life affect performance on cognitive tests in late childhood. Journal of Nutrition, 129(8), pp. 1555–1562.
MICS indicators for children under 5 applicable for this study (UNICEF 2020; available at: Tools – UNICEF MICS). https:// mics.unicef.org/tools
Modjadji, P., Madiba, S. 2019. The double burden of malnutrition in a rural health and demographic surveillance system site in South Africa: a study of primary schoolchildren and their mothers. BMC Public Health, 19(1), pp. 1–11.
Modjadji, P., Pitso, M. 2021. Maternal tobacco and alcohol use in relation to child malnutrition in Gauteng, South Africa: a retrospective analysis. Children, 8(2), p. 133.
Molani-Gol, R., Kheirouri, S., Alizadeh, M. 2023. Does the high dietary diversity score predict dietary micronutrients adequacy in children under 5 years old? A systematic review. Journal of Health, Population and Nutrition, 42(1), pp. 1–11.
National Department of Health (NDoH). 2015. Strategy for the prevention and control of obesity in South Africa. Pretoria: NDoH.
National Department of Health (NDoH), Statistics South Africa (Stats SA), South African Medical Research Council (SAMRC), ICF. 2018. South Africa demographic and health survey 2016 key findings. Pretoria, South Africa, and Rockville, Maryland, USA: NDoH, Stats SA, SAMRC and ICF.
Naude, C. 2013. “Eat plenty of vegetables and fruit every day”: a food-based dietary guideline for South Africa. South African Journal of Clinical Nutrition, 26(3), S46–S56.
Negrato, C.A., Gomes, M.B. 2013. Low birth weight: causes and consequences. Diabetology & Metabolic Syndrome, 5(1), pp. 1–8.
Périères, L., Séror, V., Boyer, S., Sokhna, C., Peretti-Watel, P. 2022. Reasons given for non-vaccination and undervaccination of children and adolescents in sub-Saharan Africa: A systematic review. Human Vaccines & Immunotherapeutics, 18(5), p. 2076524.
Popkin, B.M., Corvalan, C., Grummer-Strawn, L.M. 2020. Dynamics of the double burden of malnutrition and the changing nutrition reality. The Lancet, 395(10217), pp. 65–74.
Quelhas, D., Kompala, C., Wittenbrink, B. et al. 2018. The association between active tobacco use during pregnancy and growth outcomes of children under five years of age: a systematic review and meta-analysis. BMC Public Health, 18, 1372. https://doi.org/10.1186/s12889-018-6137-7
Said-Mohamed, R., Micklesfield, L., Pettifor, J., Norris, S. 2015. Has the prevalence of stunting in South African children changed in 40 years? A systematic review. BMC Public Health, 15(1), pp. 1–10.
Senekal, M., Nel, J.H., Malczyk, S., Drummond, L., Steyn, N.P. 2020. Provincial dietary intake study (PDIS): micronutrient intakes of children in a representative/random sample of 1- to <10-year-old children in two economically active and urbanized provinces in South Africa. International Journal of Environmental Research and Public Health, 17, p. 5924. https://doi:10.3390/ijerph17165924
Senekal, M., Nel, J.H., Malczyk, S., Drummond, L., Harbron, J., Steyn, N.P. 2019. Provincial Dietary Intake Study (PDIS): Prevalence and Sociodemographic Determinants of the Double Burden of Malnutrition in A Representative Sample of 1 to Under 10-Year-Old Children from Two Urbanized and Economically Active Provinces in South Africa. International Journal of Environmental Research and Public Health 16(18): 3334. https://doi.org/10.3390/ijerph16183334
Shisana, O., Labadarios, D., Rehle, T. et al. 2014. South African National health and nutrition examination survey (SANHANES-1). HSRC Press: Cape Town.
Singhal, A. 2017. Long-term adverse effects of early growth acceleration or catch-up growth. Annals of Nutrition and Metabolism, 70(3), pp. 236–240.
Siziba, L.P., Jerling, J., Hanekom, S.M., Wentzel-Viljoen, E. 2015. Low rates of exclusive breastfeeding are still evident in four South African provinces. South African Journal of Clinical Nutrition, 28(4), pp. 170–179.
Slemming, W., Kagura, J., Saloojee, H., Richter, L.M. 2017. Early life risk exposure and stunting in urban South African 2-year-old children. Journal of Developmental Origins of Health and Disease, 8(3), pp. 301–310.
Statista. 2022. Number of people living in extreme poverty in South Africa from 2016 to 2025. https://www.statista.com/ statistics/1263290/number-of-people-living-in-extremepoverty-in-south-africa/
Statistics South Africa. 2012. Census 2011 metadata. http:// www.statssa.gov.za/census/census_2011/census_products/ Census_2011_Metadata.pdf
Statistics South Africa. 2018. Provincial profile: Western Cape community survey 2016 report 03-01-07. http://cs2016. statssa.gov.za/wp-content/uploads/2018/07/Western Cape.pdf
Statistics South Africa. 2019. Towards measuring the extent of food security in South Africa: an examination of hunger and food inadequacy. Government publication. http://www.governmentpublications.lib.uct.ac.za/news/ towards-measuring-extent-food-security-south-africaexamination-hunger-and-food-inadequacy
Stein, D.J., Koen, N., Donald, K.A. et al. 2015. Investigating the psychosocial determinants of child health in Africa: The Drakenstein child health study. Journal of Neuroscience Methods, 252, pp. 27–35. https://doi.org/10.1016/j.jneumeth. 2015.03.016
Steyn, N.P., Nel, J.H., Casey, A. 2003. Secondary data analysis of dietary surveys undertaken in South Africa to determine usual food consumption of the population, Public Health Nutrition, 6(7), pp. 631–644.
Steyn, N.P., Labadarios, D., Maunder, E., Nel, J., Lombard, C. 2005. Secondary anthropometric data analysis of the National Food Consumption Survey in South Africa: the double burden. Nutrition, 21, pp. 4–13.
Steyn, N.P., Nel, J.H., Malczyk, S., Drummond, L., Senekal, M. 2020. Provincial dietary intake study (PDIS): energy and macronutrient intakes of children in a representative/ random sample of 1–<10-year-old children in two economically active and urbanized provinces in South Africa. International Journal of Environmental Research and Public Health, 17(5), p. 1717. https://doi.org/10.3390/ijerph17051717
Tzioumis, E., Kay, M.C., Bentley, M.E., Adair, L.S. 2016. Prevalence and trends in the childhood dual burden of malnutrition in low- and middle-income countries, 1990–2012. Public Health Nutrition, 19, pp. 1375–1388.
UNICEF. 1990. Strategy for improved nutrition of children and women in developing countries. New York: UNICEF.
UNICEF/WHO. 2018. Core questions on drinking water, sanitation and hygiene for household surveys: 2018 update. New York: UNICEF/WHO.
USAID. 2012. Sampling and household listing manual, demographic and health surveys methodology, 2012. https:// dhsprogram.com/pubs/pdf/DHSM4/DHS6_Sampling_ Manual_Sept2012_DHSM4.pdf
van der Berg, S., Patel, L., Bridgman, G. 2022. Food insecurity in South Africa: Evidence from NIDS–CRAM wave 5. Development SA, 39(5), pp. 722–737. https://doi.org/10.1080/ 0376835X.2022.2062299
van Stuijvenberg, M.E., Nel, J., Schoeman, S.E., Lombard, C.J., du Plessis, L.M., Dhansay, M.A. 2015. Low intake of calcium and vitamin D, but not zinc, iron or vitamin A, is associated with stunting in 2- to 5-year-old children. Nutrition, 31(6), pp. 841–846. https://doi.org/10.1016/j.nut.2014.12.011
Victora, C.G., Adair, L., Fall, C. 2008. Maternal and child undernutrition: consequences for adult health and human capital. The Lancet, 371(9606), pp. 340–357.
Victora, C.G., Christian, P., Vidaletti, L.P., Gatica-Dominguez, G., Menon, P., Black, R.E. 2021. Revisiting maternal and child undernutrition in low-income and middle-income countries: variable progress towards an unfinished agenda. The Lancet, https://doi.org/10.1016/S0140-6736(21)00394-9
Wang, C., Chan, J.S., Ren, L., Yan, J.H. 2016. Obesity reduces cognitive and motor functions across the lifespan. Neural Plasticity. https://doi.org/10.1155/2016/2473081
Wehler, C.A., Scott, R.I., Anderson, J.J. 1992. The community childhood hunger identification project: A model of domestic hunger: demonstration project in Seattle, Washington. Journal of Nutrition Education, 24, pp. 9S–35S.
Wenhold, F.A.M., Nel, S., van den Berg, V.L. 2022. Hands-on anthropometry: a South African handbook for large-scale nutrition studies. Training and standardisation manual. Pretoria. https://www.up.ac.za/centre-for-maternal-fetalnewborn-and-child-healthcare
WHO. 2000. Obesity: preventing and managing the global epidemic. Report of a WHO consultation. WHO Technical Report Series 894. Geneva: World Health Organization.
WHO. 2006. Multicentre Growth Reference Study Group. WHO Growth Standards. Methods and Development. Geneva: World Health Organisation. https://www.ncbi.nlm.nih.gov/pmc/ articles/PMC2636412/
WHO/UNICEF. 2021a. Indicators for assessing infant and young child feeding practices: definitions and measurement methods. Geneva: WHO/UNICEF.
WHO/UNICEF. 2021b. The extension of the 2025 maternal, infant and young child nutrition targets to 2030. https://www. who.int/nutrition/global-target-2025/discussion-paperextension-targets-2030
Willett, W. 2013. Nutritional Epidemiology, 3rd edn. USA: Oxford University Press.
Willey, B.A., Cameron, N., Norris, S.A., Pettifor, J.M., Griffiths, P.L. 2009. Socio-economic predictors of stunting in preschool children: a population-based study from Johannesburg and Soweto. South African Medical Journal, 99(6), pp. 450–456.
Wills, G., Kika-Mistry, J. 2022. Early childhood care and education access in South Africa during Covid-19: evidence from NIDS–CRAM. Development Southern Africa, 39(5), pp. 781–799.
Woo, J.G., Martin, L.J. 2015. Does breastfeeding protect against childhood obesity? Moving beyond observational evidence. Current Obesity Reports, 4, pp. 207–216.
To all the children in the Western Cape.

The DG Murray Trust (DGMT) is a public innovator through strategic investment. Innovation is achieved through behavioural change (influencing individual and societal mindsets and actions) and through technological change. For us, public innovation is simply the process of making the world a better place for all people, in synergy with nature.