The South African Early Childhood Review 2024 was developed collaboratively by Ilifa Labantwana, the Children’s Institute at the University of Cape Town, DataDrive2030, the Grow Great Campaign, the Department for Planning, Monitoring and Evaluation in the Presidency, and the Department of Basic Education. The editors would like to thank all those who contributed to this publication.
Suggested citation: Hall K, Almeleh C, Giese S, Mphaphuli E, Slemming W, Mathys R, Droomer L, Proudlock P, Kotze J, and Sadan M. South African Early Childhood Review 2024. Cape Town: Children’s Institute University of Cape Town and Ilifa Labantwana
Copyright: 2024 Children’s Institute University of Cape Town and Ilifa Labantwana
Any errors are the responsibility of the authors.
Acronyms
ANC Antenatal care
ARV Antiretroviral
CHW Community Health Worker
CSG Child Support Grant
DBE Department of Basic Education
DHA Department of Home Affairs
DHiS District Health Information System
DSD Department of Social Development
ECD early childhood development
ECD-CG Early Childhood Development Conditional Grant
ELOM Early Learning Outcomes Measure
ELP early learning programme
GHS General Household Survey
HiV human immunodeficiency virus
HH household
HSRC Human Sciences Research Council
MRC Medical Research Council
MSG maternity support grant
NFNSS National Food and Nutrition Security Survey
NSNP National School Nutrition Programme
PMTCT Prevention of mother-to-child transmission
SADHS South African Demographic and Health Survey
SAECR South African Early Childhood Review
SAM Severe Acute Malnutrition
SANHANES South African National Health and Nutrition Examination Survey
SASSA South African Social Security Agency
Stats SA Statistics South Africa
TiER.NET Three Interlinked Electronic Registers
UNiCEF United Nations International Children’s Emergency Fund
UN-iGME UN Inter-agency Group for Child
Mortality Estimation
WHO World Health Organization
ilifa Labantwana
Douglas Murray House, 1 Wodin Road, Claremont, Cape Town 7700, South Africa T: +27 (21) 670 9847
E: info@ilifalabantwana.co.za
W: www.ilifalabantwana.co.za
Foreword: Department of Basic Education
It is my privilege to introduce the South African Early Childhood Review 2024, a pivotal document that aligns with the Department of Basic Education’s ambitious and forward-thinking 2030 Strategy for ECD Programmes.
This review comes at a critical juncture in our nation’s journey towards realising universal access to quality early childhood development (ECD), especially for our most vulnerable children. The insights and findings presented here are not just a reflection of our current landscape but a beacon guiding us towards a brighter future for our youngest citizens.
Our 2030 Strategy, rooted in the belief that every child deserves the best start in life, underscores the importance of universal access as defined by the National Integrated ECD Policy. It highlights our commitment to ensuring that every community is equipped with the right mix of ECD programmes, tailored to meet the unique needs of families and children across South Africa.
This review provides invaluable data, shedding light on the current state of ECD in our country. It reveals that while we have made significant strides, there is still much work to be done. Nearly two-thirds of children aged 0-5 live in the poorest 40% of homes, with 1.3 million children in the 3-5 age group missing out on structured early learning opportunities. This is a call to action.
Our strategy is focused on five key priorities: Access, Coordination, Quality, Workforce, and Resources. These pillars are essential in addressing the challenges identified in the review, such as the need for sustainable livelihoods,
training, adequate funding, and the removal of market and regulatory barriers that hinder equity and access.
The review, our strategy, and the broader policy framework for ECD are interconnected. The review dovetails with the frameworks laid out in the National Integrated ECD Policy of 2015, which articulates the comprehensive needs of children. Our strategy emphasises a mixed provisioning model that is publicly planned and coordinated. This approach aims to expand access to a range of ECD programmes, including parent support programmes and early learning programmes, ensuring that they are responsive to the diverse needs of our communities.
As we move forward, it is crucial to recognise and harness the strengths within our ECD ecosystem. This includes the vast network of ECD programmes and practitioners who show up for our children, the dedication of local organisations. Our strategy is not just a plan, but a commitment to collaboration, innovation, and sustained effort.
In conclusion, the South Africa Early Childhood Review 2024, complemented by our 2030 Strategy, sets a clear path for us to follow. It calls for a collective effort from government departments, partners, and communities. Together, we can ensure that all South African children have the opportunity to thrive and develop to their full potential, laying a solid foundation for the future of our nation.
Mr Hubert Mathanzima Mweli Director General: Department of Basic Education
Foreword: National Planning Commission
South Africa’s 21 million children are at the centre of the National Planning Commission’s activities. The situation of children under six, as analysed in the South African Early Childhood Review 2024, is a cause of concern for us.
Most children live where it is difficult to deliver and maintain affordable services. The result is that many young children live in households without piped water or a flush toilet on site, increasing their exposure to diarrheal diseases. The cholera outbreak first detected in Hammanskraal in 2023 drew attention to these risks.
Trends in income poverty are also concerning. The upper-bound poverty rate among young children has increased since 2019. More than two thirds now live in households that cannot provide for their basic needs. The consequences of this include malnutrition. The incidence of severe acute malnutrition has risen, while stunting, which is the result of insufficient nutrition over an extended period, affects over 1.5 million young children. The in-facility neonatal death rate has increased since 2019, a sign of a possible increase in the overall child mortality rates.
The COVID-19 pandemic that took place soon after the previous review is one of the causes of these findings. However, the failure to adequately deliver and maintain essential services must be recognised as a breakdown in planning and implementation, and this extends to the provision of income support for children. The value of the Child Support Grant relative to the cost of basic food has declined due to repeated below-food inflation increases in the grant.
This review has repeatedly raised data quality as a concern. There are notable gaps, and the limited data related to children living with a disability is of particular concern.
Nonetheless, there are positive signs. South Africa continues gaining coverage across maternal and child health services and child health outcomes. In addition, the health system appears to have been resilient to the COVID-19 shock.
Action is being taken to address data concerns. For example, the Department of Basic Education responsible for early childhood development (ECD) completed a census of ECD facilities in 2021, and further data collection activities are ongoing.
Recommendations include assisting informal ECD centres to meet the criteria for registration, increasing social assistance, expanding home-based community health services, and ensuring support for primary health providers. The South African Early Childhood Review is welcome and supports the National Planning Commission’s Call to Action to reassert the significance of the National Development Plan goals.
Professor Julian May
Commissioner: Social Protection at the National Planning Commission
Director: DSI-NRF Centre of Excellence in Food Security
Director: Institute for Social Development at the University of the Western Cape
UNESCO Chair in African Food Systems
Introduction
Early childhood development (ECD) is central in reducing socioeconomic inequality. This fact is broadly accepted in South Africa, yet most children are born into environments that reduce their chances to realise their potential – typified by insufficient access to high-quality health services and nutrition, inadequate living environments, lack of security and social protection, and limited opportunities for quality early learning and stimulation. As a result, children experience malnutrition and toxic stress. From the very start, they are chronically underpowered to participate fully in the economy and society. They are unable to fully realise the benefits of formal schooling, with obvious repercussions during adolescence and later in life. Despite the many achievements of the post-apartheid period, progress across the various domains of ECD is unacceptably slow.
Children’s long-term development is a function of a package of interrelated and integrated services covering the period from conception to six years of age: maternal, newborn and child health services; nutritional support; support for primary caregivers; social services and protection; and quality early care and education programmes. Collectively, these are known as the Essential Package of ECD services. In addition to these services; developing perceptual, motor, cognitive, language, socio-emotional, and selfregulation skills in the home environment through responsive caregiving is a critical component of ECD.
Source: Adapted from Dawes et al. Indicators for early childhood development. (2006).
Brain Development
FiGURE 1: FACTORS AFFECTiNG EARLY CHiLDHOOD DEVELOPMENT
The Essential Package is a necessary pre-condition to realise children’s constitutional rights. The South African Early Childhood Review (SAECR) is structured to bring together the available data sources of the components of the Essential Package and monitor how the country is progressing towards meeting the goals that have been defined for several years and across a range of programmes and policy documents, including South Africa’s National Integrated ECD Policy of 2015.
These goals are aligned with the United Nations Sustainable Development Goals 2030 and the Nurturing Care Framework of the World Health Assembly 2018. The SAECR estimates the extent of need - the size of the relevant population of young children and their caregivers – to provide a sense of what would be required for a population-level response. It presents data on access to services to provide an estimate
of programme reach and the number of exclusions. Where possible, it includes information on outcomes as a measure of programme quality and impact. Using the Essential Package as a framework, the SAECR highlights points of intersection between different sectors and services to show the opportunities for improved integration of the service package.
Since the last publication of the SAECR in 2019, there have been three noteworthy and interlinked macro events shaping South African households specifically and the ECD sector more broadly, namely:
1. the shift of the ECD mandate from the Department of Social Development (DSD) to the Department of Basic Education (DBE) in 2022;
2. the COVID-19 pandemic and lockdown; and
3. the worsening fiscal conditions in South Africa.
Child poverty rates spiked in 2020 and by 2022 had not returned to preCOVID levels despite the introduction of the Social Relief of Distress grant for unemployed adults.
The shift of the ECD mandate from the DSD to the DBE has mainly been a positive development for the ECD sector. The DBE has demonstrated its ambition to reform the sector across several critical systemic areas. Notably, much of the DBE’s efforts have been undertaken with strong civil society involvement. These include improving the regulatory framework for early learning through the development of the Second Children’s Amendment Bill and improving the availability and use of ECD information through several important research efforts which are described in Chapter 6 – Stimulation for early learning.
Since 2021, the DBE has understandably focused on maintaining and improving the system handed over by the DSD, particularly the early learning system. More recently, the DBE has begun to look at the entire age spectrum of ECD, which starts at conception and not at age three. Their approach is articulated in their recently published six-year strategic plan for ECD (2024-2030).1
The COViD-19 pandemic was a setback for young children in South Africa from many perspectives. Child poverty rates spiked and by 2022 had not returned to pre-COVID levels despite the introduction of the Social Relief of Distress grant for unemployed adults. Similarly, the COVID-related lockdowns severely impacted early learning services, and the government’s response to the sector was largely inadequate. The early learning sector has not fully recovered.
The pandemic also negatively impacted health service utilisation across almost all maternal and child health services. Service utilisation subsequently recovered to pre-COVID levels across most essential primary health
care services. There were real fears that the pandemic would reverse the positive gains in child mortality over the previous decade. This did not happen immediately: under-5 mortality rates were unusually low during 2020 – probably due to reduced exposure to seasonal illness during lockdown. But preliminary estimates suggest that mortality rates rose again subsequently – alongside rising poverty, food insecurity and malnutrition.
The worsening fiscal conditions, as noted in successive budget policy speeches by the Minister of Finance, will be felt most acutely by young children and their caregivers. In real terms, the government plans to spend less on public services in the coming year than in previous years and will probably continue cutting expenditure for the next three years. The likely result is that frontline ECD services are in danger of being cut or eroded at best, when the need is for significant expansion.
The SAECR aims to help track how these and other events have impacted young children in South Africa. it also seeks to remind readers of the unsolved systemic challenges affecting the delivery of the Essential Package. One such issue is slow progress in setting up fit-for-purpose institutional mechanisms to coordinate, manage, and monitor complex integrated ECD service delivery. The National Integrated ECD Policy recognises that young children have a broad range of interdependent needs, and multiple role-players are involved in service delivery to meet those needs. In practice, this means that effective systems are needed for co-ordination, referral, and follow-up between the three key sectors responsible for delivering services to young children – Health, Basic Education, and Social Development – as well as with other departments such as Home Affairs, Justice and Constitutional Development, the South African Police Services, and local government.
South Africa continues to need:
• an effective central mechanism to mobilise, communicate, and coordinate a national programme for young children;
• the ability and capacity to deliver quality services at scale – in particular, to implement strategies for nutrition support for pregnant women and young children, early learning, caregiver support, child protection for all children who need it, and enhanced support for children with disabilities; and
• aggregated and individual-level data systems to routinely monitor access to and quality of ALL the services defined in the Essential Package.
FIGURE 3: GOVERNMENT DEPARTMENTAL RESPONSIBILITIES FOR THE ECD CONTINUUM OF CARE
At least 4 antenatal care visits
Attended delivery
Immunisation
Health (MNCH)
Deworming
Access to family planning and sexual reproductive health (including youth-friendly services)
Access to health care (integrated management of childhood illness)
Prevention of mother to child transmission of HIV (antenatal ARVs)
Screening for developmental delays, and hearing and visual impairment (3)
Counselling and prevention of smoking, drugs and alcohol consumption
Prevention and treatment of parental depression
Counselling on adequate diet for pregnant women
Health (Nutrition)
Social Development
Basic Education
Iron-folic acid supplementation
Exclusive
promotion
Therapeutic zinc supplementation for diarrhoea
Growth monitoring and referral
Prevention and treatment of acute child malnutrition
Micronutrient supplementation and fortification
Child protection services
Special care services for children with moderate and severe disabilities
Social assistance transfer programmes (e.g. Child Support Grant)
Caregiver education about early stimulation, growth and development (1)
Group early learning programmes
Inclusion of children with disabilities
Provision of adequate, nutritious and safe diet
Employment & Labour Parental leave
Access to safe water
Adequate sanitation
Water and sanitation
Home Affairs
Hygiene / handwashing (4)
Birth Registration
Late registration of birth
Source: Adapted from NPC 2024 ECD Report; Also draws from World Bank and Department of Basic Education 2023. Reproduced from Denboba et al. 2014 and Berry et al 2013, with some modifications.
Notes: 1) Caregiver education and support interventions are delivered by DBE, DOH and DSD. 2) Home visiting during first 1000 days conducted by both DoH and DSD; 3) Screening for developmental delays should be done by both DOH and DBE in their respective settings; 4) Hygeine/handwashing and education thereof done by DOH, DSD, DBE, W&A, etc.
1. Children under 6 years in South Africa
The SAECR focuses on young children. South Africa has nearly 7 million children under 6 years of age, and over a quarter of households in the country have one or more children in this age group. Seventy per cent of these young children are in households defined as poor, being below the official “upper-bound” poverty line, and nearly 40% live in households that do not have enough income to provide for their basic nutritional needs. Because of these high household poverty rates, all young children must access the essential and comprehensive package of ECD services.
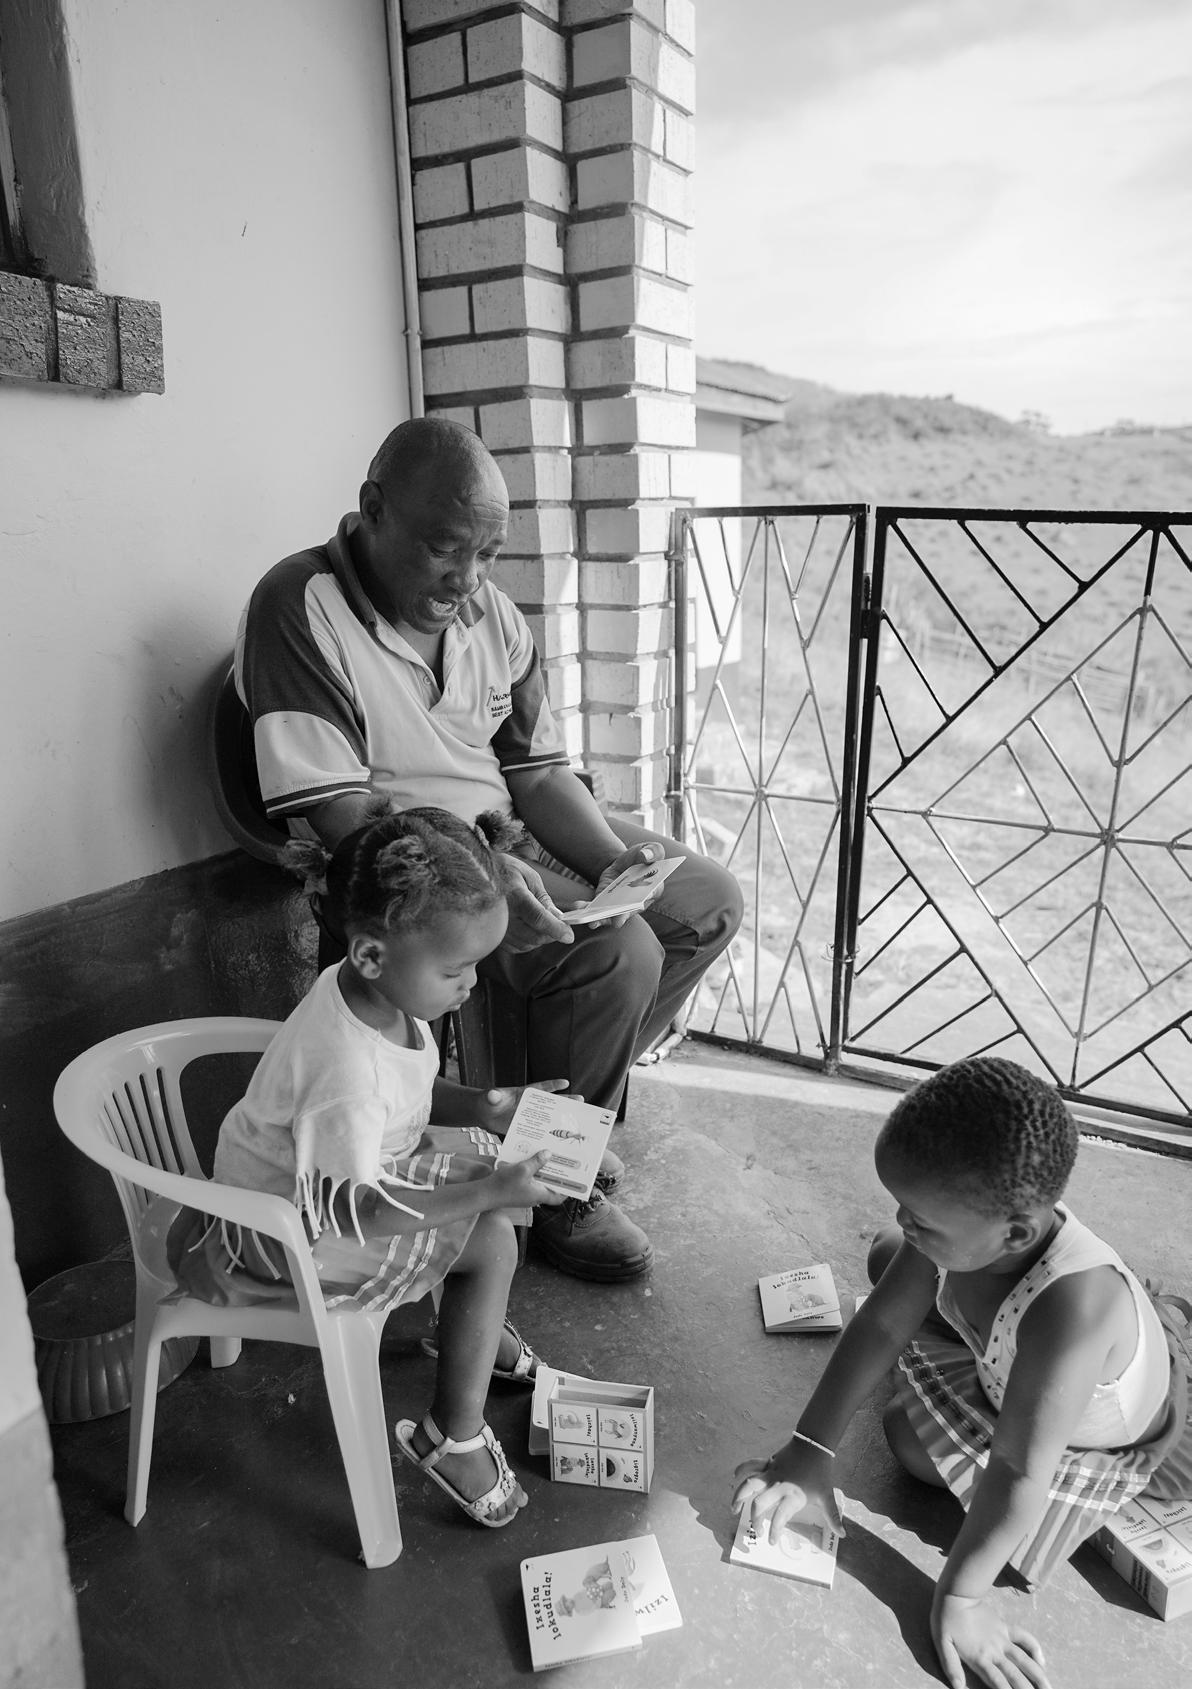
PHOTO: Early learning centre in Nquthu Local Municipality, KwaZulu-Natal (Ilifa Labantwana, 2017)
FIGURE 4: AGE SHARES IN THE SOUTH AFRICAN POPULATION 2002-2032
Source: Hall K. Calculations from Stats SA population model (2022 mid-year population estimates with projections).
The South African population is getting older. In recent decades, the shape of the population has been driven by declining fertility and mortality. Population growth is driven mainly by longer survival rates in the adult population rather than increased fertility rates. However, a growing adult population means that the number of children born each year will remain stable or even rise, even though fertility rates continue to fall. This pattern will continue in the coming decades, while more people will survive into adulthood and old age.
At the time of the transition to democracy in 1994, the total population in South Africa was just below 40 million. The population grew to more than 60 million people in South Africa in 2022, and is projected to reach nearly 70 million by 2032, of whom 50 million will be adults. Investing in children now is the best way to secure the future.
Trends in the young child population
Around 1.1 million children are born in South Africa annually, an average rate of about 3,000 births per day. These children need to be well nourished from before
birth and throughout childhood. They must be kept safe and healthy, and receive nurturing care and a good education.
No child should be deprived of these basic entitlements, which are essential for optimal human development and the country’s social and economic growth. Investments in antenatal care and early childhood create long-term and inter-generational benefits.
The South African population is gradually urbanising, resulting from increasing urban births and migration. However, the child population remains less urban than the adult population, partly because many urban settings, such as informal settlements, are not ideal places to raise children, being under-serviced and often unsafe. The lack of affordable crèches and early learning centres in urban areas makes raising young children difficult for poor parents. In these contexts, some urban-based parents may decide their children should be cared for by family members living elsewhere, such as at rural homes of origin where non-working women are available during the day.
Rural households, and rural women mainly, still carry a significant burden of unpaid care work, looking after
16% of children under 6 years do not usually live in the same household as their biological mothers
children whose mothers need to seek work elsewhere, as well as children who are orphaned or abandoned. Of the nearly 7 million children under 6 years, 1.1 million (16%) do not usually live in the same household as their biological mothers.
Four out of 10 young children live in rural settings, mainly in the rural former homelands.2 In Limpopo, over 80% of young children are in rural households, and the young child population is also predominantly rural in the Eastern Cape (61%), Mpumalanga (59%), and KwaZuluNatal (58%).
Although the overall national population numbers in the 0-6 age group have not changed substantially, there have been changes in the distribution of young children across the provinces. KwaZulu-Natal, Limpopo, and the Eastern Cape held the largest share of children for many years. However, the young child population has increased along with urban growth in Gauteng and the Western Cape over the past decade. Gauteng has surpassed KwaZulu-Natal and now has the largest under-6 population in the country.
The urban trend is likely to be the trajectory going forward, so it is important that provinces with expanding urban populations can plan and provide appropriately for young children. National agencies need to increase their services in areas with high urbanisation rates. The current and future size of the young child population matters when planning for adequate housing and basic service infrastructure, maternal and child health services, social assistance and services, birth registration service points,
child protection and caregiver support programmes, schools, and ECD facilities.
Basic services – water and sanitation
it is notoriously difficult to deliver accessible services in rural areas where populations are more dispersed, but these challenges must be overcome. Many rural caregivers and their young children must travel great distances, at considerable expense, to access even the most basic services such as birth registration, social grants, and health care.
Nearly a third (29%) of all children under six live in households without piped water on site. Household members must collect water from communal taps, tankers, or natural sources some distance away. Young children are particularly vulnerable to water-borne diseases, therefore safe drinking water must be readily available.
Adequate sanitation is necessary for health. Young children are particularly susceptible to diarrhoeal diseases and other infections associated with poor sanitation. These infections are often underlying causes of malnutrition and preventable deaths in young children. The government has defined a flush toilet or ventilated pit latrine as the minimum adequacy requirement for sanitation. For those who share communal toilets, the toilet should not be more than 200 metres from their home. While this is the minimum policy target, it is arguably inappropriate for young children to leave the safety of their homes to go to a communal toilet.
More than a fifth (22%) of young children (over 1.5 million) do not have a flush toilet or ventilated pit latrine at home. For those who do, the majority are dependent on pit latrines, which, although regarded as adequate in terms of the policy targets, can pose serious threats to young children – as evidenced in the cases where children have fallen into pit toilets. Only 35% of all children under six in South Africa have a flush toilet at home. The remaining 4.5 million must use pit toilets or some other inadequate form of sanitation.
There have been no significant improvements in access to adequate water or sanitation among children under six over the past five years.
Lessons in quality service provision from the Bulungula Incubator
Service delivery in remote rural areas is particularly challenging due to inadequate or non-existent roads, sanitation, connectivity, and communication infrastructure. Children walk to and from centres where ECD services are available, often accompanied by older siblings. During the rainy season, attendance drops significantly in many areas due to a lack of bridges across rivers that can become impassable.
Organisations that have been successful with service delivery harness the deep social capital and cohesiveness in rural communities. The Bulungula Incubator is one such organisation, partnering with communities, traditional leadership, government, and others.3 Its work began 20 years ago in Mbhashe, the poorest municipality in the Eastern Cape. Quality education, let alone ECD, was an abstract concept due to the area’s limited access to schooling.
Today, the Bulungula Incubator delivers quality services from ‘pre-conception to career’ – all of which are captured in their data management system. Services begin with health care in pregnancy through to home-based services to support physical growth and cognitive development, centre-based ECD, e-learning from the foundation phase, primary and secondary education, youth development, tertiary studies, and job creation with accessible quality and primary health care throughout at village-based outreach points.
Poverty rates
Following years of gradual but steady reductions in income poverty among children, poverty rates rose sharply over the COViD-19 lockdown period and have not declined since. In 2019, 56% of children under 6 years lived in households with incomes below the upper-bound poverty line that equated to R1,558 per person per month in 2023. Statistics South Africa (Stats SA) determines the national poverty lines and the upper-bound line represents the minimum income required to provide just enough for basic food, clothing, and other essentials. The upper-bound poverty rate among young children increased to 64% in 2020 and then increased further to 70% in 2022. This means that more than two thirds of young children, or nearly 5 million children under 6 years, live in households that cannot provide for their basic needs.
There is substantial provincial variation in poverty rates: 83% of all young children in the Eastern Cape, 81% in KwaZulu-Natal, 80% in North West, and 78% in Limpopo were in households with incomes below the upper-bound poverty line in 2022. The lowest under-6 poverty rates were in Gauteng (57%) and the Western Cape (43%) although even in these highly urbanised provinces the rates had increased substantially compared to 2019 when the upper-bound poverty rates for children under six in those provinces were 35% and 27% respectively. These rates are still worryingly high, given that the upper-bound
poverty line reflects the minimum amount of money needed to purchase basic food and clothing and cover other essentials such as housing and transport.
The food poverty line (R760 per person per month in 2023) is set at a value that only just allows people to eat the minimum calories needed for survival.4 There was a similar spike in food poverty among young children in 2020. In 2019, before the lockdown, 34% of young children in South Africa were living in households with income below the food poverty line, despite the wide reach of the Child Support Grant. This poverty rate, already worryingly high, increased to 42% in 2020, settling back to 38% in 2021 and 39% in 2022. This means that although there was some recovery, the food poverty rate among young children remains higher than in the preCOVID years.
Over 2.7 million children under 6 years live in households where the depth of poverty means that basic nutritional needs cannot be met. There are almost half a million more young children at serious risk of malnutrition than there were before COVID-19. The highest food poverty rates are in the Eastern Cape and North West, where 52% and 53% of young children are below the food poverty line respectively. Food poverty rates are also relatively high in KwaZulu-Natal (49%), Limpopo (48%), and Mpumalanga (43%). Even the Western Cape, which consistently has the lowest poverty rates,
Upper bound poverty rate
Food poverty rate
No employed co-resident adults
Source: K Hall analysis of Stats SA General Household Survey 2018-2022.
recorded a doubling of the under-6 food poverty rate, from 9% in 2018 to 19% in 2022. The food poverty rate in Gauteng grew from 16% of children under six in 2018 to 25% in 2022. it can no longer be said that food poverty for children under 6 years is primarily a rural challenge. Food poverty rates are rising in urban areas too.
The lack of substantial recovery in poverty rates in the young child population is likely to be reflected in nutritional deficits in the future. This is very worrying, given the persistently high rates of undernutrition and stunting before COVID-19.
Poverty rates among infants increased during the lockdown years and have stayed high. In 2019, around 650,000 (57%) infants under one were in households below the national upper-bound poverty line. The poverty headcount for infants increased each subsequent year, rising to 850,000 (72%) in 2022. The rising poverty trend is consistent for all children. Still, the fact that increasing numbers of infants are being born into very poor households suggests an even greater need for growth monitoring, nutritional support, birth registration, and enrolment in the Child Support Grant as soon as the child is born.
Adult unemployment rates show a corresponding trend over the lockdown period, with a spike in 2020. Although there was some recovery, the household-level unemployment rates, when viewed from the perspective of young children, had still not returned to their pre-
COViD levels by 2022. The impacts of COVID-19 and the lockdown on unemployment were well documented, with some 3 million jobs lost in the hard lockdown, of which 2 million were jobs held by women. Although there was some improvement in employment subsequently, unemployment rates remain very high. In the fourth quarter of 2022, the official (narrow) unemployment rate was 33% and the broad unemployment rate (including those not actively looking for work) was 43%.5 These households would rely entirely on social grants and remittances.
in summary, the South African population has entered a stage of demographic transition where we will start seeing an ageing population. In contrast, the size of the young child population remains fairly stable. Adult unemployment rates remain stubbornly high in an environment characterised by low growth and a labour market that does not provide enough jobs for the approximately 32 million working-age adults. Almost a third of young children live in households that receive no income from employment. The pandemic and associated lockdown exacerbated unemployment rates and have led to rising rates of child poverty.
It is essential and urgent to ensure that current and future cohorts of young children can develop healthily and thrive. Failure to make these investments would lead to the continued erosion of the human capital of future generations as children grow up to take their place as the next generation of adults, workers, and parents.
FIGURE 5: TRENDS IN UNDER-6 POVERTY RATES OVER THE LOCKDOWN AND POST-LOCKDOWN PERIOD
sanitation Children < 6 without a flush toilet or ventilated pit latrine on
Children living in poverty Children below upper bound poverty line (R1417 pp/mth)
Food Poverty
Children under 6 living in food poor households (R663 pp/mth)
Household unemployment Children under-6 living in households where no adults are employed
TABLE 1: THE STATUS OF CHILDREN UNDER 6 YEARS IN SOUTH AFRICA, BY PROVINCE
Data gaps and challenges
It is important to know how many children under 6 years are in the country, as this information provides the base population for all indicators of service access and child outcomes. Knowing the size and whereabouts of the population informs programme targets and budgets. The population census is conducted every 10 years and informs all other population estimates in the interim years.
Unfortunately, the 2022 population census, undertaken under challenging circumstances just after the lockdown, produced a substantial undercount rate of around 30%, which had to be adjusted through several imputations. Children under 5 years had one of the highest undercount rates at 35%. The population counts are adjusted using a dual system estimate combining the census and the post-enumeration survey. However, the total population figures derived remain estimates, and their accuracy is unknown.
When comparing the population estimates from the 2022 population census with those of Stats SA’s 2022 mid-year population estimate model for the same year, the overall population estimates for children in the five-year age band of 0-4 years are quite close. However, there is considerable variation at the provincial level. If the census is correct, then the under-5 population has grown faster than was previously thought in Gauteng, KwaZulu-Natal, and the Western Cape, and it has declined unexpectedly in Limpopo and Mpumalanga.
There is considerable uncertainty around the statistics derived from the General Household Survey (GHS)
during the lockdown years, which may affect the trends described in this SAECR. The GHS is an extensive nationally representative household survey conducted annually by Stats SA and provides the base data for many of the child indicators in the SAECR.
In March 2020, the GHS fieldwork was stopped abruptly due to the lockdown, as enumerators could not conduct face-to-face interviews in households. The GHS questionnaire was revised and shortened, and the sampling and interview methods changed.
The 2020 GHS was reinitiated in October 2020 and ran for the last few months of the year as a telephonic survey, in which the households interviewed were a sub-sample of households from the 2019 survey for whom Stats SA had telephone numbers, and where those telephone numbers were still working and where the respondents were still living in the same dwelling. The same approach was used in 2021. This resulted in sample bias, which Stats SA attempted to adjust for in the population weights.
A comparison of specific age ranges in the young child population with the mid-year population estimates reveals that while the adjusted weights provided a reasonable correction for bias across 5-year age bands, they did not adequately correct for over- or under-sampling within single age years. For example, even after applying population weights, the number of infants recorded in the 2021 GHS is almost 250,000 fewer than the national population estimates for the same year. It is possible that attrition from the sample was skewed towards new mothers with babies (due to mobility around the time of childbirth) and also to poorer households and those with large numbers of children.6
2. Primary-level maternal and child health
Protecting and nurturing the health of the mother and child is the foundation on which many child development gains are built. Through its massive network of clinic facilities and community health workers, the primary health care system arguably offers the best infrastructure to deliver most components of the Essential Package. However, this requires coordinated service delivery and a reorientation of the health system from “survive” to “survive and thrive”.
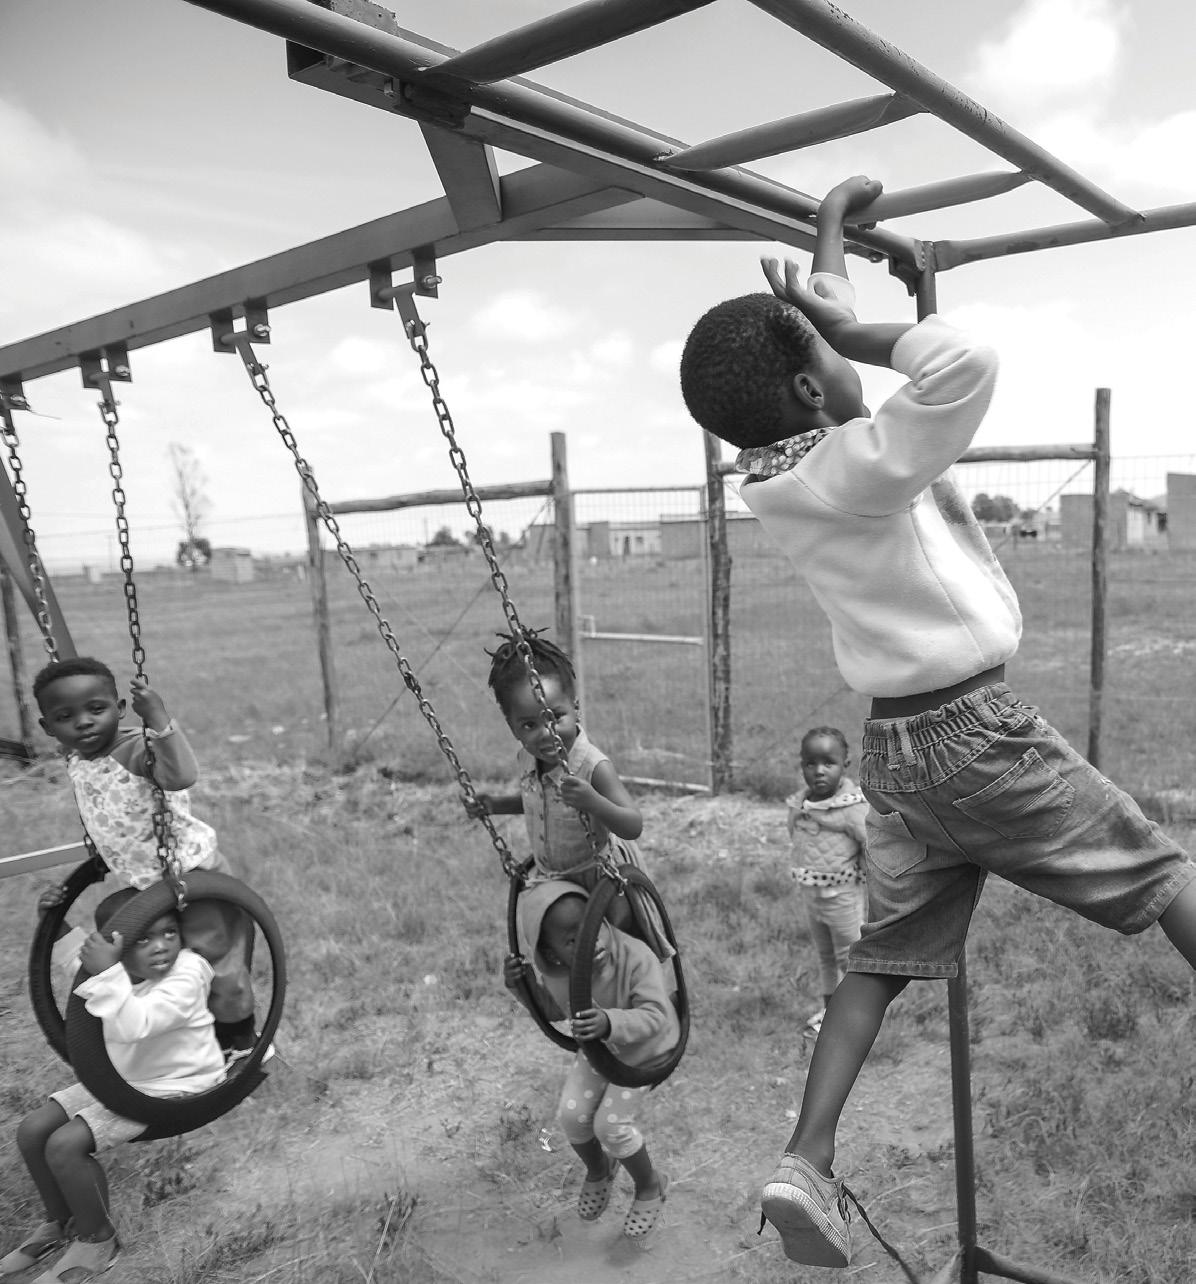
PHOTO: Caregiver Asandiswa Mbali and healthworker Momzekeliso Pita in Khayelitsha, Western Cape (DGMT, 2018)16 SOUTH AFRICAN
CHILDHOOD
This chapter analyses the state of maternal and child health service access and outcomes before, during, and after the COVID-19 pandemic. It provides a glimpse into what happened to health service utilisation and the extent to which maternal and child primary health care services were affected by the pandemic.
Overall, there were substantial effects on health service delivery and utilisation during the pandemic, with some recovery after the lockdown ended. From a budget perspective, health expenditures increased from R216 billion in 2019/20 to R237 billion in 2020/21.7 While there was a significant public and private investment in the supply and demand for the COVID-19 vaccine, new resources were targeted towards the more expensive secondary and tertiary health care, particularly to support COVID patients requiring intensive care. During the pandemic and immediately after, it was unclear how maternal and child health would be affected by the lasting effects of both the COVID lockdowns and the shifts in public health expenditure. Despite the seeming fragility of the health system, as reported in the 2019 SAECR, more recent data suggest that some health services and their utilisation have recovered after the pandemic.
The period in which children and their parents and/ or caregivers need the most frequent contact with the primary health care system is during the first 1,000 days (pregnancy and the first two years of life). Over half of the essential services during this period are delivered by health workers in primary health care clinics or community health workers visiting children and their caregivers in their homes. Each of these touchpoints was affected in some way by the lockdown regulations.
in the decade before the COViD pandemic, South Africa made major gains in coverage across almost all maternal and child health services and in some of the measurable child health outcomes. This was especially important as 88% of children under 6 years are not covered by private health insurance and rely on the public health system. The 2019 SAECR reported that several services began to see either a levelling off from these gains (e.g. diarrhoea and pneumonia case fatality rates for children under five) or declines in some cases (e.g. immunisation coverage).8 It was argued that possible causes included the increased fragility of the primary health care system in conjunction with the socio-economic challenges facing households and communities (such as increased unemployment and reduced household income).
Antenatal Services
Antenatal care (ANC) is the first gateway to a range of health services for pregnant women. These services are necessary to ensure healthy pregnancies and births, improve nutrition for both mother and child, and provide counselling and support to pregnant women to ensure positive pregnancy experiences and preparation for the birth of their child.
Early antenatal booking is recognised as a critical indicator of health services demand as it provides an opportunity to link pregnant women to the full range of services required early during their pregnancies. Early access to antenatal care has improved between 2016 and 2019, and it is encouraging to see the increased demand for antenatal services by pregnant women over time.
COVID-related lockdowns and other associated factors resulted in lower early booking rates across almost all provinces in 2020/21. However, the data from 2021/22 show that women in some provinces were returning to clinics and booking early. The national average, however, masks big differences between provinces. All provinces except the Eastern Cape and KwaZulu-Natal experienced declines in early antenatal bookings in 2020/21. While the Western Cape and Gauteng bounced back, early booking in the other provinces remained below their pre-lockdown rates in 2021/22.
All provinces except the Eastern Cape and KwaZulu-Natal experienced declines in early antenatal bookings in 2020/21.
Source: District Health Information System data published in Health Systems Trust (2020) District Health Barometer data file; Ndlovu N, Gray A, Mkhabela B, Myende N & Day C (2023) Health and related indicators 2022 In: Padarath A, Moeti T, (Eds.) South African Health Review 2022. Health Systems Trust.
30 %
The HIV prevalence rate in pregnant women remains high, at over 30%, with almost no change over the past decade
There is limited recent analysis on whether women received the recommended services that should be provided during ANC visits (e.g. blood pressure measurement or urine samples being taken). This is partly because the Demographic and Health Survey, which asks these questions, has not been repeated since 2016. The District Health Information System (DHIS) does include some indicators on the contents of ANC visits but these are mostly focused on sexually transmitted infections, HIV, and tuberculosis.
South Africa remains the country with the highest number of people living with HiV globally. The HiV prevalence rate in pregnant women remained persistently high at over 30% in the decade leading up to lockdown and dropped slightly to 27.5% in 2022. HIV prevalence rates remain high because of the high incidence of infection, but also because survival rates are high. South Africa has built the largest HIV/AIDS response through its rollout of clinical programmes, including antiretroviral treatment (ART) and mother-to-child HIV prevention programmes.
in 2021/22, 95% of eligible pregnant women were initiated on ART, a rate that has remained stable since 2016/17. Three of the nine provinces (Limpopo, Gauteng, and KwaZulu-Natal) registered gains between 2019 and 2022. However, the data from the Western Cape show a drop from 92% coverage in 2017/18 to 80% in 2019/20, and then to below 70% in 2020/21 and 2021/22. This decline could be an unintended consequence of deprioritising the delivery of disease-specific services following dismantling the province’s HIV directorate to integrate health services.
Source: DHIS data published in Health Systems Trust (2020) District Health Barometer data file; Ndlovu N, Gray A, Mkhabela B, Myende N & Day C (2023) Health and related indicators 2022 In: Padarath A, Moeti T. (Eds). South African Health Review 2022. Health Systems Trust.
The Health Systems Trust reported that the lockdown of 2020 led to serious disruptions in HIV testing and treatment. The number of HIV tests reduced dramatically and there was a decrease in the patients remaining on ART, with only a modest recovery by March 2021. This trend relates to the whole population and not specifically pregnant women.9
Despite the decline in ARV testing and treatment, the successful overall outcome of the ART and prevention of mother-to-child transmissions (PMTCT) programmes is that only 0.6% of infants born to HIV+ mothers tested HIV positive at ten weeks in 2021/22. This outcome maintains or improves upon low positivity rates over the past five years – a rate that appears to have been unaffected by COVID and lockdown.
Births in maternity facilities
Women whose babies are delivered in maternity facilities can benefit from a range of services for both the mother and newborn child. This is because facility deliveries are linked to services delivered immediately
after birth and the postnatal follow-up visit six days later. Conversely, a key driver of maternal and newborn mortality and morbidity is low rates of delivery in health facilities. Giving birth in a facility is determined partly by choice and partly by the accessibility of appropriate facilities to expectant mothers.
The trends over the past decade show a steady increase in the share of in-facility births, with 83% of pregnant women delivering their babies in healthcare facilities in 2021/22. This is an average increase of nearly ten percentage points from a decade before. The number of women who deliver in facilities is one of the few health indicators that showed improvement during the COVID pandemic and has remained upward since. It is worth pointing out that the Eastern Cape, which previously had the lowest rate of in-facility births, reflected a substantial year-on-year increase between 2020/21 and 2021/22. The Northern Cape, in contrast, experienced the most significant drop off in the share of in-facility deliveries despite having the highest rate of at least one ANC visit before and after lockdown. The in-facility delivery rate in Mpumalanga also declined after the lockdown. The reasons for these provincial variations are not clear.
DHIS data published in Health
Immunisation
immunisation is the bedrock for addressing preventable childhood illnesses, and immunisation rates are also a good proxy for the overall functioning of the health system. Immunisation is used as an entry point into the primary health care system for other interventions defined in the Essential Package of ECD services such as growth monitoring, deworming treatment, Vitamin A supplements, and appropriate treatment if children are sick. At these visits, mothers should also receive breastfeeding counselling, complementary feeding and nutrition support and information, information on home hygiene and safety, and postnatal maternal mental health support. Data on these services are not routinely collected. While the Road to Health Book (RtHB) is comprehensive in guiding the health worker on the needs of the child at each of these visits, it was not designed with the mother’s needs in mind. This is a significant gap that should be prioritised.
Reporting on 2017 data, the SAECR 2019 suggested that too few children were fully immunised at one year, with South Africa not reaching the minimum benchmark of 80% set by the World Health Organization. Efforts by the primary health care system to address these deficiencies have since borne fruit, with immunisation coverage increasing to 84% in 2019 in tandem with improvements in the six-day postnatal visit to 80% in the same year.
During the COVID-19 pandemic, public health officials were concerned that these gains would be wiped out and result in epidemics such as measles due to disruptions to essential routine services for young children. Caregivers
and their children either avoided clinic visits due to fears of COVID-19, an inability to cover transport costs to the clinic or access services for other reasons.11 UNICEF reported that over three months (November 2020 to January 2021) only three of 12 priority districts met the measles second dose target, while none met the Hexavalent third dose target of 80%.12
Despite significant drops in coverage during the COVID period and fears for the recovery, immunisation coverage rates recovered after lockdown and increased to 86% in 2021/22, bringing the rate closer to the Global Vaccine Action Plan target of 90%.
Immunisation coverage rates recovered after lockdown and increased to 86% in 2021/22, bringing the rate closer to the Global Vaccine Action Plan target of 90%
FIGURE 8: DELIVERY RATE IN FACILITIES10
Source:
Systems Trust (2020), District Health Barometer data file; Ndlovu N, Gray A, Mkhabela B, Myende N & Day C (2023) Health and related indicators 2022 In: Padarath A, Moeti T, (Eds.). South African Health Review 2022. Health Systems Trust.
The percentage of mothers attending a postnatal visit six days after birth also recovered to 79%.
Credit is due to public health officials and the primary health care system at large for the post-COVID recovery, which has surpassed pre-COVID levels. While there
was no epidemic because of the drop in vaccinations, the important lesson is that essential routine services for young children should be sustained irrespective of pandemics, natural disasters, or other crises.
Source: DHIS data published in Health Systems Trust (2020), District Health Barometer data file; Ndlovu N, Gray A, Mkhabela B, Myende N & Day C. (2023) Health and related indicators 2022. In: Padarath A, Moeti T. (Eds.). South African Health Review 2022. Health Systems Trust.
Mortality
The ultimate markers of the quality of health service coverage and health outcomes for children are the neonatal, infant and under-5 mortality rates. There was an overall decline in under-5 and infant mortality rates in the decade leading up to the COVID-19 pandemic, with a slight increase in the period from 2017 to 2019. The South African Health Review reported that during the pandemic, the inpatient case fatality rates for children under 5 years showed concerning increases for acute malnutrition, diarrhoea, and pneumonia.13 The increase in fatality rates was despite possible reductions in the number of cases of diarrhoea and pneumonia. Possible reasons for this include avoidance of care-seeking and late presentation to health facilities, resource diversion within the health sector, and undiagnosed COVID-19 in children.
The mortality estimates in Figure 10 come from the Rapid Mortality Surveillance Reports published by the Burden of Disease Unit at the Medical Research Council (MRC). The formal reports have not been updated beyond 2020 and the mortality estimates are unavailable below the national level. The MRC group have since produced preliminary updated mortality estimates for 2021 and 2022. These estimates have not been publicly released
by the MRC due to delays in the publication of causes of death data by Stats SA. However, the MRC shares their estimates with the UN Inter-agency Group for Child Mortality Estimation (UN-IGME), and the preliminary estimates are available on the IGME website.
The published mortality estimates show a sharp drop in 2020, presumably because young children were more protected from exposure to infectious illnesses during lockdown. Subsequent estimates suggest a sharp rise in both under-5 mortality and infant mortality in 2021 and again in 2022. According to the more recent preliminary estimates, 30 out of every 1,000 infants born alive did not live to their first birthday in 2022. This is the highest infant mortality rate since 2010, and it drives the increase in under-5 mortality. According to the same preliminary estimates, the under-5 mortality rate increased from a low of 29 per thousand live births in 2020 to 40 in 2022.
According to the MRC’s calculations, the neonatal mortality rate remained largely unchanged between 2012 and 2020. However, the DHIS’ administrative data recorded a slight increase in the neonatal death rate in public maternity facilities during the pandemic.
FIGURE 9: COVERAGE OF CHILDREN FULLY IMMUNISED AT AGE 12-23 MONTHS
Under-5 mortality rate
Infant mortality rate
Neonatal mortality rate
Source: Dorrington RE, Bradshaw D, Laubscher R, Nannan N. (2021). Rapid Mortality Surveillance Report 2019 & 2020Cape Town: South African Medical Research Council; Rapid Morality Surveillance (Preliminary) 2023 (VR) published by UN-IGME. https://childmortality.org/all-cause-mortality/data?refArea=ZAF&indicator=MRM0.
The in-facility neonatal death rate is calculated as the share of infants aged 0 to 28 days who died during their stay in the facility per 1000 live births in the facility. The rate had declined to 11.9 in 2019 but increased to 12.6 in 2020 and then to 13.1 in 2021. The neonatal mortality rate is an important contributor to the infant and under-5 mortality rates.
Interaction between early learning programmes and delivery of health services
As children get older, the touch points with the primary health care system become fewer. Children move from needing in-home care and clinic-based services to outof-home daycare and early learning programmes (ELPs) For many children, this transition happens when mothers return to work or seek work. At this time, the ELP site becomes an important point of contact for young children to ensure they access the full suite of ECD services.
Enabling health workers to access ELPs and ensuring that young children from these programmes can access clinics easily will promote higher immunisation coverage and improved health, growth, and nutrition Contact between ELPs and health workers also provides an opportunity to identify, refer, and support children with developmental delays and difficulties in their places of
care. Health workers, in partnership with practitioners in these programmes, can address nutritional challenges amongst children in their programmes and mediate the prevalence of growth and nutritional difficulties among children.
One of the first initiatives of the Department of Basic Education (DBE), as the new lead government department responsible for ECD, included collecting survey data on the intersections between ELPs and health and nutrition services. This is an important additional frontier that provides an opportunity to use data in planning for comprehensive and integrated primary health care services for all children aged 0-5 years. In addition to stunting outcomes collected through the Thrive by Five Index initiative, the ECD Baseline Assessment Report surveyed how ELPs interact with local clinics so that children receive the integrated early learning and health services they need for optimal development.14
A large majority (92%) of ELPs are within a 30-minute travelling distance from the nearest clinic, with two thirds being closer than 15 minutes. This is slightly higher than the estimates of clinic accessibility among households with young children: 21% of children under six live in households more than 30 minutes from the nearest clinic. For many young children, clinics are more accessible when reached from the ELPs they attend than when travelling from home.
FIGURE 10: CHILD MORTALITY RATES
21% of children under 6 live in households situated more than 30 minutes from the nearest clinic.
strengthened. Only about a third of the ELPs responded that the health workers assisted with vision, hearing, or developmental screening.
The main modes of transport used by ELPs to access clinics are either public transport or by foot, with only 23% of ELPs having a vehicle to access the clinic. However, access problems may be alleviated because health services also attend early learning facilities. Two-thirds of ELPs reported being visited by community health workers who came to do immunisations in 2019, while 64% were visited by health workers who administered deworming medication. Developmental screening is an area of collaboration with the Department of Health that can be
Source: Kotze (2022)
TABLE 3: HEALTH INDICATORS FOR PREGNANT WOMEN AND CHILDREN UNDER 6 YEARS, BY PROVINCE
TABLE 3: HEALTH INDICATORS FOR PREGNANT WOMEN AND CHILDREN UNDER 6 YEARS, BY PROVINCE (CONTINUED)
numbers have increased or decreased since the pre-COVID baseline worsening / negative improving / positive no significant change no significant change between pre-COVID baseline and most recent data no discernible change due to lack of comparative data
Data gaps
South Africa has a comprehensive DHIS that provides aggregated routine (monthly) and facility-based health data from the public sector primary health service and district hospitals. The DHIS tracks antenatal care, postnatal care, immunisation, vitamin A, and deworming data among hundreds of other maternal and child health indicators. The annual publication of the District Health Barometer by the Health Systems Trust demonstrates the depth and breadth of the indicators captured by the system and how having this information allows for detailed analysis and decision-making by the Department of Health and others. However, there are some areas where DHIS is lacking. The unit level of data collection is at the facility level and above. The DHIS does not collect and track at the individual level. Only the HIV programme collects information on individuals on ARV treatment through the TIER.NET system, which is especially important for caregivers, pregnant women and children accessing antiretrovirals.
Data on maternal mental health is not collected outside of research studies despite the growing evidence of its impact on maternal and child health, and on development outcomes.
It is difficult to assess the quality of care received through the public health care system because the DHIS does not collect this data. The most recent indicators come from the 2016 South African Demographic and Health Survey. Routine methods for collecting information on service quality are needed.
There are also limited data on the number of children screened for disabilities and developmental delays and referred for higher levels of care by the Departments of Health and Social Development. There are no data collected on the prevalence of disability or developmental delays, nor on referrals or specialised services within the early learning system – particularly important as these delays may need a health response but are identified by ECD practitioners.
Finally, the child mortality rates collected through the DHIS are not generalisable, partly because the DHIS is limited to in-facility mortality (e.g. case fatality rates), and many young child deaths occur outside health facilities. Broader data on mortality is drawn from the Rapid Mortality Surveillance Report using data from the Population Register. This report does not, however, indicate infant and under-5 mortality rates at a provincial level or lower. Child deaths are audited in the Child Death Review.
3. Nutrition
Access to good nutrition in childhood is imperative to break intergenerational cycles of poverty. Good nutrition, especially in the first 1000 days of life, optimises early childhood development and provides the foundation for human capital development across the life course. With a strong, healthy body and brain, children can learn well and develop into adults who can contribute meaningfully to society and the economy. Eliminating child malnutrition could increase South Africa’s Gross Domestic Product per capita by approximately 9%.15 Ending all forms of malnutrition is therefore not only important for the well-being of children but is also in the country’s best interests.
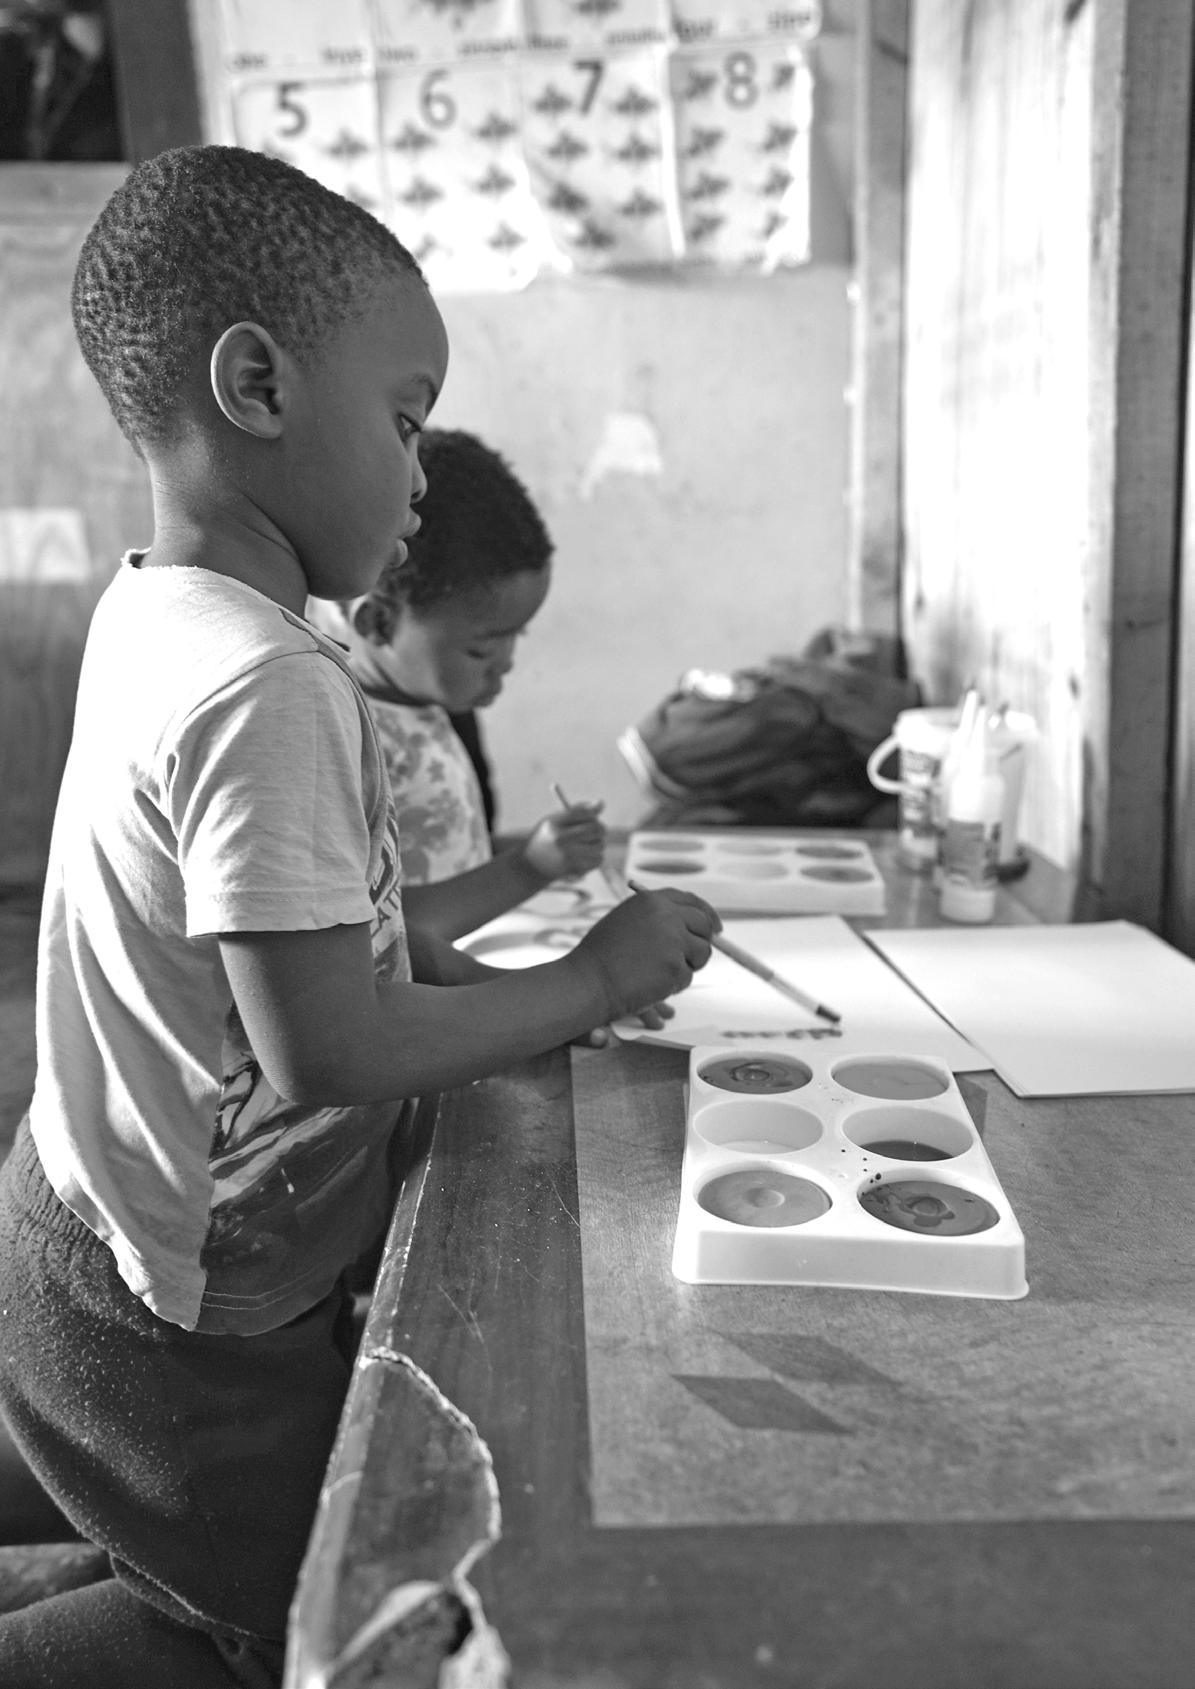
PHOTO: Early learning centre in Msinga Local Municipality, KwaZulu-Natal (Ilifa Labantwana, 2017)
international experience shows that it is possible to reduce child malnutrition even in challenging contexts. Several countries have managed to reduce the prevalence of malnutrition in children even while high levels of deprivation and inequality remain.16 The common health sector strategies in these countries included prioritising investments in maternal nutrition, promoting early and exclusive breastfeeding, and improving complementary feeding practices to improve newborn outcomes. Beyond the health sector, countries also invested in diverse strategies to address food insecurity among marginalised households, reduce gender inequalities, and improve living conditions (especially access to water and sanitation). These examples are important lessons for South Africa.
High prevalence of malnutrition
South Africa faces the complex challenge of having to contend with a high prevalence of both over- and undernutrition, both of which are forms of malnutrition.
Stunting
Stunting is the most common form of malnutrition in South Africa, affecting over 1.5 million (27%) children under the age of five 17 Children are stunted if they are too short for their age - more than two standard deviations below the median, as defined by the World Health Organization (WHO). Stunting usually occurs because of chronic undernutrition. It is influenced by proximal determinants such as sufficient quantity, quality, and diversity of food; hygiene, water, and sanitation; recurrent infections and access to high-quality primary care; and distal determinants such as poverty and low maternal education.18
Stunting affects both physical and cognitive development. Stunted children are more likely to start school with
27 %
Stunting affects over a quarter of children under the age of five in South Africa
developmental delays, perform poorly at school, be unemployed when they grow up, and to suffer from chronic conditions such as obesity, hypertension, and diabetes in adulthood.19
The 2012 World Health Assembly endorsed the target of a 40% reduction in the number of stunted children under the age of five by 2025. More recently, the WHO/UNICEF goal is to halve the prevalence of under-5 stunting by 2030. According to the South Africa Demographic and Health Survey (SADHS), stunting in South Africa was 27% in 2016, with the highest prevalence rates in Gauteng and the Free State (both 34%). South Africa’s under-5 stunting rates have remained persistently high over the past three decades, and the country is not on track to reach any of the global targets.
The tables below show the prevalence of stunting among children under five. Table 4A compares sample sizes and stunting estimates from the 2016 SADHS and the more recent National Food and Nutrition Security Survey (NFNSS) conducted by the Human Sciences Research Council (HSRC) between 2021 and 2023.20
TABLES 4A AND 4B: UNDER-5 STUNTING RATES BY PROVINCE AND WITHIN SELECTED DISTRICTS
Results from the NFNSS suggest that the under-five stunting rate increased from 27% nationally in 2016 to 29% in 2021-23.21 This is concerning but not surprising given the trends in a range of other indicators included in this SAECR, which reveal a rise in food poverty rates and food insecurity, an increase in severe acute malnutrition, and a further decline in early access to the Child Support Grant (CSG).
The provincial stunting estimates in the 2021-23 NFNSS survey were higher than the 2016 SADHS estimates in the Eastern Cape, Western Cape, Northern Cape, KwaZuluNatal, Mpumalanga, and the North West. Stunting rates were lower in the Free State, Gauteng, and Limpopo. The biggest difference between the two surveys was in the Western Cape. Almost half (46%) of children under five in that province were classified as stunted in 2022 – double the estimate of 23% in 2016, almost triple the estimate from the Western Cape Stunting Baseline Survey.22
Table 4B shows the prevalence of child stunting measured in community surveys conducted by Grow Great in 2021/22.23 It is important to note that while the SADHS and NFNSS are nationally representative surveys, the community stunting surveys are localised studies. Tables 4A and 4B are, therefore, not directly comparable.
The community stunting surveys yielded stunting prevalence rates in some districts that were substantially lower than the overall stunting prevalence levels in their respective provinces, as reported in the 2016 SADHS and the 2021-23 NFNSS. This is even though the communities surveyed in the Grow Great study were in districts identified as food-vulnerable. For example, the community survey found that the stunting prevalence in the West Rand, Gauteng, was 18%, much lower than the 34% provincial stunting prevalence reported in the 2016 SADHS, and also lower than the 24% provincial stunting prevalence reported in the NFNSS, which was conducted around the same time. It is possible that the localised surveys produced more reliable estimates at the community level (for example, the Grow Great sample in the West Rand was 482, while the NFNSS only obtained responses for 95 children in that area). If the Grow Great results are more reliable at the local level, then this implies that other districts in Gauteng may have significantly higher stunting rates, influencing the overall change.
The only province to have conducted its own provincially representative survey of stunting is the Western Cape, which undertook a Stunting Baseline Survey on children under 5 years in 2022. The survey found the stunting prevalence in the province to be 17.5%.24 If the two estimates are correct, this is a significant
drop from the 27.4% reported in the SADHS, representing a 36% reduction in stunting over seven years. However, the NFNSS, conducted in the same year as the Western Cape provincial baseline survey, yielded a stunting estimate of 46% for the same age. These contradictory estimates require further interrogation.
The Western Cape baseline survey revealed substantial variation in stunting rates within the province. The average stunting rates were driven by the predominantly formal urban child population, where stunting rates were 16.5%, compared with the much higher stunting rates in urban informal areas (21%) and rural towns (26%). Many children remain highly vulnerable to stunting even within this relatively wealthy province.
There is considerable uncertainty around the reasons for the variation in stunting estimates. However, all the surveys point to high rates of child stunting. Faster progress and a deliberate equity-driven strategy targeting the most vulnerable children and women of childbearing age will be needed if we are to reduce stunting rates across all provinces and communities.
Overweight
Overweight is the second most common form of malnutrition, affecting 13% of children under 5 years in South Africa (approximately 730,000 young children) 25 A child is defined as overweight if their weight is more than two standard deviations above the median compared to their height. Being overweight does not necessarily mean that the child is receiving enough nutrition. In South Africa, being overweight is often related to poor dietary practices and poverty. Households struggling to afford food often prioritise foods high in starch and low in nutritional content. Results from the HSRC’s NFNSS suggest that the prevalence of overweight among children under five had increased to 23% in 2021-23.
Wasting and severe acute malnutrition
Wasting is the most immediate, visible, and lifethreatening form of malnutrition and is defined as a weight that is too low compared to a child’s height. Wasting presents as either moderate acute malnutrition or severe acute malnutrition (SAM).
Recent trends in the incidence (new cases) of SAM are alarming, with a 33% nationwide increase between 2020/21 and 2021/22.26 More recently, the Department of Health reported that by mid-2023, the SAM incidence had increased by a further 20%, from a ratio of 2 per 1000 children under 5 years in 2021/22 to 2.4 per 1000 in 2022/23.27
FIGURE
11:
INCIDENCE OF SEVERE ACUTE MALNUTRITION AMONG CHILDREN UNDER FIVE
Source: DHIS data published in Health Systems Trust (2020) District Health Barometer data file; Ndlovu N, Gray A, Mkhabela B, Myende N & Day C (2023) Health and related indicators 2022 In: Padarath A, Moeti T, (Eds). South African Health Review 2022. Health Systems Trust.
Malnutrition is difficult to reverse, has lifelong consequences and can be fatal
For every one child in South Africa who suffers from SAM, approximately 135 children are affected by stunting. 28 Severe Acute Malnutrition is the extreme outcome of a much larger malnutrition challenge in South Africa.
Alongside the increase in SAM incidence is an 8% rise in the proportion of children admitted with SAM in healthcare facilities who do not survive. In 2020/21, 7.9% of all hospitalisations of children with SAM resulted in death. This reduced in 2021/22 (to 7.3%). However, it is unclear to what extent this reduction was due to the lower likelihood of children being taken to health facilities during the COVID-19 pandemic lockdown periods.
in 2022/23, a staggering 15,000 children required hospitalisation due to SAM 29 This number represents a 25% increase over just five years. During the same period, approximately 1,000 children per year lost their lives to preventable, acute malnutrition.
Children who recover from early stunting still perform more poorly in cognitive tests than their peers who do not experience early malnutrition. They also perform nearly as poorly as children who remain stunted.30
In 2022/23, a staggering 15,000 children required hospitalisation due to severe acute malnutrition
These findings indicate that having the right nutritional inputs in the first 1,000 days of life is critical to support optimal cognitive development. Poor nutrition, particularly in the first 1,000 days, negatively impacts school readiness and educational achievement.
The 2021 Thrive by Five Index, for example, found that stunted children aged 50-59 months were, on average, 5-6 months behind their peers in developmental assessments. Evidence from the South African Birth to Thirty cohort study shows that although it is possible to recover from physical stunting by age 5, the educational setbacks remain.
Interventions to improve nutrition and food security for young children
South Africa has a triple burden of child malnutrition: undernutrition, micronutrient deficiencies, and overweight/ obesity. A comprehensive, multi-sectoral approach is needed to address all forms of malnutrition in young children effectively. Various local interventions have been shown to contribute to the reduction of malnutrition. These include school feeding programmes, cash transfers through social grants, nutrition support before and during pregnancy, and regular monitoring and nutritional support by health facilities and community-based health workers.
More than one in every ten children under 6 years live in households where children are reported to go hungry because there is not enough food. Other household measures yield even higher rates of reported food insecurity.
in 2022, 20% of children under 6 years lived in households that ran out of food during the month due to a lack of money. More than a quarter (26%) of the under-6 child population (1.8 million children) lived in households forced to reduce their food range due to lack of money. This is concerning because dietary diversity is key to good nutrition. There are various ways in which the nutrition of young children can be supported.
Nutrition programmes for young children in ECD facilities
School meals provide a safety net for vulnerable children and have the added benefit of encouraging regular school attendance.31 Findings from the 2021 Thrive by Five Index suggest that young children who attend early learning programmes (ELPs) are likely to have better nutritional status than those who do not. The study showed that only 5.7% of children
20 %
In 2022, 20% of children under 6 years lived in households that ran out of food during the month due to a lack of money.
aged 4-5 years who were attending an ELP were stunted.32 This is significantly lower than the 15.6% prevalence of stunting in the same age group from the general population in the 2016 SADHS.33
To better understand the associations between ELP attendance and nutritional outcomes, the 2024 Thrive by Five Index will collect anthropometric data among children who attend an ELP and those who do not in order to compare outcomes between these groups. This aligns with the WHO recommendation of conducting stunting surveys every 3-5 years, including data on whether children attended an ELP.
Now that responsibility for coordinating ECD falls under the leadership of the Department of Basic Education (DBE), there is an opportunity to strengthen the nutrition programmes offered in ECD centres to reduce malnutrition in the preschool age group. The National School Nutrition Programme (NSNP) reaches over 9 million children of school-going age every year and has been extended to include Grade R. There is no comparable nationally coordinated nutrition programme in ELPs, but the ECD subsidy is intended to enable the provision of nutrition to the young children who attend.
While it may not be appropriate or feasible to extend the NSNP model to ECD centres, there are ways in which the nutritional support they provide to young children could be secured and enhanced. First, there should be a concerted effort to assist ECD centres to meet the criteria for registration and be eligible to receive the ECD subsidy. Second, additional budget needs to be allocated to increase coverage of the ECD subsidy. At the time of the ECD Census in 2021, only 40% of the 42,420 ELPs operating in the country were registered, and only 33% were subsidised.34 Third, the amount of the subsidy would need to be increased. The ECD subsidy is meant to cover all costs including facilities and equipment, staff salaries, and meals for the children.
Food inflation has been particularly high in recent years and the CSG is substantially below the food poverty line (R760 per month in 2023).
Despite high inflation, this amount has been stagnant at R17 per child per day since 2019, forcing ECD centres to operate on a reduced budget in real terms.35
Importantly, the DBE and its key sister departments for ECD (Health and Social Development) must give deliberate thought about ways to improve nutrition for vulnerable children who do not attend ELPs. A third of children aged 3-5 years do not attend ELPs where they might receive meals, while less than 20% of children in the 0-2 year age group attend some kind of group care.
Reduce food insecurity through increased social assistance
All young children need to have their nutritional needs met within the home. Caregivers who earn below a threshold income can access the CSG (R530 per month in 2024), which is meant to ensure that poor caregivers have the means to provide for children’s nutrition and other basic needs. Of the 13 million children receiving the CSG, 4.3 million are under 6 years old, and 2 million are in the 0-2 age group; nearly 60% of children in this very young age group are being reached. Because the grant is well-targeted, virtually all recipients are from very poor households.
Numerous studies have shown that the CSG is spent mainly on food and positively impacts children’s nutrition, health, and educational outcomes.36 However, its buying power has been reduced as the annual increases have not kept pace with inflation. Food inflation has been particularly high in recent years and the CSG is substantially below the food poverty line (R760 per month in 2023). This means that it is not enough to feed a child. Restoring the CSG to the food poverty line would be an administratively simple and effective
way of improving nutrition for young children as it puts money directly in the hands of the children’s caregivers.
A key challenge with the CSG is that the youngest children, especially infants, are most likely to be excluded. This has been a perpetual problem and has worsened since the COVID-19 pandemic. Enrolling eligible infants into the CSG from birth will require a deliberate and collaborative effort by the relevant departments, including Health, Home Affairs, Social Development, and SASSA (see Chapters 4 and 5). Given the evidence on the “dose effect” of the grant (the impacts are strongest if access is early and continuous), resolving the exclusion problem for infants will improve nutritional outcomes for the poorest children.
Expand home-based community health services
Monitoring children’s growth can be expanded through community health workers (CHWs) and conducted in children’s homes, easing the pressure on primary health care facilities. Grow Great, in collaboration with the National Department of Health, has demonstrated that it is effective to deploy CHWs to monitor children’s nutritional status. Doing so can lead to positive change, as shown in Figure 12.
The graphs show results from a retrospective growth chart review of Grow Great-trained CHWs folders. The review sought to understand how CHW visits influence maternal and child health outcomes. Approximately 5,200 folders were sampled from Greater Letaba, Limpopo, from 100 CHWs who visited pregnant women and their children aged 24 months and younger. Though these localised findings are not generalisable, they demonstrate positive trends in the nutritional status of the children over the 24 months of follow-up by the Grow Great-trained CHWs.
Since the six-monthly visits are not linked to any immunisations that require a clinician, these can be done as home visits where the CHWs can administer vitamin A supplements, deworming medication, screen for acute malnutrition, weigh children, and measure their length/height. The results showed increases in vitamin A and deworming coverage, decreased incidence of moderate and severe acute malnutrition cases and reduced stunting in children who were visited by CHWs. The extent to which these decreases are linked to the intervention vs normal “catch-up” in the first two years of life requires further investigation.
Community health workers can also monitor pregnant women in their homes between their antenatal visits, maximising the opportunity to promote health and nutritional practices for the benefit of the mother and the unborn child.
STUNTED NOT STUNTED
WASTiNG
WASTED NORMAL
UNDERWEIGHT NORMAL
Source: Grow Great 2023 Annual Report. https://www.growgreat.co.za/wp-content/uploads/2023/11/GROW-GREAT-2022-Annual-Report-final.pdf
Prioritise maternal nutrition before and during pregnancy
improving the nutritional status of children starts with improving the nutritional status of mothers. Women of reproductive age need access to adequate nutrition for a healthy pregnancy and to be able to breastfeed.
Stunting often begins while the child is still in their mother’s womb and continues for at least the first two years after birth. A study analysing data from 19 birth cohorts suggests that around 20% of stunting can be attributed to in-utero origins.37
Low birth weight babies are at significant risk of early mortality – they are more likely to die in the first 28 days. Those who survive may have compromised growth and greater risk of morbidity, including a higher likelihood of obesity, diabetes and other noncommunicable diseases later in life.38 Approximately 13% of infants are born with a low birth weight (<2,500 g) in South Africa; Limpopo has the lowest proportion (11%) and Northern Cape (18%) has the highest. There are no significant differences in low birth weight rates across urban and rural areas, but low birth weights were higher among infants born to mothers aged above 35 years.
One way to support the nutrition of pregnant women is to provide income support through a maternity support grant. The Department of Social Development is already
in 2003, South Africa made it mandatory to fortify certain types of maize meal and wheat flour with iron, folic acid, vitamin A, zinc, thiamine, riboflavin, niacin, and pyridoxine. However, there is a shortage of data on the prevalence of micronutrient deficiencies in South Africa to determine the impact of this intervention. FIGURE 12: TREND OVER
investigating this policy option (see Chapter 4 – Support for Primary Caregivers). In addition, antenatal visits provide an opportunity for identifying and addressing micronutrient deficiencies in pregnant women.
Monitor micronutrient deficiency and ensure the micronutrients are accessible and affordable for pregnant women and their young children.
iron deficiency anaemia during pregnancy is associated with an increased risk of preterm delivery and an increased incidence of low birth weight. Iron is critical for foetal development. Iron deficiency in the first 1,000 days of life may damage the central nervous system, immune system, and gut microbiota, which persist into adulthood.
A third of South African women of childbearing age were found to be anaemic in the 2016 SADHS, with the highest levels in Mpumalanga at 39% and the lowest levels in the Western Cape at 24%. The SADHS also reported extremely high levels of anaemia overall in children under five at 61%, with Gauteng and Mpumalanga at over 70%, and KwaZulu-Natal showing a lower prevalence of 42%.
STUNTiNG (height for age)
(weight for age)
UNDERWEiGHT (weight for age)
The only available national data is on vitamin A and iron deficiency anaemia in children under five years and women of reproductive age, from the South African National Health and Nutrition Examination Survey (SANHANES) conducted in 2012.
The prices of fortified foods must be protected from inflation so that the population, especially pregnant and nursing women, are not forced to buy cheaper, unfortified alternatives. This is especially important as South Africa lacks pre-conception health care services to ensure that women start taking folic acid and iron supplements before becoming pregnant. Most women who use public health care only start receiving their folic acid and iron supplements later in pregnancy. In contrast, folic acid is essential in the first 12 weeks of pregnancy to allow the baby’s brain to form normally and to prevent conditions such as spina bifida.
The public health system provides children aged 1259 months with vitamin A supplementation. Following gradual improvements in vitamin A coverage over the past decade, coverage dropped across all provinces during 2020/21 because of the COVID-19 lockdown, falling just below the 50% mark. In 2021/22, coverage rates bounced back and exceeded previous levels, reaching 60% nationally.
Breastfeeding
support
Mothers who are breastfeeding need enabling environments to do so, including at places of work. Less than half (44%) of infants were exclusively breastfed at 14 weeks in 2021/22, down from 49% in 2019/20. In the 2016, only 32% of babies up to the age of 6 months were reported to be exclusively breastfed. Results from the more recent HSRC Food Security and Nutrition Survey suggest that this rate has dropped further, to 22%. If South Africa is to meet the WHO target of increasing breastfeeding rates to 50%, there will need to be increased investments in breastfeeding promotion, protection and support programmes, and stricter enforcement of the WHO International Code on the Marketing of Breastmilk Substitutes.39
Develop strategies to reduce or counter food price inflation
A primary driver of malnutrition is poor access to nutritious food. South Africa is not a food-scarce country, but access to nutritious food is limited by
affordability. Food inflation rose during the COVID-19 pandemic, and this trend has continued. Food inflation exceeded 14% in early 2023, the highest rate since the 2008 global recession and more than double the upper inflation target limit. Over the same period, inflation on vegetables, which are an important source of micronutrients, was as high as 23%.40
The effects of high food inflation in recent years are likely to be revealed in the nutritional status of that cohort of young children. If left unattended, rising food inflation and inadequate accompanying increases to social grants will result in increasing malnutrition and the goal of ending all forms of malnutrition by 2030 will be unattainable.
It would be futile to educate pregnant women and parents on healthy food choices without advocating for healthy food to be affordable and accessible. The food affordability crisis is not solely the government’s responsibility. It is a societal challenge that demands urgent collective action from the public, civil society, government, and business.
To initiate the effort, the DG Murray Trust and Grow Great are advocating for a new initiative to reduce the cost of 10 nutritious foods for poor families. These essential food items, referred to as the ten budget friendly food items, include amasi (fermented milk), full cream milk, soya mince, canned baked beans, fortified maize meal, pilchards, peanut butter, speckled beans, and white rice. The proposal encourages collaboration between government, business, and civil society to lower the prices of these ten highly nutritious basic foods.41
44 %
44% of infants were exclusively breastfed at 14 weeks in 2021/22, down from 49% in 2019/20
Low birth weight % infants born with weight below 2500g
Child hunger
Children <6 in households where children suffer hunger
Food insecurity Children <6 in households that ran out of food due to lack of money
food diversity
infant breastfeeding Infants exclusively breastfed at 14
(as proportion of 3rd vaccination clients)
Early initiation of breastfeeding First breastfeed within 1 hour of birth
Exclusive breastfeeding - 6 months
numbers have increased or decreased since the pre-COVID baseline worsening / negative improving / positive no significant change no significant change between pre-COVID baseline and most recent data no discernible change due to lack of comparative data
Data gaps
South Africa needs more regular data on child nutrition, micronutrient deficiencies, and nutritional outcomes. Monitoring of child malnutrition is used to track human capital development progress.42 Child malnutrition estimates can help determine whether South Africa is on track to end all forms of malnutrition by 2030 which is one of the targets under Sustainable Development Goal 2.
The WHO recommends that countries do stunting surveys every three to five years. Concerningly, the most recent available nationally representative data on stunting in South Africa, from the 2016 SADHS and 2021-23 NFNSS, provide quite different results and it is unclear to what extent the differences arise from variation in sampling and method and to what extent they reflect real change in children’s nutritional outcomes. If ending all forms of malnutrition is a priority for South Africa, then an increased frequency of routine national nutrition surveys is required.
In addition, there is a need to invest in collecting more granular data at the small area level for all forms of malnutrition, particularly for stunting. This would be useful for informing the geographic targeting of interventions and adjustments to malnutrition strategies for specific communities. The Western Cape is the only province to date that has done this, and the findings from their surveys allowed the province to detect inequalities in stunting levels across communities and better understand
community-specific drivers of stunting. This will enable targeting interventions and resources.
There is also a need to standardise nutrition survey methodologies so that estimates are comparable and can be used for tracking progress.
Given the observed ageing effects, especially in the stunting data, it is essential to ensure that samples are large enough to allow for age disaggregation in reporting within the under-5 age group.
To supplement and triangulate data from population surveys, indicators on all forms of malnutrition should be included in the National Indicator Data Set and routinely monitored through the DHIS. It is widely accepted that effective use of the DHIS improves reliable and timely health information that can be used in operational and strategic healthcare decision-making.43 Stunting, the most common form of malnutrition in South Africa, should be routinely monitored.
Routine and accurate growth monitoring and plotting children’s weight and height in their Road to Health Book enables early detection and treatment of malnutrition as the height-for-age chart is included. However, this is often not done or prioritised as no performance expectations or monitoring systems are linked to this data. High patient caseloads, staff shortages, and other challenges compound matters and lead to inadequate growth monitoring of young children.44
4. Support for primary caregivers
The well-being of caregivers has a profound influence on children’s early development and along their life course. The capacity of caregivers to offer nurturing care can be undermined by the high levels of poverty, unemployment, domestic violence, lack of partner support and perinatal depression that many of South Africa’s primary caregivers experience. Support programmes and information on parenting can help, but this needs to be part of a much broader approach to building an environment where caregivers can thrive.
Young children need nurturing care to thrive and reach their full potential. Nurturing care is care that is responsive, encourages early learning, and is emotionally supportive.45
The World Health Organization’s Nurturing Care Framework for ECD is mirrored in South Africa’s National Integrated ECD Policy. These and other relevant frameworks and policies predominantly position the child as the sole focus of service delivery, possibly overlooking the integral role of parents and caregivers. An exclusively child-centred approach fails to acknowledge that caregivers are the primary conduit through which
children experience and interact with their surroundings. Consequently, there is a pressing need to reorient these frameworks to include the caregiver-child dyad as the central feature and to alter the composition and delivery of support services to address the linked needs of caregivers and their children more effectively.
To create a nurturing home environment, parents and caregivers require an enabling environment of support that prioritises their needs. Figure 13 illustrates how caregivers can be supported to ensure they have the necessary capabilities to provide responsive care to their children.
ACCESSIBLE
EARLY CHILDHOOD CARE AND EDUCATION SERVICES
Affordable, available and enriching childcare and education spaces for young children near to where they live
i NFORMAT i ON FOR AND COMMUN i CAT i ON W i TH CAREG i VERS
Easy access to quality, timely and relevant parenting information, targeted at women and men, through multi-channel public communications:
• Print e.g. Road to Health Booklet
• Radio Shows
• Digital e.g. Facebook, MomConnect
• Maternal child health call centre
• Television
CAREG i VERS + CH i LDREN
L i NKAGE TO SERV i CES
Quality home-visiting by community health workers to all vulnerable households
• Maternal and child healthcare (linkage)
• Social Grants / Birth Reg / IDs (linkage)
• Nutrition counselling (direct)
• Parenting counselling (direct)
i NCOME SUPPORT
• Maternal support grant for vulnerable pregnant women
• Increased coverage of Child Support Grant (CSG) from birth
• Increased value of CSG to food poverty line
• Linkage to job opportunities
• Reduce cost of highly nutritious basic foodstuffs
RESPONS i VE AND SENS i T i VE SERV i CES
• Primary clinic-based healthcare workers support parents/caregivers
• Provision of nutrition and health promotion at ECD sites
• Antenatal support (and support groups) for pregnant women
ACCESS i BLE PARENT i NG SUPPORT PROGRAMMES
• Evidence based individual/group parenting programmes targeted at most vulnerable households
• Tech-enabled parenting programmes
FIGURE 13: A CONSTELLATION OF SERVICES TO SUPPORT THE HOLISTIC NEEDS OF THE CAREGIVER/CHILD DYAD
Who are South Africa’s primary caregivers?
Women are overwhelmingly the primary caregivers for children in South Africa, and they often also bear the main financial responsibility for providing for children. Of the 7.2 million adult beneficiaries receiving the monthly Child Support Grant (CSG) for children in their care, over 90% are women.46 Some gender equity gains have been made in relation to work in South Africa, in that women’s labour force participation has increased in recent decades. The COVID-19 pandemic reversed these gains, with women bearing the brunt of lost work, lost hours of work, increased time spent on childcare, and a slower recovery to pre-COVID employment activity compared with men.47 Women’s unemployment rates remain significantly higher than those of men. Among those who do work, average earnings are lower for women than for men. Alongside this, marriage rates continue to decline. Children are increasingly born
outside of marriage or non-marital unions, and many children do not grow up with a co-resident father.48
According to the General Household Survey (GHS) 2022, 84% of children under the age of six years live with their biological mother, while only 38% have a biological father in their household. Around 4.6 million children under six do not have a co-resident father. There is considerable inequality in living arrangements in that young children in poor households are more likely than those in wealthier households to have parents living elsewhere. In the poorest 20% of households, only 19% of young children live with both parents, compared to 78% in the wealthiest 20% of households; and 79% of the poorest children do not have a co-resident father, compared with 20% of the wealthiest.49 The Western Cape and Gauteng have the highest child-parent co-residence rates.
Source: K Hall analysis
The fact that so many children do not have a coresident biological father does not mean that fathers and other male figures are absent from their lives. Children who do not live with their biological fathers may remain in contact with their fathers and receive support from them. Although less than 40% live in the same household as their fathers, nearly 80% share a household with at least one adult male.
Just as female caregivers are not necessarily biological mothers, fatherhood comes in many forms, not only biological. With almost 80% of children living in homes where men are present, there is potential for men, too, to take on childcare roles, shifting the ‘female burden of care’ narrative to one of shared care.50
Children with co-resident mothers (i.e. children under 6 who live in the same household as their biological mother)
Children with co-resident fathers (i.e. children under 6 who live in the same household as their biological father)
FIGURE 14: CO-RESIDENCE OF BIOLOGICAL PARENTS WITH CHILDREN UNDER SIX
FIGURE 15: ADULT AND PARENTAL CO-RESIDENCE IN HOUSEHOLDS WITH CHILDREN UNDER SIX
Children in households with women only (no men)
18% HH includes biological mother
4% No mother
Source: K Hall analysis
Children
36% HH includes both biological parents
HH includes mother (and other/s, including men), but no father
8% Neither parent
2% Includes father (and other/s); not mother
Understanding and supporting men as co-carers
MenCare is a global campaign to promote men’s and boys’ involvement as equitable, non-violent caregivers. MenCare partners in South Africa – Sonke Gender Justice and Promundo - conduct advocacy initiatives, research, and programming to engage men in positive parenting; equitable caregiving; violence prevention; and in maternal, newborn, and child health. The campaign aims to drive the possible benefits of increased involvement by fathers in the first 1,000 days as articulated in the State of South African Fathers report (2018). These include:
• The involvement of fathers in reproductive health planning reduces unintended pregnancies and helps with planned birth spacing, promoting birth preparedness.
• Practical and emotional support from fathers during pregnancy promotes maternal well-being and positive health behaviours. Support from fathers further improves women’s use of healthcare services during pregnancy and after the child is born, which contributes to better health outcomes for the mother and child.
• Early paternal attachment and active father involvement once the child is born may help to reduce harmful forms of masculinity that emphasize male control and emotional detachment, and are associated with reduced risk of future child abuse by the father.
• Paternal involvement and support can reduce the risk of postnatal depression.
• Fathers’ supportive attitudes are significant determinants of good breastfeeding practice.
• Fathers’ involvement in infants’ care also improves their own health and social connectivity.
The antenatal stage and first two years of the child’s life (the first 1,000 days) are a pivotal time to consciously involve male partners as caregivers in ways that are acceptable and meaningful to them, potentially setting them up for a continued care role across the life course of their child. Studies on infant–father attachment affirm the importance of early bonding during the prenatal period through seemingly simple acts of listening to the baby’s heartbeat and being present at the delivery.51 However, structural and attitudinal barriers exist to birth companions in labour wards.52
Antenatal and postnatal clinic visits are relatively well-attended by pregnant and post-partum women. They are important points of opportunity to include and involve fathers from the start of their child’s life.
According to the South Africa Demographic and Health Survey (SADHS) 2016, 76% of pregnant women attend at least four antenatal visits, and 75% of women access postnatal services six days post-delivery. The public health sector can promote male partner-friendly maternity clinics by, for example, sensitising healthcare workers to the maternal and child health and wellness benefits of father involvement so that they enable and encourage male partners to join their pregnant partners at antenatal clinic visits. Other options include offering antenatal clinics outside of typical work hours, specific days for partners so that male partners see other males supporting their pregnant partners, and integrating services to address the specific health needs of male clients.
Care for parental mental health
The mental health of caregivers influences how they respond to the needs of their children. Expectant and new mothers and fathers both experience stressors and increased demands, which can affect their mood and mental health, making them more vulnerable to anxiety and depression. Hormonal changes in women increase their vulnerability to depression and anxiety.
Perinatal depression and anxiety can have intergenerational ramifications associated with, among other things, pre-term birth, low birth weight, malnutrition and suicide. in South Africa, the rate of perinatal depression is approximately 40%, jeopardising the health and well-being of the mother, infant and family.53 There is ample opportunity to engage with women when they attend routine antenatal and postnatal care at public health facilities. This vulnerable time is the perfect opportunity to integrate perinatal mental health screening along with the necessary care indicated by
such screening. If perinatal spaces were also more malepartner-friendly, these services could be extended to male caregivers, as well as normalising male-partner support and acknowledging the reality of paternal perinatal depression.
Despite improving mental health policies to include routine screening, serious implementation challenges block widespread access. These include underfunding and staff shortages, which limit the provision of counselling and therapeutic services.54
Women who give birth at a very young age are at an even higher risk for perinatal depression and anxiety. Caregiver mental health support needs to be differentiated to cater to the needs of particularly vulnerable caregivers, such as teenagers and young adults without adequate family support. South Africa has relatively high rates of childbearing among young women under 24 years. The reported rate remained fairly stable for over a decade, with less than 3% of teenage girls aged 15-17 giving birth each year. The rates rise to around 8% of young women aged 18-20 and 10% in the 21-24 age group.55
An analysis of public sector data from the District Health Information System (DHIS) found that teenage births increased yearly in most provinces between 2017 and 2021. Over this period, the births to young teens aged 1014 nationally increased from 2,726 to 4,452. The analysis also identified an 18% increase in births among adolescent girls aged 15-19, from just under 120,000 in 2017/18 to an estimated 146,000 in 2021/22.56
Differentiated support options need to be explored for teen mothers, especially as pregnancies among teens are usually unplanned and may be the result of risky or coerced sex.
47 %
47% of pregnant women suffer from antenatal depression and up to 34% of women suffer from postnatal depression
Teen mothers are particularly vulnerable to perinatal mental health challenges in the face of harsh judgement or rejection from family and community, as well as the loss of a future imagined. Despite ample literature on the risks associated with adolescent pregnancy, evidence on preventing poor mental health in this vulnerable group is lacking. A systematic review of psychosocial support interventions for pregnant and parent adolescents revealed that such interventions may have promising effects on their mental health and the rate at which girls in these groups return to school.57 More research is
needed to build the evidence base and inform policies and programmes.
The babies of teenage mothers may also need additional monitoring and support to ensure that they develop healthily and are adequately provided for, including being cared for in safe environments if the mother needs to return to school after birth. Of the 92% of infants who could be matched to their mothers in 2022, 8% had mothers under 20 years old when they gave birth. This represents almost 100,000 babies with young mothers who may still be completing school.
Differentiated support for teen mothers
Flourish is a Grow Great programme made up of a national network of antenatal and postnatal classes. Some Flourish class hosts are particularly interested in supporting pregnant and parent adolescents in their community and have partnered with local schools and teen parent support groups to meet them ‘where they are’ with permission from principals and school governing bodies. When asked if they enjoyed their Flourish experience, this is what some of the teen mothers in Mopani district, Limpopo, had to say:
“She (Flourish host) is free; you can share anything with her. I was afraid to ask my mom some questions regarding pregnancy as I am a teenager, but with Marcia, I was free; she made us feel welcomed and safe.”
“I am 18 years old; no one judged me. I was free in class.”
“Yes, especially teen moms, cos we are afraid to ask our moms questions.”
One Flourish host describes the following experience with a learner in her antenatal class in Soshunguve: “She came straight from the school and just unbuttoned her school pants and sighed, saying here is the only place where she can show her pregnant stomach.”
Income support and nutrition for caregivers
Poor caregivers need income support, as much for their mental health as for their ability to provide for the nutritional and material needs of themselves and their children. Poverty hurts caregivers’ mental health when caregivers see that they are unable to provide for their children.58
A study of over 2,500 pregnant women in low-income communities of the Western Cape revealed an association between poor maternal mental health and child hunger.59 In the study, 22% of pregnant mothers reported that a child in their home had gone to bed hungry in the last seven days, and 39% of pregnant respondents reported that they had experienced hunger in the past week.
These mothers were three times more likely than those who had not experienced hunger to report feeling down, depressed or hopeless and almost twice as likely to have little interest or pleasure in doing things. Of these mothers, the odds of a low mental health score further increased when she also reported that a child in their household had gone to bed hungry. Mothers who received no direct grant income (such as the CSG) were 63% more likely to report high symptomatology on the mental health scale used compared to those women receiving grant income.
At a national scale, the share of children under six living in food-poor households (below the food poverty line) has increased from 33% in 2018 to 39% in 2022.
Over the same period, the share of children under six years living in a home where no adults are employed increased from 29% to 32%. In 2022, 26% of children under six lived in households that had to reduce the range of foods in their diet due to lack of money, and 20% lived in households that had months when they ran out of money for food. The effects of poverty and food insecurity are not only reflected in child malnutrition and high stunting rates but are also likely to exacerbate stress and poor mental health among their mothers, with further consequences for the well-being of their young children.
While support for caregiver mental health forms the foundation from which caregivers can be responsive to their children, it is inextricably linked to their need for income support to responsively provide for their nutrition, shelter, health, clothing, education, and other basic needs. There is extensive evidence that caregivers use cash grants to improve the lives of the children in the home.60 Over 90% of child grant beneficiaries are women, but there is also evidence that when men receive the grants, these are also often spent for the child’s benefit.61
However, the CSG alone is not sufficient income support for caregivers to provide all that their children need to mitigate the risks of stunting and enable them to thrive. The value of the CSG is very low (R530 per month in 2024), and its value has decreased in real terms over time as the annual increases in the grant amount have not kept pace with food inflation. Many infants are also excluded from receiving the CSG because of birth registration delays and late enrolment onto the grant. The delays could be resolved by extending the grant into the prenatal period.
A maternity support grant (MSG) for pregnant women has been proposed as a feasible and effective intervention that could be implemented within existing social support programmes 62,63 It would increase food
and income security during pregnancy and immediately following birth, both critical times for safeguarding maternal nutrition and mental health. It would also have intergenerational implications as nutritional status during pregnancy is a key determinant of birth weight and, thus, of childhood stunting. An MSG would, therefore, help to ensure healthy pregnancy, mitigate the risks of child stunting and other childhood illnesses and likely improve the mental well-being of mothers.
The introduction of an MSG would also address the persistently low uptake of the CSG for infants by ensuring a seamless transition to the CSG immediately after the child is born. Ideally, pregnant women would access the MSG from the start of their second trimester and receive it continuously for the remainder of the pregnancy, after which it would convert to the CSG on the birth of the child. The grant value would, therefore, be linked to the CSG value rather than the lower Social Relief of Distress grant for unemployed adults (R370 per month in 2024). For some years, the MSG has been among the policy options under consideration by the Department of Social Development as part of its “comprehensive social security” package.
The share of children under six years living in a home where no adults are employed increased from 29% in 2018 to 32% in 2022.
3 Year change indicator
Children with coresident mothers
Children under-6 who live with their biological mother in the same HH
Children with coresident fathers
Children under-6 who have their biological father in the same HH
Female care burden Children under-6 who live in women-only HHs
Babies with young mothers Infants <1 whose mothers were teens (<20 years) when they were born
Breastfeeding education
% of mothers (15-49 years) who reported receiving information on breastfeeding
Follow-up ante-natal visits
% of pregnant women attending facilities who had at least 4 ante-natal visits
numbers have increased or decreased since the pre-COVID baseline worsening / negative improving / positive no significant change
no significant change between pre-COVID baseline and most recent data no discernible change due to lack of comparative data
Data gaps and challenges
The last nationally representative data on perinatal services to support mothers, such as follow-up antenatal visits and breastfeeding education, came from the 2016 South African Demographic Survey. More regular surveys of this type would enable better monitoring of women’s access to support services during and after pregnancy.
There is no reliable national data on the prevalence of mothers who struggle with poor mental health. Studies that estimate the rate of perinatal depression, stress, or anxiety range from 16% to 50%. This wide range is partly due to varying methods, study populations, and measurement challenges.64
5. Income support and social services
Households with young children need adequate income to provide good nutrition and nurturing care to their children. Over 60% of children under six are in households that are too poor to afford their basic needs, and nearly 40% are in households living below the food poverty line. Income support via social grants provides an essential lifeline for these children. All children should have access to quality social welfare and child protection services when they need them.
PHOTO: L. Mgcineno Mapukata reads to his daughters at home in Amanjingqi, Eastern Cape (Photo: DGMT, 2018)
The Child Support Grant (CSG) offers income support for poor children by providing a monthly grant to their caregivers to spend on their basic needs. Initiated in 1998 as one of the first scalable poverty alleviation programmes in the new democratic South Africa, it expanded rapidly over the next decade. In 2023, the grant reached over 13 million children every month, of whom 4.2 million were under six.
Human development impacts of the Child Support Grant
Social grants are widely regarded as South Africa’s most successful poverty alleviation strategy. The CSG is well targeted to the poor, and there is a wealth of evidence on its beneficial impacts for children despite its modest value (R530 per month in 2024).
• The CSG has been associated with increased household expenditure on food65 and decreased “undesirable” goods such as tobacco and alcohol.66
• The CSG has been directly associated with reduced reported child hunger, especially in the poorest households.67
• Receiving a CSG during the first two years of life significantly improves children’s nutritional status, measured through height-for-age scores (in other words, it reduces stunting rates among beneficiaries relative to non-beneficiaries at the same income level). However, the significant gains are only achieved when CSG access starts early and is sustained through the early years of a child’s life.68
• The CSG is associated with improved health service access and better health outcomes. Receiving the CSG in the first two years of a child’s life increases the probability that the child’s growth is monitored
at a clinic. Boys who access the grant during the first year of their life are less likely to suffer from illness than those who have not received the grant.69
• The CSG is associated with higher levels of access to early learning programmes (ELPs). For example, a study of children living in rural and informal urban areas found that those receiving the grant were one and a half times as likely to attend an ECD facility or Grade R as those not getting the grant.70 CSG receipt also seems to encourage the utilisation of ELPs from a slightly earlier age and increases the length of attendance by girls.71 Caregivers report using the CSG to pay for ECD fees,72 and the recent ECD audit showed that, among children attending ECD facilities, the poorest caregivers spent about half the value of the CSG in ECD fees.73
• In facilitating access to ELPs, the CSG also reduces the gap in access for rich and poor children, thus reducing inequalities in learning before children start formal school.74 However, the fact that the poorest households spent a substantial portion of the grant on ECD fees means that educational access may come at the cost of meeting the child’s nutritional needs.
• The CSG contributed significantly to SA’s success in improving current-year birth registration (within a year of the child’s birth) as a percentage of the total births registered each year. Current-year birth registrations began to rise steeply after the CSG was introduced, from 22% in 1998 to 70% by 2009 and 91% in 2019. This is widely attributed to the rollout of birth registration desks in maternity wards and the fact that a birth certificate is generally required to apply for the grant. The increases in current-year birth registrations were even more pronounced in the more rural provinces where the majority of children live, like the Eastern Cape (where the share of infants registered within a year of their birth increased from 13% in 1998 to 90% in 2019) and Limpopo (from 10% to 95%).75
Social grants are widely regarded as South Africa’s most successful poverty alleviation strategy.
In addition to alleviating income poverty, the CSG offers some protection against the structural causes of poor early childhood development and helps to reduce inequality. However, early and continuous access to the CSG is necessary to achieve many benefits. A higher grant amount would also help achieve broader benefits like ECD access and regular health visits without families compromising their children’s other basic needs – like nutrition.
Erosion of the Child Support Grant value
The real value of the CSG has been reduced over time. it no longer provides enough money for a child’s basic nutritional needs. While the right to social assistance is a right that requires progressive realisation,76 the grant has been regressive in terms of its monetary value and its objectives. This is a concern because it means the impacts on human development will also be reduced.
When the CSG was initially introduced in 1998, the monthly value of the grant was set at an amount meant to cover a child’s basic food and clothing costs. Due to below food inflation increases over the years, the CSG has lost its value relative to the cost of basic food. For example, in April 2023, food inflation reached 14% compared with the previous April. The annual April increase to the CSG in 2023 was just 4.2%. The widening gap between the value of the grant and the official food poverty line published by Stats SA is illustrated in Figure 16.
In 2023/24, the average value of the CSG was R505 per child per month (R500 from 1 April 2023 and R510 from 1 October). The food poverty line in 2023 was R760 per person per month.78 The value of the CSG is, therefore, 33% below the food poverty line and does not provide
enough income to feed a child a basic diet that meets their minimum calorie needs. The CSG was increased by R20 to R530 from 1 April 2024, while the food poverty line is anticipated to reach nearly R800 in 2024. In the context of austerity budgeting, social spending cuts and multiple competing claims on the budget for additional funding, there are concerns that the value of the CSG will continue to be eroded by below-inflation increases, with dire consequences for young children’s nutrition and development.79
Delays in Child Support Grant uptake for young children: the link to birth registration
in 2023, 4.27 million children under six received the CSG, representing 63% of all children in this age group. Despite rising poverty levels, grant uptake for young children remained relatively stable over the lockdown years of 2020 and 2021. In March 2023, there were 40,000 fewer grant beneficiaries under 6 years than in March 2020, when South Africa went into lockdown. This
FIGURE 17: UNDER-1 BIRTH REGISTRATION AND CHILD SUPPORT GRANT ACCESS FOR INFANTS
Infant population <1 (MYPE 2022)
Current-year birth registrations (full year)
Children <1 receiving CSG (March)
Source: Compiled from Stats SA Mid-year population estimates (2022 series), Stats SA Recorded Live Births 2008-2020, and SASSA grant data by request.
suggests that the errors of exclusion for young children have increased in recent years, with more eligible children being unable to access the CSG. This is a reversal of the gains made in the previous decade.
To maximise the developmental impacts of the CSG, it is critical to ensure early uptake among infants and continuous access to the grant, especially in the early years. Although CSG uptake among infants has remained stubbornly low relative to children over one year, there was some improvement in early uptake during the decade leading up to COVID-19 and lockdown. One of the key reasons for the delay in accessing the CSG for babies is a lack of identity documentation for mothers and birth registration delays for the baby.80
Figure 17 shows the sharp drop in current-year birth registrations in 2020. Even after a considerable recovery of birth registration rates in 2021, CSG uptake for infants continued to fall.
Alongside the decline and delays in birth registration, there was a real decrease in CSG take-up among infants. The first sharp drop occurred between March 2020 and March 2021, with a decrease of just over 100,000 infants receiving the CSG.81 The trend was not reversed after the lockdown ended. Although the rate of decline slowed subsequently, the number of infants receiving the CSG has continued to decline each year, by another 1% in 2022 and by 6% in 2023. At the end of March 2023, 150,000 fewer infants received the grant than in March 2020, just before the lockdown. This represents a decrease of 23% in early CSG uptake.
Source: SASSA grant reports
TABLE 7. DECLINING CHILD SUPPORT GRANT UPTAKE FOR INFANTS UNDER ONE YEAR OF AGE
Source: SASSA Statistical Reports 2019-2023.
The decline in early CSG uptake occurred across all the provinces. In terms of numbers, the most significant drop between 2020 and 2023 occurred in Gauteng, KwaZuluNatal, and Limpopo. In percentage terms, the greatest loss was in the Western Cape (where infant uptake was 48% lower in 2023 than in 2020), Gauteng (a 29% reduction in early uptake), North West, and Free State (both declined by 22%).
CSG access for infants has declined at the same time as poverty rates increased for infants (see Chapter 1 –Children under 6). This means that, for this cohort of very young children, many of the developmental impacts of the CSG, which depend on early and sustained access to poverty alleviation, will have been lost.
Birth registration trends and challenges
From the moment they are born, all children in South Africa are entitled to a name and nationality. The state confers this through birth registration and, in the case of children who are citizens, a South African identity number.
Birth certificates are the gateway to a range of critical services for supporting children in reaching their developmental potential. Obstacles to birth registration serve to deepen existing inequalities because children
without birth certificates are likely to come from poor families to start with and then suffer further deprivation because of being unregistered. Early registration of births is important because a birth certificate is an “enabling document” – a gateway to other services and benefits, including the CSG. Not having a birth certificate can undermine a child’s access to the services needed for survival, healthy development and learning.
Early birth registration (within 30 days of birth) has improved as a percentage of current-year birth registrations from 55% in 2010/11 to 94% in 2019/2020. Besides the availability of the CSG creating an incentive for early birth registration, the rollout of home affairs service points in health facilities from 2010 onwards has greatly improved early birth registration.
Linking birth registration services to health facilities
Most births occur in health facilities, so it is important to have a good footprint of birth registration services within these facilities. Facility-based home affairs service points enable parents to apply for immediate birth registration of their newborn child. Of the 1,445 public health facilities in which births occur, 322 had service points for birth registration by 2019.82 The majority (78%) of these are ‘priority 1 – 3’ facilities, with high volumes of births accounting for over 84,5% of all births at health facilities in the country.
FIGURE 18: PROVINCIAL TRENDS IN CHILD SUPPORT GRANT ACCESS FOR INFANTS
However, in 2023, the Department of Home Affairs (DHA) reported that only 85 of the 251 high-volume centres had full-time staff capacity during the 2023/24 financial year. This means that while these facilities account for 84,5% of all births at facilities, this percentage of births are not able to be registered by the DHA partly due to DHA staff not being present at the service points.83
In July 2019, the DHA launched a programme to expand to all 1,445 public health facilities where births occur.84 This would mean adding the 1,194 priority 4 and 5 facilities where lower volumes of births occur. By mid-2023, the DHA had not established service points in any additional facilities but was able to report on progress in “optimising” 160 of the 251 priority 1 – 3 facilities.85 Optimising ensures the service point is digitally connected to the National Population Register and can issue birth certificates immediately. These 160 facilities account for 62% of births in public health facilities.86 Ensuring full staff capacity at these 160 facilities will maximise the investment made in ensuring they are digitally connected.
Late birth registration
Current-year birth registrations stabilised from around 2010, with a shortfall of about 200,000 children per year
not being registered each year since then. In other words, for the past decade, around 200,000 of the approximately 1.1 million children born each year were not registered within a year of their birth. These children require late registration. Many are registered in later years, while others remain unregistered for years, with some becoming unregistered adults.
if a baby is not registered within 30 days, their caregiver needs to navigate the more complex process of “late registration of birth.” It is even more difficult to register a birth after the child is a year old, especially if over 7 years of age, due to the additional requirements to prove the child’s birth, parental identity, existence, and citizenship. The documentary requirements include Proof of Birth forms or a birth witness affidavit and numerous supporting documents depending on who is applying and the child’s age. These can consist of paternity tests from the Department of Health (which the family must pay for), social worker reports from the Department of Social Development, court orders from the Children’s Court and High Court, letters from school principals and copies of Grade 1 admission registers from the Department of Education, and reference letters from traditional leaders or ward councillors.
Infants < 1 (population)
Current year birth registrations
FIGURE 19: TRENDS IN THE UNDER-1 POPULATION AND CURRENT-YEAR BIRTH REGISTRATIONS
Late registration is generally discouraged by the DHA to promote and encourage early birth registration. However, this approach also leads to late registration being deprioritised as a service area for resourcing. Until late registration is accepted as an inevitability for at least 200,000 children per year and adequately resourced, South Africa will not achieve completeness of birth registration.
The challenges to achieving birth registration completeness have persisted for over a decade and preceded COVID-19, although lockdown exacerbated the situation.
impact of COViD-19
Birth registration rates fell sharply in 2020. The declining birth registration rate in 2020 was evident in early registration (within 30 days of birth) and current-year birth registration rates (within one year). Birth registration within 30 days had been increasing up to 2019 when around 80% of births that occurred were registered within 30 days.88 Then, the number of unregistered infants, even after a year, leapt from 190,000 in 2019/20 to 255,000 in 2020/2021.
The decline in current year birth registration is unrelated to the decrease in fertility rates because the birth registration rate is based on the number of live births within a year.89 The drop in birth registration was initially due to the initial closure of DHA offices during the hard lockdown of 2020, and then only limited services when they opened. Even after the lockdown restrictions were lifted entirely, DHA services continued to be hampered by capacity constraints, backlogs, and load-shedding.
The number of current-year birth registrations in 2021/22 appears to have improved to its best level yet. Comparing current-year birth registration numbers with the mid-year population estimates for infants, only 127,000 (11%) births during 2021 were not registered in the same
year. However, there is some uncertainty around these estimates, as in some provinces, the number of registered births exceeded the number of births estimated for the same year. Only in retrospect, once reliable population data become available, will we know whether there was a substantial increase in births during 2021. Future analysis will also need to investigate the extent to which those who could not register during the 2020-2021 lockdown period have been able to navigate the more complicated late registration process
Eliminating the birth registration backlog
A substantial backlog in late registration applications had already started before COViD-19. In response to a question in Parliament in 2023, the Minister of the DHA revealed that there was a backlog of 258,000 unprocessed applications for late registration of birth for applications lodged over the period January 2018 to December 2022.90 Applications lodged before the lockdown in 2020 stalled during the lockdown as late registration of birth (including back-office processes such as verification of supporting documents and interviews) was one of the services not provided during the lockdown, creating a backlog that capacity constraints have since compounded due to loadshedding and austerity budgeting.
Many births are still registered at DHA offices between the 31-day period and one year of age, and a smaller number after one year. These are all considered “late registrations”. The regulations, forms, and internal protocols governing late registration need to be reviewed and reformed to include all children, and the systems need to be sufficiently flexible to accommodate different scenarios. Rather than being excluded from services, unregistered children should be fast-tracked into a responsive government service that proactively assists with their registration.
Child Support Grant access for children without birth certificates
The number of unregistered infants, even after a year, leapt from 190,000 in 2019/20 to 255,000 in 2020/2021 34%
A caregiver can apply for a CSG for her child even if she has not managed to obtain her iD or her child’s birth certificate. This is due to a little-known regulation of the Social Assistance Act.91 Regulation 13(1) provides an exception to the usual requirement of a birth certificate (for the child) and/or an identity document (for the caregiver). It clearly states that the South African Social Security Agency (SASSA) must accept the grant application even if these documents cannot be provided.
Instead, a SASSA prescribed affidavit is required. In practice, SASSA also requests one of the following supporting documents:
• Road to Health Book; or
• Baptismal certificate; or
• Letter from a reputable person, such as a school principal, traditional leader, councillor, social worker, or religious minister, vouching for the identity of the child; or
• Latest school report or proof of school attendance; or
• Proof of application to the DHA for the ID or birth certificate; or
• A copy of a Section 24 permit (refugees).92
The exact number of unregistered children in South Africa is unknown. Using data from the National Income Dynamics Study, one estimate put the total number of unregistered children (under 18 years) at around 500,000 in 2017.93 Given the negative effect of lockdown and loadshedding on access to birth registration services, it is likely that the number of unregistered children will have increased considerably since the 2017 estimate. Administrative data (for example, from the Department of Basic Education94 and Stats SA95) also indicate that the number may be considerably higher, at over a million.
Unregistered children are likely to live in very poor households. They may also have absent or deceased parents, and they may be vulnerable in other ways too: they are less likely than registered children to have access to a Road to Health Book, suggesting that they are not accessing early growth monitoring and vaccination services. Importantly, they are less likely than registered children to have access to a social grant.
The number of children without birth certificates receiving social grants increased gradually from a very low base as civil society groups collaborated with SASSA to raise awareness of this option and after SASSA agreed in mid-2020 to stop cancelling the grants after three months of payment. At the end of October 2023, 54,800 children without birth certificates and 10,600 caregivers without identity documents were accessing grants for children.96
Although an improvement, this is a small proportion of the estimated 500,000 to 1 million undocumented children in South Africa.97
The need for social welfare and protection services
There are no reliable data on the number of children needing social welfare services, or on the extent of services delivered and service delivery gaps. Social services for young children as defined in the Children’s Act include prevention and early intervention services such as child and family counselling, parenting skills programmes and support for young mothers; protection services for children who have been abused, abandoned or neglected; and the provision of alternative care, including foster care, adoption and child and youth care centres.
Data on child abuse, neglect and related service responses remain very poor – in part because child abuse and other crimes against children are underreported. The Department of Social Development recorded 17,488 cases of child abuse and neglect in 2022, but it is unknown how many of these were investigated or referred to the police. The South African Police Service does not provide statistics on child abuse in its crime reports. According to the police reports, 864 child murders were recorded between January and September 2022 – an average of nine children murdered every day and an increase of 27% from the previous year.98
35% of South African children (reporting retrospectively at ages 15-17) had already experienced some form of sexual abuse during childhood
The Optimus study provided the first-ever nationally representative data on child maltreatment and exposure to violence in South Africa. The data found that around 35% of children (reporting retrospectively at ages 15-17) had already experienced some form of sexual abuse during childhood. Among girls, the first experience of sexual abuse may have started as early as four years of age. In addition, over 20% of children had experienced physical abuse, and between 12% and 15% reported childhood neglect.99
Young children are particularly vulnerable to child abuse and neglect because they are dependent on caregivers and are unable to protect themselves. The Birth-toTwenty study, a longitudinal study of children born in Soweto, suggested that children’s exposure to violence in the home is widespread: 99% of children in its sample had experienced or witnessed acts of violence in childhood, and nearly half of preschool children had experienced physical punishment by a parent or caregiver.100 Earlier research had revealed that those most likely to be smacked or beaten were between the ages of three and four years.
The most severe form of child abuse is infanticide. A national survey of child homicides found that most fatal child abuse cases occurred among children under five years of age and that 75% of homicides among young children (0-4 years) were the result of abuse by a caregiver in their own home.101
The line between physical punishment and child abuse is easily blurred, and it is for this reason that child rights organisations have long advocated for a complete ban on corporal punishment. Corporal punishment was banned in schools as early as 1997 but is still widely practised. Stats SA reported that although reported exposure to violence in schools has reduced substantially (from 18% of learners in 2009 to 8% of learners in 2019), the vast majority of those who experienced violence in all years (over 80%) had been subjected to corporal punishment by a teacher. The same study found that adults widely believed corporal punishment in school was justifiable in some circumstances. There have been no studies of the prevalence of violence and corporal punishment in early learning facilities.
In 2019, the Constitutional Court effectively banned corporal punishment in the home by ruling that the common law defence of ‘reasonable and moderate chastisement’ was unconstitutional. Yet in 2019/20, one in ten households with children was unaware that corporal punishment was illegal. As many as a third of adult respondents living with children thought that corporal punishment at home was acceptable in certain circumstances.102
increased efforts are needed to strengthen the child protection system and to ensure that the various dutybearers, such as the police services, the departments of Social Development and Health and the criminal justice system, can collaborate well to improve the efficiency of responsive services and referral systems.
%
75% of homicides among young children (0-4 years) were the result of abuse by a caregiver in their own home.
The National Child Care and Protection Policy, published in 2019, acknowledges both the inadequacy of monitoring systems, and the serious scale of the gaps in responsive service delivery for children 103 For example, drawing on a small set of localised studies, it was found that:
• Of all the cases of violence and child abuse that were reported to social services, 52% of children received no therapeutic support at all;
• Of all the children removed from their families due to abuse and neglect, 58% did not benefit from reunification services and were still in alternative care four years later;
• Most social workers and police were reluctant to report or act against parents for the abuse of their children, even though family members perpetrated 80% of abuse cases against children aged 0-4 years; and
• Assessments and investigations by social workers are often inadequate and cursory. Of the investigations that were undertaken following reported cases of violence and abuse, 19% took more than a year, and very few cases of child abuse were referred to the Children’s Court by social workers despite a legal duty to do so.
Chapter 5 of the National Integrated ECD Policy outlines a continuum of services to strengthen the childcare and protection system. The policy document acknowledges that successful implementation depends on having adequate numbers of practitioners with the proper range of competencies. However, South Africa still has a severe shortfall of social workers (around 22,000 in the public service according to recent estimates, against a target of 55,000). The target for Priority 4 of the Medium-Term Strategic Framework is to increase the number of social service professionals to 31,744104 at an estimated cost of R9 billion by 2030.105
Social welfare services have always been shared between the public sector (government) and nongovernmental organisations such as the Child Welfare Society. Organisations that provide welfare services have historically received state funding, but the budget allocations to non-profit organisations providing welfare services have been cut substantially in recent years. This directly impacts their ability to recruit, train, and retain staff to provide much-needed services.
With the mandate for ECD having shifted to the Department of Basic Education and social grants administered by SASSA, the performance of the Department of Social Development will increasingly be assessed by the efficiency and quality of the social services it provides.
Access to Child Support Grant
Poor infants without grants Number and percentage of poor children < 1 year not receiving CSG or any grant
numbers have increased or decreased since the pre-COVID baseline worsening / negative improving / positive no significant change no significant change between pre-COVID baseline and most recent data no discernible change due to lack of comparative data
TABLE 8: SOCIAL ASSISTANCE AND SOCIAL SERVICES ACCESS, BY PROVINCE
Data gaps and challenges
There is a need for regular national data on the incidence and prevalence of child abuse (including corporal punishment and sexual abuse) and neglect. The data would need to come from reported cases to social services and the police because these issues are challenging to determine routinely in surveys. Sound administrative systems must ensure that records are accurately recorded and maintained in local offices and properly compiled at provincial and national levels.
There is also a need for good administrative data on the delivery of responsive child protection services and psychosocial support for children. For example, tracking the number and proportion of child protection cases brought before the court within 90 days would be useful, as stipulated in the Children’s Act. This would involve linked administrative data systems for the Department of Social Development and the Department of Justice and Constitutional Development – particularly the Children’s Courts.
Although disability is known to be a particular form of vulnerability, South Africa does not have a nationally accepted tool for measuring the prevalence of
disability, especially in children. The last dedicated national disability prevalence survey in South Africa was conducted in 1999. More recently, Stats SA included modules of disability questions in the Population Census, the Community Survey and some of the General Household Surveys. Still, these cannot be used reliably to determine child disability rates as the “domains of functioning” measures are not adequately sensitive to normal development processes, particularly for young children.106 Estimates of disability rates from these sources show huge discrepancies, ranging from 0.9% to 27.5% of young children under 4 years and between 0.6% and 11.2% of the total child population.107
The revised Road to Health Book includes a potential tool to identify young children at risk of disability and developmental delay, and certain screening systems for identifying disability in school-age children have been introduced through the education system in conjunction with the Department of Health – including assessments of hearing, speech, and gross motor function. The effectiveness of these tools will depend on how well and consistently they are applied by different assessors across different settings.
6. Stimulation for early learning
Young children learn naturally from the moment they are born. They learn through their interactions with others and through their engagement with their surroundings, including everyday activities in their homes and communities and more structured activities with peers and practitioners in early learning programmes. This chapter shares recent advancements in early learning in South Africa, noting some of the gains made and highlighting remaining impediments to affordable access to quality early learning for all.
Universal provision of high-quality early learning programmes (ELPs) is an essential component of our efforts to ensure child well-being, improve education outcomes, and reduce unemployment and inequality.
The home environment is critical in early learning, particularly in the first two years of life. In these earliest years, support to parents and other caregivers is essential to strengthen care and learning in the home, especially amongst vulnerable households. In addition, safe and nurturing childcare services are needed for working parents (see Chapter 4 - Support for Primary Caregivers).
It is recommended that children from around three years of age have access to more structured learning opportunities through their participation in ELPs such as preschools or ECD centres. Children who have access to at least two years of a high-quality ELP are more likely to acquire the cognitive, social and emotional skills needed to cope well with the transition into formal schooling and with the demands of the Foundation Phase curriculum.108 Access to quality early learning opportunities has also been shown to be associated with longer-term gains, improving children’s trajectories through school and even into adulthood.109 While all children benefit from highquality ELPs, the development gains are most pronounced for those from disadvantaged backgrounds.110
Data developments over the past two years have been significant
Earlier editions of the SAECR reported an absence of data on early learning. Since then, the situation has changed dramatically, and several major initiatives have been undertaken to address data gaps. These initiatives have largely been spearheaded by the Department of Basic Education (DBE) following the decision taken in 2019 that responsibility for ECD would shift from the Department of Social Development to the DBE as of 1 April 2022.
Major data initiatives
The ECD Census: In preparation for the ECD function shift and to enable better oversight, support and resource allocation, the DBE commissioned an ECD Census,111 the most extensive effort to date to map the ELP landscape in South Africa. The ECD Census sought to identify and document every ELP (registered and unregistered) nationwide. Data for the ECD Census were collected
between August 2021 and February 2022, and included information on location, operations, income sources, learning resources, registration status, child enrolments, staffing, teaching practices, and infrastructure at 42,420 early learning sites nationally.
The Thrive by Five index:112 Launched in April 2022, the Index is the first (baseline) in a series of surveys that will monitor trends over time in the proportion of preschool children who are on track for their age in three key areas of development: early learning, physical growth, and socio-emotional functioning. Between September and November 2021, the Index assessed 5,139 children between the ages of 50 and 59 months enrolled in 1,247 ELPs across all nine provinces. The Index’s next round of data collection is planned for the final quarter of 2024.
The ELP Baseline Assessment: The baseline assessment113 was undertaken alongside the Thrive by Five Index. ELP principal and practitioner interviews were conducted in 545 of the 1,247 ELPs participating in the Index, with the weighted analyses computed on 522 ELPs. Trained assessors also observed and rated the quality of the learning environment and practitionerchild interactions at each site. These programme assessments offer additional insights into the type and quality of provisioning in differently resourced areas. For the next round of the Thrive by Five Index, the intention is to conduct programme quality assessments at all participating ELPs.
Access to early learning programmes remains skewed across provinces and income groups
According to nationally representative survey data collected by Stats SA (General Household Survey 2022), 68% of children aged 3-5 years attended a group learning programme of some kind in 2022; with 45% of 3-5 years olds attending ECD centres, crèches, and playgroups; and 23% attending primary school (typically Grade R). The national ECD Census (2021/2022) found slightly lower figures, recording estimated enrolment rates of 34% amongst children aged 3-5 years (excluding Grade R). The difference may be because the ECD Census was conducted partly during the previous year (2021), when enrolment rates remained lower due to COVID-19 and did not reach all ELPs nationally.
TABLE 9: ACCESS TO EARLY LEARNiNG AMONG 3-5-YEAR-OLDS
(Grade R or higher)
(crèche/ECD centre/nursery school)
Source: K Hall. Analysis of Stats SA General Household Survey 2022.
There remains a need for considerable expansion of ELPs to achieve the National Development Plan goal of universal access by 2030. Nationally, around 1.15 million children aged 3-5 years are not enrolled in any kind of ELP.114 Important to note is that there are another 800,000 children aged 3-5 years enrolled in Grade R or above. Of these, 17%115 are below the official Grade R enrolment age and are likely to have been sent to school earlier
Group Learning Programmes
than is recommended because of ELP fee barriers.116 The access gap of 1.15 million is, therefore, likely to be an underestimate of the actual early learning service gap.
Enrolment rates in group learning programmes (including centre-based programmes, playgroups, and primary schools) within provinces range from 58% of 3-5-yearolds in the Northern Cape to 79% in the Free State. FiGURE 20: PERCENTAGE OF CHiLDREN AGED 3-5 YEARS ATTENDiNG A
Children attending Not attending
Source: K Hall. Analysis of Stats SA General Household Survey 2022
Of the 1.15 million children aged 3 to 5 years not enrolled in any kind of group learning programme, over 40% live in just two provinces, with 22% (250,000 children) in KwaZulu-Natal and 21% (238,000 children) in Gauteng.
The ECD Census also records a high variation in ELP enrolment per child population across municipalities, with enrolment rates in some areas being eight times as high as in others.117 With the ECD Census data now available, efforts to expand access can be focused on geographic areas of greatest need.
Early learning programme
access trends show the impact of COVID-19
When looking at ELP enrolment data over time, the impact of the COVID-19 lockdown is evident. On 18 March 2020, ECD programmes across South Africa were instructed to
close as part of national efforts to curb the spread of the coronavirus. In July of the same year, ECD programmes were legally permitted to reopen, provided they met COVID-19-specific health and safety standards. Sector recovery was slow,118 and surveys conducted in April 2020 (8,500 ECD providers) and August 2020 (4,500 ECD providers)119 found lack of resources to be the main reason for continued ELP closures. With many parents unable to pay fees, delays in government ECD subsidy payments and the prohibitive costs associated with prescribed COVID-19 health and safety protocols, ELPs could not resume their services for much of 2020, leaving hundreds of thousands of children vulnerable. There was some recovery in 2021, but enrolment rates for children aged 3-5 years remained lower than they had been since 2014. By 2022, attendance rates had improved but had still not entirely caught up to pre-COVID-19 levels. 21
Source: K Hall. Analysis of Stats SA General Household Survey 2022.
Source: K Hall analysis of Stats SA General Household Survey 2022.
Insufficient funding for early learning places a burden on providers and parents
While COViD-19 undoubtedly impacted the sector financially, resourcing issues are systemic and enduring. In the 2020/2021 financial year, government expenditure on early learning amounted to R9.5 billion, of which 59% was allocated to Grade R provision and the remainder to pre-Grade R services, including the ECD subsidy (R2.8 billion), ELP infrastructure, and practitioner training. In contrast, it is estimated that R14 billion in ELP fees was paid by households over the same period, with approximately R3.7 billion spent by the poorest 60% of households.120
Only one-third of ELPs in the ECD Census report receiving a government subsidy.121 The vast majority of ELP income is raised through monthly parent fees, with 94% of ELPs charging fees and 69% of ELPs citing fees as the primary source of revenue. The ECD Census recorded a national average monthly fee of R509 per child, equivalent to approximately 110% of the value of the Child Support Grant at the time. This dependence on fees burdens families: 84% of parents whose children attend an ELP report paying fees.122
The reliance on fees also makes it challenging for programme operators to run sustainable enterprises:
62% of ELPs allow some children to attend even if parents cannot afford fees, and many ELPs charge very low fees.123 The reliance on fee income contributes to the discrepancies in ELP access amongst children across the income quintiles.124 A three-year-old child in the wealthiest quintile is 1.6 times more likely to attend an ELP than their same-age peer in quintile 1. Figure 23 on the next page illustrates how the access gap closes considerably as children grow older and become eligible for Grade R at no-fee schools.
Only one-third of early learning programmes in the ECD Census reported receiving a government subsidy.
FiGURE 23: iNEQUALiTY iN ENROLMENT OF CHiLDREN iN GROUP LEARNiNG PROGRAMMES
Source: K Hall. Analysis of Stats SA General Household Survey 2022.
Between 2014 and 2019, some progress was made in closing the “inequality gap” in access. Comparing young children (3-4 years) in quintiles 1 (poorest) and 5 (richest), the difference in reported attendance reduced from 37 percentage points in 2014 to 20 percentage points in 2019. Attendance rates plummeted across the board in 2020 when ELPs closed due to the COVID-19
lockdown. All quintiles experienced a similar drop in attendance, so this had little impact on the inequality of access. Attendance rates increased again in 2021 as ELPs resumed, but the result was a re-widening of the gap between Q1 and Q5 to 26 percentage points, setting South Africa back about five years when it comes to closing the inequality gap in access to early learning.
Source: K Hall analysis of Stats SA General Household Survey 2014 - 2022.
Quintile 5 (richest 20%)
Quintile 4
Quintile 3
Quintile 2
Quintile 1 (poorest 20%)
FiGURE 24: TRENDS iN ELP ATTENDANCE AMONG 3-4 YEAR-OLDS BY iNCOME QUiNTiLE (2014-2022)
ELP Quintiles127
Quintile 1
Quintile 2
Quintile 3
TABLE 10: COMPARATiVE FEES CHARGED BY SUBSiDiSED AND NON-SUBSiDiSED ECD PROGRAMMES
Average fees charged by ELPs not receiving the subsidy
R267
R297
R374
Source: DataDrive2030 analysis of ECD Census 2021 data
In the absence of substantially greater state support, there will always be a cap on the percentage of children whose families can afford the fees they must pay to access an ELP. Broadening the reach of the government ECD subsidy to all eligible providers (group ELPs serving poor families) has the potential to reduce fee reliance.
The ECD Census found that programmes receiving the government ECD subsidy charge substantially lower fees (average of R208 per month) than ECD programmes that are not subsidised (average of R649 per month).125 The table below shows the average fees for ELPs in each school quintile 1, 2, and 3 for those receiving the subsidy and those not.126 Early learning programmes serving poor communities who can access the subsidy charge, on average, 45% less than ELPs serving the same communities who are not accessing the subsidy.
The 2023 Budget Bill provides increased allocation to the early learning conditional grant of 4.2% in 2023/24, 51% in 2024/25, and a further 24% in 2025/26. In addition, just under R300 million in 2024/25 and R400 million in 2025/26 are set aside for a nutrition support pilot for ELPs and piloting a results-based financing model to expand ELP access and quality.128
The budget provision over the Medium-Term Expenditure Framework enables an increase of 20% in
Average fees charged by ELPs receiving the subsidy
R148
R162
R204
the number of children subsidised, from a 2023 baseline of 625,000 children to 757,903 children in 2025/26. However, the value of the subsidy has been severely eroded by inflation, and the tabled budget is insufficient to bring the subsidy in line with real costs.129
At R17 per child per day, the ECD subsidy is insufficient to fully finance the delivery of quality programmes, and parental fees will remain necessary unless the subsidy amount is increased. Increasing the value of the subsidy could enable ‘no-fee ELPs’ for the poorest children, eliminating the fee barrier and opening the way for greater equity in access.
Less than half of children aged 50-59 months enrolled in ELPs are on track for early learning.
With the development and widespread use of the Early Learning Outcomes Measure (ELOM) suite of tools,130 we now have access to population-level data on preschool child outcomes in South Africa. The ELOM 4&5 Assessment Tool categorises children into those On Track for their development, Falling Behind, or Falling Far Behind in five key developmental domains.
Explaining the two major funding sources for early learning services
The Early Childhood Development Conditional Grant (ECD-CG) specifically supports early learning services through targeted, condition-based funding to provinces. In contrast, the Provincial Equitable Share broadly distributes national revenue for various services, including education, infrastructure, social services and health, without earmarking funds for specific purposes. This allows provinces flexibility in fund allocation based on their priorities. The National Treasury and the DBE can protect the value of the ECD-CG within provinces. However, the provincial allocation of equitable share funding to ECD may decrease depending on provincial priorities and the budget cuts that all provinces are experiencing in the current fiscal climate.
TABLE 11: DEVELOPMENTAL DOMAiNS ASSESSED BY THE ELOM 4&5 TOOL
Developmental domain
Gross Motor Development
Fine Motor Coordination and Visual Motor integration
Emergent Numeracy and Mathematics
Cognition and Executive Functioning
Emergent Literacy and Language
Description
This domain assesses the abilities required to control the large muscles of the body and to coordinate large movements.
This domain assesses the abilities required to control the small muscles of the body and to coordinate fine motor movements with visual information
This domain assesses the child’s ability to understand number concepts, symbols, shapes, and size.
This domain assesses the child’s ability to think critically, solve problems, form concepts, attend to instructions, and control impulses.
This domain looks at the child’s ability to communicate effectively. This includes their ability to speak in complete sentences, recognise the initial sounds of words, name common objects, relay events, and listen to and understand stories told to them.
The 2021 Thrive by Five Index found that only 46% of children aged 50 to 59 months attending an ELP in South Africa can do the learning tasks expected of a child their age (On Track), with 28% of children Falling Far Behind the expected standard. Performance was particularly poor in three key areas of development. For Fine Motor Coordination and Visual Motor Integration, only three out
of every ten children were found to be developmentally On Track, and just four out of ten children were On Track in the Cognition and Executive Functioning and Emergent Numeracy and Mathematics domains. The Emergent Literacy and Language domain is the only one in which more than 50% of children were on track for their age.131
FiGURE 25: THE PERCENTAGE OF CHiLDREN (50-59 MONTHS) ENROLLED iN ELPS WHO ARE ON TRACK, FALLiNG BEHiND, AND FALLiNG FAR BEHiND iN EARLY LEARNiNG
Children aged 50-59 months
Source: Giese S, Dawes A, Tredoux C, Mattes F, et al. (2022). Thrive by Five Index Report. Revised August 2022, Innovation Edge, Cape Town. www.thrivebyfive.co.za ON TRACK FALLING BEHIND FALLING FAR BEHIND
Gross Motor
Fine Motor & Visual Motor Integration
Emergent Numeracy and Mathematics
Cognition and Executive Functioning
Emergent Literacy and Language
The Thrive by Five index highlights the interconnectedness of learning with other areas of development. The Index finds a strong association between levels of stunting (a measure of poor health and nutrition in young children) and learning outcomes, as well as a relationship between children’s socio-emotional functioning and ELOM scores.132 This finding reinforces the importance of ensuring that young children have access to the full package of services and support necessary for their healthy development.
There is a strong relationship between poverty and early learning. Using the ELOM assessment tools to measure child outcomes and monthly ELP fee levels as a proxy for socio-economic status, the Index national dataset enabled the researchers to quantify the relationship between
poverty and early learning and to map the socio-economic gradient in learning outcomes.
Figure 26 below shows the inequalities in learning outcomes among children aged 50 to 59 months enrolled in an ELP. It shows that the children who attend ELPs with higher fees are more likely to be developmentally On Track for their age than those who attend ELPs with low fees. Only 3 out of 10 children in the lowest fee band (up to R110 per month) are On Track in their total ELOM scores, compared to 8 out of 10 children in the highest fee band (over R1,750 per month). The disparities in early learning outcomes by income level are likely to be even greater if one includes children not enrolled in ELPs, with the vast majority likely amongst the poorest.
Source: Thrive by Five Index 2021 data, further analysis by DataDrive2030
Access to quality is key
While child and household level factors no doubt contribute to the socio-economic gradient in early learning outcomes, the variable quality of ELPs across different fee bands is a significant factor in determining the percentage of children who are developmentally On Track. Young children’s gains through preschool attendance vary dramatically depending on the programme’s quality.133
Poor outcomes for poor children are by no means inevitable.134 High-quality programmes can and do significantly improve early learning outcomes for poor children in South Africa.135
The characteristics of programmes likely to drive improved learning outcomes include the availability and appropriate use of learning resources, the quality of
FIGURE 26: CHILD LEARNING OUTCOMES BY ELP FEE LEVELS
practitioner-child interactions, and the use of pedagogical approaches such as rich literacy experiences and developmentally supportive play.136
Achieving access to quality at scale will require far greater investment in both material and human resources. Only 23% of all teaching staff at ELPs137 have a level of education above the completion of secondary school. Nine out of 10 practitioners report earning below the minimum wage, with more than half receiving less than R1,000 monthly.138
While responsibility for registration, funding, and oversight of ELPs has moved from the Department of
Social Development to the DBE, the actual provision of ELPs remains primarily with the non-governmental sector. For over two decades, there has been a strongly motivated call for more funding for ELPs and simplifying registration and procurement processes to enable this funding to flow.
As the new steward for ECD, the DBE can leverage data to increase investment in early learning and drive long overdue systems reform in partnership with a dynamic sector. We can and must accelerate access to quality early learning for every child in South Africa.
Early care and education 0-2 years
Children 0-2 years reported to attend a preschool, nursery school, creche, educare centre or playgroup
Children 0-2 years reported to be in the care of a daymother / childminder / gogo
Children 0-2 years cared for at home / not with a childminder or in a group environment
Early care and education 3-5 years
Children 3-5 years reported to attend an early learning group programme or Gr R
No access to early learning programmes
Children 3-5 not attending any early learning group programme
Fees paid for ECD / childcare
Children <6 attending ECD / daycare (excl Gr R), for whom fees are paid
Numeracy among 4 year olds attending early learning prog (ELPs)
Percentage “On Track”
3 Year change indicator
Literacy & language among 4 year olds attending ELPs
Percentage “On Track”
Early learning overall score among 4 year olds attending ELPs Percentage “On Track”
Foundation phase through-put
Percentage of children aged 10-11 who have passed grade 3
numbers have increased or decreased since the pre-COVID baseline worsening / negative improving / positive no significant change no significant change between pre-COVID baseline and most recent data no discernible change due to lack of comparative data
Data gaps
Longitudinal data are needed to understand the extent to which the developmental gains made for children attending high-quality ELPs are sustained as children progress through primary school and the necessary conditions for this.
Child outcomes data have predominantly been collected for children who are enrolled in ELPs.
Data on the development outcomes of the 30% of 3-5-year-old children not attending ELPs are needed.
We also have limited data on the development of children younger than 4 years. The ELOM, widely used in South Africa, is validated for children aged
50 to 69 months. Investment is needed in developing scalable measurement tools that reliably and affordably assess key developmental domains in younger children.
There is also limited data on the proportion of young children with disabilities and the extent to which these children can meet key developmental milestones.
Finally, there is a need to strengthen routine administrative data on ELP enrolment, attendance and subsidisation to enable the DBE to monitor and plan for population-level coverage.
Data Sources
The data provided in this review are drawn from a range of sources, many of which can be updated annually. Data sources for the indicators are indicated by the letter keys to the right of the statistical tables.
a Stats SA Mid-year population estimates, 2022 series
b GHS 2022. Children’s Institute analysis
c DoH National Antenatal Sentinel HIV survey
d Health Systems Trust: District Health Barometer (data from District Health Information System)
e Health Systems Trust: South African Health Review 2022
f MRC Rapid Mortality Surveillance (Preliminary) 2023
g HSRC National Food and Nutrition Security Survey
h South African Demographic and Health Survey
i Stats SA Recorded Live Births
j
k Thrive by Five Index
Summary of progress in key services and outcomes since the pre-COVID 19 baseline
Status of children under 6
inadequate water: Children < 6 without piped water to their home
inadequate sanitation:
Children < 6 without a flush toilet or ventilated pit latrine on site
Children living in poverty: Children below upper bound poverty line (R1,417 pp/mth)
Food Poverty: Children under 6 living in food poor households (R663 pp/mth)
Household unemployment:
Children under-6 living in households where no adults are employed
maternal and child health
Poor access to clinics: Children < 6 living more than 30 minutes from the nearest health facility
Antenatal early booking (before 20 weeks)
Post-natal visit within 6 days as % of mothers birthing in public facilities
Antenatal initiation on anti-retrovirals, as % of eligible total
Delivery in facility rate: % of deliveries occurring in health facilities, under trained personnel
immunisation coverage: % of children <1 who complete the primary immunisation course
Paediatric HiV prevalence: % infants born to HIV+ mothers who test positive in a PCR test at 10 weeks
Low birth weight: % infants born with weight below 2500g
Child hunger: Children <6 in households where children suffer hunger
Food insecurity: Children <6 in households that ran out of food due to lack of money
Low food diversity: Children <6 in households who reduced variety of food due to lack of money
infant breastfeeding: Infants exclusively breastfed at 14 weeks (as proportion of 3rd vaccination clients)
Early initiation of breastfeeding: First breastfeed within 1 hour of birth
Exclusive breastfeeding6 months: Children aged under 6 months who are exclusively breastfed
Neonatal death in facility rate Vitamin A coverage in children (12 - 59 months)
infant mortality rate (per 1,000)
Under 5 mortality rate (per 1,000)
Severe acute malnutrition incidence per 1,000 in children under 5
Severe acute malnutrition fatality as % of children with severe acute malnutrition in health facilities
Stunting in children under 5
Wasting in children under 5
Underweight in children under 5
Overweight in children under 5
Female care
burden: Children under-6 who live in womenonly households
Babies with young mothers: Infants <1 whose mothers were teens (<20 years) when they were born
Breastfeeding education: % of mothers (15-49 years) who reported receiving information on breastfeeding
Follow-up ante-natal visits: % of pregnant women attending facilities who had at least 4 antenatal visits
Birth registrations that are for current year births
No birth certificate for infants - 2020:
Estimated number of children under 1 not registered within first year
No birth certificate for infants - 2021:
Estimated number of children under 1 not registered within first year
Access to Child Support Grant:
Number of children under-6 receiving the CSG
Poor infants without grants: Number and percentage of poor children < 1 year not receiving CSG or any grant
for
Early care and education 3-5 years: Children 3-5 years reported to attend an early learning group programme or Gr R
No access to early learning programmes: Children 3-5 not attending any early learning group programme
Fees paid for ECD / childcare: Children <6 attending ECD / daycare (excl Gr R), for whom fees are paid
Numeracy among 4-year-olds attending ELPs: Percentage “On Track" and "Falling Far Behind"
Literacy & language among 4-year-olds attending ELPs: Percentage “On Track” and "Falling Far Behind"
Early learning overall score among 4-yearolds attending ELPs: Percentage “On Track” and "Falling Far Behind"
Foundation phase through-put: Percentage of children aged 10-11 who have pass ed grade 3
worsening / negative
improving / positive no significant change or no discernible change due to lack of comparative data
References and endnotes
1Department of Basic Education of the Republic of South Africa. (2023). South Africa’s 2030 Strategy for Early Childhood Development Programmes. Pretoria.
2The rural homeland areas or “Bantustans” were established as labour reserves by the apartheid government. Some were even formally separated from South Africa as independent states with border posts to control migration. They operated under traditional authority and were largely neglected by South Africa in terms of service infrastructure and economic development. Between the 1960s and 1980s, millions of black South Africans who were not considered economically useful to the white economy were relocated from towns and cities to the homelands. It was particularly women and children, the unemployed and elderly, the sick and disabled who were confined to the homelands. Relative to working age adults, a disproportionate share of the child population continues to be raised in these rural parts of the country, where services are harder to reach and where infrastructure is often under-developed.
3Mbokazi N., Van Pinxteren M., Murphy K, Mair F. S., May C. R., Levitt N. S. (2023). Ubuntu as a mediator in coping with multimorbidity treatment burden in a disadvantaged rural and urban setting in South Africa. Social Science & Medicine, 334,116190. doi: 10.1016/j.socscimed.2023.116190.
4The national poverty lines are published annually by Stats SA and are available on the Stats SA website.
5To be counted as employed according to the official definition (also called the “strict” or “narrow” definition of unemployment), a person must be of working age and not working in any formal or informal enterprise or in casual work or self-employment. They must be available to work (i.e. not studying or staying at home by choice or to care for children, for example) and must have actively looked for work in the past four weeks. The broad definition of unemployment includes all the same criteria except the requirement that a person must have actively looked for work in the last month. The broad definition, therefore, includes those who have given up hope of finding employment, who cannot afford transport and other costs associated with seeking employment, or who live in areas without employment opportunities and feel that it is not worth trying. The broad definition of unemployment is, therefore, a more accurate estimation of the extent of unemployment in the country.
6Personal correspondence with Stats SA, June 2023.
7Ndlovu et al. (2021). In Govender K, George G, Padarath A, & Moeti T, (Eds). South African Health Review 2021. Durban: Health Systems Trust. URL: https://www.hst.org.za/publications/Pages/ SAHR2021.aspx
8Hall K, Sambu W, Almeleh C, Mabaso K, Giese S and Proudlock P (2019). South African Early Childhood Review 2019. Cape Town: Children’s Institute, University of Cape Town and Ilifa Labantwana.
9Ndlovu N, Gray A, Mkhabela B, Myende N & Day C. (2022). Health and related indicators 2022. In Padarath A & Moeti T (Eds), South African Health Review 2022. Health Systems Trust. doi:10.61473/001c.82026
10Delivery in facility rate [Percentage]: Deliveries in health facilities as a proportion of expected deliveries in the population. Expected deliveries are estimated as population under 1 year multiplied by 1.025 to compensate for stillbirths and infant mortality. This indicator accounts only for deliveries in the public sector and excludes private sector deliveries, which is demonstrated by rural provinces with low medical aid populations, such as Limpopo and Mpumalanga, having much higher rates than Western Cape and Gauteng. Ndlovu et al (2023)
11Spotlight. (2020, October 28). A spokesperson for the Department of Health acknowledged that “Seven out of eight metropolitan municipalities were not able to vaccinate at least 80% of their children with all primary antigens… 42 (81%) districts did not reach the target in 2020 during the lockdown period as compared to 22 (42%) of districts during the same period in 2019.” He went on to warn: “We’re sitting on a time bomb basically… Before it was bad, but now it’s worse. If for any reason there is (for example) a measles or rotavirus epidemic, we’re in trouble, big trouble.”
12UNICEF South Africa (2021). Uneven routine immunisation coverage threatens the health of South Africa’s youngest children. Press release 25 April 2021. Available https:// www.unicef.org/southafrica/press-releases/uneven-routineimmunization-coverage-threatens-health-south-africas-youngest
13Ndlovu N, Gray A, Mkhabela B & Myende N, Day C. (2023). Health and related indicators 2022. South African Health Review, 25. doi:10.61473/001c.82026
14Kotze, J. (2022). Baseline Assessment, Technical Report. Department of Basic Education.
15Galasso E, Wagstaff A. (2019). The aggregate income losses from childhood stunting and the returns to a nutrition intervention aimed at reducing stunting. Economics & Human Biology. 34, 225-38.
16Bhutta ZA, Akseer N, Keats EC, et al. (2020). How countries can reduce child stunting at scale: lessons from exemplar countries. The American Jurnal of Clinical Nutrition. 112 (Supplement_2), 894S-904S. The countries include Peru, Kyrgyz Republic, Nepal, Senegal, and Ethiopia.
17National Department of Health (NDoH), Statistics South Africa (Stats SA), South African Medical Research Council (SAMRC), and ICF. (2019). South Africa Demographic and Health Survey 2016 [Edited by Statistics South Africa (Stats SA) SAMRCSaI].
18Black RE, Victora CG, Walker SP, et al. (2013). Maternal and child undernutrition and overweight in low-income and middle-income countries. Lancet. 382, 427–451.
19Caulfield LE, de Onis M, Blössner M, Black RE. (2004). Undernutrition as an underlying cause of child deaths associated with diarrhea, pneumonia, malaria, and measles. American Journal of Clinical Nutrition. 80, 193–198.
Walker SP, Wachs TD, Meeks Gardner J, et al. (2007). Child development: risk factors for adverse outcomes in developing countries. Lancet. 369, 145–157.
Liu Y, Albertsson-Wikland K, Karlberg J. (2000). Long-term consequences of early linear growth retardation (stunting) in Swedish children. Pediatric Research. 47, 475–480.
Victora CG, Adair L, Fall C, et al. (2008). Maternal and child undernutrition: consequences for adult health and human capital. Lancet. 371, 340-357.
Haas JD, Murdoch S, Rivera J, Martorell R. (1996). Early nutrition and later physical work capacity. Nutrition Review. 54(S1), S41–S48.
Barker DJ, Eriksson JG, Forsen T, Osmond C. (2003). Fetal origins of adult disease: strength of effects and biological basis. International Journal of Epidemiology. 31, 1235-1239.
Prendergast AJ, Humphrey JH. (2014). The stunting syndrome in developing countries. Paediatrics International Child Health. 34, 250-265.
20Both these surveys are designed to be nationally and provincially representative, although response rates on the child anthropometry measures may affect the reliability of results at the provincial level. The NFNSS achieved a considerably larger sample – more than four times the SADHS sample size – of children who were weighed and measured.
21Simelane, T. Mutanga, S.S. Hongoro, C. Parker, W. Mjimba V. Zuma, K. Kajombo, R. Ngidi, M. Masamha, B. Mokhele, T. Managa, R. Ngungu, M. Sinyolo, S. Tshililo, F. Ubisi, N. Skhosana, Ndinda, C. Sithole, M. Muthige, M. Lunga, W. Tshitangano, F. Dukhi, N., F. Sewpaul, R. Mkhongi, A. Marinda, E., (2023). National Food and Nutrition Security Survey: National Report: HSRC: Pretoria.
22It is not clear whether the two surveys are directly comparable. The differences in estimates could reflect changing trends over time, but they could also arise from differences in sampling method and bias in non-response, or differences in the accuracy of obtaining child measurements. The differences between provincial and localised estimates within the time period also suggest substantial variation between communities within provinces. There is significant geographic variation, not only across the districts within the same province but also across the sub-districts within the same district, and this implies the need for more granular nutrition and stunting data at the small-area level. In the NFNSS, the provincial stunting estimates in the national report (used here) are different from those presented in the individual provincial reports due to differences in weighting.
23Grow Great (2023). GG Stunting Survey Scorecard Summit Handout. Retrieved from https://www.growgreat.co.za/
25National Department of Health (NDoH), Statistics South Africa (Stats SA), South African Medical Research Council (SAMRC), and ICF (2019). South Africa Demographic and Health Survey 2016. Pretoria, South Africa, and Rockville, Maryland, USA: NDoH, Stats SA, SAMRC, and ICF.
26Ndlovu N, Gray A, Mkhabela B, Myende N, Day C. (2023). Health and Related Indicators 2022. In: Padarath A, Moeti T, (Eds), South African Health Review 2022. Health Systems Trust.
27Department of Health (30 June 2023). Response to Parliamentary Question 2501.
28National Department of Health (NDoH), Statistics South Africa (Stats SA), South African Medical Research Council (SAMRC), and ICF (2019). South Africa Demographic and Health Survey 2016.
Pretoria, South Africa, and Rockville, Maryland, USA: NDoH, Stats SA, SAMRC, and ICF.
29SA Department of Health District Health Information System. (30 June 2023) Written reply in Parliament Question No. 2501.
30Casale D & Desmond C. (2016). Recovery from stunting and cognitive outcomes in young children: Evidence from the South African Birth to Twenty Cohort Study. Journal of Developmental Origins of Health and Disease. 7(2),163-171.
31Devereux S, Hochfeld T, Karriem A, Mensah C, Morahanye M, Msimango T, Mukubonda A, Naicker S, Nkomo G, Sanders D, Sanousi M. (2018). School Feeding in South Africa: What we know, what we don’t know.
32Giese S, Dawes A, Tredoux C, Mattes F, Bridgman G, van der Berg S, Schenk J & Kotzé J. (2022). Thrive by Five Index Report Revised August 2022, Innovation Edge, Cape Town. Retrieved from www.thrivebyfive.co.za
33There are various possible reasons for the differences in these stunting estimates. First, children attending ELPs may come from households that can afford to pay ELP fees and are therefore able to provide their children with a more nutritious diet. Second, lower stunting rates among children attending ELPs could result from the additional nutrition they receive at these centres. Third, if stunting rates have reduced since 2016, that may be another explanation for the difference. Finally, the difference in sampling strategies may account for some of the variance. For further discussion of the variance and possible reasons, see https:// datadrive2030.co.za/resources/stunting-rates-in-children-aged50-69-month-enrolled-in-elp-in-south-africa/
34Department of Basic Education (2022). ECD Census 2021: Report. Pretoria: DBE.
35Kika-Mistry, J., & Wills, G. (2022). Compliance, cost and user fees in the Early Childhood Care and Education Sector in South Africa. Ilifa Labantwana & Resep ECD Working Paper Series. No. ECD WP 005/2022
36For a review of the evidence, see Hall K, Proudlock P & Budlender D (2023). Reducing Child Poverty. Pretoria: Department of Social Development. Retrieved from http:// childrencount.uct.ac.za/uploads/publications/CSG%20Review_ Full%20report_web.pdf
37Christian P, Lee SE, Angel MD, Adair LS, Arifeen SE, Ashorn P et al. (2013). Risk of childhood undernutrition related to small for gestational age and preterm birth in low and middle income countries. International Journal of Epidemiology. 42 1340–55.
38World Health Organization. (2014). Global Nutrition Targets 2025: Low Birth Weight Policy Brief. Retrieved from https://www. who.int/publications/i/item/WHO-NMH-NHD-14.5
Mi D, Fang H, Zhao Y, & Zhong, L. (2017). Birth weight and type 2 diabetes: A meta-analysis. Experimental and Therapeutic Medicine, 14(6), 5313–5320. doi:10.3892/etm.2017.5234.
39World Health Organisation (1981) International Code of Marketing of Breastmilk Substitutes. Retrieved from https://iris. who.int/bitstream/handle/10665/254911/WHO-NMH-NHD-17.1-eng. pdf
40Statistics South Africa. (2023). Consumer Price Index, April 2023. Statistical release P0141.
41DGMT (2024). Double-discounted list of 10 budget-friendly food items. Change Ideas. DG Murray Trust. www.dgmt.co.za
42De Onis M, Branca F. (2016). Childhood stunting: a global perspective. Maternal & Child Nutrition. 12, 12-26.
43Kanfe SG, Debele GR, Berhanu RD, Ngusie HS, Ahmed MH. (2021). Utilisation of district health information system and its associated factors among health professionals working at public health facilities of the southwest of Ethiopia: cross-sectional survey. BMJ Open. 11(8),e046578. Retrieved from https://www. ncbi.nlm.nih.gov/pmc/articles/PMC8362697/
44Kaldenbach S, Engebretsen IM, Haskins L, Conolly C, Horwood C. (2022). Infant feeding, growth monitoring and the double burden of malnutrition among children aged 6 months and their mothers in KwaZulu-Natal, South Africa. Maternal & Child Nutrition. 18(1),e13288. https://doi.org/10.1111/mcn.13288
45World Health Organization, United Nations Children’s Fund, World Bank Group (2018). Nurturing care for early childhood development: A framework for helping children survive and thrive to transform health and human potential. Geneva: World Health Organization. Licence: CC BY-NC-SA 3.0 IGO.
46SASSA (2023). Twelfth statistical report: Social Assistance. March 2023.
47Casale D & Shepherd D (2021). The gendered effects of the COVID-19 crisis and ongoing lockdown in South Africa: Evidence from NIDS-CRAM Waves 1-5.
48Posel D & Hall K (2021). The economics of the family and household in South Africa. In F Tregenna, I Valodia & A Oqubay (Eds.), The Oxford handbook of the South African economy. Oxford University Press, Oxford, pp. 800-22.
49K Hall analysis of General Household Survey 2022
50Richter L, Chikovore J, Makusha T. The status of fatherhood and fathering in South Africa. Child Educ. 2010;86(6):360-365. 2
51Van den Berg W & Makusha T (2018). State of South Africa’s Fathers 2018. Cape Town: Sonke Gender Justice & Human Sciences Research Council
52Summerton JV, Mtileni TR, Moshabela ME. (2021). Experiences and perceptions of birth companions supporting women in labour at a District Hospital in Limpopo, South Africa. Curationis. 2021 Oct 27;44(1):e1-e7. doi: 10.4102/curationis.v44i1.2186. PMID: 34797104; PMCID: PMC8603091.
53Marsay C, Manderson L, Subramaney U. (2017). Validation of the Whooley questions for antenatal depression and anxiety among low-income women in urban South Africa. South African Journal of Psychiatry. 2017;23(0), a1013. https://sajp.org.za/index.php/sajp/ article/view/1013.
54Bauer, A., Garman, E., Besada, D., Field, S., Knapp, M., & Honikman, S. (2022). Costs of common perinatal mental health problems in South Africa. Global Mental Health, 9, 429-438. doi:10.1017/gmh.2022.48
55Stats SA General Household Survey – reported childbearing. Analysed by Children’s Institute, available www.childrencount.uct. ac.za
56Barron P, Subedar H, Letsoko M, Makua M & Pillay Y (2022) Teenage births and pregnancies in South Africa, 2017-2022 – a reflection of a troubled country: Analysis of public sector data. South African Medical Journal 2022;112(4):252-258.
57Laurenzi, C. A., Gordon, S., Abrahams, N., Du Toit, S., Bradshaw, M., Brand, A., & Skeen, S. (2020). Psychosocial interventions
targeting mental health in pregnant adolescents and adolescent parents: a systematic review. Reproductive health, 17(1), 1-15
58T. Kathree, O.M. Selohilwe, A. Bhana, et al. (2014). Perceptions of postnatal depression and health care needs in a South African sample: The “mental” in maternal health care. BMC Womens Health, 14.
59Matlwa Mabaso K, Laurenzi C, Menyatsoe M, Gemmell K, Manda S, Tomlinson, M. (2021). Impact of COVID-19 on wellbeing of pregnant women in 7 neighbourhoods in the Western Cape. Johannesburg, Grow Great Campaign, March 2021.
60Hall K, Proudlock P & Budlender D. (2023). Reducing Child Poverty. Pretoria: Department of Social Development.
61Van den Berg, W. & Makusha, T. (2018). State of South Africa’s Fathers 2018. Cape Town: Sonke Gender Justice & Human Sciences Research Council.
62Chersich, MF., Luchters, S., Blaauw, D., Scorgie, F., Van den Heever, A., Rees,H., Peach, E., Kharadi, S. & Fonn, S. (2016). Safeguarding maternal and child health in South Africa by starting the Child Support Grant before birth: Design lessons from pregnancy support programmes in 27 countries. SAMJ Vol. 106, No. 12
63Moolla A, Mdewa W, Erzse A, Hofman K, Thsehla E, Goldstein S, Kohli-Lynch C. (2024). A cost-effectiveness analysis of a South African pregnancy support grant. PLOS Glob Public Health. 2024 Feb 8;4(2)
64Bauer, A., Garman, E., Besada, D., Field, S., Knapp, M., & Honikman, S. (2022). Costs of common perinatal mental health problems in South Africa. Global Mental Health, 9, 429-438. doi:10.1017/gmh.2022.48
65Delany A, Ismail Z, Graham L & Ramkissoon Y. (2008). Review of the Child Support Grant: Uses, Implementation and Obstacles. United Nations Children’s Fund.
Department of Social Development (DSD), South African Social Security Agency (SASSA), & UNICEF. (2011). Child Support Grant Evaluation 2010.
Zembe-Mkabile W, Surender R, Sanders D, Jackson D & Doherty T. (2015) The experience of cash transfers in alleviating childhood poverty in South Africa: mothers’ experiences of the Child Support Grant. Global Public Health. 10(7), 834-51. doi: 10.1080/17441692.2015.1007471
66Samson et al. (2004). The Social and Economic Impact of South Africa’s Social Security System.
67Economic Policy Research Institute. (2008). Quantitative Analysis of the Impact of the Child Support Grant.
Williams MJ. (2007). The social and economic impacts of South Africa’s Child Support Grant. Economic Policy Research Institute Working Paper #40.
68Agüero MA, Carter MR & Woolard I. (2007). The Impact of Unconditional Cash Transfers on Nutrition: The South African Child Support Grant. Working Paper 39. International Policy Centre for Inclusive Growth.
DSD, SASSA and UNICEF. (2012). The South African Child Support Grant Impact Assessment: Evidence from a survey of children, adolescents and their households. Pretoria: UNICEF South Africa.
Patel L, Knijn T, Hochfeld T & Chiba J. (2017). Family contexts, child support grants and child well-being in South Africa.
The Centre for Social Development in Africa, University of Johannesburg.
69DSD, SASSA and UNICEF. (2012). The South African Child Support Grant Impact Assessment: Evidence from a survey of children, adolescents and their households. Pretoria: UNICEF South Africa.
70Delaney A et al (2008). Review of the Child Support Grant: Uses, implementation and obstacles. Johannesburg: Community Agency for Social Enquiry.
71DSD, SASSA and UNICEF. (2012). The South African Child Support Grant Impact Assessment: Evidence from a survey of children, adolescents and their households. Pretoria: UNICEF South Africa.
72Zembe-Mkabile, W., Surender, R., Sanders, D., Jackson, D., & Doherty, T. (2015). The experience of cash transfers in alleviating childhood poverty in South Africa: mothers’ experiences of the Child Support Grant. Global Public Health, 10(7), 834–851.
73Department of Basic Education. (2022). ECD Census 2021: Report. Pretoria: Department of Basic Education
74Hall K. Analysis of the General Household Survey 2021, conducted by Statistics South Africa.
75Stats SA. (2021). Recorded Live Births series.
76South African Constitution. (1996). Bill of Rights. Section 27(2).
77National Treasury (2023). 2023 Estimates of National Expenditure. Pretoria: National Treasury
78Stats SA. (2023). National Poverty Lines 2023. Pretoria: Stats SA
79See, for example, The Children’s Institute submission on the 2023 Medium Term Expenditure Framework. Available at: www. childrencount.uct.ac.za
80SASSA and UNICEF. (2013). Preventing Exclusion from the Child Support Grant: A Study of Exclusion Errors in Accessing CSG Benefits. Pretoria: UNICEF South Africa.
DSD, SASSA & UNICEF. (2016) Removing barriers to accessing Child Grants: Progress in reducing exclusion from South Africa’s Child Support Grant. Pretoria: UNICEF South Africa.
UNICEF and Joint SDG Fund. (2022). An update study on the exclusion error rate for children who are eligible to receive the Child Support Grant. Pretoria: UNICEF South Africa.
81Grants data from SASSA statistical reports
82Department of Home Affairs. (2019). Annual Report for 2018/2019 (p.52).
83Department of Home Affairs. (2023). Annual Performance Plan 2023/24 (p.12).
84Department of Home Affairs. (2020). Annual Report for 2019/2020 (p.26).
85Department of Home Affairs. (2023). Annual Performance Plan 2023/24 (p. 40).
86Department of Home Affairs. (2023). Annual Performance Plan 2023/24 (p. 40).
87StatsSA (2022). Mid-year population Estimates, 2022. Pretoria: Statistics South Africa
88Stats SA. (2020). Recorded Live Births 2019.
89Since the vital registration system is incomplete, the numbers of births are estimates, derived from models that are calibrated to the population census and other data sources. In our calculations, we refer to both the Mid-Year Population Estimates calculated by Stats SA, and the Thembisa model developed by demographers at the University of Cape Town.
90National Assembly, Parliament of RSA. (2023). Internal question paper 19 -2023, Question No. 1798.
91See Nyathi M, Van Schalkwyk C, Proudlock P & Juta S. (2023). Social grants for children without birth certificates and caregivers without identity documents. Children’s Institute, University of Cape Town; Legal Resources Centre and South African Social Security Agency. Retrieved from: https://ci.uct.ac.za/articles/202304-17-ci-and-lrc-create-resource-explaining-how-apply-childgrant-without-birth-certificate-or-caregiver
92For a simple user guide on how to access social grants without a birth certificate, see https://ci.uct.ac.za/articles/2023-04-17-ciand-lrc-create-resource-explaining-how-apply-child-grant-withoutbirth-certificate-or-caregiver
93Hall K. (2019). Expert affidavit for the Phakamisa case on undocumented learners.
94Department of Basic Education. (2022). Annexure LTM8 of the DG of Home Affairs Answering Affidavit to the Amicus Curia in Mazibuko and Others v Minister of Home Affairs and Others [Case No: 14238/21] Gauteng High Court Division, Pretoria.
95Authors own analysis of Stats SA Recorded Live Births data.
96SASSA. (2023). Social Assistance Report.
97SASSA. (2022). Social Assistance statistical report for the period December 2022.
98DSD and DOJ. (2023, February 22). Presentations to the Portfolio Committee on Social Development.
99Artz L, Burton, P, Ward, CL, Leoschut L, Phyfer J, Kassanjee R & Le Mottee C. (2016). Optimus Study South Africa: Technical report. Sexual victimisation of children in South Africa. Final report of the Optimus Foundation Study: South Africa. Zurich: UBS Optimus Foundation.
100Richter LM, Mathews S, Kagura J & Nonterah E. (2018). A longitudinal perspective on violence in the lives of South African children from the Birth to Twenty Plus cohort study in Johannesburg-Soweto. South African Medical Journal, 108(3), 181-186.
101Mathews S, Abrahams N, Jewkes R, Martin L & Lombard C. (2013). The epidemiology of child homicides in South Africa. Bulletin of the World Health Organization, 91, 562-568.
102Child Series Volume I: Children exposed to maltreatment, 2021 (Report No. 92-02-01). Statistics South Africa. Pretoria: Statistics South Africa, 2023
103Department of Social Development (2019). National Child Care and Protection Policy. Department of Social Development
104Department for Planning, Monitoring and Evaluation. (2021). Revised MTSF 2019-2024.
105Department of Social Development. (2023, March 22). Minister Lindiwe Sisulu pays tribute to all social workers on World Social Work Day. https://www.dsd.gov.za/index.php/latest-news/21-
106Statistics South Africa. (2014). Census 2011: Profile of persons with disabilities in South Africa. (Report no. 03-01-59.) Pretoria: Stats SA.
Department of Social Development (DSD), Department of Women, Children and People with Disabilities (DWCPD) and UNICEF. (2012). Children with Disabilities in South Africa: A situation analysis: 2001-2011. Pretoria: Department of Social Development / Department of Women, Children and People with Disabilities / UNICEF.
107Visser M, Nel M, Bronkhorst C, Brown L, Ezendam Z, Mackenzie K, Van der Merwe D & Venter M. (2016). Childhood disability population-based surveillance: Assessment of the Ages and Stages Questionnaire Third Edition and Washington Group on Disability Statistics/UNICEF module on child functioning in a rural setting in South Africa, African Journal of Disability, 5(1) 1-9
108Yoshikawa, H, Weiland, C, Brooks-Gunn, J, Burchinal, MR, Espinosa, LM, et al. (2013). Investing in our future: The evidence base on preschool education. Society for Research in Child Development. Retrieved from https://www.fcd-us.org/ assets/2016/04/Evidence-Base-on-Preschool-Education-FINAL. pdf.
109Nores, M, & Barnett, WS. (2010). Benefits of early childhood interventions across the world: (Under) Investing in the very young. Economics of Education Review, 29(2), 271-282. https:// doi.org/10.1016/j.econedurev.2009.09.001
110Yoshikawa, H, Weiland, C, Brooks-Gunn, J, Burchinal, MR, Espinosa, LM, Gormley WT, ... & Zaslow MJ. (2013). Investing in our future: The evidence base on preschool education. Society for Research in Child Development. Retrieved from https://www.fcdus.org/assets/2016/04/Evidence-Base-on-Preschool-EducationFINAL.pdf.
111Department of Basic Education. (2022). ECD Census 2021: Report. Pretoria: Department of Basic Education.
112https://thrivebyfive.co.za/
113Department of Basic Education. (2022). Baseline Assessment, Technical Report. Department of Basic Education.
114General Household Survey 2022. Children’s Institute analysis
115General Household Survey 2022. Children’s Institute analysis
116Parents may enrol children in Grade R earlier than recommended because they cannot afford user fees for ELPs. It is also possible that the free meals provided to Grade R learners in public schools provide an extra incentive to enrol children early.
117Department of Basic Education. (2022). ECD Census 2021: Report. Pretoria: Department of Basic Education.
118Wills G, Kotze J & Kika-Mistry J (2020). A Sector Hanging in the Balance: ECD and Lockdown in South Africa. NIDS-CRAM survey report, Wave 2.
119BRIDGE, Ilifa Labantwana, National ECD Alliance, SmartStart, SA Congress for ECD. (2020). Second Survey Assessing the Impact of COVID on ECD.
120Dulvy EN, Devercelli AE, Van der Berg S, Gustafsson M, Pettersson G, Kika-Mistry J, Beaton-Day FM. (2023). South Africa Public Expenditure and Institutional Review for Early Childhood Development (ECD PEIR). Washington,
DC: World Bank Group. Retrieved from http://documents1. worldbank.org/curated/en/099192001242341964/pdf/ P1756791e5e59bde1ad6714d311b6261dd284d0e6d65.pdf
121Department of Basic Education. (2022). ECD Census 2021: Report. Pretoria: Department of Basic Education.
122General Household Survey 2022. Children’s Institute analysis.
123Department of Basic Education. (2022). ECD Census 2021: Report. Pretoria: Department of Basic Education.
124Income quintiles for the population are derived by calculating per capita household income and dividing households into five groups (“quintiles”) based on ranked income status: Quintile 1 is the poorest 20% of households; Quintile 2 is the next poorest.
125ECD Census DataDrive2030 analysis. Furthermore, subsidised ELPs provided children with a wider selection of learning materials on average.
126ECD Census further analysis by DataDrive2030.
127Every public school in South Africa is assigned a quintile ranking by the Departments of Basic Education. This ranking is based on the relative poverty levels of the community living within 3km of the school, with quintile 1 (Q1) being the poorest and quintile 5 (Q5) the wealthiest. In this calculation, ELPs were assigned the quintile rank of the closest primary school.
1282023 Budget Bill - Ilifa Labantwana analysis
129Brooks LE, Kotzé J, Almeleh C & Senona E. (2022). Assessing the policy options for the public provisioning of early childhood development programmes, South African Journal on Human Rights. DOI: 10.1080/02587203.2022.2149614
130https://datadrive2030.co.za/data-tools/
131https://thrivebyfive.co.za/data/
132Ibid
133Wasik, BA, & Snell, E K. (2019). Synthesis of Preschool Dosage: How Quantity, Quality, and Content Impact Child Outcomes. In A. J. Reynolds & J. A. Temple (Eds.), Sustaining Early Childhood Learning Gains (1st ed., pp. 31–51). Cambridge University Press. https://doi.org/10.1017/9781108349352.003
134Henry J, & Giese S. (2023). The Early Learning Positive Deviance Initiative - Summary report of quantitative and qualitative findings. Cape Town, DataDrive2030. Retrieved from https://datadrive2030.co.za/resources/the-early-learning-positivedeviance-initiative
135Dawes, A, Biersteker, L, Girdwood, L, Snelling, M & Horler, J. (2020). The Early Learning Programme Outcomes Study. Technical Report. Claremont, Cape Town: Innovation Edge and Ilifa Labantwana. Available at https://datadrive2030.co.za/ resources/the-early-learning-programme-outcomes-elpo-study/
136Biersteker, L, Henry, J & Horler, J. (2021). Early Childhood Education Research in Sub-Saharan Africa: The Current Literature and Future Research Possibilities (Draft 22-09-2021). Cape Town: Innovation Edge and JPAL.
137Includes all practitioners, as well as principals or managers who may likely be fulfilling a teaching role as well.
138Department of Basic Education. (2022). Baseline Assessment: Technical Report. Department of Basic Education. Pretoria.
A note on this publication
The South African Early Childhood Review 2024 is an annual publication, which presents information on the essential components of the comprehensive package of early childhood development services. This review includes data and commentary on over 50 carefully selected indicators on the status of children under six, as well as service delivery progress across five domains.
Primary level maternal and child health
Nutritional support
Support for primary caregivers
Social services and income support
Stimulation for early learning
The South African Early Childhood Review 2024 is a joint publication between Ilifa Labantwana, the Children’s Institute at the University of Cape Town, the Department of Planning, Monitoring and Evaluation in the Presidency, the Department of Basic Education, the Grow Great Campaign, and DataDrive2030.
About the organisations:
Ilifa Labantwana is a national ECD programme, working to secure an equal start for all children living in South Africa, through universal access to quality early childhood development. www.ilifalabantwana.co.za
The Children’s Institute aims to contribute to policies, laws, and interventions that promote equality and improve the conditions of all children in South Africa through research, education, and technical support. www.ci.uct.ac.za www.childrencount.uct.ac.za
The Department of Planning, Monitoring and Evaluation in the Presidency was created to facilitate, influence and support effective planning, monitoring, and evaluation of government programmes aimed at improving service delivery, outcomes and impact on society. www.dpme.gov.za
The DBE deals with all schools from Grade R to Grade 12, including adult literacy programmes. The aim of the DBE is to develop, maintain and support a South African school education system for the 21st century. www.education.gov.za
Established in 2022, DataDrive2030 uses data tools and insights to drive greater access to better-quality early learning for young children in South Africa. www.datadrive2030.co.za
Grow Great is a national campaign that aims to mobilise South Africa to halve stunting in young children by 2030. Grow Great tackles the drivers of stunting in young children, pushing for national change while supporting local action. www.growgreat.co.za/