3 minute read
4.1 Intersection and At-Grade Crossings


4.0 Transportation
INTRODUCTION
Advertisement
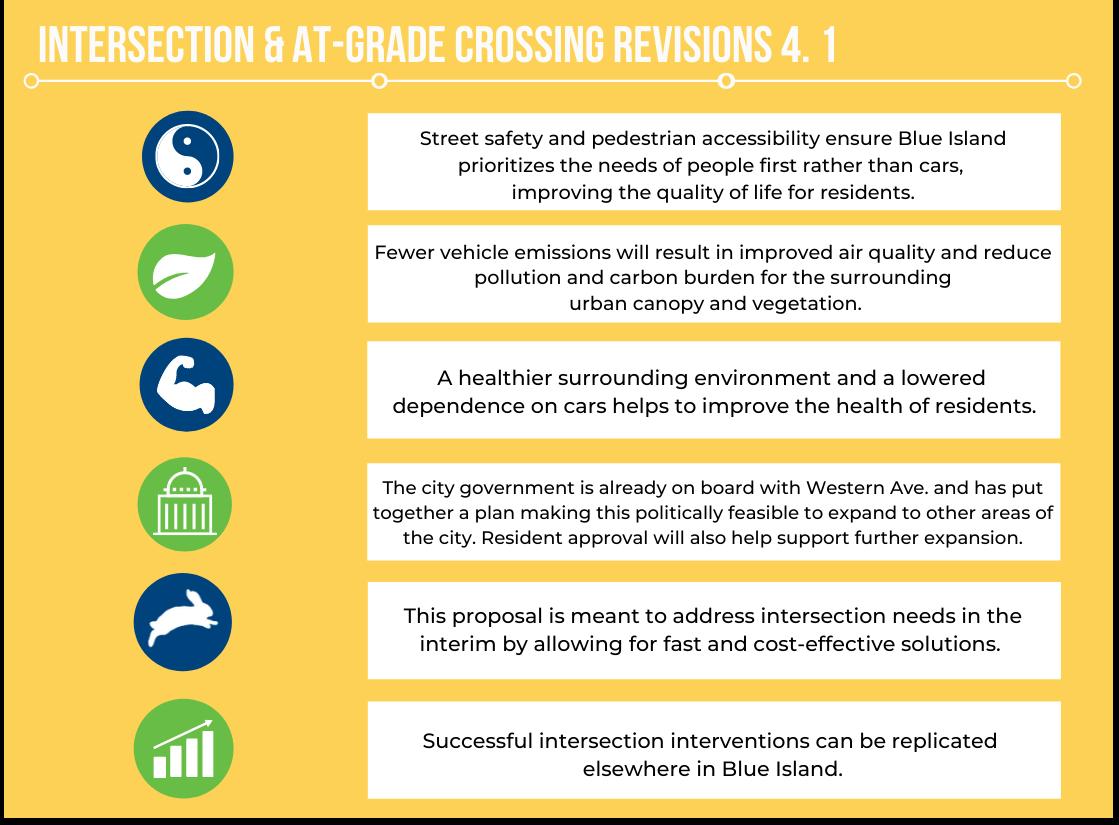
Reducing dependency on cars offers many benefits such as reduction of energy dependence on fossil fuels and healthier residents due to a reduction in vehicle emissions and more exercise. Blue Island can do more to make those living in the city and visiting comfortable with using its streets and sidewalks for biking, walking, and personalized transporters to realize these benefits.
4.1 Intersection and At-Grade Crossing Revisions
Stakeholders: Blue Island Public Works Department
Timeline: 1-5 Years, 5-10 Years
INTERSECTION AND AT-GRADE CROSSING REVISIONS
The goal of this policy is to promote semi-permanent painted infrastructure at key intersections throughout the three census tracts, building off already-identified intersections in Blue Island’s Non-Motorized Plan. This policy will implement similar pedestrian safety techniques in the at-grade crossing at 119th street and all intersections at Western Avenue.
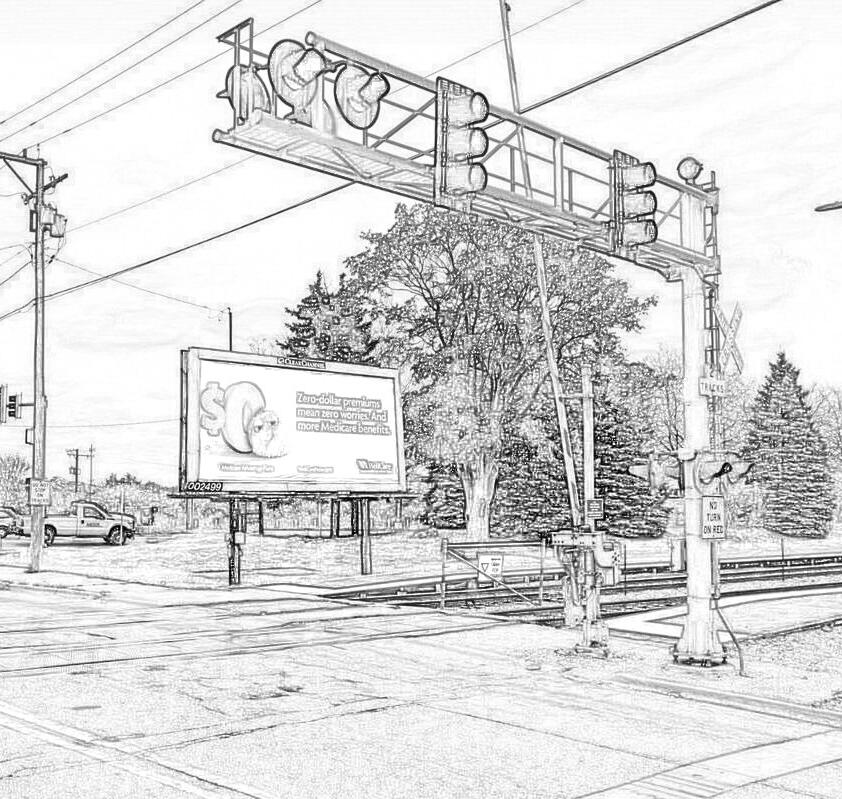
At-Grade Crossing Delays
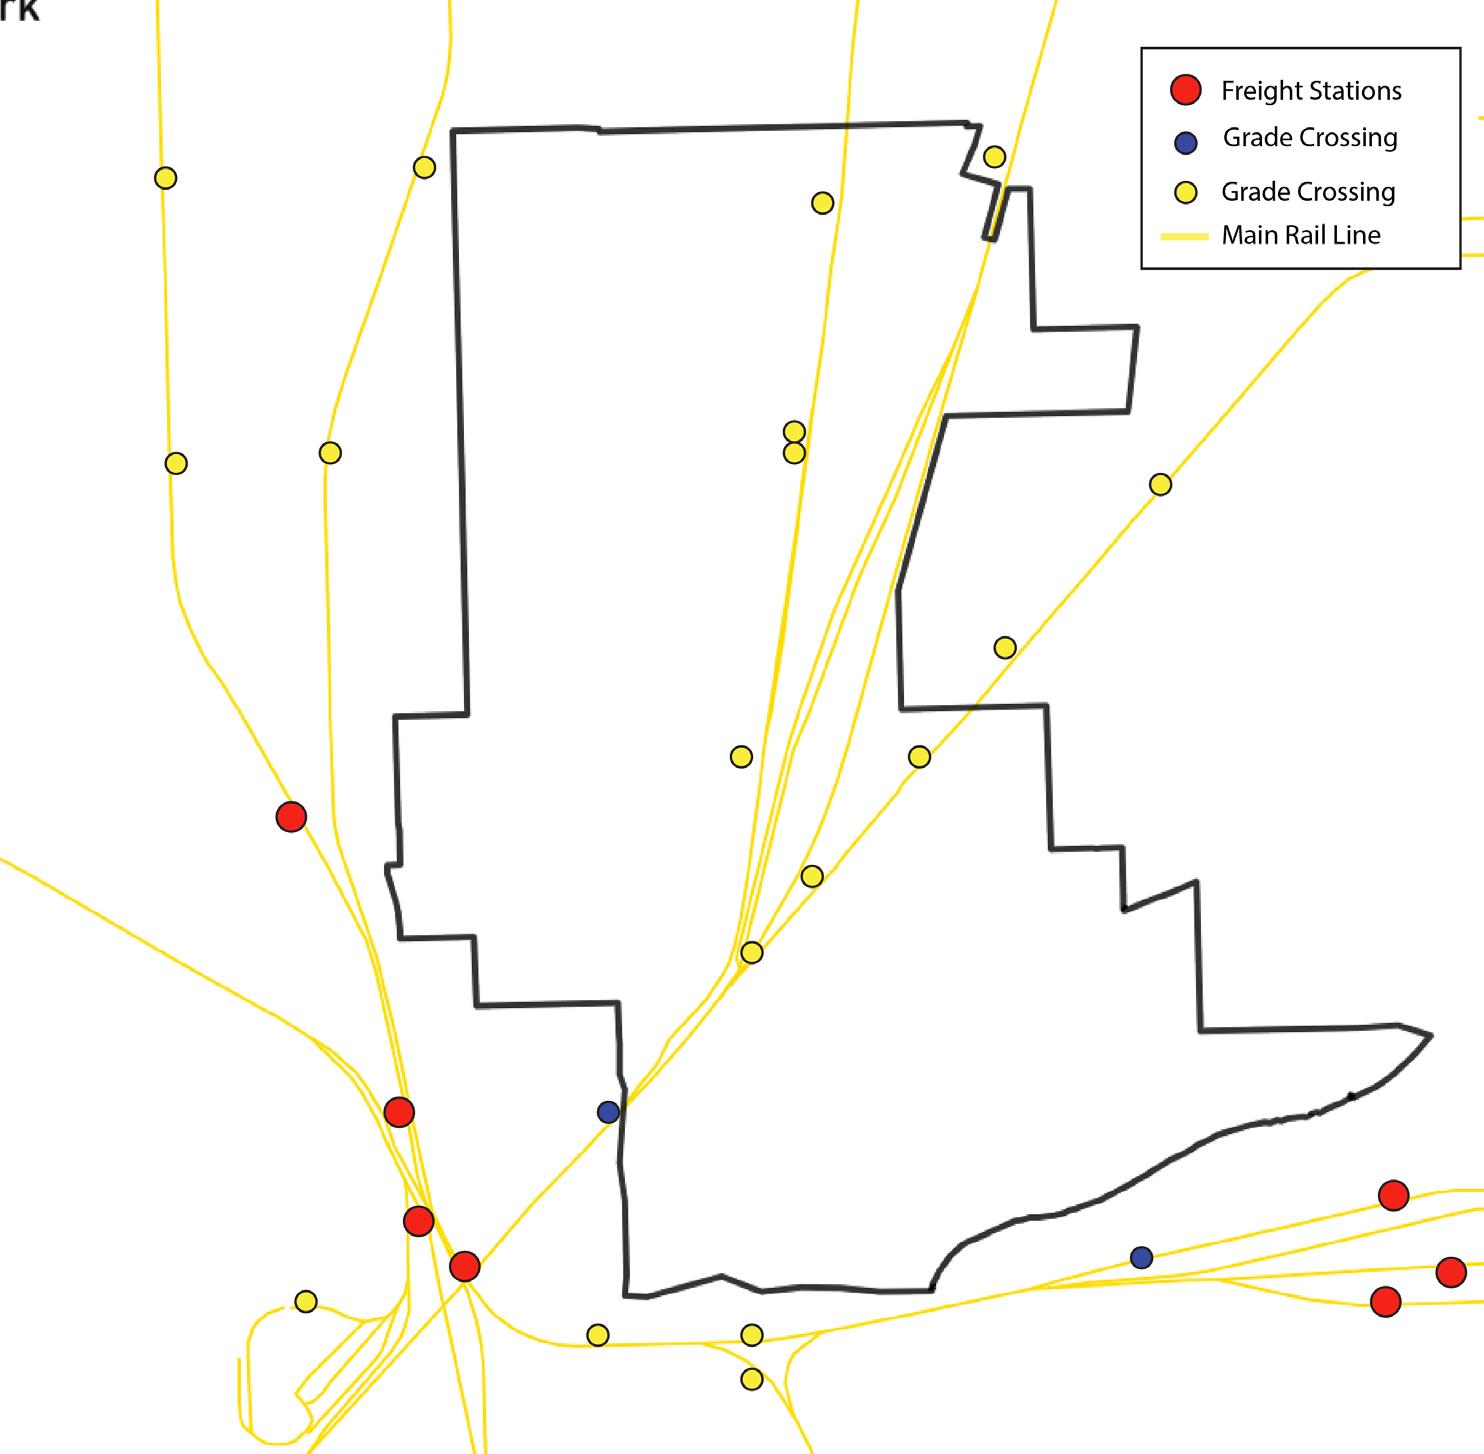
BI has several at-grade crossings that fall in the Northeast tract (See Figure 4-1). In 2011, the rail crossing at 119th Street had an average of 118.76 total hours/ day of aggregate delay, 1,974 vehicles delay, and an average of 6.56 minutes for gate down/ train passing. This is one of the top 10 public highway-rail grade crossings that cause the greatest amount of motorist delay and has several other hotspots running throughout its rail-lines.48 Safety is an issue because rail operations are in direct conflict with highway, pedestrian, and bicycle traffic.
According to CMAP’s 2011 update on Motorist Delay at Public Highway-Rail Grade Crossings in Northeastern Illinois, twenty cities with the greatest amount of motorist delay account for approximately 68% of the total motorist delay in Northeastern Illinois.49 Blue Island experiences motorist delays at 23 crossings and an annual average daily traffic (the total volume of vehicle traffic of a highway or road for a year divided by 365 days) of 114,719. This results in 5,717 delayed vehicles or 166.4 total hours of aggregate delay.50
Intersections and Pedestrian Safety Retrofits
Painted infrastructure helps mark safe spaces for pedestrians when traveling across streets such as crosswalks or intersections. Infrastructure retrofits include curb extensions to tighten curb radii. Promoting walkability to reduce dependency of cars is less likely to occur if pedestrians do not feel safe crossing these intersections. When drivers know where they must give pedestrians rightof-way, pedestrians will feel safer walking on streets. More people choosing to walk will decrease the dependence on cars and thus reduce automobile pollution from emissions.
Figure 4-1 of At-Grade Crossings in Northeast tract
Implementation
This policy will be implemented along with other cool pavement techniques for programming parking lots (see Section 5.1). Additionally, the city has already put together a comprehensive Non-Motorized Plan with the Active Transportation Alliance. The Blue Island Public Works department will help implement the policy. Responsibilities for grade crossing maintenance and improvements are divided between the public and private sectors. Private railroads maintain the warning devices and crossing surfaces at the crossing, and public highway authorities maintain advance warning signs that are not on the railroad right-of-way. Installing better signage may be cost-effective compared to expensive reconstruction of roads to separate pedestrian/ vehicle traffic from railroad traffic and prevent them sharing the same road/intersection. However, this inexpensive and shorter-term process in changing human behavior will still provide direct benefits such as reducing crossing distance for pedestrians and encouraging slower turning speeds. The success of this policy will be measured through increased pedestrian foot traffic, public engagement, incorporating artist work and designs, and a reduction in crashes at key intersections.
Case Study: Jersey City, New Jersey Jersey City, New Jersey hired a design and planning firm, Street Plans, to implement six walkability workshops that gathered feedback from residents on the city’s anticipated Pedestrian Enhancement Plan. Pop-up public meetings were held across the city in which the design firm conducted surveys for residents to help plan the walkability workshops. Based on the feedback received and supplementary data analysis, the workshop locations were along corridors that were identified as unsafe for pedestrians. Each workshop included designs such as temporary curb extensions, a public-feedback board, tables and chairs, wayfinding signage, planters, and colorful paint. The curb extensions enabled residents to travel safely throughout the areas, and additional feedback received helped provide input for the creation of the Pedestrian Enhancement Plan.51