
TECHNICAL REPORT FOR THE ESTUARY AND BASIN


Contributors Jenny Shinn (ed), Sheila Eyler, Ronald Heun, Gregory Lech, Ella Rothermel, and Dan Millemann
Cover photograph by Kate Layton
Richard Wong, PhD
DNREC Division of Fish & Wildlife
Suggested citation
Wong, R. 2022. Living Resources: Blue Crab. Technical Report for the Delaware Estuary and Basin, J. Shinn, L. Haaf, L. Morgan, and D. Kreeger (eds). Partnership for the Delaware Estuary. Report #22-05.
7.1.2 Horseshoe Crab ..................................................................
David R. Smith, PhD
U.S. Geological Survey, Eastern Ecological Science Center
Suggested citation
Smith, D. 2022. Living Resources: Horseshoe Crab. Technical Report for the Delaware Estuary and Basin, J. Shinn, L. Haaf, L. Morgan, and D. Kreeger (eds). Partnership for the Delaware Estuary. Report #22-05.
Jason Morson, PhD, David Bushek, PhD, & Lisa M. Calvo
Haskin Shellfish Research Laboratory, Rutgers University
Suggested citation
Morson, J., D. Bushek, L. M. Calvo. 2022. Living Resources: Eastern Oyster. Technical Report for the Delaware Estuary and Basin, J. Shinn, L. Haaf, L. Morgan, and D. Kreeger (eds). Partnership for the Delaware Estuary. Report #22-05.
Lisa M. Calvo, Daphne Munroe, PhD, & Jenny P. Shinn
Haskin Shellfish Research Laboratory, Rutgers University
Adopting Principles of Food Justice for Equitable Oyster
Cristina Sandolo
Danielle Kreeger, PhD, & Kurt Cheng
Partnership for the Delaware Estuary
Suggested citation
Kreeger, D., K. Cheng. 2022. Living Resources: Freshwater Mussels. Technical Report for the Delaware Estuary and Basin, J. Shinn, L. Haaf, L. Morgan, and D. Kreeger (eds). Partnership for the Delaware Estuary. Report #22-05.
1. The Academy of Natural Sciences, Drexel University; 2. Delaware River Basin Commission; 3. Division of Water Monitoring, Standards, and Pesticide Control, New Jersey Department of Environmental Protection; 4. Pennsylvania Department of Environmental Protection
Suggested citation
Kroll, S., J. Bransky, D. Bryson, A. Signor, D. Shull. 2022. Living Resources: Macroinvertebrates. Technical Report for the Delaware Estuary and Basin, J. Shinn, L. Haaf, L. Morgan, and D. Kreeger (eds). Partnership for the Delaware Estuary. Report #22-05.
United States Fish & Wildlife Service
Suggested citation
Marsh, B. 2022. Living Resources: Osprey. Technical Report for the Delaware Estuary and Basin, J. Shinn, L. Haaf, L. Morgan, and D. Kreeger (eds). Partnership for the Delaware Estuary. Report #2205.
Desmond Kahn, PhD1 & Ian Park2
1. Fishery Investigations, Inc.; 2. DNREC Division of Fish & Wildlife
Suggested citation
Kahn, D., I. Park. 2022. Living Resources: Atlantic Sturgeon. Technical Report for the Delaware Estuary and Basin, J. Shinn, L. Haaf, L. Morgan, and D. Kreeger (eds). Partnership for the Delaware Estuary. Report #22-05.
7.2.3 White Perch
John H. Clark
DNREC Division of Fish & Wildlife
Suggested citation
Clark, J. H. 2022. Living Resources: White Perch. Technical Report for the Delaware Estuary and Basin, J. Shinn, L. Haaf, L. Morgan, and D. Kreeger (eds). Partnership for the Delaware Estuary. Report #22-05.
7.2.4 Striped Bass .......................................................................
Edward A. Hale, PhD1, Ian Park2, Garry Glanden2
1. School of Marine Science & Policy, Delaware Sea Grant College Program, College of Earth, Ocean, and Environment, University of Delaware; 2. DNREC Division of Fish & Wildlife
Suggested citation
Hale, E. A., I. Park, G. Glanden. 2022. Living Resources: Striped Bass. Technical Report for the Delaware Estuary and Basin, J. Shinn, L. Haaf, L. Morgan, and D. Kreeger (eds). Partnership for the Delaware Estuary. Report #22-05.
7.2.5 Weakfish..............................................................................387
Michael J. Greco
DNREC Division of Fish & Wildlife
Suggested citation
Greco, M. J. 2022. Living Resources: Weakfish. Technical Report for the Delaware Estuary and Basin, J. Shinn, L. Haaf, L. Morgan, and D. Kreeger (eds). Partnership for the Delaware Estuary. Report #22-05.
7.2.6
Jordan Zimmerman
DNREC Division of Fish & Wildlife
Suggested citation
Zimmerman, J. 2022. Living Resources: American Eel. Technical Report for the Delaware Estuary and Basin, J. Shinn, L. Haaf, L. Morgan, and D. Kreeger (eds). Partnership for the Delaware Estuary. Report #22-05.
Haley Oleynik
University of Delaware
The Living Resources Chapter examines eleven indicators across the Delaware River Estuary and Basin, spanning multiple taxa from osprey to macroinvertebrates. Experts that manage or study each living resource provide an introduction, description of the indicator, status, trends, future predictions, and conclude with actions and needs. Of the indicators discussed, 4 are showing signs of population decline (white perch, weakfish, striped bass, freshwater mussel), 3 are stable (macroinvertebrates, horseshoe crabs, oysters) and 4 are on the rise (osprey, blue crab, American eel, strugeon)(see graphic summary below). Feature stories within this chapter highlight the burgeoning shellfish aquaculture sector including a view on food justice, and new research characterizing longterm fish community trends in the Estuary. Importantly, this chapter only focuses on a few animal populations within the Delaware Estuary and Basin; more information on other monitored fisheries (i.e., stock assessments) can be found in reports by the Mid-Atlantic Fishery Management Council , Atlantic States Marine Fisheries Commission , as well as the Delaware River Basin Fish and Wildlife Management Cooperative (e.g., the American Shad Habitat Plan for the Delaware River ).





The blue crab (Callinectes sapidus) is a member of the swimming crab family Portunidae and inhabits estuarine habitats throughout the western Atlantic, from Nova Scotia (although rare north of Cape Cod), along the Gulf of Mexico and Caribbean, to northern Argentina, and along western South America as far south as Ecuador (Williams 1979)
Blue crab spawning occurs primarily in the summer months in mid to lower Delaware Bay with peak larval abundance occurring in August (Dittel and Epifanio 1982). Larvae are exported from the estuary into the coastal ocean where they undergo a 3-6 week, seven stage, zoeal development period in surface waters (Epifanio 1995; Nantunewicz et al. 2001). Models describe an initial southward transport of zoeae along the inner continental shelf within the buoyant estuarine plume after exiting the estuary (Epifanio 1995, Garvine et al. 1997). Northward transport back toward the estuary is provided by a wind-driven band of water flowing northward along the mid-shelf. Across-shelf transport into settlement sites in Delaware Bay is accomplished by coastal Ekman transport tied to discrete southward wind events (nor’easters) in the fall. These discrete wind events may have a large effect on larval recruitment and settlement success in the bay and strongly influence year class strength.
Females mate immediately after their pubertal molt into sexual maturity, usually late in their first year of life (late spring, summer). Sperm is stored over their remaining lifetime from this single mating event. Mated females can begin producing eggs in that summer and early fall over multiple clutches, continuing through to a second spawning season (Churchill 1921; Van Engle 1958; Darnell et al. 2009). Darnell et al. (2009) observed up to seven clutches for females in North Carolina. Prager et al. (1990) estimated fecundity per batch as over 3x10⁶ eggs.
Blue crabs hold an important ecological role as opportunistic benthic omnivores, with major food items including bivalves, fish, crustaceans, gastropods, annelids, nemertean worms, plant material, and detritus (Guillory et al. 2001). Post-settled blue crabs have been shown to have a key effect on infaunal community structure, particularly through major predation on bivalves such as the eastern oyster (Crassostrea virginica) (Eggleston 1990), hard clam (Mercenaria mercenaria) (Sponaugle and Lawton 1990), wedge clam (Rangia cuneata) (Darnell 1958), soft-shelled clam (Mya arenaria) (Blundon and Kennedy 1982; Smith and Hines 1991; Eggleston et al. 1992), and other bivalve species (Blundon and Kennedy 1982), and through indirect mortality on infaunal species from mechanical disturbance of sedimentary habitats caused by foraging (Virnstein 1977). Fish are primary predators on blue crabs, with more than 60 known fish predator species (Guillory et al. 2001).
Another very important source of predation on blue crabs occurs from cannibalism, as blue crabs make up as much as 13% of their diet (Darnell 1958). Cannibalism appears to increase with increasing crab predator size and is heaviest during the period of juvenile recruitment (Mansour 1992). Adult predation may be a key factor in density-dependent regulation of juveniles (Peery 1989).
Overfishing and stock sustainability in Delaware Bay became a serious concern in the mid 1990s, after a prolonged period of rising fishing effort and three-fold increase in landings from 1985-1995 (Fig 7.1.1.1). These fears peaked after bay-wide landings reached a record 12.7 million pounds in 1995 and then subsequently dropped by more than 46% in 1996.

Concern for the stock in 1998 prompted the 138th General Assembly of the State of Delaware to direct its Division of Fish and Wildlife to prepare a fishery management plan and quantitative assessment of the stock. Subsequent stock assessments revealed high fishing mortality rates in Delaware Bay in close proximity to the management threshold (fishing mortality F=1.3) suggesting that the stock was fully exploited (Helser and Kahn 1999; Wong 2010).
Perhaps the most-studied fishery species in Delaware, the blue crab has been very closely monitored since 1978 with monthly trawl surveys conducted by the Delaware Division of Fish and Wildlife (DDFW). Using biological information collected from these surveys, together with year-round collections of landings reports, the DDFW assesses the size and status of the Delaware Bay blue crab stock on an annual basis. This annual stock assessment is funded by the National Oceanic and Atmospheric Administration.
The Delaware Bay blue crab stock supports a multi-million dollar, bi-state (NJ & DE) fishery. Delaware Bay landings and ex-vessel value in 2020 remained at historically high levels, reaching 9.3 million pounds and 14.1 million dollars combined in DE and NJ (Fig 7.1.1.1). Delaware Bay landings are generally split equally between the two States (51%:49%, DE:NJ). The current, five-year, average, baywide landings are the fourth highest on record since 1973, while the running, five-year, average ex-vessel value ($15.1M) is at the historical record high.
In the State of Delaware, the blue crab (Callinectes sapidus) is by far the most valuable commercial fishery species. The ex-vessel value of blue crab landings in Delaware is worth more than three times the value of all other commercial fisheries combined.
The blue crab is also the most-numerous recreational fishery species harvested in Delaware Bay, exceeding two million crabs annually (Wong, unpublished). Recreational harvest accounts for about 3% and 15% of the total annual Delaware Bay landings in Delaware and New Jersey, respectively.

The pot fishery, by far, harvests the lion’s share (86%) of Delaware’s crab landings and value (Fig 7.1.1.2). Male crabs make up about 2/3 of the pot landings, in stark contrast to the female-dominated winter dredge fishery landings (Fig 7.1.1.3).
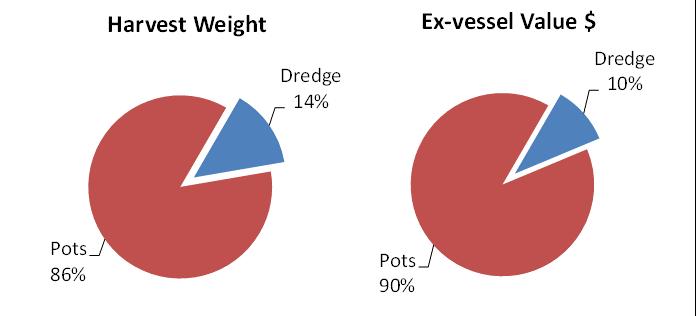
Figure 7.1.1.2 Total harvested weight and ex-vessel dollar value by gear type over the most-recent five years of Delaware landings data.
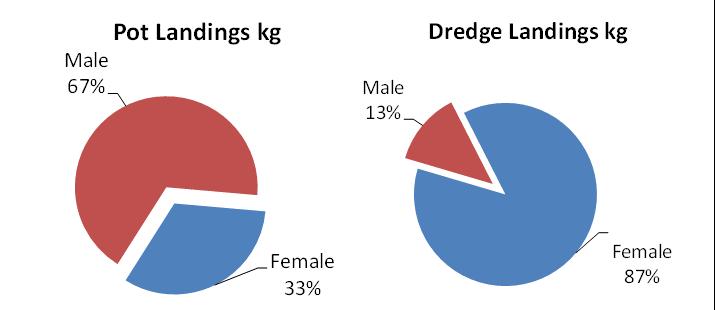
Figure 7.1.1.3 Sex-composition of pot and dredge fishery landings over the mostrecent five years of Delaware landings data.
The DDFW conducts an annual stock assessment of the Delaware Bay blue crab stock. Modeling work shows the stock to be at high levels of abundance and at relatively low levels of fishing mortality, and to be in excellent condition relative to historical metrics dating back to 1978 (Wong 2021). Juvenile recruitment has increased considerably (after bottoming in 2012-2013), reaching record highs in 2019, and persisting at robust, above-average levels for the past six years. Recent, sustained, high levels of recruitment (beginning in 2015), concomitant with a short period of low harvest (2013-2015), have now led to the highest levels of adult abundance since the population peak of the 1980s and 90s (Figs 7.1.1.5; 7.1.1.6). Consequently, fishing mortality rates have declined appreciably over recent years, at levels well

below management thresholds. Terminal year model estimates of juvenile and adult abundances are at healthy levels. Total stock size stands at 203 million crabs, above the 43 year mean and median of 153 and 132 million (Fig 7.1.1.4) (Wong 2021). The near-term future outlook is promising, given the observed, elevated, stock productivity in recent years.
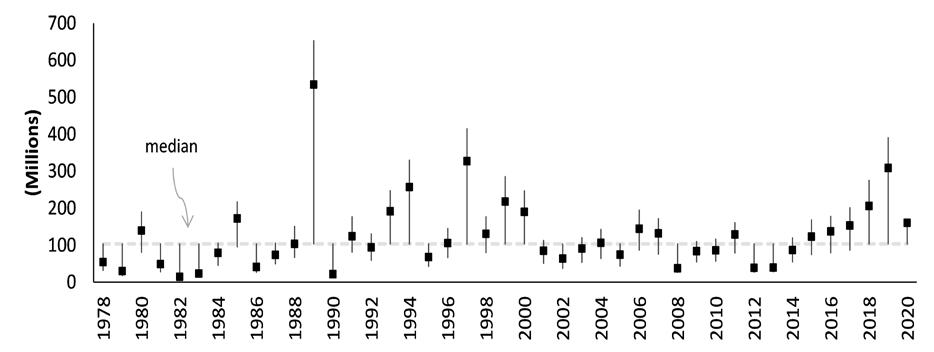
Figure 7.1.1.4 Absolute abundance (on Sep 1) of juvenile crabs with 95 percent confidence intervals estimated from the population assessment model (Wong 2021).
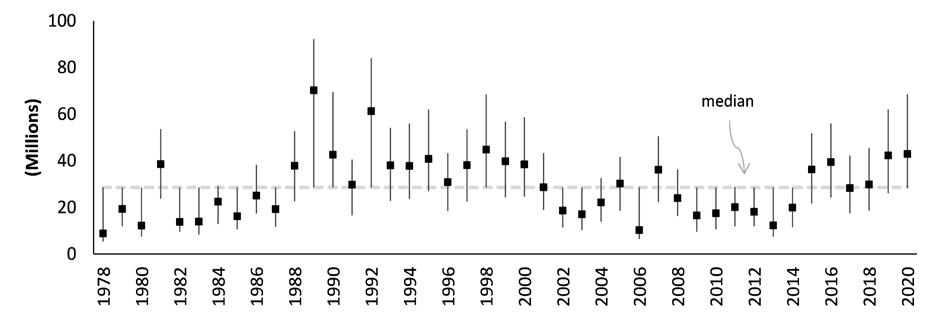
Figure 7.1.1.5 Absolute abundance (on Sep 1) of adult crabs fully recruited to the fishery with 95 percent confidence intervals estimated from the population assessment model (Wong 2021).
A period of high stock productivity occurred for about 15 years from 1985 to 1999 (Fig 7.1.1.6). During this period, DDFW crab indices were at or above median levels for 13 of 17 years. Weak year classes became commonplace for the next 15 year period from 2000 to 2014. Currently, the DDFW has observed consistently robust juvenile recruitment for six consecutive years (2015 to current).
The near-term outlook for the fishery is promising given robust juvenile recruitment. Young-of-the-year (YOY) recruitment is typically a good predictor of future Delaware Bay landings (Fig 7.1.1.7). Furthermore, high stock productivity could continue to benefit from extended spawning seasons and increased egg clutches as temperatures remain elevated in Delaware Bay.

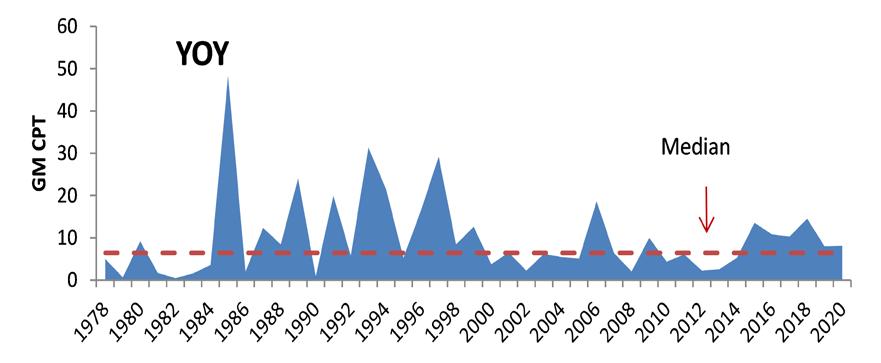
Figure 7.1.1.6 Young-of-the-year blue crab relative abundance from the DFW Delaware Bay trawl survey.

Figure 7.1.1.7 YOY abundance as a predictor of ensuing Delaware commercial landings (19782020). Red dot indicates predicted recruitment in 2021.
Continued close monitoring of stock abundance through monthly trawl surveys and accurate reporting of fishery landings are needed to protect, assess, and manage this important fishery stock.
Summary
The Delaware Bay blue crab stock is presently at historically high levels of adult abundance, and at low levels of fishing mortality (Wong 2021). Juvenile recruitment has risen sharply (after a prolonged, twodecade period of weak year classes) and has remained at above-average levels for six consecutive years, which bodes well for the stock and fishery in the near future.

Blundon, J.A. and V.S. Kennedy. 1982. Mechanical and behavioral aspects of blue crab, Callinectes sapidus, predation on Chesapeake Bay bivalves. J. Exper. Mar. Biol. and Ecol. 65:47-65.
Booth, K.J. and L.G. Martin. 1993. Striped bass feeding behavior and the potential effect on the blue crab population in the Chesapeake Bay. Maryland Department of Natural Resources, Tidewater Administration Fisheries Technical Memo No. 2 (Series), 7 pages.
Churchill, E.P. 1921. Life history of the blue crab. Bull. U.S Bureau of Fisheries for 1917-1918. 36:91-128.
Darnell, R.M. 1958. Food habits of fishes and larger invertebrates of Lake Pontchartrain, Louisiana, an estuarine community. Publication of the Institute of Marine Science, U. Texas 5:353-416.
Eggleston, D.B., R.N. Lipcius and A.H. Hines. 1992. Density-dependent predation by blue crabs upon infaunal clam species with contrasting distribution and abundance patterns. Mar. Ecol. Prog. Ser. 85:55-68.
Epifanio, C.B. 1995. Transport of blue crab (Callinectes sapidus) larvae in the waters off Mid-Atlantic states. Bull. Mar. Sci. 57:713-725.
Garvine R.W., Epifanio C.C., Epifanio C.E. and K.C. Wong.1997. Transport and recruitment of blue crab larvae: a model with advection and mortality. Estuar Coast Shelf Sci 45:99–111.
Guillory, V., (11 other authors). 2001. The blue crab fishery of the Gulf of Mexico, United States: A regional management plan. Gulf States Marine Fisheries Commission, P.O. Box 726, Ocean Springs, MS 39566.
Helser, T.E., and D.M. Kahn. 1999. Stock assessment of Delaware Bay blue crab (Callinectes sapidus) for 1999. Department of Natural Resources and Environmental Control, Delaware Division of Fish and Wildlife, 89 Kings Highway, Dover, DE 19901.
Mansour, R.A. 1992. Foraging ecology of the blue crab, Callinectes sapidus, in lower Chesapeake Bay, Ph.D. Dissertation. College of William and Mary, Williamsburg, VA.
Natunewicz, C., Epifanio, C.E., and R.W. Garvine. 2001. Transport of crab larvae patches in the open ocean. Mar. Ecol. Prog. Ser. 222:143-154.
Peery, C.A. 1989. Cannibalism experiments with the blue crab (Callinectes sapidus Rathbun): potential effects of size and abundance. Thesis (M.A.)--College of William and Mary. (Series) viii, 29 leaves, [2] leaves of plates. Virginia Institute of Marine Science.
Prager, M.H., J.R. McConaugha, C.M. Jones, and P.J. Geer. 1990. Fecundity of blue crab, Callinectes sapidus, in Chesapeake Bay: biological, statistical, and management considerations. Bull. Mar. Sci. 46:170-179.
Smith, L.D. and A.H. Hines. 1991. The effect of cheliped loss on blue crab Callinectes sapidus foraging rate on soft-shell clams Mya arenareia. J. Exp. Mar. Biol. and Ecol. 15(2):245-256.
Speir, Harley J. 2001. A review of predation on blue crabs in Chesapeake Bay. Maryland DNR. Fisheries Tech. Memo Series no.24.
Van Engle, W.A. 1958. The blue crab and its fishery in Chesapeake Bay. Part 1-Reproduction, early development, growth, and migration. Commercial Fisheries Review 20:6-17.
Virnstein, R.W. 1977. The importance of predation by crabs and fishes on benthic infauna in Chesapeake Bay. Ecology 58:1199-1217.
Wong, Richard. 2010. Stock assessment of the Delaware Bay blue crab (Callinectes sapidus). Department of Natural Resources and Environmental Control, Delaware Division of Fish and Wildlife, 89 Kings Highway, Dover, DE 19901.
Wong, Richard. 2021. Stock assessment summary of the Delaware Bay blue crab (Callinectes sapidus). Department of Natural Resources and Environmental Control, Delaware Division of Fish and Wildlife, 89 Kings Highway, Dover, DE 19901.

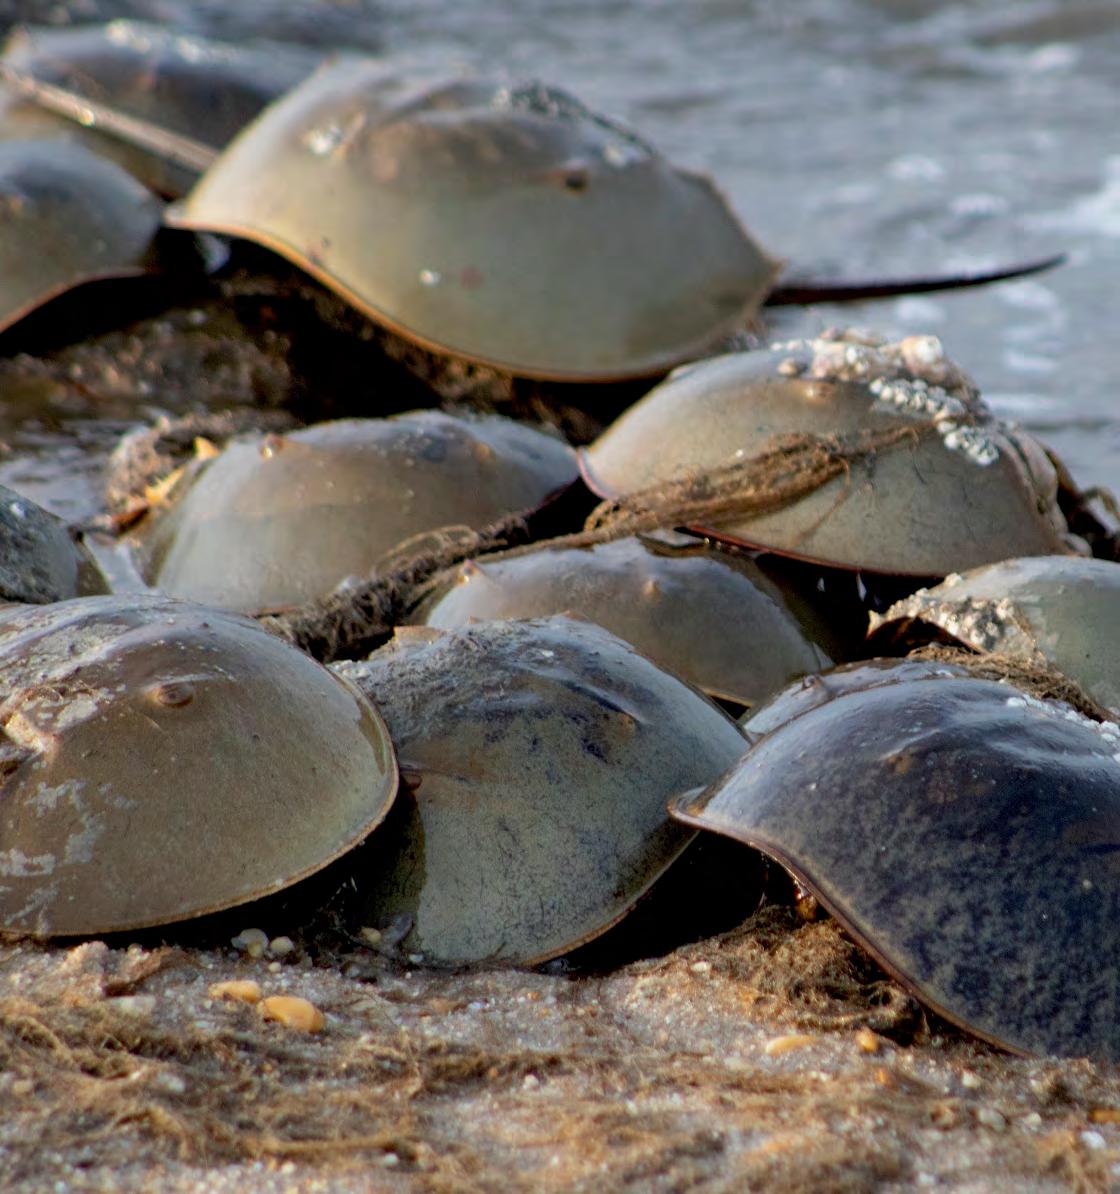
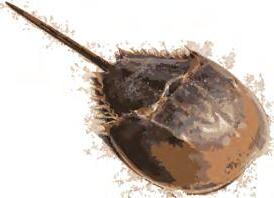
Horseshoe crabs (Limulus polyphemus) are benthic (or bottom-dwelling) marine arthropods that use both estuarine and continental shelf habitats. Although it is called a “crab,” it is grouped in its own class (Merostomata), which is more closely related to the arachnids and scorpions than blue crabs and other crustaceans. Horseshoe crabs range from the Yucatan peninsula in Mexico to northern Maine in the US, with the largest population of spawning horseshoe crabs in the world found in the Delaware Bay.
Each spring, adult horseshoe crabs migrate from deep waters in bays and the ocean to spawn on intertidal estuarine sandy beaches (Shuster and Botton 1985). Beaches within estuaries, such as the Delaware Bay, are believed to be preferred because they are low energy environments protected from wind and waves, thus reducing the risks of stranding during spawning events. Spawning generally is initiated by increasing water temperatures and occurs from May through June in Delaware Bay, with the peak spawning activity occurring on the evening new and full moon high tides in mid to late May and early June (Smith et al. 2017).
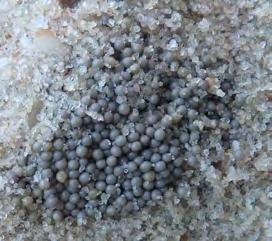
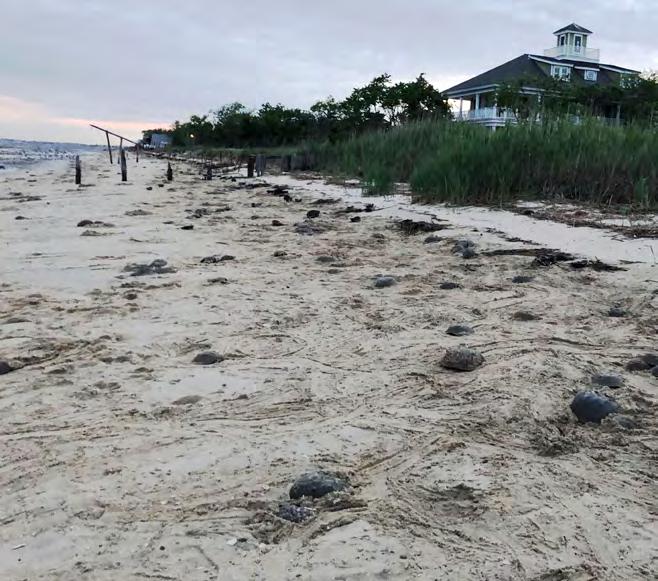
Horseshoe crabs are characterized by high fecundity, high egg and larval mortality, and low adult mortality. Horseshoe crabs spawn multiple times per season associated with high tides (Chabot and Watson 2010). Adult females spawn typically on multiple days per season digging multiple nests during a spawning bout to deposit clusters of approximately 3,650 to 4,000 eggs in each nest (Fig 7.1.2.1), which is 10-20 cm below the beach surface (Brockmann and Penn 1992, Brousseau et al. 2004, Weber and Carter 2009, Smith et al. 2010, Beekley and Mattei 2015). An average size female in Delaware Bay, measuring 265 mm in prosomal width (i.e., the widest part of the animal), lays approximately 88,000 eggs annually (Shuster and Botton 1985). Adult males approach the spawning beaches more frequently than females to fertilize eggs either while attached in a mating position, known as amplexus, or gathered around a spawning female (Brockmann and Penn 1992). Egg development is dependent on temperature, moisture, and oxygen content of the nest environment (Vasquez et al. 2015) (Fig 7.1.2.2A). Eggs hatch between 14 and 30 days after fertilization (Fig 7.1.2.2B) (Botton et al. 1992).
Juvenile horseshoe crabs generally spend their first and second summer on the intertidal flats, usually near the breeding beach where they hatched (Botton and Loveland 2003). As they mature, juvenile horseshoe crabs move into deeper water, eventually mixing with multiple cohorts and ages in areas offshore. Horseshoe crabs molt 16 to 17 times over 9 to 11 years to reach sexual maturity (Shuster and Sekiguchi 2003). Based on multiple lines of evidence from tagging studies, growth of epifaunal slipper shells (Crepidula fornicata), and demographic modeling, horseshoe crabs can live more than 20 years with tagged adults observed to remain at large up to 17 years indicating a maximum age of at least 27 years (ASMFC 2019).

Larvae and juveniles feed on benthic algae and animals, such as small polychaetes and nematodes (Carmichael et al. 2009). As horseshoe crabs mature, their diet shifts to a variety of benthic macrofauna, mainly blue mussel (Mytilus edulis) and surf clam (Spisula solidissima), but also razor clam (Ensis spp.), macoma clam (Macoma spp.), wedge clam (Tellina spp.), and fragile razor clam (Siliqua costata) (Botton and Haskins 1984, Botton and Ropes 1989).
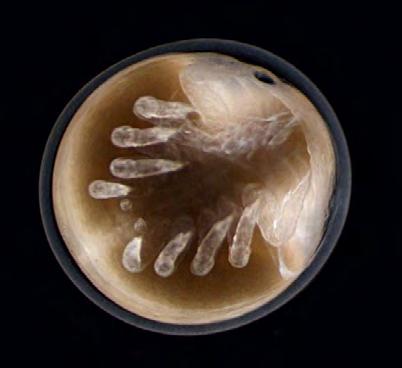
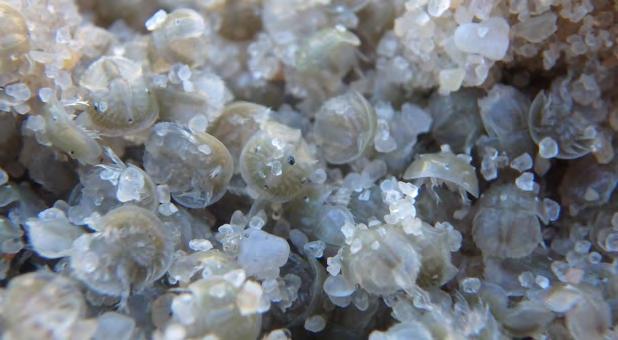
Shorebirds feed on horseshoe crab eggs in areas of high spawning densities most notably within the Delaware Bay where horseshoe crab eggs are considered essential food for several shorebird species (Karpanty et al. 2006 and 2011, Botton et al. 2022). Delaware Bay is an important migratory staging area for shorebirds in North America. Horseshoe crabs place egg clusters at depths greater than 10 centimeters, which is deeper than most shorebirds can probe (Weber and Carter 2009, Karpanty et al. 2011). Shorebirds feed on the eggs that are brought to the surface by bioturbation due to nesting activity and wave action (Nordstrom et al. 2006).
Adult and juvenile horseshoe crabs make up a portion of the diet of the loggerhead sea turtle (Caretta caretta) in Delaware (Seney 2007). Horseshoe crab eggs and larvae and adults are also a seasonally preferred food item of a variety of invertebrates and finfish.
Historically, overharvest of horseshoe crabs has caused multiple cycles of population reduction and rebuilding (Kreamer and Michels 2009). Between the 1850s and the 1920s, it is estimated that over one million horseshoe crabs were harvested annually for fertilizer and livestock feed (Kreamer and Michels 2009). More recently horseshoe crabs have been taken in substantial numbers (e.g., over 5 million pounds in 1996 probably exceeding previous harvest periods) to provide bait primarily for the American eel (Anguilla rostrata) and whelk (Busycon carica and Busycotypus canaliculatus) fisheries (Botton et al. 2022). Since the early 2000s, harvest of horseshoe crabs for bait has been regulated and restricted by the Atlantic States Marine Fisheries Commission (ASMFC). Since 2013, sex-specific harvest in the Delaware Bay region has been managed under an adaptive management framework (ASMFC 2021 and 2022).
Horseshoe crabs are also collected by the biomedical industry to produce Limulus Amebocyte Lysate (LAL). This industry bleeds individuals and releases the animals live after the bleeding procedure. LAL is used world-wide to test medical products such as influenza serum, pacemakers, artificial joints, and other items to help ensure public safety from bacterial contamination (Levin et al. 2003). Mortality of horseshoe crabs associated with LAL production is estimated to be on average 15 percent and ranges from 4 to 30

percent depending on blood volume withdrawn and handling stress (ASMFC 2019). Synthetic alternatives to LAL have been developed based on recombinant technology (Botton et al. 2022). But the alternatives are waiting for product development and validation before adoption by commercial industry.
The peer-reviewed stock assessment conducted decennially since 1999 by the ASMFC represents the state of science indication of status for the horseshoe crab population in Delaware Bay. The ASMFC stock assessment integrates information from multiple surveys from the Delaware Bay region. The most recent stock assessment conducted in 2019 established the use of a catch multiple survey analysis (CMSA) to estimate abundance.
The CMSA integrates indices from the Delaware Adult Trawl, New Jersey Ocean Trawl, and Virginia Tech Trawl surveys to estimate abundance of primiparous (1st year of spawning) and multiparous (>1 year of spawning) males and females (Figs 7.1.2.3 and 7.1.2.4). Additional scientifically valid surveys, such as egg survey data (Smith et al. 2022), could be incorporated into the CMSA in future assessments. The use of CMSA was endorsed by two peer-review panels and adopted by the ASMFC management board for use in conservation decisions. Detailed descriptions of the surveys and CMSA methods, along with peer review comments, are available in ASMFC reports (ASMFC 2019 and 2021). The first peer-review panel was convened for the 2019 stock assessment. The second panel reviewed the revised adaptive resource management framework (ARM) in 2021.
The ARM has been used to inform ASMFC management of horseshoe crabs since 2013 (ASMFC 2021, McGowan et al. 2015; Fig 7.1.2.5). The objective of the ARM is to manage sustainable harvest of Delaware Bay horseshoe crabs while maintaining ecosystem integrity and supporting red knot (Calidris canutus) recovery by providing adequate stopover habitat for migrating shorebirds. Towards that end, the CMSA model was used to predict future horseshoe crab abundance resulting from harvest levels. And the CMSA model was combined with an integrated population model for predicting red knot abundance in response to horseshoe crab abundance and other factors (ASMFC 2021, Tucker et al. 2022).
The peer-reviewed 2019 Horseshoe Crab Benchmark Stock Assessment evaluated the stock status by region, finding the Delaware Bay population to be stable (ASMFC 2019). The assessment concluded that overfishing and overfished status were unlikely for Delaware Bay horseshoe crabs because of low fishing mortality and relatively high recent abundances.
The horseshoe crab population in Delaware Bay declined in the early 1900s due to overharvest for fertilizer (Kreamer and Michels 2009). But the population increased from the mid-20th century through the 1980s after use for fertilizer stopped. Overharvest for bait caused the population to decline in the 1990s. Coordinated inter-state harvest regulation to address the overharvest started in 1999 (ASMFC 2019). The peer-reviewed 2019 Horseshoe Crab Benchmark Stock Assessment evaluated the stock status by region, finding the Delaware Bay population to be stable (ASMFC 2019).

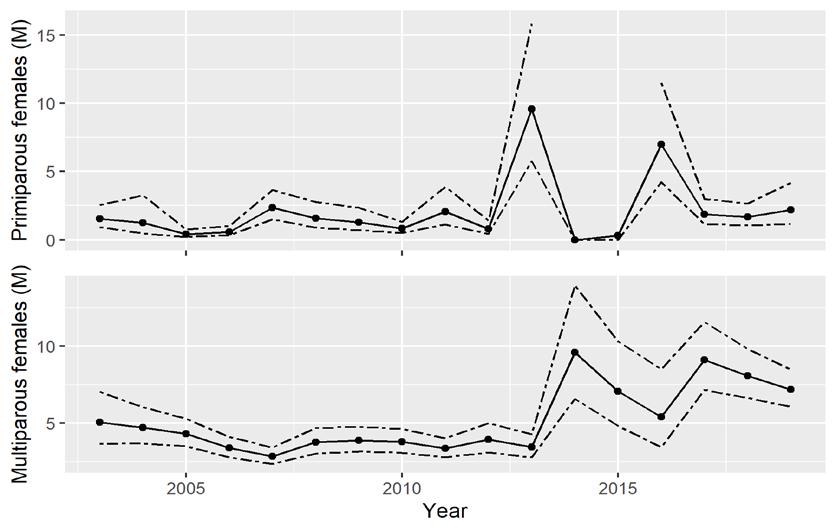
Figure 7.1.2.3 Catch multiple survey analysis (CMSA) estimated abundance (solid lines) of primiparous (first-spawning) and multiparous (previously spawned) females (millions, M) in the Delaware Bay population of horseshoe crabs ( Limulus polyphemus ) with 95% confidence limits (dashed lines) for 2003 to 2019 (ASMFC 2021 and 2022). The upper bound for primiparous females exceeded the scale in 2013-2015 and is not shown.
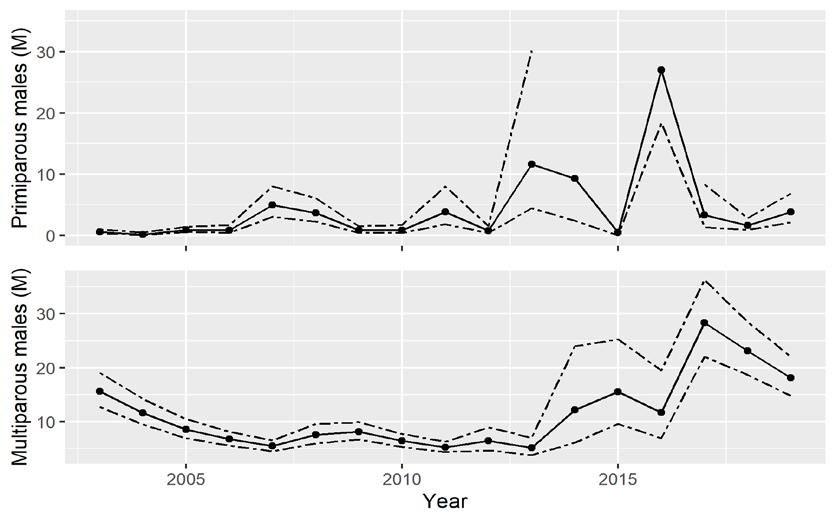
Figure 7.1.2.4 Catch multiple survey analysis (CMSA) estimated abundance (solid lines) of primiparous (first-spawning) and multiparous (previously spawned) males (millions, M) in the Delaware Bay population of horseshoe crabs ( Limulus polyphemus ) with 95% confidence limits (dashed lines) for 2003 to 2019 (ASMFC 2021 and 2022). The upper bound for primiparous females exceeded the scale in 2013-2015 and is not shown.

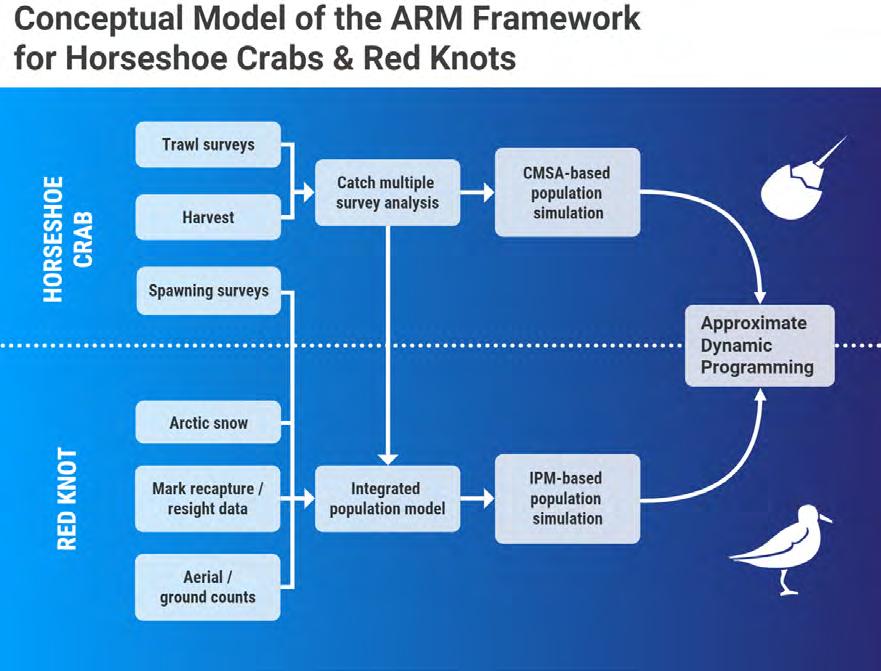
Figure 7.1.2.5 The adaptive resource management (ARM) framework used by the Atlantic States Marine Fisheries Commission to inform management of horseshoe crabs ( Limulus polyphemus ) in the Delaware Bay region (Sarah Murray, ASMFC).
The ASMFC has implemented monitoring programs and restricted harvest of horseshoe crab with stated goals of maintaining a sustainable population for current and future generations of the fishing and non-fishing public, migrating shorebirds, and other dependent wildlife, including federally listed loggerhead sea turtles. The National Marine Fisheries Service has established a horseshoe crab sanctuary off the mouth of Delaware Bay, the Carl N. Shuster Sanctuary (Smith et al. 2016). Watermen have voluntarily implemented the use of bait bags that reduce their need for bait by preventing bait from being consumed by non-target species (Walls et al. 2002). The biomedical industry has voluntarily implemented management practices to reduce stress to animals being held for bleeding (Botton et al. 2022). These measures can be expected to allow the spawning population to increase over time by reducing harvest and indirect mortality (ASMFC 2019).
Because horseshoe crabs are long-lived and females do not reproduce typically until at least 10 years old, population rebuilding can take decades (Sweka et al. 2007). Whether the recent horseshoe crab population levels are sufficient to support migratory shorebirds has been debated in the scientific literature (Karpanty et al. 2016, Smith et al. 2022). However, the data indicate that the management actions to limit harvests, combined with voluntary reductions in bait use by commercial fishers, have allowed the population to increase in recent years compared to the early 2000s (ASMFC 2019 and 2021, Smith et al. 2022).

Under the ARM Framework, empirical models that describe the dependence and interaction of red knots and horseshoe crabs can be evaluated over time by monitoring the populations and updated with new data (McGowan et al. 2015; Fig 7.1.2.5). The monitoring programs that provide data for the CMSA model and the Shorebird Monitoring Program that result in mark-recapture estimates of red knot abundance are essential to implement this Framework (ASMFC 2021). Also, the Delaware Bay spawning survey is used to estimate the proportion of spawning that occurs during the red knot migration and is another important input to the ARM modeling (ASMFC 2021). Ensuring consistent funding to support these important monitoring programs will be critical to increase our understanding and reduce our uncertainty regarding how these two populations interact.
Management of horseshoe crab harvest coupled with voluntary measures by the bait and biomedical industries has allowed spawning populations of horseshoe crabs in Delaware Bay to increase over time compared to the early 2000s. Managing for horseshoe crab abundance near carrying capacity will be important to support surface eggs needed by current and future shorebirds during their stopover in Delaware Bay. However, shifts in carrying capacity related to climate change and coastal development could alter spawning densities relative to what were believed to be historical levels.
Since a portion of the red knot population that passes through Delaware Bay winters at the tip of South America and breeds in the high Arctic, other factors outside of Delaware Bay can, and probably are, affecting these populations. Work to better understand the dependence of red knots on Delaware Bay is being carried out, in part, through a cooperative Adaptive Management Framework.
Atlantic States Marine Fisheries Commission (ASMFC). 2019. 2019 Horseshoe Crab Benchmark Stock Assessment. Arlington, VA. 271 pp. (http://www.asmfc.org/uploads/file/5cd5d6f1HSCAssessment_ PeerReviewReport_May2019.pdf)
Atlantic States Marine Fisheries Commission (ASMFC). 2021. Revision to the Framework for Adaptive Management of Horseshoe Crab Harvest in the Delaware Bay Inclusive of Red Knot Conservation and Peer Review Report. Arlington, VA. 302 pp. (To be posted at http://www.asmfc.org/species/horseshoe-crab under Stock Assessment Reports).
Atlantic States Marine Fisheries Commission (ASMFC). 2022. Overview of Horseshoe Crab ARM Revision and Peer Review. Arlington, VA. 237 pp. (http://www.asmfc.org/uploads/file/61f2f18aHSC_ARM_ RevisionOverview_Jan2022.pdf)
Beekey MA, Mattei JH (2015) The mismanagement of Limulus polyphemus in Long Island Sound, U.S.A.: what are the characteristics of a population in decline. In: Carmichael RH, Botton ML, Shin PKS, Cheung SG (eds) Changing global perspectives on horseshoe crab biology, conservation and management. Springer, New York, pp 433–461
Botton ML, Haskins HH (1984) Distribution and feeding of the horseshoe crab, Limulus polyphemus, on the continental shelf off New Jersey. Fishery Bulletin 82:383–389
Botton ML, Loveland RE (2003) Abundance and dispersal potential of horseshoe crab Limulus polyphemus larvae in the Delaware estuary. Estuaries 26:1472–1479
Botton ML, Loveland RE, Jacobsen TR (1992) Overwintering by trilobite larvae of the horseshoe crab Limulus polyphemus on a sandy beach of Delaware Bay (New Jersey, USA). Marine Ecology Progress Series 88:289–292

Botton ML, Loveland RE, Munroe D, Bushek, Cooper JF (2022) Identifying the major threats to American horseshoe crab populations, with emphasis on Delaware Bay. In: Tanacredi JT, Botton ML, Shin PKS, Iwasaki Y, Cheung SG, Kwan KY, Mattei JH (eds) International horseshoe crab conservation and research efforts. Springer (doi.org/10.1007/978-3-030-82315-3)
Botton ML, Ropes JW (1989) Feeding ecology of horseshoe crabs on the continental shelf, New Jersey to North Carolina. Bulletin of Marine Science 45:637–647
Brockmann HJ, Penn D (1992) Male mating tactics in the horseshoe crab Limulus polyphemus. Animal Behaviour 44:653–665
Brousseau LJ, Sclafani M, Smith DR (2004) Acoustic-tracking and radio tracking of horseshoe crabs to assess spawning behavior and subtidal habitat use in Delaware Bay. North American Journal of Fisheries Management 24:1376–1384
Carmichael RH, Gaines E, Sheller Z, Tong A, Clapp A, Valiela I (2009) Diet composition of juvenile horseshoe crabs: implications for growth and survival of natural and cultured stocks. In: Tanacredi JT, Botton ML, Smith DR (eds) Biology and conservation of horseshoe crabs. Springer, New York, pp 521–534
Chabot CC, Watson WH III (2010) Circatidal rhythms of locomotion in the American horseshoe crab Limulus polyphemus: underlying mechanisms and cues that influence them. Current Zoology 56:499–517
Karpanty SM, Fraser JD, Berkson J, Niles LJ, Dey A, Smith EP (2006) Horseshoe crab eggs determine red knot distribution in Delaware Bay. Journal of Wildlife Management 70: 1704-1710.
Karpanty SM, Cohen J, Fraser JD, Berkson J (2011) Sufficiency of horseshoe crab eggs for red knots during spring migration stopover in Delaware Bay USA. Journal of Wildlife Management 75: 984994.
Kreamer G, Michels S (2009) History of horseshoe crab harvest on Delaware Bay. In: Tanacredi JT, Botton ML, Smith DR (eds) Biology and conservation of horseshoe crabs. Springer, New York, pp 299–313
Levin J, Hochstein HD, Novitsky TJ (2003) Clotting cells and Limulus amebocyte lysate: an amazing analytical tool. In: Shuster CN Jr, Barlow RB, Brockmann HJ (eds) The American horseshoe crab. Harvard University Press, Cambridge, pp 310–340
McGowan CP, Smith DR, Nichols JD, Lyons JE, Sweka J, Kalasz K, Niles LJ, Wong R, Brust J, Davis M, Spear B (2015) Implementation of a framework for multi-species, multi-objective adaptive management in Delaware Bay. Biological Conservation 191: 759–769
Nordstrom KF, Jackson NL, Smith DR, Weber RG (2006) Transport of horseshoe crab eggs by waves and swash on estuarine beach: implications for foraging shorebirds. Estuarine Coastal and Shelf Science 70:438-448
Seney EE (2007) Musick JA (2007) Historical diet analysis of loggerhead sea turtles (Caretta caretta) in Virginia. Copeia 2:478–489
Shuster CN Jr, Botton ML, 1985. A contribution to the population biology of horseshoe crabs Limulus polyphemus (L.) in Delaware Bay. Estuaries 8: 363-372.
Shuster CN Jr, Sekiguchi K (2003) Growing up takes about ten years and eighteen stages. In: Shuster CN Jr, Barlow RB, Brockmann HJ (eds) The American horseshoe crab. Harvard University Press, Cambridge, pp 103–132

Smith, D. R., Brockmann, H. J., Beekey, M., King, T. L., Millard, M. J., and Zaldívar Rae, J. (2016). Conservation status of the American horseshoe crab (Limulus polyphemus): a regional assessment. Reviews in Fish Biology and Fisheries 27, 135–175. doi: 10.1007/s11160-016-9461-y
Smith DR, Brousseau LJ, Mandt MT, Millard MJ (2010) Age and sex specific migration timing and frequency of horseshoe crab spawning in Delaware Bay: insights from a largescale radio telemetry array. Current Zoology 56:563–574
Smith JAM, Dey A, Williams K, Diehl T, Feigin S, Niles LJ (2022) Horseshoe crab egg availability for shorebirds in Delaware Bay: dramatic reduction after unregulated horseshoe crab harvest and limited recovery after 20 years of management. Aquatic Conservation: Marine and Freshwater Ecosystems (doi.org/10.1002/aqc.3887)
Sweka JA, Smith DR, Millard MJ (2007) An age-structured population model for horseshoe crabs in the Delaware Bay area to assess harvest and egg availability for shorebirds. Estuaries Coasts 30:277–286
Tucker AM, McGowan CP, Lyons JE, DeRose‐Wilson A, Clark NA (2022) Species‐specific demographic and behavioral responses to food availability during migratory stopover. Population Ecology 64(1): 19-34
Vasquez MC, Murillo A, Brockmann HJ, Julian D (2015) Multiple-stressor interactions influence embryo development rate in the American horseshoe crab, Limulus polyphemus. J Exp Biol 218:2355–2364
Walls EA, Berkson J, Smith SA (2002) The horseshoe crab, Limulus polyphemus: 200 million years of existence, 100 years of study. Reviews in Fisheries Science 10(1): 39-73
Weber RG, Carter DB (2009) Distribution and development of Limulus egg clusters on intertidal beaches in Delaware Bay. In: Tanacredi JT, Botton ML, Smith DR (eds) Biology and conservation of horseshoe crabs. Springer, New York, pp 249–266

Oysters are a dominant structural and functional member of the Delaware Bay benthos. The species native to Delaware Bay is Crassostrea virginica (Gmelin, 1791), commonly called the eastern or American oyster. Eastern oysters are reef builders that provide hard substrate and create structural complexity in an environment otherwise dominated by sand and mud. This species occurs from Nova Scotia to Florida, throughout much of the Gulf of Mexico and south to Brazil. In some areas like South Carolina and Georgia, it can form extensive intertidal reefs but in Delaware Bay it is predominantly subtidal where it is protected from freezing and ice scour. In addition to providing habitat for many other species, oysters filter large quantities of water that enhance nutrient cycling within the system. Oysters have been harvested from Delaware Bay since pre-colonial times, and current harvests are carefully managed to support a sustainable fishery. Oysters have also been cultivated in Delaware Bay for more than a century in both intertidal and subtidal habitats of the lower Delaware Bay.
Oysters occur throughout Delaware Bay from Artificial Island to the mouth of the bay and extend up into tributaries until salinity falls below tolerable average levels of about 5 ppt. Some oysters live intertidally, often on or within ribbed mussels along creek banks or attached to other hard substrates, natural or otherwise, within the lower intertidal zone. Nevertheless, the vast majority of the oyster population exists subtidally on reefs or beds that occur in the upper portion of the Bay above Egg Island Point on the New Jersey side and Port Mahon on the Delaware side upbay to Artificial Island. About 90% of the oysters in this region occur on the New Jersey side of the Bay.
Oysters may begin spawning in Delaware Bay as early as May or as late as September, but most spawns take place in July and August. Females can release all their eggs at once or partially spawn multiple times, but an average mature female may produce 2 to 60 million eggs during a single spawn. Typical spawns in a hatchery yield 1 to 15 million eggs. The fertilized eggs produce free swimming larvae within 24 hours that remain in the water column for two to three weeks before attaching to whatever hard substrate they can find, preferably clean oyster shell. During this process known as “setting” or “settlement”, the settling larvae glues its left valve to the hard substrate then undergoes a metamorphosis, losing its ability to swim and taking on the morphology of a juvenile. Subsequent growth rate depends on the temperature, salinity and food availability of the site where the oyster attaches and varies both seasonally and annually. By fall the Young-of-Year (YOY) oysters can range in size from a few millimeters to 40 or 50 mm with an average of around 25 mm. Little or no growth takes place during the winter, and young oysters are heavily preyed upon by oyster drills, flatworms, small crabs and other predators. By the next fall most surviving oysters reach 30 to 65 mm depending on the location within the salinity gradient. Lower salinity areas have slower growth, but there are fewer predators so survival is better. Average growth to market size (3 inches = 76 mm) typically takes from 3 to 6 years in Delaware Bay, again depending on the location along the salinity gradient.
The oyster and the oyster reef assemblage are important to the general ecology of the bay. The assemblage of organisms that develop on an oyster reef was recognized in the late 1800s as a community and described as a biocoenose by Möbius. This concept was the forerunner of what we now know as community ecology. In addition to the structure that oysters provide, they are also a major functional part of the ecosystem because oysters filter water for food. This filtration process removes particulate material from the water column and deposits it on the sediment surface where some of it becomes food for other organisms or is broken down by bacteria. This filtration and deposition is an important pathway for nutrient cycling in estuaries. In some estuaries, oyster filtration can clarify water enough to increase light penetration and facilitate growth of sea grasses but Delaware Bay is so turbid that this facilitation does not occur.

Two oyster diseases are present in Delaware Bay. MSX is caused by Haplosporidium nelsoni, and dermo or Perkinsosis is caused by Perkinsus marinus. Both pathogens are protozoans and neither affects humans, but they are eventually lethal to oysters. There is clear evidence that the native oyster population has developed a relatively high level of resistance to MSX (Ford and Bushek 2012), but resistance to dermo has not developed to any major extent (Bushek et al. 2012). Since 1989 dermo has been a major factor controlling oyster population levels on the higher salinity oyster beds in Delaware Bay from Ship John Light south.
Given the role oysters play as a keystone species, the size and condition of the oyster population is an excellent indicator of overall ecosystem health in the Delaware estuary. Luckily, the commercially harvestable oyster beds of the New Jersey portion of Delaware Bay have been surveyed in the fall and winter since 1953 (Fegley et al. 2003). In the earlier years, the survey took place from September through the winter, but since 1989 the survey time frame has been reduced to about four, non-consecutive days between October and November. To create a survey domain, each of the beds or reefs were divided into 0.2-min latitude x 0.2-minute longitude grids (~25 acres or 10,171 m2) and the grids were assigned to one of three strata, high, medium, and low quality (Fig 7.1.3.1). Strata were delineated by relative density. For each surveyed bed, high quality strata represent high density areas containing ~50% of the population, medium density areas contain ~48% of the population, and low density areas contain just 2% of the population. A random selection of these grids on the high and medium quality strata are sampled each year using a commercial oyster dredge. The number of grids sampled in each strata is determined by optimally allocating survey effort to minimize overall survey error. Low quality grids are not sampled and the abundance of oysters on those grids, about 2% of the population, are never used in setting the quota for annual harvest. This annual survey is also supplemented by regular monitoring of disease, mortality and harvesting at weekly to monthly intervals, providing a comprehensive picture of the status of the population and the fishery it supports. Each year the Haskin Shellfish Research Laboratory (HSRL) convenes a Stock Assessment Workshop (SAW) where population status and trends are presented. At the SAW, a Stock Assessment Review Committee (SARC) is asked to make recommendations for sustainable levels of harvest and for ways to improve assessment or management of the population. Details presented at these workshops are published in annual stock assessment reports available at http://hsrl.rutgers.edu/SAWreports/index.htm
There were substantial oyster harvests from Delaware Bay in the middle 1800’s, and by the latter part of that century extensive importation of seed onto leased bottom in the lower Delaware Bay enhanced the numbers of market oysters over what the Bay alone could produce. Active survey of the seed bed resource did not take place until 1953, and annual records are available since that date (Fig 7.1.3.2). The survey was initiated during a period of low abundance and just a few years before the oyster disease MSX substantially reduced the total numbers of oysters in the bay. The following decade was a period of low abundance, but it was followed, from the late 1960’s until the mid 1980’s, by a period of high abundance. This was terminated by another MSX epizootic in 1985, and the emergence of dermo in 1989 which has dominated the population dynamics across the oyster beds ever since. In the late 1950’s the natural oyster bed oyster population averaged about 2.8 billion adult individuals. In the peak years of the 1970’s to the mid 1980’s the average oyster population was tenfold higher at 17 billion individuals during a period when disease pressure was virtually non-existent.

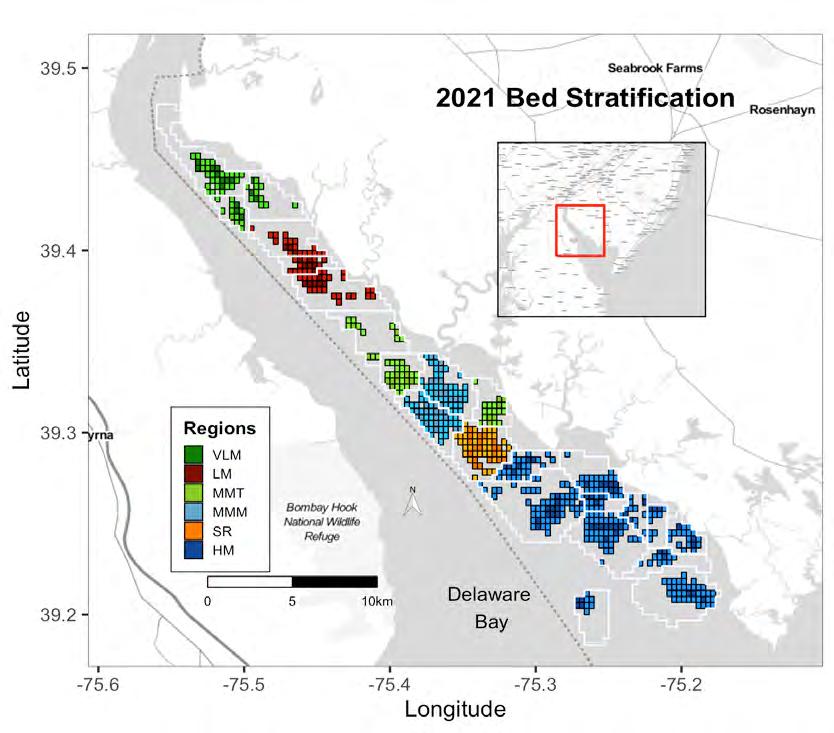
Figure 7.1.3.1 The assessed oyster beds of Delaware Bay, NJ colored by region (see Legend) with the 2021 strata designations. White outlines indicate the complete boundary of each bed with the high and medium quality strata grids in dark and light colors, respectively; black outlines indicate beds that were resurveyed in 2021. Strata designations are calculated within-bed not within-region. Gray areas in each bed indicate low quality strata. Annual assessments include samples from each bed’s high and medium quality strata only. Each grid is 0.2” latitude x 0.2” longitude, approximately 25 acres (10.1 hectares).
In 2006, the SARC established target and threshold abundance reference points based on the 19902005 time series. It was concluded that this time period represented the scope of oyster population dynamics in the present climate and disease regime in the Delaware Estuary. A target was calculated as the median of total and market-size (>63.5mm) oyster abundance and a threshold was calculated as ½ the target. These values have since provided a reference level against which the current population size could be compared. In addition, the 2006 SARC developed fishing exploitation reference points that constrained the annual harvest to be within a range of fixed exploitation. Since these two management tools were put into place, the exploitation rates of all oysters and market-size oysters have rarely gone above 2% and 4% respectively (Fig 7.1.3.3), the abundance of market-size oyster has never been below the target (Fig 7.1.3.4B), and the quota has typically fallen between ~80,000 and ~120,000 bushels (Fig 7.1.3.5). In effect, these management measures stabilized both the population and the fishery.

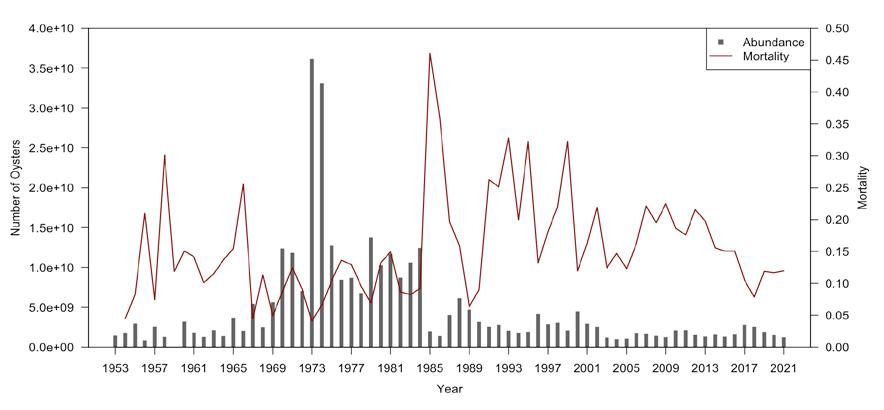
Figure 7.1.3.2 Time series of total oyster abundance (left axis) and natural mortality rate.
In 2021, a total of 238 grids scattered across the high and medium quality strata of all twenty-six beds were sampled to estimate the status of the stock. Figure 7.1.3.4 details the recent (1990-present) times series for several key population metrics. A large recruitment event in 2016 and 2017 (Fig 7.1.3.4C) led to a temporary spike in sub-market abundance (Fig 7.1.3.4B) and total abundance (Fig 7.1.3.4A). The total abundance has since returned to being between 1 and 2 billion individuals the last few years where it has typically fallen during the last ~20 years. Despite large fluctuations in sub-market and total abundance, market-size abundance has remained relatively stable and is again well above the target in 2021 (Fig 7.1.3.4B). In addition, natural mortality continues to be low in recent years relative to the last several decades (Fig 7.1.3.4D).
Since the intensity of oyster disease and recruitment cannot be predicted, management decisions can only influence how heavily the population is exploited and how much habitat is added to promote recruitment. There is no evidence that harvest has had substantial effects on the population dynamics of oysters in Delaware Bay since at least the late 1960’s. Therefore, there is no good reason to reduce exploitation any further. While current recruitment levels indicate the stock is not recruitment limited, substrate, or available habitat, may be limited. This suggests that until the amount of habitat increases, likely via persistent, large-scale shell planting, the population will remain stable at the current level. Shell planting is the addition of clean, recycled shell to the bay bottom to provide attachment surfaces for oysters. Presently, the oyster industry taxes itself at a rate that ensures it replaces what shell it harvests. Profit margins are such that increased taxes for shell planting are not likely to be a viable mechanism for increasing shell planting efforts. Ideally, shell planting would be on the order of half a million to a million bushels of shell each year. Current efforts are between 100,000 and 200,000 bushels. If external funding sources could be secured to plant additional shell and increase available habitat for spat to settle and grow on, perhaps the population could grow beyond what the current environment and habitat appear to support.
As long as oyster population dynamics in higher salinity areas are controlled by dermo and MSX, changes in the oyster population will be linked to salinity. The funnel shaped geomorphology of Delaware Bay makes the area available for development of oyster reefs decrease from the mouth of the bay toward the fall line. This unique geomorphology in combination with ongoing sea-level rise suggests that the area

available for prime oyster habitat will decline in the future. Other factors such as channel deepening, extraction of groundwater, and consumptive use of Delaware River freshwater supplies all imply that salinity will rise even if climate change causes increased rainfall. In 2011, however, excessive rainfall from Tropical Storms Lee and Irene depressed salinity throughout the bay for several weeks causing up to 75% mortality on the uppermost beds (Munroe et al. 2013). Those beds recovered rapidly with higher than anticipated recruitment. However, in 2018 and 2019 extended periods of heavy rainfall led to depressed salinity values again and mortality was observed near 50%. The likelihood of continued freshets in the upper bay region with similar impacts is expected to increase with climate change.
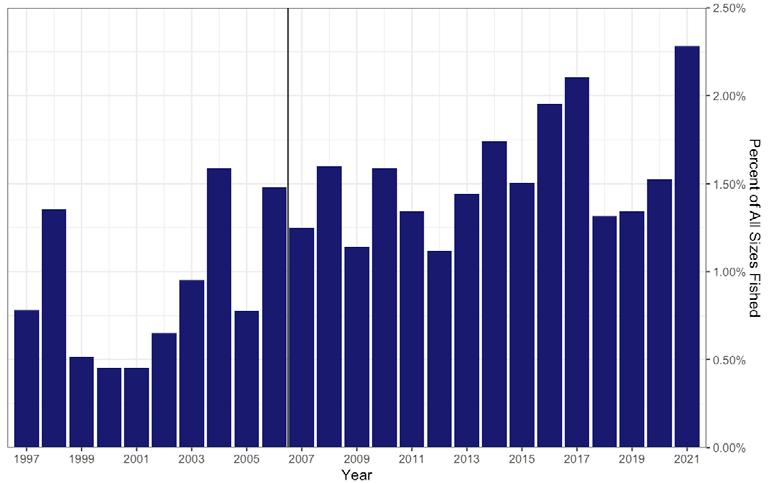
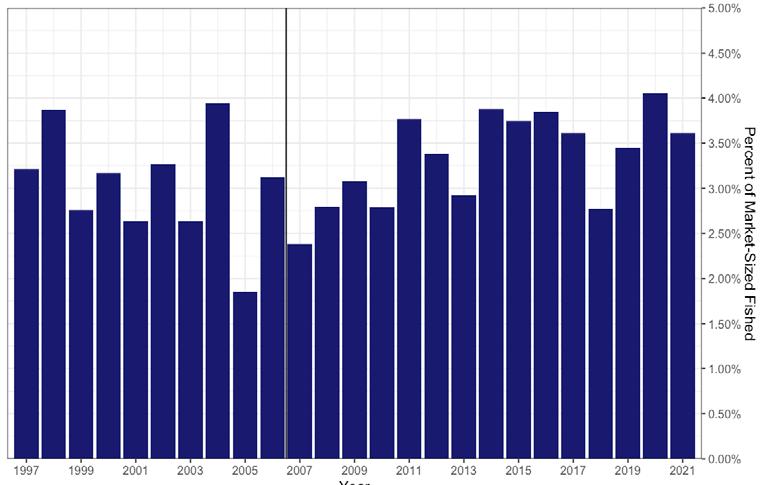


Figure 7.1.3.4 Long-term time series summary for the population. Top panels (A, B): total abundance (≥ 20 mm) and size class abundances (≥ 20 mm). Bottom panels (C, D): mortality rate and spat abundance (< 20 mm). Dashed horizontal lines represent the threshold and solid horizontal lines represent the target for abundance in panel A and for market abundance in B.
Maintaining the annual oyster population and oyster disease surveys is essential to sustainable management of this resource. In addition to continuing these survey efforts that support the annual stock assessment, actions could be taken to manage the population more actively. First, some attention should be devoted to evaluating the dynamics of the Hope Creek, Fishing Creek, and Liston Range beds to create a management plan for that region of Delaware Bay that accounts for the unique environmental conditions and population demographics in that region of Delaware Bay. Second, plans should be developed to manage the likely continued rise in salinity in Delaware Bay given its importance to the long-term viability of key oyster beds. For instance, exploration of the application of a salinity mitigation bank might be warranted. Third, development of a bay-wide environmental monitoring system for temperature and salinity should be implemented. Such a system would assist with interpreting changes in population demographics as the environment changes. Last, and likely most importantly, plans should be developed for enhancing habitat and recruitment through shell planting beyond the current efforts that are funded by the industry bushel tax.

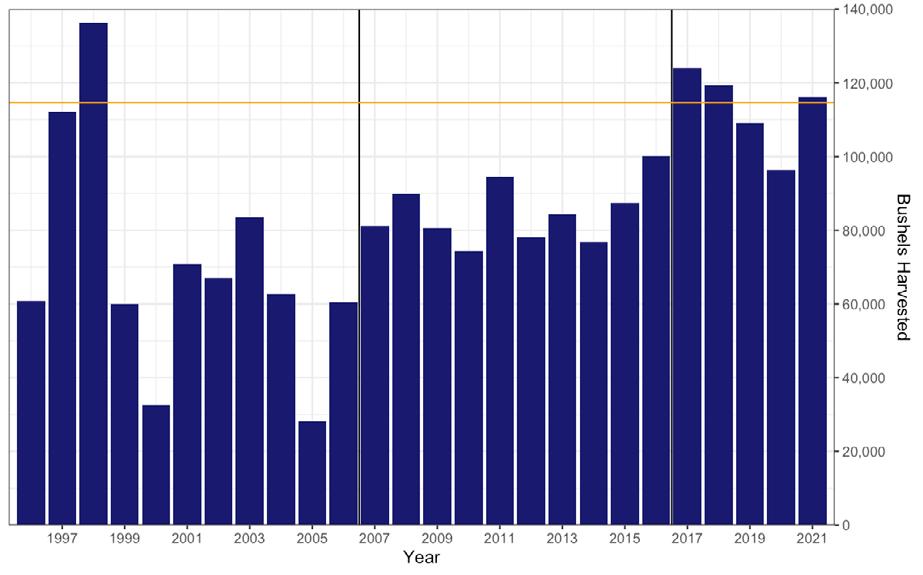
Figure 7.1.3.5 Number of bushels harvested from the natural oyster beds of Delaware Bay since the inception of the direct-market program in 1996. The 25-year average harvest is 84,130 bushels. The vertical line shows when reference points were instituted in 2007. The achieved quota for 2021 was 116,194 bushels after transplant (orange line).
Oyster aquaculture continues to expand in the Delaware Bay with new developments in breeding for disease resistance and growth as well as technological advances in cultivation systems (see Living Resources Feature 1 - Oyster Aquaculture in the Delaware Bay). Policies and regulations are being developed to guide this growth in a sustainable manner. Little growth in aquaculture is presently occurring in the intertidal areas of the southern portion of the Bay due to concerns about possible conflicts with the federally listed threatened species, Calidris canutus rufa, commonly known as red knots. An adaptive management system has been employed to help minimize potential negative impacts of oyster farming on the species. Meanwhile, advances in gear technology have led to the growth of oyster aquaculture in deeper waters in the mainstem of the Bay away from intertidal areas.
The oyster is a keystone species that helps sustain a diverse community assemblage through habitat provisioning, contributes to key geochemical processes like nutrient cycling in the estuary, and provides socioeconomic benefits to the communities that surround the Delaware estuary by providing food and supporting jobs and fishing infrastructure. The dynamics of the oyster population in Delaware Bay are controlled by a balance between recruitment and growth, and disease and fishing related mortality. Recruitment, growth, and disease respond to environmental changes such as the annual temperature cycling and salinity (freshwater input) and thus cannot be predicted or controlled. However, fishing mortality, and to some extent recruitment, can be controlled by limiting exploitation rate and planting clean shell to promote recruitment respectively. Fishing exploitation has been fixed at a low, sustainable

level for some time and this has led to a stable population of adult oysters. If the population is to grow, the capacity to support additional oysters will likely need to come from larger scale shell planting efforts from funding sources outside of the fishing industry.
References
Bushek, D., S.E. Ford and I. Burt. 2012. Long-term patterns of an estuarine pathogen along a salinity gradient. J. Marine Research, 70(2-3):225-251.
Fegley, S.R., S.E. Ford, J.N. Kraeuter and H.H. Haskin. 2003. The persistence of New Jersey oyster seedbeds in the presence of MSX disease and harvest: The role of management. Journal of Shellfish Research, 22:451-464
Ford, S.E. and D. Bushek. 2012. Development of resistance to an introduced marine pathogen by a native host. J. Marine Research, 70(2-3):205-223.
Morson, J. M., D. Bushek, and J. Gius. 2022. Stock Assessment Workshop – New Jersey Delaware Bay Oyster Beds (24th SAW) Final Report. Haskin Shellfish Research Lab., Port Norris, NJ. 87pp.
Munroe, D., A. Tabatabai, I. Burt, D. Bushek, E.N. Powell, and J. Wilkin. 2013. Oyster Mortality and Disease in Delaware Bay: Impact and Recovery Following Hurricane Irene and Tropical Storm Lee. Estuarine, Coastal and Shelf Science, 135:209-219.

Lisa M. Calvo, Daphne Munroe, PhD, Jenny P. Shinn Haskin Shellfish Research Laboratory, Rutgers University
Shellfish aquaculture has become an important and growing sector in New Jersey’s coastal economy. Extensive oyster farming in Delaware Bay has historical significance. Traditional oyster farming in the Delaware involved both moving submarket oysters from oyster bars to down bay shellfish leases where more favorable oyster growth occurred and “planting” shell on leased bottom to capture recruitment of wild oysters. At the Delaware Bay oyster fishery’s peak thousands of acres of shellfish leases were managed in this way, essentially operating as non-structural oyster farms. Oystermen worked their leases independently. With the emergence of MSX disease in the late 1950s, the lease planting strategies were nearly abandoned as the practice was no longer profitable in an environment with significant loss to disease. Today, traditional bottom planting still occurs, albeit at an effort lower than historical levels.
Contemporary structural oyster aquaculture began in the southern portion of the Delaware Bay shoreline on the Cape May Peninsula in the 1990s following advances in genetic breeding that yielded disease resistant oyster stocks that could survive in the presence of the endemic oyster disease, MSX, that decimated wild oyster populations. This shoreline is distinct in that it features narrow beaches, small creeks, and extensive intertidal sand flats that are exposed at low tide. The intertidal flats extend 1000-1700 feet offshore and are characterized by a series of sand bars (ridges) and sloughs (runnels) that run parallel to the beach. Such conditions are ideal for rack and bag cultivation systems in which oysters are grown in stiff mesh bags that are secured to rebar racks that maintain the oysters about 10-15 inches off bottom ( Fig 1 ). The farms are accessed by land and tended during low tide when the oysters are exposed for a period typically 2-6 hours long.
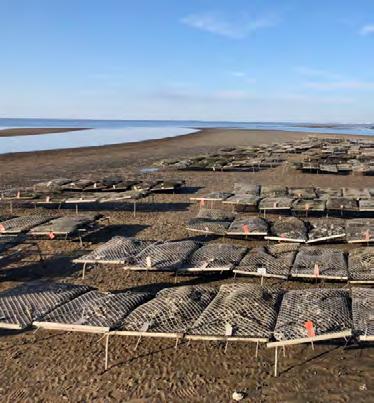
A variety of oyster seed is available from hatcheries located along the east coast. Farmers typically plant seed from 2 to 15 mm in size. Production from hatchery to market on average takes 1.5 to 2 years ( Fig 2 ) and requires extensive husbandry involving washing to remove biofouling, adjusting the volume of oysters in cages to optimize growth, sorting, grading and culling oysters. Market size and harvest season is determined by the farmer and is independent of wild harvest restrictions. Some farms harvest year-round. Growers typically use high volume trash pumps to remove biofouling organisms from the oysters using water pressure. A major oyster farm pest is the spionid mud worm Polydora cornuta , which aggregates as thick colonies surrounded in mud that can smother oysters if not removed. Labor costs associated with biofouling removal is significant. A second mud worm Polydora websteri causes unsightly internal shell blisters that negatively affect oyster health and market value. Oyster farming is a year-round endeavor; however, most activity occurs from March through December. Winter loss can be significant and some farmers

protect stocks by moving them to overwintering areas with deeper water or cold storage.
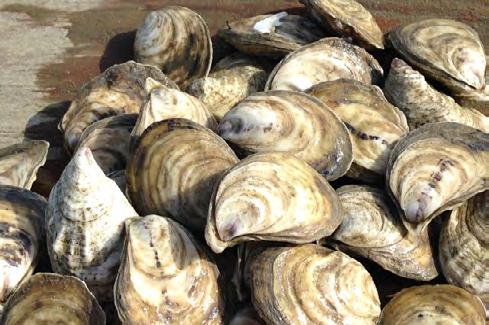
Oyster farms may be permitted in the Bay via three mechanisms: Riparian Grants, Shellfish Leases or Aquaculture Development Zone (ADZ) Leases. Riparian Grants are rare, and convey rights to private individuals holding the riparian as owners of the bay bottom. Oyster farming on riparian grants requires additional approval to grow shellfish and requires permits from New Jersey Division of Land Use Regulation (DLUR), New Jersey Bureau of Water Monitoring (BMWM), New Jersey Department of Agriculture (NJDA) and the U.S. Army Corps of Engineers (Corps). More often, tidally flooded lands are held in the public trust. In the 1850s, a system was developed for the private lease of bay bottom for the purpose of planting and growing oysters. Oyster farmers can obtain annually renewable shellfish leases from the Delaware Bay Shellfish Council. Oyster farmers operating on these private shellfish leases require authorizations from DLUR, the New Jersey Tidelands Resource Council (TRC), BMWM, NJDA, and the Corps.
Lastly, ADZ leases were established in 2011 to cluster structural aquaculture to facilitate management, streamline permitting, and minimize user conflicts. ADZ leases are pre-permitted. ADZs have been established in three areas in Middle Township in Cape May County, New Jersey. Two areas are approximately 5 miles offshore (ADZ-2 and ADZ-3) and one area (ADZ-4) is located in the nearshore intertidal about 1 mile south of Pierces Point. Twenty-four 1.5 acre parcels were established at ADZ4 and a combined 1100 acres are available as 10 acre parcels at ADZ-2 and ADZ-3. Growers leasing ADZs still require permits from BMWM and NJDA.
NJ statewide production in 2016 was two million oysters with a farm gate value of $1.37 million. Wholesale pricing averaged $0.62 per piece and direct sale price averaged $0.91 (Calvo 2018). In 2021, there were eleven active oyster farms enterprises in Delaware Bay and NJ statewide oyster aquaculture production was reported to be 3.8 million oysters (pers. communication Craig Tomlin, NJDEP). That production number, however, is likely a stark underestimate of actual production due to reporting limitations. Farm raised oysters are valued for their high quality and are mainly sold to raw bars and restaurants for the half-shell market. However, as a consequence of the COVID-19 pandemic, oyster farms established or expanded direct-to consumer markets. There is currently no oyster aquaculture occurring in the Delaware State portion of the Delaware Bay.
In addition to their economic value, Delaware Bay oyster farms provide many ecological benefits akin to wild oyster populations. An increasing body of literature demonstrates the ecological services provided by the oysters on oyster farms including water filtration, nutrient cycling and sequestration, and habitat provisioning (Alleway et al. 2019, Coen et al 2007). Both regulators and coastal communities are interested in environmental benefits that may be provided by shellfish farms. It is well established that aquaculture gear alters habitat (e.g. increases structural complexity) and diversifies the benthic community of the habitat in which the gear is placed (e.g. O’Beirn et al. 2004, DeAlteris et al. 2004). Marenghi et al. (2010) observed that 2 types of oyster aquaculture gear (rack and bag, and floating cages) supported similar assemblages of finfish and invertebrates as restored oyster reefs in the Delaware Inland Bays. Most recently, the use of underwater cameras has been employed to quantify habitat provisioning by oyster farms in coastal Connecticut (Mercaldo-Allen et al. 2021), Washington
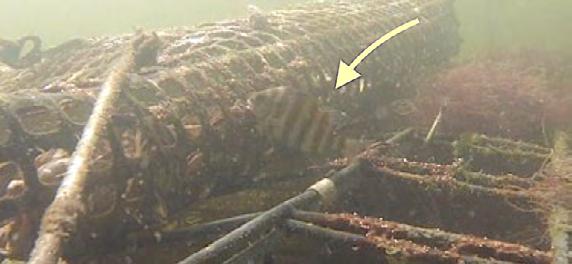
(Muething et al. 2020 and Ferriss et al. 2021) and New Jersey (Shinn et al. 2021). In New Jersey, videos were collected from both an off-bottom oyster farm using two different gear types (cages and floating bags) (Fig 3) and a marsh edge in Barnegat Bay. The overall community associated with the cage habitat differed from the other two habitats and furthermore, provides evidence of habitat provisioning for both finfish and invertebrates by intertidal oyster farms that could operate similarly to a naturally structured habitat (Shinn et al. 2021).

A recent study examined the water quality benefits oysters in the Delaware Estuary provide by conducting field experiments at an oyster farm in Rehoboth Bay and Delaware Bay to quantify farmspecific year-round oyster filtration services (Barr, 2022). Field experiments were conducted seasonally in 2020 and 2021 using a flow-through filtration chamber with ambient water from the farm sites to calculate the biomass of particles oysters removed from the water column. The results broadly showed oyster filtration physiology differed between locations and through the year. Moreover, oysters at one intertidal farm in Delaware Bay were estimated to remove 43.8 tons of particulate matter from the water column acre -1 year-1
The expansion of oyster farming in the lower Bay is limited by potential conflict with important migratory shore birds which aggregate in the area in Spring. Aquaculture operations occur within portions of the same tidal flats used by the migratory shorebirds, including the threatened rufa subspecies of the red knot ( Calidris canutus rufa ), ruddy turnstone ( Arenaria interpres ), sanderling ( C. alba ), and semipalmated sandpiper ( C. pusilla ). These intertidal oyster farms also occupy a small portion of available horseshoe crab ( Limulus polyphemus ) spawning beaches. The co-location in both time and space of horseshoe crabs and migratory shorebirds and the oyster farm activities presents a unique socio-economic-ecological interaction that has been studied recently. Maslo et al. (2020) assessed the impact of oyster aquaculture as practiced in the lower Delaware Bay on the distribution and foraging behavior of shorebirds. While red knot numbers were slightly reduced during oyster tending activities, red knot abundance was predominantly determined by the presence of other foraging shorebirds (Maslo et al. 2020). This pattern was consistent for all focal species, strongly suggesting that factors other than oyster aquaculture are the primary drivers of shorebird distribution during the stopover period (Gillings et al. 2007). Separately, Munroe et al. (2020) characterized the interactions between oyster farms and mature horseshoe crabs accessing spawning habitat. Observations of horseshoe crabs showed conclusively that neither crab access to spawning habitat, nor their use of mudflats is altered by the presence of rack-and-bag oyster aquaculture gear (Munroe et al., 2020).
Since the ESA listing of the red knot as threatened in 2015, industry growth has been directed away from this nearshore area of conflict and led to the development of enhanced technology for cage culture of oysters in subtidal upper Bay areas. Oyster aquaculture in this region requires very robust bottom cages and large vessels capable of handling such cages (Fig 4). Significant investment has been made by two farms to expand bottom culture capacity supporting a significant proportion of NJ’s oyster aquaculture production.
In accordance with Endangered Species Act (ESA), the USFWS has developed a Programmatic
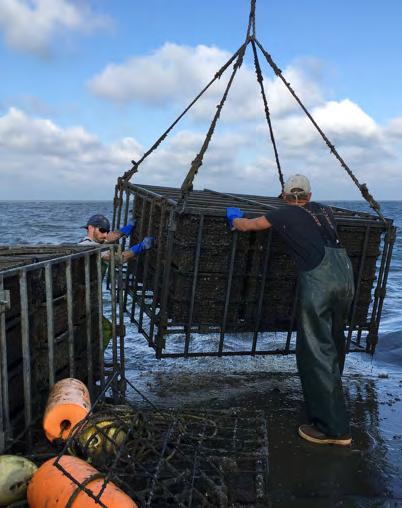
Figure 4. Large cage used in subtidal oyster aquaculture in the Delaware Bay. Photo credit: Jenny Shinn

Biological Opinion (PBO) for structural aquaculture operations in portions of the Delaware Bay in Cape May County, New Jersey for the Corps (USFWS 2016). The PBO considers the potential impacts on the threatened red knot by the Corps’ issuance of aquaculture permits in the action area. It includes an Incidental Take Statement for existing oyster farms and establishes certain actions that the aquaculture farmers must take, known as Conservation Measures (CMs), to reduce the potential harm of oyster farming on the red knot population. “The aim of the Biological Opinion is “to benefit or promote the recovery of” the red knot. The CMs include restrictions on gear placement, farm work hours, and access to farms. The changes associated with the PBO have resulted in the closure of two farm sites and limits future expansion of aquaculture in certain areas.” The Biological Opinion applies for a 10year period (2016-2026) and establishes a mechanism for adaptive management.
It is important to understand the ecological role that oyster farms play in various nearshore coastal habitats near the Delaware Estuary and around the world and to appreciate the role that changes in ecosystem indicators may make to the vitality of the industry.
Alleway, H. K., Gillies, C. L., Bishop, M. J., Gentry, R. R., Theuerkauf, S. J., and Jones, R. (2019). The ecosystem services of marine aquaculture: valuing benefits to people and nature. Bioscience 69, 59–68. doi: 10.1093/biosci/biy137
Barr, Janine. 2022. Wild and farm Eastern oyster (Crassostrea virginica) contributions to improved water quality in the mid-Atlantic: contemporary and future climate estimates. MS Dissertation. Department of Marine and Coastal Sciences, School of Environmental and Biological Sciences, Rutgers, the State University of New Jersey. New Brunswick, New Jersey. 134 pages. In Preparation.
Calvo L. 2018. New Jersey Shellfish Aquaculture Situation and Outlook Report 2016 Production Year. New Jersey Sea Grant NJSG-18-
Coen, L. D., Brumbaugh, R. D., Bushek, D., Grizzle, R., Luckenbach, M. W., Posey, M. H., et al. (2007). Ecosystem services related to oyster restoration. Mar. Ecol. Prog. Ser. 341, 303–307. doi: 10.3354/meps341303
DeAlteris J, Kilpatrick BD, Rheault RB (2004) A comparative evaluation of the habitat value of shellfish aquaculture gear, submerged aquatic vegetation and a non-vegetated seabed. J Shell Res 23(3):867-874
Ferriss B, Veggerby K, Bogeberg M, Conway-Cranos L and others (2021) Characterizing the habitat function of bivalve aquaculture using underwater video. Aquacult Environ Interact 13:439-454. https://doi.org/10.3354/aei00418

Gillings, S., Atkinson, P. W., Bardsley, S. L., Clark, N. A., Love, S. E., Robinson, R. A., ... & Weber, R. G. 2007. Shorebird predation of horseshoe crab eggs in Delaware Bay: species contrasts and availability constraints. Journal of Animal Ecology, 76(3), 503-514.
Marenghi F, Ozbay G, Erbland PJ, Rossi-Snook K (2010). A comparison of the habitat value of sub-tidal and floating oyster (Crassostrea virginica) aquaculture gear with a created reef in Delaware’s Inland Bays, USA. Aquacul Int 18(1):69-81
Maslo, B., Burkhalter, J. C., Bushek, D., Yuhas, T., Schumm, B., Burger, J., & Lockwood, J. L. (2020). Assessing conservation conflict: Does intertidal oyster aquaculture inhibit foraging behavior of migratory shorebirds?. Ecosphere, 11(5), e03097.
Mercaldo-Allen R, Clark P, Liu Y, Phillips G and others (2021) Exploring video and eDNA metabarcoding methods to assess oyster aquaculture cages as fish habitat. Aquacult Environ Interact 13:277294. https://doi.org/10.3354/aei00408
Muething KA, Tomas F, Waldbusser W, and Dumbauld BR (2020) On the edge: assessing fish habitat use across the boundary between Pacific oyster aquaculture and eelgrass in Willapa Bay, Washington, USA. Aquacult Env Interac 12: 541-557
Munroe, D. M., Grothues, T. M., Cleary, N. E., Daw, J., & Estrada, S. (2020). Oyster aquaculture does not impede spawning beach access for Atlantic horseshoe crabs Limulus polyphemus. Aquaculture Environment Interactions, 12, 81-90.
O’Beirn FX, Ross PG, Luckenbach MW (2004) Organisms associated with oysters cultured in floating systems in Virginia, USA. J Shell Res 23(3):825-829
Shinn, J.P., D.M. Munroe, J.R. Rose, 2021. A Fish’s-Eye-View: Accessible Tools to Document Shellfish Farms as Marine Habitat In New Jersey. Aquacult Env Interact 13: 295-300 DOI: https://doi. org/10.3354/aei00407
USFWS. Biological Opinion on the Effects of Existing and Expanded Structural aquaculture of Native Bivalves in Delaware Bay, Middle Lower Township Cape May County, New Jersey on the Federally Listed Red Knot (Calidris canutus rufa). 2016 175 p.
Cristina Sandolo, PSM, Ocean Food Systems

Introduction
While many Black watermen were critical to our region’s oyster industry historically, the aquaculture industry lacks racial diversity, particularly at the business ownership level. Recent work by Sandolo (2021) analyzed barriers to entry and the history of Black oystermen in the region, and Food Justice, to determine if Food Justice themes could be adopted to promote socioeconomic diversity among business owners. 13 Oyster Producers and 12 Industry Experts from MD, DE, and NJ and 3 Food Justice Experts were interviewed about industry history, management and statistics, and food justice. Over 85 peer-reviewed and non-peer-reviewed resources were also analyzed. Results indicate that exploitation of Black watermen and historic barriers to wealth accumulation have disproportionately fueled barriers to entry today. The research identified 8 major barriers to entry in aquaculture and 5 core Food Justice themes that were then developed into a framework of recommendations (Sandolo, 2021). The framework presents an opportunity for industry managers to facilitate engagement among a more diverse population of both entrepreneurs and consumers, promoting economic development, nutrition security, and environmental restoration in the Delaware Estuary and beyond.
Historically, communities of color have been exploited in the food system and disproportionately excluded from key positions and from land and business ownership (Horst et al, 2017). Black farmers have experienced racial discrimination from lenders and subsidy programs. Farmland loss in the 1900s impacted Black farmers 3 to 4 times more than white farmers (Alkon, 2007). Efforts to build community determination of the food system date back at least the Black Panther Party’s 1960’s community food programs, such as free breakfast programs led by and serving the Black community, transforming roles from consumer to decision-maker and doer (Alkon, 2007). In 1996, the Community Food Security Coalition convened to create a vision for Food Justice (Bradely & Herrera, 2016) and the movement has grown dramatically since then, as a response to racial inequities and a corporate-controlled food system (Clendenning et al., 2016). The Food Justice movement seeks to create equity in all aspects of the food system, from seed to table, including land and business ownership, labor rights, and consumer access, through systemic and structural change (Horst et al, 2017). Sandolo (2021) defined Food Justice as the right of all people to grow, process, sell, distribute and consume their food of choice, and to have the means to do so, such as land ownership, business ownership and access to water and other resources and identified 5 core themes:
• Creating systemic change throughout the food system
• Having an Antiracist and Anti-exploitation Approach
• Focusing on Community Determination of a Just Food System: Acknowledge, Invest in Talent and Leadership of Communities of Color

• Ensuring The Right to the Food System: The Right to Business Ownership and Livable Wages; the Right to Land and Resources; The Right to Food
• Valuing People, Culture, Community, and Environment

As with land farming, seafood resources were stolen from indigenous communities, privatized, and exploited through slavery. Opportunities for advancement, business development, and resource ownership in the 1800s’ oyster boom were mostly limited to white watermen. Oystering did provide a unique sense of freedom and some monetary benefits for Black oystermen. And, some Black watermen did own and captain ships. Captain James McBride (Fig 1) is described as New Jersey’s only Black oyster fleet owner; his wife, Lucy M. McBride took on the enterprise after he tragically died while at sea (Delaware Bay Watermen’s Memorial, 2013). Sam Turner joined the Civilian Conservation Corps and sent money to his father so they could buy land in 1939. They opened a shucking business, employing 40 shuckers (Anderson, 1998). These stories should be memorialized and amplified, celebrating the integral role of Black watermen in the region. Still, most Black watermen remained in lower-level positions through the mid 20th Century, even with a deep knowledge of the marine environment and skills in navigation and oyster harvesting and processing (Chiarappa, 2018) (Fig 2).
Laws and codes prevented most Black watermen from owning or operating boats and travel required permission from a white person (Clarke, 2021). William Wallace remembers two failed attempts by his dad, a Black oysterman in Chesapeake Bay, to secure a loan for a boat purchase. Fearing a loss of labor, the owner of the boat his dad labored on discouraged the banker from giving the loan (Anderson, 1998). Robert Morgan, an oysterman from Delaware, described: “...there was a lot of Black mates who were just as qualified as any white man but just couldn’t make it. If they were somebody’s son they’d have been captain. . . you know how things work. We’re below the MasonDixon Line here. Things change slow”(Chiarappa, 2018).
The impacts of marginalization in the industry were only exacerbated by systemic oppression preventing Black people from equal participation in the economy. Systems of slavery and structural racism in labor, the housing market, and credit (such as disproportionate rates of denials for loans for businesses and homes and limited business opportunities) have caused racial discrepancies in generational wealth accumulation still evident today (Herring & Henderson, 2016; Miller, 2011). The demographics of today’s aquaculture industry illustrate that many Black watermen were excluded from the financial benefits and legacy that the booming industry could have provided.
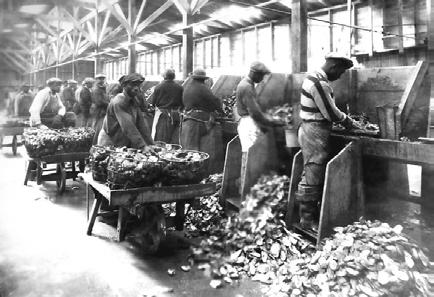

Although the wild oyster fishery is somewhat limited to general entry today due reduced oyster stocks and harvest limitations in most estuaries, the aquaculture sector is poised to grow. However, a lack of both historical awareness and gender and racial diversity exist in aquaculture today (Sandolo 2021). 11 of the 12 oyster producers interviewed in the study identified as white men. Furthermore, just 7 acknowledged the historic role of Black watermen; 1 made an “assumption” that Black watermen participated while another had “no idea.” Barriers to entry were identified by interviewees as:
• Racial and Gender Bias
• Exclusiveness. Those without relationships (e.g., from previous generations’ success) have difficulty gaining entry.
• Access to Capital. Startup costs are high.
• Permitting Processes. Lengthy permitting processes and public protests prevent those without disposable income, time, and social capital from participating.
• Waterfront Access. A lack of public waterfront access for small businesses limits the pool of participants to those who can afford coastal land or dock space.
• Exposure to the Industry.
• Experience on the Water.
• Lack of Support and Technical Assistance.
Industry managers can utilize a Food Justice framework to eliminate barriers preventing equal participation among people of color and to expand consumption of oysters. Recommendations include (Table 1):
1. Develop an ant-racist approach . Hire a consultant to train staff in adopting an antiracism, equity, or Food Justice Framework.
2. Acknowledge Leaders of Color . Memorialize Black talent, leadership, and labor. Integrate the history of watermen of color into management plans and permitting processes. Develop multilingual material.
3. Acknowledge and Eliminate Exploitation and Harm . Equip staff with knowledge: integrate the history, including the harm, into training and meetings.
4. Eliminate Racial and Gender Bias . Require antiracism and anti-bias training at all staff levels.
5. Facilitate Access to Capital . Establish and expand equity-based, no- or low-interest loans and grants. Integrate equity lens into application review to prioritize applicants of color. Provide Technical Assistance in applying for funds and in business planning. Promote livable wages to facilitate advancement.
6. Create More Waterfront Access . Provide dock space and waterfront space to descendants of watermen of color and interested entrepreneurs of color. Promote development of systems that require less onshore activity.
7. Boost the Buying Market . Integrate goals in equitable food access into industry plans. Invest in marketing and promotion: Engage historically marginalized communities; tell the story and build pride. Initiate farm-to-institution programs for producers to sell to state institutions. Engage growers in planning. Incentivize oyster purchases made with Federal Benefits. Facilitate shellfish handling certification for growers.
Table 1. Recommendations table that lists action steps aligned with Food Justice themes, that could reduce barriers to entry and increase Food Justice within the oyster aquaculture regions studied. Acronyms used include: People of Color (POC); Food Justice (FJ); Technical Assistance (T.A.).
RECOMMENDATIONS: REDUCING BARRIERS TO ENTRY IN MD, DE AND NJ OYSTER AQUACULTURE
FOOD JUSTICE THEMES AND SUBTHEMES
Creating systemic change throughout the food system.
Antiracist and Antiexploitation Approach
CommunityDetermination of a Just Food System

Acknowledging Harm, History, and Trauma
Reparations
Acknowledge, Invest in Talent and Leadership of Communities of Color
Community Power and CommunityDetermination
Right to Food
Racial and Gender Bias Exclusiveness
BARRIERS TO ENTRY
AccessPermitting to Capital Technical Assistance
Waterfront Access Exposure to Industry Experience on the Water
Hire a consultant to lead all staff through training in: 1) the history of the industry, 2) antiracism and 3) adopting an Antiracism, Equity or Food Justice framework.
Require antiracism training for all industry employees
Memorialize Black talent, leadership and labor; acknowledge exploitation
Integrate history into staff training and management practices
Invest in people of color as the future of aquaculture.
Compensate descendants of watermen of color to tell industry history
Pay for shellfish handling certification to facilitate direct-toconsumer sales
Right to Business Ownershp and Livable Wages
Integrate industry history into creative place-making in urban areas.
Integrate antiracism / equity lens into permit process
Create / expand no- and low-interest and forgivable loans and grants
Invest in technical assistance in permitting / business planning / grant applications technical assistance for entrepreneurs of color.
Position interested descendants of watermen and people of color as compensated decision-makers
Integrate equitable food access goals into management plans
Invest in regional marketing / build pride
Hold informational / T.A. sessions in noncoastal areas and in communities of color
Develop oyster farm-to-institution programs with state universities, hospitals, and other institutions
Simplify permitting and provide multiple languages and various avenues for information sharing.
Utilize antiracism framework in outreach and engagement programs; tell the story of the industry
Provide dock / working waterfront space to descendants of watermen of color and entrepreneurs of color
Build pride / connection to the industry in the region through marketing
Invest in and compensate people of color as leaders
Invest in organizations led by people of color, internships, and community engagement to amplify industry exposure
Establish incentive programs for oyster purchases made with Federal Benefits.
Invest in paid apprenticeships / externships as opportunities for entrepreneurs to build skills and successful businesses
Invest in educational programming (KCollege) and in organizations led by people of color to conduct youth education in fisheries and seafood
Invest in working waterfront space and ondeck equipment
Provide opportunities for people to explore aspects of aquaculture outside of farming. The Right to the Food System
Right to Land and Resources
Engage the public through events and online.
The Right to Human Dignity
Establish multilingual outreach and communications across all platforms and initiatives.
Community / Collaboration
Environmental Connection and Stewardship
Sponsor events that showcase the history of the oyster industry. (e.g. at Bivalve Center, in inland cities)
Invest in people of color to lead environmental education programming
Develop low-cost dock access for oyster entrepreneurs who do not have convenient private dock access.
Develop “right to farm” policies that prohibit or minimize complaints
Promote livable wages via grant / loan requirements
Highlight industry’s role in historic regional development through product marketing
Eliminate / minimize public protest process and expand on pre-approved Aquaculture Zones
Support businesses through grants, marketing, and institutional purchasing
Conduct community education to build social capital
Expand oyster purchasing programs for restoration
Prioritize environmentally beneficial coastal activities in state, county, municipal plans.
Ensure leases are not dependent on landownership
Create Internship / Apprenticeship programs at state agencies, small aquaculture businesses, universities, and organizations to boost their capacity while increasing engagement
Invest in memorializing the history, celebrating the individuals, and acknowledging historic injustices.
Compensate families of black oystermen for decision-making roles in planning memorials.
Invest in organizations led by people of color for community outreach and education (e.g. urban communities; coastal communities; incarcerated communities) to increase interest in the industry and increase the buying market
Invest in environmental organizations to conduct community engagement about the industry and the environmental benefits of aquaculture

8. Boost Exposure to the Industry and its History . Memorialize the history and acknowledge injustices. Position families of Black oystermen as decision makers in planning memorials. Invest in organizations led by people of color to amplify exposure. Establish compensated apprenticeships and internships within state agencies, aquaculture businesses, and partners (state universities, HBCUs, community colleges, city high schools and creative place-making initiatives in urban areas.
9. Modify Permitting Processes . Do not require land ownership for leases. Protect growers from personal attacks: eliminate public protests, encourage bottom culture; conduct community education; establish the “right to farm” in community-scale aquaculture; position activities that are beneficial to coastal ecosystems as priorities within development plans. Expand pre-approved aquaculture areas. Expedite and incentivize descendants of watermen of color for loans and grants. Improve timeliness of application review: engage apprentices in application review. Provide permit application technical assistance.
Now is the time for the oyster industry to recognize the historic barriers to advancement faced by oysterers of color that have led to modern day barriers to entry in aquaculture. Ignoring historical wrongdoings and opportunities for repair is no longer acceptable. Increasingly, consumers consider their food choices’ impacts, evidenced by the terrestrial Food Justice movement, from which the oyster industry has an opportunity to learn. Using the framework developed by Sandolo (2021) would promote socioeconomic diversity among business owners and position aquaculture as a reflection of Food Justice in our region, boosting demand and popularity and creating triple societal benefits: small business development, healthy ecosystems, and nutritional food.
Alkon, A. H. (2007). Growing Resistance: Food, Culture and the Mo’ Better Foods Farmers’ Market. Gastronomica, 7(3), 93–99. https://doi.org/10.1525/gfc.2007.7.3.93.
Anderson, H. (1998). Black Men, Blue Waters African Americans on the Chesapeake. Marine Notes, April. Bradley, K., & Herrera, H. (2016). Decolonizing Food Justice: Naming, Resisting, and Researching Colonizing Forces in the Movement. Antipode, 48(1), 97–114. https://doi.org/10.1111/anti.12165
Chiarappa, M. J. (2018). Working the Delaware estuary: African American cultural landscapes and the contours of environmental experience. Building and Landscapes, 25(1), 64–91. https://doi.org/10.5749/buildland.25.1.0064
Clarke, W. M. (2021, February). Water Bound. Cheseapeake Quarterly. https://storymaps.arcgis.com/stories/1c6f8f445a7c43e5982e6e4682df537e
Clendenning, J., Dressler, W. H., & Richards, C. (2016). Food justice or food sovereignty? Understanding the rise of urban food movements in the USA. Agriculture and Human Values, 33(1), 165–177. https://doi. org/10.1007/s10460-015-9625-8
Delaware Bay Watermen’s Memorial. (2013). Contemplation - Reflection - Remember the Past - Envision the Future. http://watermensmemorial.org/about.htm
Herring, C., & Henderson, L. (2016). Wealth Inequality in Black and White: Cultural and Structural Sources of the Racial Wealth Gap. Race and Social Problems, 8(1), 4–17. https://doi.org/10.1007/s12552-016-9159-8
Horst, M., Mcclintock, N., & Hoey, L. (2017). The Intersection of planning, urban agriculture, and food justice: A review of the literature. Journal of the American Planning Association, 83(3), 277–295. https://doi.org/10. 1080/01944363.2017.1322914
Miller, M. C. (2011). Land and Racial Wealth Inequality. American Economic Review, 101(3), 371–376. https://www. jstor.org/stable/29783772.
Sandolo, C. (2021). Adopting Principles of Food Justice for Equitable Oyster Aquaculture Industry Development. Graduate Program in Ocean Foods Systems, University of New England, Maine, USA.
Freshwater mussels are filter feeding bivalve mollusks that live in lakes, rivers, and streams (Fig 7.1.4.1). Similar to oysters, freshwater mussels provide many important functional and structural benefits for natural ecosystems. Supporting and regulating ecosystem services include increasing water clarity, filtering particulate pollutants, and enhancing nutrient storage and cycling (Vaughn et al. 2008, Newton et al. 2011, Hoellein et al. 2017, Kreeger et al. 2018). Freshwater mussels can serve as habitat engineers that increase complexity, buffer hydraulic stresses, reduce erosion, and enrich habitats for benthic plants, invertebrates and fish (Gutiérrez et al. 2003, Lopez and Vaughn 2021, Sansom et al. 2018, 2020, Vaughn et al. 2008). Their cultural benefits are diverse, ranging from their historical importance for Native Americans and the shell button, pearl and jewelry industries to their current use for myriad bioassessment and educational programs. For summaries of the ecosystem services provided by mussel assemblages, see Strayer 2017, Vaughn 2018, Atkinson et al. In Press).
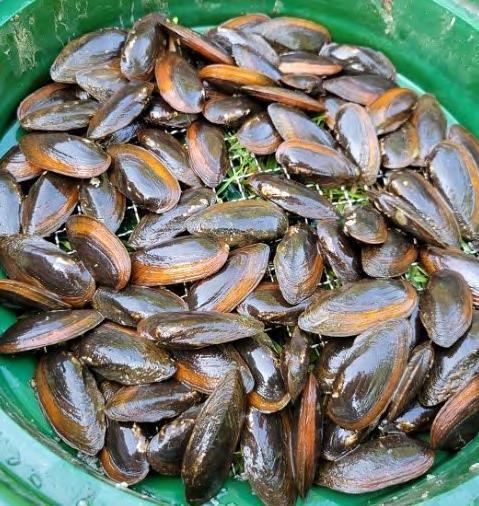
Figure 7.1.4.1 Eastern Pondmussel ( Sagittunio nasutus ) juveniles exhibiting new growth along ventral margin. Photo credit: Kurt Cheng, Partnership for the Delaware Estuary.
The potential beneficial effects of mussel beds on water quality are generating increasing research and restoration interest (Kreeger et al. 2018, Strayer et al. 2019, Wood et al. 2021). Although vastly depleted in numbers and species richness compared to historical conditions, enough freshwater mussels appear to remain in the Delaware River Basin to materially contribute to water quality by their filtration ( Kreeger and Kraeuter 2010, Anderson and Kreeger 2010). For example, Kreeger (2008) measured the abundance of the Eastern Elliptio ( Elliptio complanata ) in the Brandywine River and used survey data from Dr. W. Lellis (2001) (U.S.Geological Survey) to estimate that there are at least 4 billion adult mussels of this species across the Basin. Pairing these survey data with measured physiological processing rates, this species was estimated to filter about 10 billion liters of water per hour across the Basin, which is roughly 250 times the volume of freshwater entering the tidal estuary (Kreeger and Kraeuter 2010). A similar approach was used to estimate that representative beds of freshwater mussels in the tidal Delaware River upstream from Philadelphia filter more than a million gallons of water and 8 tons of suspended particles per day per hectare (Fig 7.1.4.2) (Kreeger et al. 2013).
Freshwater mussels grow more slowly than their marine counterparts. They also live longer (50 years or more) and have complicated reproduction strategies dependent on fish hosts (Haag 2012). As long-lived, relatively sedentary creatures that process large amounts of water over their soft tissues, freshwater mussels are particularly sensitive to water quality and contaminants (e.g., Wang et al. 2007). The health, population abundance, and species diversity of freshwater mussels

therefore represent excellent bioindicators of freshwater systems, particularly over long periods of time. Unfortunately, freshwater mussels are typically not sampled effectively as part of traditional macroinvertebrate assessments (see section 7.1.5), and so data on the status and trends of freshwater mussel populations are scarce.

Figure 7.1.4.2 Freshwater mussels are filter-feeding bivalves that efficiently remove microparticulate matter, resulting in improved water clarity, greater light penetration, and beneficial transformation of many filtered pollutants. In this outreach demonstration, both tanks received the same water, but the addition of live mussels to the tank on the right had dramatically enhanced water quality within 4 hours. Photo credit: Danielle Kreeger, Partnership for the Delaware Estuary.
Freshwater mussels are among the most imperiled of all animals and plants in North America (Nobles and Zhang 2011), which has the world’s greatest diversity of this taxonomic group with nearly 300 species (Williams et al. 2017). More than 70% have special conservation status (Williams et al. 1993, FMCS 2016). At least 12 species are native to the Delaware River Basin (Ortmann 1919, Campbell and White 2010, Kreeger and Kraeuter 2010); however, all but one species is currently reported to be uncommon (Kreeger and Kraeuter 2010).
To assess present status, survey data were gathered from disparate sources and analyzed for the past 25 years from the portions of Delaware, New Jersey, and Pennsylvania that comprise the Delaware River Basin. Most survey data were qualitative reports of species presence or absence rather than quantitative assessments of size class distribution and abundance. Due to limited data availability and the sensitive nature of heritage datasets, the current status of mussel resources was analyzed as species richness at the sub-watershed scale (i.e., by tributary or hydrologic unit code (HUC) unit). This analysis suggests that the overall condition of freshwater mussel populations is poor in streams where water quality, habitat degradation, dams, and other factors have progressively eliminated or reduced mussel populations over the past 100 or more years (Thomas et al. 2011).
Joint surveys in southeastern Pennsylvania by the Partnership for the Delaware Estuary (PDE) and the Academy of Natural Sciences of Drexel University between 2000 and 2010 found that only 4 of >70 Piedmont stream reaches contained any freshwater mussels (Thomas et al. 2011). Even the most “common” native species are presently patchy in distribution and limited in abundance. Furthermore, most mussel populations that have been found appear to lack juveniles and be comprised mainly of older individuals, suggesting that most populations in Piedmont streams are not successfully reproducing. In contrast, surveys for freshwater mussels in Coastal Plain streams of

southern Delaware and New Jersey suggest that mussel populations are not quite as degraded with regard to the number of streams that still retain extant populations of at least one native species (Cheng and Kreeger 2015). Similarly, extensive surveys of the undammed and tidal reaches of the mainstem Delaware River have revealed sometimes large beds of mussels (5-100 per square meter) (Lellis 2001, 2002, Kreeger et al. 2011). Several species found in the tidal Delaware River in 2010-1011 were previously believed to have been extirpated from the basin because they had not been reported in the published literature since Ortmann’s surveys 100 years earlier (Ortmann 1919). Importantly, quantitative surveys of the Delaware River between Philadelphia, Pennsylvania, and Trenton, New Jersey, revealed a few locations that still contained abundant juvenile mussels, demonstrating that natural reproduction is still occurring within that zone of the river where up to 6 mussel species can still be found (Kreeger et al. 2013, 2015).
Taken together, these richness and occurrence data indicate that the condition of mussel assemblages on Coastal Plain streams and the tidal Delaware River is healthier compared to assemblages in non-tidal tributaries of Piedmont streams, including the Schuylkill River. Anecdotal observations of mussel fitness and sizes support this observation, as evidenced by lower shell erosion, richer tissue biochemistry, and a more diverse size class range in Coastal Plain locations compared to Piedmont streams. Caging and tagging relocation studies in Delaware and Pennsylvania indicate that the food and water quality of most streams can currently support mussel fitness, growth and survival (Kreeger and Padeletti 2011, Gray and Kreeger 2014, Cheng and Kreeger 2015). We therefore infer that the main current culprits for the poor status of mussel populations is impaired habitat or limited fish hosts that are needed for reproduction. Since freshwater mussels rely on fish, usually species-specific relationships, for successful reproduction dams that block fish passage can disrupt reproduction and gene flow (McMahon 1991, Neves 1993).
Freshwater mussels require stable streambeds that they can burrow into, and stormwater scouring causes unstable conditions that wash mussels out or leads to very course sediments or bedrock. Shoreline alterations can also disturb or degrade mussel habitat, and dredging can result in a direct mussel take. Even in streams that have been the subject of deliberate remediation, restoration practices rarely consider the habitat needs of freshwater mussels (Wood et al. 2021).
The most comprehensive historical regional mussel survey was conducted in Pennsylvania between 1909 and 1919 (Ortmann 1919). Ortmann’s surveys described the bivalve species that were present or absent in many representative watersheds. However, even by that time, dams and water quality degradation may have already affected mussel communities. Nevertheless, the study provided an excellent benchmark for gauging long-term trends in the mussel assemblage for the past 100 years, especially related to species diversity. Ortmann (1919) reported 12 species of native mussels in the Delaware River Basin, most of which were present at that time in southeastern Pennsylvania (Fig 7.1.4.3A). Although species richness was highest in the mainstem Delaware River even then, at least five species were present in several tributary watersheds, including the Schuylkill and Brandywine.
In contrast, Figure 7.1.4.3B depicts the current species richness of native mussels for those subwatersheds where surveys have been completed since 1996 (Thomas et al. 2011; updated in 2022 by the PDE mussel database). Although the richness appears to have been preserved in the mainstem Delaware River and a few tidal tributaries in New Jersey, only one or no species has been detected in the past 25 years in most surveyed tributary streams of Delaware and Pennsylvania (Fig 7.1.4.3B). Taken together, these data suggest a long-term decline in mussel diversity in most areas of the lower Delaware River Basin where survey data exist.

The comparison between Figures 7.1.4.3A and 7.1.4.3B also suggests that the range of native mussel occurrence has shrunk significantly during the last 100 years in streams where historic and recent survey data exist. This decline appears to be continuing. For example, two species were found there as recently as 1998-2001, but no mussels have been found since 2002 in the upper White Clay Creek, Pennsylvania, despite annual surveys by PDE (Fig. 7.1.4.3).
The leading causes of historic mussel declines in the Delaware River Basin have been habitat and water quality degradation, like elsewhere in the United States (Haag 2012, FMCS 2016). As discussed above, the water quality and food within the system appears to now be sufficient to support mussel recolonization in many areas. However, as noted above, habitat degradation, fish passage blockages, and the inattention to mussel needs in stream restoration efforts are factors that continue to impede mussel recolonization in historically occupied habitats.
Since the decline of native mussel biodiversity has been attributed to habitat and water quality degradation, the future prospects for freshwater mussels are likely to hinge on careful watershed management, inclusion of mussel requirements in stream restoration practices, and deliberate efforts to conserve and restore mussel populations. Human population is expected to grow by 80% this century in the basin, which threatens to exacerbate the stressors that have been affecting mussels for probably hundreds of years.
Climate change also threatens freshwater mussels because of increased thermal stress, periodic drought, and increased flooding and stormwater scouring (Kreeger et al. 2011, Najjar 2015). Freshwater mussels are especially sensitive to bed instability and inputs of fine sediments to the system, and so stormwater and flood scouring represent threats that are expected to increase with climate change. Salinity rise may also threaten mussels living in freshwater tidal areas, especially during droughts and storm events which can lead to localized spikes in conductivity (Cheng et al. 2021). Periodic dips in dissolved oxygen concentrations could constrain mussels in some areas such as deeper areas of the tidal Delaware River.
Since freshwater mussels depend on fish hosts for larval dispersal, it is unlikely that southern mussel species will be able to expand northward to fill niches that open if northern species are extirpated. The Eastern Pearlshell, Margaritifera margaritifera , is an example of a cold-adapted species that uses brook trout as a host – its present distribution in southeast Pennsylvania is constrained to a few cold headwater streams and below reservoirs in the upper Schuylkill Basin which release colder water from the bottom. Assisted migration of warm-adapted southern species represents a potential climate adaptation tactic, but the willful introduction of species that are not native to this region might carry unforeseen risks and is at odds with current management paradigms.
Enhanced conservation and restoration efforts have the potential to offset projected continued declines in freshwater mussels (Kreeger and Padeletti 2011). Given the severely weakened status of freshwater mussel richness, range, and abundance, it is vital that any extant populations be protected. Although some streams may no longer be as suitable for mussels as they were historically, results from pilot reintroduction trials during 2007-2017 at more than a dozen locations in Delaware and Pennsylvania (Gray and Kreeger 2014, Kreeger et al 2014, 2015, Cheng and Kreeger 2017) suggest the majority of historic streams and ponds are still capable of sustaining mussels, but natural recolonization is prevented because of either inhibited movements of suitable fish hosts or unsuitable habitat conditions. Mussel restoration in these areas can be accomplished by improving habitat conditions and promoting fish passage. Where suitable habitat exists (or is created) but mussels are still depleted or absent, stocking of hatchery-propagated mussel seed having appropriate genetic

composition has the potential to expedite recovery (Kreeger et al. 2018, 2022). For example, new restoration approaches such as building mussel beds within urban living shoreline projects (Morgan et al. 2022) have the potential to also boost mussel carrying capacity via habitat enhancement, and mussel bed establishment in remediated areas may require stocking. Recent findings also suggest that freshwater mussels could be introduced into man-made aquatic systems such as stormwater management ponds to either promote water quality or diversify rearing locations for hatcheryproduced mussels (Gentry et al. 2022). Growing interest in mussel-mediated ecosystem services, such as water quality benefits, could energize mussel restoration in the Delaware River Basin and beyond (Kreeger et al. 2018, Wood et al. 2021).
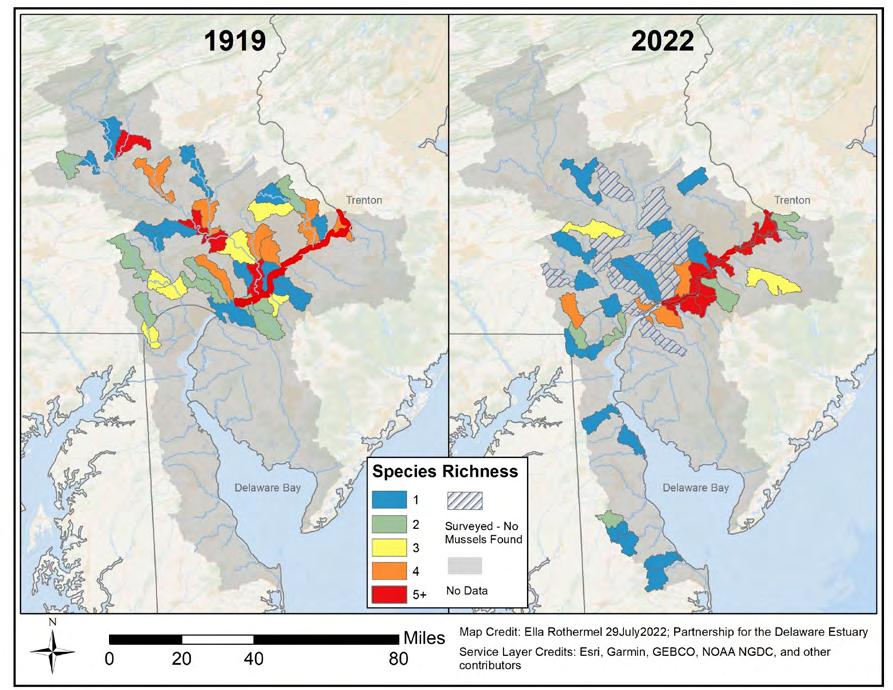
Figure 7.1.4.3 A) Species richness of native freshwater mussels reported in surveys conducted between 1919-1996, based on available data obtained by PDE. Surveys were primarily conducted by W. Ortmann prior to 1920 and A. Bogan during the 1980’s. B) Species richness of native freshwater mussels reported in surveys conducted between 1996-2016. Surveys were primarily conducted by PDE with assistance in some areas by the Academy of Natural Sciences of Drexel University, Environmental Protection Agency Region 3 dive unit, Philadelphia Water Department, and the Western Pennsylvania Conservancy.

More proactive freshwater mussel monitoring for species presence and population health is needed across the Delaware Estuary and River Basin. Freshwater mussels are not targeted in routine macroinvertebrate assessments, and so mussel surveys are rarely performed despite their value for assessing long-term status and trends of aquatic health. Hence, survey data are not available for most sub-watersheds of the Basin for at least 25 years, if ever. Improved coordination and data sharing would also facilitate development of better indicators and a coordinated watershed restoration strategy. New survey technologies for mapping mussel beds and suitable habitats are being developed and could be used to fill vital data gaps, identify mussel conservation areas, and help prioritize restoration areas. Critical habitat for mussel beds should be mapped and protected. The confirmation of natural freshwater mussel propagation and rare species in the tidal freshwater zone of the Delaware River is important because these represent potential source populations and broodstock to support the restoration of genetically appropriate mussels in other areas of the Basin. Quantitative surveys of mussel beds in this span of the Delaware River suggest that the presence of rarer species may depend on high densities of more common mussel species; hence, conservation and restoration efforts should target the entire mussel assemblage in their natural species abundance ratios. More research is needed to clarify these interspecific relationships. Research is also needed to understand the life history, habitat requirements, and ecological importance of native species of freshwater mussels, which are still understudied compared to marine bivalves (e.g. oysters) or freshwater macroinvertebrates (e.g. insects). Due to the lack of mussels for experiments, there are few case studies that have empirically determined outcomes from large-scale mussel restoration efforts.
Thanks to recent advances in mussel propagation and rearing technology, we now have the ability to produce juvenile mussels and rear them quickly in ponds for use in restoration and enhancement projects (Patterson et al. 2018). Given the current status of freshwater mussels nationwide, it is widely accepted that this technology will be needed to help address mussel conservation and restoration goals (FMCS 2016). This is because natural populations are so depleted and mussel dispersal mechanisms so restricted that it is unlikely that they can recover on their own, and even in the places where natural recovery may be viable it would take a very long time due to their slow growth rates. As part of the Freshwater Mussel Recovery Program that PDE and partners have been coordinating since 2007, more than 50,000 juvenile mussels representing four species native to the Delaware River Basin were propagated between 2017 and 2022. These mussels were produced from Delaware River broodstock at either the Fairmount Water Works demonstration hatchery in Philadelphia, owned and operated by the Philadelphia Water Department, or the USFWS Harrison Lake National Fish Hatchery in Virginia. These mussels were reared to sizes that can withstand most predators and then released into various types of aquatic habitats where they continue to be monitored.
Building on these successes, increased hatchery capacity is needed to supply mussels for regional restoration, enhancement, bioassessment, research and engagement programming. PDE estimates that more than 1 billion mussel seed would be needed to address these needs within the Delaware River Basin. To help address this constraint, a “Mussels for Clean Water Initiative” was launched in 2019 to increase mussel production capacity and test new mussel restoration and enhancement concepts, particularly at sites that are impaired for microparticulate pollutants such as total suspended solids, nutrients, and human pathogens. This initiative aims to produce up to 500,000 juvenile mussels per year. Similar to fish and oyster propagation and stocking, there are various genetic, biosecurity and ecological considerations that exist with mussel hatcheries (e.g., see Strayer et al. 2019). Efforts to reverse mussel declines or enhance musselmediated ecosystem services using propagated animals should be mindful of these concerns and proactively address them with best management practices, research, and monitoring. Monitoring

of restoration outcomes is aided by electronic tagging methods, biochemical and physiological fitness measures, new genetic markers, and a variety of other emerging technologies (e.g., Kreeger and Padeletti 2011, Gray and Kreeger 2014, Cheng and Kreeger 2014).
These various advances in restoration and monitoring tools offer hope that mussel declines can start to be reversed in the Delaware River Basin and elsewhere. However, in many areas mussel recovery will not be possible until all of the root issues causing their declines have been addressed. For example, best management practices to manage stormwater runoff are needed to promote more stable mussel habitats. Stream restoration practices should consider mussel habitat suitability. Water quality managers should consider mussel sensitivity to specific conductivity, dissolved oxygen, ammonia, metals and other parameters that could cause chronic or acute stress to natural mussel assemblages. Finally, permitting agencies should consider impacts to both common and rare mussel species when weighing damages from natural resource injuries, or dredging or development projects.
A robust community of freshwater mussels should be evident throughout most freshwater aquatic habitats of the Delaware River Basin, including diverse species that fill different ecological niches in streams, rivers, ponds and lakes. Unfortunately, the present status of the dozen native species of mussels is poor in most areas of the Basin, especially in flashy Piedmont streams and areas with impediments to fish passage. Poor status was judged by the reduced biodiversity, abundance, and range for this taxonomic group. Continued watershed development and climate change represent increasing threats. As long-lived organisms that are sedentary, mussels are a useful indicator of site-specific conditions over longer time scales, compared to short-lived or mobile fauna. The depleted status of natural mussel populations is concerning because of emerging data showing that mussel beds provide a diverse array of ecosystem services. For example, growing research is strengthening our understanding of the water quality benefits of healthy mussel assemblages and the economic basis for an increased restoration investment particularly at sites with impaired water quality. Careful watershed management, inclusion of mussels in traditional restoration, and more vigorous mussel conservation and restoration would help to reverse historic mussel declines and offset future threats. The few areas that still harbor healthy, diverse, and reproductive mussel beds, such as a few areas of the mainstem Delaware River, merit careful protection. Many areas that have lost mussel beds can now be restored or bolstered using new technologies. Mussel beds might also be included in man-made systems to provide ecosystem services, similar to treatment wetlands. The greatest improvements for water and habitat quality will likely be achieved by a basin-wide shellfish strategy that conserves and restores native bivalves living in different niches throughout the river-to-sea continuum.

Anderson, R.M. and D. A. Kreeger. 2010. Potential for impairment of freshwater mussel populations in DRBC Special Protection Waters as a consequence of natural gas exploratory well development. Written testimony to the Delaware River Basin Commission. November 23, 2010. 14 p. < http://ww w.delawa reestuar y.o rg/ science_ reports_ other_g roups.asp > (accessed 9/9/11).
Atkinson, Hopper, Kreeger, Lopez, Maine, Sansom, Schwalb and Vaughn. In Review. Gains and gaps in knowledge surrounding freshwater mollusk ecosystem services. Freshwater Mollusk Biology and Conservation.
Campbell, C.A. and B. St. John White. 2010. Development of an aquatic gap analysis for the Delaware River Basin. Gap Analysis Bulletin 17: 26-29.
Cheng, K. M. & D. A. Kreeger, 2015. Current Status and Restoration of Freshwater Mussels in Northern Delaware. Partnership for the Delaware Estuary, Wilmington, DE. PDE Report No. 15-04. < https://s3.amazonaws.com/delawa reestuary/pdf/PDE-Report-15-04_ Cur rent+Status+and+Restoration+of+F reshwater+Mussels+in+Northern+Delawa re.pd f> (accessed 5/11/17)
Cheng, K. M. & D. A. Kreeger, 2017. Determination of Filtration Capacity and Pollutant Removal of Freshwater Mussels in Delaware Streams. Partnership for the Delaware Estuary, Wilmington, DE. PDE Report No. 17-04. (accessed 5/11/17)
Cheng, K. M., Haaf, L. R., Kreeger, D. A., O’Hara, B. and Gentry M. J., 2021. Enhancing Water Quality by Restoring Freshwater Mussels in an Urban River: Assessing and Testing Prospects in Relation to Salinity. Partnership for the Delaware Estuary, Wilmington, DE. PDE Report No. 21-02.
Freshwater Mollusk Conservation Society. 2016. A national strategy for the conservation of native freshwater molluscs. Freshw. Mollusk Biol. Conserv. 19: 1-21.
Gentry, M. J. K. M. Cheng, L. Morgan and D. A. Kreeger. 2022. Municipal stormwater ponds as low-maintenance, high-impact grow-out sites for juvenile freshwater mussels in the Delaware River Basin, USA. Abstract. J. Shellfish Res. 41(2)
Gray, M. and D. Kreeger. 2014. Monitoring fitness of caged mussels (Elliptio complanata) to assess and prioritize streams. Aquatic Conservation: Marine and Freshwater Ecosystems. vol. 24. pp. 218-203.
Gutiérrez, J. L., C. G. Jones, D. L. Strayer, and O. O. Iribarne. 2003. Mollusks as ecosystem engineers: the role of shell production in aquatic habitats. Oikos 101:79-90.
Haag, W. R. 2012. North American Freshwater Mussels: Ecology, Natural History, and Conservation. New York, NY: Cambridge University Press.
Hoellein, T. J., C. B. Zarnoch, D. A. Bruesewitz, and J. DeMartini. 2017. Contributions of freshwater mussels (Unionidae) to nutrient cycling in an urban river: filtration, recycling, storage, and removal. Biogeochemistry 135:307-324.
Kreeger, D.A. 2005. A holistic concept for the conservation and propagation of populations of freshwater, brackish and estuarine bivalves for ecosystem services. J. Shellfish Res. 24(2): 662
Kreeger, D., J. Adkins, P. Cole, R. Najjar, D. Velinsky, P. Conolly, and J. Kraeuter. June 2010. Climate Change and the Delaware Estuary: Three Case Studies in Vulnerability Assessment and

Technical Report for the Delaware Estuary and Basin Partnership for the Delaware Estuary— Host of the Delaware Estuary Program
Adaptation Planning. Partnership for the Delaware Estuary, PDE Report No. 10-01. 1-117 pp. < https://s3.amazonaws.com/ delawa reestuary/pdf/Climate/Climate%20Change%20and%20 the%20Delawa re%20Estuary%20&%20Appendicies_PDE-10-01.pdf > (accessed 5/11/17)
Kreeger, D.A., K. Cheng, P. Cole and A. Padeletti. 2014. Partnership for the Delaware Estuary. 2014. Reintroduction of Freshwater Mussels into the Red and White Clay Creeks, DE. PDE Report No.14-02. http://delawa reestuar y.s3.amazonaws.com/PDE-Report-14-02_Re-Int roductionofF reshwaterMusselsintoRedClayandWhiteClayC reeksDE.pdf > (accessed 5/11/17)
Kreeger, D.A., K. M. Cheng, M. J. Gentry, L. M. Morgan and J. A. Moody. 2022. Beyond restoration aquaculture: testing the propagation, rearing and deployment of freshwater mussels for water quality enhancement of impaired habitats. Abstract. J. Shellfish Res. 41(2).
Kreeger, D., P. Cole, K. Cheng, L. Butler, D. Ross, A. Padeletti, R. Thomas, J. D’Agostino, L. Wool. 2015. Freshwater Mussel Scientific Research and Community Involvement for Improved Water Quality in Urban Pennsylvania Coastal Zone Project. Partnership for the Delaware Estuary final report to the Pennsylvania Coastal Management Program. PDE Report No. 15-02. 41p. < http://delawa reestuar y.s3.amazonaws. com/PDE-Report-15-02_F reshwater%20Mussel%20 Scientific%20Resea rch%20and%20Community%20Involvement%20for%20Imp roved%20 Water%20Quality%20in%20the%20Urban%20 PA%20Coastal%20Zone. pdf > (accessed 5/11/17)
Kreeger, D., P. Cole, M. Mills, L. Butler, A. Padeletti, R. Thomas, J. D’Agostino. 2013. Connecting people to aquatic biodiversity: freshwater mussel surveys in Pennsylvania’s coastal zone. Partnership for the Delaware Estuary final report to the Pennsylvania Coastal Management Program. PDE Report No. 13-02. 65 p. < https://s3.amazonaws.com/delawa reestuary/pdf/ ScienceReportsbyPDEandDELEP/PDE-Report-13-02_ F reshwater+Mussel+Surveys+in+Pennsylvania%27s+Coastal+Zone.pdf > (accessed 5/11/17).
Kreeger, D. A., C. M. Gatenby, and P. W. Bergstrom. 2018. Restoration potential of several native species of bivalve mollusks for water quality improvement in mid-Atlantic watersheds. Journal of Shellfish Research 37: 1121-1157.
Kreeger, D., R. Thomas, S. Klein, A. Padeletti, and W. Lellis. 2011. Recent discoveries of rare freshwater mussels (Unionidae) in the urban corridor of the Delaware Estuary. Proceedings for the Fourth Delaware Estuary Science & Environmental Summit. P. Cole and D. Kreeger (eds.), Partnership for the Delaware Estuary. PDE Report No. 11-01. 154 p. < http://ww w.delawareestuar y.o rg/science_ reports_partnership.asp > (accessed 9/12/11)
Kreeger, D. and J. Kraeuter. 2010. Ecologically significant bivalve molluscs of the Delaware Estuary, Appendix N, In: Climate Change and the Delaware Estuary: Three Case Studies in Vulnerability Assessment and Adaptation Planning. Partnership for the Delaware Estuary, Report No. 10-01. 23 p. < http://ww w delawa reestuar y.o rg/science_ reports_ partnership.asp > (accessed 9/9/11).
Kreeger, D. and A. Padeletti. 2011. Freshwater mussels: “old growth” survivors for “new age” restoration. Estuary News 21(4): 5-6.
Lellis, W.A. 2001. Freshwater Mussel Survey of the Delaware Scenic and Recreational River, Qualitative Survey 2000. Report to the National Park Service, February 20, 2001. 6 p. plus appendices.

Technical Report for the Delaware Estuary and Basin Partnership for the Delaware Estuary— Host of the Delaware Estuary Program
Lellis, W.A. 2002. Freshwater Mussel Survey of the Delaware Water Gap National Recreation Area, Qualitative Survey 2001. Report to the National Park Service, March 8, 2002. 12 p. plus appendices.
McMahon, R. F. 1991. Mollusca: Bivalvia. In: J. H. Thorp and A. P. Covich (eds.), Ecology and Classification of Freshwater Invertebrates. Academic Press Inc., New York. pp. 315 397.
Morgan, L., M. Gentry, K. Cheng, J. Moody and D. A. Kreeger. 2022. Coupling freshwater mussel and shoreline restoration practices in the Delaware Estuary, USA. Abstract. J. Shellfish Res. 41(2)
Najjar, R. G. 2015, Potential impact of climate change on bivalves in the tidal freshwater region of the Delaware River. Final report to Pennsylvania Sea Grant. 23 p.
Neves, R.J. 1993. A state-of-the-unionids addres. P. 1-1- in K.S. Cummings, A.C. Buchanan, and L. M. Koch (eds.). Conservation and management of freshwater mussels. Proc. Upper Mississippi Riv. Conserv. Comm. Symp., Rock Island, IL.
Newton, T. J., S. J. Zigler, J. T. Rogala, B. R. Gray, and M. Davis. 2011. Population assessment and potential functional roles of native mussels in the Upper Mississippi River. Aquatic Conservation: Marine and Freshwater Ecosystems 21: 122-131.
Nobles, T., and Zhang, Y. 2011. Biodiversity loss in freshwater mussels: importance, threats, and solutions. Biodiversity Loss in a Changing Planet. Intech, Rijeka, 137-162.
Ortmann, A. E. 1919. A monograph of the naiades of Pennsylvania. Part III. Systematic account of genera and species. Memoirs of the Carnegie Museum. 8(1):1-384. Partnership for the Delaware Estuary. 2008. State of the Estuary Report. PDE Report #08-0. 36 p.
Pennsylvania DEP Report 2020. Qualitative Survey of the Spatial Extent of Freshwater Mussel Beds in the Pennsylvania Portion of the Tidal Delaware River using Side Scan Sonar Imaging and Underwater Video. http://www.depgreenport.state.pa.us/elibrary/GetDocument?docId=3420602&DocName=DELAWARE%20ESTUARY%20SIDE%20SCAN%20MUSSEL%20 SURVEY.PDF%20%20%3cspan%20style%3D%22color:green%3b%22%3e%3c/span%3e%20 %3cspan%20style%3D%22color:blue%3b%22%3e%28NEW%29%3c/span%3e%2010/1/2022# (Accessed on 8/22/2022)
Patterson, M.A., R.A. Mair, N.L. Eckert, C.M. Gatenby, T. Brady, J.W. Jones, B.R. Simmons and J.L. Devers 2018. Freshwater Mussel Propagation for Restoration, 1st Edition, Cambridge University Press, https://www.cambridge.org/core/books/freshwater-mussel-propagation-for-restoration/2373C012E661FF1533D3FB5082FC1ABA
Sansom, B. J., S. J. Bennett, J. F. Atkinson, and C. C. Vaughn. 2020. Emergent hydrodynamics and skimming flow over mussel covered beds in rivers. Water Resources Research 56: 1–17.
Sansom, B. J., J. F. Atkinson, and S. J. Bennett. 2018. Modulation of near-bed hydrodynamics by freshwater mussels in an experimental channel. Hydrobiologia 810: 449–463.
Strayer, D. L., J. Geist, W. R. Haag, J. K. Jackson, and J. D. Newbold. 2019. Essay: Making the most of recent advances in freshwater mussel propagation and restoration. Conservation Science and Practice 1. 10.1111/csp2.53
Thomas, R., D. Kreeger, S. Klein, A. Padeletti, Z. Ruge, M. Gray and C. Gatenby. 2011. Occurrence of freshwater mussels (Unionidae) in surveyed streams of southeastern Pennsylvania, 2000-

and
2010. Proceedings for the Fourth Delaware Estuary Science & Environmental Summit. P. Cole and D. Kreeger (eds.), Partnership for the Delaware Estuary. PDE Report No. 11-01. 154 p. < http://ww w.delawa reestuar y.o rg/science_ reports_ partnership.asp > (accessed 9/12/11)
Vaughn, C. C. 2018. Ecosystem services provided by freshwater mussels. Hydrobiologia 810: 15-27.
Vaughn, C. C., S. J. Nichols, and D. E. Spooner. 2008. Community and foodweb ecology of freshwater mussels. Journal of the North American Benthological Society 27: 409-423.
Wang, N., C. G. Ingersoll, D. K. Hardesty, C. D. Ivey, J. L. Kunz, T. W. May, F. J. Dwyer, A. D. Roberts, T. Augspurger, C. M. Kane, R. J. Neves, and M. C. Barnhart. 2007. Acute toxicity of copper, ammonia, and chlorine to glochidia and juveniles of freshwater mussels (Unionidae). Environmental Toxicology and Chemistry 26:2036-2047.
Williams, J. D., M. L. Warren, K. S. Cummings, J. L. Harris, and R. J. Neves. 1993. Conservation status of freshwater mussels of the United States and Canada. Fisheries 18: 6-22.
Williams, J. D., Bogan, A. E., Butler, R. S., Cummings, K. S., Garner, J. T., Harris, J. L., Johnson, N. A. and Watters, G. T. 2017. A revised list of the freshwater mussels (Mollusca: Bivalvia: Unionida) of the United States and Canada. Freshwater Mollusk Biology and Conservation, 20(2): 33-58.
Wood, Bukaveckas, Galbraith, Gattis, Gray, Ihde, Kreeger, Mair, McLaughlin, Hahn, and Harvey. 2021. Incorporating Freshwater Mussels into the Chesapeake Bay Restoration Efforts. Chesapeake Bay Workshop Publication. Annapolis, MD.

Technical Report for the Delaware Estuary and Basin Partnership for the Delaware Estuary— Host of the Delaware Estuary Program December 2022 | Report No.22-05
Freshwater benthic macroinvertebrate communities, home to a diverse group of organisms such as those shown in Figures 7.1.5.1A and 7.1.5.1B, are useful indicators of the ecological integrity of the Delaware River watershed for several reasons. A variety of macroinvertebrates live in every aquatic environment, and they are functionally important in several ecological roles. They are widely acknowledged to be good indicators of water quality because they are directly impacted by and highly sensitive to changes in water quality. Furthermore, they have been studied extensively in all parts of the Delaware River Basin.
It is difficult to aggregate and summarize data about this indicator for a multi-state area like the Delaware Estuary and Basin because the various organizations that produce data (including state environmental agencies) all use different methods of sampling and analysis. The differences in methods limit the comparability of data from different sources. Therefore, data are compared using the common approach for all states, grades of condition (e.g. good, fair, poor). Assuming a rough comparability between these grades of condition, data from various sources can be brought together and presented side-by-side to approximate a basin-wide assessment.
An explanation of how this complex situation came about may help explain what this indicator tells us about the ecology of the Delaware River Basin broadly. The discussion may also help readers to appreciate something about benthic macroinvertebrates and their importance, and to understand more about the way environmental agencies perform water quality management in the United States.


Figure 7.1.5.1 (Top) Newly emerged adult dragonfly (photo credit PA DEP); (bottom); Drunella spp (photo credit NJ DEP).
The word “benthic” indicates animals that live on, or in, the substrate at the bottom of a waterbody. The word “macroinvertebrates” designates invertebrate animals that are large enough to be seen without the aid of magnification. In aquatic habitats, benthic macroinvertebrates are a broad group of organisms representing several phyla. The group includes roundworms, flatworms, mollusks, and several kinds of arthropods. Insects are a particularly important class of animals in the group, because of their abundance and diversity in the freshwater biota. Some aquatic invertebrates that are commonly encountered are dragonflies, mayflies, mosquitoes, and water striders.
To be more precise, the indicator being discussed here is freshwater benthic macroinvertebrates that live in streams. Thus, those macroinvertebrates that live in lakes, ponds, wetlands, and tidal waters are excluded. These distinctions are primarily made because the nature of the information most easily

available, is mostly for “wadable” streams. Wadable streams are relatively easy to survey, and these smaller waterbodies are where most states have focused their sampling efforts (Fig 7.1.5.2). Most states have been sampling and compiling data about benthic macroinvertebrates since the 1970s or 1980s. The reason lies in what these animals say about the water quality of the environments in which they live. Using a procedure called “bioassessment,” the biological condition of macroinvertebrate communities is analyzed to provide information about pollution and other water quality problems. A bioassessment protocol is a set of standard practices describing how streams should be surveyed to produce data about ecological condition.In most states, bioassessment is used for multiple purposes, but the most widespread application of bioassessment is for the purpose of assessing a state’s streams for the attainment of water quality standards. This program of assessment arises from the states’ obligations under the Federal Clean Water Act.
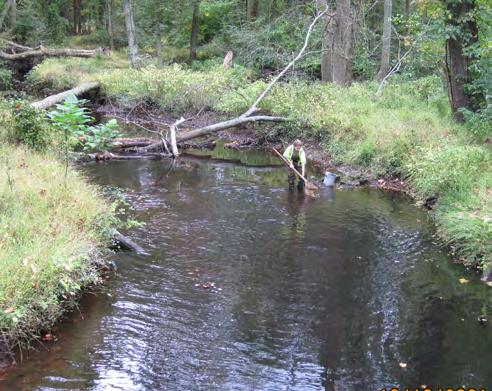

The Federal Clean Water Act (and its amendments through 1987) requires states to develop water quality monitoring programs. States report to the U.S. Environmental Protection Agency (USEPA) on the quality of their waters using the biennial “305 (b) report” and the “303 (d) list.” In most states, these biennial reports are now usually merged into a single document called the “Integrated Assessment” or the “Integrated Report.” The states are charged with assessing their waterways’ conditions for various water uses, including, for example, public water supply, recreation, or aquatic life. The condition of macroinvertebrate communities is usually connected specifically to aquatic life uses. Results of bioassessments are used to determine if a waterway is “attaining” or “not attaining” the State’s water quality standard, a threshold condition determined by the state.
Over the past 20 to 30 years, bioassessment has become increasingly important to environmental agencies, as advances have been made in the scientific understanding of watershed degradation and its effects. It is now widely acknowledged that biological indicators represent an essential means of determining the condition of natural waters. Some of the reasons for this are:
• Bioassessments provide information that is directly relevant to the goals of water pollution law (that is, that waters should be able to support aquatic life).
• Bioassessments provide information about long-term, chronic, or episodic stressors that are otherwise difficult to monitor.

• Bioassessment methods can be used to assess fish or periphyton (algae) in addition to macroinvertebrates. However, macroinvertebrates may be the most broadly useful of these biological groups, for reasons that include the following:
• Macroinvertebrates are relatively easy to sample and analyze,
• Macroinvertebrates are less mobile than fish, and thus they provide a better representation of the condition of a particular location, and
• Macroinvertebrates are abundant and utilize diverse niches, which allows for a detailed determination of their condition over a wide gradient.
Methods of collection and analysis must be standardized and consistently applied if data are to be comparable. However, there is no single macroinvertebrate protocol that is universally applicable in all circumstances. Natural variation sometimes dictates that protocols should differ, for the assessment of streams from substantially different environments. In addition, the needs and resources of the organization doing the sampling sometimes determines what protocol will be applied, since there are some protocols that demand more time and resources, while others can be done more rapidly. While there are broad similarities between many of the protocols, they usually differ from one another in their various details. A brief discussion of some of the variables will illustrate the reasons for this complexity. Every macroinvertebrate bioassessment protocol must include a description of each of the steps listed below. Within each of these four steps, there can be variations in methodology, as indicated by the following discussion:
1. Sampling: According to most protocols for wadable streams benthic macroinvertebrates should be sampled using hand-held nets. The bioassessment protocol specifies details such as the exact shape of the net, the size of the mesh, and how the net should be handled in a stream. The protocol describes how to select sampling sites in the field and how to combine the material from grab samples to make a composite. The protocol further specifies how many organisms are needed to make a representative sample (typically between 100 and 300 individuals), and provides techniques for ensuring that those organisms are picked from the sample using an unbiased randomization method.
2. Identifying organisms: The bioassessment protocol specifies whether a collection of organisms will be identified in the field and returned to the stream alive or preserved and identified in a laboratory. Field methods usually involve family-level identification, while laboratory methods often provide for identification to genus or to species. Laboratory analysis requires more time and effort but provides more information. Whether the identification is done in the field or the lab, the product of this step is a list of the macroinvertebrate taxa found at a site, along with the number of individuals of each taxon.
3. Applying bioassessment metrics: The list of organisms produced in the previous step is analyzed by applying bioassessment metrics. This involves various methods of grouping and counting the organisms by types (by taxa). A variety of bioassessment metrics have been presented in scientific literature. Some metrics involve counting the number of different taxa found in a sample (assessing sample diversity); while other metrics involve counting the number of individuals of certain taxa or in certain groups of taxa (assessing community structure). Applying metrics often requires grouping taxa together by what is known about their ecological roles or characteristics. For example, there are several commonly-used metrics that take into account the relative “pollution tolerance” of the various taxa. Applying any metric to the list of taxa for a sample produces a numerical score. It is generally agreed that no single metric

provides enough information to stand alone as a means of assessing water quality. Therefore, most states apply a suite of several metrics.
4. Applying an index: An Index of Biological Integrity (IBI) is a method of combining and integrating information from several bioassessment metrics. It involves applying a series of mathematical transformations to each sample’s metric scores and then combining them to give a single numerical index score. Typically, an index score for the so-called “reference condition” is developed using data from sites that are known to be undisturbed and that are judged to be appropriate reference sites based on regional and ecological considerations. Sample data are compared to reference conditions using the numerical scores calculated using the index. Increasing degrees of disturbance (or pollution) are indicated by scores that range further and further from the reference score. For state agencies, one of the main purposes of their bioassessment work is to identify those streams that are divergent enough from the reference condition that they are determined to be “not attaining” the state’s water quality standards for aquatic life use. Typically, the threshold that is used to determine attainment is linked to a particular numerical score using the appropriate index.
The “Present Status” and “Past Trends” sections of this chapter are based on data from six different sources, namely the four Delaware River Basin states, Delaware River Basin Commission (DRBC), and the Academy of Natural Sciences of Drexel University. These six organizations all use different macroinvertebrate protocols in their programs for stream assessment. In addition to this interstate variability, there is also intrastate variability, because some states actually use more than one protocol to account for natural variation. A brief description is provided of how each of the organizations that contributed data has designed their respective programs for producing macroinvertebrate data.
Delaware Delaware is a small state with relatively little natural variability, but it does straddle a significant eco-regional divide. Delaware’s land area is divided between the Middle Atlantic Coastal Plain ecoregion and the Northern Piedmont eco-region. In the Coastal Plain, where streams have a low-gradient character, the state’s bioassessment program specifies the use of the protocol developed by a USEPAsponsored, multi-state workgroup called the Mid-Atlantic Coastal Streams Workgroup (USEPA 1997). In the Piedmont, the state specifies the use of methods documented in USEPA’s 1999 Rapid Bioassessment Protocols report (Barbour et al. 1999). The structural and ecological differences between coastal plain streams and piedmont streams dictate several differences between the two protocols. For both stream categories, Delaware specifies that macroinvertebrate samples are to be preserved and identified in a laboratory, with most taxa identified to genus. Both protocols also utilize a multi-metric index. Of the assessment stations that make up the data set for Delaware’s Delaware Estuary Basin, 46% are from the Piedmont and 54% are from the Coastal Plain.
Pennsylvania In 2006, after 10 years of effort, Pennsylvania completed their first statewide bioassessment survey, which was done using a modified version of the USEPA Rapid Bioassessment II Protocol from the document referenced above (Barbour et al. 1999). This method used field identification of organisms and family-level taxonomy. At about the same time, the state decided to refine their biomonitoring program and implement major changes to the bioassessment protocols. Pennsylvania’s new program has the State’s streams divided into four major ecological categories, each of which is assessed by a different data collection protocol and assessment method. Each collection protocol specifies particular sampling requirements, and each assessment method specifies how metrics and index calculations should be applied.
The largest group of streams in Pennsylvania is categorized as wadable riffle-run streams, which are assessed using the “Wadable Freestone Riffle-Run Stream Macroinvertebrate Assessment Method” (Shull 2017). The method specifies making a certain number of collections from shallow gravel-bottom or

cobble-bottom riffle habitat, and then compositing and randomly sub-sampling to give a 200-organism sub-sample. The sub-sample is preserved and identified in a laboratory to genus, and a multi-metric IBI is applied to the taxa list. The preferred seasons for sampling are between November and May, so as to avoid sampling during the summer emergence period of many important insects. However, a method for summer samples is also available when agency workload requires that stream assessments continue through the summer months. The summer samples method provides a modified analysis to account for the effects of seasonal emergence on the invertebrate community. During the summer months, many insects emerge as winged adults, and their aquatic forms are notably absent from stream-collected samples. In light of this, practitioners of bioassessment have two choices. They may avoid sampling during the time of year when the benthic community is likely to be altered by emergence, or they may develop protocols that are specifically tailored to each particular seasonal condition. Freestone Streams account for 95% of the assessments performed in Pennsylvania’s Delaware River Basin.
Pennsylvania’s second stream category consists of low-gradient streams that are lacking in riffle habitat. Pennsylvania uses the phrase “Multi-Habitat” to refer to this stream category and method. For MultiHabitat sites, the sampling protocol is designed to provide a means of capturing representative organisms from several specific kinds of habitats (including, for example, coarse submerged debris, submerged aquatic vegetation, and deposits of coarse particulate organic matter). A specific multimetric analysis and IBI are applied for assessments (Pulket 2017). This category is somewhat similar to the Mid-Atlantic Coastal Plain Streams “Coastal Plain” streams discussed above in the “Delaware” section, as well as to the “Coastal Plain (Non-Pinelands)” category discussed below in the “New Jersey” section. However, the analogy is not exact, because many of Pennsylvania’s Multi-Habitat sites are not in the coastal plain but in low-gradient topography in plateau regions, such as the Pocono region of northeast Pennsylvania. Multi-Habitat assessments account for 4% of the assessments performed in Pennsylvania’s Delaware River Basin.
The third category of streams, limestone streams, is assessed using the method for “True” Limestone Streams (Williams 2017). This method is specifically for spring-fed streams with high alkalinity and constant year-round temperature. These streams are considered ecologically unique and are important as cold-water fish habitat. The protocol specifies the collection of two samples from riffle habitat, composited and sub-sampled to make a 300-organism sample, followed by laboratory-identification of organisms to genus. A specific multi-metric analysis and IBI are applied. Limestone Streams account for 1% of the assessments performed in Pennsylvania’s Delaware River Basin.
Pennsylvania’s fourth stream category includes the large semi-wadable rivers. Semi-wadable rivers are defined as predominantly free-flowing systems with drainage areas >1,000 mi2 and have physical characteristics that allow for riffle and run sections to occur with relative frequency. These river systems tend to lack a well-defined and navigable U-shaped channel for any significant distance and frequently present difficulties for both wadable and non-wadable macroinvertebrate data collection protocols. Well over half of the large rivers within Pennsylvania are considered semi-wadable. Pennsylvania uses the “Semi-Wadable Large River Macroinvertebrate Assessment Method”, which applies a multi-metric IBI to make assessments, much like the previous methods discussed (Shull 2018). Samples from large semiwadable rivers are not reported here because they constituted less than 1% of the total assessments performed in Pennsylvania’s Delaware River Basin.
New Jersey In the early 1990’s, New Jersey began its Ambient Macroinvertebrate Network (AMNET). Each station within this network of freshwater, non-tidal, wadable rivers and streams is sampled once every five years using a rotating basin approach (NJDEP 2007). Assessments are made utilizing one of three multi-metric indices developed for use in New Jersey. The three indices are: the High Gradient Macroinvertebrate Index (HGMI), which applies to the streams of northern New Jersey in the Highlands, Ridge and Valley, and Piedmont ecoregions; the Pinelands Macroinvertebrate Index

(PMI), which applies to rivers and streams within the Pinelands National Reserve and 5-km buffer surrounding this boundary; and the Coastal Plain Macroinvertebrate Index (CPMI), which applies to the Coastal Plain of southern New Jersey excluding the Pinelands National Reserve and buffer. For New Jersey’s most recent sampling in the Delaware River Basin, 37% of stations were assessed by the HGMI, 42% by the CPMI, and 21% by the PMI.
New York New York’s biological monitoring program began in 1972, with the first surveys done on the state’s large rivers, using artificial substrate samplers. Since 1984, New York has used a “Rapid Assessment’’ method in the state’s wadable streams, for both special studies and as part of the statewide ambient water quality monitoring program. In 1987, the statewide program was re-designed to use a rotating cycle of monitoring and assessments called Rotating Integrated Basin Studies (RIBS). Under the current RIBS schedule, chemical and biological monitoring is conducted in all of the state’s 17 major drainage areas over a five-year period (Bode et al. 2002). Riffle habitat is targeted for biological sampling of wadable streams. Non-wadable waters are monitored using artificial substrate samplers. The index period for wadable stream sampling is from July through September. Individual metrics characterizing the benthic macroinvertebrate community are combined to form a multi-metric index called the Biological Assessment Profile. There is no differentiation of streams by eco-region; however, modification of the sampling methods and assessment metrics are used for low-gradient, sandy- bottom streams. Samples are preserved and identified in the laboratory to genus or species.
DRBC As an interstate agency, DRBC takes responsibility for assessing the mainstem Delaware River where it forms a border between states. Since 2001 DRBC has collected benthic macroinvertebrate samples annually at about 25 fixed sites on the Delaware River. These sites range from Hancock, NY (river mile 331/533 km) to just above the head-of-tide at Trenton, NJ (river mile 137/220 km). All samples are collected from gravel- or cobble-dominated riffle habitats. Sampling generally occurs in the late summer, with the central sampling window being August and September. The samples are preserved for laboratory identification, and the organisms are generally identified to genus. The analytical methodology is based on a multi-metric IBI with a 100-point range.
The Academy of Natural Sciences of Drexel University (ANSDU) collects data for the Delaware River Watershed Initiative (DRWI ; 4states1source.org), among other projects. ANSDU has coordinated and performed monitoring for the DRWI around on-the-ground restoration and protection projects since 2013. Projects take place in sub-watershed “clusters” in 8 geographies across the basin: Brandywine-Christina (BWC), Middle Schuylkill (MS), Schuylkill Highlands (SH), Upper Lehigh (UL), Poconos-Kittatinny (PK), New Jersey Highlands (NJH), Kirkwood-Cohansey [Aquifer], and Upstream Suburban Philadelphia (PHL). The sampling sites and methods are designed to capture the potential effects of stream recovery from implementation of agricultural Best Management Practices (BMPs) and land preservation. The quantitative sampling methods were applied with the goal of tracking small changes over time. For example, when sufficient aggregation of BMPs leads to nutrient and sediment reductions, the data are a fine enough resolution to show stream ecosystem response (Kroll & Abell, 2015; Kroll et al., 2019).
ANS and Stroud Water Research Center (SWRC) field teams collected baseline data at three types of sites. Integrative sites capture larger areas of the cluster drainage and were sampled to characterize the overall condition of sub-watershed clusters, sampled in 2013 and 2015. Baseline sampling occurred in 2014 and 2016 at project sites – upstream and downstream of on-the-ground projects, where streams are smaller and improvement of degraded waters or maintenance of good conditions might be expected as a result of DRWI activities. The third site type represents Focus Areas in 2017-2020—smaller regions within sub-watershed clusters where on-the-ground work is focused. The Focus Area sites are typically located at the watershed outlets of the Focus Area, or the “pour

points.” Sampling follows the same protocols at all sites, producing comparable and complementary data that over time can give a comprehensive picture of ecosystems within the basin at different spatial scales. For the DRWI, fish, macroinvertebrate and diatom communities are assessed, along with habitat assessment and water chemistry (Kroll et al., 2021). Macroinvertebrate data are collected by Stroud Water Research Center (SWRC) from April to June. Surber samplers are used to collect macroinvertebrates at 16 riffle locations in each site and composited into 4 samples. A portion of each of the 4 samples is taken to the laboratory and identified to genus or species. The data are presented using the PA DEP IBI here to align with other data sets.
For this Technical Report, the status of macroinvertebrates in nontidal waterways of the Delaware Estuary and Basin is determined using the data produced by the States for their biennial water quality reporting. All four basin states and DRBC report results of water quality monitoring to USEPA for the biennial 303(d) list, sometimes called the Integrated List of Waters, or the Integrated Assessment. For this Technical Report, the states have provided the most recent bioassessment data they were able to share. Some state-by-state details are given in the sections below, and in the accompanying figures.
Present status is given by data from 87 individual assessments, performed between 2006 and 2009. Four grades of condition were reported: excellent condition, good condition, moderately degraded, and severely degraded. These grades were translated to excellent, good, fair, and poor for consistency with other states. The aggregated data are presented in Figure 7.1.5.3.
Present status is given by data from 1,993 assessments, spanning more than 20 years of time. Four grades of condition are reported: excellent, good, fair, and poor. The aggregated data are presented in Figure 7.1.5.4.
The Ambient Macroinvertebrate Network (AMNET) has produced several rounds of survey results for each of the state’s major basins. Four condition categories are used: excellent, good, fair, and poor. Present status is given by data collected since the previous report (Burke and Bright 2012). This includes two sampling events at stations in the Delaware River Basin: 2011-2013 (264 stations) and 2016-2018 (270 stations). The aggregated data are presented in Figures 7.1.5.5 and 7.1.5.6, respectively.
Present status is given by data from 107 stations, collected from 2014 -2019. Four grades of condition are reported: non-impacted, slightly impacted, moderately impacted, and severely impacted. These grades were translated to excellent, good, fair, and poor for consistency with other states, however in this report, no sites in the basin scored “poor”. The aggregated data are presented in Figure 7.1.5.7.
Delaware River Watershed Initiative (DRWI) data show a variety of water quality levels throughout the sub-watershed clusters. The assessments are based on 564 samples from 185 sites. The aggregated data are shown in Figure 7.1.5.8.

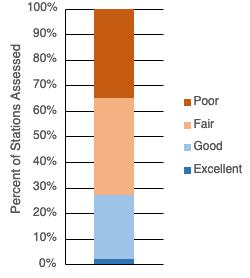
Figure 7.1.5.3 Bioassessment station data for Delaware’s Delaware River Basin from 87 individual assessments, performed between 2006 and 2009.
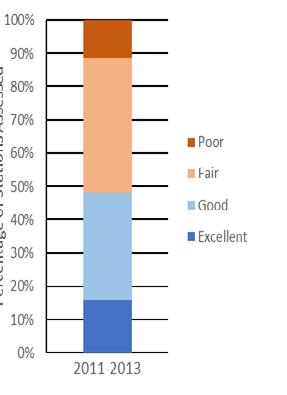
Figure 7.1.5.5 Bioassessment station data for New Jersey’s Delaware River Basin, AMNET program, 2011-2013.
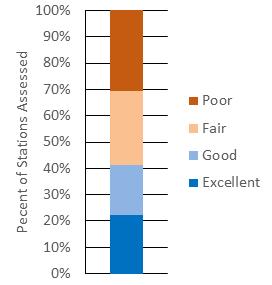
Figure 7.1.5.4 Bioassessment station data for Pennsylvania’s Delaware River Basin for 1,993 assessments.

Figure 7.1.5.6 Bioassessment station data for New Jersey’s Delaware River Basin, AMNET program, 2016-2018.

All data from the four basin states and the DRWI were compiled to evaluate biological condition at a basin-wide scale (Fig 7.1.5.9). Discrepancies in field and analytical methods between the basin states complicate direct comparison of IBI scores, however a qualitative comparison of the condition of macroinvertebrate communities is possible. Each state categorizes its biological assessments into four qualitative categories that describe the biological condition of the stream. As seen above, slight differences in terminology exist between the states so conditions were mapped to the following categories: Excellent, Good, Fair, and Poor. A biological condition was then calculated at the HUC12 sub-watershed scale by assigning values to the qualitative scores (Excellent=4, Good=3, etc.) and averaging the scores. Each HUC 12 sub-watershed was color coded based on condition (Excellent = 3.5-4, Good = 2.5-3.5, Fair = 1.5-2.5, Poor = 1-1.5).
An important assumption of this analysis is that each state’s qualitative interpretation of condition is the same (i.e., Excellent in PA describes a similar condition as Excellent in NJ). In reality, there may be differences in how each state categorizes its results which may lead to some bias in visual interpretation of the map. Additionally, the amount of available data can bias the results. For instance, in NY, each sub-watershed often contains only a single sampling point, which ultimately defines the condition for the entire unit.
Considering the Delaware River Basin as a whole, there may be some broad regional conclusions that can be drawn from the bioassessment data (Fig 7.1.5.9). New York is the state with the lowest percentage of low-scoring stations, and apparently the best overall condition. Delaware is the state with the highest percentage of low-scoring stations; and New Jersey and Pennsylvania are in

Figure 7.1.5.7 Bioassessment station data for New York’s Delaware River Basin sites, 107 stations, collected from 2014-2019.
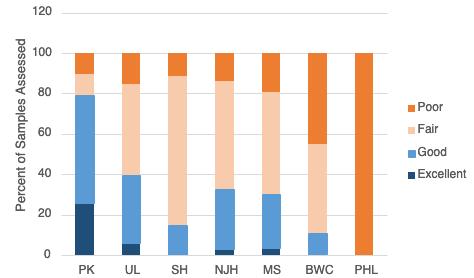
7.1.5.8 Bioassessment station data for the DRWI’s Delaware River Basin samples based on 564 samples from 185 sites.

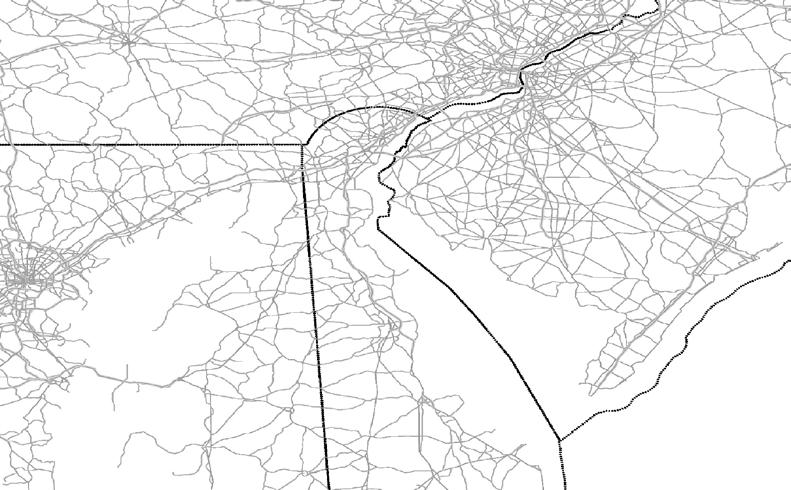


Figure 7.1.5.9 Biological condition complied using data from NJ, DE, NY, PA and the DRWI across the Delaware Estuary Basin.

between. These observations suggest that the condition of benthic macroinvertebrates is generally better in the upper portions of the Delaware River Basin, farther from the coast, and closer to “headwaters.” This corresponds to what may be expected based on a general understanding of water quality problems in this Basin. Good water quality is generally expected (hence macroinvertebrate quality) to correlate negatively with urban land cover, which is mostly in the Lower Basin, and positively with forested land cover, which is mostly in the Upper Basin.
The data suggest the above conclusions as though there were a basin-wide survey, however this is not exactly the case. The data presented in this report, particularly for the states of Delaware and Pennsylvania and for the DRWI, may not represent a random selection of sites, as would have been ideal if this had truly been a basin-wide survey of ambient conditions. In Pennsylvania this is due to the fact that the state has not yet completed a full survey of the Basin using their revised bioassessment protocol. In Delaware, the available data is skewed towards lower-quality waterways, which were prioritized for monitoring. For the DRWI, sites are chosen relative to on-the-ground projects, and are sampled to show if improvements can be observed with aggregation of these projects.
Benthic macroinvertebrate community condition is affected primarily by water quality and habitat disturbance. There are many reasons why conditions at a particular site may appear to be degraded. Furthermore, the Basin being discussed is large and diverse. For these reasons, it would probably be inappropriate to draw further conclusions from the data presented. When biomonitoring results cause a state agency to list a stream as “impaired,” the agency is supposed to attribute the impairment to a “source” and a “cause.” The Integrated List for each state contains information about these “source” and “cause” determinations for each listing, but the terminology that is used is complex. Because of this complexity, an attempt was not made to gather or analyze “source” and “cause” information for the present report. Readers who are interested in examining the sources and causes of impairments listed by the states are referred to the Integrated List documentation for Pennsylvania , New Jersey, and New York.
Monitoring of trends is one of the stated goals of the biomonitoring program in most of the states. However, trend detection is more easily said than done. Reporting trends is difficult at the present time because of the nature of the available data; in Delaware and Pennsylvania, sufficient data was not obtained to present any kind of trend. Several more years of work will be necessary before meaningful time series will be generated for Pennsylvania and Delaware. We can discuss trends for New Jersey, New York, and for the mainstem Delaware River (DRBC data), based on the collected data.
New Jersey New Jersey’s AMNET program has a dataset spanning over 20 years in the Delaware River Basin, with sampling conducted roughly once every 5 years. Data from three successive rounds of the AMNET program spanning 1995-2018 are presented. Data presented here shows 5 rounds completed to date. While there are fluctuations in the percentage of sites in each of the 4 condition categories round-to-round, no discernible trend is observed (Fig 7.1.5.10). In each round, the highest percentage of sites is in the fair category, with the majority being in the good-fair range. Also, most often, the lowest percentage of sites is in the poor range.
New York Over the years, New York has collected multiple rounds of data for a certain number of stations in the Delaware River Basin. In 2004, the state published a report entitled “30-Year Trends in Water Quality of Rivers and Streams in New York State Based on Macroinvertebrate Data, 1972-2002.” (The report is available online at https://nysl.ptfs.com/data/Library1/98990.pdf). That report compared the results of surveys conducted between 1992 and 2002 to an earlier set of data collected before 1992.


Figure 7.1.5.10 Bioassessment data for three successive rounds of New Jersey’s AMNET program in the Delaware River Basin, 1995-2008.
For the present report, the recent data (2003 – 2010) was compared to the data from the 1990s that appears in the state’s “30-Year Trends” report. The comparison reveals that the changes that occurred from the 1990s to the 2000s were very small. The total number of stations with assessment data in both decades was 37. Of those, 28 scored the same both times, while 9 scored differently. Five stations changed from “non-impacted” to “slightly impacted,” and four others changed from “slightly impacted” to “non-impacted.” Thus, the overall difference in the Basin appears to be very small. Figure 7.1.5.11 presents this comparison as a chart.
DRBC Because DRBC’s sampling team has returned to the same stations for several years on a regular basis, their data set appears to offer an opportunity to look at bioassessment data in a time series. Some of these data are presented as a chart in Figure 7.1.5.12. Data is presented from 25 stations, collected between 2008 and 2017. Stream condition is shown as the percentage of sites meeting DRBC’s IBI threshold for attainment of aquatic life use. Sites are grouped by DRBC Water Quality Zone and year to visualize trends spatially and temporally. Spatially, macroinvertebrate communities in the upper river (Zone 1a) almost always indicate high water quality. Moving downstream, the proportion of sites meeting DRBC’s IBI threshold for attainment of aquatic life use decreases. Temporally, there is year-toyear variability, but it appears that there are no clear trends.
DRBC’s technical staff believe that some of the variability observed here can be attributed to particular events or conditions. It is thought that a severe summer drought or a major flood can affect aquatic life enough to produce anomalous scores using the bioassessment metrics and index.
The future condition of the benthic macroinvertebrates in the Delaware River Basin can be expected to follow the various causes of waterway impairment. Any attempt to project future conditions in the Basin would be speculative, particularly in light of the challenges of determining past trends from macroinvertebrate data.

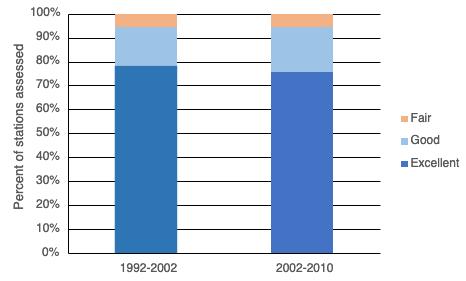
Figure 7.1.5.11 Bioassessment station data for New York’s Delaware River Basin sites. The same 37 sites were sampled in each time period, 1992-2002 and 2002-2010.

Figure 7.1.5.12 DRBC bioassessment data for mainstem Delaware River by Water Quality Zone from 2007 - 2017.

The Delaware River Basin has received increased investments to maintain and improve water quality and ecosystem health over the past decade through private and public funding sources. Most notably, the Delaware River Basin Act allocates funding for restoration, protection, monitoring and research through congressional approval each year. Nonetheless, the data and associated information indicate that urban areas are still impacted by Combined Sewage Overflows and a lack of tertiary treatment of wastewater to remove nutrients. Non-point source pollution, especially runoff of stormwater and nutrients, continues to affect streams of all sizes in the watershed, but several federal, state and regional programs are working to reduce these inputs. Changing development patterns have led to increased populations and associated urban lands in forested areas throughout the Basin. Therefore, attention must continue to be paid to changing water quality and ecosystem health, and measures to protect and restore the Basin’s waterways are needed to ensure these natural resources remain intact for future generations.
Bioassessment of macroinvertebrates is a well-established practice in state environmental agencies, and it may be expected to continue for the foreseeable future. Bioassessment has become a core element of the regulatory system for protecting water quality in the United States. Over time, it may be expected that the uses of bioassessment data will be refined as the datasets grow and as organizations gain experience with the interpretation of information produced. While small and often unknown to the general public, macroinvertebrates provide an important contribution to streams as a food source to fish and other predators, among other functions. Macroinvertebrate communities indicate stream health on local and watershed levels, making them the indicator most used to designate stream quality in state assessment programs. Macroinvertebrate data are used in conjunction with water chemistry, habitat assessments, diatom and fish community data to identify stream characteristics, ecosystem conditions, and potential sources of disturbance.
Benthic macroinvertebrates are a diverse and important natural resource. They are well known to people who are concerned with water quality and watershed health, but ignored or taken for granted by most people in the general public. Macroinvertebrates are not normally considered for specific management actions of any kind. The management actions that affect benthic macroinvertebrates are essentially the same management actions that affect water quality and aquatic habitats. It is expected that macroinvertebrates can be allowed to thrive by preventing water pollution and by protecting or restoring natural habitat conditions in waterways.
The authors would like to thank Jenny Shinn from Rutgers University, Haskin Shellfish Research Laboratory for coordinating the collaborative writing process, Bryan Duffy and Meredith Streeter from the New York State Department of Environmental Conservation, Division of Water, Stream Monitoring and Assessment for contributing data for the report, and the numerous field, laboratory, and administrative collaborators who collected and processed samples, entered data and coordinated this work.

Barbour, M.T., J. Gerritsen, B.D. Snyder, and J.B. Stribling. 1999. Rapid Bioassessment Protocols for Use in Streams and Wadeable Rivers: Periphyton, Benthic Macroinvertebrates and Fish, Second Edition. USEPA 841- B-99-002. U.S. Environmental Protection Agency, Office of Water, Washington, D.C.
Burke, D., G. Bright. 2012. “Chapter 6.12 - Macroinvertebrates” in the Technical Report for the Delaware Estuary and Basin. Partnership for the Delaware Estuary. PDE Report No. 17-07, pp. 283298.
Kroll, S.A., R. Abell, 2015. Points of Departure: Baseline Conditions in the Subwatershed Clusters of the Delaware River Watershed Initiative, Academy of Natural Sciences of Drexel University, 65 pp. http://www.ansp.org/~/media/Files/ans/research/pcer-other/Points%20of%20Departure.ashx?la=en.
Kroll, S.A., R.J. Horwitz, D.H. Keller, B.W. Sweeney, J.K. Jackson, L.B. Perez, 2019. Large-scale protection and restoration programs aimed at protecting stream ecosystem integrity: The role of science-based goal-setting, monitoring, and data management. Journal of Freshwater Science 38(1): 23-39.
Kroll, S.A., H.C. Oakland, A.M. Frohn, 2021. Macroinvertebrate and diatom indicators of ecosystem integrity for setting targets in agricultural BMP restoration. Ecosphere, doi:10.1002/ecs2.3798
Pulket, M. (editor), 2017. Wadeable multihabitat macroinvertebrate assessment method. Chapter 2.3, pages 36–45 in D. R. Shull, and R. Whiteash (editors). Assessment methodology for streams and rivers. Pennsylvania Department of Environmental Protection, Harrisburg, Pennsylvania.
Shull, D. R. (editor), 2017. Wadeable freestone riffle-run stream macroinvertebrate assessment method. Chapter 2.1, pages 2–24 in D. R. Shull, and R. Whiteash (editors). Assessment methodology for streams and rivers. Pennsylvania Department of Environmental Protection, Harrisburg, Pennsylvania.
Shull, D. R., 2018. Semi-wadeable large river macroinvertebrate assessment method. Chapter 2.4, pages 46–74 in D. R. Shull, and R. Whiteash (editors). Assessment methodology for streams and rivers. Pennsylvania Department of Environmental Protection, Harrisburg, Pennsylvania.
U.S. Environmental Protection Agency, 1997. Field and Laboratory Methods for Macroinvertebrate and Habitat Assessment of Low Gradient, Nontidal Streams. Mid-Atlantic Coastal Streams (MACS) Workgroup, Environmental Services Division, Region 3, Wheeling, WV, 23 pp.
Williams, A. (editor), 2017. Wadeable freestone riffle-run stream macroinvertebrate assessment method. Chapter 2.2, pages 25–35 in D. R. Shull, and R. Whiteash (editors). Assessment methodology for streams and rivers. Pennsylvania Department of Environmental Protection, Harrisburg, Pennsylvania.
Delaware Department of Natural Resources and Environmental Control, 2008. State of Delaware 2008 Combined Watershed Assessment Report (305(b)) and Determination for the Clean Water Act Section 303(d) List of Waters Needing TMDLs. Delaware Department of Natural Resources and Environmental Control. 204 pp.

Technical Report for the Delaware Estuary and Basin Partnership for the Delaware Estuary— Host of the Delaware Estuary Program December 2022 | Report No.22-05
Delaware River Basin Commission, 2010. 2010 Delaware River and Bay Integrated List Water Quality Assessment. Delaware River Basin Commission. 52 pp.
New Jersey Department of Environmental Protection, 2010. 2010 Integrated Water Quality Monitoring and Assessment Methods. (Appendix F of the 2010 New Jersey Water Quality Monitoring and Assessment Report). New Jersey Department of Environmental Protection. 79 pp.
New Jersey Department of Environmental Protection, 2007. Standard Operating Procedures, Ambient Biological Monitoring Using Benthic Macroinvertebrates. New Jersey Department of Environmental Protection. 44 pp.
New York Department of Environmental Conservation, 2009. The New York State Consolidated Assessment and Listing Methodology. New York Department of Environmental Conservation. 23 pp.
Lookenbill, M. J., and R. Whiteash (editors), 2021. Water quality monitoring protocols for streams and rivers. Pennsylvania Department of Environmental Protection, Harrisburg, Pennsylvania.
Shull, D. R., and R. Whiteash (editors), 2021. Assessment methodology for streams and rivers. Pennsylvania Department of Environmental Protection, Harrisburg, Pennsylvania.
Pennsylvania Department of Environmental Protection, 2022. 2022 Pennsylvania Integrated Water Quality Monitoring and Assessment Report, Clean Water Act, Section 305(b) Report and 303(d) List. Pennsylvania Department of Environmental Protection, Harrisburg, Pennsylvania.

Introduction
Osprey (Pandion haliaetus; Fig 7.2.1.1) are found on all continents except Antarctica. This large bird of prey has regained a prominent position in the Delaware Estuary after having experienced dramatic population declines in the mid-20th century particularly associated with environmental contaminants.
Osprey typically arrive in the Delaware Estuary in mid to late March and begin nesting in April (Hess et al. 2000, Wurst and Clark 2021). Nest sites include live or dead trees but they have particularly adapted to nesting on artificial structures such as nesting platforms, utility poles, channel markers, and duck blinds (Poole et al. 2002). Nests are comprised of sticks and other materials opportunistically found and individual nests can be used for many years as they gradually increase in size.
Nestlings fledge in the summer and join adults migrating south in early September. Wintering likely occurs mostly in the Caribbean and South America for osprey nesting in the Delaware Estuary (Martell et al. 2001).
Osprey occur near water where they feed almost exclusively on fish that make up 99% of their diet (Poole et al. 2002). Osprey are highly adapted for opportunistically capturing a variety of species of fish common in the Delaware River watershed such as menhaden and summer flounder. Some of their adaptations include oily feathers to reduce water absorption, nostrils that can shut when in water, and spines on their toes along with a reversible outer toe to help them keep a secure grip on fish. At times osprey may plunge nearly completely underwater in pursuit of their prey but are generally restricted to foraging on fish near the surface. Therefore, they are most concentrated in areas where there are abundant fish in shallow water or schooling fish near the surface and are able to forage more effectively in calm sunny weather.
Bald eagles (Haliaeetus leucocephalus) and great horned owls (Bubo virginianus) are known to take fledgling osprey and raccoons (Procyon lotor) occasionally take eggs (Poole et al. 2002). Raptors and other birds will take over osprey nests as their own nesting sites. Bald eagles also often rob osprey of the fish they have caught.
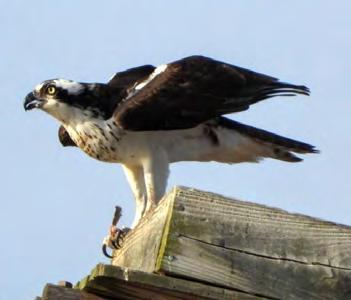


New Jersey, Delaware, and Pennsylvania have osprey monitoring and conservation programs. Nest checks by ground observers are conducted to determine active nests and productivity between the end of April and mid-July. Every five years more comprehensive surveys may be done including aerial observation of nests. Each state works independently on their monitoring programs with their own protocol and therefore the reported data upon which this indicator is based vary in type and quality. Delaware Division of Fish and Wildlife has relied mostly on volunteer monitoring since 2014 and does not count all nests in the State but does examine productivity of selected nests. New Jersey Division of Fish and Wildlife staff in partnership with the Conserve Wildlife Foundation of New Jersey perform ground surveys and also rely on citizen scientist Osprey Watchers to monitor some nests from a distance and have the most data on osprey in the watershed. Pennsylvania has been developing a database of known osprey nests. The Pennsylvania Game Commission relies on a combination of staff observations and citizen scientist Osprey Watchers.
The data sets gathered by the states, although limited and not inclusive of all nesting activity, do suggest a generally positive trend for the number of active nests and productivity. Figure 7.2.1.2 shows data for New Jersey, Figure 7.2.1.3 for Pennsylvania and Tables 7.2.1.1 and 7.2.1.2 show data for Delaware.
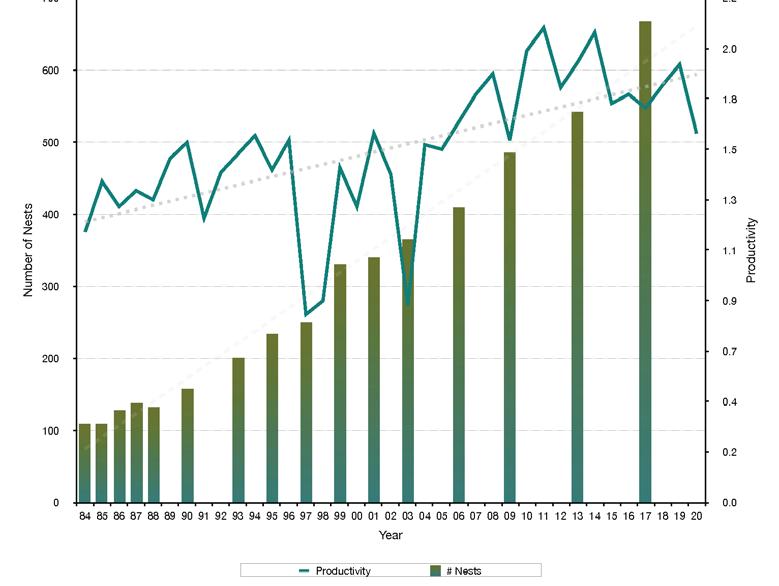
Figure 7.2.1.2 New Jersey State-wide osprey nesting population (bars) and productivity (line) 1984-2021 (Wurst and Clark 2022).

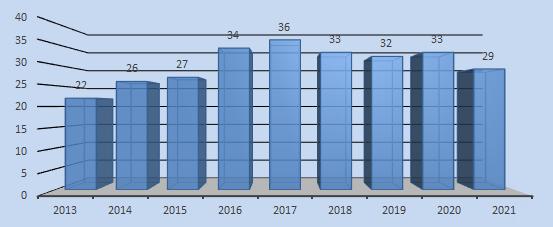
Figure 7.2.1.3 Pennsylvania active osprey nests 2013-2021 in the Delaware River watershed from Northampton County to Delaware County (Morgan and Barber 2021: unpublished report).
Table 7.2.1.1 Delaware state-wide osprey nest surveys 2003, 2007, and 2014 (DE DFW 2014: unpublished report). Active nests are those where eggs or chicks were seen in a nest during at least one survey, Successful nests are those in which at least one chick reached banding age, and Chicks refers to the number observed in the nest during any survey.
Table 7.2.1.2 Delaware volunteer osprey nest monitoring project 2014–2020 (Brown and Robinson, 2020: unpublished report). Active nests are those with eggs or chicks confirmed (includes incubating posture) and Chicks refers to the number of successfully fledged chicks.

Osprey appear to be doing well in the Delaware Estuary and are a noteworthy conservation success story for the area. New Jersey still lists osprey as threatened, but Pennsylvania and Delaware no longer do. Productivity, as measured by fledglings observed, consistently appears to be higher than needed for a stable population. For example, New Jersey that has the largest dataset between the three states, has seen productivity rates over 0.80 (the minimum needed for a stable population) every year data was collected since 1997 (Wurst and Clark 2022).
Population levels may be at least back to what is believed to have been the level prior to the widespread use of dichlorodiphenyltrichloroethane (DDT)(Henny et al. 2010). Studies of osprey eggs and diet and water quality show that the birds continue to be exposed to environmental contaminants. These include legacy contaminants, such as PCBs and DDT, and more novel contaminants, such as pharmaceutical ingredients, but the exposures are below levels believed to warrant concern (Bean et al. 2018, Rattner et al. 2018).
Historically abundant, osprey populations declined precipitously in the Northeast from the 1950s through the 1970s due exposure from DDT, from widespread use to control mosquitoes, and other contaminants that enter the osprey food chain and consequently impact breeding success of ospreys (Henny et al. 2010, Bierregaard et al. 2014). The location of osprey at the top of the aquatic food chain means they can be exposed to high concentrations of contaminants that have been biomagnified through their food chain from relatively low concentrations in the sediment and water column. Delaware Estuary populations remained somewhat depressed into the 1990s partly due to high organochloride levels still in the system, such as polychlorinated biphenyls (PCBs) and legacy concentrations of the metabolites of DDT, but since then levels of organochlorides have gradually lowered allowing productivity to improve. Additionally, in the 19th and into the mid early 20th century, osprey were shot, their nests were destroyed, or their eggs were collected far more often than now (Bierregaard et al. 2020).
The outlook for osprey continues to be good in the Delaware Estuary and they are expected to continue to rebound and thrive. Osprey adapt well to some anthropogenic disturbance, such as moderate coastal development and boat traffic. As long as nesting sites remain, fish populations do well, and novel contaminant threats are not created, osprey should sustain population levels currently observed.
Osprey have shown flexibility for nesting structures. However, the most common nesting structure for osprey in the estuary are nesting platforms put up specifically for them. These structures are susceptible to collapse especially as nests increase in weight over years (Wurst and Clark 2021) or with the possibility of increased storm intensity associated with climate change. Continued installation and especially maintenance of nesting platforms will ensure a continued robust population. For example, New Jersey generally is not installing new nesting platforms to increase the population further but is working to maintain the existing platforms to maintain the current robust population (Wurst and Clark 2022). New platforms are now mostly installed only when a current nest must be relocated from an unsuitable structure in New Jersey.
Contaminants likely to biomagnify into osprey have declined in the estuary and in the osprey and their eggs. However, due to their reliance on fish, osprey will continue to potentially be exposed to

some concentrations of legacy contaminants, such as PCBs and DDT metabolites, as well as novel contaminants in the water and sediment through their prey. We do not yet fully understand the impact of some of these contaminants and therefore osprey warrant continued observation (Bierregaard et al. 2014).
Volunteers are needed for monitoring nests and productivity. Due to limited resources, the states do not know of all nests or track productivity of all known nests. More support for these programs will enhance the current data sets to further indicate osprey population health in the watershed. Those interested in volunteering, establishing nesting structures, reading more detailed reports or that have questions about osprey should contact the State agencies responsible for osprey conservation:
NJ: http://www.conservewildlifenj.org/protecting/projects/osprey/
DE: https://dnrec.alpha.delaware.gov/fish-wildlife/conservation/osprey-monitoring/
PA: https://www.pgc.pa.gov/InformationResources/GetInvolved/Pages/OspreyNestSurvey.aspx
Summary
Osprey populations in the Delaware Estuary are a success story. They demonstrate the value of reducing contaminants in our environment and taking conservation actions. The success of osprey conservation and the continued monitoring of the populations shows how volunteers can work with the states to make a difference in the estuary.
Bean T.G., B.A. Rattner, R.S. Lazarus, D.D. Day, S.R. Burket, B.W. Brooks, S.P. Haddad, and W.W. Bowerman. 2018. Pharmaceuticals in water, fish and osprey nestlings in Delaware River and Bay. Environmental Pollution 232:533-545. https://doi.org/10.1016/j.envpol.2017.09.083
Bierregaard, R.O., A.F. Poole, and B.E. Washburn. 2014. Ospreys (Pandion haliaetus) in the 21st Century: Populations, migration, management, and research priorities. Journal of Raptor Research 48(4):301-308. 2014. http://dx.doi.org/10.3356/0892-1016-48.4.301
Bierregaard, R.O., A.F. Poole, M.S. Martell, P. Pyle, and M.A. Patten. 2020. Osprey (Pandion haliaetus), Version 1.0. In P.G. Rodewald (Ed.), Birds of the World. Cornell Lab of Ornithology, Ithaca, NY, USA. https://doi.org/10.2173/bow.osprey.01
DE DFW. 2014. Final Report: Delaware Osprey Monitoring Program Report. Unpublished report. Delaware Division of Fish and Wildlife, Dover.
Henny, C.J., R.A. Grove, J.L. Kaiser, and B.L. Johnson. 2010. North American osprey populations and contaminants: Historic and contemporary perspectives. Journal of Toxicology and Environmental Health, Park B 13:579-603. https://doi.org/10.1080/10937404.2010.538658
Hess, G.K., R.L. West, M.V. Barnhill, and L.M. Fleming. 2000. Birds of Delaware. University of Pittsburgh Press, Pittsburgh.
Martell, M.S., C.J. Henny, P.E. Nye, and M.J. Solensky. 2001. Fall migration routes, timing, and wintering sites of North American ospreys as determined by satellite telemetry. The Condor 103: 715-724. https://doi.org/10.1093/condor/103.4.715

Morgan, J. and P. Barber. 2021. Draft summary of 2021 osprey nesting in Pennsylvania’s Southeast Region. Unpublished report. Pennsylvania Game Commission Bureau of Wildlife Management. August 2021.
Poole, A.F., R.O. Bierregaard, and M.S. Martell. 2002. Osprey. Number 683. In A. Poole and F. Gill (Eds.). The Birds of North America. The Birds of North America, Inc., Philadelphia, Pennsylvania.
Rattner, B.A., R.S. Lazarus, T.G. Bean, P.C. McGowan, C.R. Callahan, R.A. Erickson, and R.C. Hale. 2018. Examination of contaminant exposure and reproduction of ospreys (Pandion haliaetus) nesting in Delaware Bay and River in 2015. Science of the Total Environment 639:596-607. https://doi. org/10.1016/j.scitotenv.2018.05.068
Brown, J. and S. Robinson. 2020. Delaware Citizen Osprey Monitoring Program Data Summary. Unpublished report. Delaware Division of Fish and Wildlife, Dover.
Wurst, B. and K. Clark. 2021. 2020 New Jersey osprey project report. Kathleen Clark, NJ Division of Fish and Wildlife - Endangered and Nongame Species Program and Benjamin Wurst, Conserve Wildlife Foundation of New Jersey. February 5, 2021. https://www.nj.gov/dep/fgw/ensp/pdf/osprey20.pdf
Wurst, B. and K. Clark. 2022. 2021 New Jersey osprey project report. Kathleen Clark, NJ Division of Fish and Wildlife - Endangered and Nongame Species Program and Benjamin Wurst, Conserve Wildlife Foundation of New Jersey. April 2022.

In 2012, the National Marine Fisheries Service declared the New York Bight Distinct Population Segment of Atlantic sturgeon to be endangered. The Delaware River spawning stock is part of this “population segment” and is officially considered Endangered under the Endangered Species Act. The Delaware River population of Atlantic sturgeon has been determined to be genetically similar to those of the Hudson River, but through range-wide genetic analysis of nuclear DNA, at least 6 sub-populations were suggested including one for the Delaware River distinguishable from the Hudson River stock (King et al. 2001).
During the late nineteenth century, the fishery for Atlantic sturgeon peaked. The Delaware River landings were an order of magnitude higher than landings from all other estuaries and rivers combined. One estimate based on these landings was that the Delaware River spawning stock included 180,000 mature females (Secor 2002). Secor estimated the next highest stock as 20,000 females for the entire Chesapeake Bay. This past abundance suggests that the Delaware may still have the potential to produce a large population of sturgeon.
Mature Atlantic sturgeon migrate from the sea to fresh water in advance of spawning. In the Delaware River, first-maturing females are likely to be at least 15 years old. Males can be somewhat younger at first spawning. Spawning occurs in flowing fresh waters with a hard bottom. Shed eggs are 2-3 mm in diameter and become sticky when fertilized. They frequently become attached to hard substrates or submerged detritus until hatching in several days. After hatching occurs, juveniles (Fig 7.2.2.1) remain in fresh water for several years but have been documented to out-migrate to coastal areas in their 3rd year. Sweka et al. (2006), found that juvenile sturgeon preferred soft bottom habitats at depths greater than 6.3 meters in the Hudson River. Once juveniles out-migrate from their natal river they are known to frequent distant estuary systems (Secor et al. 2000); tagged age-0 fingerlings stocked in the Hudson River in 1994 were found in the Chesapeake and Delaware Bays in 1997 (Bain 1998).
Mature individuals also frequent estuaries distant from their natal river. Studies performed in the Hudson River using pop-up satellite archival tags showed that the majority of adult Atlantic sturgeon captured and tagged in the Hudson during spawning season eventually outmigrated to the mid-Atlantic Bight; one individual, however, traveled north to the Bay of Fundy and another went south to coastal Georgia (Erickson et al. 2011). Mature Atlantic sturgeon are of great potential commercial value for both flesh and roe, the latter being known as caviar. Although there is an occasional report of Atlantic sturgeon caught with rod and reel, the species is not known for recreational fishing importance.
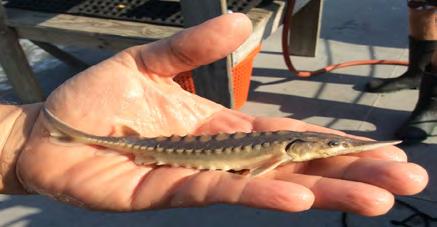
The primary indicator, which monitors the annual production of young sturgeon in the tidal Delaware River, is the mean catch per unit of effort (CPUE) of young sturgeon from the small-mesh gill net survey conducted by the Delaware Division of Fish and Wildlife (Park 2020).; specifically it is the mean catch per hour per square meter of gill net (Fig 7.2.2.2). The survey employs four gill nets 91.5 meters long and 2.4 meters deep; two of these consisted of 5.1 cm stretch mesh and two consisted of 7.6 cm stretch mesh. The nets were constructed from 0.33 mm diameter clear monofilament, with a 29.5 kg/182.9 m lead

line and a 1.3 cm foam core rope with floats every 4.57 meters. Sampling was conducted at least twice a week from October through December and was weather dependent. Anchor nets were set diagonal to the current approximately 45 minutes prior to slack tide and pulled at the onset of the next tide. Sampling was limited to slack tide due to strong tidal currents.
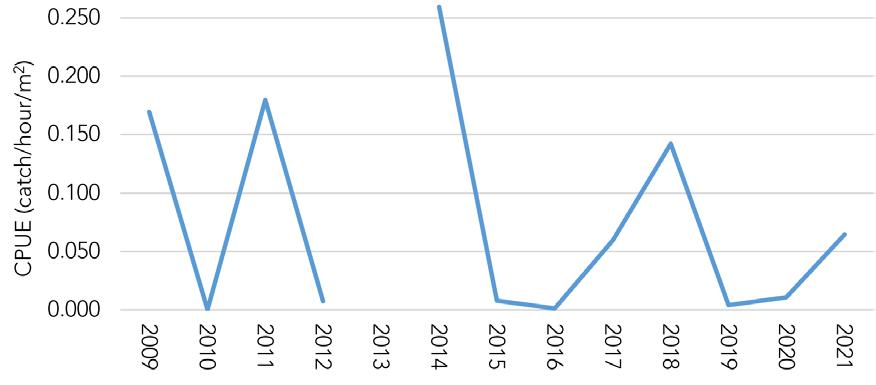

Figure 7.2.2.2 Primary indicator. Relative abundance trend of age 0 Atlantic Sturgeon in the Delaware River. The indices are the catch per unit effort in small mesh gill-nets set in the tidal Delaware River.
The secondary indicator is the relative abundance index of larger juvenile and some adult sturgeon from by the Delaware Division of Fish and Wildlife’s Adult Groundfish research trawl survey, which is conducted monthly from March through December at nine fixed sites in the Bay (Fig 7.2.2.3). The Division conducts the survey on the sixty-two-foot-long (19 meters) research vessel, the “First State”. An otter trawl with a thirty-foot, six-inch (9.3 m) long headrope is towed along the bottom. Nine sites are sampled each month from March through December. The index of abundance is the mean catch-pertow (cpt) of Atlantic sturgeon over the course of each year.
Recent results from the primary indicator, the small-mesh gill-net survey conducted with similar effort annually since 2014 (Fig 7.2.2.2), showed high abundance in 2014 and 2018, with lower levels in other years. The 2016 index was almost certainly reduced by the overlapping of the gill net survey that year with a sturgeon relocation project conducted for the U. S. Army Corps of Engineers Sturgeon Relocation Project (280 sturgeon relocated fall of 2016 – all numbers refer to Atlantic sturgeon relocated; data provided by Environmental Research and Consulting, Inc). That project was part of the larger project to deepen the shipping channel in the River right in the reach that is a favored location for young sturgeon, near Marcus Hook and the Pennsylvania-Delaware border. Bedrock in the navigation channel had to be fractured using a drilling and blasting technique. In order to reduce possible mortality of sturgeon caused by blasting used to deepen the channel, the Corps contracted with a commercial fishing vessel to trawl the channel to capture sturgeon and then relocate them up river. With its large net (almost three times larger than the net used for the Delaware Division of Fish and Wildlife’s Delaware Bay research groundfish trawling), the trawler was effective at capturing sturgeon.
Some of the relocated sturgeon had been tagged, and some of them returned and were then caught a

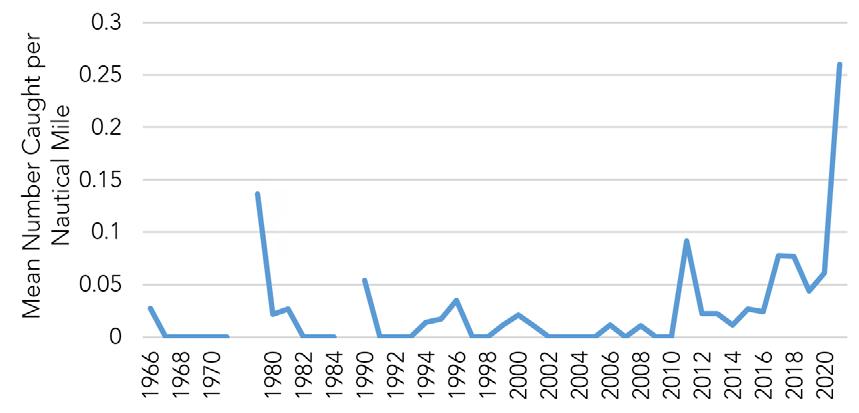
Figure 7.2.2.3 Secondary indicator. Relative abundance trend of older juvenile and adult Atlantic Sturgeon based on the mean number caught per nautical mile by the Delaware Division of Fish and Wildlife’s Adult Fish Trawl Survey in Delaware Bay (M. Greco, DDFW, personal communication). The survey has been conducted from 1966 through 1971, 1979 through 1984 and 1990 through the present. The survey design varied between periods and within periods prior to 1990. Survey sampling gear was consistently an otter bottom trawl with a thirty-foot headrope.
second time at the Marcus Hook area, substantially downriver from where they were released, upstream of Philadelphia. Consequently, it was difficult to estimate a reduction in the gill net survey in the fall catch from a relocation the previous winter.
The relocation project operated from 2016 through 2020 during fall and winter. In 2017, the index of abundance was based on the gill-net survey operation prior to the trawling operation in November (fall 2017- winter 2018: 3,211 sturgeon relocated). No trawling was conducted during the fall of 2018, but there was extensive trawling during the winter of 2019 (1,355 sturgeon relocated). A minimal amount of trawling was conducted in the fall of 2019 and the winter of 2020 (170 sturgeon relocated)
A potential cause of the relatively low young-of-year index in 2015, 2019, and 2020 could be mortality of young sturgeon due to hypoxia. Kahn and Fisher (2012) combined earlier relative abundance estimates from this survey with data collected by the United States Geological Survey on temperature and oxygen content of the river. They developed a hypoxia hypothesis that years with low levels of dissolved oxygen (DO) in the nursery area of the river have caused high mortality of young-of-year sturgeon, which is reflected in relatively low relative abundance indices in the gill net survey in those years.
The current Delaware River Basin Commission’s (DRBC) criteria for dissolved oxygen, enacted in 1967, is only 3.5 mg/liter as an average over a 24 hour period, meaning the DO level can drop below that level for several hours and still meet the 24 hour average criteria. When river temperatures increase in July and August to as much as 30 ˚C., 3.5 mg/L is only 40% oxygen saturation, which is considered hypoxia. Consequently, the current DRBC oxygen criteria allows for hypoxic conditions, which laboratory tests have shown reduces survival, especially of young-of-year sturgeon at high temperatures (Niklitschek and Secor 2009). At this time of year, young-of-year sturgeon are only one to two months old.
Recent data seems consistent with the hypoxia hypothesis. In 2015, DO saturation registered below

50%, and in 2019, 2020 and 2021 DO saturation levels reached as low as 40% in an area of the river from at least Chester, PA to Philadelphia, PA (Fig 7.2.2.4). Relative abundance was very low in 2019 and 2020, and was low in 2021 (Fig 7.2.2.2). Juvenile sturgeon collected in 2019 were also smaller than those collected in other years, suggesting that low oxygen conditions or the increase in salinity observed that year may have had a negative effect on growth rate, as well as survival, as reported by Niklitschek and Secor (2009).
An alternative explanation of fluctuations in the relative abundance of young-of-year sturgeon is that spawning and hatching success vary markedly among years. This could be due to fluctuations in the number of spawning adults, or due to combined effects of various environmental factors such as timing of fluctuations of flow, weather events and temperature. In either case, if such random effects of spawning density or environmental variables are the cause of variation in relative abundance of young-of-year sturgeon, no obvious correlation between relative abundance and dissolved oxygen levels would be expected. As the data collection proceeds, a test of the hypoxia hypothesis will be feasible.
A recent estimate of total abundance of juvenile sturgeon of ages 0-1 years in the Delaware River was presented by Hale et al. 2016. Utilizing tag-recapture methods, they estimated abundance in 2014 as 3,656 (95% CI = 1,935–33,041), and abundance in 2018 was estimated to be 5,846 (95 CI = 2,394-14,446) (Park 2020). We are seeing high variability, with estimates of abundance between the low thousands and fifteen thousand annually. While trawling was not conducted in 2014, these numbers are roughly comparable to the numbers collected during the relocation project.
Hale et al. also tracked locations of ages 0-1 sturgeon using acoustic tags during 2014. They located these young fish in concentrations centered on the Delaware-Pennsylvania border, specifically the Marcus Hook anchorage, the Cherry Island Flats adjacent to Wilmington, and the Chester Range of the river and nearby areas.
Acoustic tracking continued in 2015-2019, and similar results were obtained (Park 2020). Marcus Hook is the prime nursery location. The deep Marcus Hook reach is the location of the Marcus Hook Anchorage, which can often be identified visually because tankers frequently are anchored in the river there.
The secondary indicator has shown a consistently increasing trend in abundance of sub-adults in the Bay (Fig 7.2.2.3, M. Greco, Delaware Division of Fish and Wildlife, personal communication), building upon a similar but lower trend, reported in the 2017 Technical Report on the Delaware Estuary (Kahn 2017). Sturgeon caught in this trawl survey may be from other spawning stocks, since sturgeon are known to wander the Atlantic coast, entering various estuaries. However the sharp increase in catch in 2021 coincides with the large year class documented in 2018, since the lengths of many of the sturgeon collected in the trawl survey were that of three-year olds.
During the last decade, there has been about a doubling of reports to the Delaware Division of Fish and Wildlife of sturgeon carcasses in the Delaware estuary compared to the previous decade. Brown and Murphy (2010) initially documented the appearance of carcasses in the Bay and River. Most carcasses bear evidence of propeller strikes from ships. The recent increase may, in part, have been caused by an increased reporting rate, since the Division has conducted a campaign directed at anglers by requesting reports of observed sturgeon mortalities. Another likely cause of this increase in reported carcasses is the apparent increase in abundance of larger sturgeon indicated by the Division’s research trawl survey (Fig 7.2.2.3).
Researchers at Delaware State University have worked with the Division to investigate these reports. Sixty-one percent of the carcasses that were measured through 2019 were of adult length (over 1500 mm; approximately 5 feet). In 2020, for example, nine carcasses were reported to the Division, of which

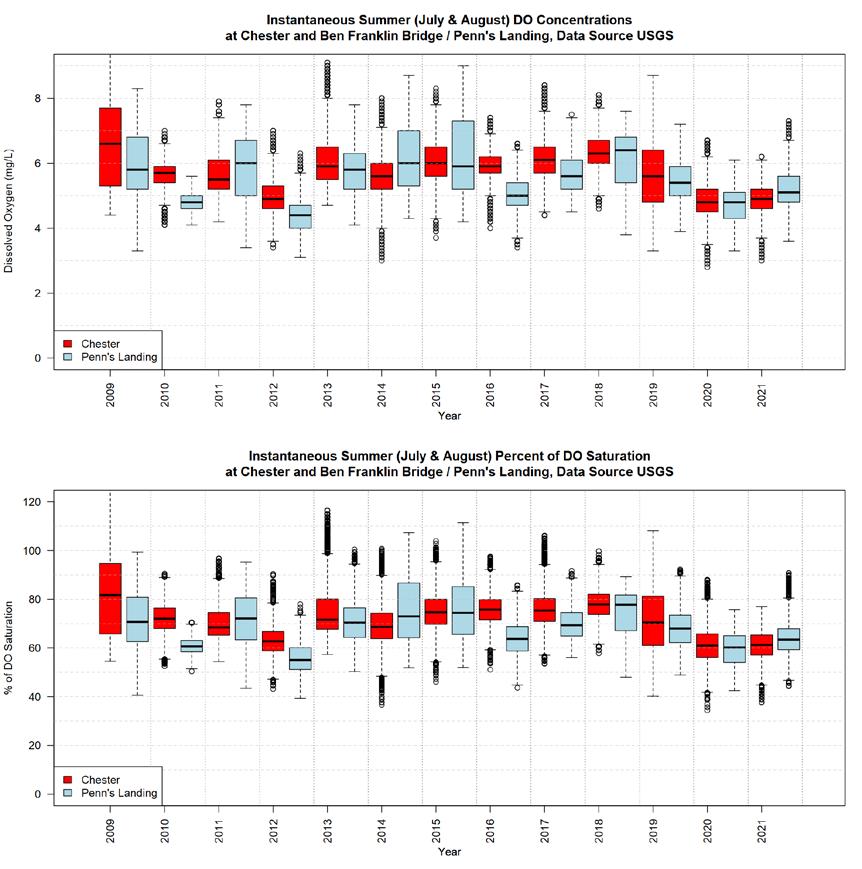
Figure 7.2.2.4 Dissolved oxygen readings conducted by the United States Geological Survey in the tidal Delaware River from 2009 through 2021 during July and August, based on two separate dissolved oxygen meters. One meter is located at Chester, Pennsylvania and the other was at the Benjamin Franklin Bridge in Philadelphia until it was moved the Penns’s Landing in central Philadelphia. Measurements were conducted every 30 minute or every 15 minutes. The solid line in each box is the median value. The upper and lower boundary of each box represent the upper and lower quartiles of the measurements, respectively. The length of the box is known as the interquartile range. The dashed lines are drawn from the top of each box to the largest observation within 1.5 interquartile ranges of the top and conversely a dashed line is drawn from the bottom of each box to the smallest observation within 1.5 interquartile ranges of the bottom. The chart was provided by John Yagecic, Delaware River Basin Commission.

six appeared to have been killed by ship strikes; eight of these were measured and half appeared to be of adult size (Park 2021). There has been concern expressed that this mortality from ship strikes can repress the ability of the stock to rebuild.
Heavy fishing in the late nineteenth century in the lower tidal river probably caused a decline in the population, although no data or analysis documents that hypothesis. The production of eggs from mature females was high enough that a railroad line was constructed to Delaware City, Delaware to haul the eggs, which were held in barrels. They were apparently shipped to Russia for processing into caviar.
The failure of the stock to recover during the twentieth century is likely to be due to sturgeon’s sensitivity to oxygen levels and the depletion of oxygen in the Delaware. Sturgeon have been described as more sensitive to oxygen levels than rainbow trout (Klyashtorin 1982). Webster et al. (1914) reported an oxygen reading in Philadelphia of only 1 mg of oxygen per quart of water. In 1946, Ellis et al. (1947) found dissolved oxygen (DO) levels less than 2.0 mg/l for thirty-five to forty miles of the River in spring and fall from Pennsville, NJ, 6 miles below Wilmington to several miles above Philadelphia. Sharp (2010) in a comprehensive review of hypoxia in the river, reports data and estimates of oxygen levels from 1880 to 2005.
The method of using small-mesh gill nets to monitor young-of-year sturgeon (the primary indicator) was only introduced in 2008 by Fisher (2009). There is no indication from this indicator of an increasing trend in abundance of young sturgeon in the river; in fact, the survey shows reduced abundance from 2015 on. The interference of the sturgeon relocation project clouds this picture for some years; the capture of hundreds to thousands of young sturgeon by the relocation project, however, verifies that substantial levels of reproduction have been occurring consistently.
The secondary indicator (Fig 7.2.2.3) had a couple of years early in the research trawl survey with relatively high indices of subadults and adults. The previous highest index, though, which was for 1981, has now been surpassed by the 2021 value. The last nine years have had higher indices, on average, than the earlier years back to the 1960s. Consequently, this indicator does indicate an increase in abundance in Delaware Bay of adults and subadults over the last decade.
The discussion above outlines the problem with the current oxygen criterion, which is dangerous to young sturgeon. While the regulations imposed in 1967 have produced increased oxygen levels in the river compared to earlier decades, when levels were below 2 ppm for forty kilometers of river in summer (Ellis et al. 1947), the continuing presence of high levels of nitrogen-based biological oxygen demand in the river is well-documented and the Delaware River Basin Commission is currently considering requiring improvement in DO by reducing input of ammonia and other sources of nitrogen into the river while raising the criteria for oxygen.
The data presented above show that Atlantic sturgeon are reproducing successfully in most years in current conditions in the river, with hundreds to thousands of sturgeon ages 0 – 1 present in the river. Delaware Bay is hosting more consistent levels of subadults and adults then during the previous decade. While ship strikes are causing some mortality on sub-adults and adults, we don’t have an estimate of the mortality rate caused by this factor. The question is to what extent this mortality will affect the population

growth rate. Ship-strike mortality will have some negative effect on the population, but the amount of reduction in population growth rate is unknown.
References
Bain, M. 1998. Hatchery Atlantic sturgeon released in the Hudson River showing up in the Delaware River and Chesapeake Bay. Cornell Sturgeon Notes 5:14. Newsletter of the New York Cooperative Fish and Wildlife Research Unit- Department of Natural Resources. Cornell University, Ithaca, NY.
Brown, J.J. and G.W. Murphy. 2010. Atlantic Sturgeon Vessel-Strike Mortalities in the Delaware Estuary. Fisheries 35:72-83.
Erickson D. L., A. Kahnle, M. J. Millard, E. A. Mora, M. Bryja, A. Higgs, J. Mohler, M. DuFour, G. Kenney, J.Sweka and E. K. Pikitch. 2011. Use of pop-up satellite archival tags to identify oceanic-migratory patterns for adult Atlantic Sturgeon, Acipenser oxyrinchus oxyrinchus Mitchell, 1815. Journal of Applied Ichthyology 27:356–365.
Fisher, M. 2009. Atlantic sturgeon progress report. State Wildlife Grant Project T-4-1. Delaware Division of Fish and Wildlife, Dover.
Hale, E.A., I., Park, M.T. Fisher, R.A. Wong, M.J. Stangl and J.H. Clark. 2016. Abundance Estimate for and Habitat Use by Early Juvenile Atlantic Sturgeon within the Delaware River Estuary, Transactions of the American Fisheries Society. 145:6, 1193-1201.
Kahn, D. M. 2017. Atlantic Sturgeon. Technical Report for the Delaware Estuary and Basin. Partnership for the Delaware Estuary. Wilmington.
Kahn, D. M. and M. Fisher. 2012. Endangered Atlantic Sturgeon in the Delaware River require higher standards for dissolved Oxygen. Delaware Division of Fish and Wildlife, Dover. Available at Reports by Others - Partnership for the Delaware Estuary
King, T.L., B.A. Lubinski, and A.P.Spidle. 2001. Microsatellite DNA variation in Atlantic sturgeon (Acipenser oxyrinchus oxyrinchus) and cross species amplification in the Acipenseridae. Conservation Genetics 2:103-119.
Klyashtorin, L. B. 1982. The ability of sturgeons (Acipenseridae) to regulate gas exchange. J. Ichthyology 21.
Niklitschek, E. J. and D. H. Secor. 2009. Dissolved oxygen, temperature and salinity effects on the ecophysiology and survival of juvenile Atlantic sturgeon in estuarine waters: I. Laboratory results. Journal of Experimental Marine Biology and Ecology 381: 150-160.
Park I.A. 2021. State of Delaware Annual Compliance Report for Atlantic Sturgeon. Delaware Division of Fish and Wildlife
Park, I.A. 2020. Conservation and Recovery of Juvenile Sturgeons in the Delaware River. Delaware Division of Fish and Wildlife. Final Report to National Marine Fisheries Service. Award NA16NMF4720072
Secor, D. H. 2002. Atlantic Sturgeon fisheries and stock abundances during the late nineteenth century. American Fisheries Society Symposium 28:89-98
Secor, D.H., and 9 co-authors. 2000. Dispersal and growth of yearling Atlantic sturgeon Acipenser

Technical Report for the Delaware Estuary and Basin Partnership for the Delaware Estuary— Host of the Delaware Estuary Program
oxyrinchus, released into the Chesapeake Bay. U.S. National Marine Fisheries Service Fishery Bulletin 98:800-810.
Sharp, J. H. 2010. Estuarine oxygen dynamics: What can we learn about hypoxia from long-term records in the Delaware estuary? Limnology and Oceanography. 55:535-548.
Sweka, J.A., J.Mohler, M.J. Millard. March 2006. Relative Abundance Sampling of Juvenile Atlantic Sturgeon in the Hudson River. Technical Report to the NY State Department of Environmental Conservation. Hudson River Fisheries Unit. New Paltz, NY. 46 pp.
Webster, G. S., G. E. Dateman and W. L. Stevenson. 1914. Report on the Collection and Treatment of the Sewage of the City of Philadelphia. Philadelphia Dept. of Pub. Wks., Philadelphia. 187 pp

Technical Report for the Delaware Estuary and Basin Partnership for the Delaware Estuary— Host of the Delaware Estuary Program December 2022 | Report No.22-05
White perch (Morone americana; Fig 7.2.3.1) are one of the most abundant fish in the Delaware Estuary and probably the most widespread, found in nearly all the waters of the Delaware Estuary, from the lower bay to uppermost reaches of the estuary’s many tidal tributaries. White perch support important recreational and commercial fisheries throughout the estuary.
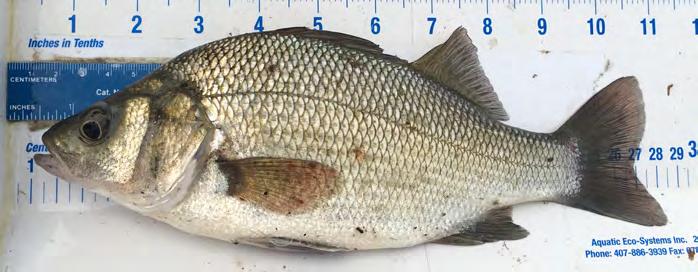
White perch are closely related to striped bass, but the white perch is a much smaller fish. Although the Delaware state record white perch was 2 pounds 9 ounces (1.2 kg), any white perch over one pound is considered large. Delaware Estuary white perch display anadromous tendencies in that large aggregations of white perch move into tidal tributaries in spring to spawn and then out into the deeper waters of the Estuary to overwinter, but, unlike striped bass, white perch rarely leave the Estuary. White perch numbers in the Delaware Bay and River typically increase during fall and remain high through winter, then decrease during spring and summer (Miller 1963, PSEG 1984), while white perch numbers in the tidal tributaries show the opposite trend (Smith 1971). However, white perch were caught yearround in both the Delaware Estuary (de Sylva et al 1962) and the tidal tributaries (Smith 1971), so the evidence was inconclusive about the extent of white perch movements. On a smaller spatial scale, Jones et. al (2014) used acoustic telemetry in Alloway Creek, NJ, to determine white perch exhibit high site fidelity and variable movement patterns but prefer Spartina spp. and mixed marshes to those invaded by Phragmites australis. In addition, landlocked white perch populations have thrived for years in most of the freshwater ponds in the headwaters of Delaware Estuary tidal tributaries (Martin 1976).
White perch spawn in the Delaware River (Miller 1963, PSEG 1984) and most of the Delaware Estuary tidal tributaries (Miller 1963, Smith 1971, Clark 2001). Spawning occurs from early April through early June, but May is usually the peak spawning month (Miller 1963, Smith 1971, PSEG 1984). Young-of-theyear white perch, are found in both the Delaware Estuary (PSEG 1984) and the lower salinity reaches of tidal tributaries (Smith 1971, Clark 2001). White perch feed almost exclusively on small invertebrates from their larval through juvenile stages, and then add fish to their diet as they reach maturity (PSEG 1984). Most male and female white perch mature at two and three years, respectively (Wallace 1971). Delaware Estuary white perch have been aged to ten years old and some may live longer than that, but white perch older than six years old are rare (Clark 2001).
White perch tolerate a wide range of environmental conditions, as would be expected of such a ubiquitous fish. White perch have been collected from water with temperatures ranging from 2.2° C (Rohde and Schuler 1971) to 35.5° C (Clark 1995) and at salinities ranging from 0 (Shirey 1991) to 35 (Clark 1995). White perch catch per unit effort is greatest in fresh and oligohaline waters of Delaware tidal tributaries (Clark 2001). White perch in the Delaware Bay, particularly juveniles, are caught more

frequently at lower salinities; not many are caught at higher, ocean salinity levels. Both juveniles and adults are caught at lower temperatures (Oleynik 2020)(Fig 7.2.3.2). Smith (1971) collected white perch at a dissolved oxygen level of 2.2 ppm in Blackbird Creek, DE and Clark (1995) caught white perch at a dissolved oxygen level of 2.0 ppm in a high-level tidal impoundment near the Little River, DE, but neither report indicated whether the fish showed signs of stress at these low dissolved oxygen levels.
White perch were among the top five finfish species harvested commercially in Delaware from the time

Figure 7.2.3.2 Probability of catching white perch in the Delaware Bay across a range of temperature (°C), salinity (ppt), and dissolved oxygen (% saturation). Solid line represents the 30-foot trawl used in DDFW’s Adult Groundfish Research Trawl Survey (1966-2019) and dashed line represents the 16-foot trawl used in DDFW’s Juvenile Finfish Research Trawl Survey (1978-2019) (Oleynik, 2020).
Delaware began requiring commercial catch reporting in the 1980s until the mid-2010s, but landings have since decreased substantially. Landings averaged 77,868 lbs during 2010 through 2015, with the highest landings, 157,947 lbs, reported in 2011, but only averaged 10,152 lbs during 2016 through 2020 (Fig 7.2.3.3). The decline in landings likely reflects a decline in the Delaware Estuary white perch population, but other factors also contributed to the landings decline. Although gourmets consider the white perch to be one of the finest tasting fish available, market demand for white perch has declined over the years, which has contributed to the decline in landings. Most fishing effort for white perch was expended during late fall through winter and into early spring. Delaware Bay was the source for most commercially-caught white perch, but substantial landings also came from Delaware River and several tidal tributaries. Commercial white perch landings in Delaware Estuary counties in New Jersey (Salem and Cumberland) averaged 24,333 lbs per year during 1995 through 2000, but, as with Delaware, landings have declined and averaged 7,652 lbs per year during 2015 through 2020.
White perch were among the top ten fish species harvested recreationally in Delaware annually since 2000. The annual, mean estimated recreational harvest during 2000 through 2020 was 97,618 pounds, with harvests greater than 150,000 pounds reported in 2010, 2011, 2014, and 2019 (personal communication from the National Marine Fisheries Service, Fisheries Statistics Division. 10/22/21). White perch are sought after for their mild, flaky meat; however, there are several consumption advisories for white perch in the Delaware Estuary (NJDEP 2021, DNREC 2018).
This indicator uses the white perch young-of-the-year (YOY) index derived from the Delaware Division of Fish and Wildlife’s (DDFW) Juvenile Finfish Trawl Survey. The juvenile finfish trawl survey uses a 16’ trawl to sample 39 inshore Delaware Bay and River stations monthly during April through October. The YOY

index is calculated as the geometric mean number of YOY white perch caught by the juvenile finfish trawl survey during June through October in Delaware Bay and River (Greco 2021). The white perch YOY index is an indicator of year-class strength and may indirectly be an indicator of future spawning stock abundance. The geometric mean white perch YOY index was only above the 1990 through 2016 time series geometric mean of 0.80 YOY white perch per tow twice during the past ten years of 2011 through 2020 (Fig 7.2.3.4).
Delaware white perch commercial landings exceeded 100,000 lbs. in both 2009, 2010 and 2011; the only time landings have exceeded 100,000 lbs. for three consecutive years in the 1951 through 2020 time series, but landings have since declined and have been below the time series mean since 2015 (Fig 7.2.3.3). The YOY Index and commercial landings suggest the Delaware Estuary white perch population has declined since the last update of this report in 2017.
The white perch YOY index was below the time series mean YOY index value 80% of the time from 20112021, which suggests the Delaware Estuary white perch spawning population has had poor spawning success during this period. Although the white perch YOY index has not been used as a predictor of future spawning stock abundance or future commercial catches, the low YOY index values may be a factor in the decrease in commercial landings reported during 2013 through 2020.
Delaware white perch commercial landings were the longest-term time series available to assess past trends in white perch abundance (Fig 7.2.3.5), but white perch landings were affected by several factors other than the white perch population, such as fishing effort, conditions during the fishing season, gears used, market demand etc. Delaware white perch landings were high for several years during the 1950s, were low during most of the 1960s and 1970s, rose during the 1980s, were near or above the time series mean during the 1990s through 2015, and have since declined to levels not seen since in decades. While Delaware’s precipitous decline in commercial landings since their historic peak in 2011 may be the result of poor fishing or market conditions during the following years, it may also be a result of poor recruitment to the fishery during this time as suggested by the low YOY index during most years between 2011 through 2020. Both the YOY index and the commercial landings suggest that the Delaware Estuary white perch population undergoes cyclical expansions and declines.
The white perch’s ability to inhabit almost all waters of the Delaware Estuary may buffer it from some of the extreme population fluctuations seen in other species, but habitat protection, particularly for areas of the Estuary in which white perch spawn, is important for the continued viability of this fish. Although the 8-inches is likely conservative, an establishment of a 6+ inch minimum size limit for white perch by all states in the Delaware Estuary will help ensure that most perch may spawn before they recruit to the fisheries.
The 8-inch (21 cm) minimum size limit for white perch, established by Delaware in 1995, has been effective in allowing almost all white perch to spawn at least once before recruiting to the fisheries. All states in the Delaware Estuary should establish an 8-inch minimum size for white perch to ensure that most white perch may spawn before they recruit to the fisheries.

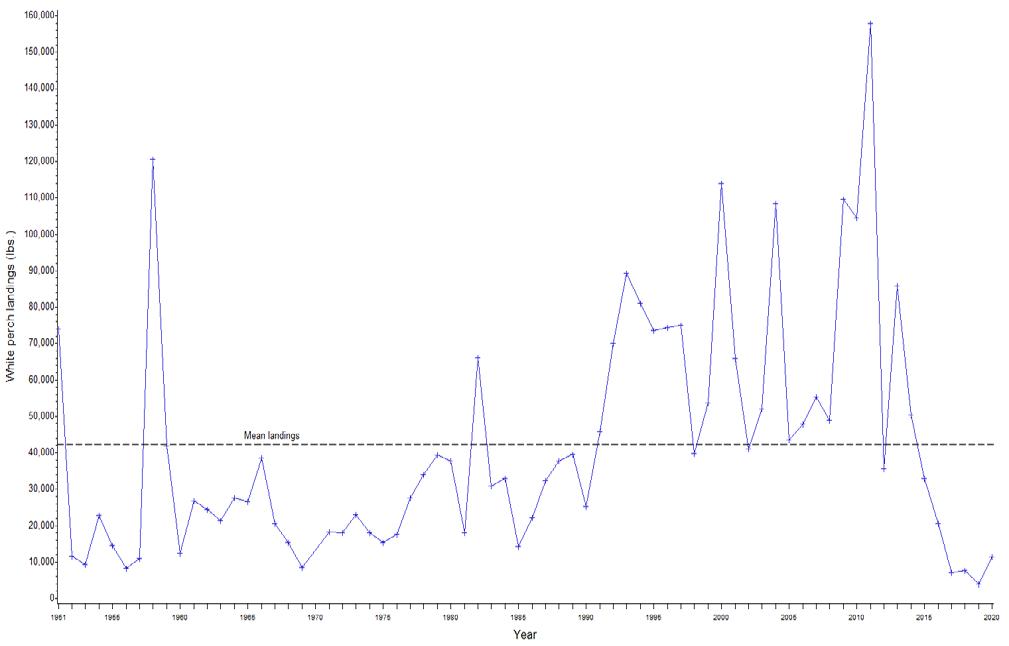
Figure 7.2.3.3 Delaware commercial white perch landings (lbs) during 1951 through 2020.
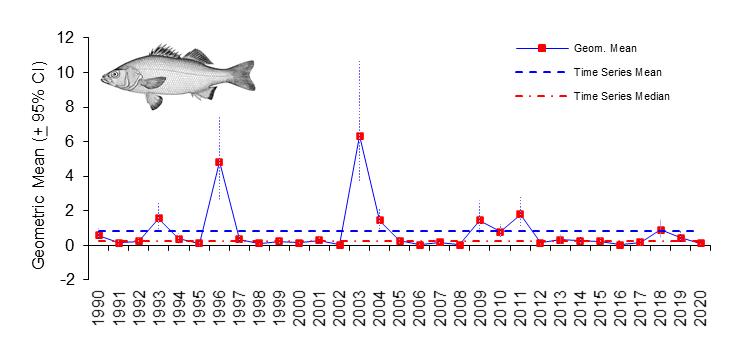
Figure 7.2.3.4 White perch YOY index (number of YOY white perch caught per trawl tow) from the DDFW Juvenile Trawl Survey from 1990 through 2020.

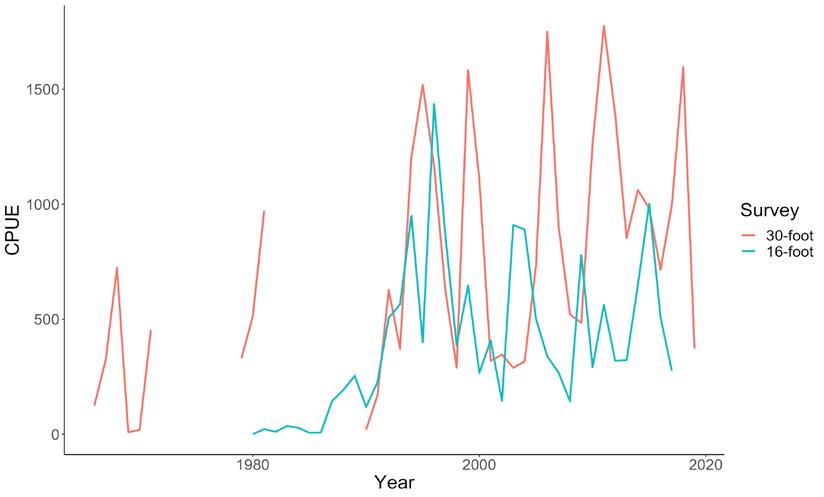
Figure 7.2.3.5 White perch CPUE (catch per unit effort) from DDFW’s Adult Groundfish Research 30-foot Trawl Survey (1966-2019) and DDFW’s Juvenile Finfish Research 16-foot Trawl Survey (1978-2019) (Oleynik, 2020).
White perch often spawn in areas of the Delaware River and in the upper reaches of Delaware Estuary tidal tributaries that have been subject to intense development pressure in the past 60 years. These are spawning habitats for many fish species in addition to white perch and these habitats should be protected.
Summary
White perch are one of the most abundant and widespread fish in the Delaware Estuary. White perch support important commercial and recreational fisheries. Although the white perch population in the Delaware Estuary seems to be maintaining itself, its abundance has declined over the past decade, so some basic management measures must be taken to ensure the population can rebound.
References
Clark, J. 1995. Impoundment estuarine interactions. Federal Aid in Fisheries Restoration Project F-44-R-5. Final report. Delaware Division of Fish and Wildlife, Dover, DE. 186 pp.
Clark, J. 2001. Anadromous species investigations. Federal Aid in Fisheries Restoration Project F-47-R-10. Job Number 1 - VI: White Perch Management Plan for the Delaware Basin. Delaware Division of Fish and Wildlife, Dover, DE. 54 pp.
de Sylva, D. P., F. A. Kalber, Jr., and C. N. Shuster, Jr. 1962. Fishes and ecological conditions in the shore zone of the Delaware River estuary, with notes on other species collected in deeper waters. Information Series, Publication 5. University of Delaware Marine Laboratories, Lewes, DE. 164 pp.

DNREC. 2018. Delaware Fish Consumption Advisories. Delaware Department of Natural Resources and Environmental Control & Delaware Division of Public Health.
Greco, M. 2021. Coastal finfish assessment survey. Federal Aid in Fisheries Restoration Project F-42-R-30. Annual report. Delaware Division of Fish and Wildlife, Dover, DE. 406 pp.
Jones, K.M.M., P.E. McGrath, P.E., K.W. Able. 2014. White perch Morone americana (Gmelin, 1789) habitat choice and movements: Comparisons between Phragmites-invaded and Spartina reference marsh creeks based on acoustic telemetry. Journal of Experimental Marine Biology and Ecology 455: 14-21.
Martin, C. C. 1976. Delaware lentic water management program. Federal Aid in Fisheries Restoration Project F-28-R-1. Annual report. Delaware Division of Fish and Wildlife, Dover, DE. 42 pp.
Miller, L. W. 1963. Growth, reproduction, and food habits of the white perch, Roccus americanus (Gmelin), in the Delaware River estuary. Master’s thesis. University of Delaware, Newark, DE. 62 pp.
NJDEP. 2021 Fish Smart. Eat Smart. A Guide to Health Advisories for Eating Fish and Crabs Caught in New Jersey Waters. NJ Department of Environmental Protection & NJ Department of Health.
Oleynik, H. A. 2020. Changes in a Mid Atlantic estuary: trends and drivers of the fish and macroinvertebrate community in Delaware Bay. (Publication No. 1237124312) [Master’s thesis, University of Delaware]. https://udspace.udel.edu/handle/19716/28649
Public Service Electric and Gas Company (PSEG). 1984. White perch (Morone americana): A synthesis of information on natural history, with reference to occurrence in the Delaware River and estuary and involvement with the Salem Generating Station. Public Service Electric and Gas Company, Newark, NJ. Appendix X. 629 pp.
Rhode, F. C. and V. J. Schuler. 1971. Abundance and distribution of fishes in the Delaware River in the vicinity of Artificial Island. Ichthyological Associates for Public Service Electric and Gas, Newark, NJ. 232 pp.
Shirey, C. 1991. Stream and inland bays fish survey. Federal Aid in Fisheries Restoration Project F-37-R-5. Final report. Delaware Division of Fish and Wildlife, Dover, DE. 231 pp.
Smith, B. 1971. An ecological study of the Delaware River in the vicinity of Artificial Island. Delaware Progress Report 3 (Part V). Ichthyological Associates for Public Service Electric and Gas, Newark, NJ. 291 pp.
Wallace, D. C. 1971. Age, growth, year class strength, and survival rates of the white perch, Morone americana (Gmelin), in the Delaware River in the vicinity of Artificial Island. Chesapeake Science 12: 205-218.

Technical Report for the Delaware Estuary and Basin Partnership for the Delaware Estuary— Host of the Delaware Estuary Program December 2022 | Report No.22-05
Striped bass are large, predatory fish of the family Moronidae with dark horizontal stripes extending from the opercula to the caudal peduncle (Fig 7.2.4.1). This species has been found to inhabit tidal creeks and rivers, jetties, beaches and relatively open water in the Bay, River and ocean depending upon age and time of year. Striped bass are frequently referred to as rockfish because of a historic association with oyster reefs which were known as oyster rocks in the Mid-Atlantic region. Some younger, smaller individuals inhabit portions of the Delaware River Estuary year-round, unlike other potentially large predators such as weakfish, bluefish, large sharks and sea turtles which occur within the estuary seasonally. The Delaware Division of Fish and Wildlife, hereafter the Division, has conducted a survey to measure spawning stock biomass since 1996. Additionally, the Division has started to explore the use of acoustic telemetry to better identify migratory corridors and trends in habitat utilization. Preliminary results coupled with older tagging studies indicate that a large portion of the Delaware River spawning stock, primarily females, engage in a spring coastal migration to Southern New England and eastern Long Island; mature females spawn in the River prior to migrating up the coast annually. However, most tagged male bass remain in the estuary or nearby ocean waters year-round. Further, the Division has found evidence of exchange between the Chesapeake and Delaware Bays via the Chesapeake and Delaware Canal, indicating these fish use the canal as a migratory corridor between estuaries.
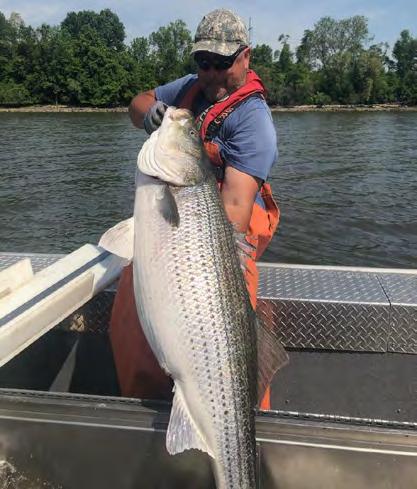
Once considered extirpated by some biologists prior to the improvement of dissolved oxygen levels in the 1980s, the Delaware River population is now one of the major spawning stocks on the Atlantic coast, along with the Hudson River and Chesapeake Bay stocks. Management action for striped bass can be traced as far back as pre-Colonial times, when use of striped bass for fertilizer was banned. The Delaware River spawning stock declined greatly by the mid-twentieth century, in response to frequent, prolonged periods of hypoxia and anoxia in the late spring through early fall in the spawning grounds from Philadelphia through Wilmington reaches (ASMFC 1981; Kahn et al., in press), with some areas having persistent DO concentrations at zero during the summer months in the 1950s and 1960s (Sharp 2010). The Delaware River oxygen content increased during the 1970s and 1980s due to the Clean Water Act, which produced pollution reduction and upgrades to the sewage treatment plants along the River. During the 1980s, production of striped bass young of year increased gradually with a large surge in 1989 (Figure 7.2.4.2).
Striped bass feed on a variety of fishes and invertebrates throughout their life cycle with a general increase in prey size concomitant with individual growth. Younger bass feed primarily on smaller invertebrates including zooplankton, insects, worms, and amphipods. However, juveniles will also feed on fish larvae and small pelagic fish species as growth and ontogeny progress. Larger bass have been found to predominately prey on small pelagic fish species such as anchovies, river herring, Atlantic silverside and Atlantic menhaden (Griffin and Margraf, 2003) with secondary prey items including larger invertebrate species (e.g. blue crab, Atlantic rock crab and American lobster; Pruell et al. 2003; ASMFC 2013).

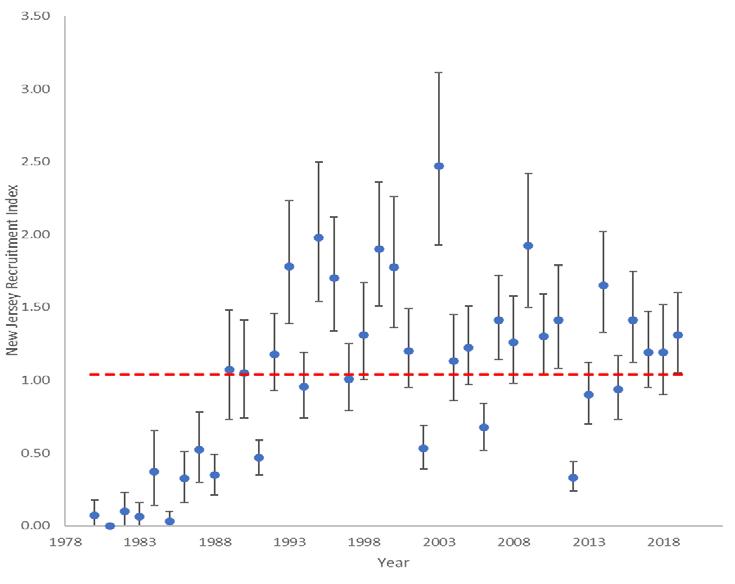
Figure 7.2.4.2 The annual Delaware River Recruitment Index, the geometric mean number of young-of-year bass caught per seine haul, with the time series mean shown by the red dashed line. Source: New Jersey Division of Fish, Game and Wildlife.
Striped bass spawning grounds exist in tidal fresh water in the Delaware River generally above detectable concentrations of salinity. However, the Division has observed spawning activity in nearby tidal waters with salinities ranging from 0.5 – 5.0 ppt. Similarly, a previous study demonstrated that striped bass successfully spawn within a narrow range of very low salinities (0.70-1.5 ppt) in the Chesapeake and Delaware Canal (Johnson and Koo 1975; Greene et al. 2009). The Delaware spawning survey usually finds more fish in April in Delaware waters from the Delaware Memorial Bridge up to the DelawarePennsylvania line. However, the New Jersey shore is typically where the majority of spawners congregate, along with the Cherry Island Flats, which are shoals in the River opposite of Wilmington, DE. As the season progresses into May, the temperature and salinity tend to increase, and spawning striped bass are more commonly collected in Pennsylvania waters up to the Philadelphia Navy Yard. Spawning usually terminates by the beginning of June. By September, young-of-year striped bass are several inches long, not typically exceeding four inches in total length before November. A recent study (Oleynik, 2020) examined the Division’s annual trawl surveys data and determined striped bass are more frequently caught at lower salinity levels and lower temperatures across life history stage. Juveniles, in particular, are more likely to be caught in low salinity areas close to the mouth of the Delaware river and up into the river while adults are more likely to be caught in a greater range of salinities (Fig 7.2.4.3).


Figure 7.2.4.3 Probability of catching striped bass in the Delaware Bay across a range of temperature (°C), salinity (ppt), and dissolved oxygen (% saturation). Solid line represents the 30-foot trawl used in DDFW’s Adult Groundfish Research Trawl Survey (1966-2019) and dashed line represents the 16-foot trawl used in DDFW’s Juvenile Finfish Research Trawl Survey (1978-2019) (Oleynik, 2020).
In addition to being integral to the ecology of the estuary, striped bass are of economic benefit to both the States of Delaware and New Jersey. Delaware has a commercial fishery targeting the species. Currently, this fishery has the highest economic value of any of Delaware’s commercial fin fisheries and is second only to the commercial blue crab fishery in terms of total ex-vessel value in the state. In 2019, Delaware commercial fishers generated more than $450,000 in ex-vessel value from striped bass landings (Fig 7.2.4.4). However, the State of New Jersey has banned the commercial harvest of striped bass for decades. Despite the difference between the commercial activities of the two states, both Delaware and New Jersey have a large recreational fishery (Fig 7.2.4.6), which ranks as one of the most popular in both states. The species is one of a few inshore species that can achieve big game size, with occasional fish exceeding 50 pounds (23 kg). However, there are several consumption advisories for striped bass in the Delaware Estuary (NJDEP 2021, DNREC 2018).
Two indicators from the Delaware River Estuary serve to measure the relative health of the striped bass population: the Delaware Spawning Stock Survey and the New Jersey Recruitment Survey. Both surveys use a geometric mean to provide a quantitative annual index of two biological parameters so we can compare performance through time. The first index, a geometric mean of the number caught per unit of electrofishing effort on the spawning grounds in April and May, is a measure of the reproductively capable abundance of the stock (Fig 7.2.4.5). The second index, the geometric mean of the number of young-of-year bass caught per seine haul, is a measure of the annual reproductive output of the stock (Fig 7.2.4.2).
Survival to age one varies annually in response to a multitude of factors, including but not limited to, adult spawning intensity, hydrodynamic properties affecting transport and retention, growth, quantity and quality of larval prey and corresponding larval condition. A large year class at the young-of-year stage often results in a greater number of recruits into the fishery several years later. Regardless of the observed fluctuations between years, the overall status of the Delaware River spawning stock is trending downward and management strategies are being evaluated to reverse that trend. The most recent assessment has shown that the female spawning stock biomass has been below the management threshold since 2013, thus triggering new management actions to reduce catch.

The 2018 stock assessment found that striped bass are presently being overfished and are experiencing overfishing relative to the biological reference points (NEFSC 2018). However, the most recent assessment still shows that female spawning stock biomass and recruitment are above the levels seen in the 1980s which resulted in a harvest moratorium being imposed. Improvements to water quality and a successful management regime are cited as the principal reasons for the dramatic improvement in the population. Within the Delaware River Estuary, the annual Spawning Stock Survey index has varied from 0.48 to a high of 4.10, with a mean of 2.05 from 1996-2019 (Fig 7.2.4.4). The index was generally higher from 1996-2005 compared to the period from 2005-2019. However, a great deal of inter-annual variability is present in the index.
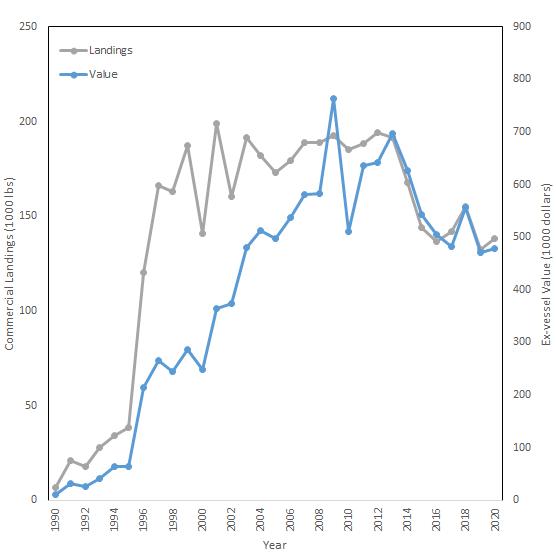
Figure 7.2.4.4 The total annual landings and ex-vessel value of commercially caught Atlantic striped bass in the State of Delaware.
The annual New Jersey Recruitment Survey index has ranged from 0.03 to 2.47, with a time series mean of 1.04 from 1980-2019 (Fig 7.2.4.5). Similar to the Spawning Stock Survey index, the recruitment index observes substantial inter-annual variability, but 2016-2019 the index remained above the time series mean.
The striped bass fishery is managed under relatively conservative regulations to maintain high levels of spawning stock biomass. The current reference points were enacted to protect a coast-wide spawning stock biomass target of 125% of the 1995 levels (the year the species was declared recovered by the ASMFC). Aggressive management actions to rebuild the spawning stock biomass predicts that the female spawning stock biomass will be recovered by 2023.

When examining the number of striped bass caught per recreational trip in Delaware, a similar pattern of high inter-annual variability compared to the Delaware Spawning Stock Survey becomes apparent (Fig 7.2.4.6), demonstrating the inherent irregularity in annual harvest. Despite the second lowest value since the turn of the century being observed in 2016, the past several years have shown an increase in striped bass being caught per recreational trip. The recreational catch per trip was generally higher in the last twenty years than the time series average suggesting that the species has been managed to maintain relatively high levels of productivity.

7.2.4.5 The annual Delaware Spawning Stock Survey index with the time series mean shown by the red dashed line.
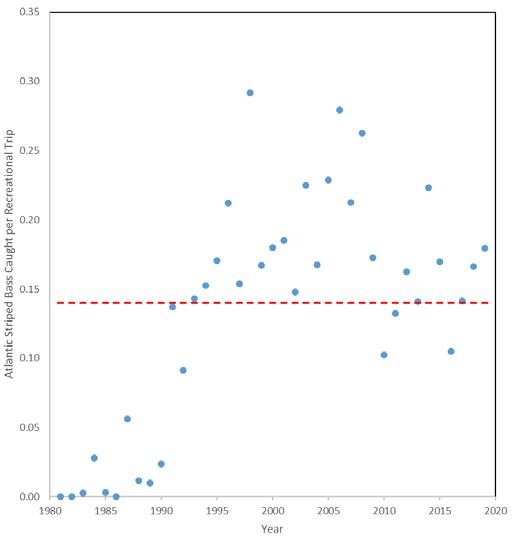
7.2.4.6 Annual index of recreationally caught Atlantic striped bass caught per trip with the time series mean shown by the red dashed line.
In order to ensure sustainable levels of future harvest, we need to continue monitoring long term trends in biomass and recruitment, responding when necessary with management action. The most recent stock assessment reported that overfishing was occurring. One of the main culprits of the overfishing finding was a new estimate of recreational discard mortality being calculated. Several management actions have been implemented to decrease discard mortality, including a coastwide mandate on the use of circle hooks, and limiting recreational fishing during times of the year when water temperatures are at their peak.
Striped bass are large, predatory fish that are important to the ecology of the Delaware River Estuary and the economy of the surrounding states. In response to conservative historical management measures and improved habitat availability and thanks to enhanced water quality conditions, the species has rebounded from historic lows to new highs in abundance. It has come to represent a significant

management success and continues to provide a sustainable fishery resource. In order to continue to sustainably harvest striped bass, we will need to continue long term monitoring programs and advance our mathematical modeling to better approximate the dynamics of an ever-changing environment.
References
ASMFC. 1981. Interstate Fisheries Management Plan for the Striped Bass of the Atlantic Coast from Maine to North Carolina. A report prepared by the State of Maryland Department of Natural Resources, Tidal Fisheries Division as part of the Interstate Fisheries management Program. 329 p.
ASMFC. 2013. Striped Bass Benchmark Stock Assessment for 2013. A report prepared by the Striped Bass Technical Committee for the Atlantic Striped Bass Management Board. 967 p.
DNREC. 2018. Delaware Fish Consumption Advisories. Delaware Department of Natural Resources and Environmental Control & Delaware Division of Public Health.
Greene, K. E., J. L. Zimmerman, R. W. Laney, and J. C. Thomas-Blate. 2009. Atlantic coast diadromous fish habitat: A review of utilization, threats, recommendations for conservation, and research needs. Atlantic States Marine Fisheries Commission Habitat Management Series No. 9, Washington, D.C.
Griffin, J. C. and F. J. Margraf. 2003. The diet of Chesapeake Bay striped bass in the late 1950s. Fisheries Management and Ecology 10: 323–328.
Johnson, R. K., and T. S. Y. Koo. 1975. Production and distribution of striped bass (Morone saxatilis) eggs in the Chesapeake and Delaware Canal. Chesapeake Science 16: 39-55.
Kahn, D. M., P. Himchak, Cl. A. Shirey, M. Fisher, T. Baum, R. Allen, G. Murphy, M. Kaufman and R. W. Miller. In press. Restoration of the Delaware River Stock of Striped Bass.
Kahn, D. M., R. W. Miller, C. A. Shirey, and S. Grabowski. 1998. Restoration of the Delaware River stock of striped bass. Delaware Division of Fish and Wildlife, Dover.
NJDEP. 2021 Fish Smart. Eat Smart. A Guide to Health Advisories for Eating Fish and Crabs Caught in New Jersey Waters. NJ Department of Environmental Protection & NJ Department of Health.
Northeast Fisheries Science Center (NEFSC). 2018. 66th Northeast Regional Stock Assessment Workshop (66th SAW) Assessment Report: Part B. Striped Bass Stock Assessment. Northeast Fisheries Science Center Reference Document 19-08 (https://www.nefsc.noaa.gov/publications/ crd/crd1908/)
Oleynik, H. A. (2020). Changes in a Mid Atlantic estuary: trends and drivers of the fish and macroinvertebrate community in Delaware Bay. (Publication No. 1237124312) [Master’s thesis, University of Delaware]. https://udspace.udel.edu/handle/19716/28649
Pruell, R. J., B. K. Taplin and K. Cicchelli. 2003. Stable isotope ratios in archived striped bass scales suggest changes in trophic structure. Fisheries Management and Ecology 10: 329–336.
Rugolo L.J., Crecco V.A., and M.R. Gibson. 1994. Modeling stock status and the effectiveness of alternative management strategies for Atlantic coast striped bass. Washington (DC): ASMFC. A Report to the ASMFC Striped Bass Management Board. 30 p.
Sharp, J. 2010. Estuarine oxygen dynamics: What can we learn about hypoxia from long time records in the Delaware Estuary? Limnology and Oceanography 55, 535-548.

Technical Report for the Delaware Estuary and Basin Partnership for the Delaware Estuary— Host of the Delaware Estuary Program
Weakfish ( Cynoscion regalis ) is a marine fish that is member of the drum family Sciaenidae. Locally, weakfish often go by other common names such as gray trout or sea trout; although they are of no relation to the “true” trout family Salmonidae. Weakfish occur along the Atlantic coast from Nova Scotia, Canada to southeastern Florida, but are most common from New York to North Carolina. Weakfish once dominated Delaware’s recreational and commercial landings in the 1970s and 1980s and the species was named the Delaware State Fish in 1981. With the onset of spring and the warming of coastal waters, adult weakfish begin a northerly inshore migration from offshore waters off the Carolina coast to nearshore coastal waters and estuaries to spawn. Spawning in the Delaware Estuary occurs in the shallows and on shoals in the middle and lower Bay and generally begins in May with sporadic, secondary spawning taking place throughout the summer. Larger weakfish, over several pounds, which were extremely common in the 1970s and 1980s and less so in the later 1990s, spawn in the spring and then leave the Bay. These larger fish may then migrate to southern New England. Younger, smaller adult weakfish tend to stay in the Bay all summer and do spawn more than once given their propensity to reach sexual maturity by age 1 (Nye et al. 2008). From late spring through early fall, young-of-the year (YOY) weakfish are found throughout the estuary from the lower Bay up into the Delaware River (Fig 7.2.5.1). In recent years, age 0 weakfish have started to appear in surveys in mid to late June. Young weakfish are fast growing, often reaching a length of six to eight inches (15-20 cm) before leaving the Bay in the fall to migrate south as water temperatures decline. Due to the above life history characteristics, weakfish in Delaware Bay have a strong relationship to temperature and are much more likely to be caught at higher temperatures, in warmer months across life history stage. While adult weakfish are caught across a range of salinity, juvenile weakfish are more likely to be caught at higher salinity levels (Oleynik 2020) (Fig 7.2.5.2).
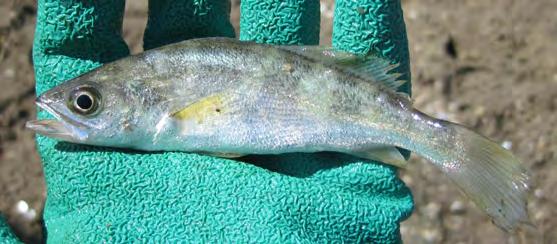
Weakfish feed on a variety of prey ranging from invertebrates like crustaceans, and mollusks to various fish species. Younger fish feed on mysid shrimp, also known as opossum shrimp, and sand shrimp, which can be very abundant in mats of grass detritus washed out of marshes. Larger weakfish are more piscivorous, feeding mainly on other fish, primarily members of the Clupeidae family like Atlantic menhaden. Larger weakfish are also cannibalistic, feeding on YOY weakfish (Merriner 1975; Thomas 1971). Due to these and other life history traits, there are several human consumption advisories for weakfish in the Delaware Estuary (NJDEP 2021, DNREC 2018).
Weakfish abundance and catches have been declining coast-wide since the late 1990s. The 2019 Weakfish Stock Assessment Update indicates that Weakfish continue to be depleted and have been since 2003 (ASMFC 2019). A coast-wide stock assessment completed in 2006 found natural mortality had increased beginning in 1996, eventually causing the stock to decline (ASMFC 2006). That assessment developed a hypothesis that predation and possibly competition from striped bass and spiny dogfish caused the large increase in natural mortality that led to the weakfish decline. Although coast-wide YOY indices remained relatively steady with low levels of adult harvest, the population did not show signs of recovery. A stock assessment conducted in 2009 examined other potential factors that could affect natural mortality in addition to predation, including seasonal variables such as water temperature, and large-scale, environmental phenomena including the Atlantic Multidecadal Oscillation (NEFSC 2009).


Figure 7.2.5.2 Probability of catching weakfish in the Delaware Bay across a range of temperature (°C), salinity (ppt), and dissolved oxygen (% saturation). Solid line represents the 30-foot trawl used in DDFW’s Adult Groundfish Research Trawl Survey and dashed line represents the 16-foot trawl used in DDFW’s Juvenile Finfish Research Trawl Survey from years 1978 to 2019 (Oleynik 2020).
The most recent peer reviewed assessment conducted in 2016 utilized several methods to estimate time-varying mortality including the relationship between catch and the Atlantic Multidecadal Oscillation (ASMFC 2016). As with the 2016 assessment, the 2019 assessment update supported the hypothesis that natural mortality has increased since 1996 but was unable to determine the underlying cause or causes. Tagging work also estimated an increasing trend in natural mortality and suggested that increased predation from bottlenose dolphin was driving that trend (Krause 2019).
The primary indicator of weakfish productivity in the Delaware River Estuary is the mean catch per nautical mile of weakfish in the adult groundfish research trawl survey, conducted using a 30-foot otter trawl net in Delaware Bay by the Delaware Division of Fish and Wildlife. This survey has been conducted since 1966 (1966-71, 1979-84 and 1990-present) and is conducted monthly from March through December at nine fixed stations in Delaware Bay.
Weakfish relative abundance in the 30-foot trawl survey has generally followed a declining trend since 1996 (Fig 7.2.5.3) and total mortality estimates have correspondingly increased. Despite annually ranking among the top 1 or 2 (by number) fish species encountered in the trawl survey, weakfish abundance remains below the historical average for the survey (Greco 2021). The age structure of weakfish remains truncated similar to the age structure found in the early 1990s with 82% of survey catch being less than age two.
A secondary indicator of weakfish productivity in the Delaware River Estuary is the index of relative abundance of YOY weakfish as measured by the Delaware Division of Fish and Wildlife’s Juvenile Finfish Research Trawl Survey. This survey has been conducted annually since 1980 and samples monthly from April through October at 33 fixed stations in the Delaware Bay and River utilizing a 16-foot semi-balloon otter trawl. Abundance of YOY weakfish declined in 2020 relative to 2019 and remains below the time series mean for the fifth consecutive year (Fig 7.2.5.4) (Greco 2021). Weakfish annually rank among the top species collected in the juvenile trawl. However, as with the relative abundance in the 30-foot trawl survey, the YOY index for weakfish has also followed a declining trend since 1996 (Fig 7.2.5.4).

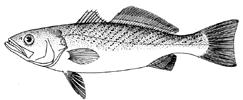
Figure 7.2.5.3 Weakfish relative abundance (mean number per nautical mile), time series (1966 – 2020) mean and median as measured in 30-foot trawl sampling in Delaware Bay.

Figure 7.2.5.4 Relative abundance of young of the year (YOY) weakfish from 1980 through 2020, time series (1980-2019) mean and median as measured by 16-foot trawl sampling in the Delaware Estuary.

Despite a top-5 adult abundance level in Delaware’s adult trawl survey in 2019; YOY recruitment in the estuary continues to be below the historical average, the coast-wide weakfish stock is considered depleted and has been since 2003 as detailed in the latest peer reviewed stock assessment (ASMFC 2016). Under the new reference points proposed in the latest assessment, the stock is considered depleted when the coast-wide estimated spawning stock biomass is below 30% of the estimated average biomass over the period 1982-2014. The 2019 assessment update estimated the spawning stock biomass to be 4.24 million pounds in the terminal year of the assessment update (2017). Despite slight increases in total abundance and spawning stock biomass in recent years, the stock is well below the spawning stock biomass threshold and has been since 2003. Results of the latest assessment update indicated that total mortality (Z = 1.45) was above the target (Z = 1.03) and threshold (Z = 1.43). However, the assessment indicated that natural mortality has been increasing since the mid-1990s. As such, the weakfish population has been experiencing high levels of total mortality, which has prevented the stock from recovering (ASMFC 2016).
Weakfish were at moderate abundance prior to the 1970s, when they began an explosive rise in abundance and size. By the late 1970s, Delaware Bay had become famous throughout the Mid-Atlantic region as a destination for catching trophy-sized weakfish in the spring spawning run. By the late 1980s, this fishery declined somewhat; however, the Delaware commercial fishery landed over 200,000 pounds of weakfish as late as 2001.The Atlantic States Marine Fisheries Commission imposed significant fishery restrictions coast-wide in the mid-1990s, and, in response, abundance and catches initially began to increase through the late 1990s, before declining during the 2000s. So, although the fishery has not regained the high catches and trophy sizes seen in the 1970-1980 period, it did produce higher catches of legal-size weakfish for many in the mid- to late 1990s, before its ultimate decline. By 2007, Delaware commercial landings declined to 27,000 pounds. By 2010, no directed fishery was allowed on the Atlantic coast; only a small amount of bycatch was legal.
The 2016 stock assessment indicated that in recent years, slight increases coast-wide in total abundance, spawning stock biomass and recruitment of age 1 fish have occurred. However, the stock remains well below the recommended threshold.
None.
Currently, weakfish reproduction continues at moderate levels. Survivorship to catchable size, however, has declined greatly, to the point that catches of legal-size weakfish are uncommon in Delaware Bay. The cause of the decline has been linked to factors such as predation by striped bass and spiny dogfish, competition with striped bass for Atlantic menhaden and changes in environmental conditions (ASMFC 2006, NEFSC 2009). However, the most recent stock assessment (ASMFC 2016) claimed that explicit factors leading to the decline of weakfish require more investigation.

References
ASMFC. 2006. Weakfish Stock Assessment Report, 315 pp. Available at http://www.asmfc.org/uploads/ file/2006WeakfishStockAssessment.pdf
ASMFC. 2016. Weakfish Stock Assessment and Peer Review Report. 435p.
DNREC. 2018. Delaware Fish Consumption Advisories. Delaware Department of Natural Resources and Environmental Control & Delaware Division of Public Health.
Greco, M. J. 2019. Coastal finfish assessment survey. Federal Aid in Fisheries Restoration Project F-42-R-30-2. Annual Report. Delaware Division of Fish and Wildlife, Dover.
Krause, J.R. 2019. Sources, Magnitude, and Timing of Weakfish Mortality across the U.S. East Coast [dissertation]. Raleigh, NC. 22 p.
Merriner, J. V. 1975. Food habits of the Weakfish, Cynoscion regalis, in North Carolina waters. Chesapeake Science. 16: 74-76.
NEFSC. 2009. 48th Northeast Regional Stock Assessment Workshop (48th SAW) Assessment Summary Report. US Dept Commerce, Northeast Fisheries Science Center Ref Doc. 09-10; 50 p. Available from: National Marine Fisheries Service, 166 Water Street, Woods Hole, MA 02543-1026, or online at http://www.nefsc.noaa.gov/nefsc/publications/
NJDEP. 2021 Fish Smart. Eat Smart. A Guide to Health Advisories for Eating Fish and Crabs Caught in New Jersey Waters. NJ Department of Environmental Protection & NJ Department of Health.
Nye, J.A., Targett, T.E., and Helser, T.E. 2008. Reproductive characteristics of weakfish in Delaware Bay: implications for management. N Am J Fish Manage. 28: 1-11.
Oleynik, H. A. (2020). Changes in a Mid Atlantic estuary: trends and drivers of the fish and macroinvertebrate community in Delaware Bay. (Publication No. 1237124312) [Master’s thesis, University of Delaware]. https://udspace.udel.edu/handle/19716/28649
Thomas, D. L. 1971. The early life history and ecology of six species of drum (Sciaenidae) in the lower Delaware River, a brackish tidal estuary. Ichthyological Associates. Delaware Progress Report 3 (Part III). 247 pp.

American eels (Anguilla rostrata) (Fig 7.2.6.1) are very unique among fishes of the Delaware River Estuary. Being catadromous, eels spend most of their lives in fresh and estuarine water, only returning to the open ocean to spawn. It is believed that all American eels spawn in the Sargasso Sea off the southern coast of the United States (Miller et. al. 2014). American eels are also semelparous, meaning they spawn once and die. Larval stage eels (leptocephali) hatched from buoyant eggs are leaf-like in shape and drift on ocean currents westward to the eastern Gulf of Mexico and Atlantic coast of the U.S. All American Eels are currently believed to spawn in one aggregation, and therefore offspring, with few exceptions, are genetically indistinguishable (Cote et. al. 2012). Larval eels are not believed to return to the particular waters from which their parents came, but rather migrate up the coast with the Gulf Stream and move inshore in a randomized fashion. Recent findings suggest that ingressing juvenile eels are capable of conspecific cuing, using olfaction to select waters that are already occupied by other eels (Schmucker et. al. 2016).
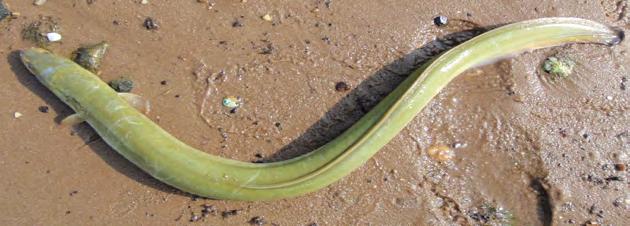
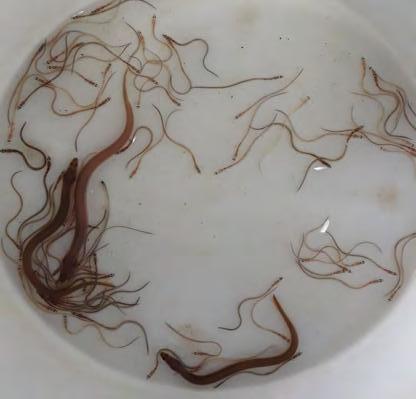
As leptocephali near freshwater environs in the late winter to early spring, they metamorphose into clear, very small eels known as glass eels. Some eels will move far up into non-tidal portions of Delaware River tributaries, often very small streams. Others remain in brackish water in tidal tributaries of the Bay and River. Once glass eels reach freshwater, they undergo pigmentation, eventually reaching the “yellow” phase of their life history, named as such for their yellow-green coloration. American eels spend most of their life in the “yellow” stage, residing in tributaries and the Delaware River for up to 30 years (Able and Fahay 1998) until they reach sexual maturity and the last stage of their life cycle, the “silver” phase (Fig 7.2.6.2). A number of physiological changes occur during the silvering process: the skin thickens, the body fattens, the shape and color of the pectoral fins change, the digestive tract degenerates, and the eyes become enlarged. These changes are thought to be beneficial for migration through the open ocean back to the Sargasso Sea (Facey and Van den Avyle 1987).
Delaware and New Jersey have, historically, had significant commercial fisheries for yellow eels, prosecuted in the Bay and it’s tidal tributaries. Delaware landings ranged above 100,000 pounds until 2008 when shortages in bait supply, namely female horseshoe crab, suppressed more recent annual landings (Fig 7.2.6.3). Eels are used by recreational fishers for bait to catch striped bass and large pelagic fishes such as tunas and billfish. A fairly robust bait market exists in the southeastern United States as well for cobia, catfish, and land-locked striped bass. Size of bait eels varies depending upon the quarry targeted but all must meet the legal minimum size of nine inches (23 cm). The second market for eels is a food market both in this country and in Europe, where they are regarded as a delicacy. Eels are

shipped live or frozen to Europe. There are several consumption advisories for eating American eel meat harvested in the Delaware Estuary (NJDEP 2021, DNREC 2018).
Delaware’s eel fishery is reliant on a source of good bait; fishers say that much of the year, the only bait that will catch significant numbers of eels is female horseshoe crabs. With the restrictions on horseshoe crab harvest along the Atlantic coast, availability has dwindled and the price of bait has increased considerably. The price of bait has negatively impacted Delaware’s eel landings in two ways. First, the catchability of other baittypes including fish wracks and blue crabs is not as great as it is for horseshoe crabs. Secondly, many eel fishermen accustomed to catch rates of pots employing horseshoe crab baits have left the fishery presumably due to a decline in profitability. As a result, a sharp decline in commercial landings have been observed since regulations were enacted (2007) banning the harvest of female horseshoe crabs in the Delaware Bay region (Fig 7.2.6.3). In more recent years, aquaculture facilities in Europe and Asia have supplanted the need for wild-caught eel product.
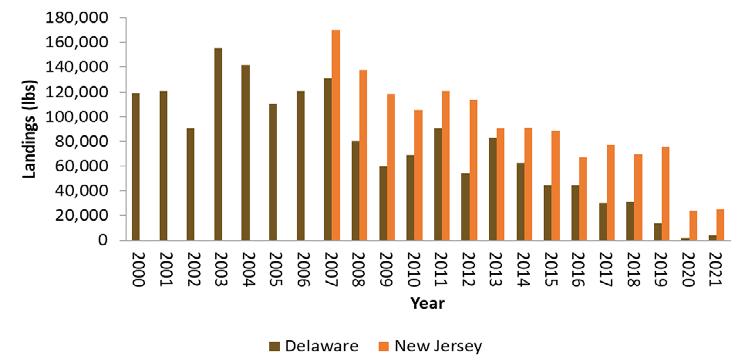
Figure 7.2.6.3 American eel commercial landings for the years: 2000 – 2021 in Delaware and 2007-2021 (data from 2021 are preliminary) in New Jersey.
The American eel population is managed under regulations developed by the Atlantic States Marine Fisheries Commission. Coast-wide populations have declined in recent years, due to several potential factors including the relatively slow rate of maturation, high levels of stage specific mortality, fishing mortality on a wide range of year classes prior to spawning, continued habitat loss in the form of dams and other impediments to upstream migration, and changes in oceanic conditions. Additionally, the introduced Asian parasite, Anguillicola crassus, is now wide-spread in the American eel population, as it has been documented in every State on the Atlantic coast. Relatively little is known about the overall effects this parasite has on the population, but the fact that it weakens, and in some cases, totally destroys the eel’s swim bladder intuitively equates to a negative impact on infected eels. The United States Fish & Wildlife Service conducted a review of the species status in order to determine whether it should be listed under the Endangered Species Act (ESA). The Service had previously concluded in 2007 that there was no basis for listing eels as threatened or endangered. After reviewing the data again in 2015, the USFWS decided that listing the American eel under the ESA was again not warranted (USFWS 2015).

The index of eel relative abundance is developed from 13 trawl survey stations in the lower Delaware River by the Delaware Division of Fish and Wildlife Juvenile Finfish Trawl Survey. The net is a 16-ft (4.8m) semi-balloon trawl with a 0.5-in (1.3-cm) cod end liner towed by 62-ft (19-m) R/V First State. The geometric mean catch-per-tow, using catch data collected from April through June from 1982-2021, is used to estimate an index of abundance (Fig 7.2.6.4). Catch typically consists of eels from ages 0 to 7, with 3 years of age representing the most frequent age observed in the catch (DDFW unpublished data). All eels captured in this survey are yellow-phase.
A linear regression line was found to best represent the index as a function of year, which explains a statistically significant portion of the annual variability (P = 0.01, R2 = 14.6%; Fig 7.2.6.4). Such patterns raise the possibility of decadal-scale oscillations in climate affecting recruitment into the stock. Changes in cyclical climatic events have been found to affect patterns of abundance through cumulative effects on ecosystem processes including, but not limited to spawning success, primary productivity and larval transport (Nye et al. 2014).
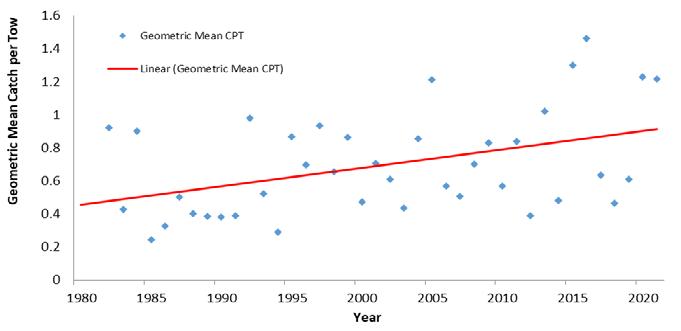
Figure 7.2.6.4 Index of relative abundance of American eels in the tidal Delaware River, based on catch per tow at 13 stations from April –June from 1982-2021. The index is the geometric mean catch per tow. The predicted line was fitted as a linear regression, P = 0.01, R 2 = 14.6%.
Eel abundance in the estuary as represented by the index, has generally increased over the time series with the last four years exhibiting the highest abundance estimates of the last decade (Fig 7.2.6.4). All indications from anecdotal accounts from fishermen and biologists are that eel abundance is currently very high. Glass eel abundance surveys in Delaware and New Jersey have documented above average recruitment over the past decade. Although these surveys do not occur within the Delaware River watershed, they generally speak to recruitment trends in the region.
Abundance declined somewhat during the 1980s, but increased to higher levels in the mid-2000s.

Sykes and Lehman (1957) reported that eel weirs were so numerous on the non-tidal Delaware River that they trapped and killed many, if not most, young-of-year shad migrating downriver in early fall. These weirs targeted the so-called silver eel stage, which are adults migrating down river and out to spawn in the Sargasso. Smiley (1884) described “hundreds of traps” in the River between Lackawaxen, PA and Hancock, NY. The relatively high number of fishing weirs would suggest much heavier fishing mortality occurred on silver eels many decades ago. In recent years, nine weirs have been operating in the Delaware River, in New York. Due to the panmictic nature of the American eel population, high fishing mortality in the upper Delaware River may not affect the number of new recruits arriving to the Delaware River Basin from the Sargasso Sea annually.
There are no apparent basis for future predictions, but the coast wide nature of the spawning aggregation suggests that even if the Delaware estuary spawning numbers would decline, the estuary could still receive relatively high levels of annual recruits.
Although the main stem of the Delaware River is un-dammed, hundreds of dams still block passage along its tributaries; many are low head dams under private ownership and in poor operating condition. In addition, there are thousands of culverts for roads that cross the tributaries. And in many areas the riparian forested buffer along the streams has been removed, leaving the stream exposed to sun and dramatically increased non-point source sediment and pollution run off. Fish passage and riparian restoration would help improve habitat for eel by increasing connectivity and improving in-stream habitat by providing shade and structure in these tributaries.
Eel populations in the estuary declined in the late 1980s and increased in the mid-2000s. This increasing trend has continued through to 2020. Annual recruitment in Delaware has been stable at a high level for the past four years. Harvest controls put in place through interstate management of the resource should bode well for sustainability of the fishery. Habitat initiatives such as dam removal, when practical, open up quality habitat in the upper portions of Delaware River tributaries.
New Jersey commercial landings data were provided courtesy of Jennifer Pyle at NJ Department of Environmental Protection, Division of Fish and Wildlife.

Able, K. W., & Fahay, M. P. 1998. First year in the life of estuarine fishes in the middle Atlantic Bight. Rutgers University Press.
Cote, C. L., P. A. Gagnaire, V. Bourret, G. Verreault, M. Castonguay, and L. Bernatchez. 2013. Population genetics of the American Eel (Anguilla rostrata): Fst = 0 and North Atlantic Oscillation effects on demographic fluctuations of a panmictic species. Molecular Biology 22, 1763-1776.
DNREC. 2018. Delaware Fish Consumption Advisories. Delaware Department of Natural Resources and Environmental Control & Delaware Division of Public Health.
Facey, D. E., and M. J. Van Den Avyle. 1987. Species profiles: life histories and environmental requirements of coastal fishes and invertebrates (North Atlantic): American eel.
Miller, M. J., S. Bonhommeau, P. Munk, M. Castonguay, R. Hanel, and J. D. McCleave. 2014. A century of research on the larval distributions of the Atlantic eels: a re-examination of the data. Biological Reviews 000-000.
NJDEP. 2021 Fish Smart. Eat Smart. A Guide to Health Advisories for Eating Fish and Crabs Caught in New Jersey Waters. NJ Department of Environmental Protection & NJ Department of Health.
Nye, J. A., M. R. Baker, R. Bell, A. Kenney, K. H. Kilbourne, K. D. Friedland, E. Martino, M. M. Stachura, K. S. Van Houtan, and R. Wood. 2014. Ecosystem effects of the Atlantic Multidecadal Oscillation. Journal of Marine Systems 133:103–116.
Schmucker, A. K., N. S. Johnson, H. S. Galbraith, and W. Li. 2016. Glass-eel-stage American Eels respond to conspecific odor as a function of concentration. Transactions of the American Fisheries Society 145:712–722.
Smiley, W. (1884). US Fisheries Commission Bulletin. 4: 469-470.
Sykes, J. E., & Lehman, B. A. 1957. Past and present Delaware River shad fishery and considerations for its future. US Fish and Wildlife Service. No. 46.
USFWS (U. S. Fish and Wildlife Service). 2015. Endangered and threatened wildlife and plants; 12-month finding on a petition to list the American eel as threatened or endangered. Federal Register 80:95 (10 October 2015): 60834–60850.

Haley Oleynik University of Delaware
Trawl survey data from Delaware Bay revealed a shift in the fish community over the last three decades (Oleynik 2020). In this feature box, we’ll explore long-term fish community trends and explain possible mechanisms for these changes.
Delaware Fish and Wildlife conducts two fish and macroinvertebrate trawl surveys which take place once a month between April and November at fixed sampling stations in Delaware Bay (Fig 1). The smaller, 16-foot survey, samples along the coastline of the Bay and up into the Delaware River, and typically catches smaller, juvenile animals, while the larger, 30-foot survey, samples in the deepest parts of the Bay along the shipping channel typically catch larger, adult animals. The two surveys date back to the 1960s, making them some of the longest-running state trawl surveys in the U.S.
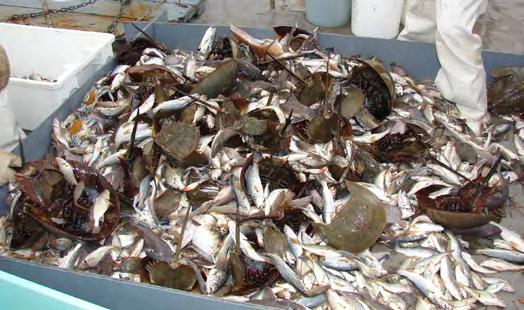


Nearly 200 species of finfish and shellfish were caught in the trawl surveys since 1960. Many of these species are transient marine species, which move in and out of the Bay, and up and down the coast, throughout the year, making Delaware Bay an ecologically and economically important habitat for the entire East Coast. Our analyses of these trawl survey data revealed changes in the overall fish and macroinvertebrate community composition through time, with a significant increase in species richness, or the number of species caught in the surveys, since 1990. We also found a significant increase in temperature and a significant decrease in dissolved oxygen in Delaware Bay, indicating a change in the physical environment (Fig. 2).
To explore fish community changes further, we assessed species accumulation, which represents the relationship between species richness and the area or effort sampled. In this case, a species accumulation curve represents the accumulation of species when sampled from individual trawls within the entire Delaware Bay. The species accumulation curves for each year were calculated and then linearized to determine their slope. The slope of species accumulation curves has been correlated to community

metrics including abundance, species richness, and species diversity, and it may be a more efficient measure of overall community ‘health’ than a combination of these community metrics (Novaglio et al. 2016). We found that slopes increased since 1990, echoing the increasing trend in species richness (Fig. 2). Studies have shown that disturbed ecosystems that experienced greater anthropogenic pressure typically have lower species accumulation slopes than undisturbed ecosystems (McClanahan 1994; Flather 1996; Cannon et al. 1998; Tittensor et al. 2007). Thus, the increase in species richness and species accumulation may indicate an increase in overall community health through time in Delaware Bay. This trend in richness and accumulation may be, at least in part, due to habitat restoration and improvements in water quality that have taken place in Delaware Bay since the 1980s.
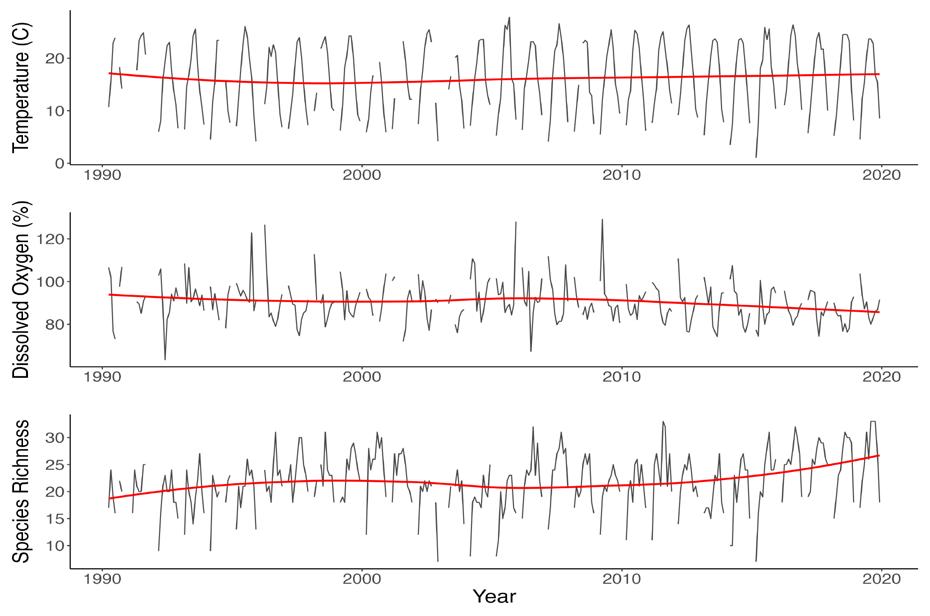
Figure 2. Monthly time series of temperature (°C), dissolved oxygen (percent saturation), and species richness (# of species) in Delaware Bay from 1990 to 2019. The red line represents a LOESS smoother to show the general trend.
While restoration and water quality may have helped to improve community health, further analysis also revealed community-wide reorganizations in Delaware Bay through time. Delaware state scientists noticed that some species, such as winter flounder, were caught frequently in the trawl surveys in the 1960s, 70s, and 80s, but began to disappear, and are almost never caught in the present day. Upon examination of single species patterns of occurrence through time, this appeared to be true for a number of other species as well, which typically have more northern distributions. These included species like winter skate (Leucoraja ocellata), silver hake (Merluccius bilinearis), and Atlantic herring (Clupea harengus) for which Delaware is at the southern extent of their distribution. Similarly, species with more southern ranges that were not caught in the early years of the survey began to show up in later years. These included species like sandbar shark (Carcharhinus plumbeus), spot (Leiostomus xanthurus), and bluntnose stingray (Dasyatis say), for which Delaware Bay is at the Northern extent of their distribution (Fig. 3, Table 1).

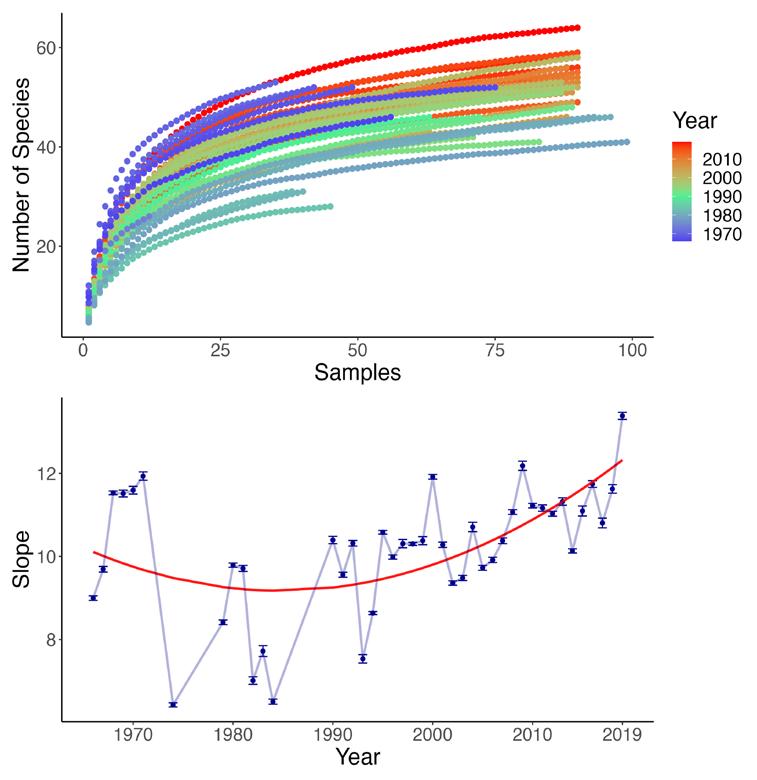
Figure 3. Species accumulation curves, color represents year (top); Slope and standard error of species accumulation curve by year (1990-2019) with a weighted quadratic fit in red (bottom).
To explore possible climate-related mechanisms of community change, mean mid-latitude of the marine community in Delaware Bay was assessed through time. Mid-latitude was characterized for each species using the information in FishBase, and the mean mid-latitude was taken for the whole community in each year to see the trend through time. These results show that the mean mid-latitude of the community has decreased through time, meaning that more southern range species are now dominating the community composition (Fig. 4). Mean preferred temperature was also explored in a similar way; the mean preferred temperature for each species was taken from a temperature range in FishBase, and then mean preferred temperature for the entire community was characterized through time. This trend showed an increase in mean preferred temperature through time, indicating that species that inhabit warmer waters are being caught more frequently in Delaware Bay (Fig. 4). These trends indicate a clear shift in the community through time, and the increase in species richness and species accumulation suggest that Southern range species are possibly showing up faster than Northern range species are disappearing. One possible ecological explanation for the difference in rates, indicated in prior research, is that species ranges generally expand faster poleward than they contract at the lower latitudes of their distribution due to climate change (Parmesan and Yohe 2003). While increasing temperature has not yet been directly linked to these changes in community in the Delaware Bay, temperature was found

to be the greatest driver of temporal and spatial variability in the estuarine fish community (Oleynik et al. in review). As climate change continues to drive changes in physical conditions, particularly in more vulnerable marine environments like estuaries, the community in Delaware Bay will likely continue to change into the future.
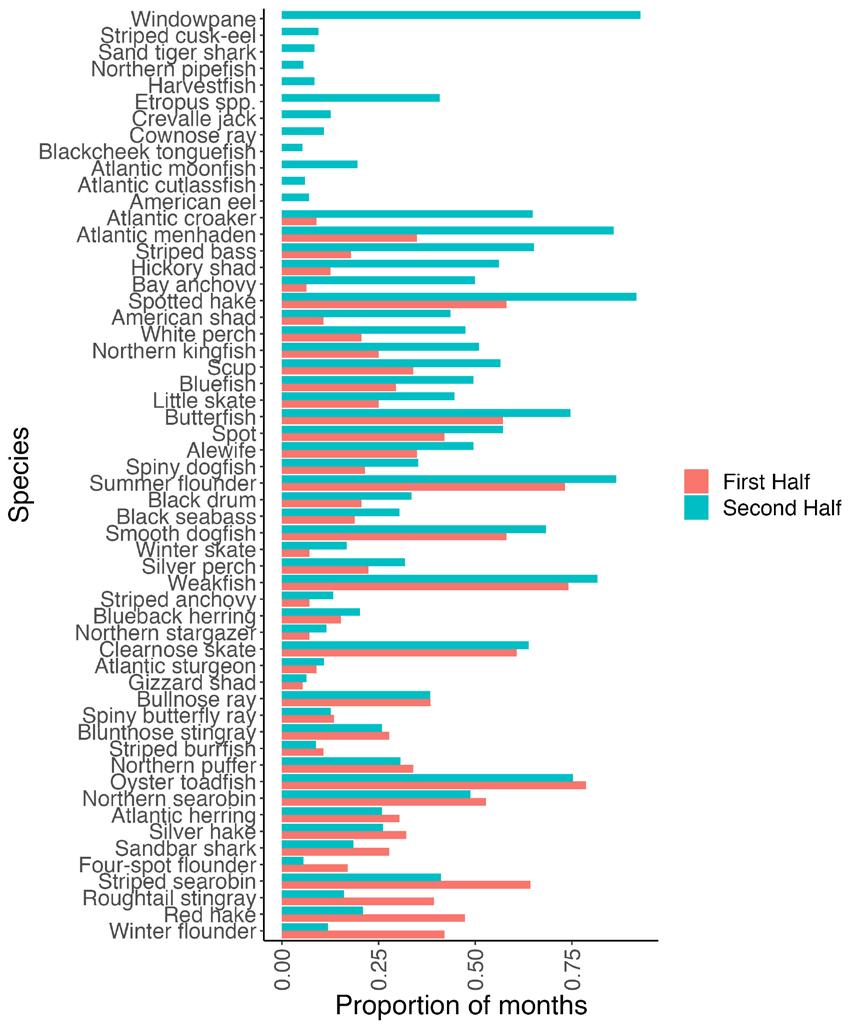
Figure 4. Proportion of months each species was caught in the 30-foot survey for the first half of the time series (1966-1984) in red and the second half, (1990-2019) in blue. Species occurring in less than 5% or more than 95% of months were excluded.
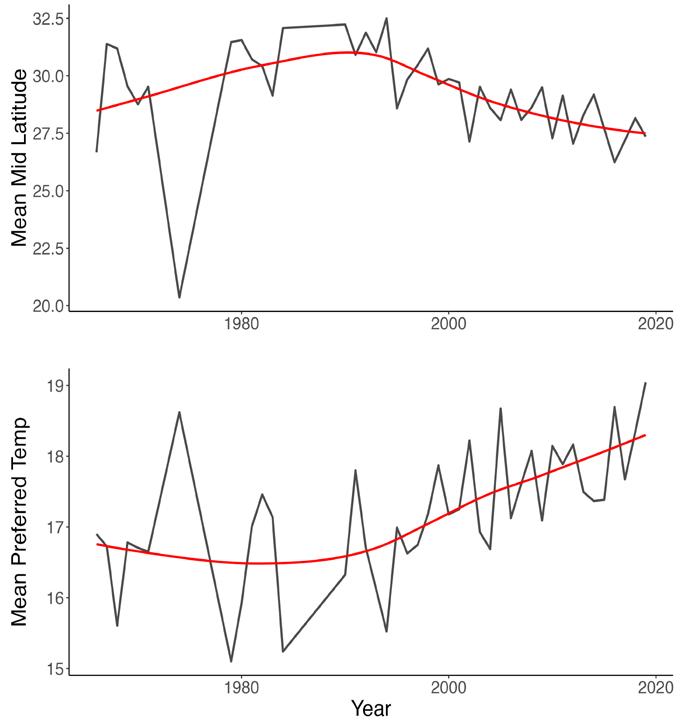
Figure 5. Mean preferred temperature (°C) and mean mid latitude from fishbase. org by year for fish species from 1966 to 2019 from the 30-foot survey. The red line represents a LOESS smoother to show the general trend.
Table 1 Occurrence of each species caught in the 30-foot survey by decade. Green “x” represents caught, white “0” represents not caught.
Species
The following fish were caught across all decades, from 1960s to 2010s:

Atlantic Menhaden, Atlantic Sturgeon, Black Drum, Black Seabass, Blueback Herring, Bluefish, Bluntnose Stingray, Butterfish, Clearnose Skate, Conger Eel, Four-spot Flounder, Gizzard Shad, Hickory Shad, Hogchoker, Little Skate, Northern Kingfish, Northern Puffer, Northern Searobin, Oyster Toadfish, Red Hake, Roughtail Stingray, Sandbar Shark, Scup, Silver Hake, Smooth Dogfish, Spiny Butterfly Ray, Spiny Dogfish, Spot, Spotted Hake, Striped Bass, Striped Burrfish, Striped Searobin, Summer Flounder, Weakfish, White Perch, Windowpane, Winter Flounder


Cannon, C. H., Peart, D. R., & Leighton, M. (1998). Tree species diversity in commercially logged Bornean rainforest. Science https://doi.org/10.1126/science.281.5381.1366
Flather, C. H. (1996). Fitting species-accumulation functions and assessing regional land use impacts on avian diversity. Journal of Biogeography https://doi.org/10.1046/j.1365-2699.1996.00980.x
Froese, R. and D. Pauly. Editors. 2021. FishBase. World Wide Web electronic publication. www.fishbase.org. McClanahan, T. R. (1994). Kenyan coral reef lagoon fish: effects of fishing, substrate complexity, and sea urchins. Coral Reefs https://doi.org/10.1007/BF00303637
Novaglio, C., Smith, A. D. M., Frusher, S., & Ferretti, F. (2020). Identifying historical baseline at the onset of exploitation to improve understanding of fishing impacts. Aquatic Conservation: Marine and Freshwater Ecosystems, 30(3), 475–485. https://doi.org/10.1002/aqc.3264
Oleynik, H. A. (2020). Changes in a Mid Atlantic estuary: trends and drivers of the fish and macroinvertebrate community in Delaware Bay. (Publication No. 1237124312) [Master’s thesis, University of Delaware]. https:// udspace.udel.edu/handle/19716/28649
Oleynik, H.A., J. J. Bizzarro, E. A. Hale, & A. B. Carlisle. In review. Environmental drivers of biogeography and community structure in a Mid-Atlantic Estuary. Oecologia
Parmesan, C., & Yohe, G. (2003). A globally coherent fingerprint of climate change impacts across natural systems. Nature. https://doi.org/10.1038/nature01286
Tittensor, D. P., Micheli, F., Nyström, M., & Worm, B. (2007). Human impacts on the species-area relationship in reef fish assemblages. Ecology Letters https://doi.org/10.1111/j.1461-0248.2007.01076.x