
5.1.1.6. Specifications
Clear bay length: 750 mm (Outer dimension 840 mm, including two 40 x 45 mm nibs at bottom)
Rise of arch: 290 mm
Shell thickness: 25 mm
Unit weight: 50 kg per meter length
Length: Up to 5.4 m
Design mix: Cement: Fine Aggregate 1:2 to 1:3 by weight, M25 grade Water: Cement ratio 0.45 to 0.55 Fine Aggregate should be coarse sand confirming to grading Zone II as per IS Code 383-1970
Mesh reinforcement: 200 mm strip of MS weld mesh of 12-gauge, 25 mm square opening along crown of channel GI wire chicken mesh of hexagonal 12 mm opening, 22 gauge, throughout the shell and double layer of 1 m length at both ends of channel
Nib reinforcement: Roof application: from 6 mm for 3 m span to (1 no. In both nibs)12 mm for 5.4 m span Floor application: from 8 mm for 3 m span to 16 mm for 5.4 m span
Design load: As per BIS: 875 Load carrying capacity of FC Channel roof varies from 650 2 kg/m to 1200 kg/m depending on the reinforcement
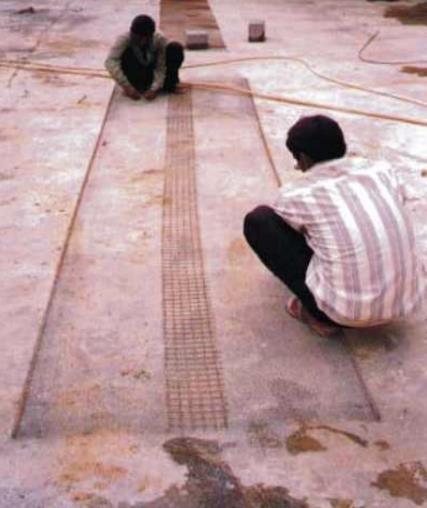
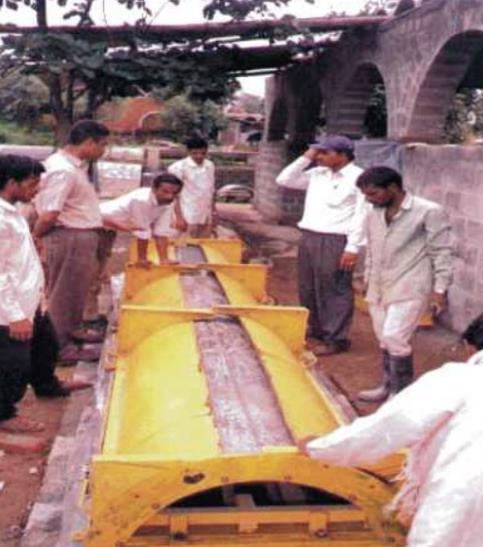
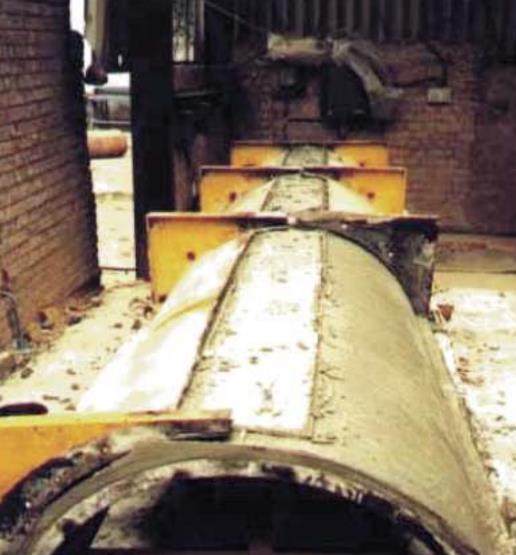
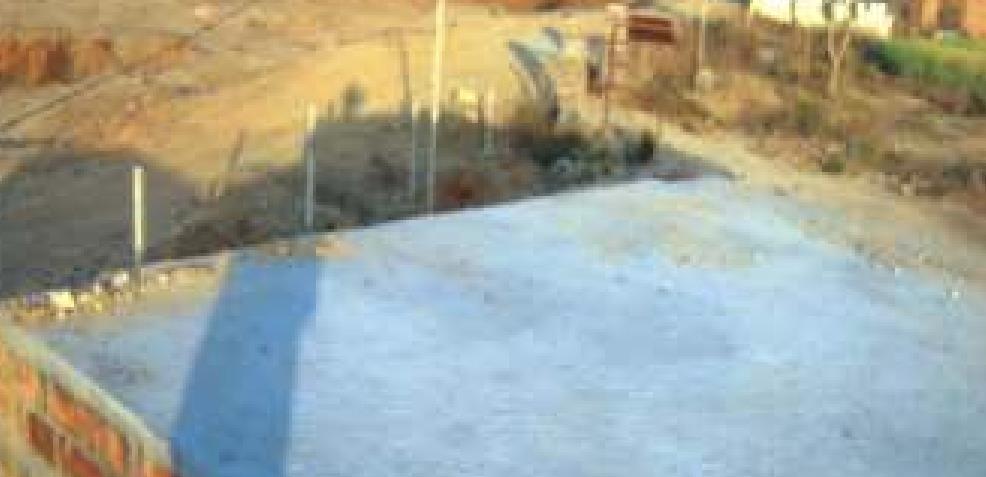
5.1.1.7. Construction


6. CHECKLIST FOR PLACEMENT OF FERROCEMENT
6.1. Resource Management Parameters
1)Raw materials-
Reinforcement steel stored separately as per bars of different diameter, length, and grade wise with proper labelling.
Weld mesh roll is opened in the reverse direction of its curvature.
After cutting chicken mesh the ends of wires are folded back immediately.
Cement is fresh, free from lumps & stored in dry condition
Aggregates/Sand is clean, free from organic matter and relatively free from clay and silt
Water is fresh, clean, and potable. Admixture stored in covered storage area, cool, dry place, away from sunlight.
2)Equipment and tools-
Calibration of weighing balances satisfactorily done. All required sieves available are in satisfactory condition.
Condition of steel/mesh bending, cutting, welding machines satisfactory.
Condition of mortar mixer machine satisfactory
Availability of tools like piers, hooks, trowels, plumb with satisfactory condition
3)Testing and documentation-
Testing of cement as per inspection testing plan(ITP) satisfactory
Testing of sand/fine aggregates as per inspection testing plan (ITP) satisfactory
Testing of steel as per inspection testing plan (ITP) satisfactory.
Brand/make/age of admixtures as specified.
Testing of mesh as per inspection testing plan (ITP) satisfactory
Testing of mortar as per inspection testing plan (ITP) satisfactory
6.2. Site supervision
6.2 1. Pre-Placement
Inspection before placement of ferrocement
1 Centre line, Location of structural elements
2 Formwork & Staging
3 Construction joint location*
4 Steel diameter & coating
drawing
per the drawing & in exact plumb
the drawing
specification
6
7
9 All precast panels in level as per thickness.
6.3. Finished quality:
Sl. No Parameters
1 Quality of joint filling found ok
2 No damages observed in precast panels.
6.4. Note
All the empty space has to be filled and remarks if any shall be written in remarks column.
Date of inspection of pre-concrete, during placement and post-concrete placement shall be noted as these steps may not be performed on the same day.
Signature by contractor supervisor and engineer is done after each inspection.
7. QUALITY TOOLS
Quality Management tools help employees identify the common problems which are occurring repeatedly and also their root causes. Quality Management tools play a crucial role in improving the quality of products and services.
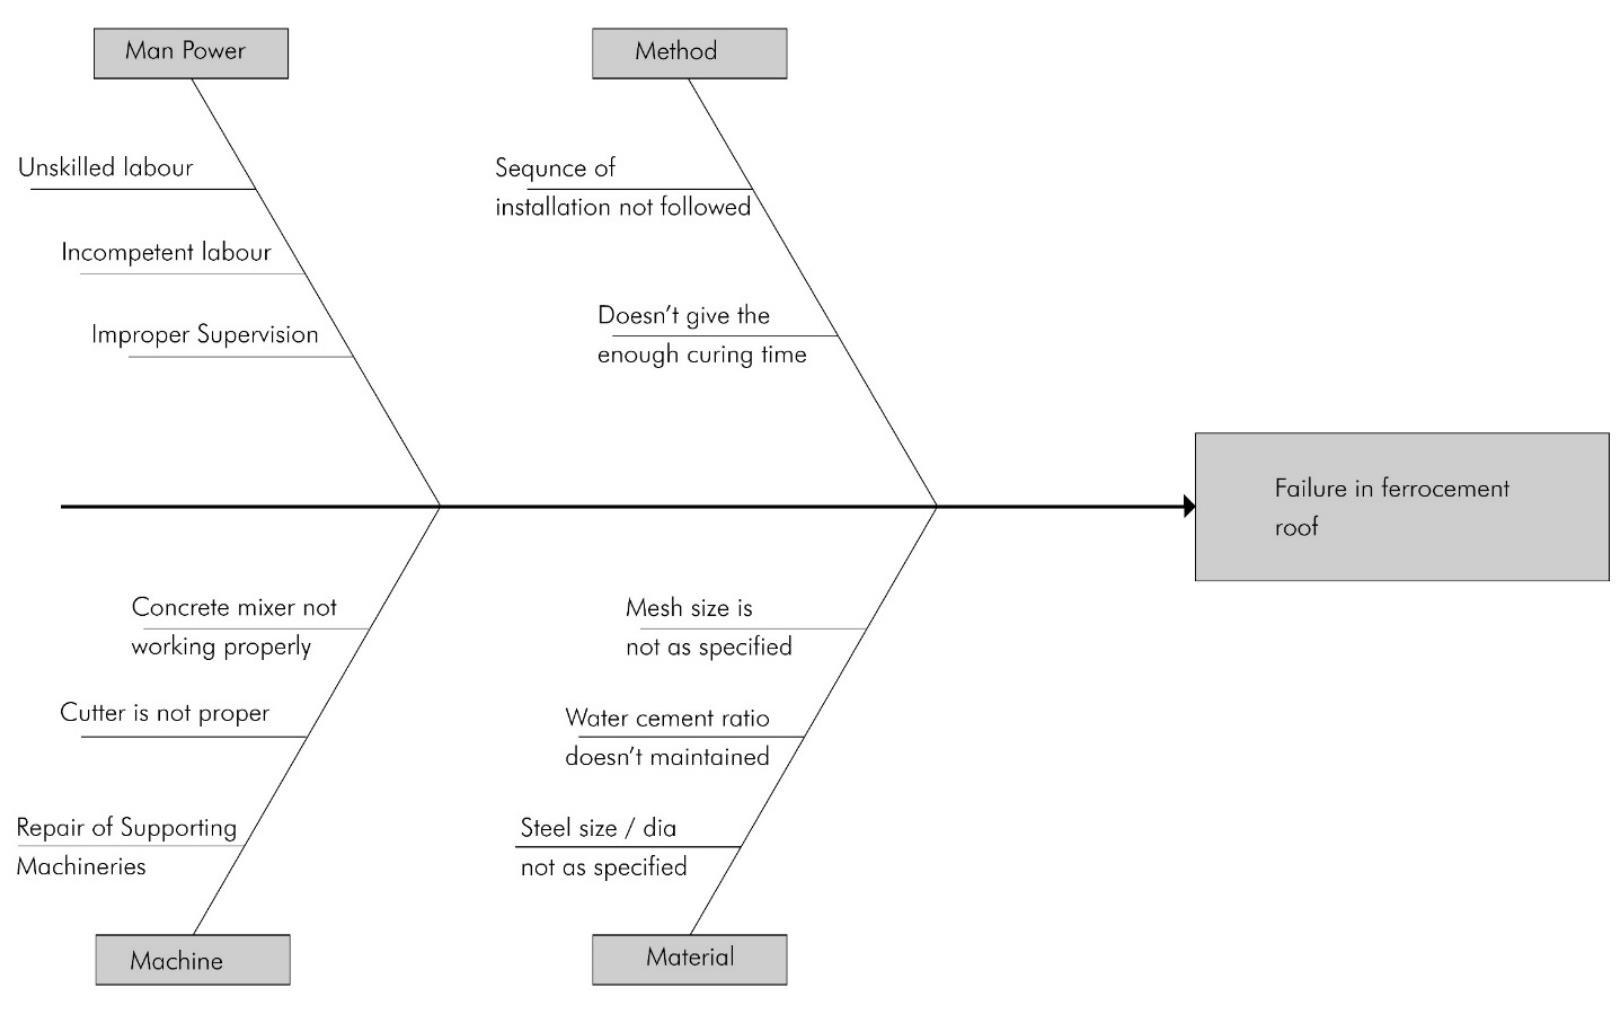
A cause-and-effect diagram is also called an Ishikawa diagram, after its developer
Kaoru Ishikawa, or a fishbone diagram
It is used to identify possible causes and effects in processes. It is used to explore all the potential or real causes that result in a single output
The causes are organized and displayed in a graphical manner to their level of importance or details.
The diagram is a graphical display of multiple causes with a particular effect.
The effect or problem being investigated is shown at the end of the horizontal Arrow
The causes are organized and arranged mainly into four categories.
7.2. Flow chart
Inspect the ferro cement roof ( recast/ n site )
Checking for the h sical ama e in the roof or precast panels Improper finish, eflection in panel
Re ection 1
Checking for the Chemical ama e in the roof or precast panels Concrete degradation
Re ection 2
No No
Checking for the tructural ama e in the roof or precast panels
Re ection 3
No
es es es
Employ physical resistance principles
Employ chemical resistance principles
Employ structural resistance principles
roceed the panel for Construction
Flow chart to determine the employable repairing principles of ferrocement
Rejection Percentage - Project 1
Rejection 1 - Physical Properties
Rejection 2 - Chemical Properties
Rejection 3 - Structural Properties
Rejection Percentage - Project 2
Rejection 1 - Physical Properties
Rejection 2 - Chemical Properties
Rejection 3 - Structural Properties
Rejection Percentage - Project 3
Rejection 1 - Physical Properties
Rejection 2 - Chemical Properties
Rejection 3 - Structural Properties
COMPARISION OF THREE PROJECTS
Compared to three projects defect in rejection physical properties gives more impact in the project
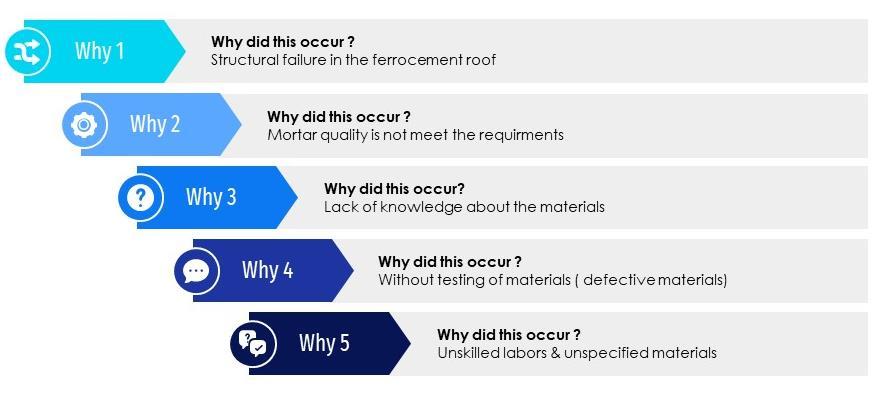
7.4. Five why analysis
7.5. Process diagram objective
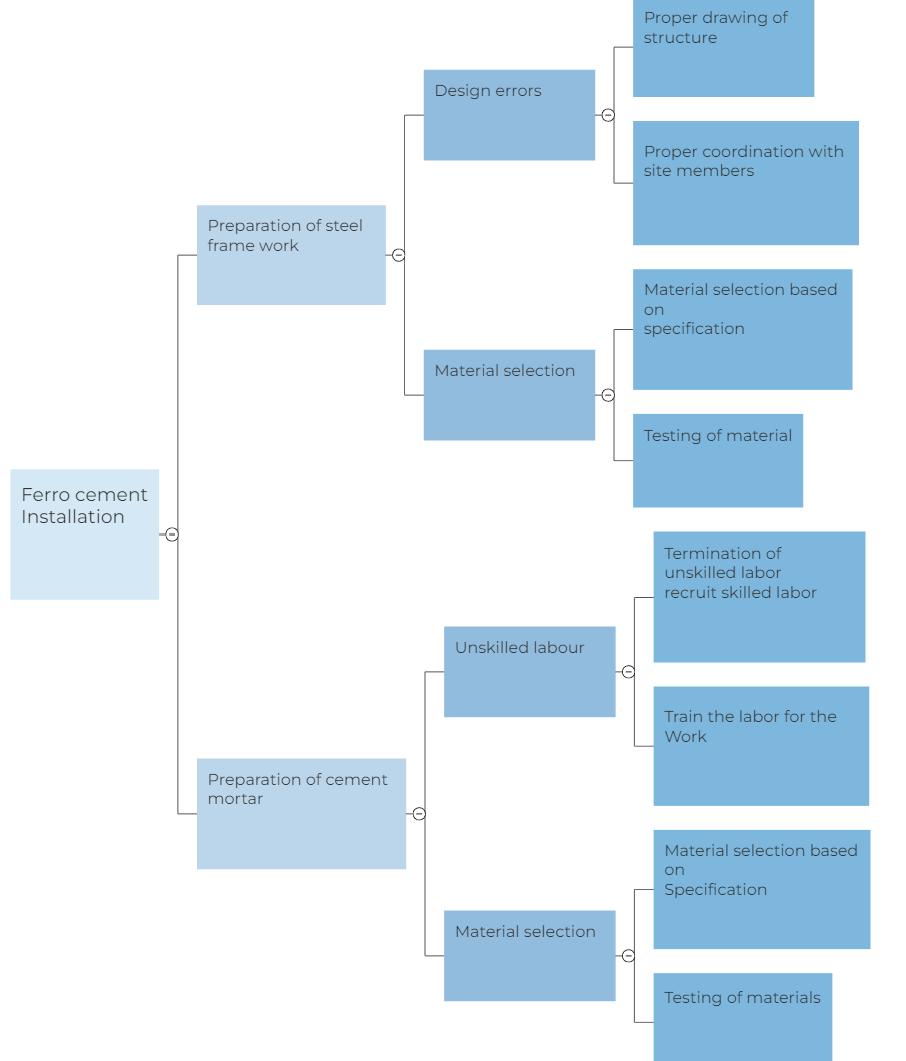
Task
Possible mistake
Contingency Plan
7.6. Comparison chart
Therefore, cost for 3m ferrocement roofing channel roofing = 1417 Rs.
Consider Room size: 10ft. × 10ft.
No. of ferrocement channel required = 8 Cost of channels required =8×1417 =Rs.11336
Cost of gap filling between channels and installation=1500Rs.
Total cost required for 100sq. ft. =12836 Rs.
Therefore, Total cost using ferrocement channel roofing system = 128 Rs. /sq. ft
Total cost using conventional (R.C.C) roofing system = 200 Rs. /sq. ft
COST COMPARISON
Ferrocement Rcc