Switched-on to Resilience

ASSET MANAGEMENT PLAN 2024 UPDATE FOR THE PERIOD
1ST APRIL 2024
THROUGH TO 31ST MARCH 2034


ASSET MANAGEMENT PLAN 2024 UPDATE FOR THE PERIOD
1ST APRIL 2024
THROUGH TO 31ST MARCH 2034

4 5 6
We’re more excited about our future than ever before. To find out more about the journey ahead, our 2024 Asset Management Plan update (AMP update) highlights the material changes in key investments for the next ten years. This not only involves maintaining the high-quality network we’re known for, but also planning for future demand by continually innovating. All up, it means we’re keeping our customers and stakeholders at the forefront of our decision making.
The electricity sector is not immune to uncertainty and many factors can affect forecasting demand, from emerging new technologies to evolving policy and changing markets. On the supply side, global conflicts continue to destabilise trade and supply chains, and inflation has continued to increase the cost of delivering work. Despite these shifts, we’re still determined to make long-term investment decisions that will have a net cost-benefit for our customers and ensure that our network remains safe, resilient, reliable, sustainable, and affordable.
Our E3 Strategy (see p.7) provides the framework for how we will navigate these challenges. You’ll see it focuses on extracting more value from the core business, exploring alternative energy solutions, and expanding our capabilities well into the future. This AMP Update builds on the progress made during 2023 and should be read in conjunction with last year’s full AMP.
During the planning period of this AMP Update, we remained focused on collecting more data on our exposure to natural disasters to allow detailed planning for risk reduction in future years. Cyclones Dovi and Gabrielle provided first-hand experience of the intensity of storms we may expect in the future. We have also commissioned resilience exposure studies that are assisting us to develop targeted and prioritised initiatives.
In addition to the development of our core business systems and capabilities outlined in this document, our asset management system is currently being aligned to the requirements of the ISO 55001 Asset Management Standard. Safety remains a priority, and we continue to apply a “Good Work” approach which is captured in an internal threeyear continuous improvement plan.
Phase 1 of our Distribution System Operator (DSO) transformation roadmap is underway and is providing enhanced visibility of our high and low voltage networks. Section 2 provides detail around this, and any necessary investments are clearly outlined in this document.
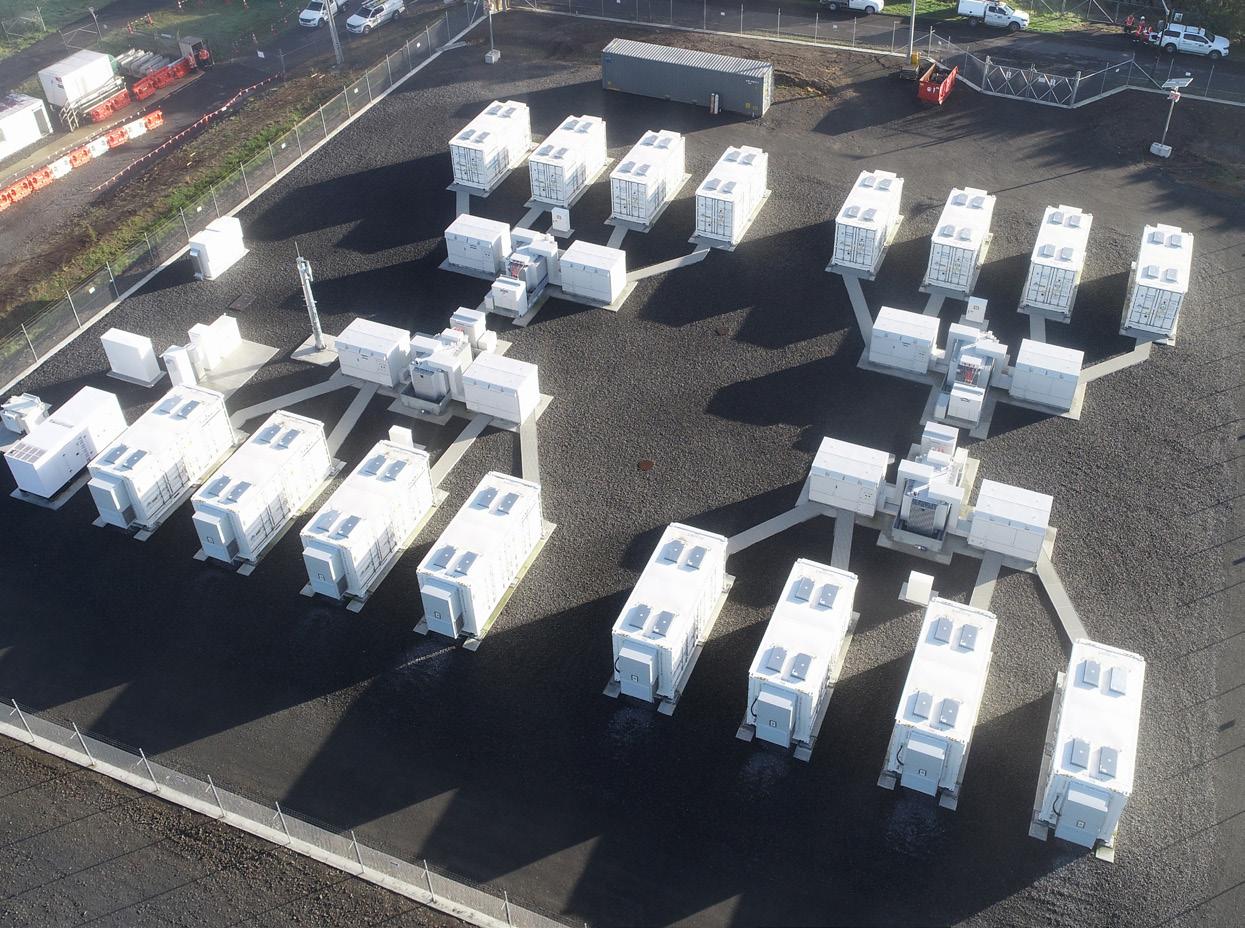
October 2023 saw the launch of our 35MWh Rotohiko Battery Energy Storage System (BESS), the first battery of this scale in New Zealand. It’s an exciting milestone for our business which improves the resilience of the electricity system and will increase the value of intermittent renewable generation in the region as uptake accelerates. Our investment in network technology – as well as our support for EV uptake through We.EV – demonstrates our ongoing commitment to a brighter, more sustainable energy future.
AT A GLANCE : IN OUR 2024 AMP UPDATE, THE MOST SIGNIFICANT CHANGES OVER THE PERIOD OF THE 2023 AMP ARE:
AN INCREASE IN OUR CUSTOMER INITIATED WORKS FORECAST OF $95.1M
Although we’re expecting a slowdown in residential, commercial, and industrial development activity in FY25, growth is not expected to be as slow as previously forecast. Increased demand is expected from the middle of the planning period. This demand is expected to rise from; residential intensification of Hamilton, increased investment in decarbonisation of industrial processes, growing EV uptake, and increasing adoption of distributed generation and distributed energy resources.
AN UPLIFTED INVESTMENT IN NON-NETWORK CAPEX BY $23.5M
This will support the significant enhancement of our asset management and DSO capabilities and covers LV works management, digital transformation, data management, acquisition, and platform services.
AN INCREASE OF $6.4M FOR NETWORK DEVELOPMENT
The bulk of this is to improve the resilience of the network from high impact, low probability (HILP) events and bring forward feeder reliability projects to enhance our network performance.
Over the past 12-months we’ve identified opportunities to improve the forecasting of the required asset replacement programme, via upfront scoping of all asset classes and improved per unit cost estimation. However we will still have a small uplift of $3.3M due to changes in asset replacement quantities, as detailed in section 3.2.3. These adjustments will ensure that our investments are not only prudent and efficient, but will also deliver a network that remains safe, resilient, and reliable – ultimately enabling our communities to thrive.
The past year has seen continued increases in our Network OPEX costs. These have been driven by increases in labour costs and service provider costs (e.g. traffic management). We expect that these costs will continue to increase in line with inflation so have factored this in to the projected OPEX spend.
In FY25 we are planning to upgrade SAP to S/4Hana and invest in integration and data platforms (adding $4M). In addition, our digital transformation is estimated to add $4M pa in SaaS/licencing costs.


WEL GROUP IS
WEL GROUP HAS OVER % 100 OWNED BY THE COMMUNITY
350 PEOPLE WHO DELIVER ELECTRICITY SERVICES TO OUR COMMUNITIES
WEL NETWORK CONNECTS MORE THAN
100,000 RESIDENTIAL PROPERTIES AND BUSINESSES INCLUDING
944 COMMERCIAL INDUSTRIAL

WEL NETWORK MAINTAINS
7
,083
KILOMETRES OF LINES 48% ARE OVERHEAD
71,200
HOMES AND BUSINESSES CURRENTLY HAVE ONE OF OUR SMART METERS
FROM APRIL ‘22 TO MARCH
‘23 ACROSS OUR 25 PUBLIC EV CHARGERS WE’VE SAVED
723,800kg of CO2e
WEL’s network stretches from Hamilton in the southeast, to Raglan in the west and to Maramarua in the north. WEL also owns and operates small, embedded networks in Cambridge and the Auckland Region.
Southgate
Brick St
Hulme Pl
Ryan Pl
Flagship
Compass Pt
Dannemora
Porchester Road Wattle Downs
Our electricity network consists of six main elements: Grid Exit Points, Distributed Generation, 33kV Subtransmission, Zone Substations, 11kV Distribution and the Low Voltage Network.
FIGURE 1
WEL Networks boundary and small embedded networks in Cambridge and Auckland
Enabling our communities to thrive
To create and support an innovative and sustainable energy future
We deliver that through our
A strategy that unlocks our energy potential by extracting value from our core services, exploring energy solutions, and expanding our thinking into the future.
EXTRACT THE CORE VALUE ENSURING WE GAIN THE GREATEST BENEFIT FROM THE INVESTMENTS MADE IN OUR CORE INFRASTRUCTURE.
EXPLORE ENERGY SOLUTIONS PROVIDING WHAT CUSTOMERS AND BUSINESSES NEED TODAY AND TOMORROW FOR A LOW CARBON, LOW PRICE, CHOICE-DRIVEN ENERGY FUTURE.
EXPAND INTO OUR FUTURE STATE INCUBATE NEW IDEAS WITH A VIEW TO INVEST IN SCALEUPS AND START-UPS TO INCREASE OUR OFFERING AND OUR NON-REGULATED REVENUES.
In March 2023 we published a comprehensive Asset Management Plan (2023 AMP), which is available on our website. This AMP Update states material changes (greater than $500,000) to the 2023 AMP as required by the Electricity Distribution Information Disclosure Determination 2012. We have not repeated the detailed explanations provided in the 2023 AMP here – so it’s essential you read the 2023 AMP in conjunction with this update.
Section 1 provides an overview of this AMP, WEL Networks and uncertainty in our planning horizons. It provides our E3 Strategy which has been set to deliver our vision.
Section 2 outlines work that is underway to ensure that WEL adapts to our changing environment and ensures that we are well placed to meet the opportunities ahead.
Section 3 looks at material changes to our current 2023 network development plans, lifecycle asset management plans, and asset management practices – and explains our reasoning behind them.
Section 4 contains our updated Disclosure Schedules.
Section 5 provides a summary of WEL's approach to the Tranche 1 Amended Information Disclosure Requirements.
Section 6 contains the Directors’ Certificate.
This AMP Update has been structured to meet disclosure requirements and is in a similar format to our previous AMP updates. It gives an overview of the changes we foresee in our operating environment –and how these affect our forecasts.
Our AMP period is 1 April 2024 to 31 March 2034, with the caveat that, naturally, there will be a higher level of accuracy in the earlier years than the later ones.
This plan was approved and certified by the WEL Networks Limited Board of Directors on 5th March 2024.
The plan is publicly available on our website for anyone to read. However, our primary audiences are our stakeholders, wider community, our customers, the Commerce Commission, the Electricity Authority, and our staff and contractors.
What areas does the information disclosure cover?
This AMP Update covers* material changes in the last AMP to:
• Network development plans
• Lifecycle asset management plans
• Forecast capital and operational expenditure
• Asset management practices of WEL, and
• Drivers underlying those changes.
*Full disclosure requirements are set out in the Electricity Distribution Information Disclosure Determination 2012.
Forecasts allow us to plan and help us see any obstacles on the road ahead. But as the past few years have shown, there’s always a degree of uncertainty, particularly over longer periods. There are a number of good reasons for this: technology moves quickly, policies change, markets shift, demand fluctuates, and customer trends happen quickly. Other factors, including short-notice commercial customer applications, result in changes in demand that are difficult to predict. On the supply side, there has been significant uncertainty driven by the ongoing economic impact of global conflicts.
1.4.1 What can we do to mitigate change?
The size and timing of our distribution investment is based on net cost-benefit to customers over the lifecycle of customer demand and network assets. It’s a tricky balance. Adjusting our network investment ensures that network expansion meets our communities’ needs within finite financial and workforce capacity and minimises overall risks.
1.4.2 Can you expect to see any more changes?
Nobody can accurately predict the future, but we can prepare for it based on our best analyses. Consequently, it’s possible we will need to make changes as time goes on, in line with our continual improvement philosophy for Asset Management. This means our development plans and corresponding investments may be amended in subsequent revisions of the AMP – reflecting the emerging needs of our customers, stakeholders and changing circumstances on the network.

WE’RE DEALING WITH 6 MACRO MEGATRENDS
1 DIGITAL TRANSFORMATION AND DISRUPTIVE TECHNOLOGIES
3CLIMATE CHANGE MITIGATION AND ADAPTION
5 TRADE AND GLOBALISATION
2 ENVIRONMENTAL, SOCIAL AND GOVERNANCE AND SUSTAINABILITY
4LABOUR, SKILLS SHORTAGE, AND DEMOGRAPHIC SHIFTS
6 POLITICAL AND ECONOMIC VOLATILITY
LEADING US TO KEY INITIATIVES

• IMPROVING RESILIENCE
• DIGITAL TRANSFORMATION
• DSO
• ENERGY MANAGEMENT
We are investing in the network of the future, so it’s fit for purpose today – and tomorrow. From the resilience of our network assets and easier access to information, to the emerging demands of electrification and our Distribution System Operation (DSO) initiatives and changing customer needs, we’re focused on building a robust network – and that means greater visibility of LV networks. Here, we describe our response to these drivers.
New Zealand has committed to achieving net zero greenhouse gas emissions by 2050. Electricity has a key role to play in achieving the country’s climate ambitions. That said, the changes required – not least the speed at which these changes must be implemented – is unprecedented. Two of the largest impacts are electrification of transport, and electrification of heating systems (process heat in particular).
Electric Vehicles (EV) are here to stay
We continue to plan for multiple scenarios for EV uptake to guide investment. Our current EV uptake model is based on studies undertaken on the impact of EV on our network from 2021 and updated with real world information from We.EV. As more data comes in, we are starting to see the ramp up of EV charger infrastructure by corporates for both light and heavy vehicles. Currently the EV uptake numbers in the WEL network area are lagging the study by about a year.
EV charging infrastructure is having an impact on both Customer Initiated Works (CIW) and the Network Development CAPEX. This will require investment at all voltage levels, an allowance over the AMP period of $39M has been allocated under CIW expenditure and $57M has been made in the Network Development category.
From fossil fuels to cleaner futures WEL has worked with DETA consultants to gauge the appetite of customers to convert from fossil fuel burning to electricity. While there’s little doubt that electrification of commercial business will happen, the timing and extent of that is still largely unknown. There are large variances in the forecasts due to conversion costs and it’s expected that biomass boilers will also play a large role in future. Nevertheless, we cannot afford to take a ‘wait and see’ approach. With this in mind, we have taken a conservative approach to commercial customer electrification and have allowed $10M over the AMP period. We will continue to monitor this situation and adapt our AMP as we see signs of change in the market and watch as Government and regulatory policy develops.
For us, resilience is the capacity to anticipate, absorb, quickly recover, and learn from events that impact on our ability to provide services to our customers.
To ensure we respond effectively to the resilience challenges we have begun to develop a Resilience Strategy which will guide and prioritise our activities. This strategy will be completed in FY25. Our roadmap of activity will be based on the following six macro-Megatrends,
1. Digital transformation and disruptive technologies (including cybersecurity)
Core to transforming our industry over the coming decades will be adoption of new technologies. Technology is seen as a positive disruptor, enabling gains in resource efficiency and productivity. However, technology also comes with an increased risk of cyberattacks through enhanced connectivity.
Our response:
We’re bringing digital and data to the core of our business. Our digital strategy has recently been completed, see section 2.3. We’re also increasing our utilisation of leading edge technology and data to ensure that we are placed to provide the network of the future, see also the section on DSO.
2. Environmental, Social and Governance (ESG) and sustainability
Increasingly a business’s license to operate hinges on its ESG decisions through adherence to government policies and as more socially conscious generations age there is an expectation that governance and corporate decisions not only consider financials, but also environmental and societal impacts.
Our response:
WEL has an existing Sustainable Business Plan for 2021-30. The plan aligns to four of the of the United Nations’ Sustainability Development Goals (SDGs) to focus our activity. This plan will be reassessed in light of the current activity in developing this overarching Resilience Strategy to ensure we address emerging trends and issues. This plan will be updated by the end of FY25.
3. Climate change mitigation and adaption and the low carbon energy transition
We are experiencing more extreme and frequent weather events requiring updated assessments of network resilience with these changing weather patterns. Business’s sustainability and ESG decisions as we transition to a low carbon energy system will have significant impact to our industry through electrification. These decisions will increase electricity demand and the need for greater investment in electricity infrastructure.
Our response:
Our strategy to diversify our network assets to include a range of distributed generation is underway with solar farms in progress. Solar farms have the dual benefit of providing redundancy of supply along with being low emission generation. We achieved a key milestone with the launch of our Rotohiko BESS in October 2023, the largest grid scale battery in NZ. The battery is an energy storage facility which will improve the resilience of the New Zealand electricity system. The battery’s role in reducing the need for non-renewable energy sources will be a key contributor to lowering emissions in support of New Zealand’s Net Zero emissions target by 2050.
We have commissioned a report on climate related risks to our network, in particular in relation to flooding and inundation. The data is now being factored into network resilience for both new build and remediation. Our next step is to better understand network vulnerabilities in relation to wind (storm) events.
The electricity sector is going to experience growth rates higher than ever seen and the demand for people will be significant and globally the sector will be competing for people from the same talent pool. With the digital transformation different skills and capabilities will also be needed to take advantage of new technologies. There are also the changing expectations of younger talent on employers with flexible working and a need for personal alignment to business ethos being an important part of their employment decisions.
Our response:
Our existing workforce plans include growing our own talent through the provision of trainee/ internships and our work on attracting and retaining people. We are completing an external review of our Employee Value Proposition (EVP) to assess our current benefits package and prioritise any additional benefits. Whilst these activities remain a central part of our strategy the volume of work and competition for talent saw us introduce two new network service partners to support our in-house delivery arm with the build and maintenance of our network.
Shocks to global trade have prompted responses from companies and governments to increase resilience in their supply chains, and businesses to adapt, creating permanent shifts in global trade patterns and the need to seek more strategic trade partnerships.
Our response:
We are now holding higher stock levels to ensure we keep on top of delays being experienced in the supply chain. Additionally, we have added alternative suppliers across key network stock to provide greater diversification. While the significant delays experienced as a result of Covid have eased we will continue to hold higher stock levels compared with pre-Covid levels due to the ongoing heightened international risks.
The scale of change in technology, climate, demographics, and trade will create instability as economies and governments deal with an evolving global environment, with global and domestic risks set to remain or increase over the coming decades. Developed markets will need to increase productivity (in a current environment of productivity recession) against a backdrop of declining working age populations.
Our response:
We are actively involved in both national and international industry groups to ensure we remain up-to-date on the latest trends and any emerging risks. This will help us to proactively respond to anything that arises and helps us to stay at the forefront of industry thinking.
A review of our response to cyclones
Dovi and Gabrielle identified several areas for improvement, including:
• Conversion of a meeting room into a fit-for-purpose incident response room with multiple information screens and all other resources to manage a major event
• Development of a customer restoration prioritisation procedure
• Critical Incident Management System (CIMS) incident management training for key roles involved in our response
• Systems to quickly identify CIMS roles and responsibilities
• Development of smart meter tools to aid in the prioritisation of restoration, verify customer supply post fault restoration, and detect any additional faults (e.g. broken neutrals and loose connections)
• Improved systems for scoping damage and repair methodologies.
Specific improvements included:
1. Mitigating scrub fire risks
We’ve implemented a system for monitoring and minimising scrub fire risks from network faults, utilising NIWA’s Fire Risk modelling data. This system will predict high fire risk conditions to implement control measures and is integrated into our network management system.
2. Locating line clashes
We’ve used our LiDAR data, fault information and line design software to identify/verify high potential locations of line clashing on the network. We addressed these locations in our FY24 work program.
3. Identifying third party risks
We’ve undertaken a risk assessment of network assets that are located in third party buildings. This risk assessment is being used to inform our replacement program, refine our inspection/maintenance programmes, and identify mitigations required.

From decarbonisation and DER disruption to customer demands and behaviours, the pace of change occurring in our industry is relentlessly fast. The traditional methods of working are neither efficient nor sustainable, so to enable our business we need to have systems and processes that allow our staff and contractors to make effective decisions based on up-to-date data.
We are currently in the process of a major digital transformation initiative. This will ensure that we have the right digital capabilities in place to support the business and our customers in the years ahead. There are three key areas:
We need to leverage the vast amounts of data that we capture to make the best possible investment decisions as customer demand increases. Traditional design approaches that are based on assumptions and calculations will be augmented by digital models and actual usage data to optimise our network designs and the resulting capital expenditure. Realtime data from the electricity network will be used to identify operational issues and allow us to substitute reactive fault work for planned maintenance and upgrades.
This ensures that all business-critical processes are supported with the appropriate digital solutions. In many cases this will mean enabling our staff to leverage data and systems that we already have in the most effective way possible. We’ll focus on digitally enabling time-consuming and error prone manual processes to improve efficiency, accuracy, safety and job satisfaction. We’ll also provide better support to manage the flow of work through our organisation via digital workflow management and greater enablement of existing mobile devices to provide access to data, documents, and systems when and where they are required. By leveraging modern cloud and mobile technologies, we can deliver an employee experience that both supports and encourages digital collaboration across the whole company, leading to faster, more informed, decision making.
We will review our existing customer engagement channels to determine if they are fit for purpose and meeting our customers’ expectations. Where we have digitally enabled our internal processes, we will seek to provide transparency of work requests to our customers to enable customer self-service via updated and/or new digital channels. We will seek new ways to become closer to our customers and to better understand their needs and support them through greater use of digital technology.
Underpinning this work will be several foundational platforms. While some of these platforms are already in place, there is still a significant amount of work required to update them and to ensure that the quality of data is sufficient to support our digital aspirations. These include:
1. Enterprise resource planning
SAP is our core financial and asset management system. This is a ‘best of breed’ platform, however it requires a significant upgrade to remain supported and to unlock new capabilities.
2. GIS
In FY24 we upgraded our GIS platform to ESRI. This is the preferred GIS system platform for electricity distribution companies across the globe. The migration to ESRI included a transition from a basic geometric model to the more sophisticated Utility Network (UN) model. This platform will form the base of our geospatial model and gives us the ability to provide asset information in a more useful and accurate format.
3. Metering headend management
WEL invested in bringing the smart meter headend in house rather than remaining with a Software as a Solution (SaaS) out of the United States. The primary benefit of hosting the headend in NZ is it provides the network with greater flexibility in the development of tools and insights from the smart meter data. Two data centres geographically separated in New Zealand were selected to host the servers and associated equipment and to provide redundancy. By relocating the system to a New Zealand environment, system resiliency is improved, and the overall ownership cost is reduced. The project is part of WEL’s commitment to increase its understanding and management of the Low Voltage Network, and to further develop DSO capabilities to help meet decarbonisation targets.
4. Network management system
GE PowerON is our core network management system (NMS) and it’s the primary platform that supports our controllers in managing the real-time activities of the network, including the safety of any work undertaken. This platform has been well maintained and supported, but it is due for a routine upgrade which will be undertaken in late 2024.
5. Network visibility and insight systems
GridSight and PI Vision are the core of our new Distribution System Operator (DSO) platform. While the DSO is still in its formative phase, it is already delivering tangible business benefits to the network. These benefits and the DSO roadmap illustrate the opportunity for leveraging network data to improve the way that we design, build, manage, and operate the network. As the DSO platforms evolve, more work will be undertaken to provide robust two-way integration with other systems to fully realise the benefits from the DSO operating model.
6. Overhead network management
We have undertaken a LiDAR survey of our overhead network. We are currently exploring the potential of integrating this data into Neara, our line design software. This initiative will provide us with a ‘digital twin’ of our overhead network to enable modelling of differing weather conditions on the network, so we can then determine resilience improvement opportunities. It will also improve the efficiency and accuracy of our line designs and safety of work delivery.
7. Energy management
We are investigating systems that will actively visualise and manage energy flows within our network. The global drive for decarbonisation is seeing rapidly increasing uptake of DER, as it is critical that the energy flows are managed in a way that gives flexibility to both the customer and the network without massive interruption. This allows us to ensure that the network has the ability to predict load on the network, then defer load to non-peak periods in near real-time whenever appropriate. The deferral of load ensures that the network can be effectively managed without the need to ‘over build’ at significant additional cost.
Two additional platforms are going to be deployed to address missing architectural capabilities required to support our digital technology transformation. These are:
We have bespoke integration between our many systems; an integration platform will enable cheaper and more reliable integration between our current systems, and any new ones. While some systems make use of bespoke integration methods, others operate in isolation and require data to be manually updated across multiple systems at the same time. It’s anticipated that the implementation project will start in FY25.
Multiple silos of data exist across WEL’s systems. There is significant untapped business value and a lot of useful information within these data assets. A robust and scalable approach to capturing and storing this data – as well as secure methods for reporting, analytics, and data-sharing across the business – is needed to ensure the best possible decision making.
Historic planning methods have served us well in the past and resulted in a well-designed and managed network. However, given the changing landscape ahead of us, this would require changes far greater than the capacity and resources available and would drive a network that is unreliable and costly to operate. This would become a roadblock to both energy affordability and NZ’s decarbonisation goals. There is a pressing need to decode the large volumes of information available to realise our ambitions. To enable these changes WEL created a DSO team in 2021. While still in the early stages of the transformation to the network operator of the future, exciting benefits are already being realised, and the team is constantly looking for new ways to address current and future scenarios.
The WEL DSO strategy and roadmap was published in November 2021, the following diagram provides a simple view of where we are currently, and the next steps we are taking. You’ll see our WEL DSO transformation is right in the middle of the Phase 1 implementation and we are close to kicking off our Phase 2 development projects. The first step in Phase 2 is our Distributed Energy Resources Management System (DERMS) implementation. In 2024 we will also kick off the phase 3 planning in parallel with Phase 2 in other workstreams. In this roadmap, we have identified the top six issues that must be addressed by taking a different approach, which include:
1. Operational safety risks due to data error and equipment failure – Safety
2. An aging network with more defects due to equipment deterioration – Asset Integrity
3. Higher energy cost, construction costs, labour costs and equipment costs – Affordability
4. Reduced system availability caused by frequently occurring major climatic events – Resiliency
5. Growth of new connections and higher capacity demand occurring at a rate faster than we can manage - Electrification
6. Consumer owned DERs and utility scale DERs causing reverse energy flow and subsequent power system constraints – Compliance
As presented in the DSO roadmap (refer to the diagram below), we have initiated the WEL DSO program to deliver this transformation program. All DSO work streams are inter-related but also have components that must delivered sequentially, which makes program planning and resource management very challenging.
Multiple benefits are being realised by WEL from the DSO R&D low voltage insights and tools being produced for business adoption. The outcomes from these insights address health and safety risk and cost savings for both customer and network. The following is a summary of achievements to date:
• Developed a pilot fault detection system for major event response.
• Data science and a new system to detect HV line down, neutral faults, LV burning conductors, as well as equipment failure prediction.
• Reinforcing the network metering system and proactively managing comms issues, faulty meters and obsolete equipment.
• A new DSO application to support new connection assessment process.
• Pilot solutions to address DER integration needs to avoid system overloading and supply compliance issues.
• New data analytic solutions to assist network planning functions.
• New systems to support network engineering and design functions.
• Engineering logic to detect network connectivity issues to support GIS development.
• Working with external aggregators, DER managers and retailers on developing non-network solutions and proving technology trials for an open network
5
Distributed Energy Resources (DER) are having an impact on the network and WEL believes that this impact will continue to grow. For NZ to realise its climate change goals the successful integration of DER will be critical. WEL has undertaken a number of different investments and studies to enable this future state.
On the 20th October 2023 WEL celebrated the launch of our Rotohiko Battery Energy Storage System (BESS). It’s the culmination of a lot of hard work, creativity, innovation, and collaboration by many of our own talented people, our WEL Group subsidiaries, partner organisations, suppliers, and stakeholder groups.
The 35MWh BESS is the first battery at this scale in New Zealand and something we are proud of. It will deliver significant benefits by improving the resilience of the electricity system through the reserves market, while also increasing the value of intermittent renewable generation in the region.
Rotohiko is aligned to our long-term strategy, primarily ensuring that the delivery of electricity to our customers remains affordable. It achieves this through generating revenue via energy arbitrage. It’s also capable of providing fast reserve support for the North Island grid, maximising the benefits of solar power as our own solar farm projects continue to develop.
The BESS can store enough energy to meet the daily demands of over 2,000 homes, and it will play an important role in reducing the need for non-renewable energy sources, actively lowering emissions in support of New Zealand’s 2050 Net Zero target.
WEL is focussed on supporting New Zealand’s net carbon zero journey and are aligned to the United Nations Sustainable Development Goal #7 (Affordable and Clean Energy). Resource consents have been received for two solar farm sites near Rangiriri. The projects (10MW AC and 22.4MW AC) are in the final stages of engineering development for Board Final Investment Decision (FID). The projects once approved will be constructed through our subsidiary DER development company Infratec. It is anticipated to have at least one of the projects generating in the 1st quarter of 2025. The sites are embedded within WEL’s 33kV network.
In 2021, WEL engaged two consulting firms to independently analyse the EV market in Europe, bring those insights back to a New Zealand context and forecast the impact to the WEL Network. The result was that by 2040, we would have to double the network from current valuation if no action was taken to manage the additional load and network peaks. While the DSO is working closely with aggregators, WEL established an EV charger business unit in early 2022. Focusing initially on fleet operators, significant savings were made for customers through smart design and charging solutions that avoid costly network connection upgrades.
Unmanaged Residential EV’s can cause congestion at peak periods which is part of the future challenge network owners face to ensure we enable new DER coming onto our network and maintain a reliable electricity supply.
One of WEL’s responses to this challenge was for the business unit called We.EV to trial a residential customer EV charger solution as it is clear this market segment will have the greatest impact on the network. Through using an EV Charger platform, WEL can control the charger loads at network peaks if and when necessary via the DSO Distributed Energy Resource Management System (DERMS).

New DER coming onto the network is both a challenge and an opportunity and depending on how they are utilised and managed can have both positive and negative impacts. Over the past 12 months we have seen a significant increase in DER connection requests, and in particular aggregators installing residential battery and solar systems. Managed DER that charges household batteries overnight from the network and throughout the day from solar while discharging through peak times can see a reduction in consumption during peak periods reducing costs to the end consumer.
Historically residential usage patterns have largely followed the same profile however, as more DER comes on, we are seeing a shift in consumer usage patterns. We are working with aggregators to understand both what impact they will have on our network, but also what services they may provide. Network alternatives (such as DER) may provide greater cost benefit value to our consumers as opposed to traditional methods of build as the nation electrifies.
Figure 4 is an example of customers pre DER and post managed DER usage profiles.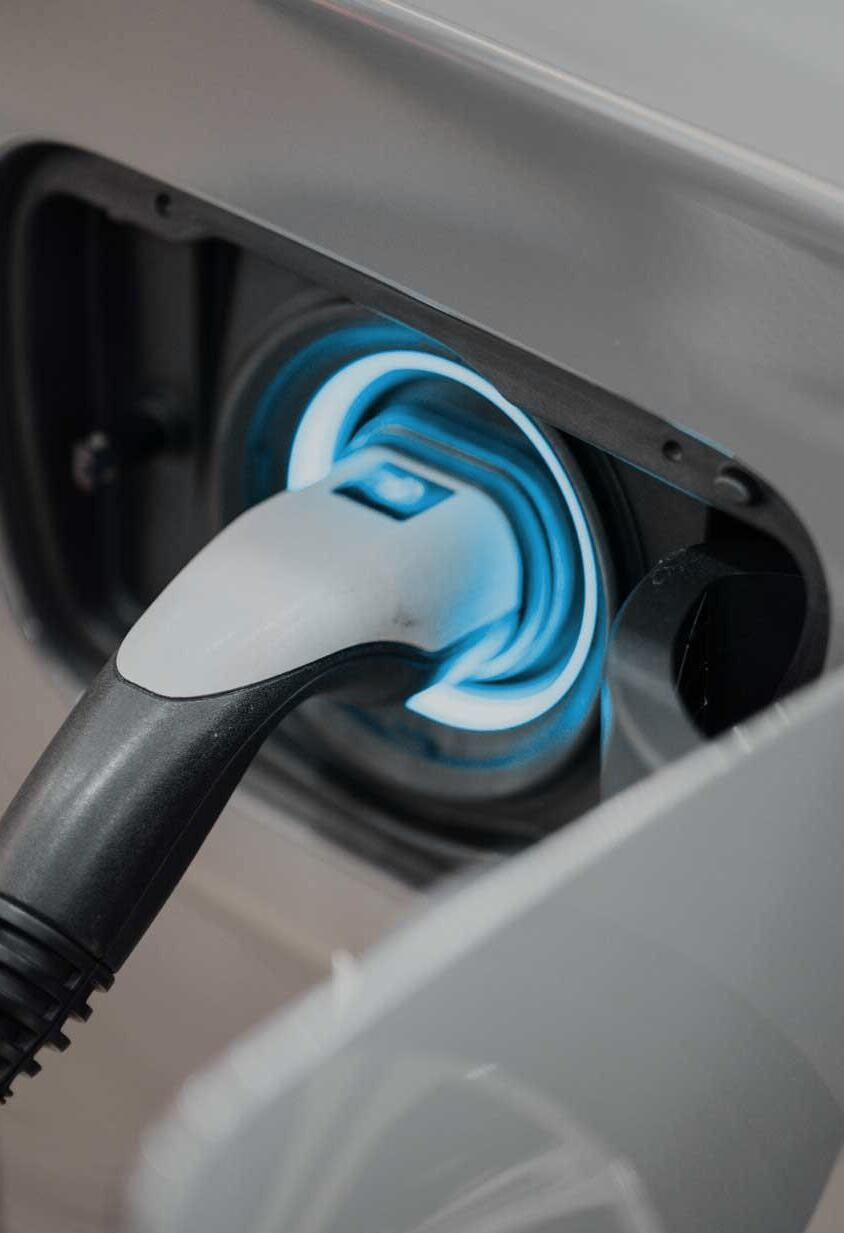
 CHAPTER 3
ASSET MANAGEMENT PLAN UPDATE 2024
CHAPTER 3
ASSET MANAGEMENT PLAN UPDATE 2024

This section presents a high-level overview of the material changes to our forecasts and assumptions, and our related Network Development Plans, Asset Lifecycle Plans and Asset Management practices. Although you’ll see that significant external factors continue to impact the organisation – delivering a safe, resilient, and reliable electricity network to meet our customers’ needs remains our absolute priority. (It’s also worth noting that for the expenditure plans discussed in this section, a material change is defined as >NZ$500,000.)
Year-on-year inflation of input costs is normally around 2 – 3%. At the time of undertaking the analysis for this AMP the inflation forecast for FY25 was 2.3%, from FY26, it’s expected to return to the normal inflation range for the planning period. To forecast as accurately as possible, we’ve used a forecast of annual CPI of 4.5% for FY2024, 2.3% for FY2025, and 2% from then on. Network CAPEX for the AMP period is forecast to increase by $104.8M compared to last year, largely due to changes in CIW forecasts.
Hamilton’s 2022 gross domestic product (GDP) grew at a rate of 4.1% to $13.4 billion, against national GDP growth of 2.3%. GDP growth of 3.2% was experienced in the Waikato District in 2022 with the biggest contributors being manufacturing, construction, agriculture, forestry, and fishing.
In 2023 we engaged the University of Waikato to provide insights into the future population growth for the WEL Networks region. Based upon this work, we have forecast population growth of 1.4% per year over the next 10 years. From this, we estimate that around 1,760 to 2,320 new dwellings will be built each year over the medium to long-term.
In our 2023 AMP we forecast a significant and rapid slowdown in new residential development over the short-term. This slowdown has not actually effected our required delivery, and although recent discussions with developers suggest that activity will likely reduce through FY25, the downturn is unlikely to be as sharp as previously expected. By contrast, in the medium to long-term, demand resulting from EV adoption and electrification of industry is expected to increase markedly. Responding to these drivers will require significant expenditure in reticulation upgrades. We’ve detailed our input assumptions (used to formulate the various growth scenarios) in the following table:
Our demand forecast scenarios are graphically presented in Figure 6. The scenario (Med) represents a balanced view of the many factors influencing demand and is used as a fair indicator in our network development decision-making processes.
The Customer Initiated Works (CIW) forecast includes consumer connections, new subdivision reticulation, asset relocation expenditure, and a provision for electrification, including greater uptake of solar PV and electric vehicles. As noted earlier, a short-term slowdown in residential expansion is expected compared with FY24. The same underlying economic drivers will likely contribute to a slowdown in EV adoption compared to the forecast in our 2023 AMP. While industrial and commercial enquiries remain strong, a downturn in activity in these sectors is expected in FY25.
In the longer term, increased demand is expected to be driven by residential intensification plans for Hamilton, increased investment in decarbonisation of industrial processes (electrification of process heat), EV uptake, and adoption of distributed generation and distributed energy resources. These growth drivers result in a $95.1M increase in the CIW expenditure forecast from FY25 to FY33 compared to our 2023 AMP. This growth has been factored into our demand forecasts and is illustrated in the graph below in terms of capital expenditure (CAPEX).
Our Network Development Plan includes expenditure associated with system growth, assuring legislative and regulatory compliance, and improvements to reliability, safety, and environmental performance. There are few material changes, including bringing forward the delivery of several distribution feeder reliability projects identified in the 2023 AMP, and increased investment in fibre network projects to improve the performance and resilience of sub-transmission protection systems (which is reflected in our updated network communications strategy). Some system growth projects have been deferred in the short-term.
The recent cyclones have highlighted the need for improved resilience of all critical infrastructure. Electrification to support the decarbonisation of the economy will increase the country’s dependence on electrical infrastructure, further underscoring the importance of resilience in our sector. An additional investment of $8.8M from FY26 to FY34 has been allocated to bolster the network against high impact, low probability (HILP) events. These funds will kickstart initiatives we identify through resilience gap analyses and risk studies.
The following table summarises the material changes to Network Development projects presented in the 2023 AMP, along with our reasons for the changes (the specific need for these projects, and the options considered, are covered in the 2023 AMP and remain unchanged.)
The net effect of these changes and nonmaterial adjustments is increased expenditure on Network Development of $6.4M from FY25 to FY33 compared to our 2023 AMP. (Keep in mind that all costs are presented in FY24 dollars to facilitate comparison, and values will differ from those presented in the 2023 AMP.)
New: Initiatives for enhancing WEL’s resilience maturity driven by our resilience strategy currently under development
Adjusted: Costs adjusted, to allow additional voltage management and network reinforcement projects
Adjusted: Cost adjusted based on recently completed substation projects. This cost has been benchmarked against other EDBs. Deferred: Based on re-forecasted loading in the area
Adjusted: Cost adjusted based on recently completed projects
Adjusted: Cost adjusted for additional underground sections
Adjusted: Cost adjusted based on recently completed projects
New: Introduced to allow for offloading of either half bus at the Hamilton
substation
Adjusted: Cost adjusted based on recently completed projects
Accelerated: To address load growth in the south-eastern region of the Finlayson Rd zone substation
Adjusted: Cost adjusted based on recently completed projects
Accelerated: based on reforecast growth
Adjusted: Scope reduced as proposed projects did not demonstrate required benefit
Our asset replacement and renewal strategy remains aligned to those detailed in our 2023 AMP. It’s our strategy to balance cost, risk, and performance drivers by maintaining a constant level of risk for our asset portfolio over the planning period. The long-term asset strategy is being reviewed and enhanced to better direct asset lifecycle decisions in the future. This strategy is expected to be in place by March 2024.
However, we’ve had to make a few adjustments to Asset Replacement and Renewal Plans – largely to improve investment efficiency, updated cost data, and a better understanding of asset performance and condition.
These include:
1. Capitalised vegetation management expenditure:
An additional budget has been made available to accommodate the capitalisation of vegetation works in conjunction with asset renewal projects. This will enable us to hold our Vegetation Management OPEX budget flat.
2. Increases in cost per unit:
This incorporates increases in labour, material, and services costs driven by inflation across all asset classes.
3. Increases in number of units addressed:
3.1 Ring main units
Additional ring main units have been included in the renewal programme. This is to counter the frequency of equipment failures and any related increase in risk to safety. This will increase the total number of units replaced over the 10 years – from 130 units to 175.
3.2 Air break switches
For the same reasons as the units above, we’re increasing the total number of units replaced over the 10 years – from 130 units to 150.
3.3 Cables
Budget was allocated for proactive cable replacement in the 2023 AMP, and this will be carried forward for the planning period.
4. Decrease in pole replacements:
The number of poles to be replaced has been reduced from 220 to 160 per year over the planning period, starting from FY25. This is due to our improved understanding of the condition of the assets and updates to CBRM models.
5. Substation assets replaced:
Planned relay replacements at Chartwell substation have been consolidated to include replacement of the SCADA RTU device. Other substation asset classes that are included in this plan are consistent with the 2023 AMP. These adjustments result in a total increase of $3.3M from FY25 to FY33 compared to our 2023 AMP.
Like the Asset Renewal Capital Expenditure profile presented in the 2023 AMP, the years FY25-FY27 are relatively flat. From FY28 there is an increase in expenditure on ring main units, LV underground cables, and zone substation transformers, driven by asset age and condition.
This is expected to increase by $23.5M compared to the 2023 AMP. Indexed to this year’s costs, the changes can be summarised as:
Strategic projects +$13.1M
Routine non-network +$10.4M
The key changes since the last AMP are:
• Smart Meters and Easements included as non-network CAPEX $11.2M
• Building and facilities costs updatedrelating to a new building being constructed in FY25, and ongoing costs around the ageing existing building $11.2M
Material changes to forecast operational expenditure
Network operational Expenditure
Recently we have seen increases in our Network OPEX costs. This has been driven by increases in labour costs, service costs (e.g. traffic management), resource availability (e.g. Vegetation now covers three full teams), more accurate capture of actual costs compared to previous budget assumptions. This has resulted in an increase of $13.5M from FY25 to FY33 compared to our 2023 AMP.
The changes in operational expenditure, from the 2023 AMP (indexed to this year’s costs), over the previous AMP period, can be summarised as:
System operations -$5.9M
Business support +$49.7M
This has resulted in a total increase of $43.8M, across the previous AMP period, as illustrated in Figure 13.
As outlined on pages 14-16 “Future Focused: Our Digital Journey”, WEL is activating our digital strategy to ensure we remain in technical support, and we have the right digital capabilities in place to support the business and our customers in the years ahead.
A number of the platforms we are upgrading or implementing are now cloud based and/ or Software as a Service (SaaS) offerings, resulting in an annual operating expense rather than the traditional upfront capital expense (e.g. on-premise with perpetual licenses).
Looking to FY25, upgrading SAP to S/4Hana and implementing both Integration and Data Platforms is forecasted to result in additional OPEX of $4M. In addition, upgrades / implementations forming our digital strategy are estimated to result in annual SaaS/ licence costs of $4M p.a. into the future.
The activation of our digital strategy will ensure our business has systems and processes in place that allow our staff and contractors to make efficient decisions based on up-to-date data.
3.4.1
The changes in capital expenditure, from the 2023 AMP (indexed to this year’s costs), over the previous AMP period, can be summarised as a total increase of $128.4M, as illustrated above.
The changes in capital expenditure, from the 2023 AMP (indexed to this year’s costs), over the previous AMP period, can be summarised as:
Customer Initiated Works +$95.1M
Asset renewal +$3.3M
Network development +$6.4M
Non-network CAPEX +$23.5M
3 5
3.5.1
The changes in operational expenditure, from the 2023 AMP (indexed to this year’s costs), over the previous AMP period, can be summarised as a total increase of $57.3M, as illustrated above.
WEL is currently undertaking a project to gain certification to the ISO 55001 Standard, as part of a continuing effort to improve WEL’s systems and capability. This means we will be able to deliver an appropriate balance of risk management, cost, and asset performance for the communities we serve. The international standard for asset management is recognised by the NZ Commerce Commission as evidence of exemplary practice.
In FY24 we are observing an increase in the amount of planned SAIDI impacting our network. This will result in an increase in SAIDI from 35.6 minutes (WEL target) to a forecast of 60 minutes. This increase is the result of additional planned work being delivered on our network, especially with the introduction of Tier 1 service providers. In FY25 we are forecasting an increase from historic values due to the volume of work we are undertaking. It is currently predicted that this will increase to 52 minutes.
Our performance has been very good when compared to the wider industry. However, we acknowledge that the reliance on electricity is increasing with a shift to a decarbonised economy. We are actively investigating methods to reduce outages as much as possible wherever it is cost effective. This includes reviewing our live line process, changing our network standards, and investing in plant and equipment including non-wire solutions.
This schedule requires a breakdown of forecast expenditure on assets for the current disclosure year and a 10 year planning period. The forecasts should be consistent with the supporting information set out in the AMP.
The forecast is to be expressed in both constant price and nominal dollar terms. Also required is a forecast of the value of commissioned assets (i.e., the value of RAB additions).
EDBs must provide explanatory comment on the difference between constant price and nominal dollar forecasts of expenditure on assets in Schedule 14a (Mandatory Explanatory Notes).
EDBs must express the information in this schedule (11a) as a specific value rather than ranges. Any supporting information about these values may be disclosed in Schedule 15 (Voluntary Explanatory Notes). This information is not part of audited disclosure information.
Subcomponents of expenditure on assets (where known)
*EDBs’ must disclose both a public version of this Schedule (excluding cybersecurity cost data) and a confidential version of this Schedule (including cybersecurity costs)
Commentary on options and considerations made in the assessment of forecast expenditure EDBs may provide explanatory comment on the options they have considered (including scenarios used) in assessing forecast expenditure on assets for the current disclosure year and a 10 year planning period in Schedule
*include
This schedule requires a breakdown of forecast operational expenditure for the disclosure year and a 10 year planning period. The forecasts should be consistent with the supporting information set out in the AMP. The forecast is to be expressed in both constant price and nominal dollar terms.
EDBs must provide explanatory comment on the difference between constant price and nominal dollar operational expenditure forecasts in Schedule 14a (Mandatory Explanatory Notes).
EDBs must express the information in this schedule (11b) as a specific value rather than ranges. If EDBs wish to provide any supporting information about these values, this may be disclosed in Schedule 15 (Voluntary Explanatory Notes).
This information is not part of audited disclosure information.
disclose both a public version of this Schedule (excluding cybersecurity cost data) and
of this Schedule (including cybersecurity
EDBs may provide explanatory comment on the options they have considered (including scenarios used) in assessing forecast operational expenditure for the current disclosure year and a 10 year planning period in Schedule 15.
This schedule requires a breakdown of asset condition by asset class as at the start of the forecast year.
All
The data accuracy assessment relates to the percentage values disclosed in the asset condition columns. Also required is a forecast of the percentage of units to be replaced in the next 5 years.
poles / steel structure No.
All Overhead Line Wood poles No.
All Overhead Line Other pole types No.
HV
Line
OH up to 66kV conductor km HV
HV
All information should be consistent with the information provided in the AMP and the expenditure on assets forecast in Schedule 11a.
All units relating to cable and line assets, that are expressed in km, refer to circuit lengths.
This schedule requires a breakdown of current and forecast capacity and utilisation for each zone substation and current distribution transformer capacity.
The data provided should be consistent with the information provided in the AMP.
¹ Extend forecast capacity table as necessary to disclose all capacity by each zone substation
Information provided in this table should relate to the operation of the network in its normal steady state configuration.
Installed Firm Capacity
Constraint +5 years (cause)
No constraint within +5 years
Explanation
Subtransmission circuit Limited by the 33kV OH conductor current rating. Planned project for FY25 will address capacity constraint till FY27 after which load will be transferred to Gordonton substation following 11kV feeder upgrades and Chartwell substation once new substations Fairfield and Crosby are built.
Transformer Planned offload to nearby substations.
No constraint within +5 years
Transformer Planned offload to new Fairfield zone substation and Chartwell zone substation.
No constraint within +5 years
No constraint within +5 years
No constraint within +5 years
Transformer Currently meets WEL network security criteria through 11kV backfeeds. Transformer capacity will be reviewed when transformer renewals due at end of AMP period.
No constraint within +5 years
No constraint within +5 years Meets security of supply requirements. Industrial load step growth excluded in forecasts due to uncertainty.
Transformer New Kohia substation planned to support industrial and residential development FY24 - FY25.
No constraint within +5 years
Transformer Planned offload to nearby substations.
No constraint within +5 years
No constraint within +5 years New Airport substation planned to support industrial and residential development FY28 - FY31.
No constraint within +5 years Te Rapa co-generation already been decommissioned Jun 2023.
Pukete Anchor + WEL 11kV load on primary winding will exceed transformer primary 30MVA rating without intervention.
Subtransmission cables carry a portion of Sandwich Rd, Tasman, Kent St, Horotiu load.
Current work programme to repair cable joints will restore firm capacity. Planned offload to new Kohia zone substation starting FY24 will bring load within firm capacity.
Subtransmission circuit Planned Raglan 33kV resilience project, FY25.
Subtransmission circuit Planned 33kV overhead circuit & river crossing re-tensioning, FY25.
Transformer New Exelby substation planned to support Industrial and residential development FY25-FY29.
Transformer Industrial and residential customer dependent growth. Size of transformer will be considered closer to time of renewal.
No constraint within +5 years
No constraint within +5 years
Transformer Load can be transferred to the adjacent Glasgow St Substation in the event of a transformer outage. Planned projects to increase transfer capacity within Huntly area.
No constraint within +5 years
This schedule requires a forecast of new connections (by consumer type), peak demand and energy volumes for the disclosure year and a 5 year planning period.
The forecasts should be consistent with the supporting information set out in the AMP as well as the assumptions used in developing the expenditure forecasts in Schedule 11a and Schedule 11b and the capacity and utilisation forecasts in Schedule 12b.
*include additional rows if needed
This schedule requires a forecast of SAIFI and SAIDI for disclosure and a 5 year planning period.
The forecasts should be consistent with the supporting information set out in the AMP as well as the assumed impact of planned and unplanned SAIFI and SAIDI on the expenditures forecast provided in Schedule 11a and Schedule 11b.
1 This Schedule requires EDBs to provide explanatory notes to reports prepared in accordance with clause 2.6.6.
This Schedule is mandatory—EDBs must provide the explanatory comment specified below, in accordance with clause 2.7.2. This information is not part of the audited disclosure information, and so is not subject to the assurance requirements specified in section 2.8.
Commentary on difference between nominal and constant price capital expenditure forecasts (Schedule 11a)
2. In the box below, comment on the difference between nominal and constant price capital expenditure for the current disclosure year and 10-year planning period, as disclosed in Schedule 11a.
Box 1: Commentary on difference between nominal and constant price capital expenditure forecasts
The inflation forecasts for the 10-year planning period are based on the May 2023 monetary policy statement from Reserve Bank
Commentary on difference between nominal and constant price operational expenditure forecasts (Schedule 11b)
3. In the box below, comment on the difference between nominal and constant price operational expenditure for the current disclosure year and 10-year planning period, as disclosed in Schedule 11b.
Box 2: Commentary on difference between nominal and constant price operational expenditure forecasts (as per commentary above)

CHAPTER 5
TRANCHE 1 AMENDED INFORMATION REQUIREMENTS
WĀHANGA 1 NGĀ HERENGA PĀRONGO KUA PANONIHIA

Expand ID requirements related to how much notice of planned interruptions is given to consumers, including planned interruptions that are booked but not carried out.
Q1A - Narrative disclosure
Describe how WEL provides notice and communicates planned and unplanned interruptions, including any plans for changes or improvements in this area
Planned outages
2023 AMP 5.3.3
A network request system is utilised to apply for the outage within the WEL Advanced Distribution Management System (ADMS). The date, time, customer impact, and mitigation methods are assessed and approved. An EIEP5A file identifying the affected transformers, date, shutdown start and end time is auto generated and sent to the Electricity Authority Outage Portal a minimum of 10 days prior to the outage date. This portal is accessed by retailers to produce individual customer outage notifications. The notification process automatically generates a scheduled outage, which is published on the outage page on the WEL website in both list and graphical overlay format. Cancellations, time, and date changes greater than 24 hours prior to the notified outage are communicated to the retailer. A new EIEP5A file is sent to the EA Outage Portal and the outage map is updated automatically. Overruns, cancellations, time, and date changes within 24 hours prior to the notified outage are updated in the outage map and as a courtesy an EIEP5A file is generated and sent to the EA Portal.
Unplanned outages
An unplanned outage caused by a fault or emergency switching, automatically generates an EIEP5B file and updates the current outage map. An Estimated Time to Restoration is automatically applied and is updated as the fault cause and remedial actions are identified.
Call centre
We have an in-house Customer Call Centre during standard business hours and utilise a third-party call centre outside of business hours. The ADMS generates outage notifications to selected groups and people including the third-party call centre who generate automated outage messaging which is played to all incoming calls.
Add ID requirements on power quality.
Q2 – Narrative disclosure Requirement for EDBs (electricity distribution businesses) to describe their practices for monitoring voltage (including any plans for improvements) including:
Q2(i)
Q2(ii)
Q2(iii)
Q2(iv)
What the EDB (electricity distribution businesses) is doing to develop and improve practices for monitoring voltage quality on its low voltage (LV) network (e.g., the EDB may provide reference to any work they are undertaking with other companies)
What work the EDB is doing on their LV network to address any known non-compliance with the applicable voltage requirements of the Electricity (Safety) Regulations 2010;
How the EDB is responding to and reporting on voltage quality issues when it identifies them, or they are raised by a stakeholder (e.g., the EDB may provide reference to performance over the previous period to give the forward plan context);
How the EDB is communicating the work it is doing to improve voltage quality on its LV network to affected consumers
2023 AMP 6.5.2 and 6.7.2
2024 AMP 2.3 and 2.4
2023 AMP 4.2.2, 6.7.2 and 6.9
2023 AMP 6.7.2
2023 AMP 5.3 and 6.7.2
We aspire to being ‘Best in Service.’ Our objective is to provide excellent customer service and network performance. We believe that relationships in our community, with businesses, councils and community groups are vital to our success.
Customer experience is a measure of how customers feel about the service received from us. Customer experience includes the level of network reliability each customer receives, how we interact with them, the value derived from the services we provide and the information we supply about our network. The objectives for achieving ‘Best in Service’ are:
• Delivery of electricity at the service level sought by our customers.
• Customers know who we are and can contact us across multiple mediums media.
• Providing meaningful feedback that customers understand and know we will act on.
• Customers value the services we offer and can rely on us to meet their needs.
• WEL is ‘partner of choice’ within the community and within the industry.
Power quality describes the stability and conformity of the power supply in terms of voltage magnitude, frequency, and waveform required for the safe, and continuous operation of network and customer electrical equipment. Power quality issues include transient disturbances, harmonics, steady-state deviations, and equipment compatibility.
EDBs are required to comply with NZ Regulations. The evolving topology of distribution networks, nature, characteristics and profiles of loads and DER means that power quality may need increased monitoring than historically undertaken. We currently monitor power quality at various points in the distribution network:
• Grid Exit Points (GXP) through installed monitoring devices, as well as market information.
• Selected zone substations.
• Selected 11kV feeders.
• Selected distribution transformers.
• At the customer end through smart meters (for residential customers).
We are improving the accuracy of power quality monitoring through increasing the number of monitoring devices and proportion of the network being monitored. Quality of supply including voltage regulation is a key driver for our network development plans. The key projects to address voltage issues are detailed in section 6.9 of our 2023 AMP.
A foundational element of enabling flexible networks and non-wire solutions is statistical and timebased information, on load and generation profiles at all levels of the network. To increase the resolution of information, we are investing in network monitoring equipment at the LV level.
Data analytics are applied to the load and power quality information from smart meter and Power Quality (PQ) analysers to create statistical demand profiles for each customer group. This establishes a baseline for current customer behaviour, and is used to locate potential flexible demand, and increasing the certainty of large customer connection requests.
Information from smart meters and PQ analysers upstream of groups of customers (e.g. at distribution transformers) is used to validate finer customer load profiles and estimate load profiles for customers on parts of the network without our smart meters.
Our DSO roadmap enhances visibility using smart meters. The smart meter data enables innovative practices and is presently used to manage 12 issue types across the LV network including broken neutral connections. This visibility enabled further innovation in trials for DER interfacing and DERMS (Distributed Energy Resource Management System).
Examples are detailed below:
Application area 1 – Coordinated voltage profile study
This study was designed to investigate using voltage data to plot aggregated distribution transformer level voltages in order to support a voltage compliance study at both distribution transformer and ICP (Installation Control Point) levels. Non-compliant locations are further investigated by assessing the individual ICP level profile, loading data, phase imbalances, etc. The study was extended to consider all distribution transformers under the same HV feeder and zone substation power transformer, so that end-to-end coordination can be delivered. These are ranked and assessed to be upgraded using the budget allocated.
Application area 2 – Loop impedance / high neutral impedance detection and study
Supply quality data and voltage events are used for the ICP connection high loop impedance study. The WEL approach considers both voltage patterns and calculated impedance patterns to detect potential connection issues, the result is compared against upstream connection levels, e.g. LV circuit and distribution level, in order to narrow down potential fault locations. These patterns are actively monitored and when a defect is detected a fault technician is dispatched to repair this issue. Once complete the results are analysed to confirm the correction of the issue.
If a formal complaint is received, it is investigated, and we endeavour to resolve the problem with the customer. If we receive a complaint, we will:
• Acknowledge the complaint within two working days either in writing or verbally.
• Provide the customer with an update on progress within seven working days if the complaint has not already been resolved.
• Endeavour to resolve the complaint within 20 working days. If not, we provide customers with an explanation in order to extend the investigation by a further 20 working days.
• If the customer complaint is more appropriately dealt with by another party such as an electricity retailer, we may refer the complaint to that company on behalf of the customer. We will notify the customer that we have referred their complaint on and provide the relevant party, name and contact details.
Add ID requirements on practices for connecting new consumers and altering existing connections.
Q3A – Narrative disclosure Require EDBs to describe their practices for connecting consumers and making alterations to existing connections, including:
Q3A(i) The EDB’s approach to planning and management regarding connecting new consumers or making alterations to existing connections (offtake and injection connections);
Q3A(ii)
How the EDB is seeking to minimise the cost to consumers of new or altered connections; 2023
Q3A(iii) The EDB’s approach to planning and managing communication with consumers about new or altered connections;
Q3A(iv)
Commonly encountered delays, issues, and potential timeframes for different connection types.
2023 AMP 5.3.3
Planning and management of new or altered connections
If the connection meets criteria for a point of connection in the road reserve and there is LV supply available, the scope of work is quoted at standard rates in accordance with our Capital Contribution Policy. If the scope of work is deemed to be non-standard, a design is completed and commercially modelled to determine the appropriate customer contribution.
For Distributed Energy Resources (DER) applications, the Asset Strategy and Engineering team participate in the design and approval process. Upon payment, the work is processed through the required activities to delivery.
Our approach to managing communications with customers about new or altered connections is through a portal on the public website called WELConnect. Customers can log into the WELConnect portal and see the status and information on their projects. Additional queries can be communicated by email or phone to staff.
Two Tier One contractors have been bought on board to focus on CIW delivery. The capacity they bring is trending our performance towards our target figures. The current average time to provide a standard quote is 6 days and for non-standard is 32 days. The average time to construct a new ICP or alterations to an existing ICP is 98 days, across all customer work types.
The consumer classes are broken down into the following types:
• Non-standard new connection <110kVA
• Standard new connection <110kVA
• Subdivisions
• Streetlights
• Temporary supplies
• Distributed Generation
Capital contribution required from the customer is calculated in accordance with WEL’s Capital Contribution Policy. The main purpose of the Capital Contribution Policy is to ensure that the option selected is also financially viable. A copy of the policy can be found on WEL’s website www.wel.co.nz
Customer Satisfaction (Customer Initiated Works) - Monthly surveys of all customers who have had a new connection or similar customer work-type completed. The survey is conducted by an external research contractor and measures customer satisfaction across Value, Efficiency, Communication, Performance and Outcome. A quarterly report is provided to us for analysis to drive improvements in customer satisfaction. The target is reviewed annually to ensure a customer focus is retained.
The fact that WEL has engaged the two Tier one contractors ensures that work is undertaken in a competitive environment. WEL undertakes an evaluation of similar work undertaken by each contractor to ensure that both are providing cost effectiveness to our customers.
Global supply chain shortages in the infrastructure industry have impacted WEL. During the past 2 years, we have seen supply chain constraints affect our ability to deliver on customer expectations as lead times have trebled for some key equipment. Supply chain issues combined to be part of a “perfect storm” as customer spend increased by 27% since 2020, compounded by a tight labour market. This made it challenging to fully meet customer needs. Consequently, we have recently engaged two Tier One contractors to increase capacity. To ensure we fully meet customer requests, we have increased our stock levels to ensure we have frequently used equipment on hand. We have partnered with contractors for delivery to ensure we are responsive to customer requests.
Add ID requirements on customer service, e.g., customer complaints.
Q4
Narrative disclosure A requirement for EDBs to describe their current customer service practices including:
Our customer service performance measures are:
• Customer satisfaction – Regular surveys of a sample of customers to gauge their performance expectations, the price they are prepared to pay and their satisfaction with our service.
• Customer satisfaction (Customer Initiated Works) - Monthly surveys of all customers who have had a new connection or similar customer work-type completed. The survey is conducted by an external research contractor and measures customer satisfaction across Value, Efficiency, Communication, Performance and Outcome. A quarterly report is provided to us for analysis to drive improvements in customer satisfaction. The target is reviewed annually to ensure a customer focus is retained.
• Standard new connection quote time – Measures the average number of working days it takes to provide a quote for upgrades and new connections to our network.
• Complaint response time – The average number of working days to provide a resolution to any customer complaint.
We offer a free in-house complaints service. If a formal complaint is received, it is investigated, and we endeavour to resolve the problem with the customer. If we receive a complaint, we will:
• Acknowledge the complaint within two working days either in writing or verbally.
• Provide the customer with an update on progress within seven working days if the complaint has not already been resolved.
• Endeavour to resolve the complaint within 20 working days. If not, we provide customers with an explanation in order to extend the investigation by a further 20 working days.
• If the customer complaint is more appropriately dealt with by another party such as an electricity retailer, we may refer the complaint to that company on behalf of the customer. We will notify the customer that we have referred their complaint on and provide the relevant party, name and contact details.
Complaints are received by the Customer Services team and reviewed and assigned to the appropriate person to follow to resolution as per our Complaints Management Policy. Customer complaints and compliments are managed by using the WEL customer service portal. If it is because of a third party or natural event out of our control, we refer the customer to their insurance company. If it is a complaint for damage because of WEL activity or equipment failure, we will adopt a fair and reasonable approach on a case-by-case basis. In cases where resolution is not able to be achieved using internal resources, the customer is informed that the Utilities Disputes resolution process is available to them.
Add ID requirements on information about customer charters and guaranteed service level (customer compensation) schemes, e.g., information about existing schemes.
Q5 Require that EDBs publicly disclose up-to-date copies of:
Q5 (i)
Q5 (ii)
The EDB’s existing customer charters including guaranteed service levels if any
Information about existing customer compensation schemes (if any) that it has in place
Customer complaints resolution
See below
See below
2023 AMP 5.3.3
Complaints are received by the Customer Services team, reviewed, and assigned to the appropriate person to track to resolution, as per our Complaints Management Policy. Customer complaints and compliments are managed using WELConnect. If it is due to a third party or natural event out of our control, we refer the customer to their insurance company. If it is a complaint for damage due to of WEL activity or equipment failure, we adopt a fair and reasonable approach, on a caseby-case basis. In cases where resolution is unable to be achieved through internal resources, the customer is informed that the Utilities Disputes resolution process is available to them.
Refine ID requirements on third party interference interruptions by breaking down into more specific categories, such as vehicle damage, ‘dig in’, overhead contact, and vandalism.
Q13 Require EDBs to break down reporting of interruptions caused by thirdparty interference in Schedule 10(ii) to include commonly occurring interruptions resulting from external contractors or members of the public. The new table of additional third-party reporting categories includes:
Q13(i) ‘Dig-In’: means any unintended damage to any underground network asset caused by a third party
Q13(ii)
Overhead Contact: means any form of unintended damage to any above ground network asset caused by contact that is not related to vegetation or animals;
Q13(iii) Vandalism: means any intentional destruction of, or damage to, any network asset;
Q13(iv)
Vehicle Damage: means any unintended damage to any network assets including poles, ground mounted transformers, pillar boxes, but excluding overhead lines, caused by a ground vehicle; and
Q13(v) Other
This will be disclosed in our August 2024 disclosure
This will be disclosed in our August 2024 disclosure
This will be disclosed in our August 2024 disclosure
This will be disclosed in our August 2024 disclosure
This will be disclosed in our August 2024 disclosure
Add requirements on new connections likely to have a significant impact on network operations or asset management priorities.
D2 – Narrative disclosure Require EDBs to disclose a description of:
Forecasts involve a degree of uncertainty, particularly over longer periods and where there are changing circumstances or the potential for new activities. In the medium-to-long term, emerging technologies, demand, generation, evolving policy, and markets increase the uncertainty of our demand forecasts. Other factors, including short-notice commercial customer applications, result in substantial step changes in demand that are difficult to predict. On the supply and delivery side, there is uncertainty driven by the ongoing impact of the economic uncertainty and global conflicts.
Global macro-economic and policy developments to decarbonise the NZ economy indicate electricity usage and loading on distribution networks will increase. There is less certainty around timing, as users’ decisions are critical and less well signalled. WEL is continually scanning the local and global markets, developing data analytics, gauging customer intentions, for trends and triggers for development. Various technology/customer uptake scenarios are created to represent the range of possibilities and the most appropriate ones are selected, reviewed, and regularly updated.
To manage the network of the future and to understand investment requirements a clear understanding of the LV network is critical, and we are investing in LV visibility and management projects. There are limited mechanisms for network control of these new loads, beyond pricing signals. The potential demand flexibility and responsiveness to price of existing and new loads is highly uncertain as distribution pricing signals can be diluted or exacerbated by retail offerings.
The size and timing of our distribution investment is based on net cost-benefit to customers over the lifecycle of customer demand and network assets. Smoothing of network investment ensures that network expansion occurs within finite financial and workforce capacity and overall risks are minimised. Our development plans and corresponding investments may be amended in subsequent revisions of the AMP reflecting the emerging needs of our customers, stakeholders and changing circumstances on the network. We evolve our planning approach to balance a growing number of priorities.
Demand forecast and contingency scenarios for different areas of the network are input into network models to forecast loading on individual assets and identify constraints that may prevent the system from consistently working to transmit electricity. Potential constraints are:
• Network asset’s thermal capacity issues.
• Quality of Supply (or Power Quality).
• Security issues including other reliability concepts such as availability, durability, resilience.
• Legislative and regulatory requirements.
• Safety and environmental requirements.
• The base case includes an economic recession induced slowdown in EV (Electric Vehicle) uptake due to lower disposable income and less favourable financing conditions.
Supplying emergent demand from EV and industrial process electrification requires provisions for demand scenarios. This must be developed before specific timing, location, types of demand and flexibility is firmed up. The provision has been allocated to each region based on current demand and probability of uptake. This will need to be reviewed annually and forecasts adjusted.
5 8
Add reporting requirements on EDBs’ innovation practices
D4 – Narrative requirement
D4(i)
D4(ii)
D4(iii)
D4(iv)
D4 (v)
Require EDBs to describe their innovation practices, including a description of:
Any innovation practices the EDB has planned or undertaken since the last AMP or AMP update was published, including case studies and trials; 2023 AMP 6.6, 6.7 8.2.6 2024 AMP Section 2
What the desired outcome of any innovation practice is, and how it may improve outcomes for consumers
How the EDB measures success and makes decisions regarding any innovation practices, e.g. how the EDB decides whether to commence, commercially adopt, or discontinue any innovation practices;
How the EDB’s decision-making about innovation practices may depend on the work of other companies, including other EDBs and providers of nonnetwork solutions; and
The types of information the EDB uses to inform or enable innovation practices, and their approach to seeking that information.
Innovation since last AMP
See section 2 of this document.
AMP Section 2
AMP Section 2
AMP Section 2
Innovation in solution selection
Selection of solutions is based on:
• Whole of lifecycle cost and benefit.
• Cost efficiency of capacity provided or deferred.
• Technical feasibility.
• Availability and reliability.
• Risks mitigated and risks introduced (technical, safety, financial etc.).
• Ease of integration and inter-operability with network and asset management systems.
• Continued long term support.
• Relative economic value of the above factors for alternatives WEL seeks to ensure that local DER (solar/battery) solutions are considered as part of the solution options.
The cost benefit of emergent solutions is evaluated against the same economic and technical criteria as conventional solutions e.g. lifecycle cost per MW and MWh, regardless of form. This is to prevent over investment and passthrough costs of a more expensive solution, or selection of a high-risk endeavour.
We are preparing for emergent solutions to be a pillar of future electricity system security, sustainability, and affordability. Our innovation development path includes improvements to network visibility, and new inter-operability infrastructure and platforms, which will be integrated when they are ready. We continue to trial and test emergent solutions so that optimal economic and technical solutions are deployed for the community.
New Zealand’s energy future will be shaped by many factors, most of all our customers usage, generation, and management of energy. Electricity distribution networks are the closest interface with the grid for most customers, and where the greatest impact from these changes in customer behaviour will be felt. WEL, as an owner and operator of a distribution network, has a responsibility to evolve our operating model and services to adapt to future operating environments and enable customers’ changing use of the network to service their future energy needs.
WEL is developing our operating and service model to support the changes in energy flows, data, flexibility, towards an open access model. An open access network will allow existing and new consumers greater and more equitable utilisation of the distribution network as a vital platform for delivery of energy and capacity to and by consumers.
WEL’s investments seek to enable this by developing:
• Standards and processes for greater access to connect and operate any compatible equipment.
• Operational technology to support distribution level DER and flexible demand.
We call this the transition from distribution network owner (DNO) to Distribution System Operator (DSO). We have published our innovation path in the DSO strategy roadmap, shared with industry at the EEA 2022 conference. This strategy outlined how we are going to integrate the traditional network management practice with an innovative DSO service model.
5 9
Improve lifecycle asset management planning provisions (vegetation, assumptions).
AM7A EDBs are required to provide information on vegetation management-related maintenance, and summary discussion of the approach and assumptions that underpin the process used for vegetation management.
AM7B EDBs are required to provide the assumptions and rationale used to inform capital expenditure forecasts for asset investments.
2023 AMP 8.2.3
2023 AMP 8.1-8.4
Vegetation management is managing vegetation in and around our assets that has the potential to interfere with the safe and reliable supply of electricity to customers and network. WEL has increased the line inspection frequency and has a vegetation management system to record, predict and manage all vegetation works through a mobile solution platform. This system has a purposebuilt vegetation growth model based on all New Zealand species, weather, and environment information to aid in proactive targeting of risk areas and future vegetation management requirements. This system has allowed WEL to manage vegetation more effectively.
The current vegetation legislation is under review, and this may lead to a need for vegetation expenditure to change. The current legislation provides minimal ability to address “fall in” trees. Fall in trees are trees that are outside the growth and notice zones specified in the Regulations, however the lines are within the fall radius of the tree. Fall in trees are the predominant contributor to major outages resulting from extreme weather events within the WEL network. Vegetation expenditure is currently based on WEL’s vegetation management requirements to maintain safety compliance and ensure network reliability targets are met.
Delivering WEL’s performance objectives requires the right balance between expenditure on maintenance and investment in renewals. WEL considers the whole of life cost of the assets and required interventions during their lifecycle, to ensure balance between competing drivers of risk, performance, and costs.
As part of capability project initiatives, WEL streamlined its end-to-end asset renewal process to improve the decision making when prioritising replacements and enabling work packaging.
Introducing work scoping at the early stage of the planning process allows efficient grouping of work. An Annual Work List (AWL) is generated, and risk ranked, using the outcomes of the Condition Based Risk Management (CBRM) tool. The CBRM tool uses system data, including condition information to determine the asset health index (AHI) and asset risks, to develop WEL’s capital expenditure in this area. Our asset lifecycle strategy is focused on achieving system reliability and meeting regulatory requirements.
The objective contained in our Maintenance Manual is to obtain the most cost-effective method of managing network risk and ensure network assets achieve their expected level of service. We achieve this through Failure Mode Effects and Criticality Analysis (FMECA) and whole of life cycle cost analysis. This is used to develop our individual fleet asset management manuals. These manuals document our approach to maintenance, inspection, renewal, and disposal requirements for each asset class. The information collected in the maintenance and inspection programs is used to inform our Condition-Based Risk Management (CBRM) tool. This tool is used to determine the optimal renewal strategy for each asset class. For assets, such as HV fuses (DDOs), that do not have a CBRM model, WEL uses information obtained from inspection and reliability tools, such as FMECA to assess the risk of failure and prioritise the renewal programme.
WEL has undertaken analysis on per unit replacement costs. This provides a more detailed understanding of the cost to replace each asset and has been factored into our overall approach. We have developed an equipment condition feedback loop into our replacement programmes. This requires the teams replacing the assets to provide information on the condition of the assets being removed. That information is then used to calibrate our CBRM model and asset condition grading.
Optimised asset management seeks to lower the cost of replacement for each asset class and considers whole of life costs. WEL lowers these costs through continually reviewing opportunities to improve our approach by optimising scoping, grouping and risk-ranking replacements. This approach has significantly reduced the amount of variation in our annual works programme, resulting in far greater certainty of the works to be delivered in a particular year, with greater clarity of work scope. In FY23 we implemented a mobile platform which incorporated; defect notifications, routine inspections, data corrections and works scoping. Combining these four processes into a single application we can combine tasks which can all be undertaken by a single person, thereby improving efficiency. Additional efficiency driven by this change is the integration directly into SAP removing the need for duplicated data handling, improving both efficiency and the accuracy of data. A full year’s worth of asset inspections is now available to our inspectors, giving them greater visibility and flexibility in delivering the annual inspection programme. There are dashboards which provide visibility on progress. Early results show a marked improvement in the delivery of the inspection programme.
We use this grading to ratify our asset replacement programmes, in line with the ISO 55001 requirement for a feedback loop. While WEL is achieving positive results in SAIDI reductions in the equipment failure category, planned SAIDI has been increased to enable the asset replacement programme to be completed.
Improve lifecycle asset management planning provisions (processes, forecast assumptions) and provide additional information on data and models.
AM8A
Amending clause 3.11 of Attachment A to require EDBs to provide a description of:
AM8A(i) How asset management data informs the models that an EDB develops and uses to assess asset health;
AM8A(ii) How the outputs of these models are used in developing capital expenditure projections.
AM8B
That EDBs provide information regarding its consideration of non-network solutions to inform its expenditure projections (capex and opex). This must include an explanation of the approach and assumptions the EDB used to inform these expenditure projections.
See below
2023 AMP 8.2
2023 AMP 8.2 and 8.3
2023 AMP 6.6 - 6.7
2024 AMP Section 2
The key assumptions and inputs are described below.
Maintenance tasks are determined using industry maintenance standards, supporting tools and analysis that assist maintenance engineers to optimise and rationalise the maintenance plan. In 2021, WEL completed a programme of creating Standard Maintenance Procedure documents (SMPs). SMPs outline the maintenance requirements in the Maintenance Manual, in a more detailed and procedural way. This assists in standardising plant maintenance processes and the capture of key asset information, including asset condition.
WEL regularly inspects its assets, the surrounding area and vegetation. The inspection or monitoring frequency of an asset is determined by potential risk, manufacturer’s recommendations, and legislative requirements. During an asset inspection, the condition is assessed and recorded, along with any defects found, in the Computerised Maintenance Management System. This information is used by the CBRM tool to produce risk profiles and investment scenarios, with options for capital expenditure projections.
Asset condition influences the extent of servicing, any necessary repairs required and provides vital data to inform asset renewal decisions. The condition assessment is based on a 0 to 5 rating system.
Defects are identified during inspections and captured into our Enterprise Resource Planning system. If an asset has a defect, the asset inspector will assess the severity of the defect and assign a defect rating.
This covers unplanned asset replacement due to network asset failures. The annual quantity of faults is forecast based on historical trends.
WEL uses CBRM modelling to develop a risk-based approach to planning asset renewals.
This approach prioritises the renewal of assets that present the highest risk to safety, network performance, environment, and economic loss. This methodology is used by numerous electricity distribution companies internationally to deliver effective risk-based asset management.
CBRM is a tool that combines asset data and information (e.g. age, asset type, working environment, condition, other factors such as number of connected parties), engineering knowledge as well as practical experience to estimate future condition and performance of network assets.
For assets, such as HV fuses (DDOs), that do not have a CBRM model, WEL uses information obtained from inspection and reliability tools, such as FMECA to assess the risk of failure and prioritise the renewal programme.
Specific risks for each asset category are identified and quantified. WEL has developed CBRM models for all its key asset classes to determine health and risk profiles and used these to develop capital expenditure projections. Through the asset planning process, WEL manages scope and budget requirements of renewal work. This is outlined in the Project Definition Document (PDD). WEL’s asset renewal philosophy remains aligned to its previous AMP.
Refer section 2 of this document.
Selection of solutions is based on:
• Whole of lifecycle cost and benefit.
• Cost efficiency of capacity provided or deferred.
• Technical feasibility.
• Availability and reliability.
• Risks mitigated and risks introduced (technical, safety, financial etc.).
• Ease of integration and inter-operability with network and asset management systems.
• Continued long term support.
• Relative economic value of the above factors for alternatives WEL seeks to ensure that local DER (solar/battery) solutions are considered as part of the solution options.
The cost benefit of these emergent solutions is considered against the same economic and technical criteria as conventional solutions e.g. lifecycle cost per MW and MWh, regardless of form. This is to prevent over investment and passthrough costs of a more expensive solution, or selection of a high-risk endeavour.
We are preparing for emergent solutions to be a pillar of future electricity system security, sustainability, and affordability. Our innovation development path includes improvements to network visibility, and new inter- operability infrastructure and platforms, which will be integrated when they are ready. We continue to trial and test emergent solutions so that optimal economic and technical solutions are deployed for the community.


Electricity Distribution Information Disclosure Determination 2012 (consolidated July 2023)
Pursuant to clause 2.9.1 of section 2.9
We, Barry Spence Harris and Carolyn Mary Steele being directors of WEL Networks Limited certify that, having made all reasonable enquiry, to the best of our knowledge:
a) The following attached information of WEL Networks Limited prepared for the purposes of clauses 2.4.1, 2.6.1, 2.6.3, 2.6.6 and 2.7.2 of the Electricity Distribution Information Disclosure Determination 2012 in all material respects complies with that determination.
b) The prospective financial or non-financial information included in the attached information has been measured on a basis consistent with regulatory requirements or recognised industry standards.
c) The forecasts in Schedules 11a, 11b, 12a, 12b, 12c and 12d are based on objective and reasonable assumptions which both align with WEL Networks Limited’s corporate vision and strategy and are documented in retained records.
Director

Date 5th March 2024
Director

Date 5th March 2024