Potential effects of trawling- free zones on carbon stocks of Danish eelgrass meadow
2 Scientific note from DCE – Danish Centre for Environment and Energy Date:22 March 2023 | 14 ,

Scientific briefing from DCE – Danish Centre for Environment and Energy no. 544
Category: Research contribution
Title: Potential effects of trawling-free zones on carbon stocks of Danish eelgrass meadows
Author(s): Carmen Leiva-Dueñas, Andreas Holbach, Cordula Göke, Jacob Carstensen, Dorte Krause-Jensen (Carmen, Andreas and Cordula have participated equally and therefore share firstauthorship)
Institution: Aarhus University, Department of Ecoscience
Referee: Jesper Christensen
Quality assurance, DCE: Anja Skjoldborg Hansen
Linguistic QA: Anne Mette Poulsen
External comment: Danmarks Naturfredningsforening. The comments can be found here: http://dce2.au.dk/pub/komm/N2023_14_komm.pdf
Financed by: Danmarks Naturfredningsforening through funding from Velux Fonden
Please cite as: Leiva-Duenas, C., Holbach, A. Göke, C., Carstensen, J. & Krause-Jensen, D. 2023 Potential effects of trawling-free zones on carbon stocks of Danish eelgrass meadows. – Scientific briefing no. 2023|14
https://dce.au.dk/fileadmin/dce.au.dk/Udgivelser/Notater_2023/N2023_14.pdf
Reproduction permitted provided the source is explicitly acknowledged.
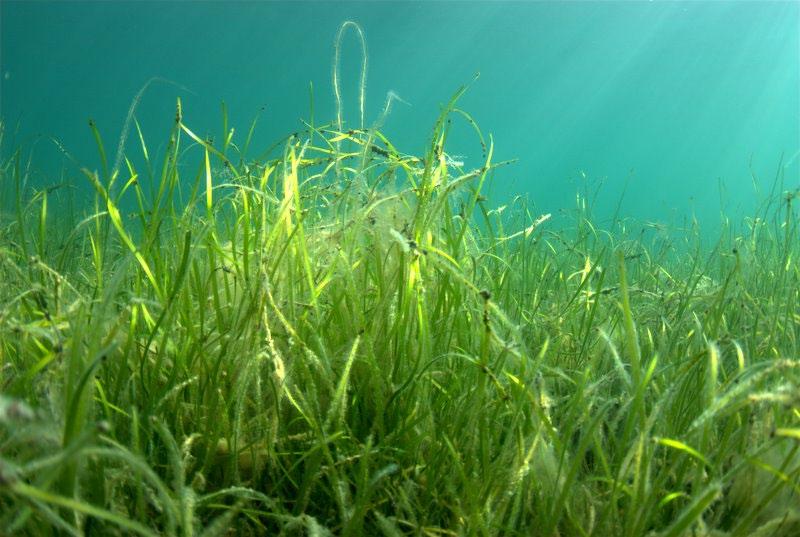
Front page photo: Peter Bondo Christensen
Number of pages: 29
Eelgrass is the most important marine plant in Danish coastal waters where vast sheltered and shallow areas with sandy seafloor should support extended eelgrass meadows and associated biodiversity, carbon and nutrient storage capacity and natural coastal protection (Duarte et al. 2013). However, over the past century, at least a third of the meadows have been lost, first due to a disease in the 1930’s, then due to multiple pressures including eutrophication and physical damage, from e.g. trawling (Krause-Jensen et al. 2021). In the face of climate change there is an increased need to support the resilience of eelgrass meadow<s by minimizing other pressures.
This briefing is the product of a research agreement between Danmarks Naturfredningsforening (DN) and Aarhus University (AU), Department of Ecoscience, with the aim to provide an estimate of the potential effects of trawling-free zones on carbon stocks (blue carbon) of eelgrass meadows in Denmark. Danmarks Naturfredningsforening has commented on an earlier version of the briefing, the comments can be found online.
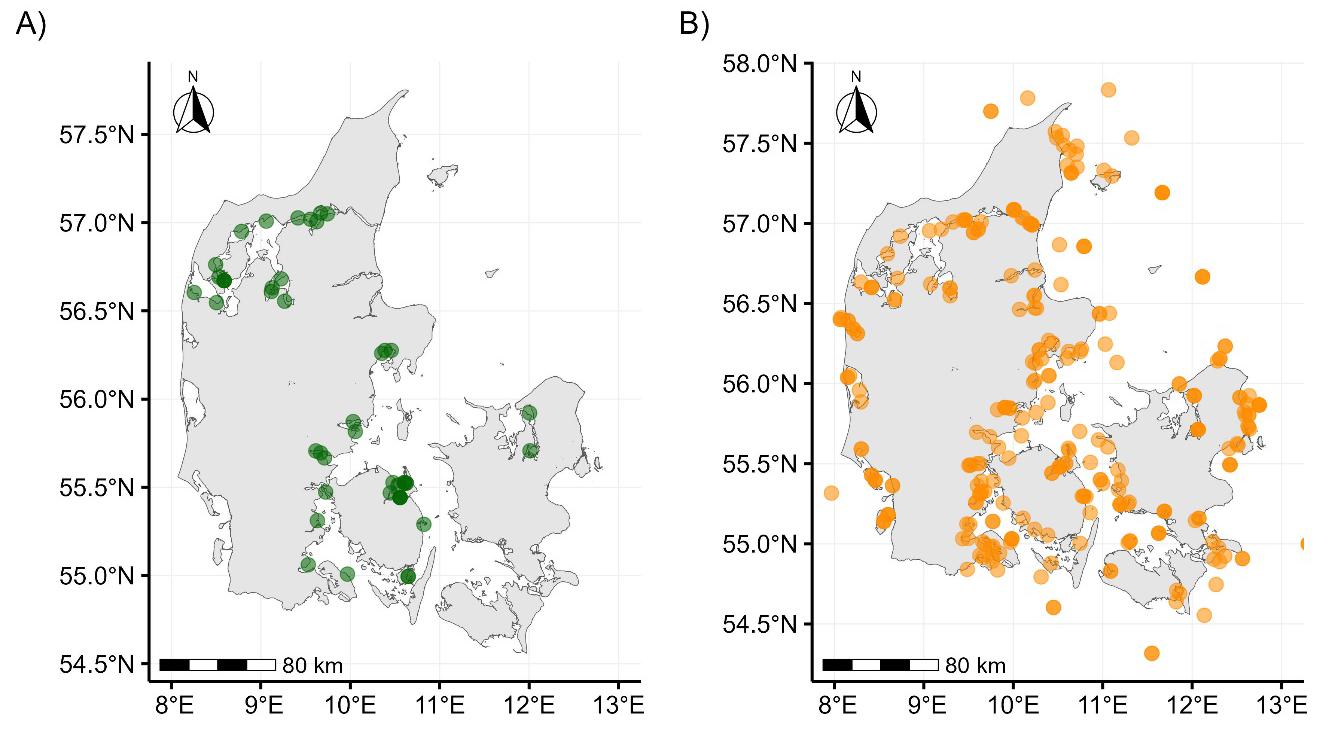
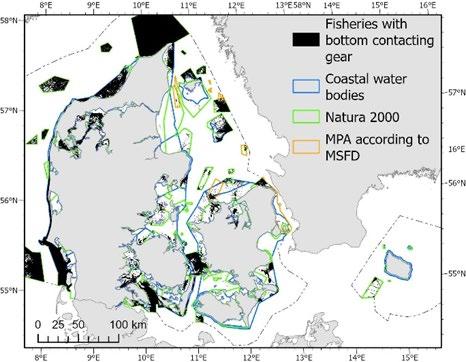
The focus is on eelgrass meadows within the Marine Protected Areas (MPAs) that are composed of the Natura 2000 areas (N2000) and the protected areas according to the Marine Strategy Framework Directive (MSFD) and within the 3, 6 and 12-nautical mile boundaries, respectively (Figure 1.1)

The study builds on quantification of blue carbon in Danish eelgrass meadows via the recently concluded project “Blue forests – Marine forests as carbon sinks” funded by the Velux Foundation and initial modelling of blue carbon conducted via that project.
The analysis has four components, each targeting one of the research questions listed below, and the briefing is organised accordingly.
Question 1: What is the size of carbon stocks in Danish eelgrass meadows within protected areas and at different distances from land (3, 6 and 12 nautical mile zones)?
Approach: We develop a GIS layer that combines the potential distribution area of eelgrass (following Stæhr et al. 2019; Timmerman et al. 2021) with a GIS layer on the estimated carbon stocks (C-stocks) in eelgrass sediments. For comparative purposes, the estimates also consider C-stocks beyond eelgrass areas.
Question 2: What is the direct effect of trawling on the eelgrass extent?
Approach: The trawling effect on the eelgrass extent is quantified as the overlap between the potential distribution area of eelgrass and the area of the seafloor subject to trawling. The potential eelgrass area is modelled based on ecological drivers and does not consider trawling impact (Staehr et al. 2019; Timmermann et al. 2021). Assessment of trawling impact relies on VMS (“Vessel Monitoring System”) trawling data for fisheries and black box data for mussel dredging (Petersen et al. 2021). Our assessment of trawling impact includes a statistical comparison of the trawling pressure in the relevant eelgrass areas based on two available data aggregation levels:
• high-resolution data (100 m*100 m) limited to the coastal waterbodies and Natura 2000 areas provided by the Environmental Protection Agency (Miljøstyrelsen 2019, 2021). This dataset covers the period 2014 – 2018 for the coastal waterbodies and 2013 – 2018 for the Natura 2000 areas. The high resolution of the data was achieved by combining the VMS and black box information with data from the automatic identification system (AIS) used for vessel tracking.
• low-resolution (approximately 3 km*5.6 km) data representing a time series (2009-2016) for the HELCOM area covering the Kattegat, Belt Sea and Baltic Sea areas that are relevant for eelgrass (HELCOM 2019a-h). The data was chosen because it covers a longer time series than the data provided by the European Marine Observation and Data Network (Emodnet), which would cover the complete Danish waters. It should be noted that DCE recently gained full access to VMS data for all of Denmark. Although the current project did not have sufficient resources and timespan to integrate those complete data sets in the analyses, this could be done in a future larger project.
Since 2012, all fishing vessels with at least 12 m length are obliged to use VMStracking. The high-resolution data only includes Danish vessels. Since the lowresolution data is based on national data, it only includes Danish vessels as well. As a result, vessels measuring <12 m length and foreign vessels are not considered in the analysis. Although the number of fishery vessels <12 m length (1786 vessels) is five times higher than the number of vessels ≥12m length (349 vessels) (Statistics Denmark 2023a), the registered days at sea for vessels <12 m length are only 27 % of those of the larger vessels. On the other hand, the smaller boats may be more active at shallow water, in the potential eelgrass zone. Shrimp beam trawlers and mussel dredgers, which make up 5% of the days at sea, are not categorized by length (Statistics Denmark 2023b). It was not possible to estimate the activity of foreign vessels in the Danish waters.
Question 3: What is the potential effect of trawling on current eelgrass carbon stocks?
Approach: We comp<are the current potential eelgrass distribution for situations with and without trawling ban (as described under Q2) and estimate trawling-caused removal of carbon stock via:
• lost eelgrass standing stock (g C m-2)
• lost sedimentary C-stocks built up in the eelgrass meadows The effect on eelgrass-associated C-stocks will be supported by comparing C-stocks in currently trawled and nontrawled areas.
• lost eelgrass sequestration of carbon (g C m-2 year-1).
Question 4: What is the potential future effect of a trawling ban on eelgrass carbon stocks?
Approach: As for Q3 but extrapolating to 2030 and 2050 by assuming that:
• eelgrass does currently not grow within the zones where trawling occurs and that, after a ban, eelgrass will potentially recolonise the newly trawling-free zone within the area where eelgrass habitat conditions are fulfilled.
• in the absence of trawling, Danish eelgrass meadows fulfil the WFD requirement of “good ecological status”, i.e., the water quality standards allow eelgrass to grow as deep as required in relation to the WFD by 2027. It should be no/ted, however, that the Danish “strategy” is to meet the maximum allowable nutrient input requirement set by the WFD by 2027, not to achieve the biological/ecological status by that year. Hence, the recovery time of eelgrass is not included in the Danish strategy, and since it is well-known that recovery can be slow (Krause-Jensen et al. 2020), eelgrass is unlikely to fulfil the WFD by 2027. Our scenario of good ecological status for eelgrass by 2027 is, therefore, solely meant for illustration purposes.
• an immediate effect of a trawling ban, i.e., that eelgrass would recover promptly and, hence, be distributed to full capacity by 2027. As mentioned above, our estimate thus ignores that eelgrass recovery can be slow and is difficult to predict even without considering potential effects of climate change on recovery (Krause-Jensen et al. 2020; Timmerman et al. 2021).
• restored eelgrass meadows will gradually build up C-stocks compared to those in existing eelgrass areas. Hence, if starting in 2027, the recovered meadows would have sequestered carbon for 3 and 23 years, respectively, by 2030 and 2050. The effect on eelgrass-associated C-stocks will also be supported by comparing C- stocks in currently trawled and non-trawled areas.
The briefing summarises the key methodologies and findings under each of the four research questions. For further details, we refer to associated manuscripts that are currently under preparation for submission to peer-reviewed international journals (Leiva-Dueñas et al. in prep.; Holbach et al. in prep).
We finally present a case-study on the development of eelgrass meadows following a trawling ban in a specific area (Nibe Broad, Limfjorden) to supplement the modelling of trawling effects.
To answer this question, we developed two independent spatial models on the sediment C-stock:
• One model was based on sediment core data collected within eelgrass meadows (eelgrass C-stock model).
• The other model was based on surface sediment samples collected from soft coastal sediments (coastal C-stock model) and primarily represented samples collected outside of eelgrass meadows; a few samples collected inside the meadows are included as well.
The eelgrass C-stock model compiled previously published data on sediment C-stocks over the top 10 cm (g C m-2) from 48 vegetated eelgrass meadows distributed across Denmark (Kindeberg et al. 2018; Leiva-Dueñas et al., 2023) (Figure 2.1A). Information on sample collection, laboratory analyses and calculations of C-stocks can be found in Kindeberg et al. (2018) and Leiva-Dueñas et al. (2023).
Additionally, the coastal C-stock model used data from 274 sediment core samples over the top 10 cm collected and geochemically analysed as part of the Danish national marine monitoring program (Figure 2.1B).
It should be noted that the comparison of C-stocks do not consider that sediment accumulation rates and, hence, C-accumulation rates differ between areas, both between eelgrass and non-eelgrass areas and within each of those area types. Differences in C-accumulation rates imply that the 10 cm C-stocks can represent very different time periods. However, comparable data sets on C-accumulation in eelgrass vs. non-eelgrass areas are not available. Information on differences in the lability of the organic material, which affects the turnover of the C-stocks and provides insight into their vulnerability, was also not available.
The eelgrass C-stock model considered several potential drivers of eelgrass production and, subsequently, C-accumulation and storage: seawater temperature (at the seafloor, 95th percentile), salinity (at the seafloor, 5th percentile), dissolved oxygen (5th percentile), light availability at the sea floor, light attenuation coefficient, chlorophyll-a content, indices of physical exposure (bottom shear stress (95th percentile) and wave exposure indexes, water depth, distance to the coast, and sediment type. All data layers were brought to a common projection and cut to the same extent, which was delimited by potential distribution areas with at least 10% of eelgrass cover (Staehr et al. 2019; Timmermann et al. 2021).
The coastal C-stock model considered the following environmental factors as potential predictors of C stocks in soft coastal sediments: sediment type, topographic position index (TPI), bottom slope, water depth, distance to the main coastline, relative exposure index, average chlorophyll concentration and salinity.
As a compromise between the different original spatial resolutions of the covariates, a spatial resolution of 100 m and 500 m was selected for the eelgrass C-stock model and the coastal C-stock model, respectively
We used Generalized Additive Models (GAMs) to model the relationship between spatially explicit and uncorrelated environmental factors and the spatial distribution of sediment C-stocks. GAMs can identify non-linear relationships between response and predictor variables as well as non-Gaussian error distributions. The best-performing GAMs were used to predict C-stocks within the top 10 cm in both eelgrass meadows and soft coastal sediments. Specific details about the GAM fitting, their generation, selection, and validation can be found in Leiva- Dueñas et al. (in prep.) and Holbach et al. (in prep.).
From the output of the two independent GAM models, we calculated a weighted average ensemble model. The models were weighted based on their prediction accuracy of measured C-stocks as calculated with the RMSE metric.
The ensemble model for sediment C-stocks was laid over a potential distribution map of eelgrass (Timmermann et al. 2021) and a map of Natura 2000 areas. The total C-stocks (Gg 1 C) present in the top 10 cm of sediment were estimated within and outside the area of eelgrass with a spatial cover greater than 10% (Timmerman et al. 2021) as well as in Nature 2000-protected eelgrass meadows and at different distances from land (0-3, 3-6 and 6-12 nautical miles areas). The total eelgrass C- stocks were calculated by multiplying the pixel Cstock value by the area of the pixel covered by eelgrass (e.g. pixels with 10% eelgrass cover were multiplied by 0.1) and adding up the resulting C-mass within each relevant area. An uncertainty range of the total predicted sediment C-stocks was calculated based on sums of lower and upper C-stocks boundaries for each pixel (exp(predicted value ± 2*standard-error), predicted values and standard-errors at log-scale).
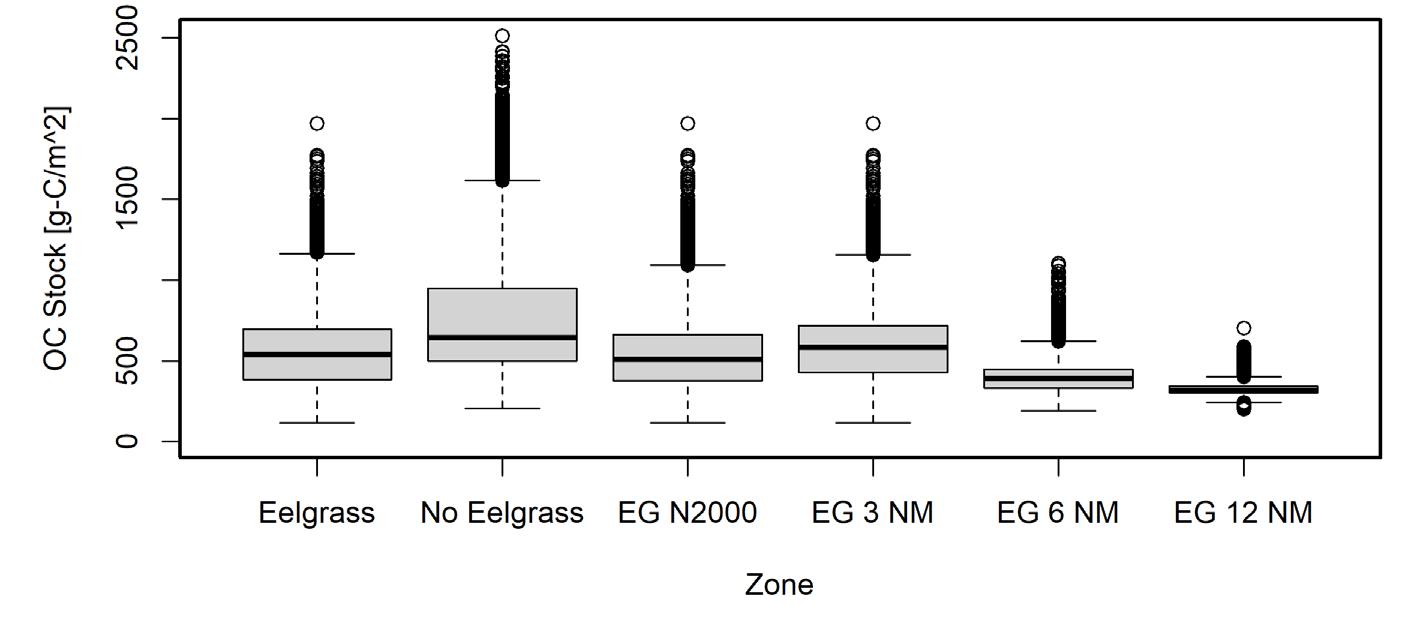
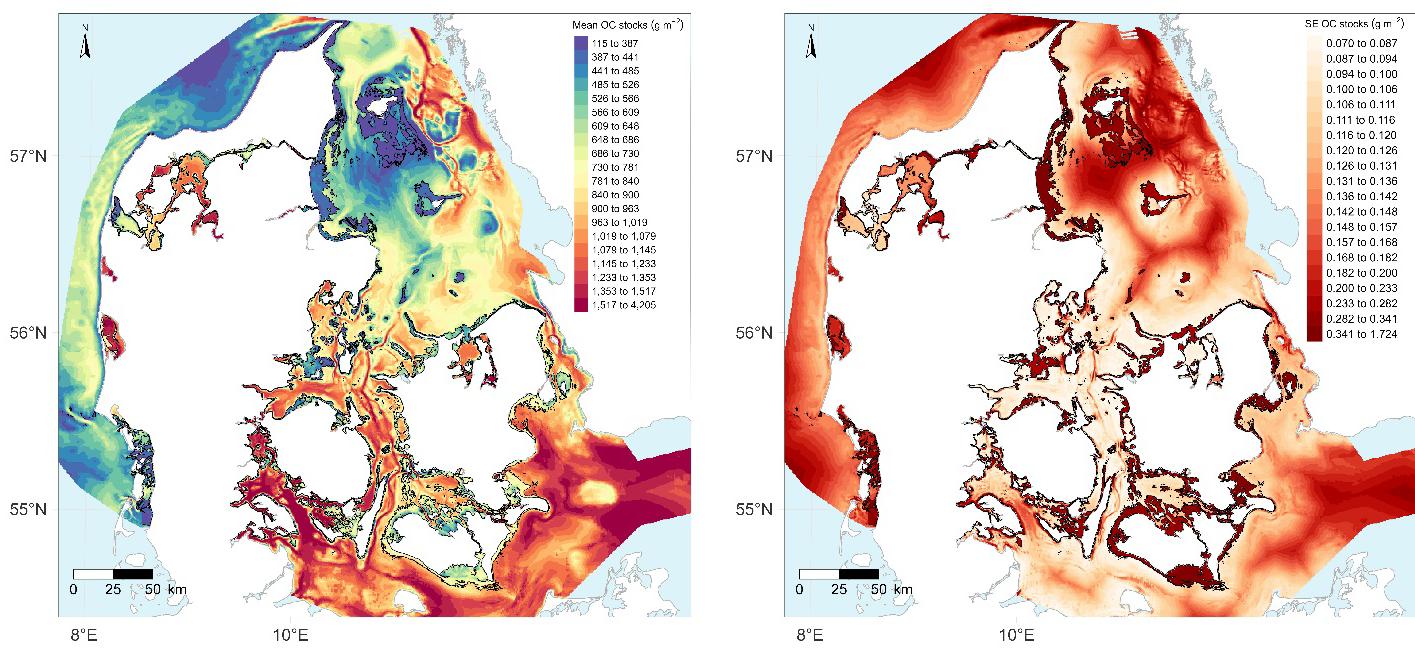
The ensemble outputs from the two C-stock GAMs are shown in Figure 2.2 and were used to estimate the sediment C-stocks within potential areas of eelgrass meadows. The mean C-stocks within the current potential extent of eelgrass meadows were 555 ± 203 g C m-2 (range 118-1970 g C m-2), while outside the potential eelgrass meadows the C-stocks averaged 740 ± 297 g C m-2 (range 207–2510 g C m-2) (Figure 2 .3). The northeast coast of Jutland and nearby islands in the Kattegat area had the lowest per square meter stocks, while the highest were found in inner, sheltered areas of the fjords as well as along the southern coasts of the Islands of Funen and Zealand (Figure 2.2 left). The spatial variation of the ensembled model errors associated with the predicted Cstocks shows larger standard errors along the coast for the eelgrass distribution because the eelgrass C-stock model had larger error due to the lower training data used in this model (Figure 2.2 right).
The similar C-stock values found between eelgrass and non-eelgrass areas is surprising, but in accordance with recent results by Leiva-Dueñas et al. (2023), who reported no significant differences in measured C-stocks between eelgrass meadows and nearby unvegetated sediments in four study sites of Denmark. This may in part be due to the decline of eelgrass meadows over the last decades, which can imply that sites that are currently bare could have been vegetated in the (recent) past. If physically undisturbed, some sediment layers at these bare sites may contain part of the C-stocks that were associated to past meadows (Leiva-Dueñas et al. 2023).
The total sediment C-stocks (top 10 cm) within the potential distribution area of eelgrass meadows across Denmark is 1210 (660-2380) Gg C. To give an impression of the size of the stocks, they are equivalent to 9.2 to 33.3% of Danish annual emissions emitted in 2020 (26.2 million metric tons of CO2-eq, production-based emissions (Friedlingstein et al. 2021). Within potential eelgrass meadows located in Nature 2000-protected zones the total sediment C-stock amounts to 934 (502-1870) Gg C, for those located within 0 to 3 nm from the coast it amounts to 1130 (617-2220) Gg C, within 3 to 6 nm to 52.5 (27.0-113) Gg C and within 6 to 12 nm to 15.3 (8.05-32.1) Gg C
1 Gg = Giga g = 109 g
values are weighted averages of the predicted C-stocks from the two spatial GAMs used in this briefing. Right map) Spatial distribution of the combined weighted standard errors at logscale around the predictions of the two GAMs. In both maps, the outer boundary of the potential eelgrass area is indicated by a black continuous line. The potential eelgrass area is predicted by a habitat suitability model for current water conditions supporting at least 10% eelgrass cover (Staehr et al. 2019; Timmermann et al. 2021).
Figure 2.3.
of modelled organic carbon (OC)-stocks (ensemble) in the 6 assessment zones: (1) ≥ 10% eelgrass cover (Staehr et al. 2019; Timmermann et al. 2021), (2) < 10% eelgrass cover, (3) ≥ 10% eelgrass (EG) cover in Nature 2000 areas, (4) within 3 NM, (5) 3-6 NM, and (6) 6-12 NM from the coast.
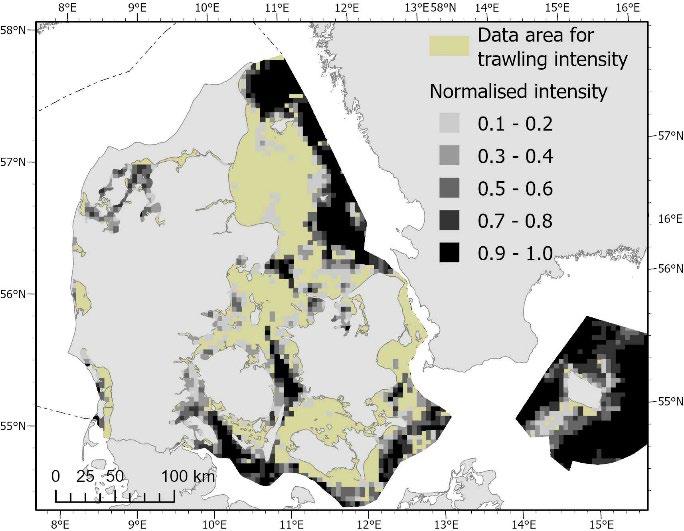
To answer this question, we used the high-resolution trawling data covering only part of the study area and the low-resolution trawling data covering almost all the relevant eelgrass area. It should be noted that we sometimes apply the term “trawling data” for the sake of simplicity although the dataset is termed “fisheries with bottom-contacting gear”.
The high-resolution trawling data cover the years 2014-2018 for the coastal waterbodies and 2013–2018 for the Natura 2000 areas. The Natura 2000 areas have been updated since the production of the fisheries data. For the analysis, we use the extent of the Natura 2000 areas that are currently in force. We checked for agreement between the two datasets by comparing the number of presence-absence cells when aggregating onto a 4x4 km raster. In general, there was good agreement with slightly higher presence values for the dataset with longer time coverage. Consequently, those two datasets were combined and provide presence-absence information with a 100 m*100 m resolution (Figure 3.1, left). For the low resolution HELCOM trawling data, we found temporally quite stable distributions of trawling intensity across the study area (available years 2009-2016) as indicated by decreasing relative deviations with increasing trawling intensity, which justifies averaging over the years. The average low-resolution HELCOM data were combined with high-resolution data on the closed fjords at the west coast and the Wadden Sea to cover the relevant area for eelgrass distribution in Denmark. Therefore, we checked for correlation between both intensities after aggregation on a 4x4 km raster. We found a significant linear relationship between both datasets and integrated them by linear regression and scaling of intensities to a range between 0 and 1 (Figure 3.1, right).
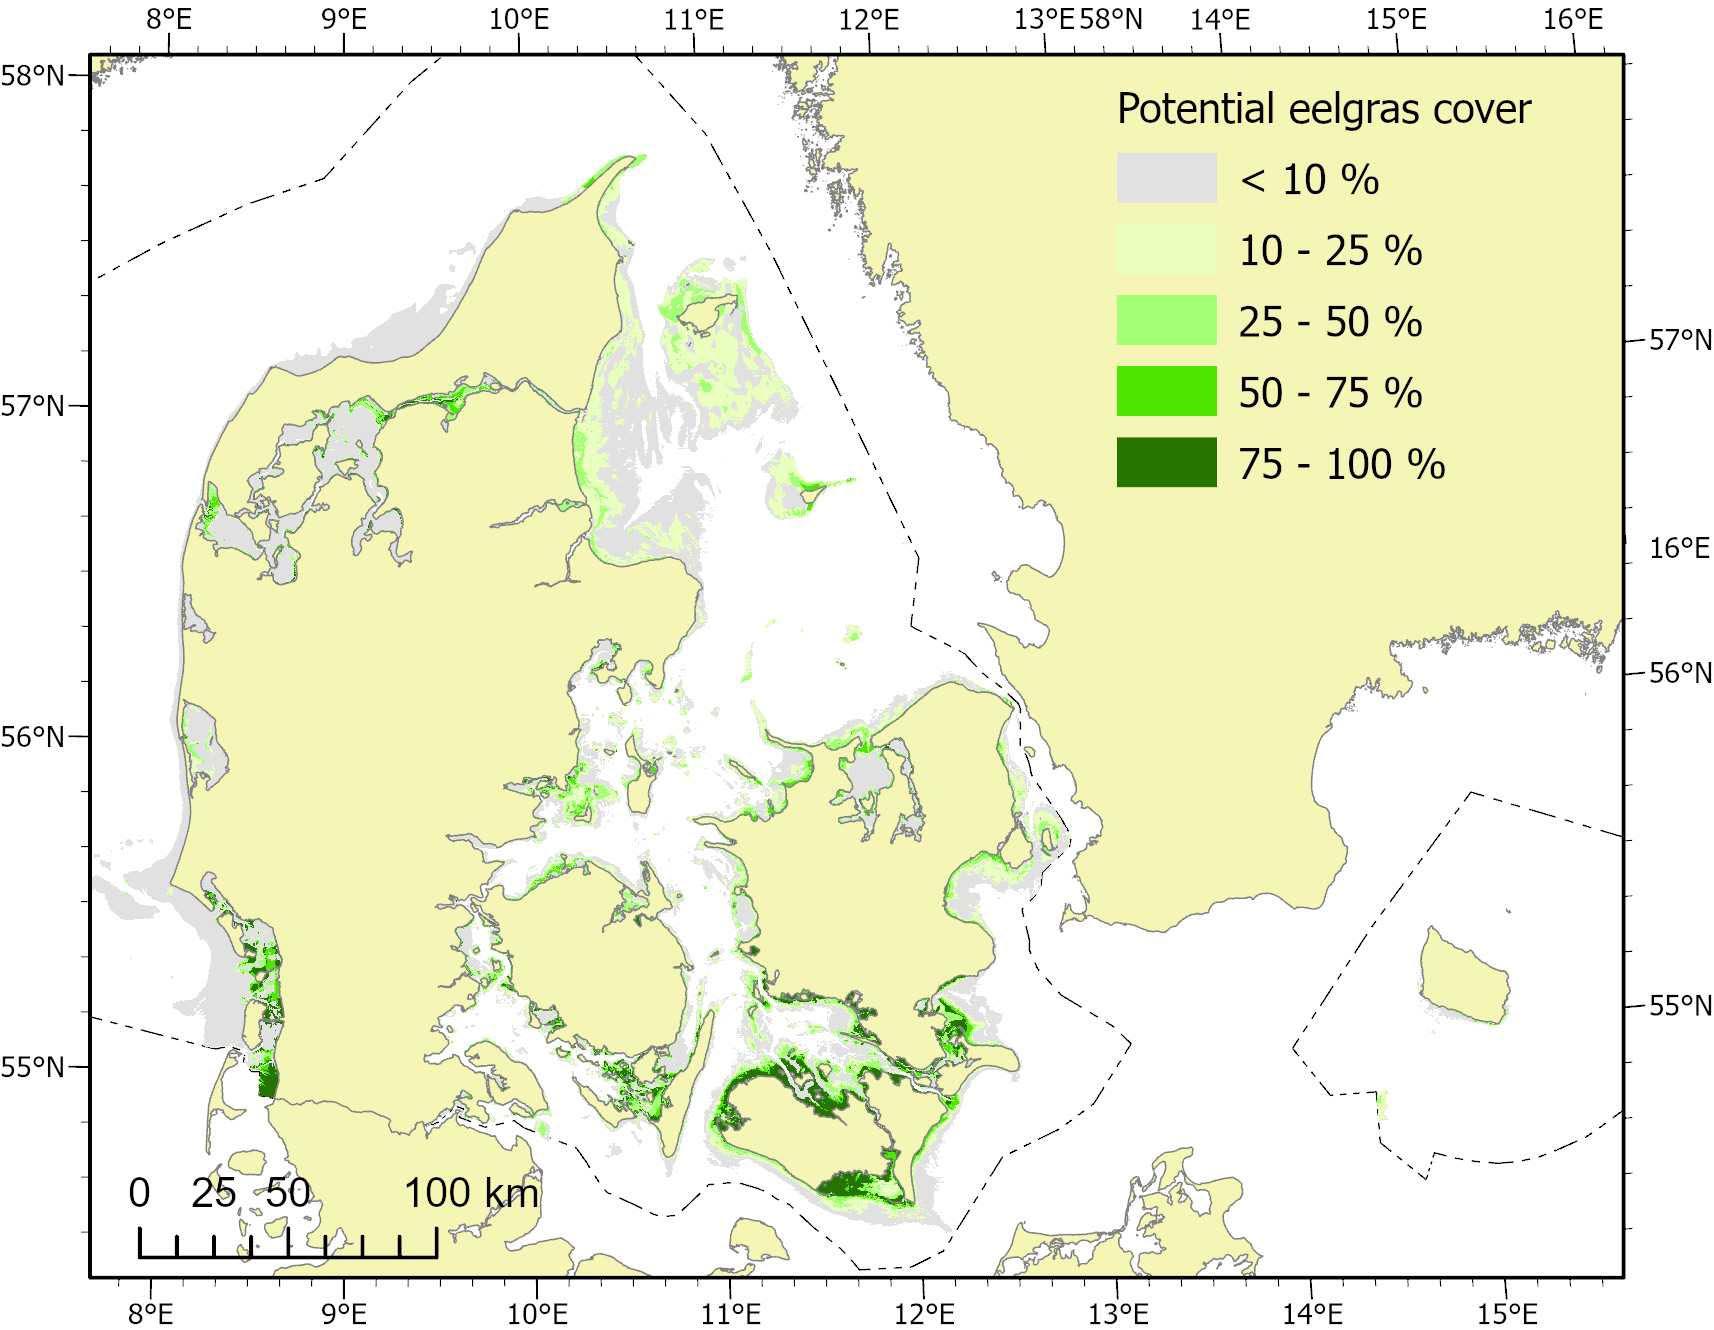
The potential eelgrass cover was predicted and mapped using the eelgrass habitat suitability model developed by Stæhr et al. (2019) and Timmermann et al. (2021) (Figure 3.2).
To evaluate how much of the eelgrass cover was impacted by trawling, we assumed that a single trawling activity disturbs the eelgrass and, hence, that the overlap between the model and the trawling activity shows the direct impact of trawling on eelgrass:
The trawling intensity was recorded either as a binary value with 1 indicating the presence of trawling and 0 its absence, or as a normalized intensity value ranging from 0 to 1. The potential eelgrass cover was expressed as a ratio between 0 and 1, where 0 represents no eelgrass cover and 1 represents complete cover of the pixel area
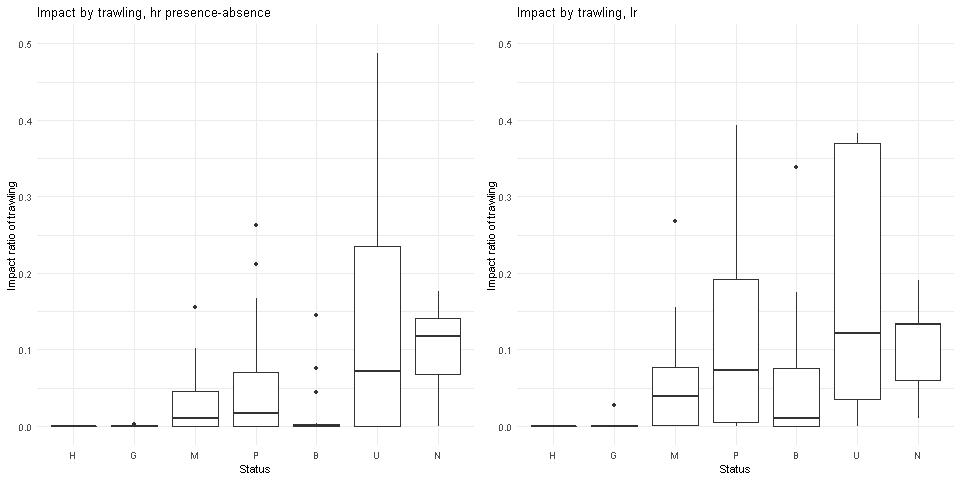
Since only the low-resolution trawling data cover the area relevant for eelgrass completely, we checked how well the data predict the impact on eelgrass in comparison to the high-resolution data within the waterbodies. At the same time, we analysed how the trawling impact differed among the ecological status classes for the quality element angiosperms (sensu WFD) of the coastal waterbodies.
We specifically calculated an impact ratio of trawling per waterbody: trawling impact within the waterbody divided by the average potential eelgrass cover within the same waterbody. Based on the high-resolution data, the waterbodies in high and good ecological status are subject to lower trawling impact than those with moderate, poor and unknown status or where the depth limit for eelgrass is not relevant. The trawling impact ratio for waterbodies in bad status is, however, low. The pattern was very similar when using the low-resolution data although the impact of trawling overall showed higher values than with the high-resolution data (Figure 3.3). The total impact of trawling by large (>12 m) Danish vessels on eelgrass within the coastal waterbodies is 6.9% as calculated from the low-resolution data, and 4.9% as calculated from high-resolution data.
Only the low-resolution fisheries data cover the distance zones completely. For this analysis, the low-resolution data overlapping with the HELCOM area (extended with the fjords at the west coast and the Wadden Sea) are selected. The impact of fisheries with bottom contact is, as expected, highest in the 3 nm zone where most of the eelgrass is located. In this zone, 254,709 ha, which represents 6.6% of the total eelgrass area, is affected. The impact of trawling on eelgrass in other zones ranges from 0.4% in the 3-6 nm-zone to 0.1 % in the two most distant zones (6-12 nm and beyond 12 nm). Overall, fisheries by large (>12 m) Danish vessels with bottom contact affect 39.8% of the total
For this analysis, the MPAs overlapping with the HELCOM area (extended with the fjords at the west coast and the Wadden Sea) were selected. The fisheries high-resolution data do not cover the full extent of the Natura 2000 areas
Table
currently in force or the MPAs according to the MSFD completely (Figures 1.1, 3.1). The results show that trawling affects approximately 17.7% and 16.2% of the total area of the selected MPAs, and 6.2% and 5.1% of the eelgrass area, based on the low- and high-resolution trawling data, respectively. The difference in trawling impact between the two data sets is larger for the eelgrass area than for the total MPA area. This is due to the location of fisheries in the respective data sets in relation to the potential eelgrass cover (Table 3.2 ).
Fisheries data
Modelled
grass
Sum area of fisheries impact on eelgrass (ha) Trawling effect (% of eelgrass cover) Low resolution 278,495 13,170 211,832 1,576,049 17.7 6.2 High resolution 255,594 10,763 211,832 1,576,049 16.2 5.1
To assess the impact of trawling on current eelgrass C-stocks, we used the same GAM model as in question 1 (section 2) to predict the spatial variability of sediment C-stocks, with the difference that we now included trawling as a predictor variable together with the previously used environmental predictor variables. By doing so, we could assess if trawling has a significant impact on the spatial variability of sediment C-stocks while accounting for the effect of other environmental variables that we know can influence sediment C-stocks.
Trawling information on the available high-resolution presence-absence datasets (see section 3) was introduced in both models as a categorical variable with two possible levels: presence and absence of trawling. The coastal Cstock GAM model was also run with the integrated and scaled numerical trawling intensity (see section 3).
To obtain a spatial layer with estimates of eelgrass standing biomass, we used the model described in Carstensen et al. (2016). This model was based on functional relationships that convert eelgrass cover into aboveground biomass, using site-specific information on light attenuation:
where Bmax is a parameter describing the maximum attainable biomass at a given depth in August, I0/Isat is a parameter describing the relative amount of surface radiation where light reduces growth by 24%, and kc is another parameter describing how fast the relationship between biomass and cover levels off. For these parameters, we used the estimated values in Carstensen et al. (2016). The spatial layers fed to the formula were: the coefficient of light attenuation with depth (kd), water depth ( Z) and eelgrass cover ( C), for which we used the eelgrass coverage values obtained by the eelgrass habitat suitability model by Stæhr et al. (2019) and Timmermann et al. (2021)
To get the C-stocks associated to the standing biomass, the predicted eelgrass standing biomass was multiplied by 0.34, which is the average organic carbon content in eelgrass shoots in Denmark estimated with data from Leiva-Dueñas et al. (2023).
Figure 4.1. Spatial distribution of the eight eelgrass meadows where C accumulation rates were assessed and used to build the GAM aiming to model the spatial variability in C-accumulation rates.
To model the spatial variability in C-accumulation rates in eelgrass meadows, another GAM was built. The data used in this model came from only eight seagrass meadows (two in each of Nibe Bredning, Horsens Fjord, Southern Funen, and Roskilde Fjord) where C-accumulation rates had recently been measured by Leiva-Dueñas et al. (2023), providing detailed 210Pb analyses and C-accumulation rate calculations (Figure 4.1). Due to the very limited number of data points, a very simple approach was used to avoid over-parameterising the model. A total of ten candidate models were built using one predictor variable per model. The predictor variables considered were the same as those used for the eelgrass C-stock model. The model chosen, with the lowest AIC, was the one with wave relative exposure index as explanatory variable.

Eelgrass standing biomass and C-accumulation rates were predicted within the current potential eelgrass extent as delimited by the area modelled with at least 10% eelgrass cover (Staehr et al. 2019; Timmermann et al. 2021) within the coastal waterbodies.
Spatial information on trawling (presence-absence format and based on merged trawling high-resolution data from within coastal waterbodies and Natura 2000 areas) was transformed into a polygon vectorial layer and used as a mask to extract the values of C- stocks in aboveground eelgrass biomass and C-accumulation rates within the current potential areas of eelgrass affected by trawling. This approach assumes that the standing biomass and accumulation rates of eelgrass are completely lost due to trawling, which we believe is a realistic scenario. The total eelgrass biomass C-stocks and C-sediment accumulation flux impacted by trawling were calculated by multiplying the C-biomass stock or C-accumulation rate pixel value by pixel area and adding up the resulting C-mass.
On sedimentary C-stocks built up in the eelgrass meadows Trawling did not have a significant impact on sediment C-stocks in either of the GAMs including trawling as a predictor variable. The coastal C-stock GAM showed no impact from trawling at all, not even a trend, on the overall
sediment C-stocks, neither when using the numerical intensity trawling variable (p = 0.87) or its categorical presence-absence form (p = 0.65). The lack of significance of trawling on sediment C-stocks across coastal seabed sediments is in line with results from Epstein et al. (2022), who conducted a literature review and observed that 61% of the compiled studies directly investigating the impact of trawling on seabed C-stocks reported no significant effects, while 29% reported lower C-stocks and 10% higher C- stocks in trawled areas.
In the eelgrass C-stock GAM, trawled areas showed lower C-stocks, although not significantly so (p = 0.17). Out of the 48 data points, distributed across Denmark, used to train the eelgrass C-stock model, only four had direct trawling impact on top of them. The unbalanced number of sites within trawled and non-trawled zones may have prevented the model from showing a significant trawling impact on eelgrass sediment C-stocks. Even when comparing C-stocks at a local-scale (in fjords where trawling over eelgrass was recorded) there is no significant difference in C-stocks between trawled and nontrawled areas (two-way ANOVA with fjord and trawling, F-statistic of 2.44 and p-value for trawling of 0.179). Despite not being significant, results point to lower C-stocks in the trawled areas at a local-scale (Figure 4.2). These results should be interpreted with caution due to the small sample size, which may have prevented the detection of a significant difference
Previous studies on the impact of physical disturbance on the sediment Cstocks of seagrass meadows have shown inconsistent results. The variation appears to be linked to the degree of intensity of the disturbance. Small-spatial scale physical damage due to boat anchor damage (Macreadie et al., 2014) or traditional harvesting activities (Branco et al., 2018) did not exhibit detectable decreases in the superficial sediment C-content or C-stocks. However, more intense mechanical destruction over space and time by mooring activities, boat propeller scarring, and clam harvesting has significantly decreased the sediment C-stocks of seagrass meadows (Macreadie et al. 2015; Serrano et al. 2016; Arney et al. 2020; Román et al. 2022). Thus, the limited impact of trawling detected with our data could be attributed to a trawling activity limited in space and time over the Danish eelgrass meadows by the large trawling vessels included in our study. However, we cannot discard the possibility that the potential eelgrass area under trawling influence is underestimated due to large uncertainties in the available trawling data because of lack of inclusion of smaller vessels, lack of activation of the tracking systems during fishing (Petersen et al. 2020) or due to the short-time period covered by the trawling data (four years). Another point to consider is that the sediment C-stocks in soft coastal sediments might be subject to considerable horizontal redistribution due to resuspension by physical disturbance (e.g. hydrodynamics, bioturbation, trawling). In this way, trawling would contribute to blurring its own impact signal on C-stocks by causing resuspension and redistribution of sediment material.
Assuming that the non-significant impact of trawling identified by the eelgrass GAM model is probably due to insufficient trawling data and in order to proportionate a rough estimate of the C-stocks potentially lost due to trawling in eelgrass meadows, we used the eelgrass C-stock GAM, including the categorical trawling variable, to predict C-stocks in eelgrass sediments for the following two scenarios:
• No trawling over the potential eelgrass distribution.
Figure 4.2. A) Spatial distribution of all sediment cores obtained in eelgrass meadows for which C stocks down to 10 cm were estimated and used in the eelgrass C-stock GAM model, with a zoom in the two fjords where trawled and non-trawled areas occur over potential eelgrass meadows. B) Boxplot of C-stocks comparing trawled and non-trawled areas in each of the fjords where trawling and non-trawling areas occur together (left plot is in Limfjord and right plot in North Funen). Values over or under the boxplots indicate the average and standard error in C-stocks for each corresponding category.

• Trawling in areas where current trawling activity is recorded and overlaps with the potential eelgrass distribution.
In the trawled areas with potential eelgrass distribution, which covers about 204 km2, the mean C-stocks showed average values of 278 ± 213 g C m-2 when non-trawled as opposed to 185 ± 140 g C m-2 when trawled. The trawling impact according to GAM led to decreases in the sediment C-stocks of, on average, 34%. The total C-stocks for the two scenarios were computed to 792 (3522394) Gg C for the non-trawling scenario and 787 (350-2380) Gg C for the trawling scenario. The total stock difference between the scenarios, 6.3 (2-14) Gg C, could be considered a rough estimate of the cumulative disturbance of trawling in the top 10 cm of sediment C-stocks within Danish eelgrass meadows. The sediment C-stock that would be currently impacted by trawling is equivalent to a very low percentage (< 1%) of the total sediment C-stock modelled within areas with potential eelgrass distribution in coastal waterbodies.
To assess how realistic the modelled eelgrass standing biomass values are, we compared the modelled values with measured field data in the literature. The modelled average eelgrass aboveground dry weight (DW) biomass, 80 ± 55 g DW m-2 (range 0.03-201), falls at the lower end of the range of measured biomasses in Danish Z. marina meadows, namely 52-830 g DW m-2 by Leiva-Dueñas et al. (2023), but corresponds well with the aboveground biomass values of 76-210 g DW m-2 observed also in Denmark by Röhr et al. (2016).
The C-stocks in eelgrass aboveground biomass show a similar spatial pattern to that of sediment C-stocks, with higher values in inner fjords and along the southern coasts of the islands of Funen and Zealand (Figure 4.2A). Out of these predicted C-stocks in eelgrass aboveground biomass, those likely affected and lost due to current trawling activity have an average value of 18.2 ± 13 g C m-2, with the total stock amounting to ca. 3.8 Gg C, which is equivalent to 2.4% of all the C-stocks in the eelgrass standing biomass modelled within potential meadows located inside coastal waterbodies.
As mentioned above, C-accumulation rates are only available for eight eelgrass meadows (Leiva-Dueñas et al., 2023), which have been upscaled to a coarse C-sequestration map for eelgrass meadows in Denmark based on the main identified driver of the spatial variability, which turned out to be the wave relative exposure (Leiva-Dueñas et al., in prep.). Therefore, the predicted C-accumulation rates are clearly higher in sheltered areas, i.e. inner fjords (Figure 4.3B). On this basis, the main area where trawling impacts wider zones with higher C- accumulation rates in potential eelgrass areas are in the southern areas of Limfjorden and in Horsens Fjord, and the overall impacted sediment C-accumulation rates across Denmark average 0.8 g C m-2 y1 (range from 0 to 309 g C m-2 y-1). The total sediment C flux currently impacted by trawling is around 0.35 (0-0.71) Gg C y-1, which is equivalent to 1.9% of the modelled total C-accumulation rate within potential meadows located inside coastal waterbodies.

On sedimentary C-stocks built up in the eelgrass meadows
To assess the impact of trawling on future eelgrass carbon stocks, we used the eelgrass C-stock GAM including categorical trawling information as a predictor variable together with the previously used environmental predictor variables to predict C stocks in eelgrass sediments for the following two scenarios:
• No trawling over the future potential eelgrass distribution.
• Trawling in the same areas where current trawling activity is recorded and overlaps with the future potential eelgrass distribution.
In both scenarios, the irradiance predictor variable used in the GAM was modified to account for an improvement in sea bottom irradiance levels according to a fulfillment of the WFD requirements. The future potential distribution of eelgrass is estimated using the Habitat Suitability Model (Stæhr et al. 2019) and considers the abovementioned improvement in water environment conditions. As before, the trawling data used in the model were categorical with two possible levels: presence or absence of trawling. The difference between the two scenarios in stocks per area and in the total stock integrated over the future potential eelgrass distribution gives a rough estimate of the amount of sediment C that could be affected by trawling in the future.
To obtain a spatial layer with estimates of eelgrass standing biomass in a future situation, we again used the model already described in Carstensen et al. (2016), although this time we used two of the spatial layers with modifications:
• Eelgrass coverage values and potential distribution of eelgrass in a future scenario in which water conditions are improved as required by the WFD. The layer was obtained using the eelgrass habitat suitability model by Stæhr et al. (2019) and Timmermann et al. (2021)
• The “coefficient of light attenuation” spatial layer was systematically reduced by 22% relative to current values, which is the average improvement of light conditions needed to fulfil the WFD requirements for eelgrass depth limits (Timmermann et al. 2020).
To determine the C-stocks associated with the standing biomass, we followed the same approach as in question 3 (section 4).
The C-accumulation rate model used to predict the spatial variability in a future potential distribution of eelgrass was the same GAM as described in question 3 (section 4). Carbon accumulation rates were also predicted within the future potential eelgrass distribution as delimited by the area modelled with at least 10% eelgrass cover and within water basin boundaries.
Spatial information on trawling (presence-absence based on merged trawling data within waterbodies and Natura 2000 areas) was transformed into a polygon vectorial layer and used as a mask to extract the values of C-stocks in eelgrass aboveground biomass and C-accumulation rates in future eelgrass areas overlapped by current trawling activity. This approach assumes that eelgrass standing biomass and accumulation rates are completely lost due to trawling. The total eelgrass biomass C-stocks and sediment C-accumulation flux impacted by trawling were calculated by multiplying the pixel values of biomass C-stocks or C-accumulation rates by the area of the pixel and adding up the resulting Cmass.
Over the trawled areas within the areas with potential distribution of eelgrass in the future, the mean C-stocks showed an average value of 82 ± 93 g C m-2 when not trawled and a decrease to 54 ± 61 g C m-2 when trawled. The total C-stocks for the two scenarios were 794 (356-2453) Gg C in the non-trawled scenario and 788 (352-2439) Gg C in the trawled scenario. The difference in total C stocks between the two scenarios, 7.6 (4-14) Gg C, can be considered a rough estimate of the cumulative disturbance of trawling, which may be avoided with a ban, in the top 10 cm of sediment C-stocks within Danish eelgrass meadows in the future scenario. Again, the sediment stock that would be impacted by trawling in a future situation equals a very low percentage (< 1%) of the total sediment C stocks modelled within areas with potential eelgrass distribution in coastal waterbodies.
The total C-stocks in the aboveground eelgrass biomass that could be recovered after a trawling ban is estimated to ca. 5.8 Gg C, which is equivalent to 3% of all the C stocks in eelgrass standing biomass modelled within future potential meadows located inside coastal waterbodies. Carbon stocks in eelgrass standing biomass per area basis showed an average value of 19.5 ± 13 g C m-2 with a spatial pattern that did not greatly differ from the current scenario except for the fact that the eelgrass area for which the values are predicted reaches deeper zones due to improved light conditions (Figure 5.1 A).
Because the relative exposure index was assumed to be similar to that in the current scenario, the highest predicted C-accumulation rates in a future scenario remain within sheltered areas (Figure 5.1 B). The main future areas where a trawling ban could benefit eelgrass C- accumulation rates are, still, in the south of Limfjorden and in Horsens Fjord but also in the inner southern areas of the Isefjord, with sediment C-accumulation rates averaging 1 g C m-2 y-1 (range from 0 to 310 g C m-2 y-1).
The total sediment C flux that could be recovered after a trawling ban is estimated to 0.73 (0-1.7) Gg C y-1, which is equivalent to 3.8% of the total C accumulation rate within future potential meadows located inside coastal waterbodies. Since we base the assessment on a scenario of fulfillment of the WFD with respect to eelgrass by 2027, the effect of a trawling ban on eelgrass meadows would lead to storage of approximately 2.18 (0-5.1) Gg C by 2030 (i.e. after three
years of storage) and of 19.7 (0-46) Gg C by 2050 (i.e. after 23 years of storage). As reestablishment of eelgrass is a long-term process, the scenario should be seen as an upper limit.

Figure 6 1. A) Temporal trends of Secchi depth and eelgrass depth limits in Nibe-Gjøl Bredning, Limfjorden over the period 19882021. Depth limits are represented by the deepest occurrence of single shoots (max depth limit) and the deepest occurrence of 10% eelgrass cover (main distribution limit). B) Temporal trends of mussel landings in Nibe-Gjøl Bredning over the same time period.

Coupled information on temporal trends in eelgrass depth distribution, water clarity and mussel trawling activity in Nibe/Gjøl Bredning in Limfjorden serves as an example of how a trawling ban may stimulate eelgrass distribution. Data on eelgrass and water clarity come from the national marine monitoring program and mussel landings are derived from the Danish Fisheries Agency.
At the beginning of the monitoring period, i.e. 1989-1995, no mussel trawling (except in 1994) took place in Nibe Gjøl Bredning, and the lower depth limit of the eelgrass meadows was closely coupled with the Secchi depths (Figure 6.1 A). However, in the following decade until 2004, when a trawling ban was implemented, mussel trawling was intense, with up to 4000 tons of mussels landed annually. During this decade and until 2009, i.e. several years after the trawling ban was implemented, eelgrass depth limits were decoupled from Secchi depths so that the meadows extended to much shallower depths than the light conditions allowed. From 2010 to 2013, the eelgrass depth distribution increased and gradually matched the Secchi depths, first reflected by an extension of the maximum depth limit, then by an extension of the main distribution limit (depth limit of 10% cover). In 2014-2018, i.e. a decade after the trawling stopped, depth limits again matched the Secchi depths. However, despite the continued trawling ban, a decoupling between depth limits and Secchi depths have recently reappeared, indicating new disturbance of the meadows (Figure 6.1 B).
A closer look at the development in the spatial distribution of eelgrass meadows in recent years (2018-2021) reveals that the losses of eelgrass mainly happened centrally in the bay where the three transects (tr 17, tr 44, tr 47) showed major losses of eelgrass along their deeper edges (Figure 6.2, upper panels).
In contrast, the three transects at the edges of the bay (tr 18, tr 33, tr 34) did not show such declines. We illustrate the losses in the central part of the bay with tr 44 as an example (Figure 6.2, lower panels). Here, plots of eelgrass cover versus distance from land over the years 2018-2020 show major losses of deep eelgrass cover between the survey in September 2019 and that in September 2020 (Figure 10, lower panels). The losses extended over large stretches of the seafloor from around 1500 to 3000 m from land, and some meadows at around 1000 m from land were also lost (Figure 6.2, lower panels).

We can only speculate about the cause of these losses. Heat waves could be one potential cause, but there were no heatwaves between 2019 and 2020. Sediment mobility might disturb the meadows, but this would be expected to have most effect at shallow depths closest to the shore. Mussel trawling could also produce such losses, but since there is a trawling ban there is no documentation of such disturbance in recent years.
Figure 6
Upper
Map of Nibe-Gjøl Bredning showing the location of monitoring transects for eelgrass; the red circle encloses the transects in the central bay where losses of eelgrass meadows have been recorded in recent years. Lower left panel: Map showing eelgrass occurrence along transect 44 over the years 2018-2020 (and 2021, covered by the 2020 transect). Lower right panel: Eelgrass cover along transect 44 as a function of distance from the shore over the years 2018-2020. The pattern of eelgrass cover in 2021 (not shown) was similar to that in 2020.
We aimed to quantify the potential effect of trawling on eelgrass C-stocks in Danish coastal waters and predict the future effect of a trawling ban on these variables. We applied two datasets (high- vs. low-resolution) on fisheries with bottom contact. These were comparable in their zones of overlap and were, therefore, combined and overlayed with maps of eelgrass distribution and sediment C-stocks (top 10 cm; based on two different C-stock models: an eelgrass C-stock model and a coastal C-stock-model) to evaluate potential effects of trawling. The trawling data included Danish vessels >12 m length while smaller vessels and foreign vessels were not considered.
The analyses showed that trawling with large Danish vessels affects 39.8% of the total study area in Danish coastal waters but only 7.2% of the modelled potential eelgrass area. Even with this relatively limited impact, the results indicate that fisheries with bottom contact can be a contributing factor preventing eelgrass meadows from extending to deeper areas. Eelgrass-associated C-stocks include those in eelgrass biomass and sediments, which are also affected by discontinued eelgrass C-accumulation capacity following loss of meadows. We document large sediment C-stocks within eelgrass areas but equally large or larger stocks outside eelgrass meadows. The analysis detected no significant impact of trawling on eelgrass sediment C-stocks, although a tendency towards lower C-stocks in trawled eelgrass areas was observed. Upscaling the (non-significant) trawling effect identified by the eelgrass C-stock model indicated a trawling impact of <1% of the sediment C-stocks in eelgrass. Moreover, our results indicated a limited effect of trawling on current and future C-stocks in the standing eelgrass biomass (2.4 to 3% of total biomass C-stocks of each scenario) and associated C-accumulation rate (1.9 to 3.8% of the total C-accumulation rate of each scenario). This low impact is due to a non-significant effect of recorded trawling on sediment C-stocks and a limited overlap between the poteial extent of eelgrass meadows and areas with recorded trawling activity. The analysis is insufficient to evaluate the overall effect of trawling on eelgrass C-stocks as it solely included effects of trawling with larger Danish vessels. It should also be noted that the C-stocks represent variable timespan of accumulation, which is not reflected in the estimated effects. Scarce data of coastal C-accumulation rates also prevented an accurate assessment of how trawling impacts C-accumulation rates within and beyond eelgrass meadows, and the lability and fate of eelgrass carbon remobilised by trawling is also unknown. While our modeling at a national scale indicated limited effect of a trawling ban on eelgrass extent, our case study indicated a marked increase in eelgrass cover after a realised trawling ban in a specific study area (Nibe Bredning).
Future studies should aim for high-resolution data for all trawling vessels, for eelgrass distribution and associated sediment C-stocks and C-accumulation rates, as well as for effects of individual trawling events to better quantify potential impacts. Data on the lability of the sediment carbon and its spatial variability within and beyond eelgrass meadows would also contribute to further elucidating how prone to degradation the organic material accumulated in eelgrass sediments impacted by trawling is. However, even with high-quality data, trawling itself may contribute to blur its own potential effect on sediment C-stocks by inducing resuspension and redistribution of sediment. Despite challenges there is a need to better quantify effects of trawling on eelgrass meadows and their important ecosystem functions.
Arney, R.N., Shepherd, A.K., Alexander, H.D. et al. 2021. Soil carbon and nitrogen storage in natural and prop-scarred Thalassia Testudinum seagrass meadows. Estuaries and Coasts 44, 178–188.
https://doi.org/10.1007/s12237-020-00765-6.
Branco, J., Pedro, S., Alves, A. S., Ribeiro, C., Materatski, P., Pires, R., Caçador, I., Adão, H. 2018. Natural recovery of Zostera noltii seagrass beds and benthic nematode assemblage responses to physical disturbance caused by traditional harvesting activities. Journal of Experimental Marine Biology and Ecology 502, 191-202. https://doi.org/502. 10.1016/j.jembe.2017.03.003.
Carstensen, J., Krause-Jensen, D., Balsby, T.J.S. 2016. Biomass-cover relationship for eelgrass meadows. Estuaries and Coasts 39, 440–450 (2016). https://doi.org/10.1007/s12237-015-9995-6
Duarte, C. M., Losada, I. J., Hendriks, I. E., Mazarrasa, I., Marbà, N. 2013. The role of coastal plant communities for climate change mitigation and adaptation. Nature climate change, 3(11), 961-968.
Epstein, G., Middelburg, J.J., Hawkins, J P., Norris, C R., Roberts, C.M. 2022. The impact of mobile demersal fishing on carbon storage in seabed sediments. Global Change Biology 28, 2875–2894. https://doi.org/10.1111/gcb.16105
Friedlingstein, P., Jones, M.W., O’Sullivan, M. et al. 2021. Global Ccarbon budget 2021. Earth System Science Data Discussion 2021, 1–191. https://doi.org/doi:10.5194/essd-2021-386
HELCOM 2019a. Fishing intensity total 2009 surface gear v2. https://metadata.helcom.fi/geonetwork/srv/eng/catalog.search#/metadata/3c317aa4-f2da-4cac-abd9-5194b0cf7208
HELCOM 2019b. Fishing intensity total 2010 surface gear v2.
HELCOM 2019c. Fishing intensity total 2011 surface gear v2.
HELCOM 2019d. Fishing intensity total 2012 surface gear v2.
HELCOM 2019e. Fishing intensity total 2013 surface gear v2.
HELCOM 2019f. Fishing intensity total 2014 surface gear v2.
HELCOM 2019g. Fishing intensity total 2015 surface gear v2.
HELCOM 2019h. Fishing intensity total 2016 surface gear v2.
Holbach, A., Göke, C., Leiva-Dueñas, C., Krause-Jensen, D., Upadhyay Staehr, P.A. In preparation. Spatial distribution of carbon stocks in coastal sediments – On the impact of seagrasses, trawling and environmental conditions.
Krause-Jensen, D., Duarte, C.M., Sand-Jensen, K., Carstensen, C. 2021. Century-long records reveal shifting challenges to seagrass recovery. Global Change Biology 27, 563–575. https://onlinelibrary.wiley.com/doi/full/10.1111/gcb.15440
Leiva-Dueñas, C., Graversen, A E.L, Banta, G.T., Holmer, M., Masqué, P., Stæhr, P.A.U., Krause-Jensen, D. 2023. Capturing organic carbon and nitrogen in eelgrass sediments of Southern Scandinavia. Limnology & Oceanography. doi: 10.1002/lno.12299.
Macreadie, P.I., York, P.H., Sherman, C.D.H. et al. 2014. No detectable impact of small-scale disturbances on ‘blue carbon’ within seagrass beds. Marine Biology 161, 2939–2944.
https://doi.org/10.1007/s00227-014-2558-8
Macreadie, P.I., Trevathan-Tackett, S.M., Skilbeck, C.G., Sanderman, J., Curlevski, N., Jacobsen, G., Seymour J.R. 2015. Losses and recovery of organic carbon from a seagrass ecosystem following disturbance. Proceedings of the Royal Society B282: 20151537.
http://dx.doi.org/10.1098/rspb.2015.1537
Miljøstyrelsen 2019. Fiskeriintensitet fra 2014 – 2018. https://miljoegis.mim.dk/spatialmap?profile=vandrammedirektiv3basis2019
Miljøstyrelsen 2021. Analyseret fiskeriintensitet 2013 – 2018.
https://miljoegis.mim.dk/spatialmap?profile=natura2000planer3h2021
Petersen, J.K. (Ed.), Brooks, M.E., Edelvang, K., Eigaard, O R., Göke, C., Hansen, F.T., Kuhn, J., Mohn, C., Maar, M., Olsen, J., Pastor, A., Stæhr, P.A., Svendsen, J.C. 2020. Andre presfaktorer end næringsstoffer og klimaforandringer – effekter af stedspecifikke presfaktorer på det marine kvalitetselement ålegræs. Dansk Skaldyrcenter. DTU Aqua-rapport Vol. 2020 No. 361. https://www.aqua.dtu.dk/-/media/Institutter/Aqua/Publikationer/Rapporter-352-400/3812021_Andre-presfaktorer-end-naeringsstoffer-og-klimaforandringersammenfatning.ashx
Petersen, J.K. 2021. Andre presfaktorer end næringsstoffer og klimaforandringer – sammenfatning. DTUAqua. DTU Aqua-rapport Nr. 381-2021
https://www.aqua.dtu.dk/-/media/Institutter/Aqua/Publikationer/Rapporter-352-400/381-2021_Andre-presfaktorer-end-naeringsstoffer-og-klimaforandringer-sammenfatning.ash
Román, M., de Los Santos, C.B., Román, S., Santos, R., Troncoso, J.S., Vázquez, E., Olabarria, C. 2022. Loss of surficial sedimentary carbon stocks in seagrass meadows subjected to intensive clam harvesting. Marine Environmental Research 175, 105570.
https://doi.org/10.1016/j.marenvres.2022.105570
Röhr, M.E., Boström, C., Canal-Vergés, P., Holmer, M. 2016. Blue carbon stocks in Baltic Sea eelgrass (Zostera marina) meadows, Biogeosciences 13, 6139–6153. https://doi.org/10.5194/bg-13-6139-2016.
Serrano, O., Ruhon, R., Lavery, P. et al. 2016. Impact of mooring activities on carbon stocks in seagrass meadows. Science Report 6, 23193.
https://doi.org/10.1038/srep23193
Statistics Denmark 2023a. FISK1: Danish vessels by region, unit, type of vessels, length and tonnage. https://www.statbank.dk/FISK1. Access 2023/02/06
Statistics Denmark 2023b. FIREGN2: Accounts statistics for fishery (average per unit) by vessel length and items www.statbank.dk/FIREGN2. Access 2023/02/06
Stæhr, P.A., Göke, C., Krause-Jensen, D., Timmermann, K., Upadhyay, S., Ørberg, S.B., Holbach, A.M. 2019. Habitat model of eelgrass in Danish coastal waters: development, validation and management perspectives. Frontiers in Marine Science 6, 175.
https://doi.org/10.3389/fmars.2019.00175
Timmermann, K., Christensen, J.P.A., Erichsen, A. 2020. Referenceværdier og grænseværdier for ålegræsdybdegrænser til brug for vandområdeplanerne. Aarhus Universitet, DCE – Nationalt Center for Miljø og Energi, 28 s. - Videnskabelig rapport nr. 390.
http://dce2.au.dk/pub/SR390.pdf
Timmermann, K., Stæhr, P.A., Göke, C., Stæhr, S.U., Erichsen, A. (2021). Klimaændringernes betydning for indsatsbehov til kystvande. DCENationalt Center for Miljø og Energi. Videnskabelig rapport fra DCENationalt Center for Miljø og Energi No. 479
https://dce2.au.dk/pub/SR479.pdf