14 minute read
1 Background


Eelgrass is the most important marine plant in Danish coastal waters where vast sheltered and shallow areas with sandy seafloor should support extended eelgrass meadows and associated biodiversity, carbon and nutrient storage capacity and natural coastal protection (Duarte et al. 2013). However, over the past century, at least a third of the meadows have been lost, first due to a disease in the 1930’s, then due to multiple pressures including eutrophication and physical damage, from e.g. trawling (Krause-Jensen et al. 2021). In the face of climate change there is an increased need to support the resilience of eelgrass meadow<s by minimizing other pressures.
This briefing is the product of a research agreement between Danmarks Naturfredningsforening (DN) and Aarhus University (AU), Department of Ecoscience, with the aim to provide an estimate of the potential effects of trawling-free zones on carbon stocks (blue carbon) of eelgrass meadows in Denmark. Danmarks Naturfredningsforening has commented on an earlier version of the briefing, the comments can be found online.
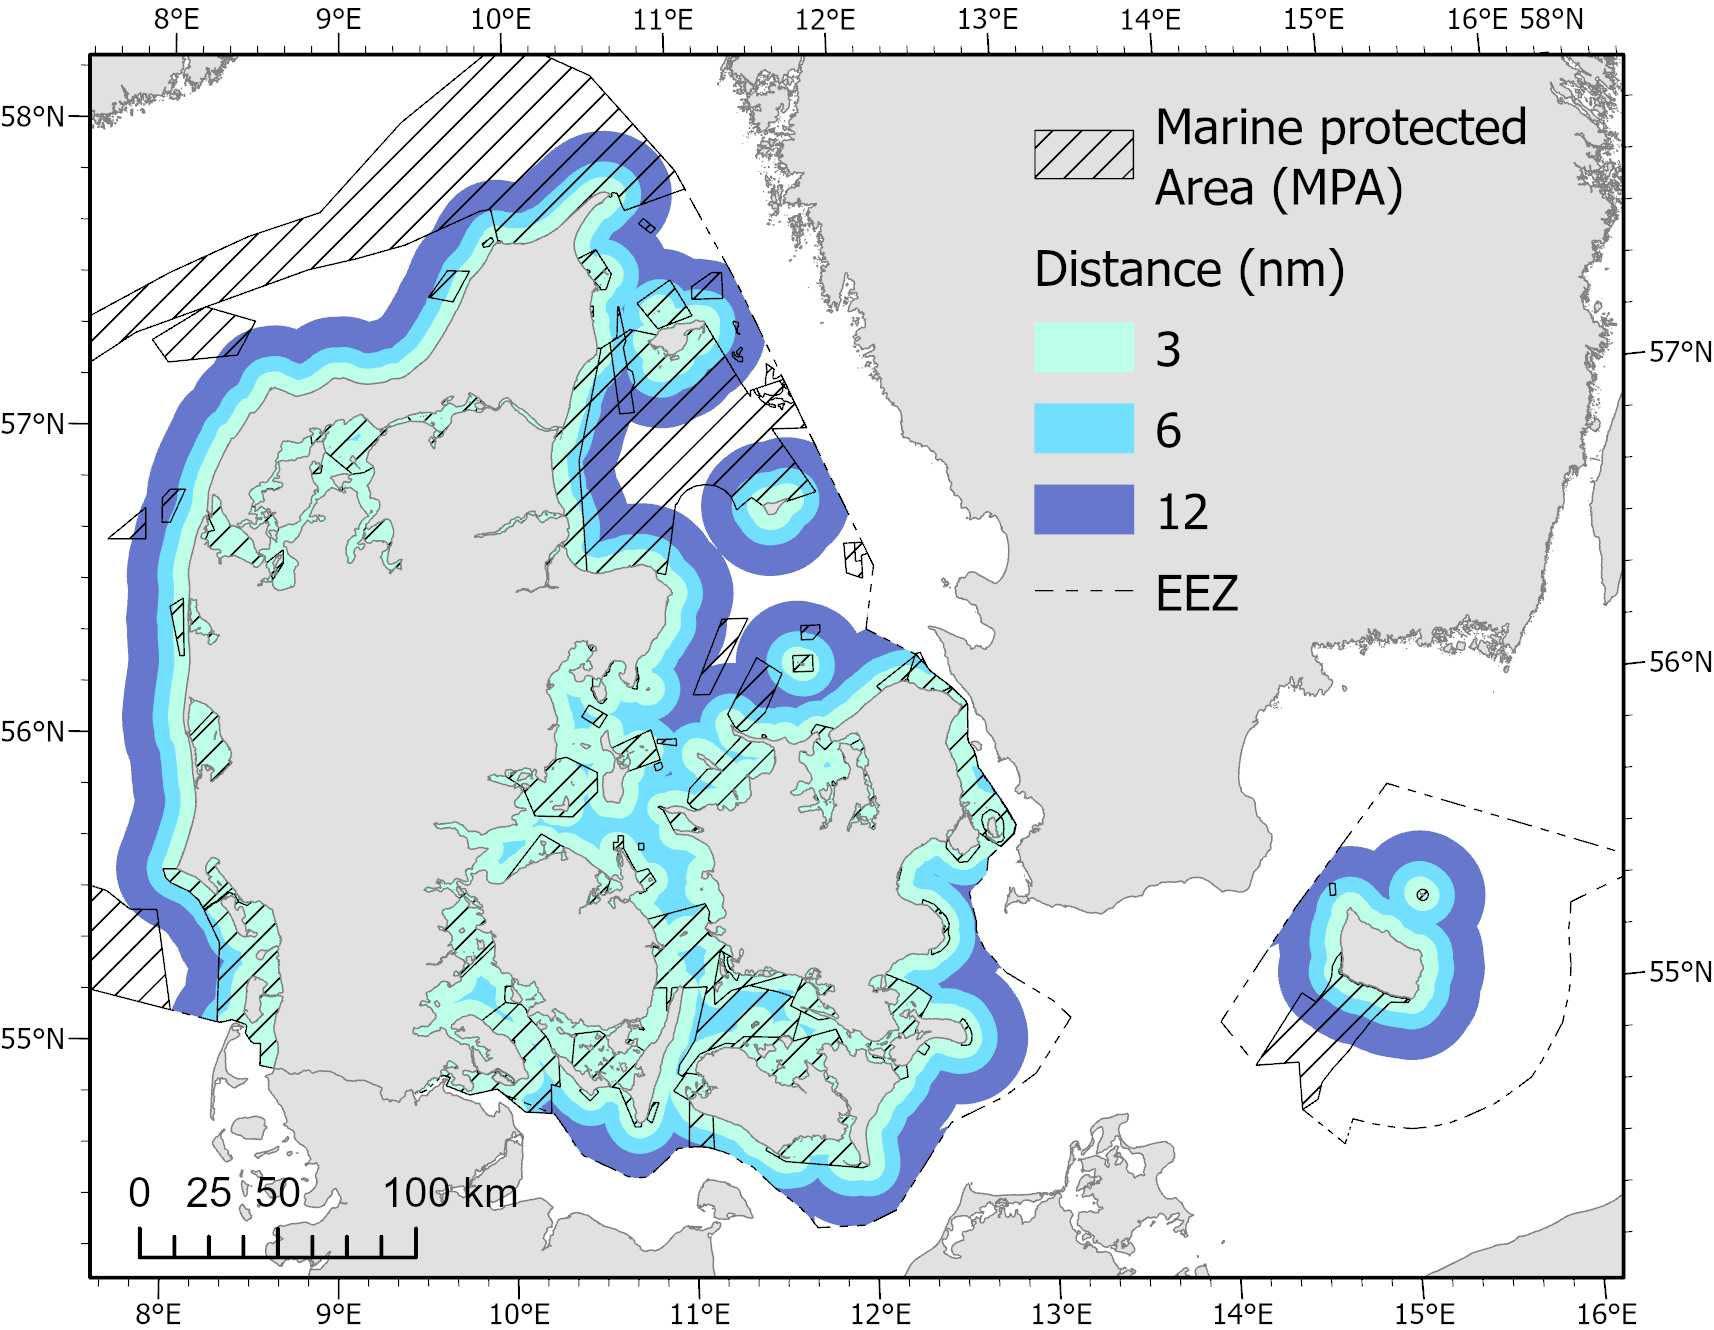
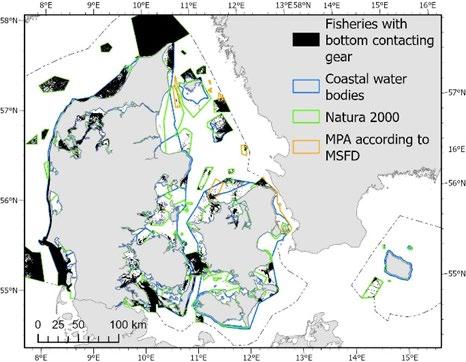
The focus is on eelgrass meadows within the Marine Protected Areas (MPAs) that are composed of the Natura 2000 areas (N2000) and the protected areas according to the Marine Strategy Framework Directive (MSFD) and within the 3, 6 and 12-nautical mile boundaries, respectively (Figure 1.1)
The study builds on quantification of blue carbon in Danish eelgrass meadows via the recently concluded project “Blue forests – Marine forests as carbon sinks” funded by the Velux Foundation and initial modelling of blue carbon conducted via that project.
The analysis has four components, each targeting one of the research questions listed below, and the briefing is organised accordingly.
Question 1: What is the size of carbon stocks in Danish eelgrass meadows within protected areas and at different distances from land (3, 6 and 12 nautical mile zones)?
Approach: We develop a GIS layer that combines the potential distribution area of eelgrass (following Stæhr et al. 2019; Timmerman et al. 2021) with a GIS layer on the estimated carbon stocks (C-stocks) in eelgrass sediments. For comparative purposes, the estimates also consider C-stocks beyond eelgrass areas.
Question 2: What is the direct effect of trawling on the eelgrass extent?
Approach: The trawling effect on the eelgrass extent is quantified as the overlap between the potential distribution area of eelgrass and the area of the seafloor subject to trawling. The potential eelgrass area is modelled based on ecological drivers and does not consider trawling impact (Staehr et al. 2019; Timmermann et al. 2021). Assessment of trawling impact relies on VMS (“Vessel Monitoring System”) trawling data for fisheries and black box data for mussel dredging (Petersen et al. 2021). Our assessment of trawling impact includes a statistical comparison of the trawling pressure in the relevant eelgrass areas based on two available data aggregation levels:
• high-resolution data (100 m*100 m) limited to the coastal waterbodies and Natura 2000 areas provided by the Environmental Protection Agency (Miljøstyrelsen 2019, 2021). This dataset covers the period 2014 – 2018 for the coastal waterbodies and 2013 – 2018 for the Natura 2000 areas. The high resolution of the data was achieved by combining the VMS and black box information with data from the automatic identification system (AIS) used for vessel tracking.
• low-resolution (approximately 3 km*5.6 km) data representing a time series (2009-2016) for the HELCOM area covering the Kattegat, Belt Sea and Baltic Sea areas that are relevant for eelgrass (HELCOM 2019a-h). The data was chosen because it covers a longer time series than the data provided by the European Marine Observation and Data Network (Emodnet), which would cover the complete Danish waters. It should be noted that DCE recently gained full access to VMS data for all of Denmark. Although the current project did not have sufficient resources and timespan to integrate those complete data sets in the analyses, this could be done in a future larger project.
Since 2012, all fishing vessels with at least 12 m length are obliged to use VMStracking. The high-resolution data only includes Danish vessels. Since the lowresolution data is based on national data, it only includes Danish vessels as well. As a result, vessels measuring <12 m length and foreign vessels are not considered in the analysis. Although the number of fishery vessels <12 m length (1786 vessels) is five times higher than the number of vessels ≥12m length (349 vessels) (Statistics Denmark 2023a), the registered days at sea for vessels <12 m length are only 27 % of those of the larger vessels. On the other hand, the smaller boats may be more active at shallow water, in the potential eelgrass zone. Shrimp beam trawlers and mussel dredgers, which make up 5% of the days at sea, are not categorized by length (Statistics Denmark 2023b). It was not possible to estimate the activity of foreign vessels in the Danish waters.
Question 3: What is the potential effect of trawling on current eelgrass carbon stocks?
Approach: We comp<are the current potential eelgrass distribution for situations with and without trawling ban (as described under Q2) and estimate trawling-caused removal of carbon stock via:
• lost eelgrass standing stock (g C m-2)
• lost sedimentary C-stocks built up in the eelgrass meadows The effect on eelgrass-associated C-stocks will be supported by comparing C-stocks in currently trawled and nontrawled areas.
• lost eelgrass sequestration of carbon (g C m-2 year-1).
Question 4: What is the potential future effect of a trawling ban on eelgrass carbon stocks?
Approach: As for Q3 but extrapolating to 2030 and 2050 by assuming that:
• eelgrass does currently not grow within the zones where trawling occurs and that, after a ban, eelgrass will potentially recolonise the newly trawling-free zone within the area where eelgrass habitat conditions are fulfilled.
• in the absence of trawling, Danish eelgrass meadows fulfil the WFD requirement of “good ecological status”, i.e., the water quality standards allow eelgrass to grow as deep as required in relation to the WFD by 2027. It should be no/ted, however, that the Danish “strategy” is to meet the maximum allowable nutrient input requirement set by the WFD by 2027, not to achieve the biological/ecological status by that year. Hence, the recovery time of eelgrass is not included in the Danish strategy, and since it is well-known that recovery can be slow (Krause-Jensen et al. 2020), eelgrass is unlikely to fulfil the WFD by 2027. Our scenario of good ecological status for eelgrass by 2027 is, therefore, solely meant for illustration purposes.
• an immediate effect of a trawling ban, i.e., that eelgrass would recover promptly and, hence, be distributed to full capacity by 2027. As mentioned above, our estimate thus ignores that eelgrass recovery can be slow and is difficult to predict even without considering potential effects of climate change on recovery (Krause-Jensen et al. 2020; Timmerman et al. 2021).
• restored eelgrass meadows will gradually build up C-stocks compared to those in existing eelgrass areas. Hence, if starting in 2027, the recovered meadows would have sequestered carbon for 3 and 23 years, respectively, by 2030 and 2050. The effect on eelgrass-associated C-stocks will also be supported by comparing C- stocks in currently trawled and non-trawled areas.
The briefing summarises the key methodologies and findings under each of the four research questions. For further details, we refer to associated manuscripts that are currently under preparation for submission to peer-reviewed international journals (Leiva-Dueñas et al. in prep.; Holbach et al. in prep).
We finally present a case-study on the development of eelgrass meadows following a trawling ban in a specific area (Nibe Broad, Limfjorden) to supplement the modelling of trawling effects.
2
What is the size of carbon stocks in Danish eelgrass meadows within protected areas and at different distances from land?
2.1 Method
To answer this question, we developed two independent spatial models on the sediment C-stock:
• One model was based on sediment core data collected within eelgrass meadows (eelgrass C-stock model).
• The other model was based on surface sediment samples collected from soft coastal sediments (coastal C-stock model) and primarily represented samples collected outside of eelgrass meadows; a few samples collected inside the meadows are included as well.
Response variables: sediment C-stock data
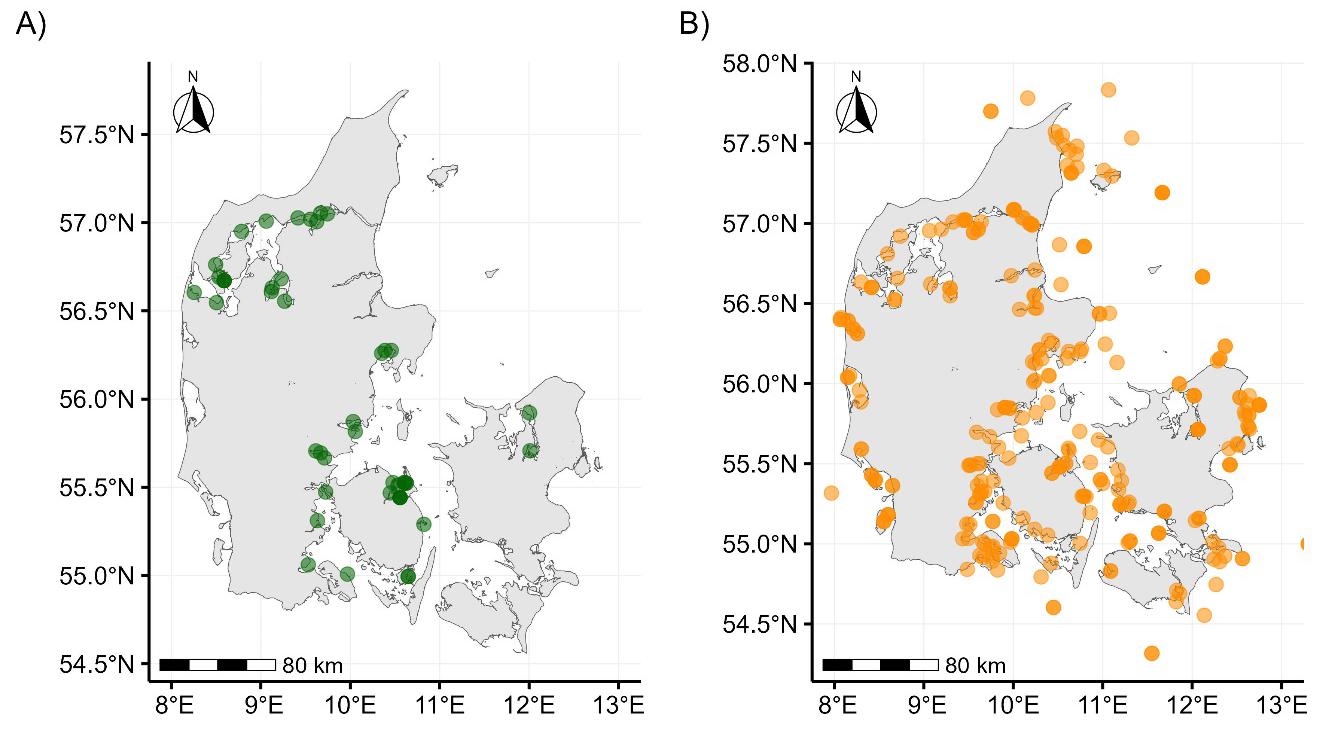
The eelgrass C-stock model compiled previously published data on sediment C-stocks over the top 10 cm (g C m-2) from 48 vegetated eelgrass meadows distributed across Denmark (Kindeberg et al. 2018; Leiva-Dueñas et al., 2023) (Figure 2.1A). Information on sample collection, laboratory analyses and calculations of C-stocks can be found in Kindeberg et al. (2018) and Leiva-Dueñas et al. (2023).
Additionally, the coastal C-stock model used data from 274 sediment core samples over the top 10 cm collected and geochemically analysed as part of the Danish national marine monitoring program (Figure 2.1B).
It should be noted that the comparison of C-stocks do not consider that sediment accumulation rates and, hence, C-accumulation rates differ between areas, both between eelgrass and non-eelgrass areas and within each of those area types. Differences in C-accumulation rates imply that the 10 cm C-stocks can represent very different time periods. However, comparable data sets on C-accumulation in eelgrass vs. non-eelgrass areas are not available. Information on differences in the lability of the organic material, which affects the turnover of the C-stocks and provides insight into their vulnerability, was also not available.
Spatial predictor layers
The eelgrass C-stock model considered several potential drivers of eelgrass production and, subsequently, C-accumulation and storage: seawater temperature (at the seafloor, 95th percentile), salinity (at the seafloor, 5th percentile), dissolved oxygen (5th percentile), light availability at the sea floor, light attenuation coefficient, chlorophyll-a content, indices of physical exposure (bottom shear stress (95th percentile) and wave exposure indexes, water depth, distance to the coast, and sediment type. All data layers were brought to a common projection and cut to the same extent, which was delimited by potential distribution areas with at least 10% of eelgrass cover (Staehr et al. 2019; Timmermann et al. 2021).
The coastal C-stock model considered the following environmental factors as potential predictors of C stocks in soft coastal sediments: sediment type, topographic position index (TPI), bottom slope, water depth, distance to the main coastline, relative exposure index, average chlorophyll concentration and salinity.
As a compromise between the different original spatial resolutions of the covariates, a spatial resolution of 100 m and 500 m was selected for the eelgrass C-stock model and the coastal C-stock model, respectively
Statistical analyses and spatial prediction
We used Generalized Additive Models (GAMs) to model the relationship between spatially explicit and uncorrelated environmental factors and the spatial distribution of sediment C-stocks. GAMs can identify non-linear relationships between response and predictor variables as well as non-Gaussian error distributions. The best-performing GAMs were used to predict C-stocks within the top 10 cm in both eelgrass meadows and soft coastal sediments. Specific details about the GAM fitting, their generation, selection, and validation can be found in Leiva- Dueñas et al. (in prep.) and Holbach et al. (in prep.).
Ensemble prediction and calculation of total C-stocks
From the output of the two independent GAM models, we calculated a weighted average ensemble model. The models were weighted based on their prediction accuracy of measured C-stocks as calculated with the RMSE metric.
The ensemble model for sediment C-stocks was laid over a potential distribution map of eelgrass (Timmermann et al. 2021) and a map of Natura 2000 areas. The total C-stocks (Gg 1 C) present in the top 10 cm of sediment were estimated within and outside the area of eelgrass with a spatial cover greater than 10% (Timmerman et al. 2021) as well as in Nature 2000-protected eelgrass meadows and at different distances from land (0-3, 3-6 and 6-12 nautical miles areas). The total eelgrass C- stocks were calculated by multiplying the pixel Cstock value by the area of the pixel covered by eelgrass (e.g. pixels with 10% eelgrass cover were multiplied by 0.1) and adding up the resulting C-mass within each relevant area. An uncertainty range of the total predicted sediment C-stocks was calculated based on sums of lower and upper C-stocks boundaries for each pixel (exp(predicted value ± 2*standard-error), predicted values and standard-errors at log-scale).
2.2 Results
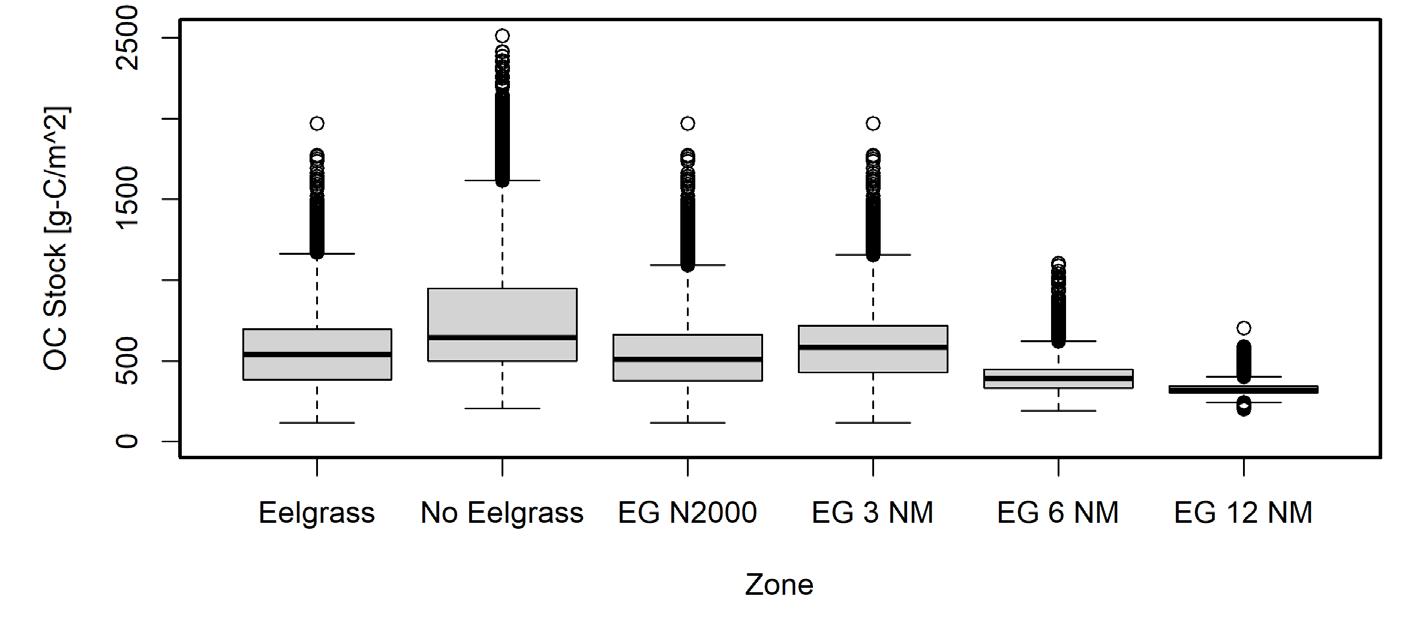
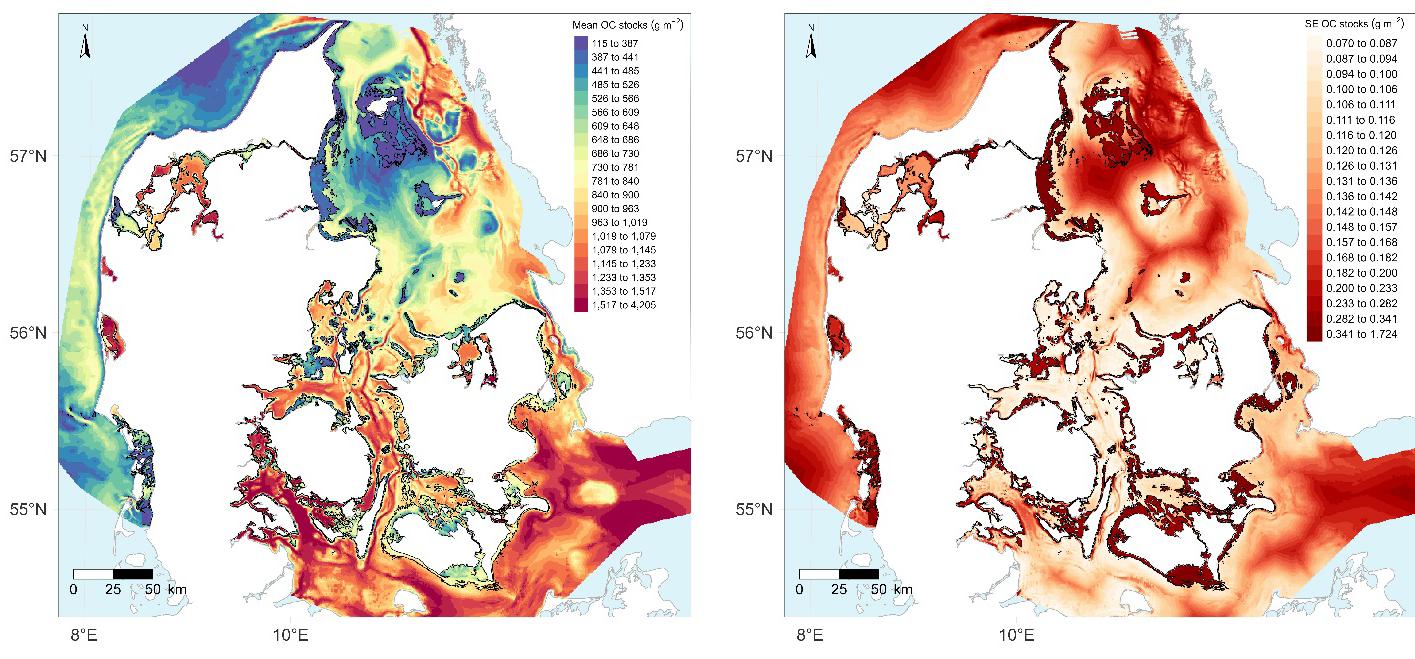
The ensemble outputs from the two C-stock GAMs are shown in Figure 2.2 and were used to estimate the sediment C-stocks within potential areas of eelgrass meadows. The mean C-stocks within the current potential extent of eelgrass meadows were 555 ± 203 g C m-2 (range 118-1970 g C m-2), while outside the potential eelgrass meadows the C-stocks averaged 740 ± 297 g C m-2 (range 207–2510 g C m-2) (Figure 2 .3). The northeast coast of Jutland and nearby islands in the Kattegat area had the lowest per square meter stocks, while the highest were found in inner, sheltered areas of the fjords as well as along the southern coasts of the Islands of Funen and Zealand (Figure 2.2 left). The spatial variation of the ensembled model errors associated with the predicted Cstocks shows larger standard errors along the coast for the eelgrass distribution because the eelgrass C-stock model had larger error due to the lower training data used in this model (Figure 2.2 right).
The similar C-stock values found between eelgrass and non-eelgrass areas is surprising, but in accordance with recent results by Leiva-Dueñas et al. (2023), who reported no significant differences in measured C-stocks between eelgrass meadows and nearby unvegetated sediments in four study sites of Denmark. This may in part be due to the decline of eelgrass meadows over the last decades, which can imply that sites that are currently bare could have been vegetated in the (recent) past. If physically undisturbed, some sediment layers at these bare sites may contain part of the C-stocks that were associated to past meadows (Leiva-Dueñas et al. 2023).
The total sediment C-stocks (top 10 cm) within the potential distribution area of eelgrass meadows across Denmark is 1210 (660-2380) Gg C. To give an impression of the size of the stocks, they are equivalent to 9.2 to 33.3% of Danish annual emissions emitted in 2020 (26.2 million metric tons of CO2-eq, production-based emissions (Friedlingstein et al. 2021). Within potential eelgrass meadows located in Nature 2000-protected zones the total sediment C-stock amounts to 934 (502-1870) Gg C, for those located within 0 to 3 nm from the coast it amounts to 1130 (617-2220) Gg C, within 3 to 6 nm to 52.5 (27.0-113) Gg C and within 6 to 12 nm to 15.3 (8.05-32.1) Gg C
1 Gg = Giga g = 109 g values are weighted averages of the predicted C-stocks from the two spatial GAMs used in this briefing. Right map) Spatial distribution of the combined weighted standard errors at logscale around the predictions of the two GAMs. In both maps, the outer boundary of the potential eelgrass area is indicated by a black continuous line. The potential eelgrass area is predicted by a habitat suitability model for current water conditions supporting at least 10% eelgrass cover (Staehr et al. 2019; Timmermann et al. 2021). of modelled organic carbon (OC)-stocks (ensemble) in the 6 assessment zones: (1) ≥ 10% eelgrass cover (Staehr et al. 2019; Timmermann et al. 2021), (2) < 10% eelgrass cover, (3) ≥ 10% eelgrass (EG) cover in Nature 2000 areas, (4) within 3 NM, (5) 3-6 NM, and (6) 6-12 NM from the coast.
Figure 2.3.
What is the direct effect of trawling on the eelgrass extent?
3.1 Method
To answer this question, we used the high-resolution trawling data covering only part of the study area and the low-resolution trawling data covering almost all the relevant eelgrass area. It should be noted that we sometimes apply the term “trawling data” for the sake of simplicity although the dataset is termed “fisheries with bottom-contacting gear”.
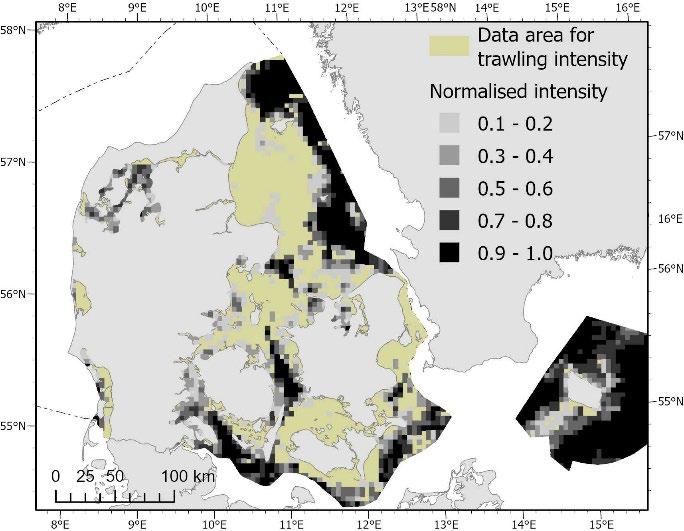
The high-resolution trawling data cover the years 2014-2018 for the coastal waterbodies and 2013–2018 for the Natura 2000 areas. The Natura 2000 areas have been updated since the production of the fisheries data. For the analysis, we use the extent of the Natura 2000 areas that are currently in force. We checked for agreement between the two datasets by comparing the number of presence-absence cells when aggregating onto a 4x4 km raster. In general, there was good agreement with slightly higher presence values for the dataset with longer time coverage. Consequently, those two datasets were combined and provide presence-absence information with a 100 m*100 m resolution (Figure 3.1, left). For the low resolution HELCOM trawling data, we found temporally quite stable distributions of trawling intensity across the study area (available years 2009-2016) as indicated by decreasing relative deviations with increasing trawling intensity, which justifies averaging over the years. The average low-resolution HELCOM data were combined with high-resolution data on the closed fjords at the west coast and the Wadden Sea to cover the relevant area for eelgrass distribution in Denmark. Therefore, we checked for correlation between both intensities after aggregation on a 4x4 km raster. We found a significant linear relationship between both datasets and integrated them by linear regression and scaling of intensities to a range between 0 and 1 (Figure 3.1, right).
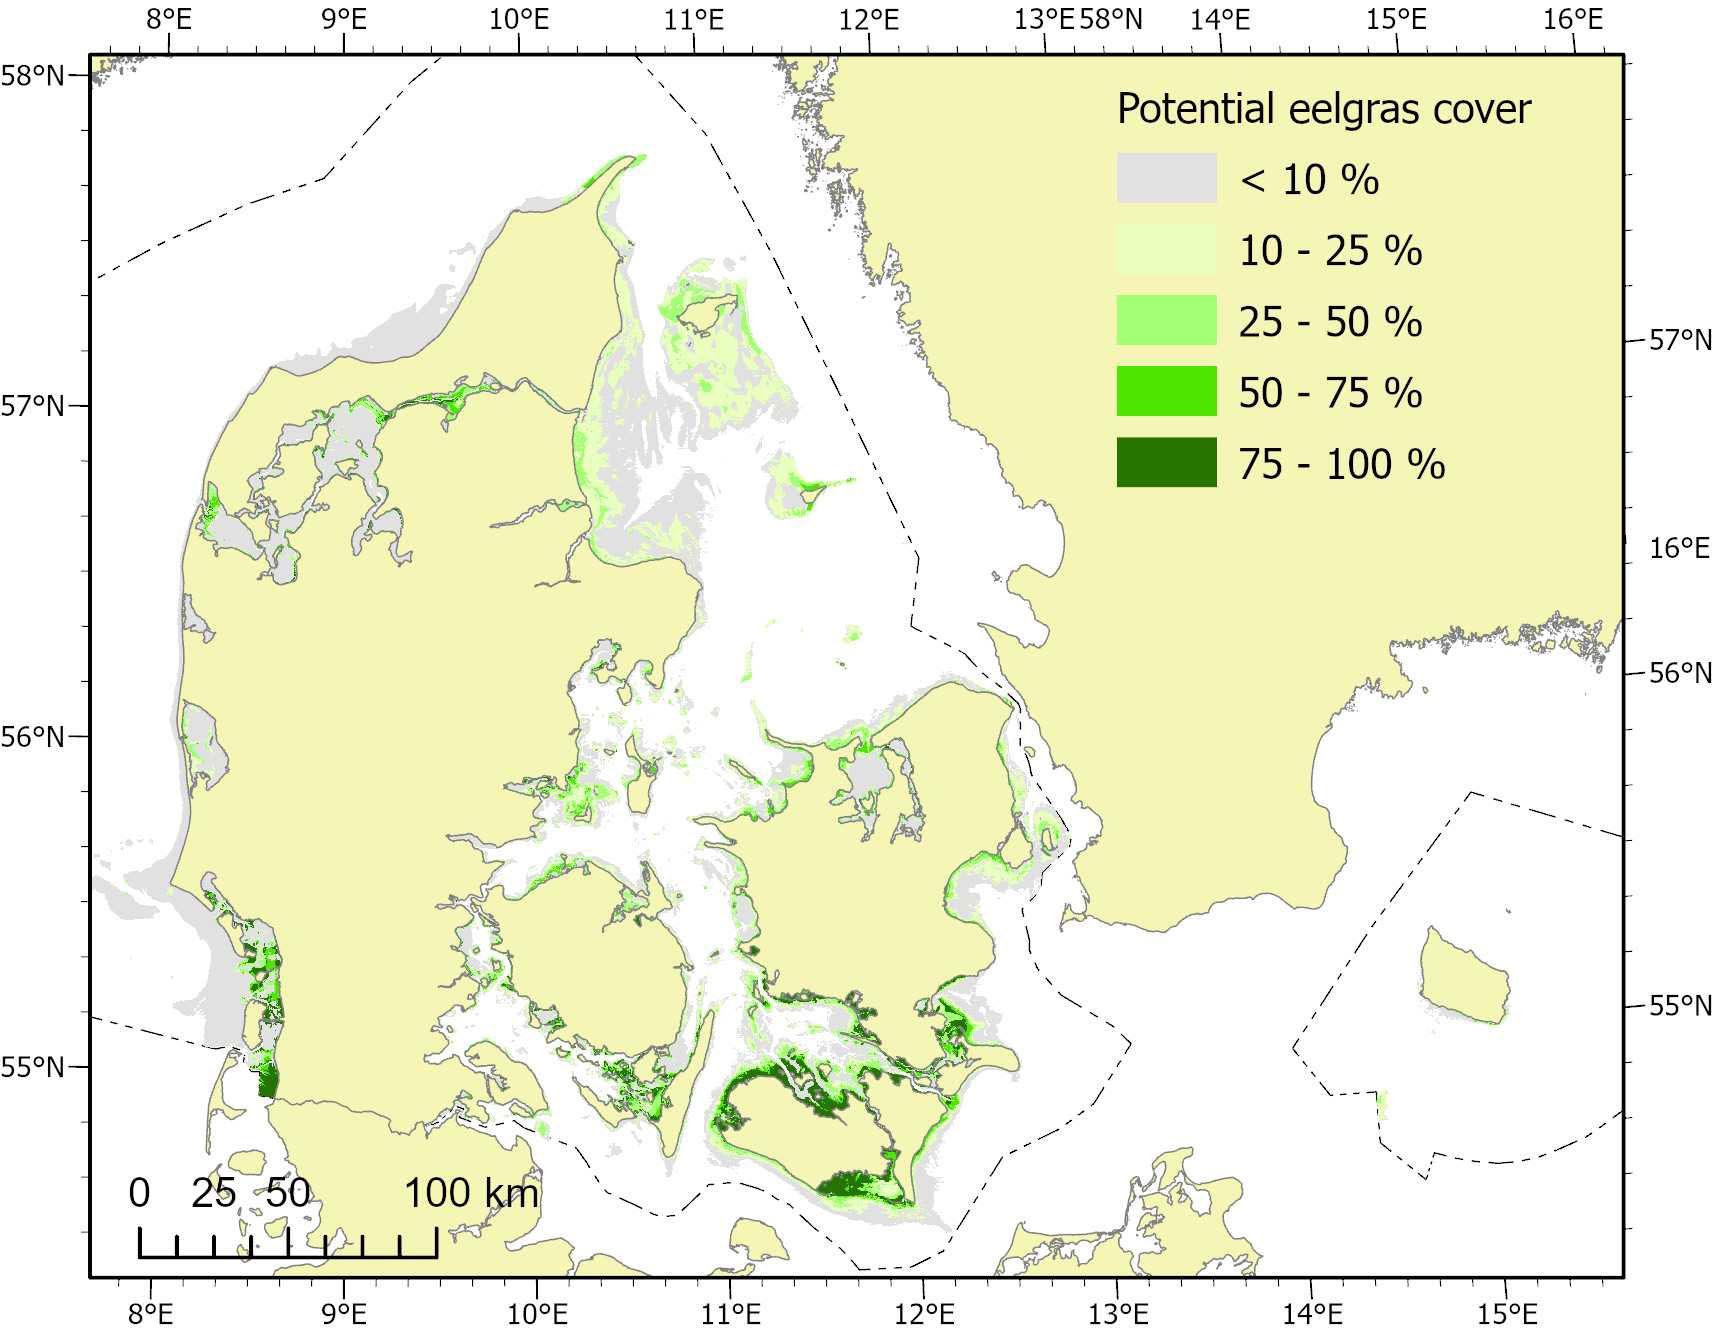
The potential eelgrass cover was predicted and mapped using the eelgrass habitat suitability model developed by Stæhr et al. (2019) and Timmermann et al. (2021) (Figure 3.2).
To evaluate how much of the eelgrass cover was impacted by trawling, we assumed that a single trawling activity disturbs the eelgrass and, hence, that the overlap between the model and the trawling activity shows the direct impact of trawling on eelgrass:
The trawling intensity was recorded either as a binary value with 1 indicating the presence of trawling and 0 its absence, or as a normalized intensity value ranging from 0 to 1. The potential eelgrass cover was expressed as a ratio between 0 and 1, where 0 represents no eelgrass cover and 1 represents complete cover of the pixel area
3.2 Results
Since only the low-resolution trawling data cover the area relevant for eelgrass completely, we checked how well the data predict the impact on eelgrass in comparison to the high-resolution data within the waterbodies. At the same time, we analysed how the trawling impact differed among the ecological status classes for the quality element angiosperms (sensu WFD) of the coastal waterbodies.
We specifically calculated an impact ratio of trawling per waterbody: trawling impact within the waterbody divided by the average potential eelgrass cover within the same waterbody. Based on the high-resolution data, the waterbodies in high and good ecological status are subject to lower trawling impact than those with moderate, poor and unknown status or where the depth limit for eelgrass is not relevant. The trawling impact ratio for waterbodies in bad status is, however, low. The pattern was very similar when using the low-resolution data although the impact of trawling overall showed higher values than with the high-resolution data (Figure 3.3). The total impact of trawling by large (>12 m) Danish vessels on eelgrass within the coastal waterbodies is 6.9% as calculated from the low-resolution data, and 4.9% as calculated from high-resolution data.
Area affected per distance zone (3, 6, 12 nautical miles)
Only the low-resolution fisheries data cover the distance zones completely. For this analysis, the low-resolution data overlapping with the HELCOM area (extended with the fjords at the west coast and the Wadden Sea) are selected. The impact of fisheries with bottom contact is, as expected, highest in the 3 nm zone where most of the eelgrass is located. In this zone, 254,709 ha, which represents 6.6% of the total eelgrass area, is affected. The impact of trawling on eelgrass in other zones ranges from 0.4% in the 3-6 nm-zone to 0.1 % in the two most distant zones (6-12 nm and beyond 12 nm). Overall, fisheries by large (>12 m) Danish vessels with bottom contact affect 39.8% of the total
Impact of fisheries with bottom contact inside selected MPAs
For this analysis, the MPAs overlapping with the HELCOM area (extended with the fjords at the west coast and the Wadden Sea) were selected. The fisheries high-resolution data do not cover the full extent of the Natura 2000 areas
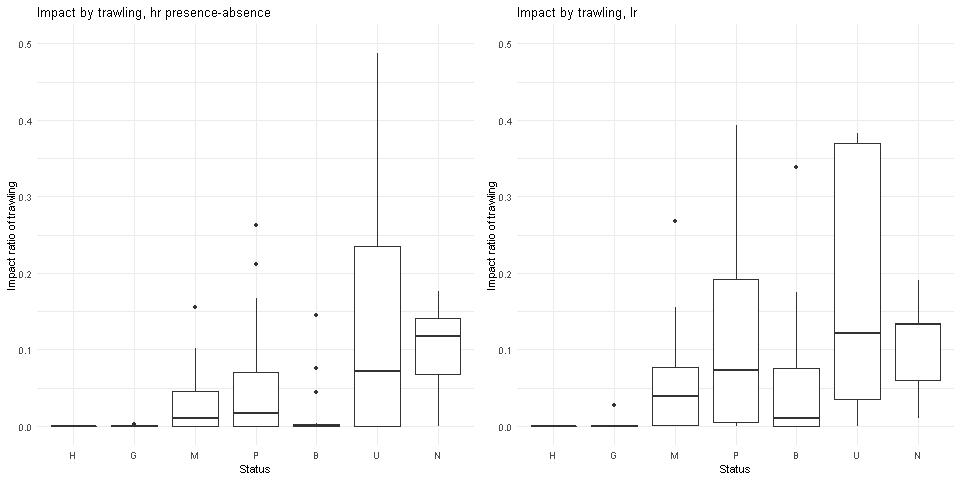
Table currently in force or the MPAs according to the MSFD completely (Figures 1.1, 3.1). The results show that trawling affects approximately 17.7% and 16.2% of the total area of the selected MPAs, and 6.2% and 5.1% of the eelgrass area, based on the low- and high-resolution trawling data, respectively. The difference in trawling impact between the two data sets is larger for the eelgrass area than for the total MPA area. This is due to the location of fisheries in the respective data sets in relation to the potential eelgrass cover (Table 3.2 ).
Fisheries data
Modelled grass
Sum area of fisheries impact on eelgrass (ha) Trawling effect (% of eelgrass cover) Low resolution 278,495 13,170 211,832 1,576,049 17.7 6.2 High resolution 255,594 10,763 211,832 1,576,049 16.2 5.1


