ANNUAL REVIEW
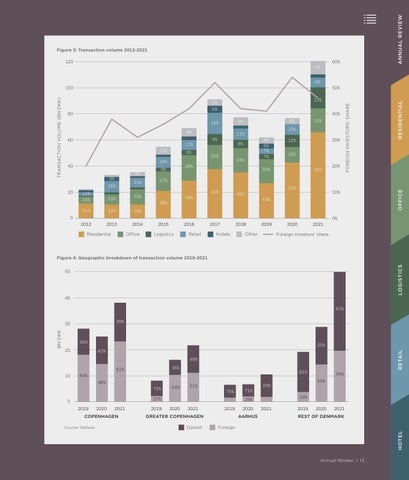
Figure 3: Transaction volume 2012-2021 60%
120 9% 6%
6%
80
40%
9% 60
11% 11% 16% 9%
9%
21%
26% 11% 24%
23%
51%
32%
30%
2012
2013
2014
8% 6% 7% 7%
8%
20%
24%
28%
5%
30%
12% 16%
30%
55%
20%
27% 55%
41%
33%
42%
38%
10%
45% 43%
0
OFFICE
40
20
6%
10%
11% 9%
15%
6%
8%
18%
FOREIGN INVESTORS' SHARE
TRANSACTION VOLUME (BN DKK)
13%
5%
RESIDENTIAL
50%
100
0% Residential
Office
2015
2016
Logistics
Retail
2017
2018
Hotels
2019
Other
2020
2021
Foreign investors’ share
LOGISTICS
Figure 4: Geographic breakdown of transaction volume 2019-2021 50
40 61% 39%
36% 20
50%
RETAIL
42% 49% 36%
61% 10
81%
64% 48% 73%
64%
51% 75%
27%
0 2019
2020
2021
COPENHAGEN Source: ReData
2019
71%
83% 19%
29% 2020
2021
2019
GREATER COPENHAGEN Danish
2020 AARHUS
39% 50%
2021
2019
2020
2021
REST OF DENMARK
Foreign
HOTEL
BN DKK
30
Annual Review | 13