MARKET DATA
VM | Monday, September 22, 2014 | Issue 011
VM1
TRADING UPDATE Declined Unchanged Advanced
SECTOR PRICE CHANGES - SEPTEMBER 15-19, 2014
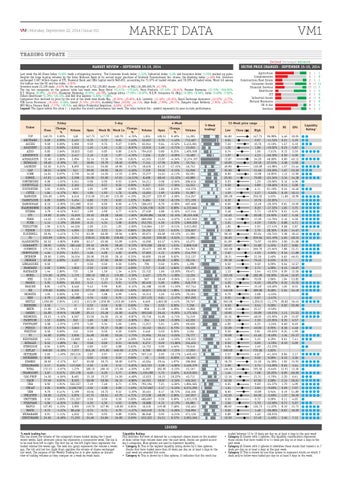
MARKET REVIEW – SEPTEMBER 15-19, 2014 Last week the All-Share Index ↑0.93% made a whispering recovery. The Consumer Goods index ↑1.23%, Industrial index ↑4.8% and Insurance index ↑1.05% marked up gains. Despite the huge buying volumes by the Qatar National Bank in its second major purchase of Ecobank Transnational Inc. shares, the Banking index ↓1.26% fell. Investors exchanged 2.667 billion shares of ETI, Diamond Bank and UBA Capital worth N48.692, accounting for 71.07% of traded volume, and 78.39% of traded value. Worst hit among the indices was the Oil and Gas index ↓4.81%. Investors made 22,109 deals ↓6.63% for the exchange of 3,752,130,802 shares ↓23.16% at N62,116,289,400.76 ↓41.78%. The top ten companies on the gainers’ table last week were Ikeja Hotel ↑51.41%: ↑175.64%, Vono Products ↑37.14%: ↓24.61%, Premier Breweries ↑21.33%: ↑564.94%, R.T. Briscoe ↑8.99%: ↓34.01%, Champion Breweries ↑8.56%: ↓46.78%, Lafarge Africa ↑7.59%: ↑10.87%, N.E.M. Insurance Co (Nig.) ↑6.58%: ↑8.00%, Cutix ↑5.49%: ↑7.87%, Fidson Healthcare ↑5.39%: ↑26.15%, and Red Star Express ↑4.38%: ↑7.86%. Companies that declined in price by the end of the week were Roads Nig. ↓25.65%: ↓25.65%, A.G. Leventis ↓13.16%: ↓22.35%, Royal Exchange Assurance ↓12.07%: ↓3.77%, FTN Cocoa Processors ↓10.53%: ↑2.00%, Conoil ↓9.73%: ↓29.35%, Academy Press ↓9.03%: ↓44.71%, Skye Bank ↓7.99%: ↓39.77%, Dangote Sugar Refinery ↓7.95%: ↓30.77%, NPF Micro Finance Bank ↓7.77%: ↑18.75%, and Africa Prudential Registrars ↓6.06%: ↓6.63%. Legend: The figure before the colon ( : ) signifies the stock’s performance last week. The value behind the : symbol represents its year-to-date performance.
Agriculture Conglomerates Construction/Real Estate Consumer Goods Financial Services Healthcare ICT Industrial Goods Natural Resources Oil & Gas Services
3 2 2 8 17 1 2 4 0 8 9
1 3 6 12 33 5 9 11 5 2 6
1 0 1 11 7 4 0 6 0 1 3
DASHBOARD Friday Ticker
Close
7UP 140.70 ABCTRANS 0.69 ACCESS 9.59 AGLEVENT 1.32 AIICO 0.85 AIRSERVICE 2.00 ASHAKACEM 32.40 BETAGLAS 18.40 CADBURY 52.50 CAP 38.21 CCNN 14.01 CONOIL 47.01 CONTINSURE 0.96 COURTVILLE 0.53 CUSTODYINS 3.95 CUTIX 1.84 DANGCEM 224.00 DANGFLOUR 6.89 DANGSUGAR 8.10 DIAMONDBNK 6.20 ETERNA 3.79 ETI 19.00 FBNH 14.22 FCMB 4.14 FIDELITYBK 1.96 FIDSON 3.53 FLOURMILL 59.94 FO 223.99 GLAXOSMITH 62.52 GUARANTY 28.95 GUINNESS 175.50 HONYFLOUR 4.04 INTBREW 29.00 JBERGER 67.00 LINKASSURE 0.50 MANSARD 2.60 MAYBAKER 1.44 MOBIL 174.00 MRS 53.20 NAHCO 5.05 NASCON 8.85 NB 179.00 NEIMETH 1.05 NEM 0.79 NESTLE 1,050.00 NIGERINS 0.50 NNFM 21.90 OANDO 24.00 OKOMUOIL 33.21 PAINTCOM 1.52 PORTPAINT 5.08 PRESCO 39.37 PRESTIGE 0.50 PZ 34.00 REDSTAREX 4.53 ROYALEX 0.52 RTBRISCOE 0.94 SEPLAT 640.00 SKYEBANK 2.65 SOVRENINS 0.50 STANBIC 30.02 STERLNBANK 2.17 TOTAL 172.53 TRANSCORP 5.87 UAC-PROP 14.50 UACN 57.49 UBA 6.92 UBCAP 2.05 UBN 9.70 UNILEVER 50.00 UNITYBNK 0.50 VITAFOAM 4.06 WAPCO 127.90 WAPIC 0.72 WEMABANK 0.91 ZENITHBANK 24.65
Change, % 0.00% 2.99% 0.00% 0.00% 3.66% 1.52% 2.86% -2.39% 0.21% -4.36% 0.07% -4.84% -1.03% -3.64% 0.00% -4.17% 1.90% 0.00% -2.99% -0.48% -0.52% 0.16% -1.25% -1.19% 0.51% 4.75% -1.41% 1.81% -3.80% 1.65% -0.78% 0.25% 2.58% 4.69% 1.96% 2.86% -0.29% 5.26% 0.00% -1.67% 0.28% 0.00% -3.66% 2.85% 4.78% -0.91% -3.12% 0.00% -3.97% 0.97% 0.00% 2.29% 2.95% -1.89% 0.00% -5.18% -1.49% -2.37% 0.46% -3.07% 0.51% -4.04% 0.97% 1.91% 0.00% 0.41% -1.21% 0.00% -4.25% 3.15% -1.37% 1.11% -0.48%
5-day Change, Volume Open Week Hi Week Lo % 148 147.73 147.73 140.70 -4.76% 2,421 0.70 0.72 0.65 -1.43% 5,960 9.59 9.75 9.27 0.00% 2,912 1.45 1.45 1.32 -8.97% 18,825 0.83 0.85 0.80 2.41% 2,417 2.10 2.10 1.97 -4.76% 2,094 32.14 33.30 31.50 0.81% 55 18.85 19.79 18.40 -2.39% 8,695 52.41 55.00 49.90 0.17% 541 39.95 39.95 38.21 -4.36% 3,720 14.50 14.50 13.55 -3.38% 2,598 55.00 55.00 47.01 -14.53% 5,541 0.98 0.99 0.93 -2.04% 2,363 0.53 0.57 0.52 0.00% 3,595 3.95 3.99 3.88 0.00% 901 1.90 1.92 1.76 -3.16% 6,616 215.00 231.00 215.00 4.19% 5,454 6.80 7.25 6.63 1.32% 151,069 8.50 8.90 8.00 -4.71% 104,299 6.30 6.52 6.15 -1.59% 9,017 3.99 3.99 3.77 -5.01% 15,019 19.32 20.28 18.62 -1.66% 265,185 14.52 14.64 14.20 -2.07% 28,949 4.15 4.34 3.98 -0.24% 44,326 2.00 2.01 1.95 -2.00% 4,094 3.50 3.53 3.24 0.86% 3,713 63.00 66.00 59.94 -4.86% 2,251 230.01 236.00 218.00 -2.62% 9,806 63.17 65.00 61.09 -1.03% 382,440 29.16 29.95 28.20 -0.72% 5,113 170.00 176.90 170.00 3.24% 6,031 4.06 4.08 4.00 -0.49% 16,554 28.90 29.00 28.10 0.35% 3,437 61.01 67.00 60.92 9.82% 0 0.50 0.50 0.50 0.00% 1,652 2.50 2.60 2.50 4.00% 735 1.38 1.50 1.34 4.35% 1,175 180.10 180.11 174.00 -3.39% 10 50.54 53.20 50.54 5.26% 24,353 5.11 5.21 5.01 -1.17% 6,446 9.43 9.90 8.85 -6.15% 8,335 177.19 180.00 174.50 1.02% 4,702 1.03 1.08 0.99 1.94% 105,885 0.76 0.82 0.75 3.95% 1,012 1,013.00 1,050.00 1,010.00 3.65% 0 0.50 0.50 0.50 0.00% 10 20.91 23.08 20.90 4.73% 18,589 25.11 25.48 24.00 -4.42% 6,567 33.50 34.50 33.16 -0.87% 262 1.60 1.68 1.52 -5.00% 1,979 5.00 5.34 5.00 1.60% 3,843 37.00 39.37 35.80 6.41% 112 0.50 0.50 0.50 0.00% 2,836 34.60 35.00 33.24 -1.73% 13,060 4.34 4.63 4.19 4.38% 84 0.58 0.60 0.51 -10.34% 2,529 0.89 0.97 0.88 5.62% 7,077 655.26 675.00 640.00 -2.33% 263,516 2.87 2.97 2.57 -7.67% 0 0.50 0.50 0.50 0.00% 617 30.00 30.75 30.00 0.07% 117,049 2.30 2.30 2.15 -5.65% 1,276 180.10 180.10 171.00 -4.20% 237,178 6.05 6.29 5.77 -2.98% 8,481 15.18 15.37 14.50 -4.48% 8,503 58.00 59.90 56.15 -0.88% 556,557 7.19 7.40 6.71 -3.76% 2,528,752 2.02 2.08 2.00 1.49% 5,199 10.04 10.75 9.52 -3.39% 5,876 47.75 50.61 47.75 4.71% 151,357 0.50 0.50 0.50 0.00% 1,363 4.30 4.30 4.03 -5.58% 3,905 119.70 127.90 118.00 6.85% 86,436 0.73 0.74 0.70 -1.37% 4,032 0.91 0.95 0.89 0.00% 71,293 24.60 24.84 24.00 0.20%
4-Week Change, Volume Open Volume % 1,024 128.51 9.49% 14,205 53,657 0.70 -1.43% 712,487 63,941 9.64 -0.52% 5,415,061 12,015 1.40 -5.71% 23,045 794,610 0.80 6.25% 1,495,508 7,226 2.20 -9.09% 15,489 41,501 33.87 -4.34% 13,274,197 7,114 17.96 2.45% 32,744 18,635 63.37 -17.15% 46,752 7,339 39.05 -2.15% 24,938 15,277 14.61 -4.11% 82,591 8,498 68.45 -31.32% 42,889 54,211 0.98 -2.04% 286,616 9,247 0.57 -7.02% 54,553 31,921 3.86 2.33% 133,370 13,601 1.90 -3.16% 31,987 28,227 229.97 -2.60% 214,267 9,684 7.50 -8.13% 371,199 188,453 8.70 -6.90% 487,468 3,324,736 6.20 0.00% 4,172,644 27,550 3.88 -2.32% 537,316 20,592,094 16.50 15.15% 39,253,508 688,958 14.61 -2.67% 2,267,922 252,701 4.30 -3.72% 1,069,209 314,864 1.97 -0.51% 3,013,892 26,352 3.33 6.01% 226,607 20,671 66.69 -10.12% 41,306 18,233 230.00 -2.61% 71,696 15,050 63.57 -1.65% 45,275 879,258 28.52 1.51% 2,800,518 20,477 189.90 -7.58% 54,763 57,803 4.15 -2.65% 214,759 50,895 26.60 9.02% 212,137 8,463 65.00 3.08% 28,116 796 0.50 0.00% 1,398 7,717 2.48 4.84% 225,239 23,722 1.60 -10.00% 99,471 2,427 175.75 -1.00% 12,236 567 58.49 -9.04% 12,116 82,410 5.00 1.00% 240,759 24,188 10.00 -11.50% 157,744 50,871 175.52 1.98% 336,320 10,313 1.20 -12.50% 70,103 227,172 0.81 -2.47% 857,290 6,649 1,065.00 -1.41% 20,747 724 0.50 0.00% 7,358 958 21.00 4.29% 15,858 260,540 26.45 -9.26% 1,175,564 23,716 34.85 -4.71% 74,219 264 1.60 -5.00% 42,226 11,017 5.01 1.40% 69,636 10,142 36.21 8.73% 36,528 2,446 0.50 0.00% 3,504 21,954 35.14 -3.24% 70,777 74,640 4.60 -1.52% 178,332 6,273 0.59 -11.86% 154,455 14,753 0.90 4.44% 70,616 8,780 690.00 -7.25% 17,059 507,110 2.95 -10.17% 1,449,431 10 0.50 0.00% 16,320 45,054 29.44 1.97% 196,060 243,721 2.28 -4.82% 2,426,379 4,387 182.05 -5.23% 22,167 1,159,289 5.72 2.62% 6,519,045 12,023 16.15 -10.22% 42,711 44,501 58.87 -2.34% 424,342 793,194 7.21 -4.02% 1,894,565 2,747,867 2.17 -5.53% 6,274,296 30,461 8.17 18.73% 246,166 27,538 48.99 2.06% 167,057 486,607 0.50 0.00% 1,031,578 18,888 4.15 -2.17% 65,885 16,535 119.00 7.48% 132,463 240,519 0.76 -5.26% 746,994 86,948 0.95 -4.21% 371,120 633,322 24.51 0.57% 2,081,346
5-Week trading1
52-Week price range Low 64.80 0.65 7.22 1.25 0.74 1.97 13.87 10.69 49.90 35.96 8.00 25.92 0.93 0.50 1.30 1.59 185.00 6.32 8.00 5.86 2.48 12.40 11.50 3.01 1.85 1.80 58.10 36.30 61.09 22.67 162.00 2.62 18.31 59.18 0.50 1.95 1.33 103.00 32.53 4.56 8.85 140.00 0.79 0.55 945.00 0.50 18.00 10.00 32.15 1.33 4.00 32.00 0.50 30.08 4.01 0.50 0.84 590.00 2.57 0.50 18.70 2.09 146.26 1.44 12.16 42.58 6.65 1.24 8.00 42.50 0.50 3.66 88.92 0.66 0.89 19.50
Close ( )
High
YtD
147.73 96.98% 0.97 -11.74% 10.70 -0.10% 1.86 -19.02% 1.00 -7.61% 4.23 -40.30% 34.20 48.08% 22.10 27.51% 110.00 -45.98% 51.66 -20.36% 15.98 16.85% 79.80 -23.34% 1.29 -20.00% 0.89 -18.46% 4.11 81.19% 2.27 -5.64% 250.02 3.63% 10.76 -32.65% 12.49 -28.32% 8.20 -17.33% 5.73 -19.87% 20.28 15.92% 17.29 -12.76% 4.59 7.81% 2.95 -27.41% 3.70 28.36% 83.64 -26.74% 259.94 141.19% 74.97 -10.69% 31.80 4.32% 266.70 -25.64% 4.50 4.94% 31.50 2.40% 76.45 6.23% 0.50 0.00% 2.73 4.00% 2.64 -43.53% 182.00 50.00% 70.00 2.86% 6.46 -20.47% 15.10 -40.40% 189.00 8.48% 2.08 -4.55% 0.97 -2.47% 1,250.01 -11.17% 0.54 0.00% 25.57 -0.50% 36.89 -10.21% 48.05 -25.92% 2.30 -22.05% 6.25 -3.24% 49.00 0.95% 0.81 -20.63% 41.46 -8.10% 5.35 6.59% 0.69 -3.70% 1.49 -33.33% 735.00 5.82% 4.67 -41.24% 0.50 0.00% 31.50 34.38% 2.74 -13.20% 195.50 -0.44% 7.08 35.25% 21.31 -5.70% 67.85 2.68% 9.60 -24.37% 3.04 -9.69% 10.89 0.94% 64.00 -5.66% 0.72 0.00% 5.70 -15.59% 136.73 11.22% 1.48 -36.28% 1.40 -28.91% 27.40 -1.40%
PE
EPS
4.46 0.21 1.57 0.23 0.15 0.50 0.80 3.38 1.57 1.67 1.12 3.34 0.16 0.11 0.24 0.19 11.80
30.05 3.19 6.10 5.87 5.59 4.00 40.12 5.58 33.44 23.30 12.90 14.38 6.06 5.00 16.46 10.11 18.99
0.81 1.65 0.61 3.67 2.16 0.88 0.68 0.24 3.38 4.63 3.00 3.27 7.88 0.34 0.63 6.74 0.04 0.15 0.09 10.44 1.04 0.32 1.05 5.24
10.00 3.75 6.25 5.18 6.58 4.71 2.87 14.67 18.43 48.33 21.68 8.86 22.21 11.88 46.01
28.82 0.02
36.43 25.00
1.11 2.29 0.35 0.60 8.38 0.25 1.34 0.61 0.10
21.53 15.07 4.57 8.49 4.48 1.99 25.37 7.41 5.09
0.84 0.15 1.92 0.63 12.91 0.09 2.20 2.14 1.70 0.29 0.19 1.37 0.11 0.71 8.10 0.07
3.17 3.36 15.93 3.44 13.36 66.90 6.61 26.61 4.09 7.07 51.89 36.49 4.65 5.97 15.73 10.29
3.46
7.12
Liquidity Rating2
12.57 16.87 15.56 16.67 53.85 15.55 8.55 34.18
LEGEND 5-week trading bar: This bar shows the volume of the company’s shares traded during the 5 most recent weeks. Each alternate colour bar represents a consecutive week. The bar is to be read from left to right. The first bar on the left (light blue) represents the traded volume five weeks ago. The next bar (grey) represents the volume 4 weeks ago. The 5th and last bar (light blue) signifies the volume of shares exchanged last week. The purpose of the Weekly Trading bar is to give readers an instant view of trading volumes as they compare on a week-by-week basis. 1
Liquidity Rating: This indicates the level of demand for a company’s shares based on the number of deals rather than volume done over the past week. Stocks are graded according 5 categories. Blue spheres are used to represent liquidity. • Category 5: This is the highest liquidity rating shown by 5 blue spheres. Stocks that have traded more than 20 deals per day on at least 4 days in the past week are awarded this score • Category 4: This is shown by 4 blue spheres. It indicates that the stock has 2
traded between 12 to 19 deals per day on at least 4 days in the past week • Category 3: Shown with 3 spheres, this liquidity classification represents those stocks that have traded 8 to 11 deals per day on at least 4 days in the past week • Category 2: Shown with 2 spheres it identifies those stocks that traded 4 to 7 deals per day on at least 4 days in the past week • Category 1: This is shown by one blue sphere to represent stocks on which 3 deals and/or below were traded per day on at least 4 days in the week.