?
Test yourself
23 The magnitudes of two forces are measured to be 120 ± 5 N and 60 ± 3 N. Find the sum and difference of the two magnitudes, giving the uncertainty in each case. 24 The quantity Q depends on the measured values a and b in the following ways: a a Q = , a = 20 ± 1, b = 10 ± 1 b b Q = 2a + 3b, a = 20 ± 2, b = 15 ± 3 c Q = a − 2b, a = 50 ± 1, b = 24 ± 1 d Q = a2, a = 10.0 ± 0.3 a2 e Q = 2 , a = 100 ± 5, b = 20 ± 2 b In each case, find the value of Q and its uncertainty. 2 25 The centripetal force is given by F = mvr . The mass is measured to be 2.8 ± 0.1 kg, the velocity 14 ± 2 m s−1 and the radius 8.0 ± 0.2 m; find the force on the mass, including the uncertainty. 26 The radius r of a circle is measured to be 2.4 cm ± 0.1 cm. Find the uncertainty in: a the area of the circle b the circumference of the circle. 27 The sides of a rectangle are measured as 4.4 ± 0.2 cm and 8.5 ± 0.3 cm. Find the area and perimeter of the rectangle. 28 The length L of a pendulum is increased by 2%. Find the percentage increase in the period T. L T=2 g 29 The volume of a cone of base radius R and 2 height h is given by V = πR3 h. The uncertainty in the radius and in the height is 4%. Find the percentage uncertainty in the volume. 30 In an experiment to measure current and voltage across a device, the following data was collected: (V, I ) = {(0.1, 26), (0.2, 48), (0.3, 65), (0.4, 90)}. The current was measured in mA and the voltage in mV. The uncertainty in the current was ± 4 mA. Plot the current versus the voltage and draw the best-fit line through the points. Suggest whether the current is proportional to the voltage.
20
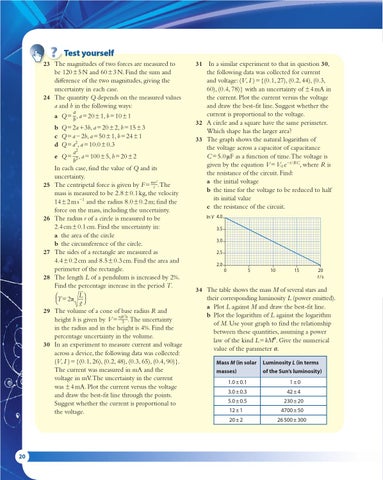
31 In a similar experiment to that in question 30, the following data was collected for current and voltage: (V, I ) = {(0.1, 27), (0.2, 44), (0.3, 60), (0.4, 78)} with an uncertainty of ± 4 mA in the current. Plot the current versus the voltage and draw the best-fit line. Suggest whether the current is proportional to the voltage. 32 A circle and a square have the same perimeter. Which shape has the larger area? 33 The graph shows the natural logarithm of the voltage across a capacitor of capacitance C = 5.0 µ F as a function of time. The voltage is given by the equation V = V0 e−t/RC, where R is the resistance of the circuit. Find: a the initial voltage b the time for the voltage to be reduced to half its initial value c the resistance of the circuit. ln V 4.0 3.5 3.0 2.5 2.0 0
5
10
15
20 t /s
34 The table shows the mass M of several stars and their corresponding luminosity L (power emitted). a Plot L against M and draw the best-fit line. b Plot the logarithm of L against the logarithm of M. Use your graph to find the relationship between these quantities, assuming a power law of the kind L = kM . Give the numerical value of the parameter . Mass M (in solar masses) 1.0 ± 0.1
Luminosity L (in terms of the Sun’s luminosity) 1±0
3.0 ± 0.3
42 ± 4
5.0 ± 0.5
230 ± 20
12 ± 1
4700 ± 50
20 ± 2
26 500 ± 300