Ziqi Cui, Siman Zhang
2023 Spring
Final Thesis in Politecnico di Milano
Faculty: Prof. Alessandra Zanelli, Prof. Salvatore Viscuso
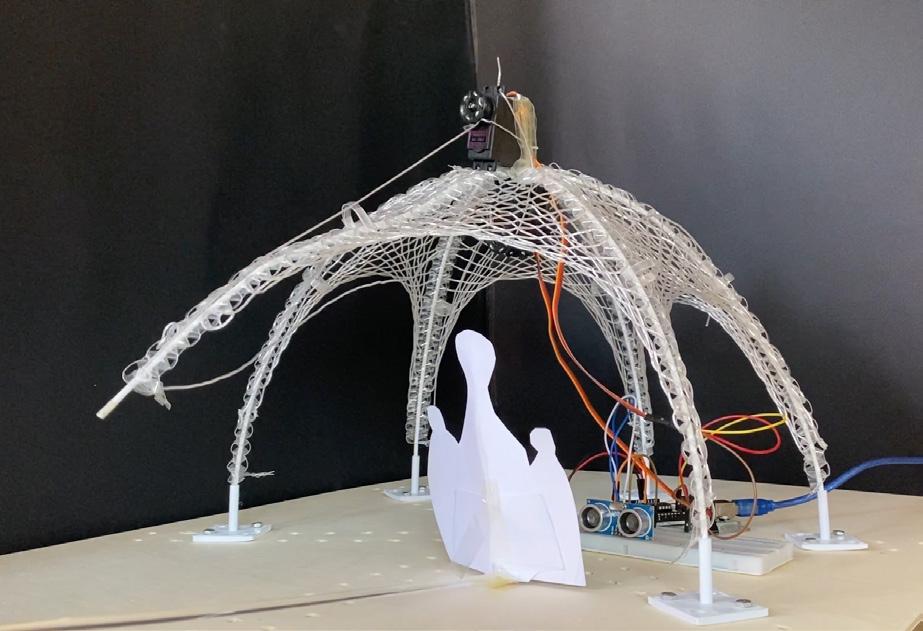
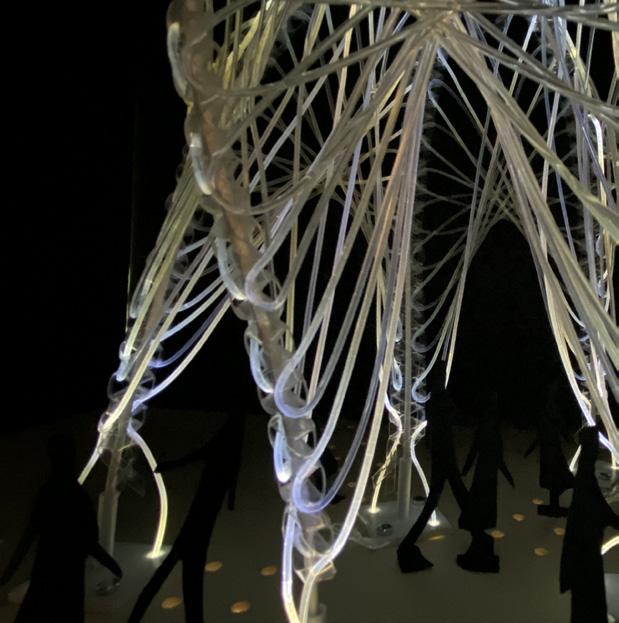
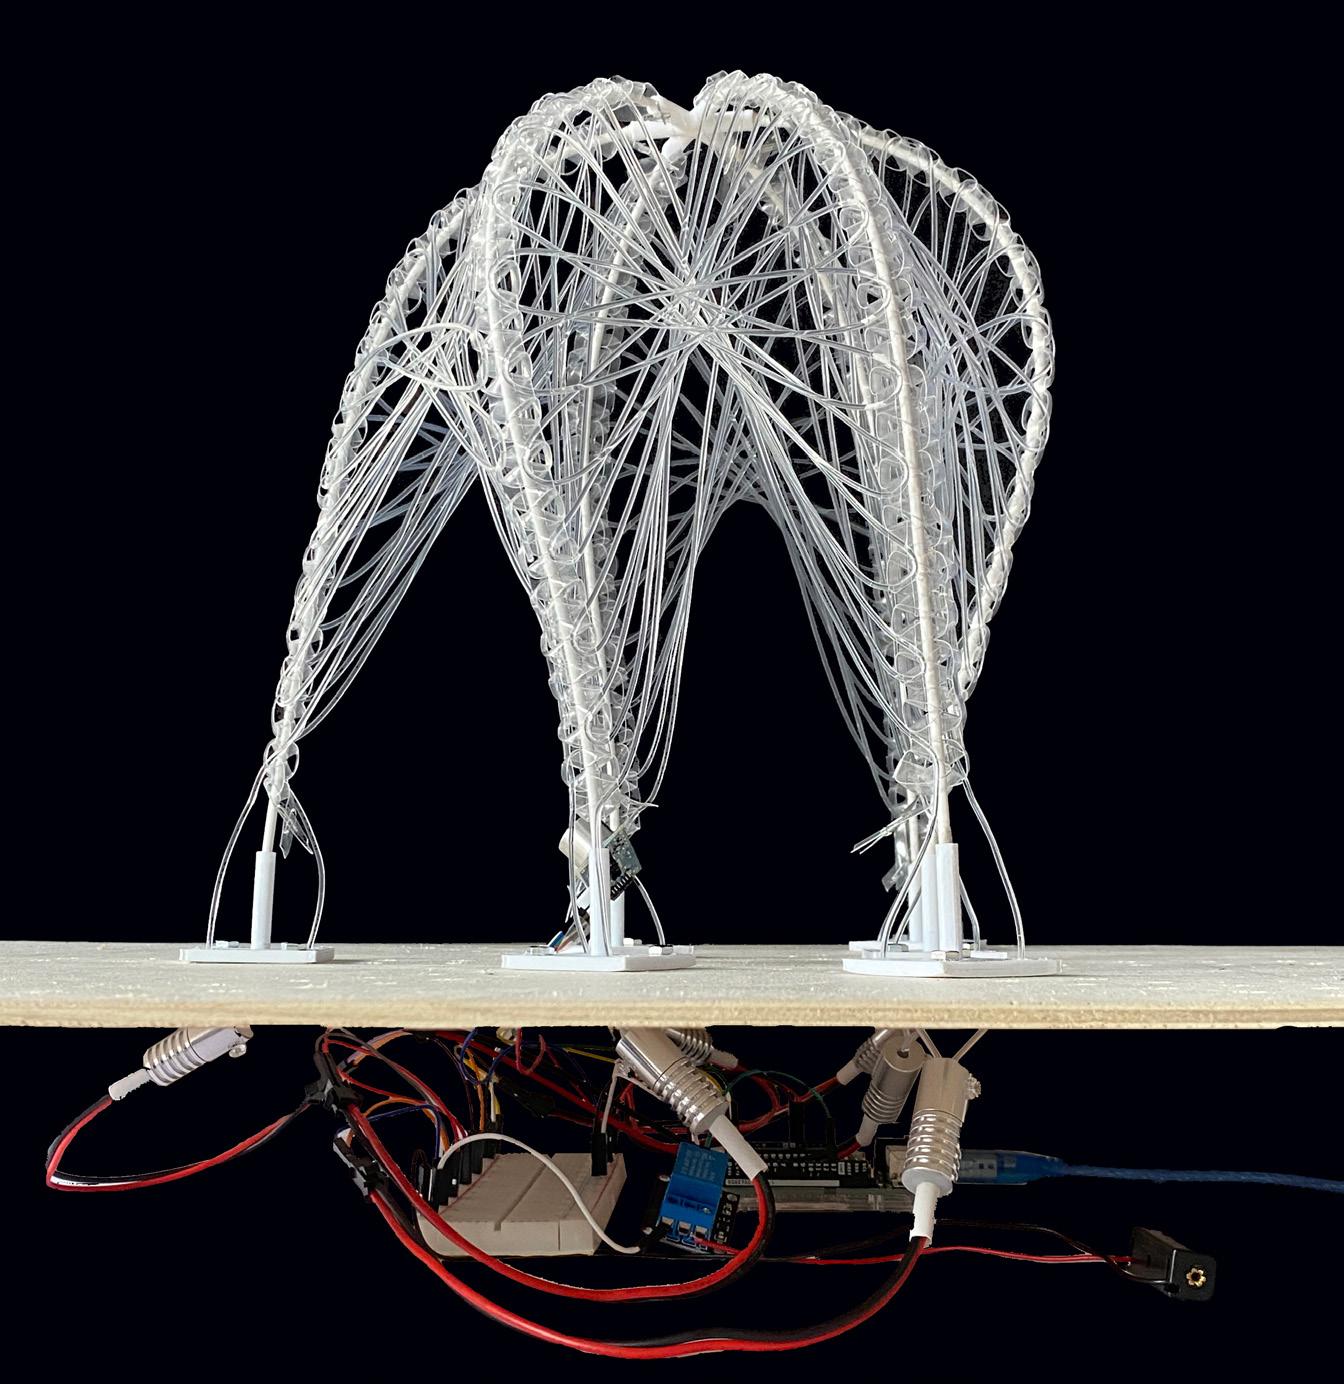
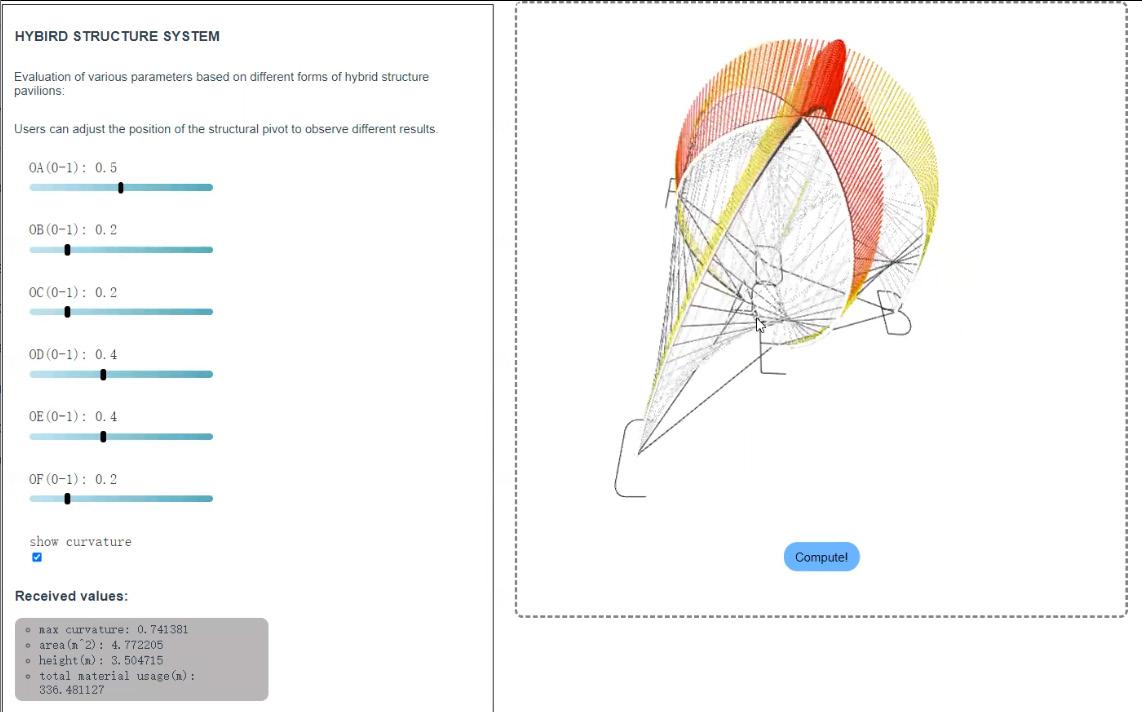
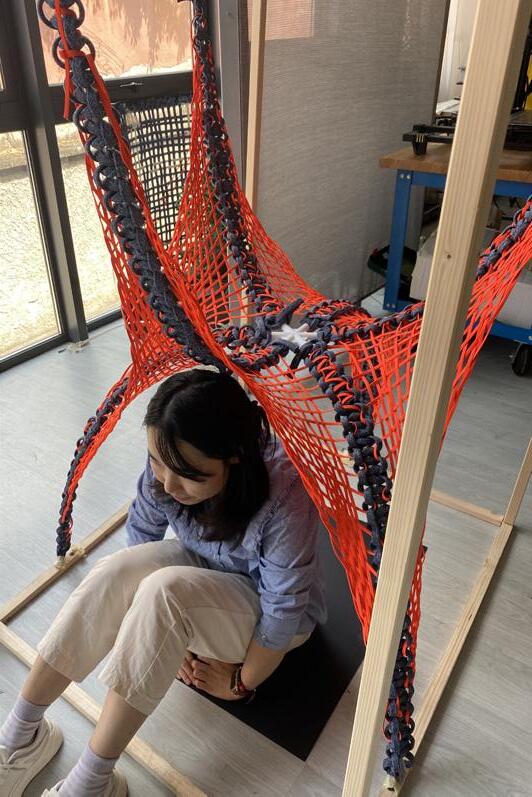
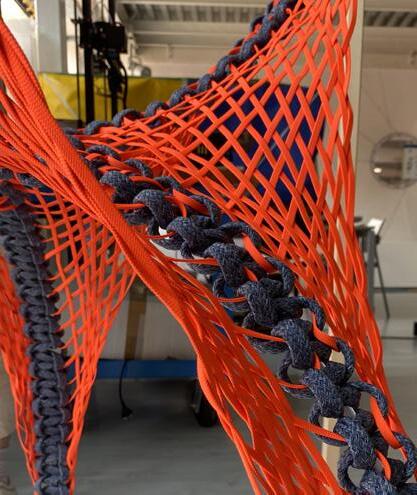
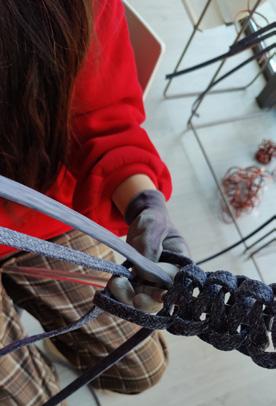
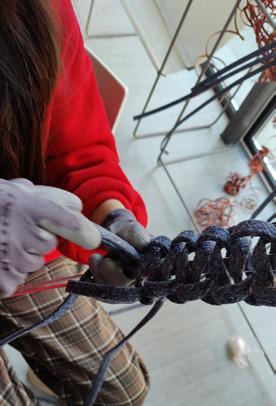
A smart weaving prototype exploration
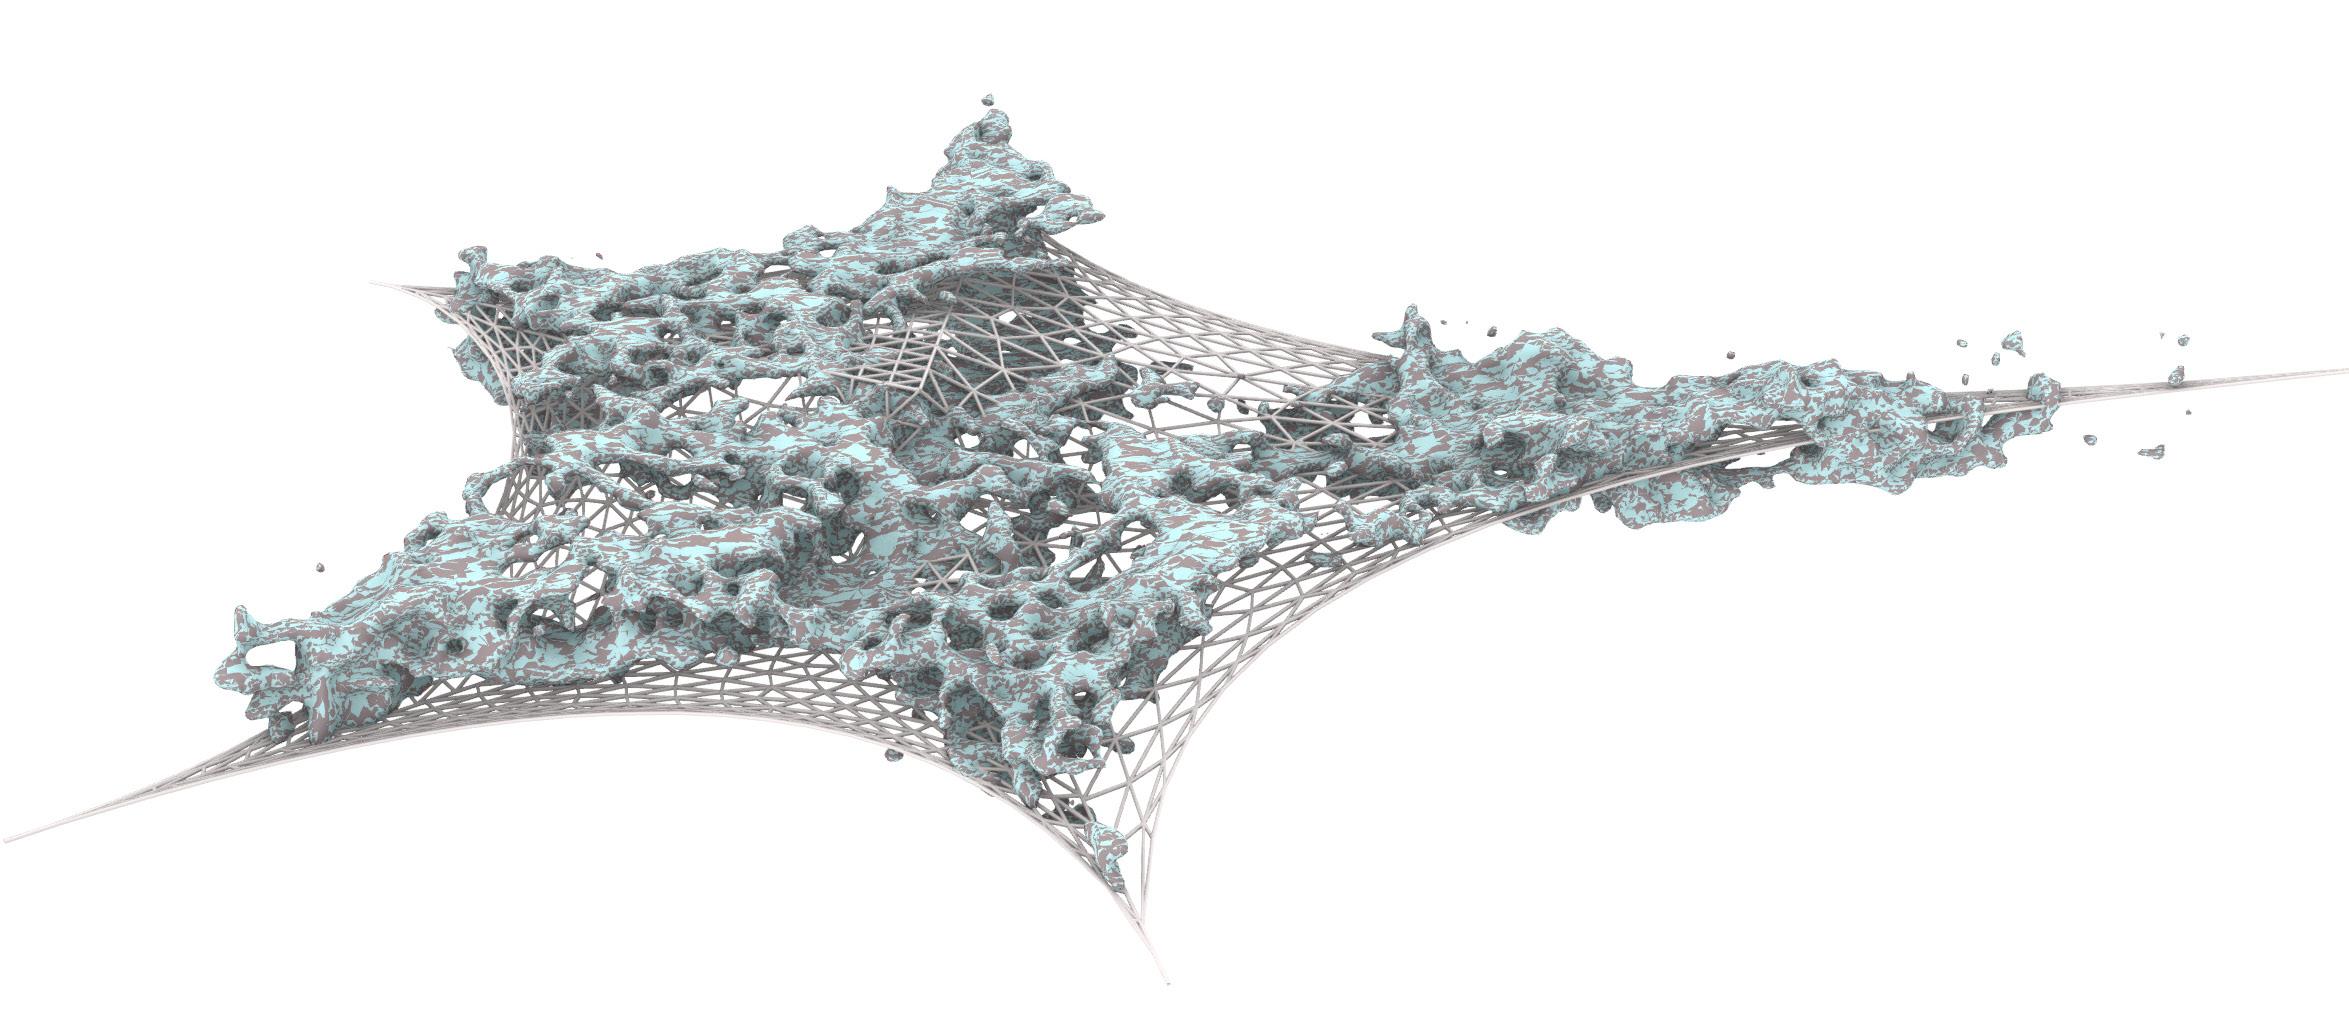
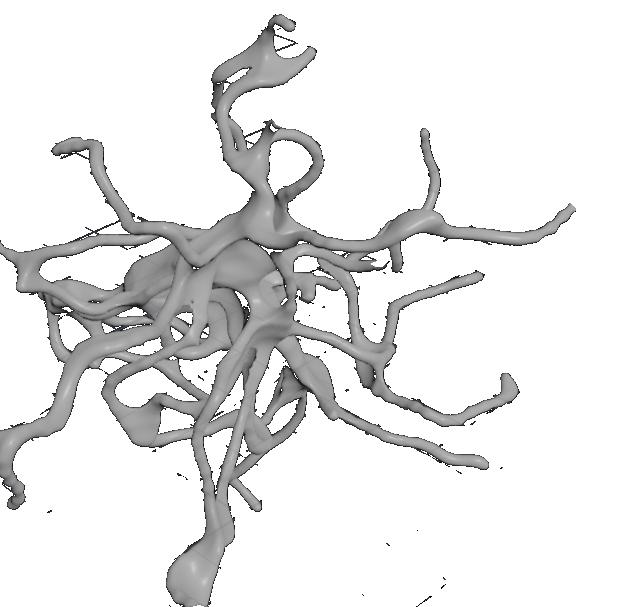
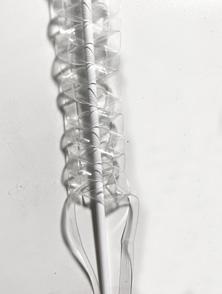
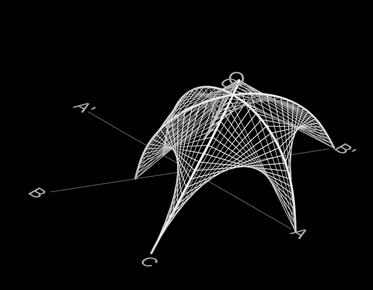
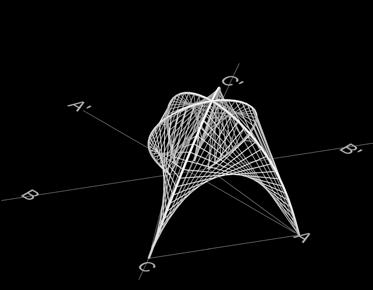
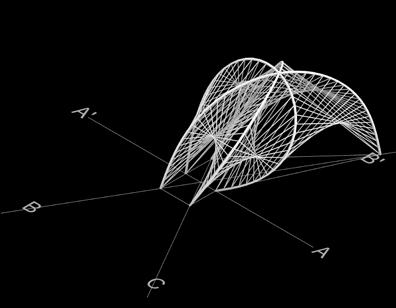
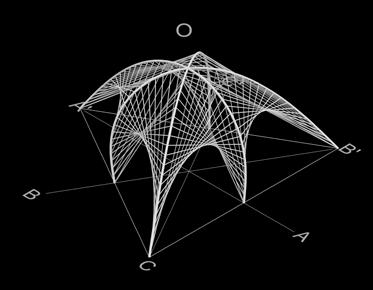
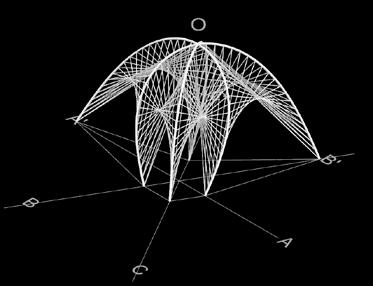
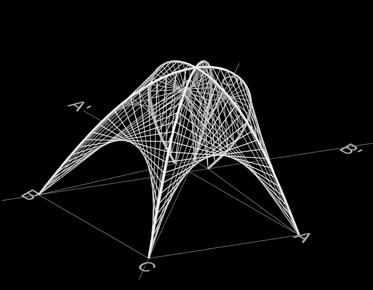
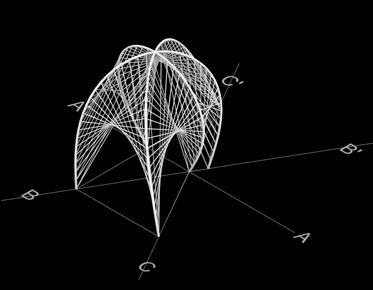
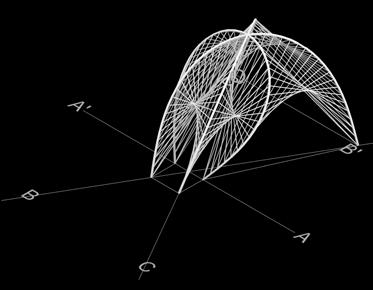
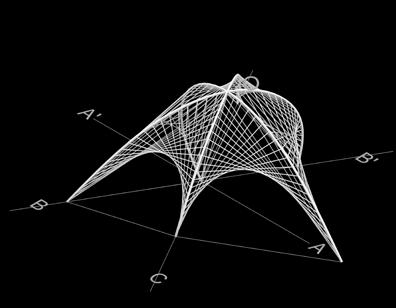
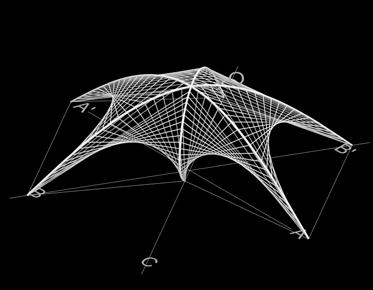
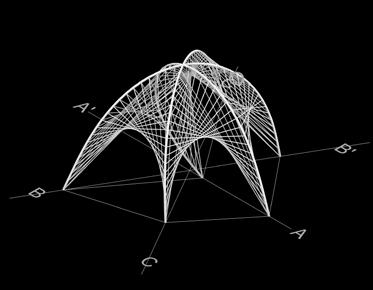
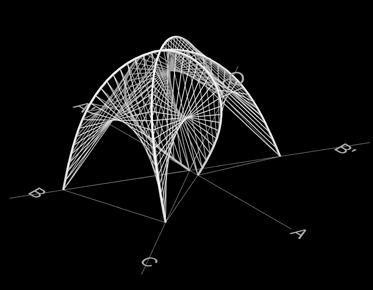
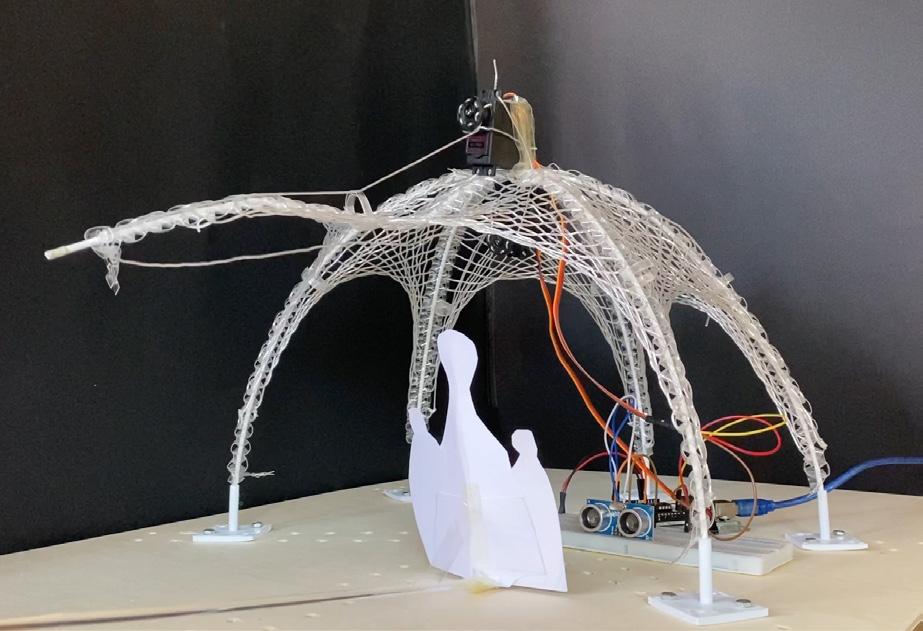
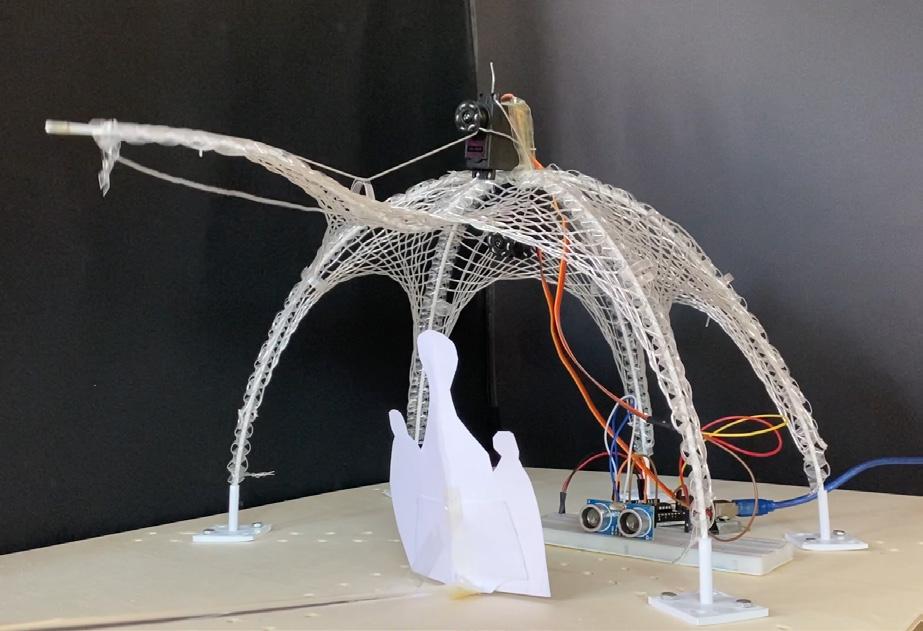
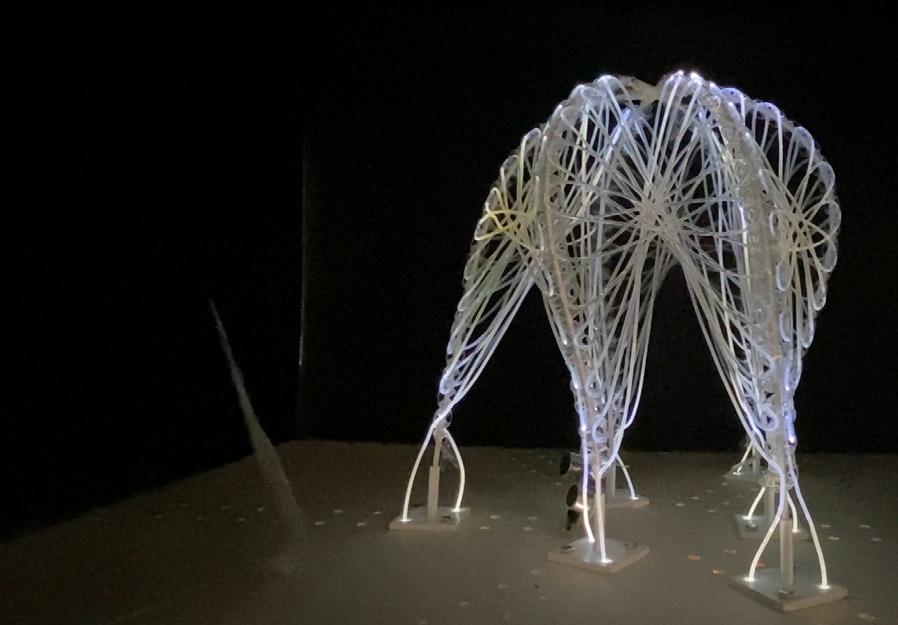
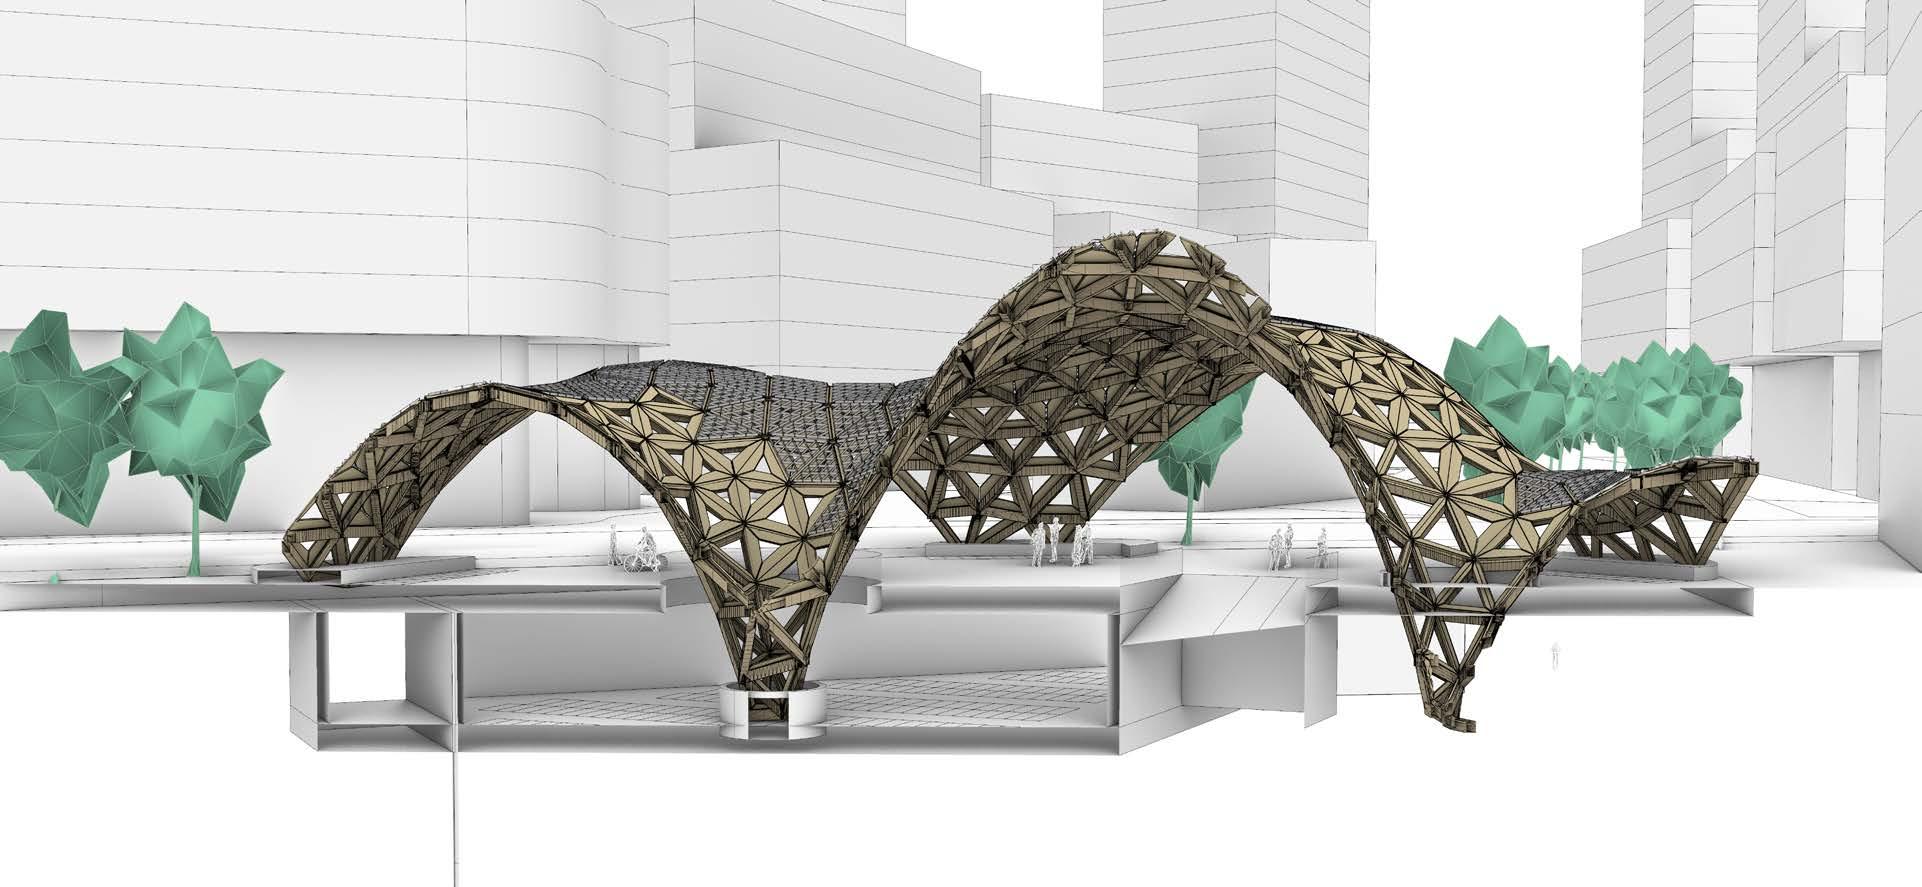
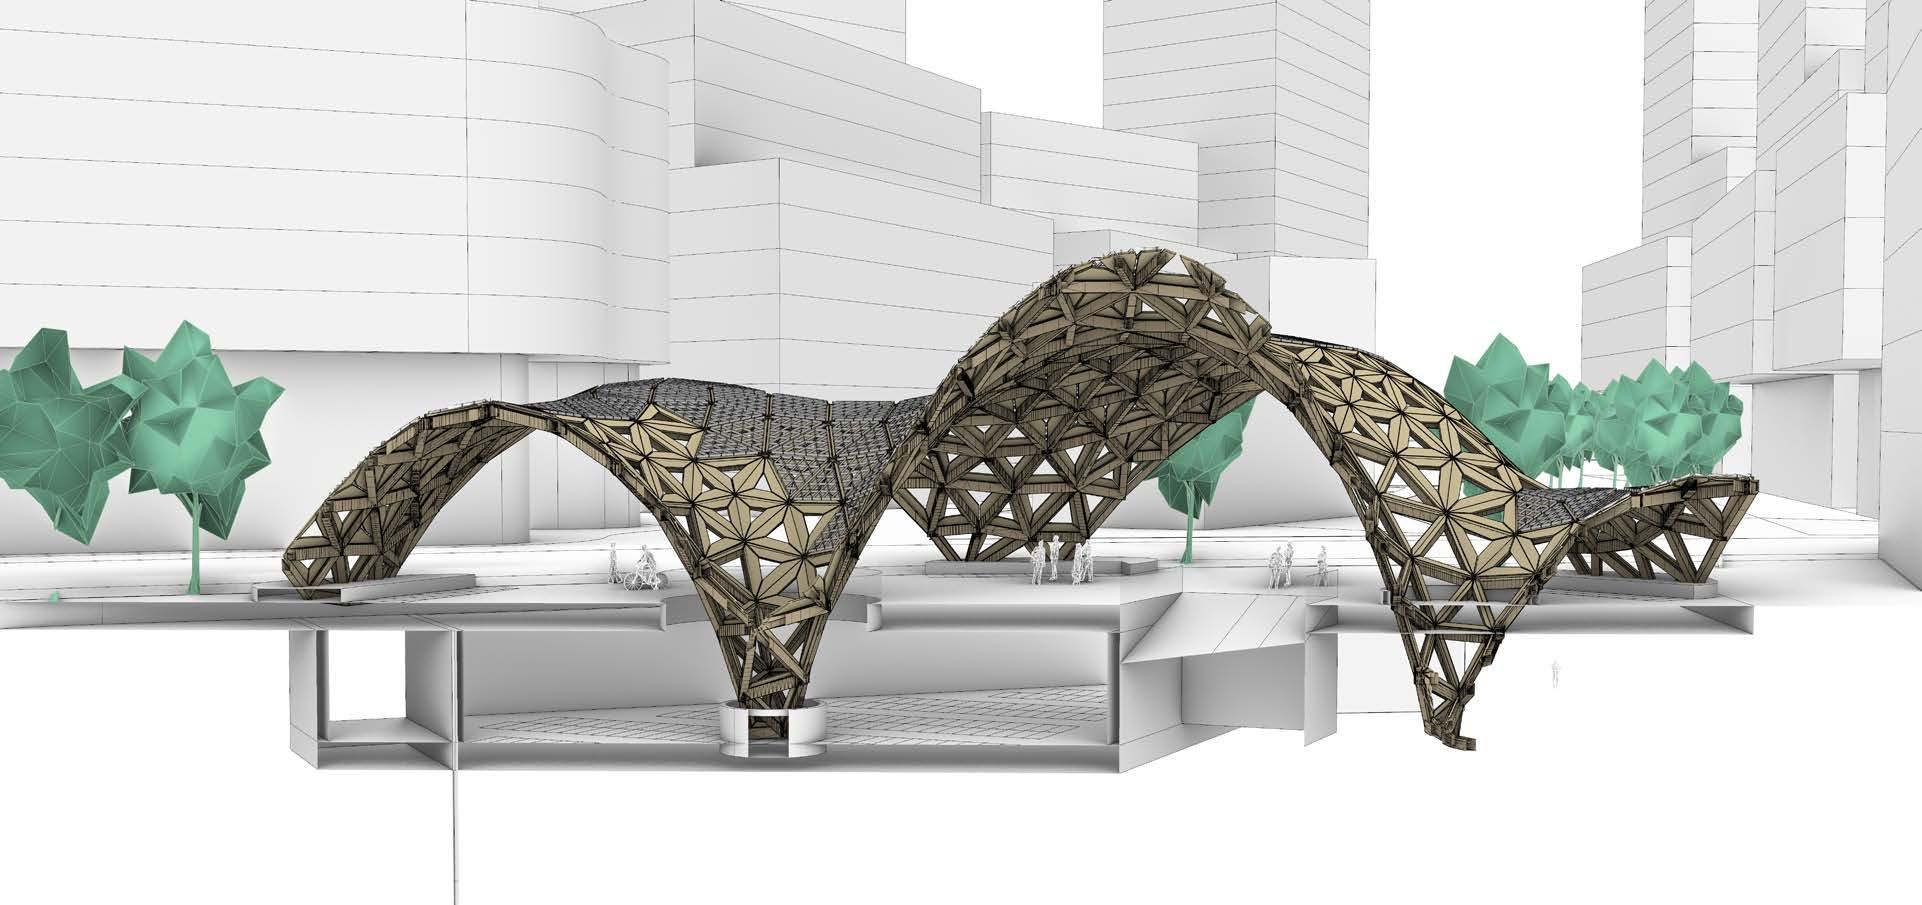
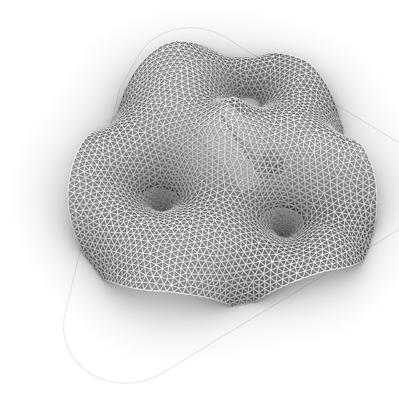
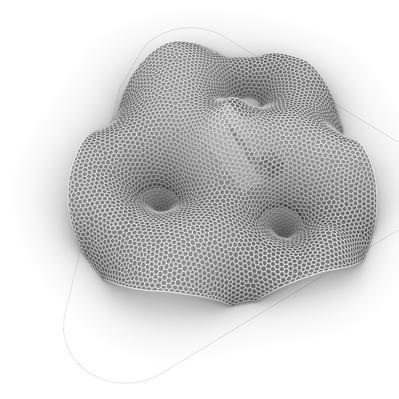
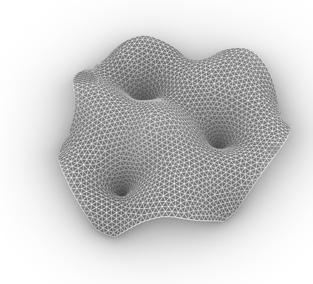
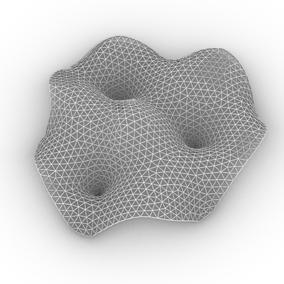
Weaving Octopus


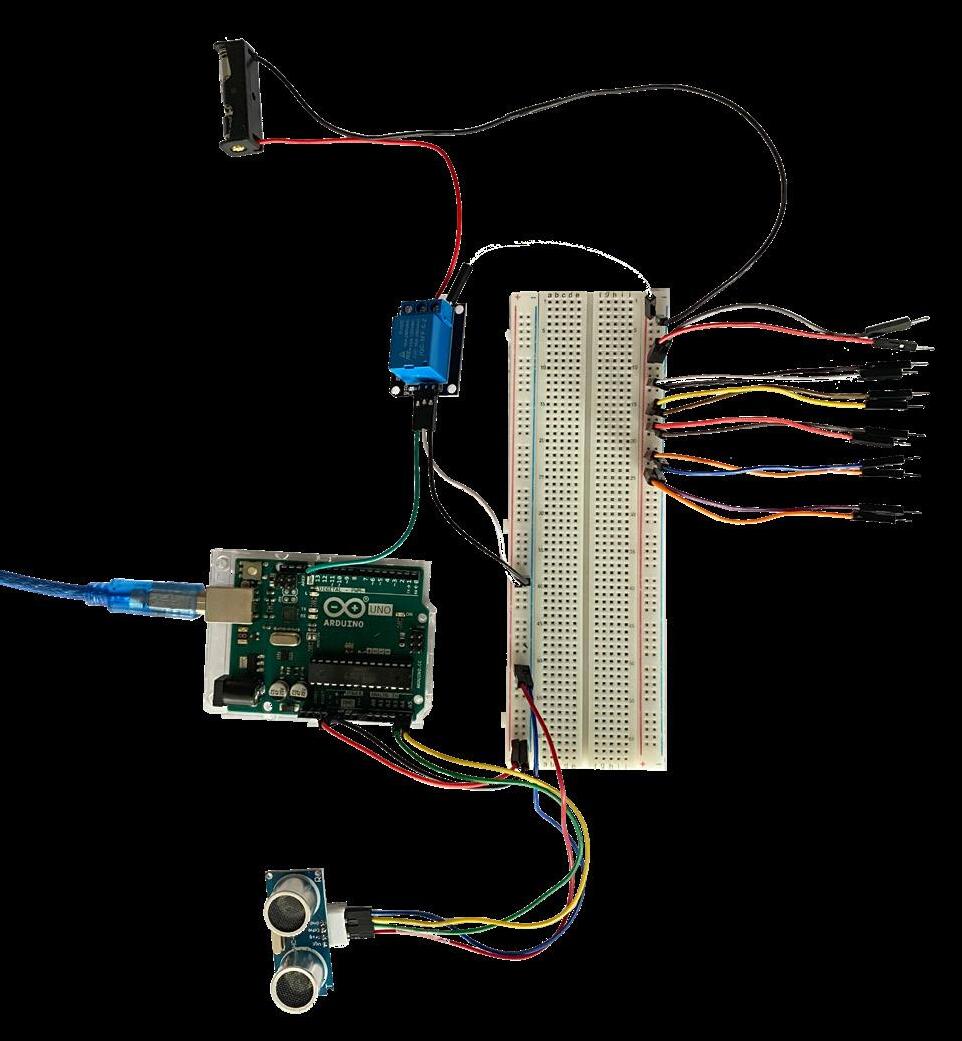
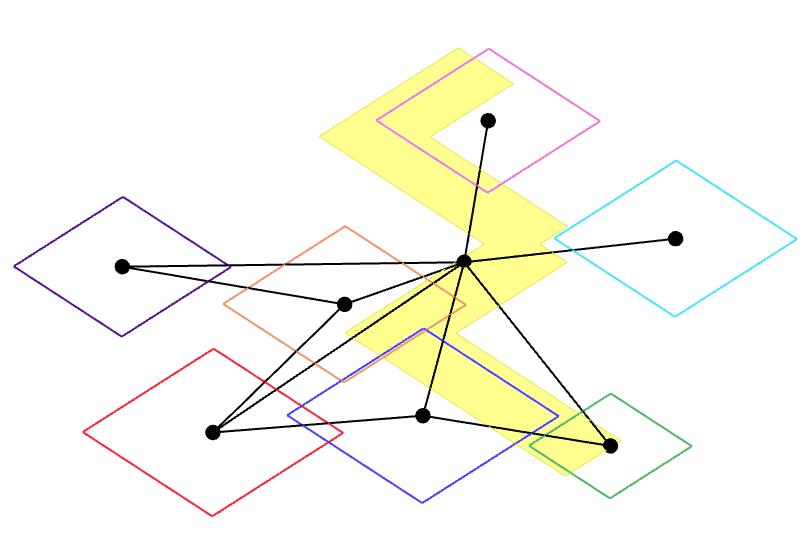
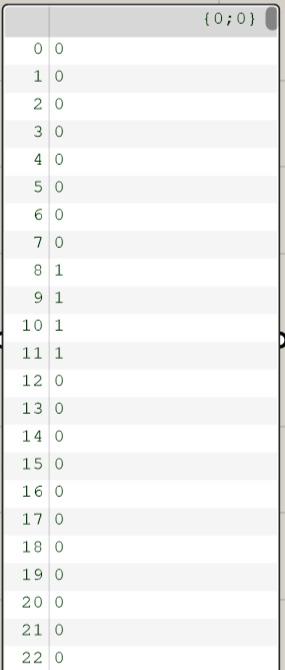
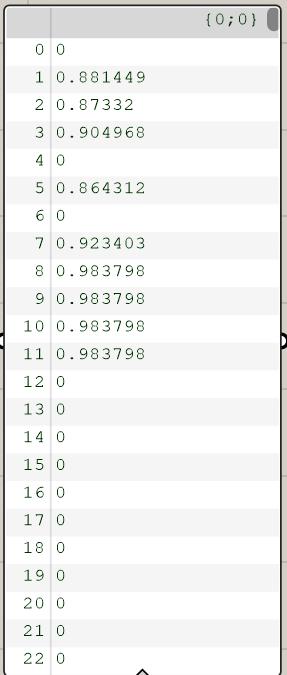
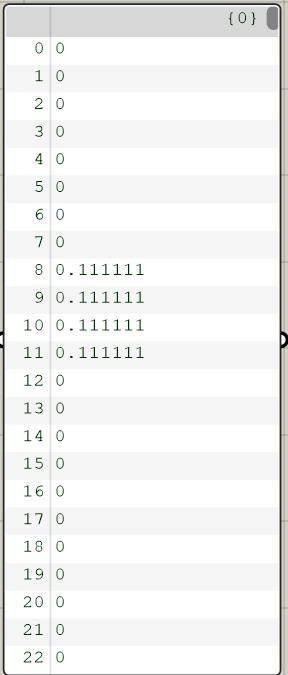
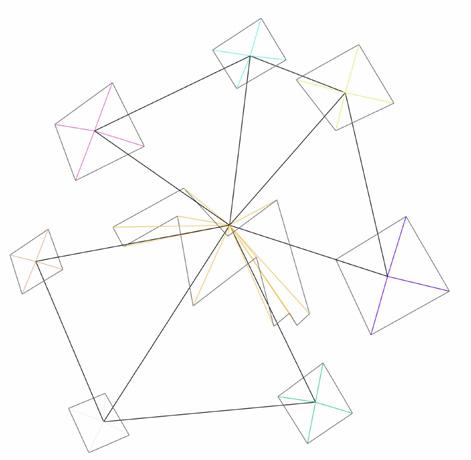
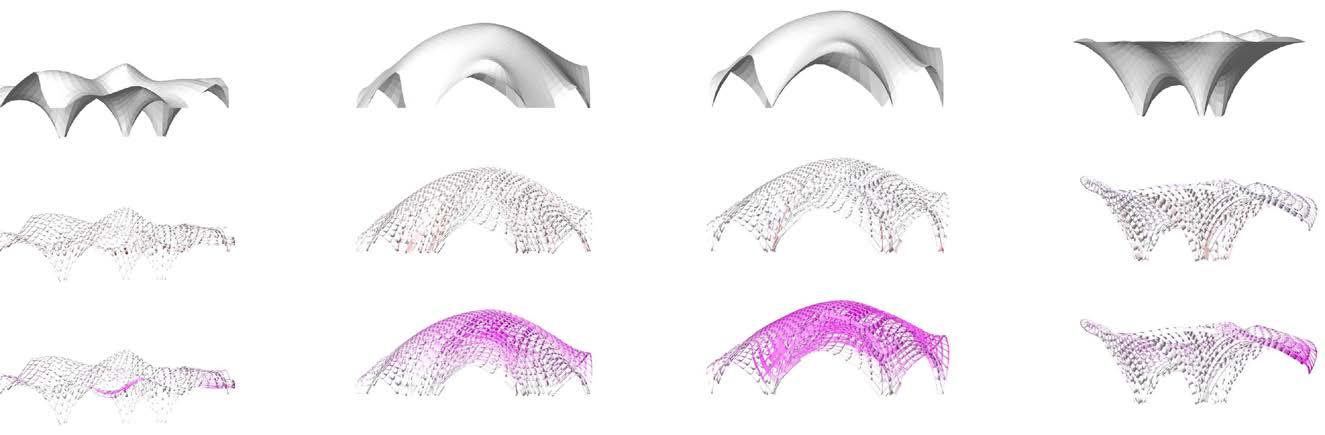
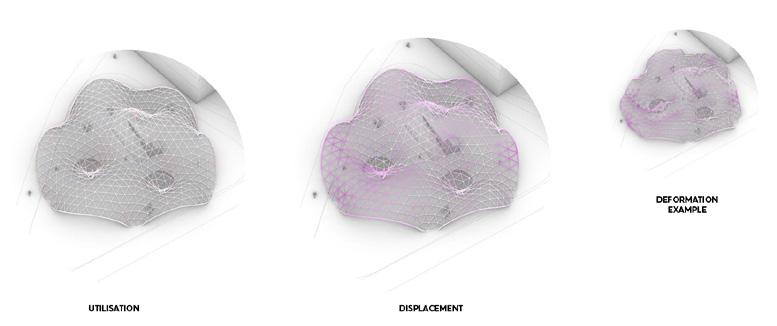
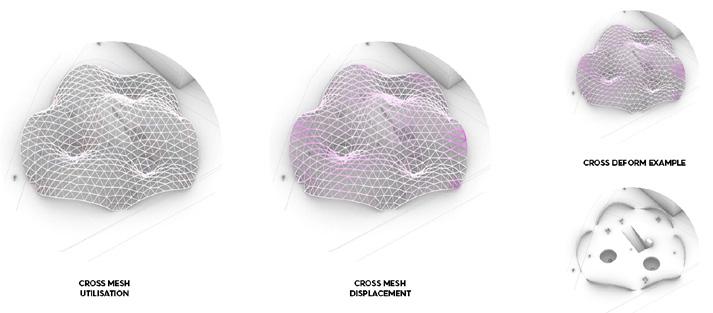
Weaving System On Skeleton

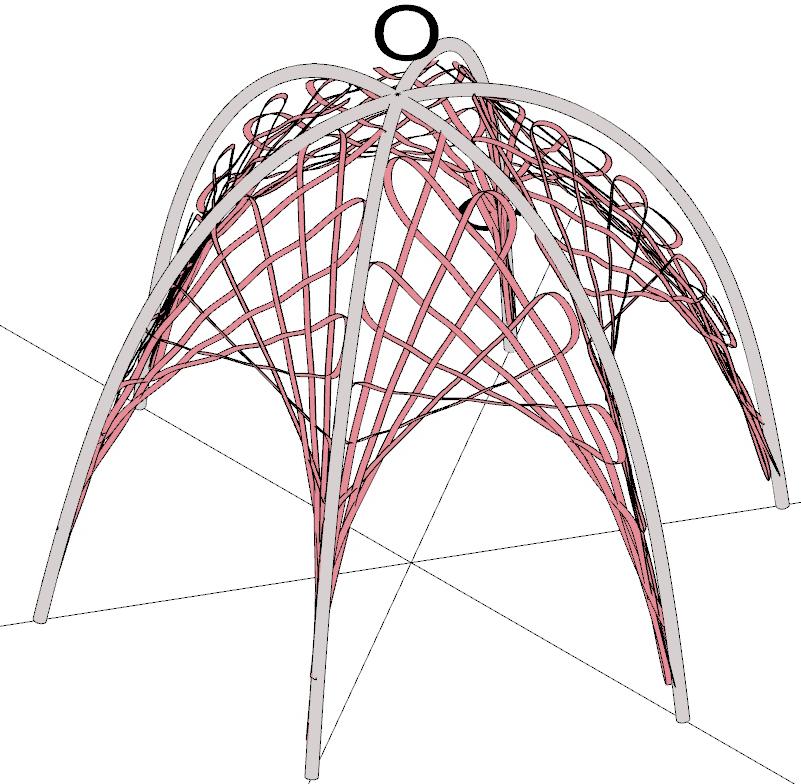


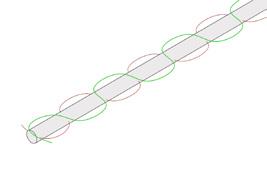
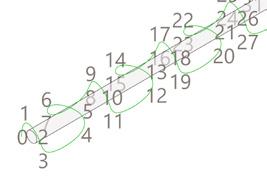
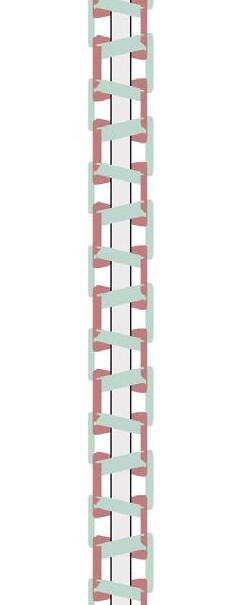

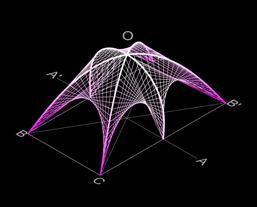
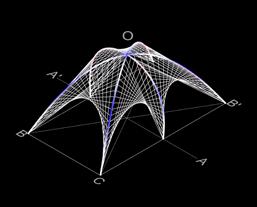
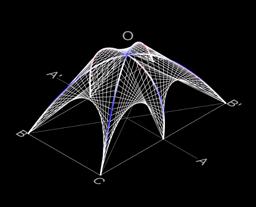

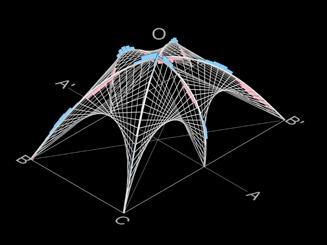
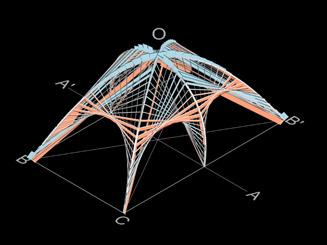
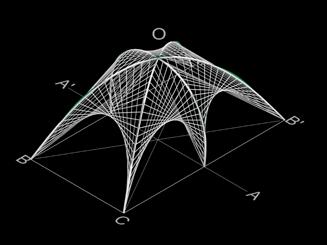
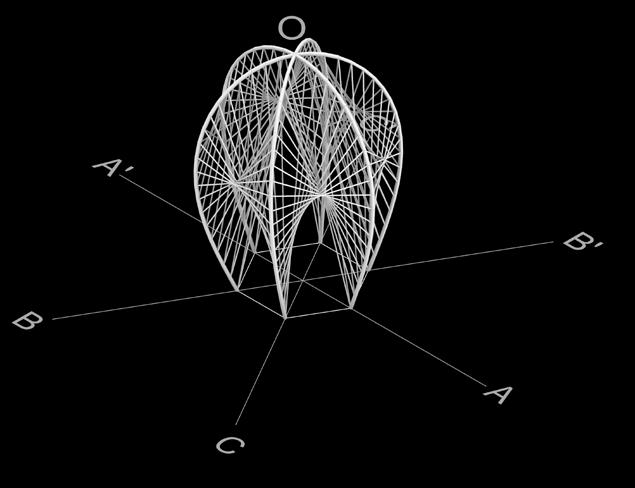
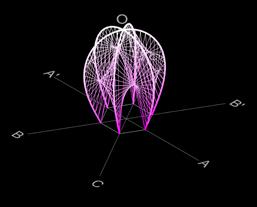
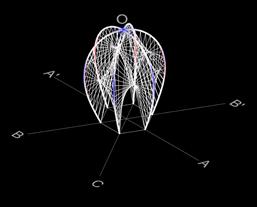
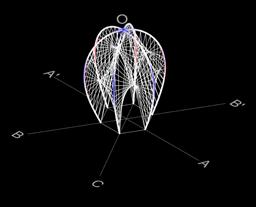
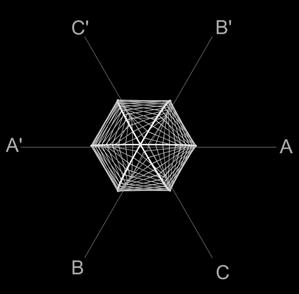
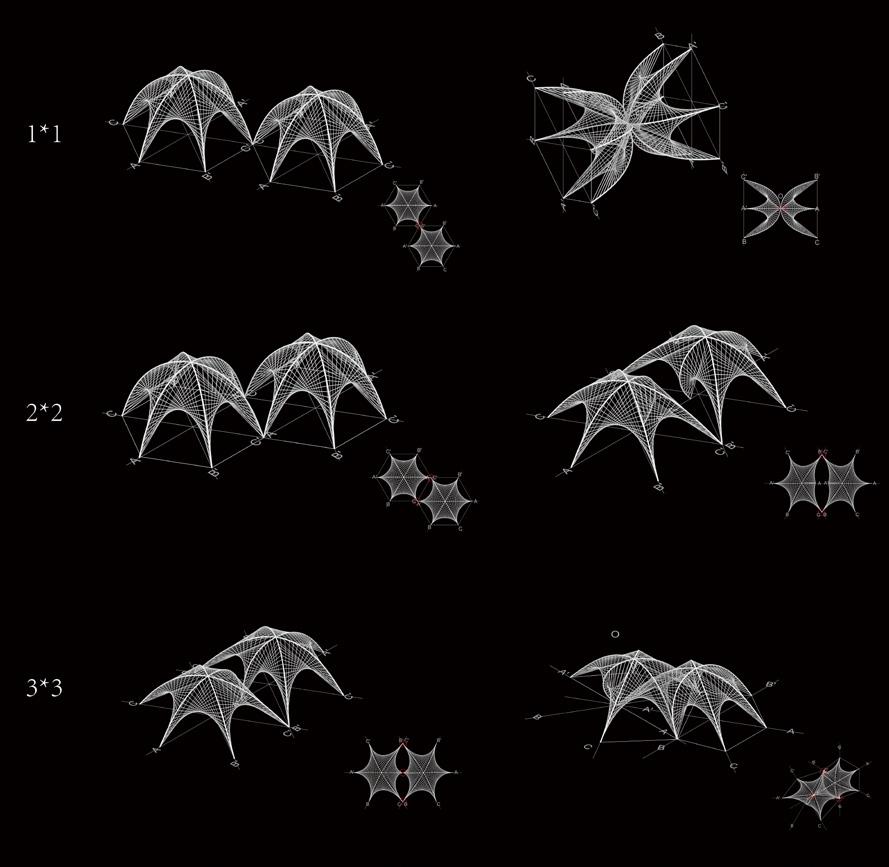
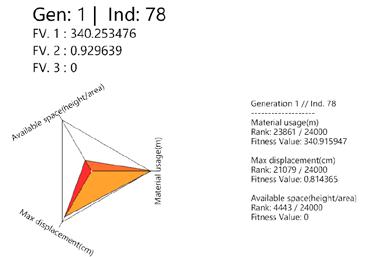
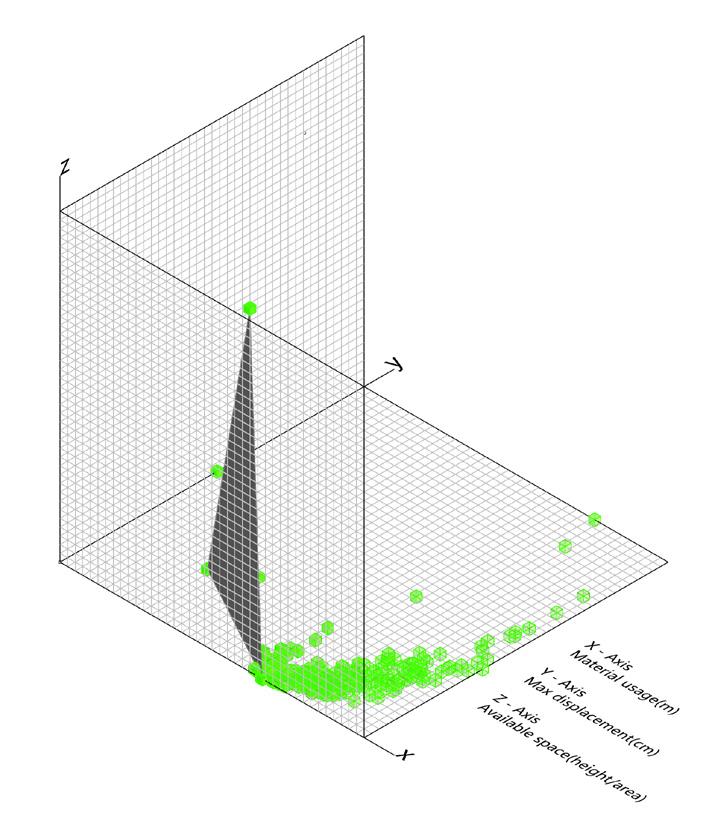
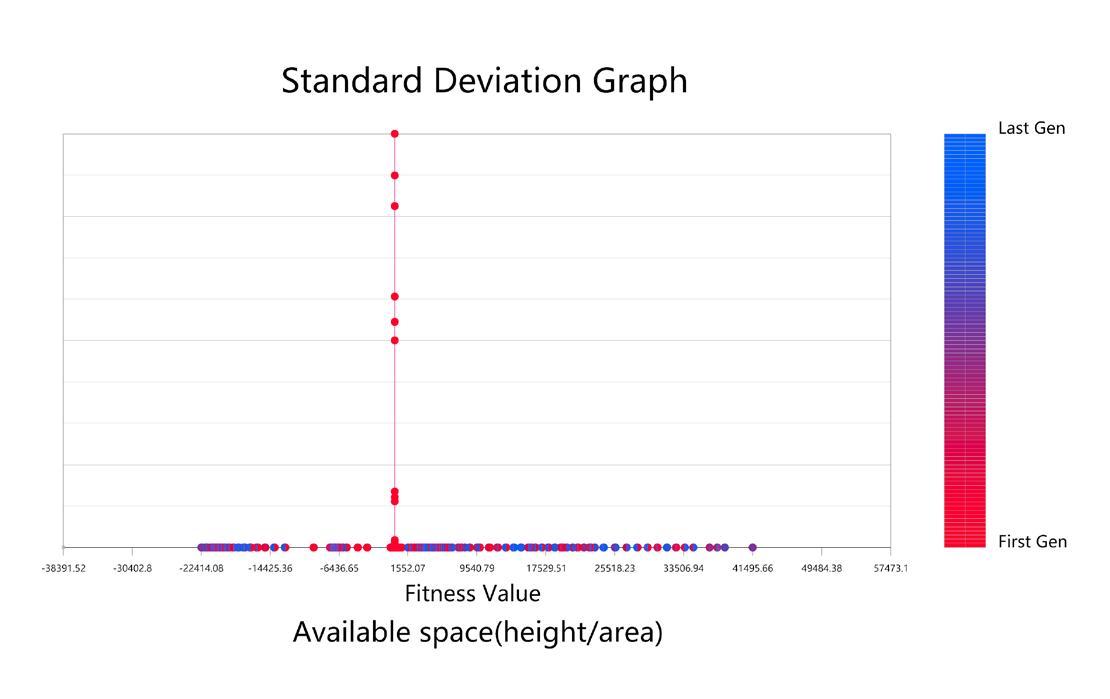
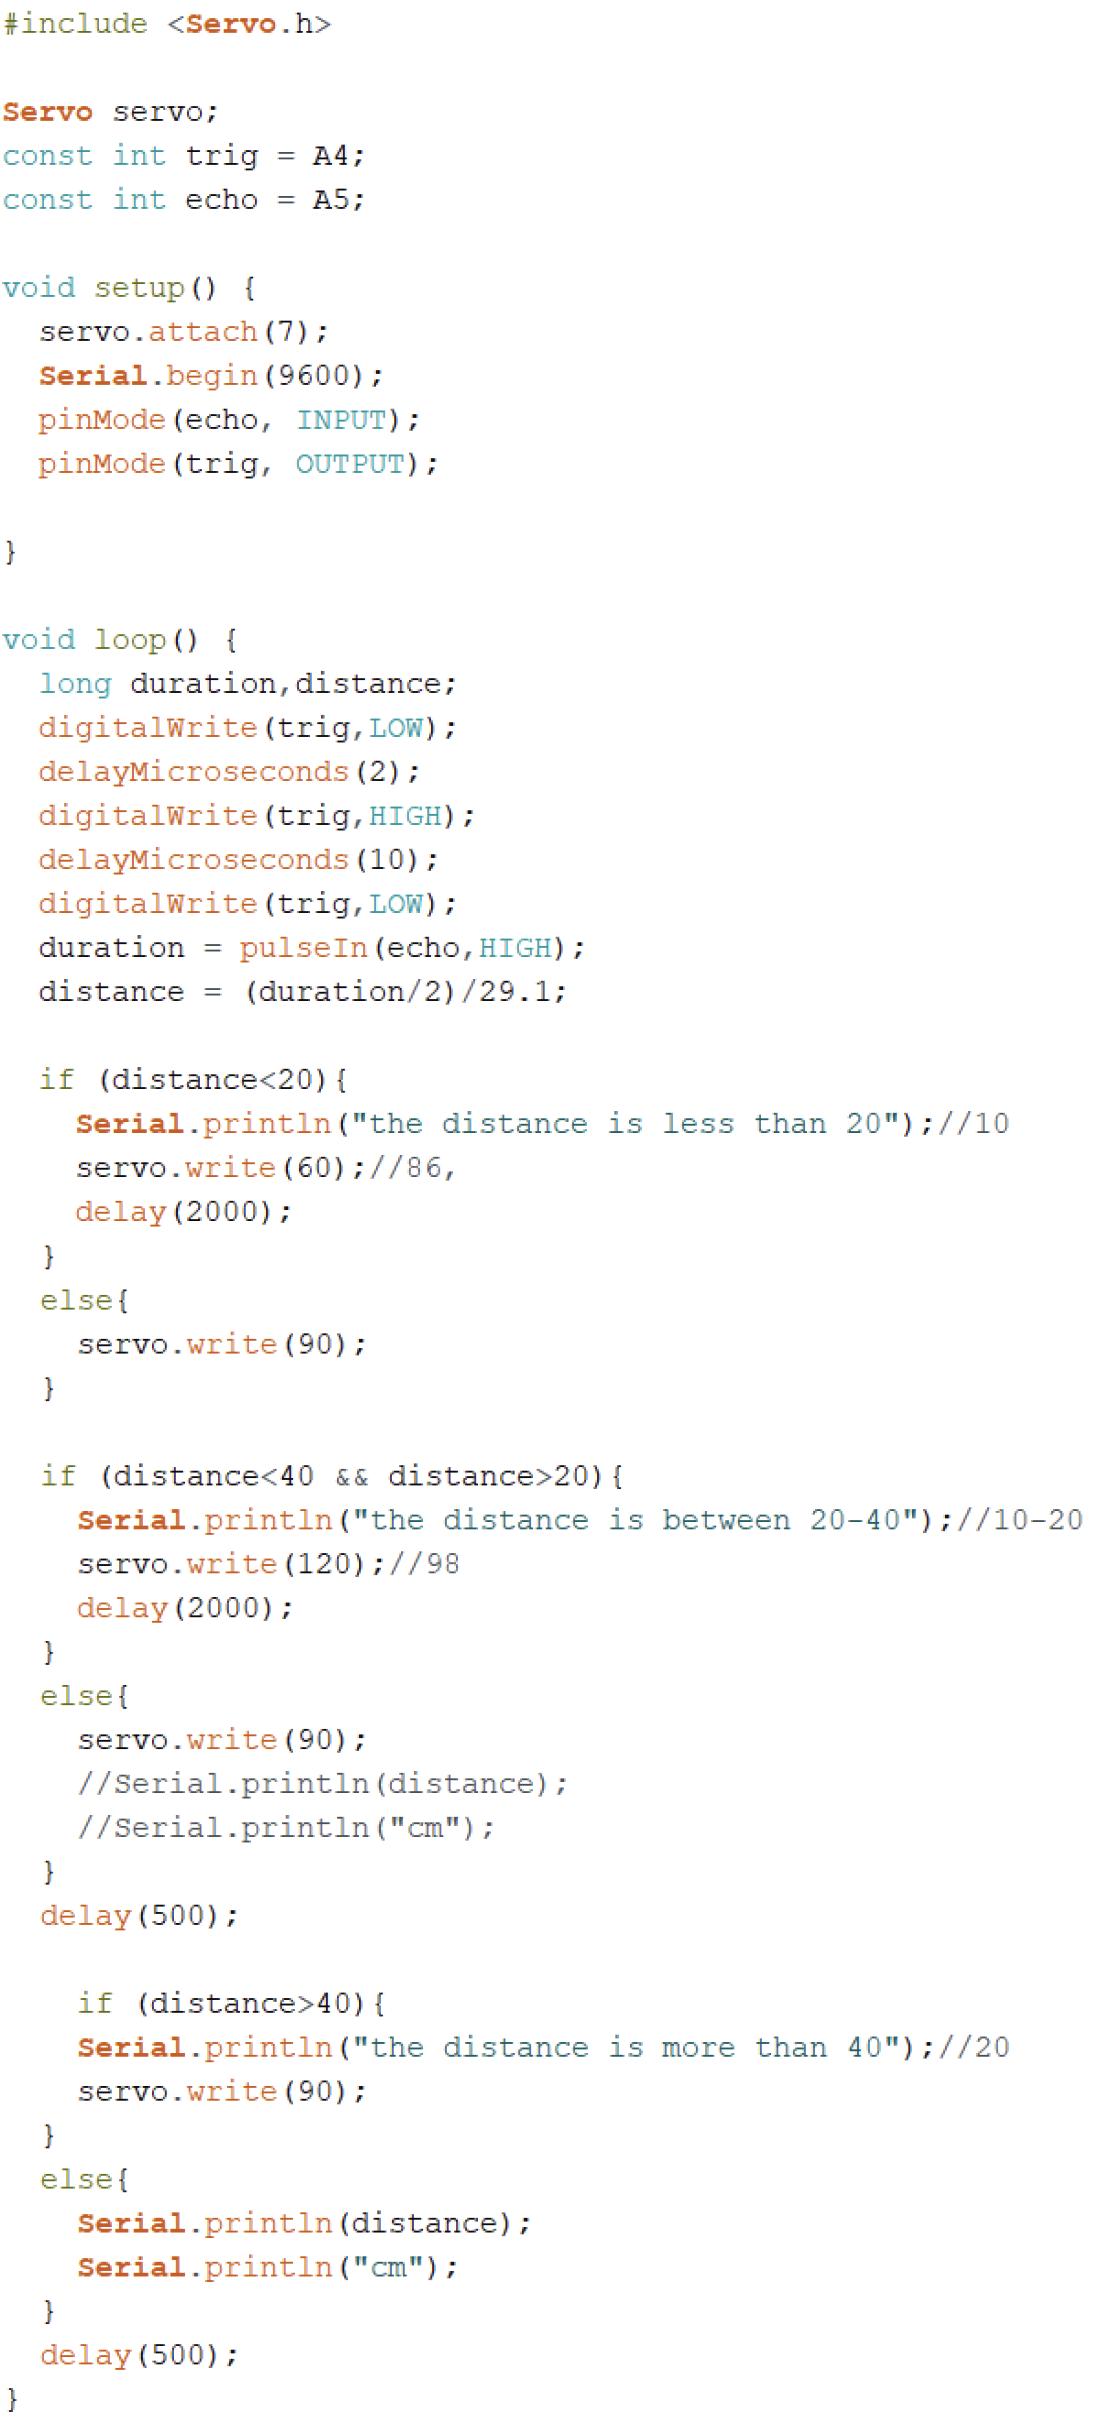
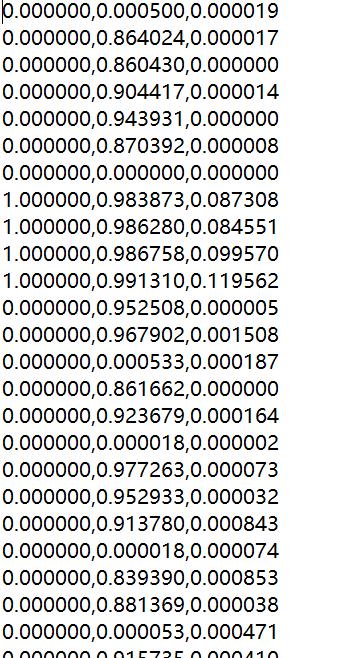
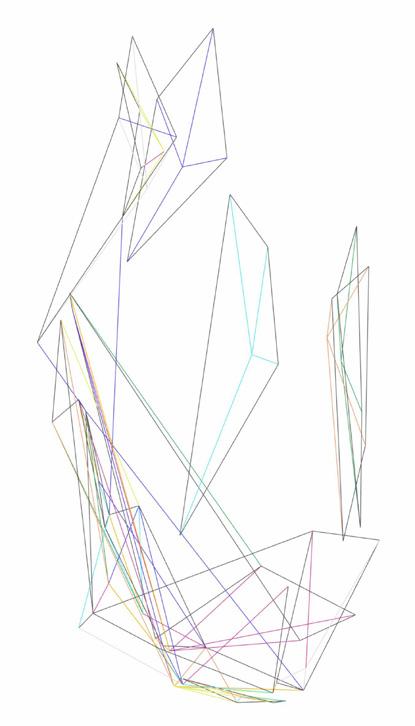
Input: material usage for each two skeleton Out put: form/height/area/curvature/displacement of prototype


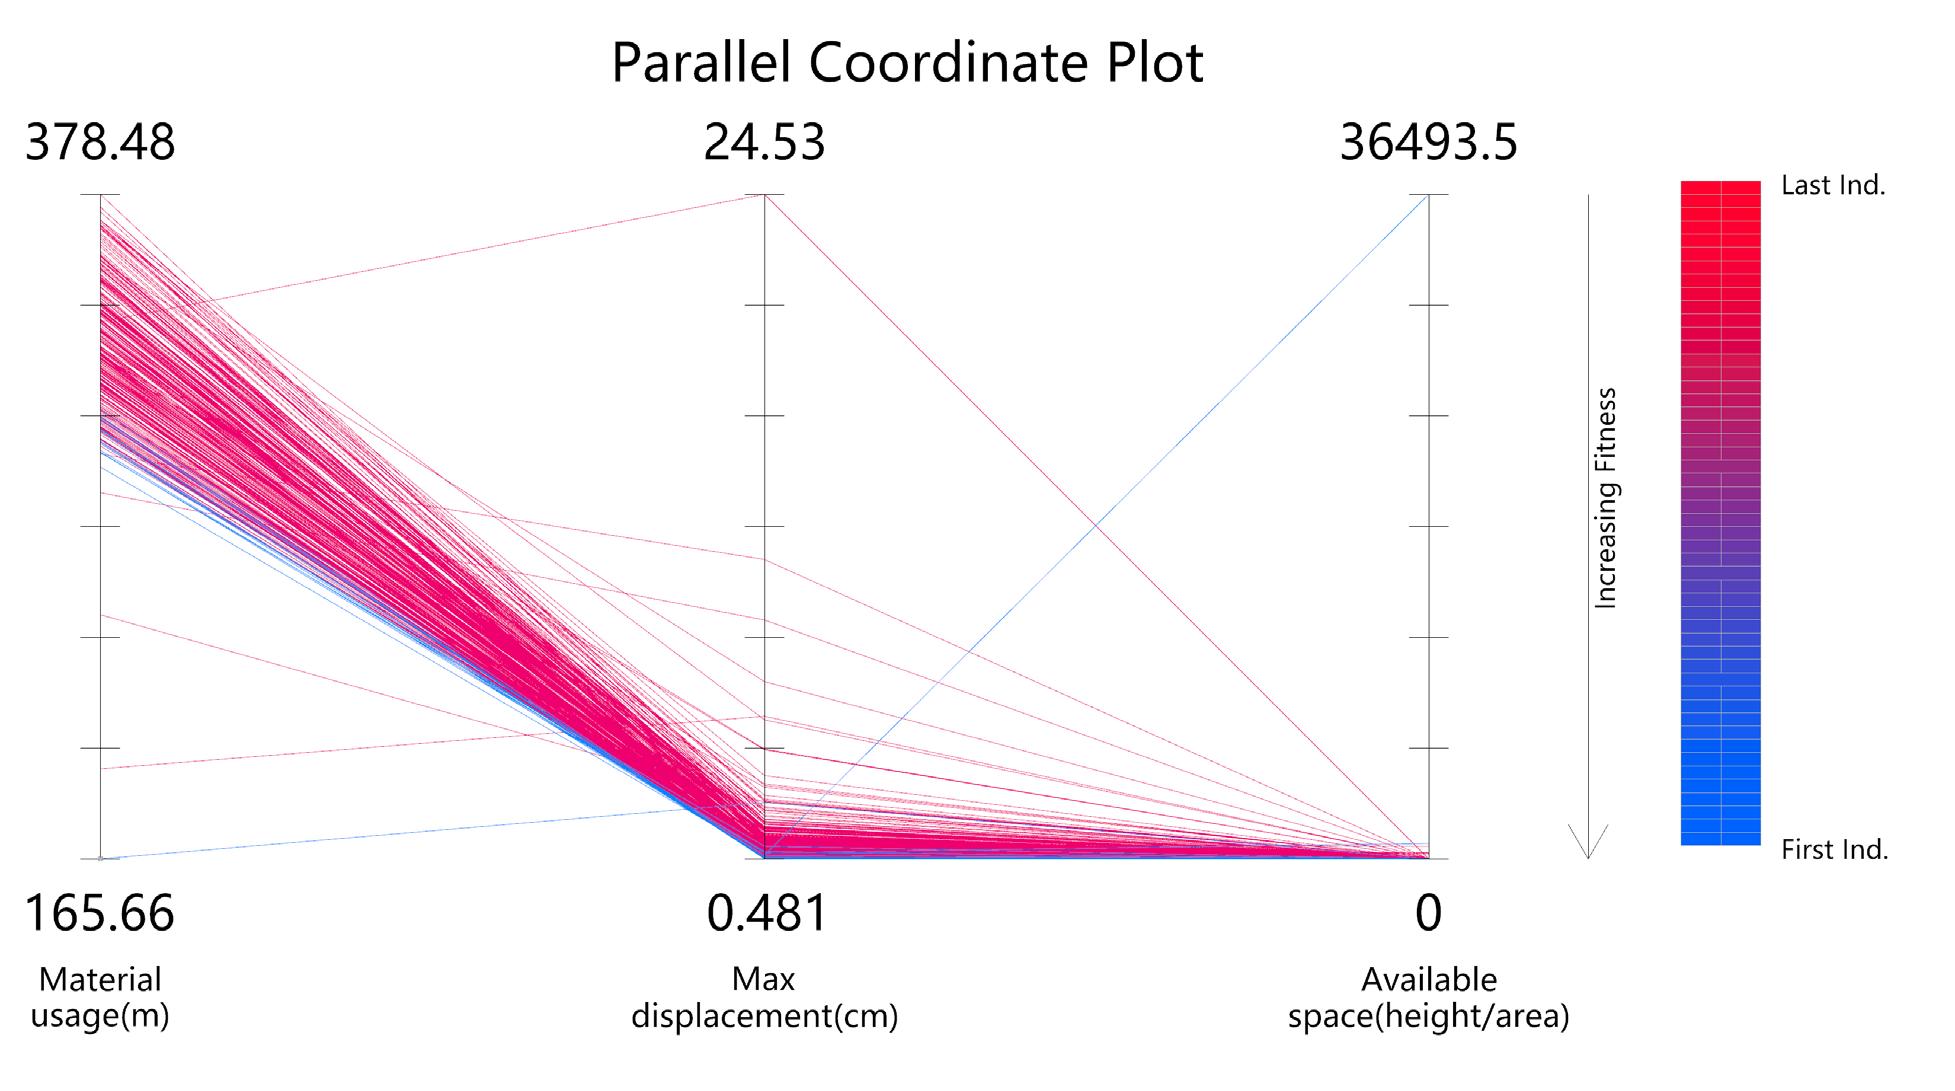
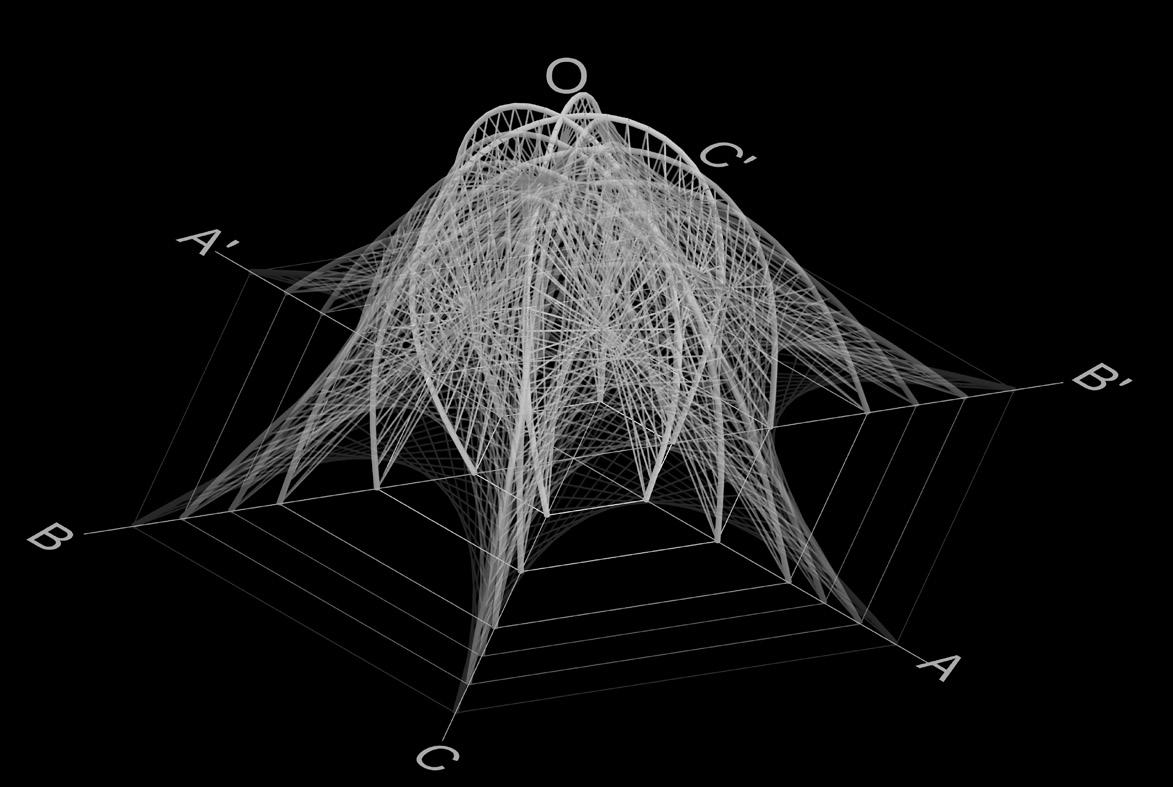
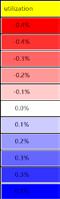
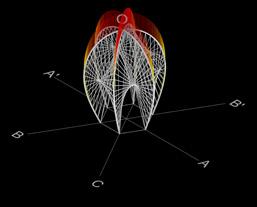
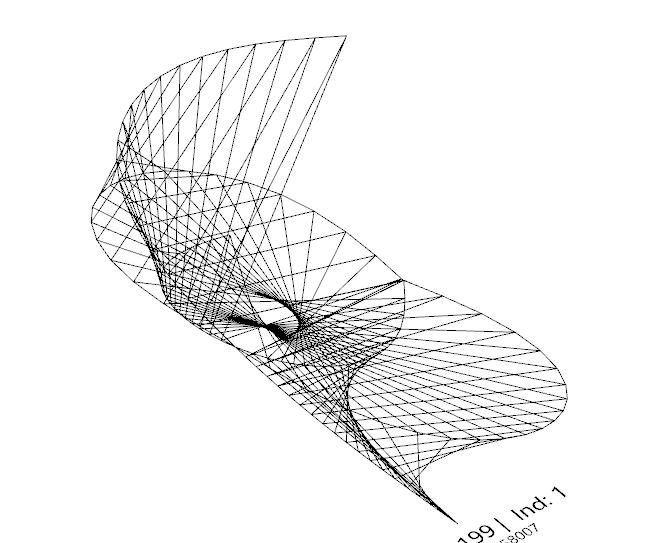
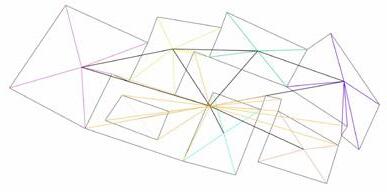
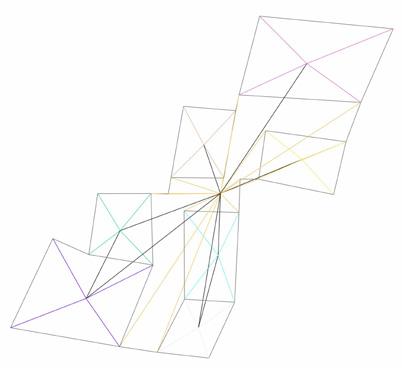
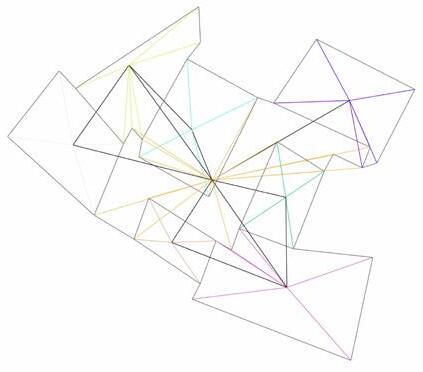
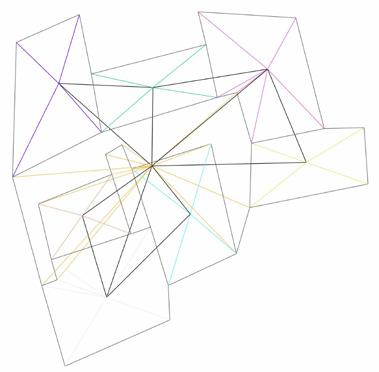
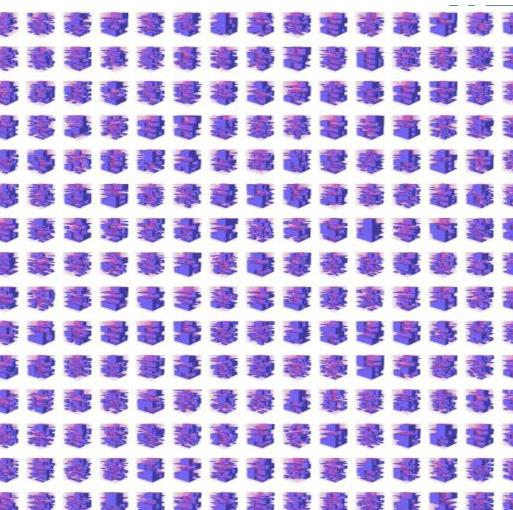
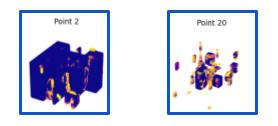
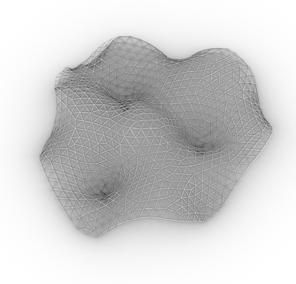
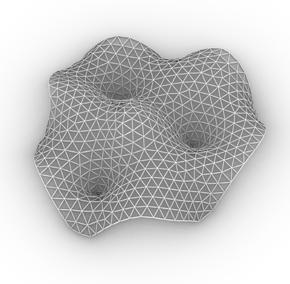
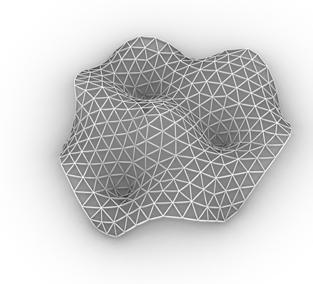
The last few generations: optimization results generated as the
Outerlier:
Outerlier:
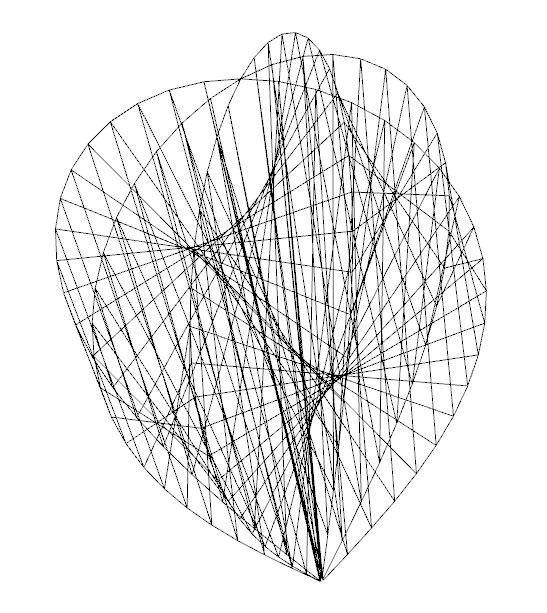
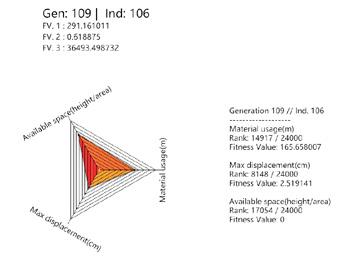
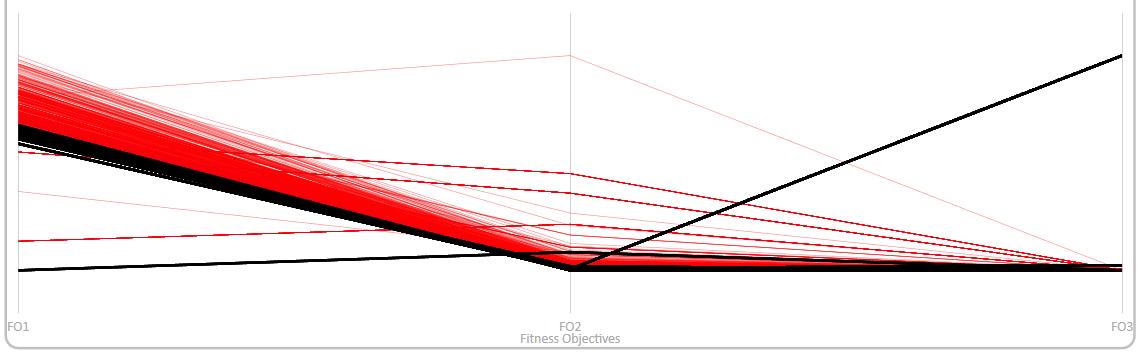
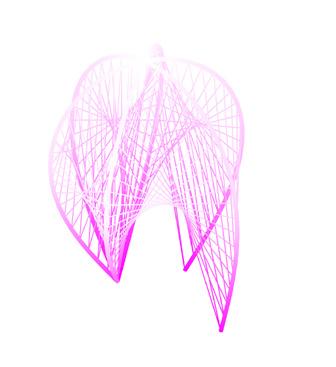
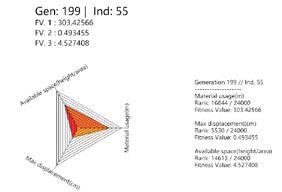

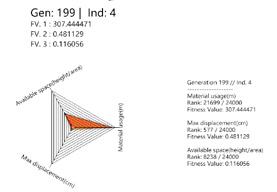
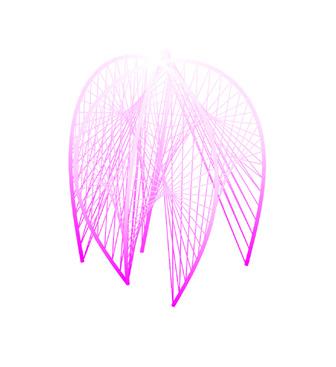
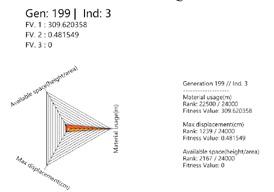
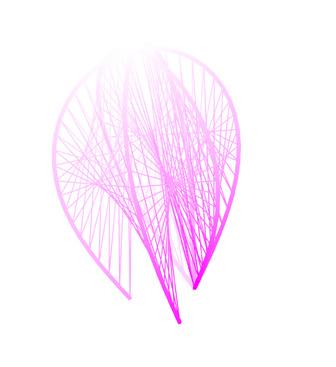
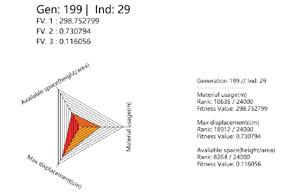
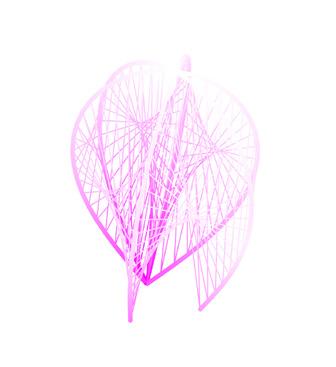
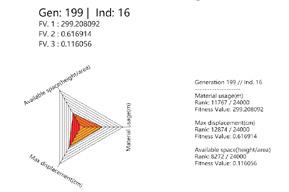
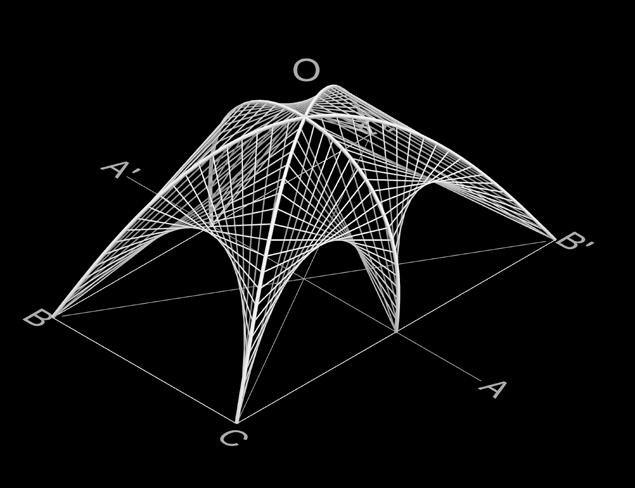
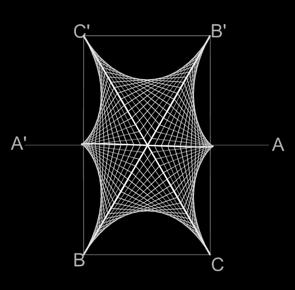
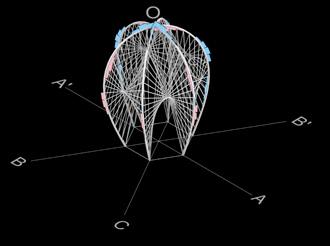
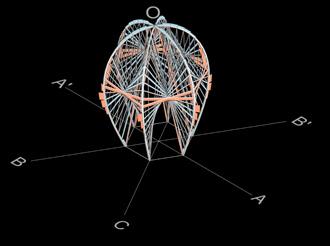
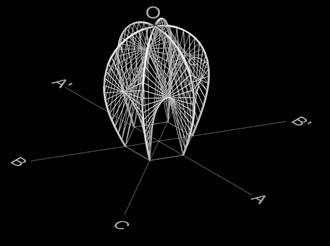
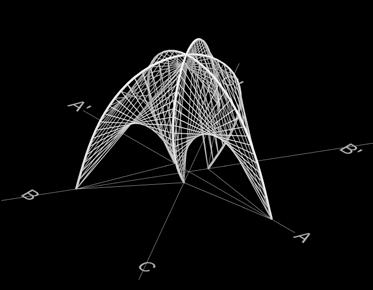
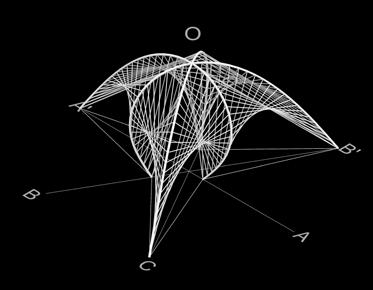
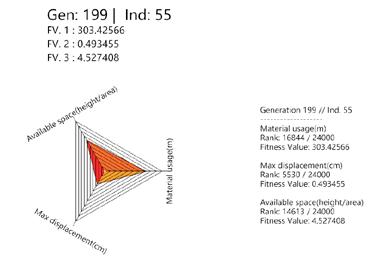
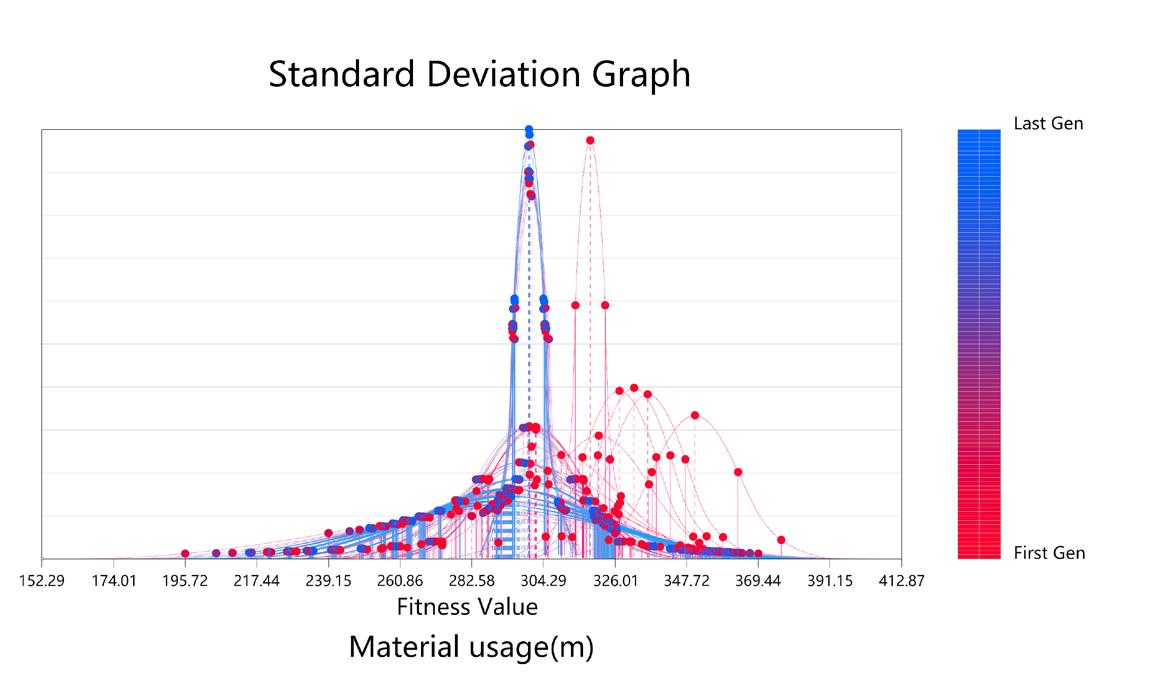
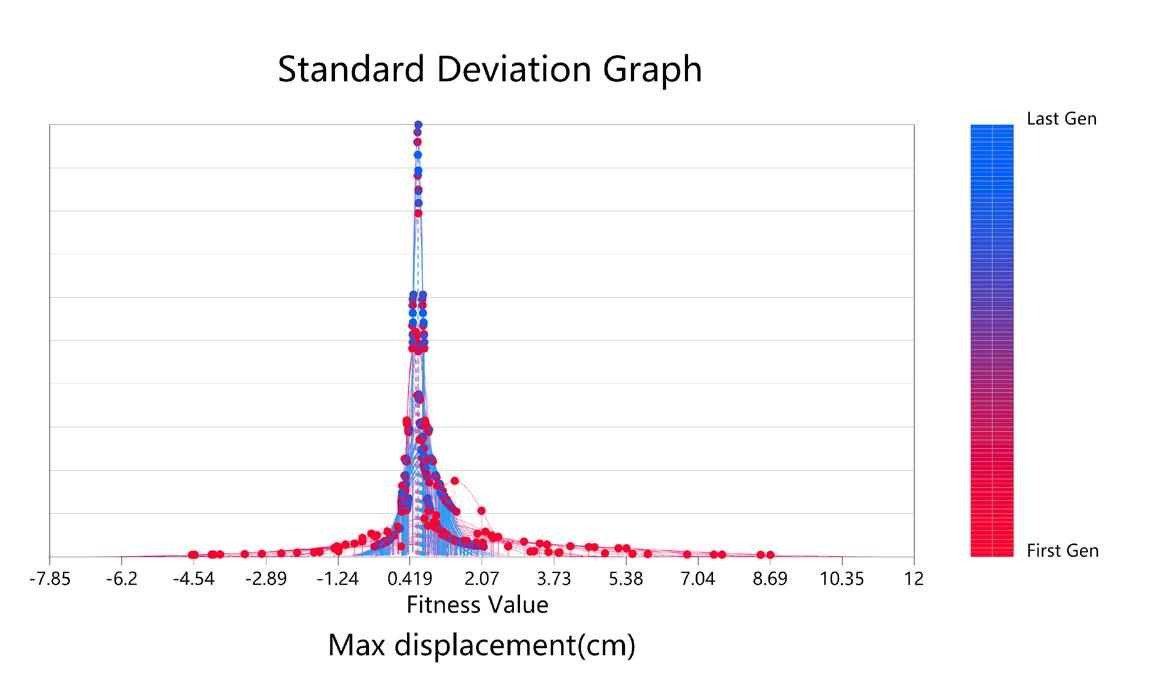
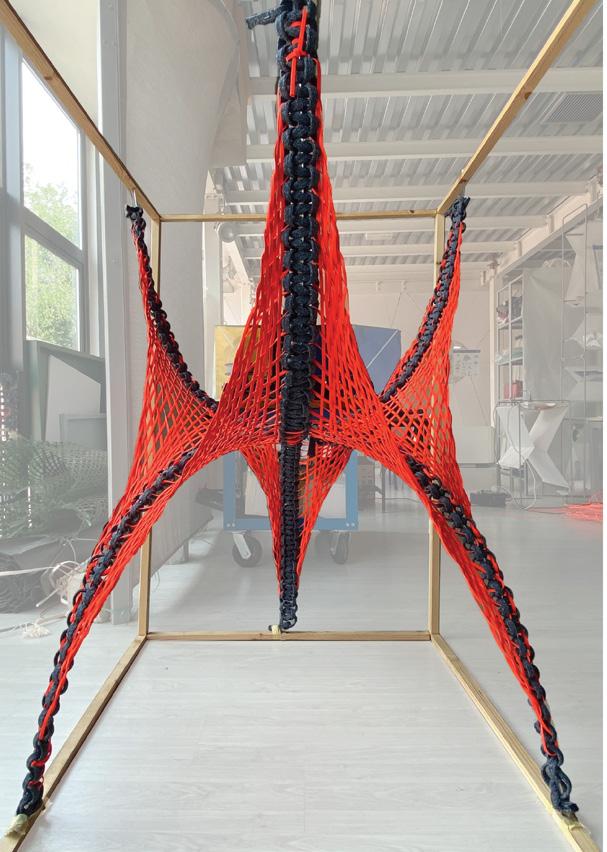
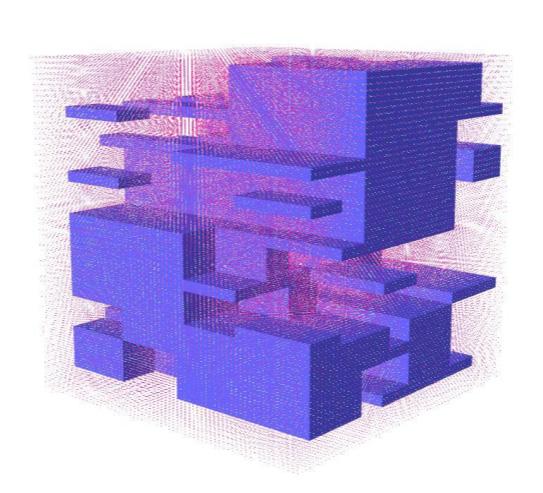
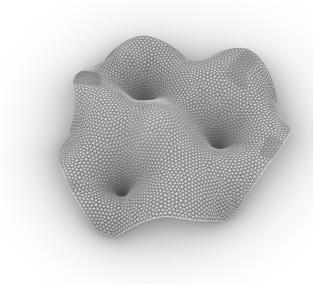
As the evolutionary direction moves closer to the fitness goal, in the last few generation results(for example generation199). The shape of each prototype is closer together, forming a similar cocoon shape. At same time, the material consumables and structural stability are optimized compared to the original generation results.
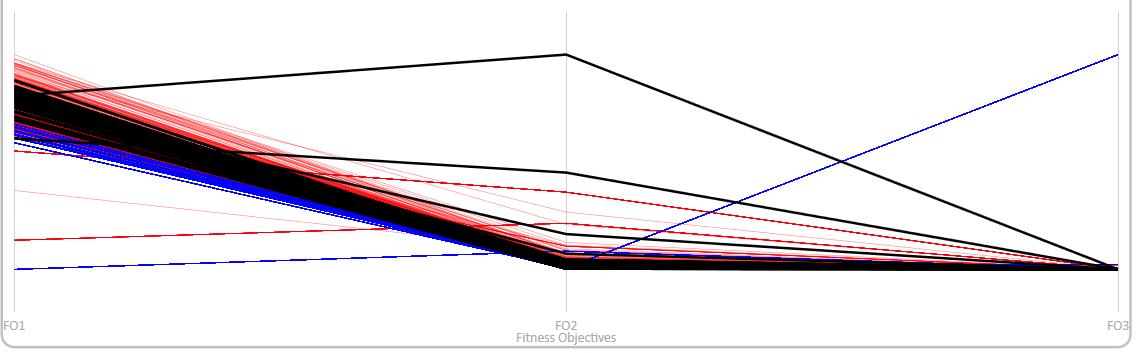

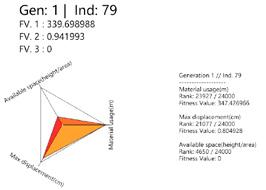
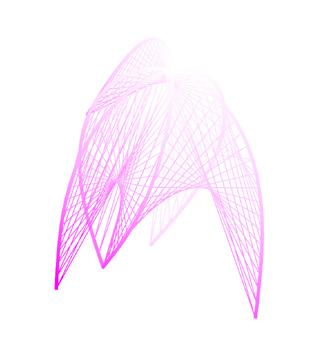
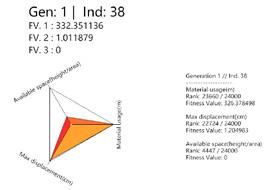
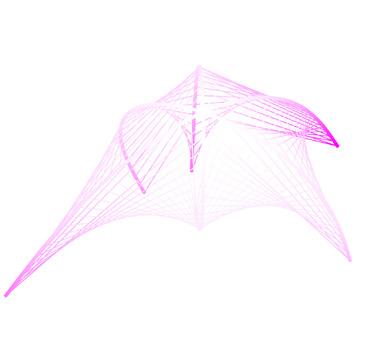
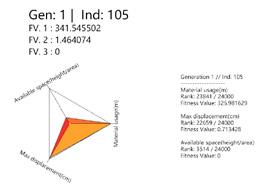
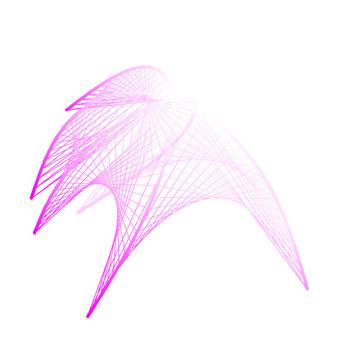
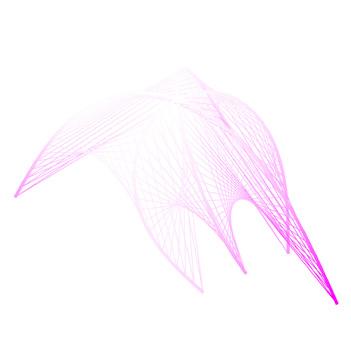
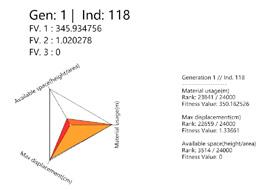
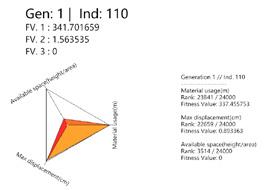
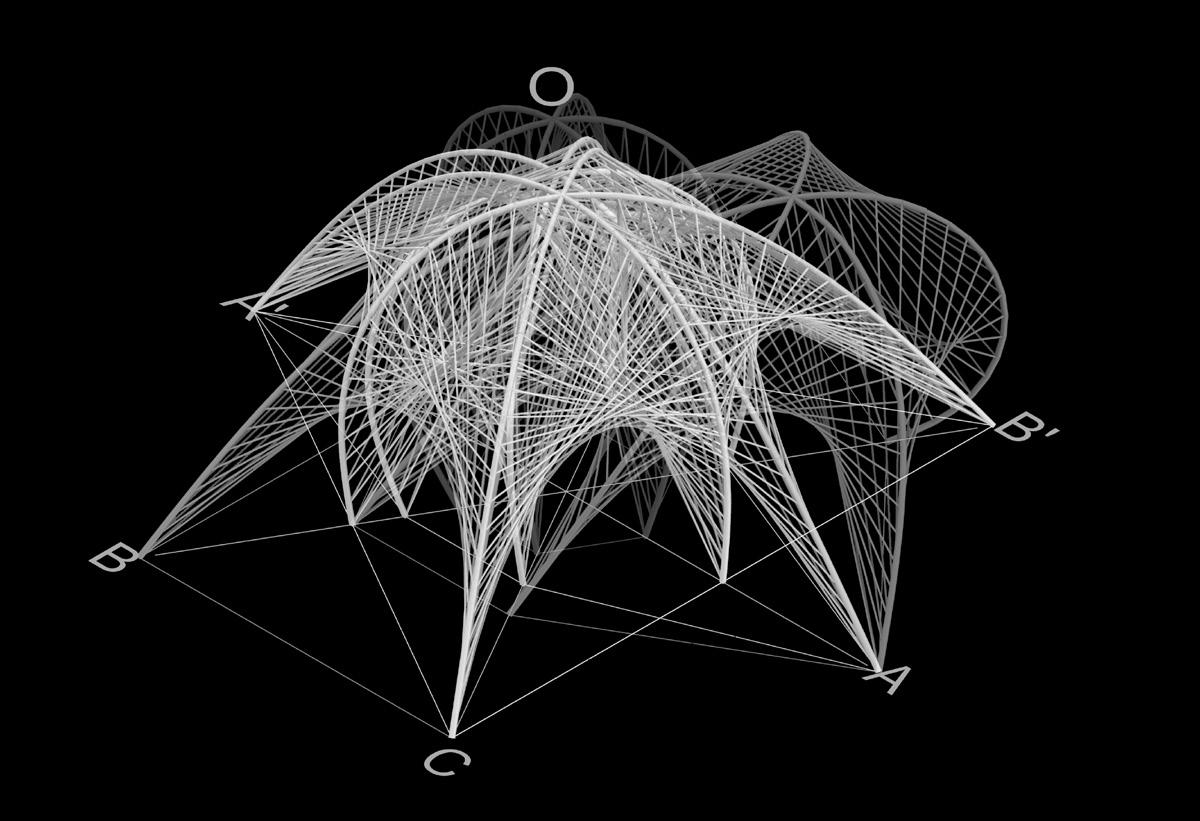
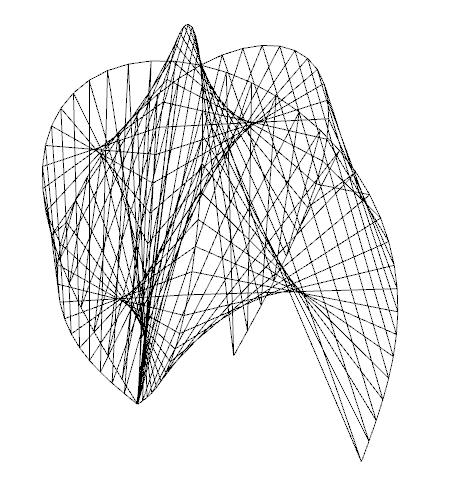
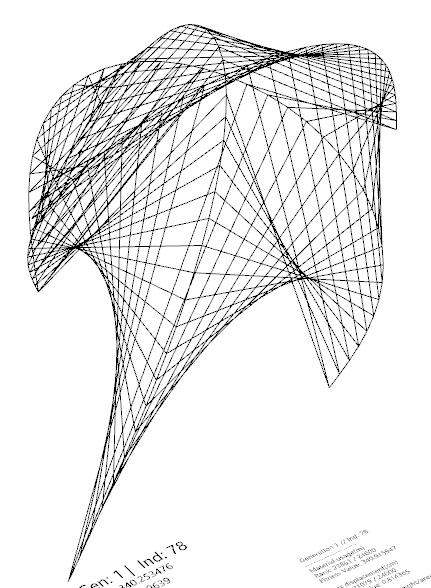
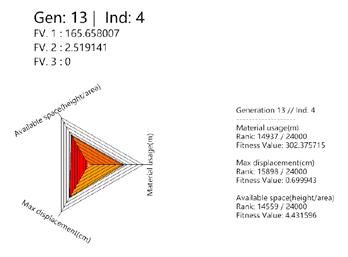
By observing the first few generation results, for example, in generation01 results, the shape of the prototype is closer to an exaggerated form. In these cases the value of the material consumables and the structural displacement are relatively large.
After 24thousands of iterations, the final generated results will gradually meet our ideal results.
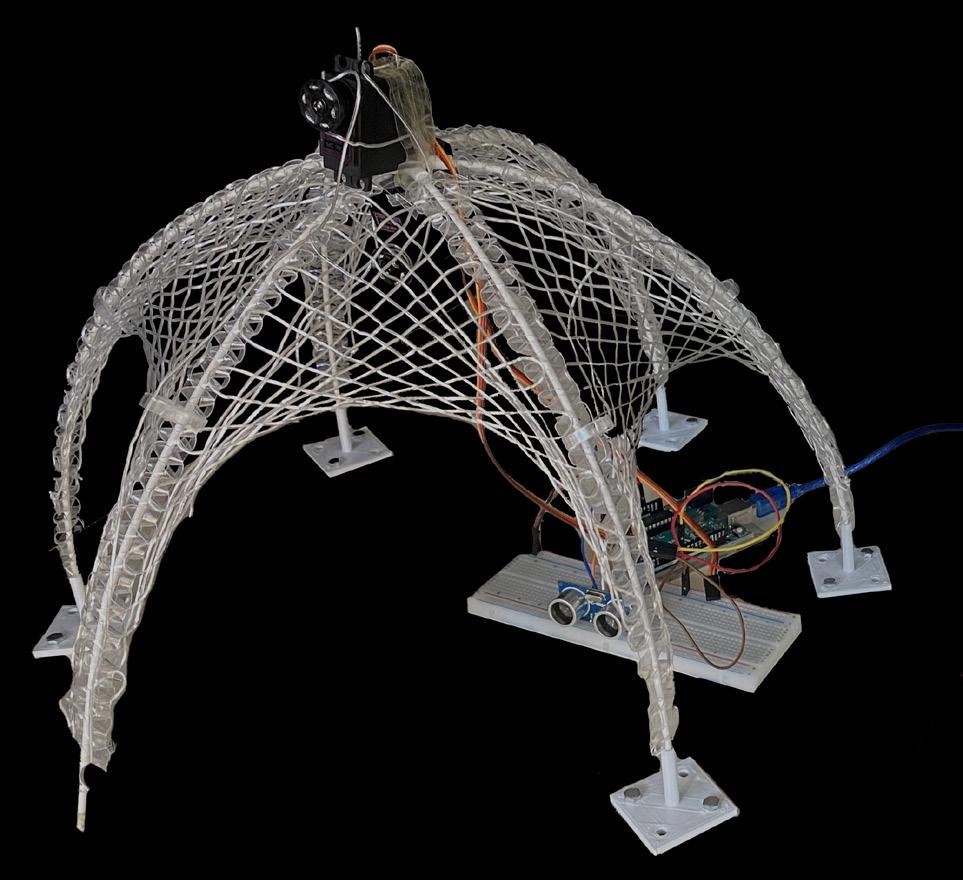
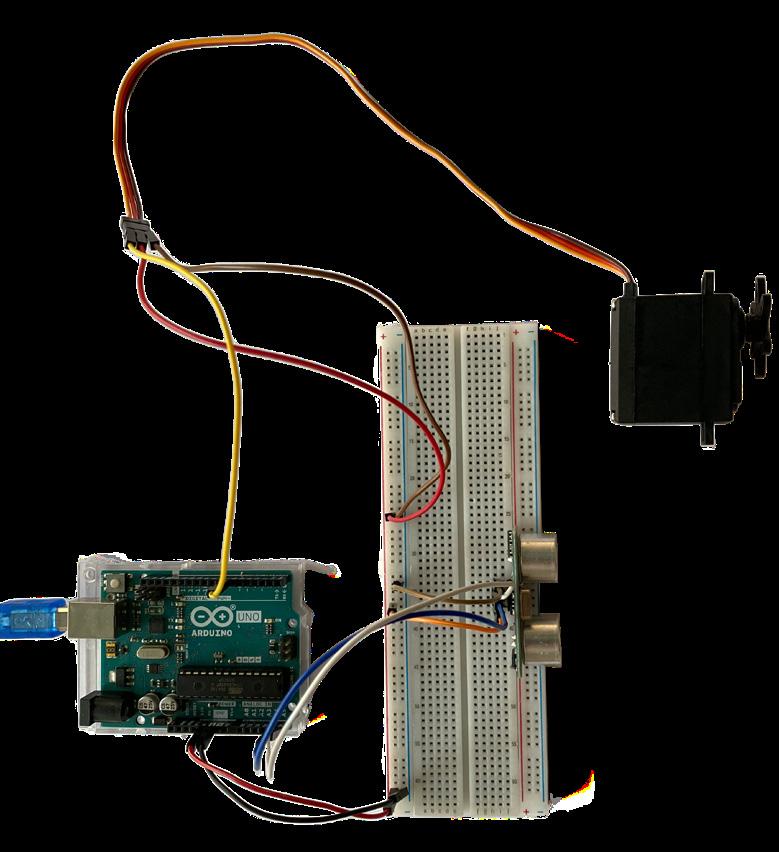


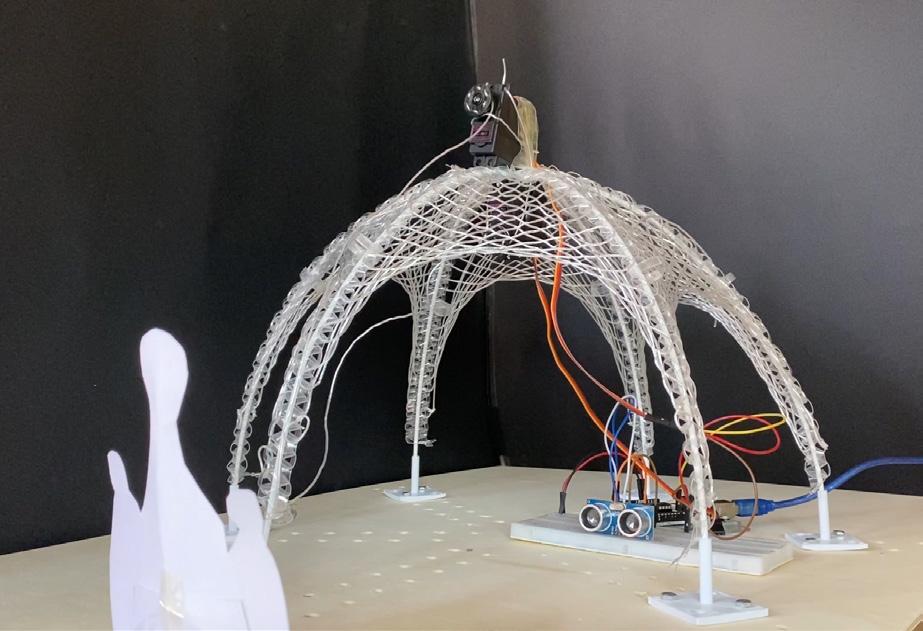
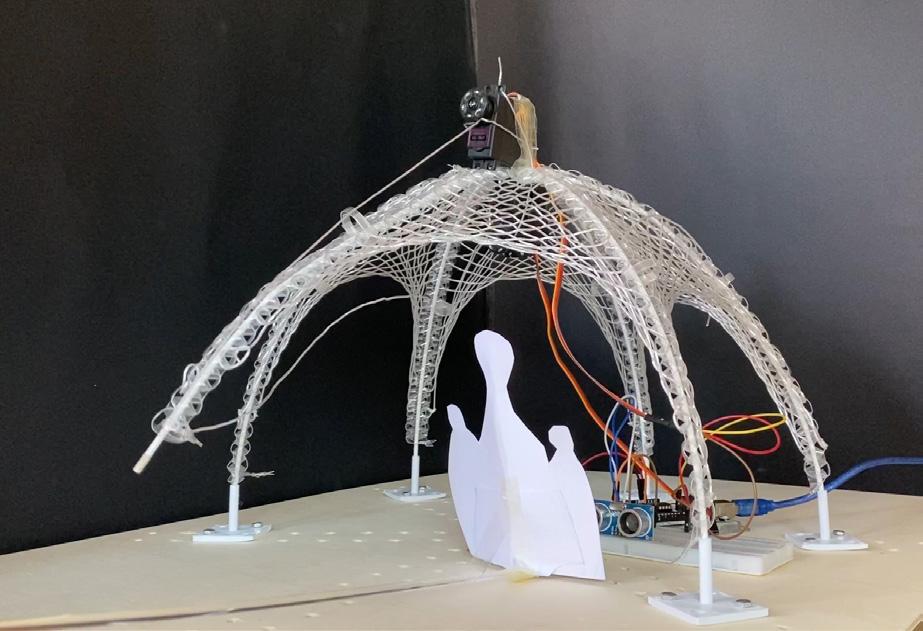
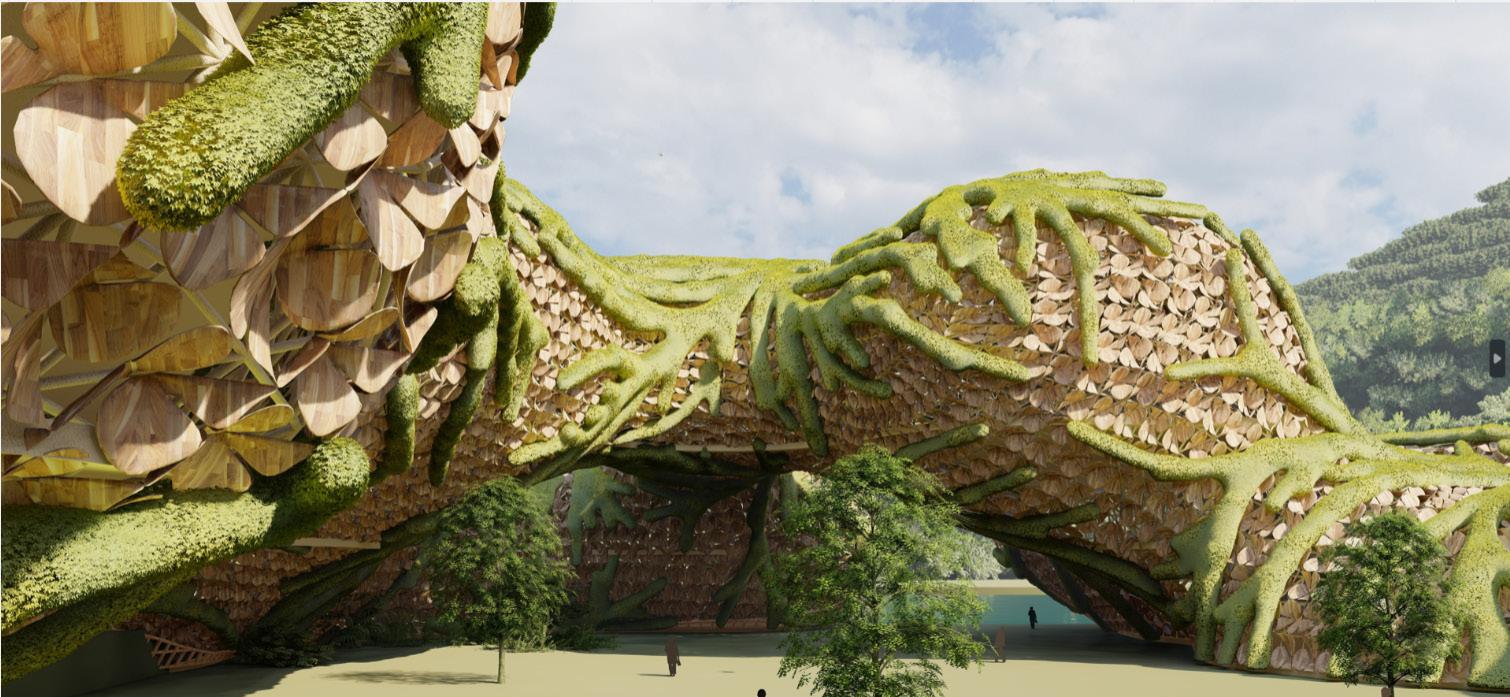
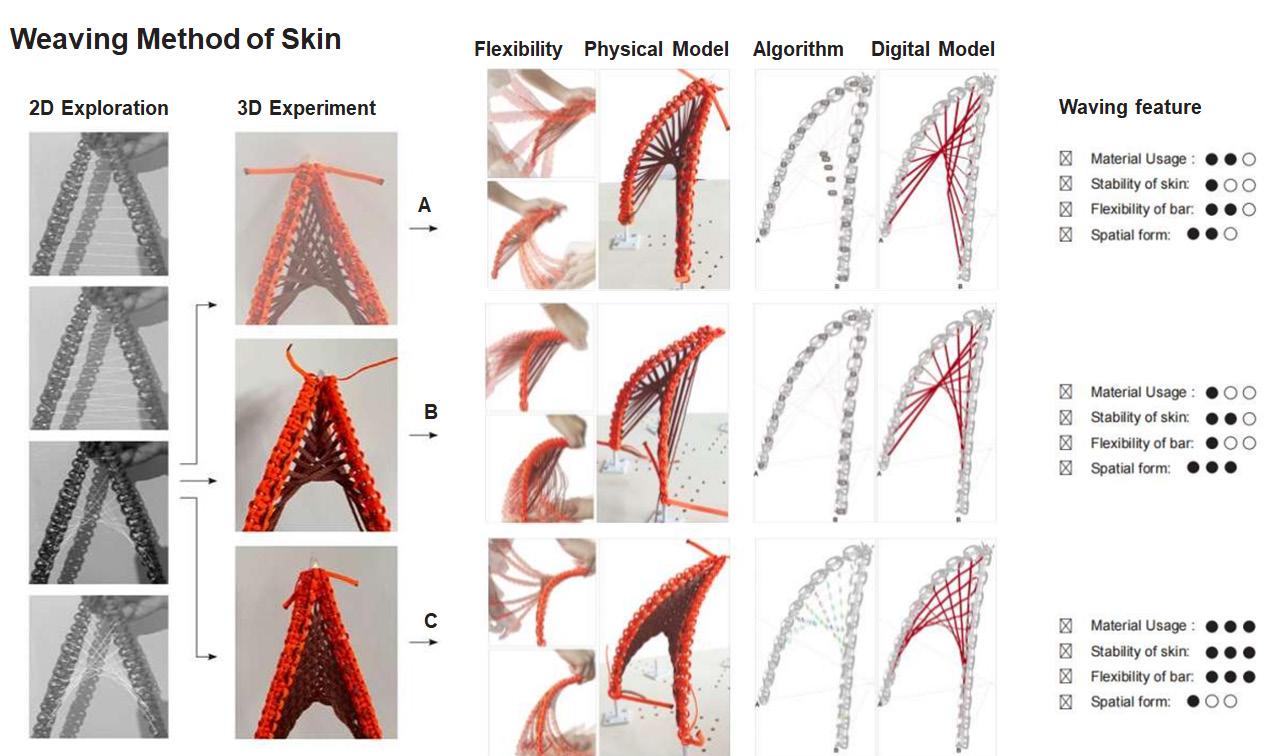
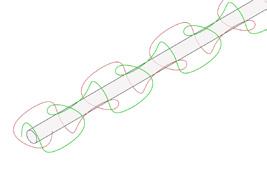
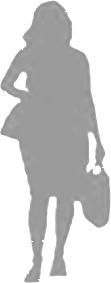
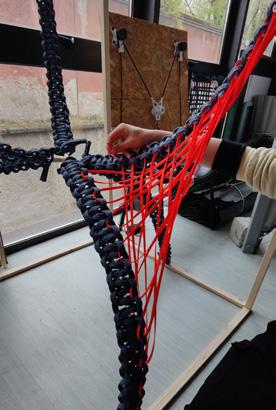
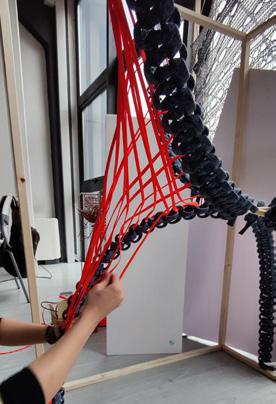
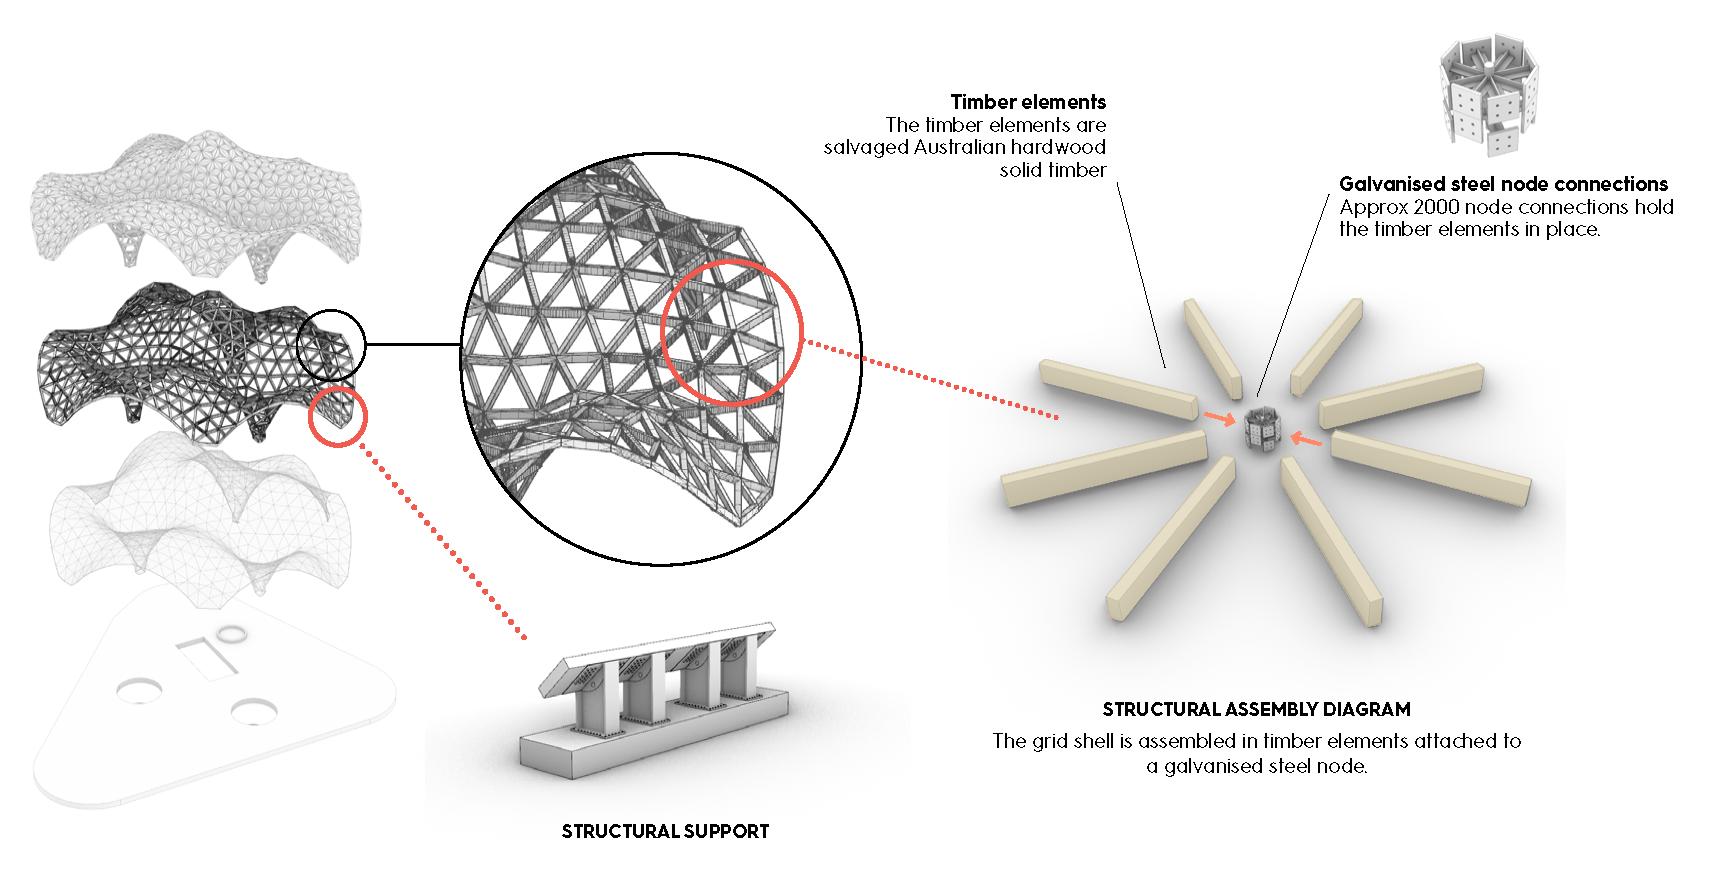
Pons: high flexibility and interactive potential
Cons: not stable enough
Application: dynamic interactive system
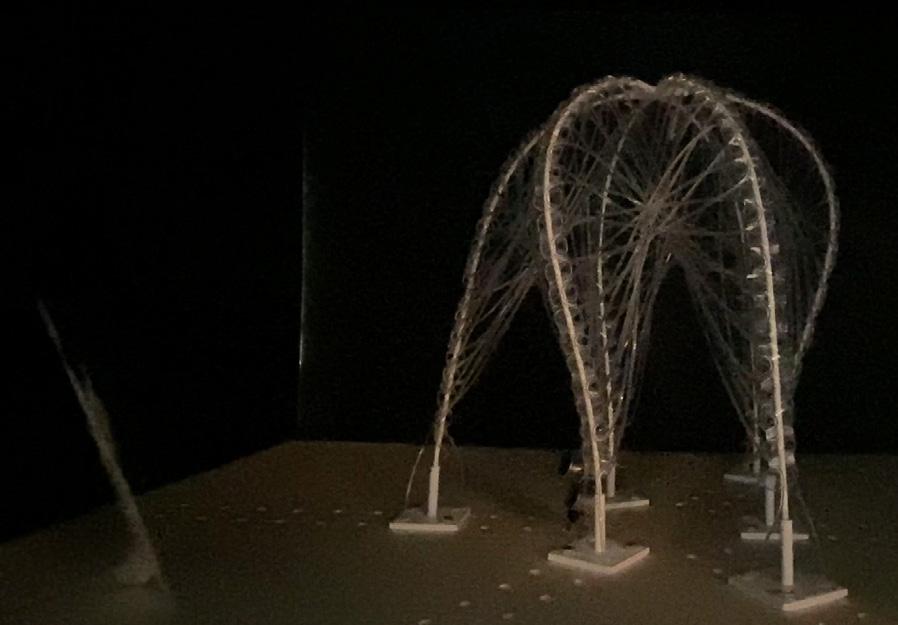
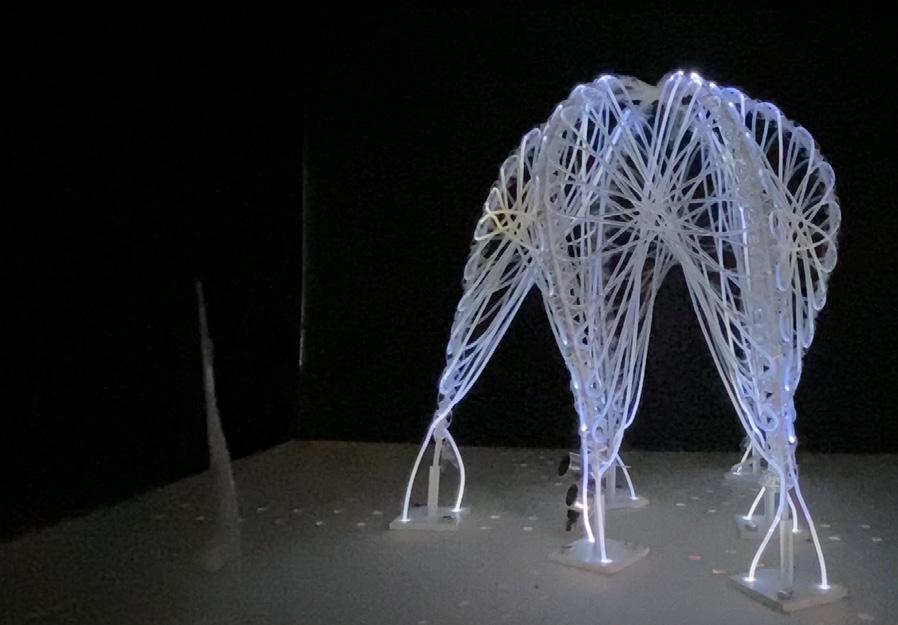
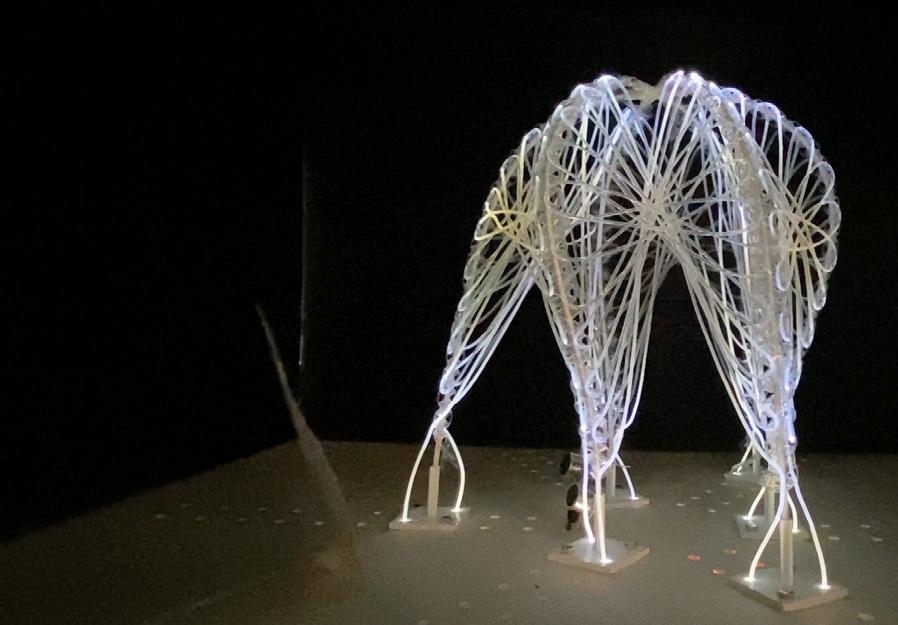
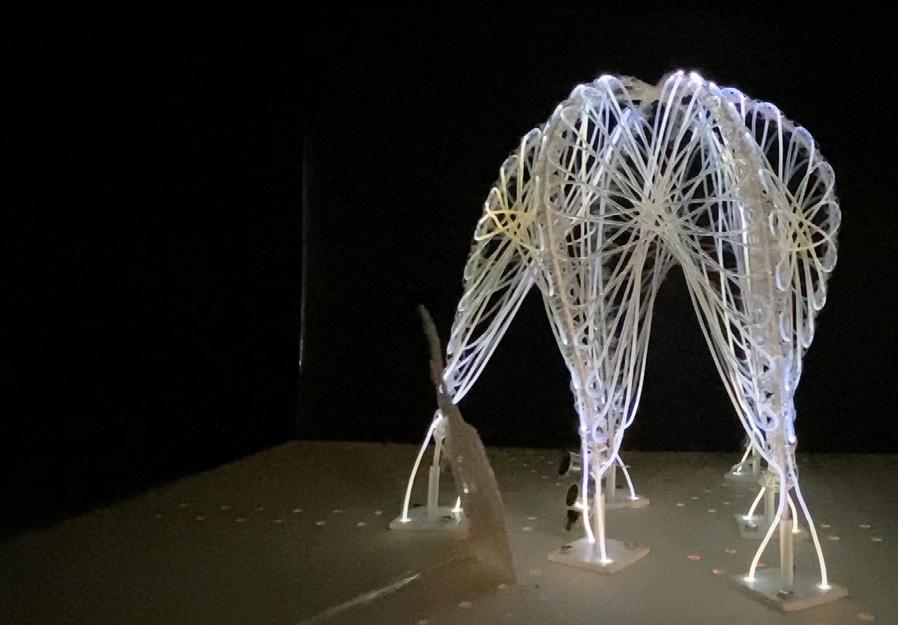
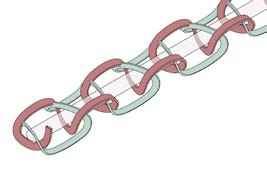
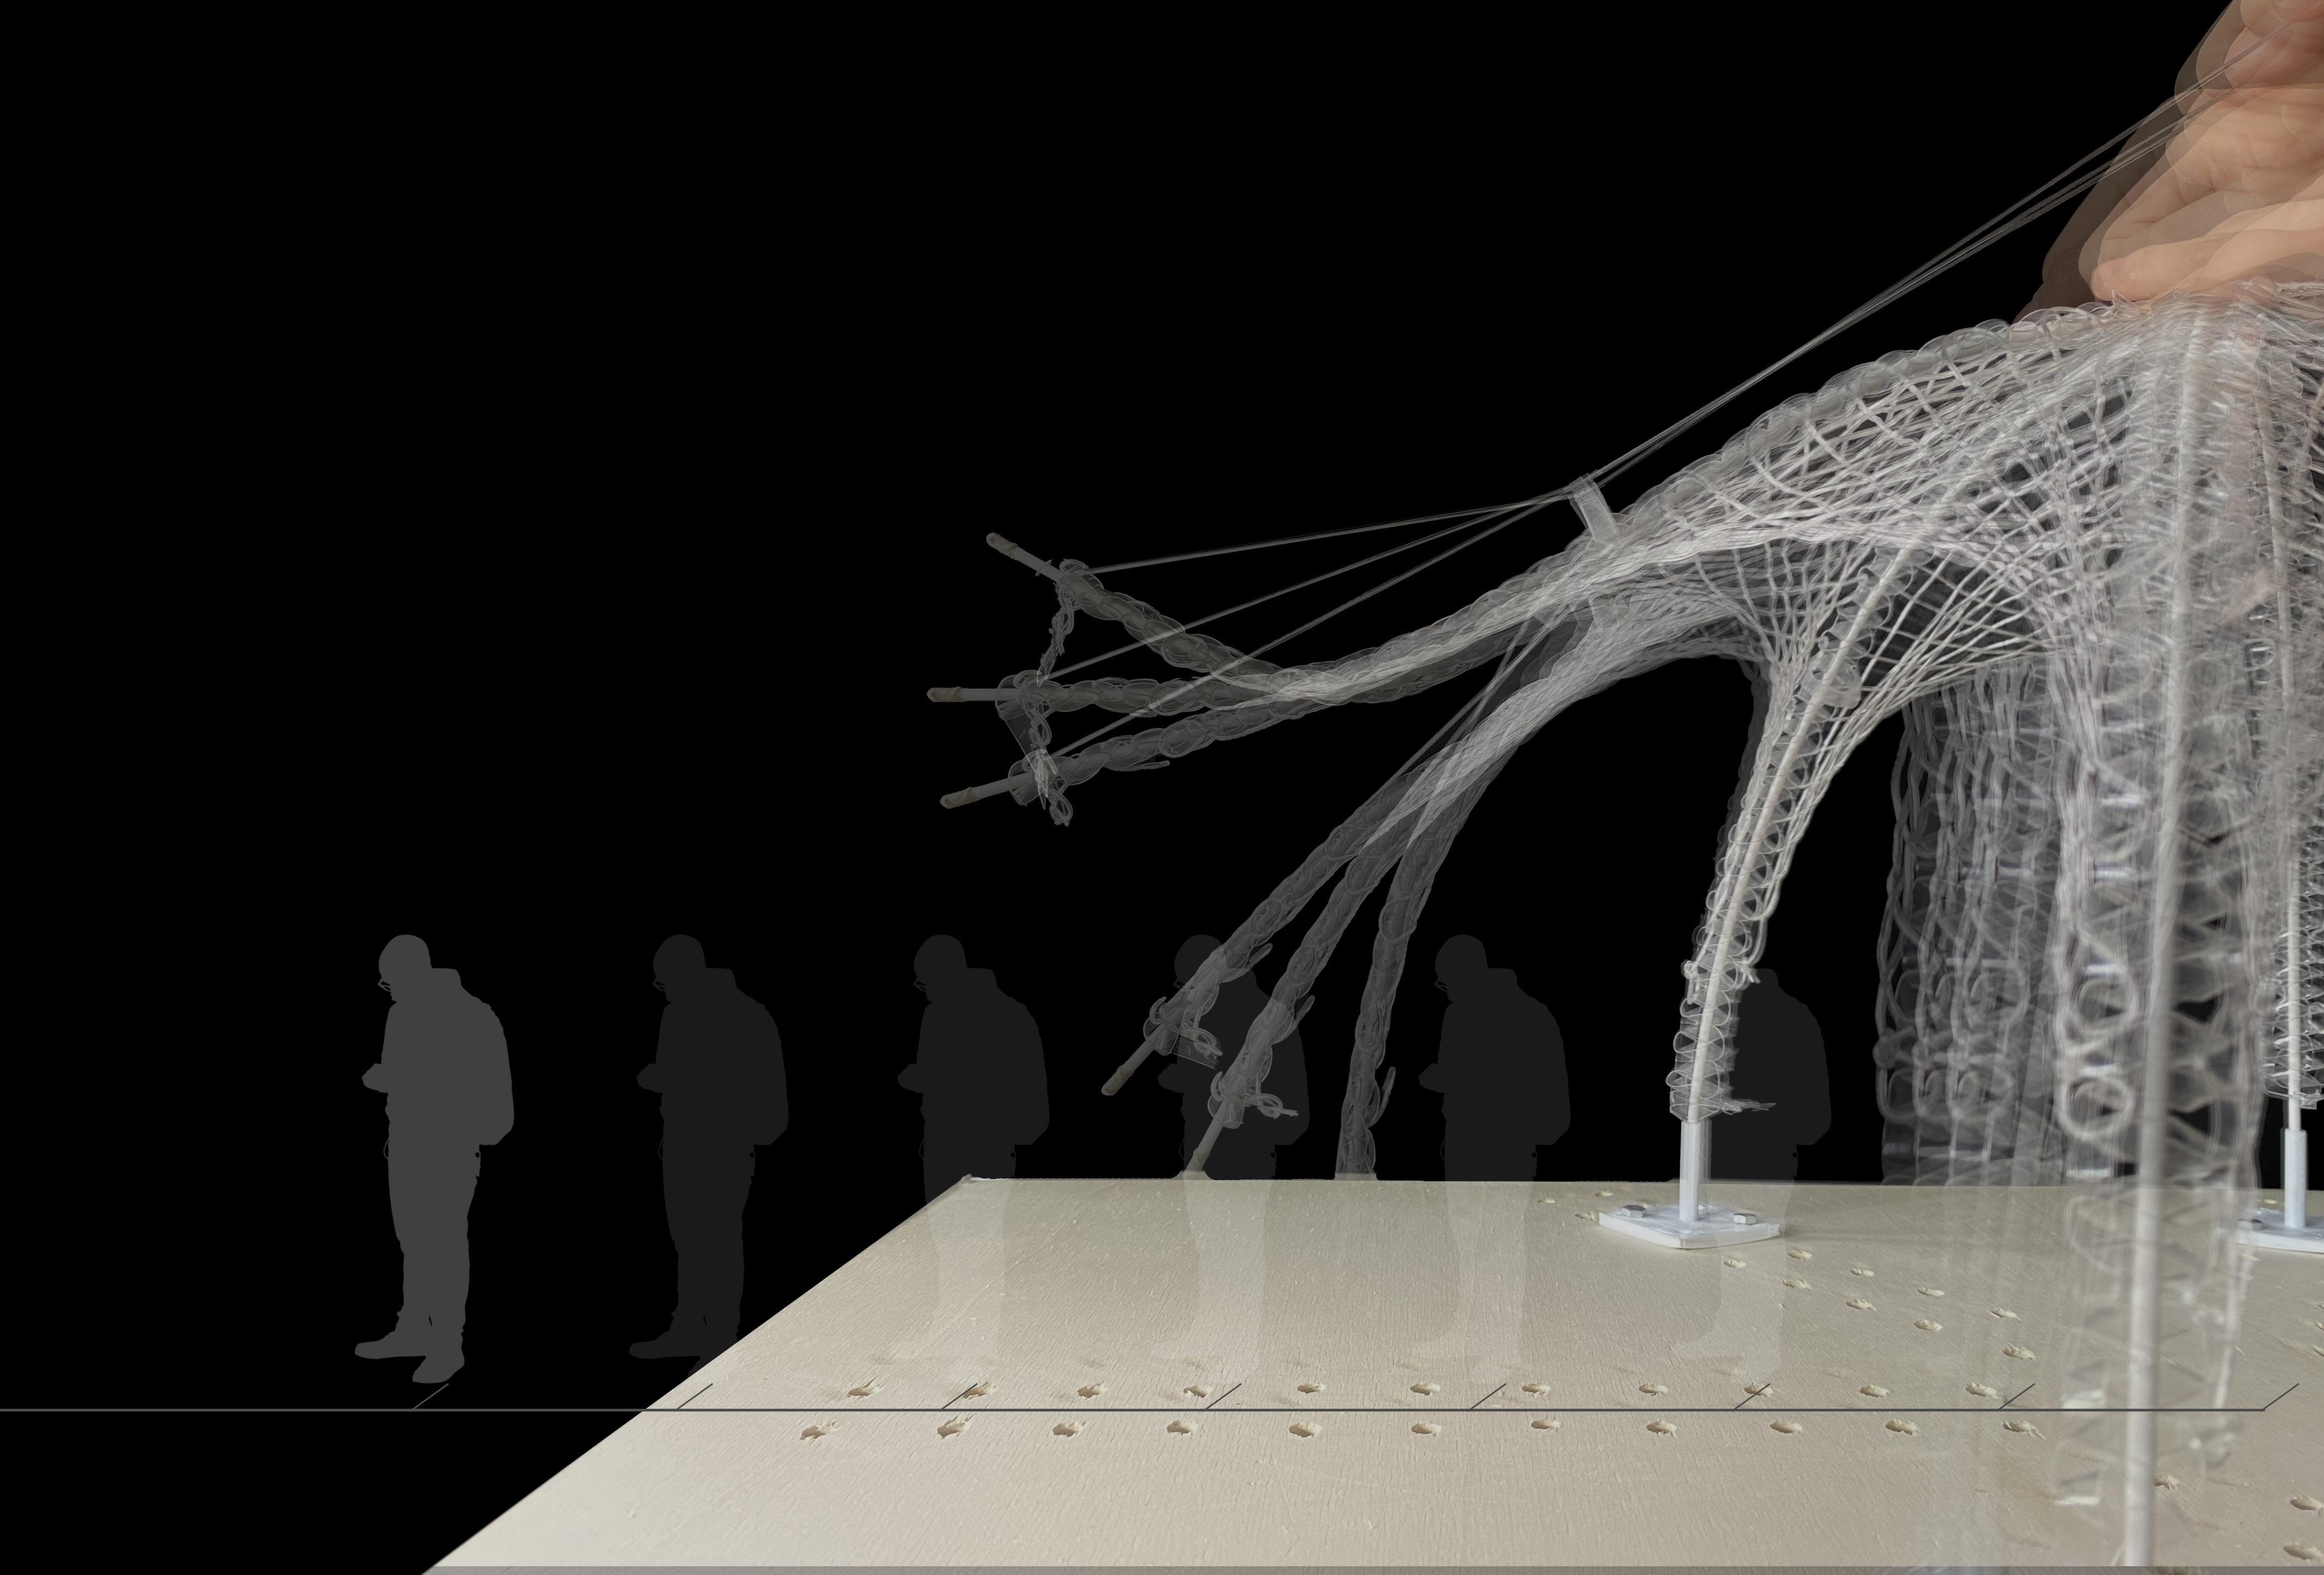
Pons: more stable, can be customized
Cons: the shape cannot be changed after assembly
Application: lighting interactive system


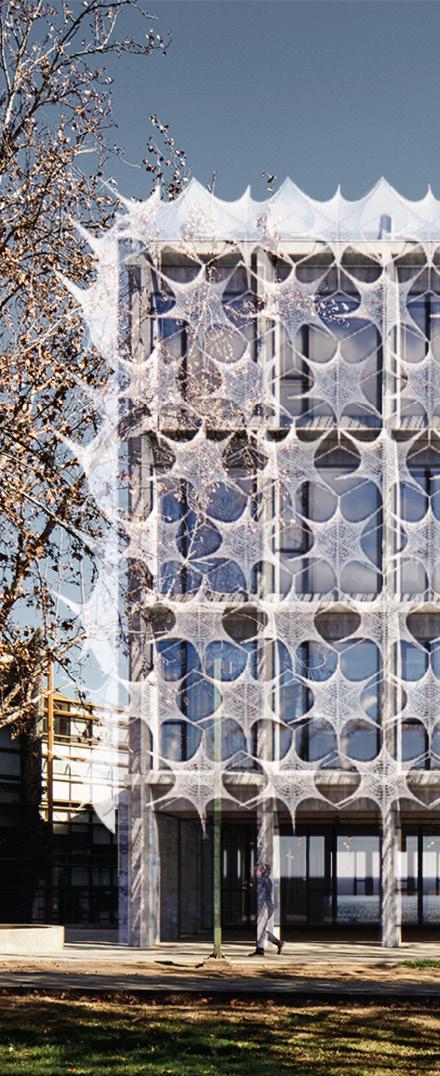
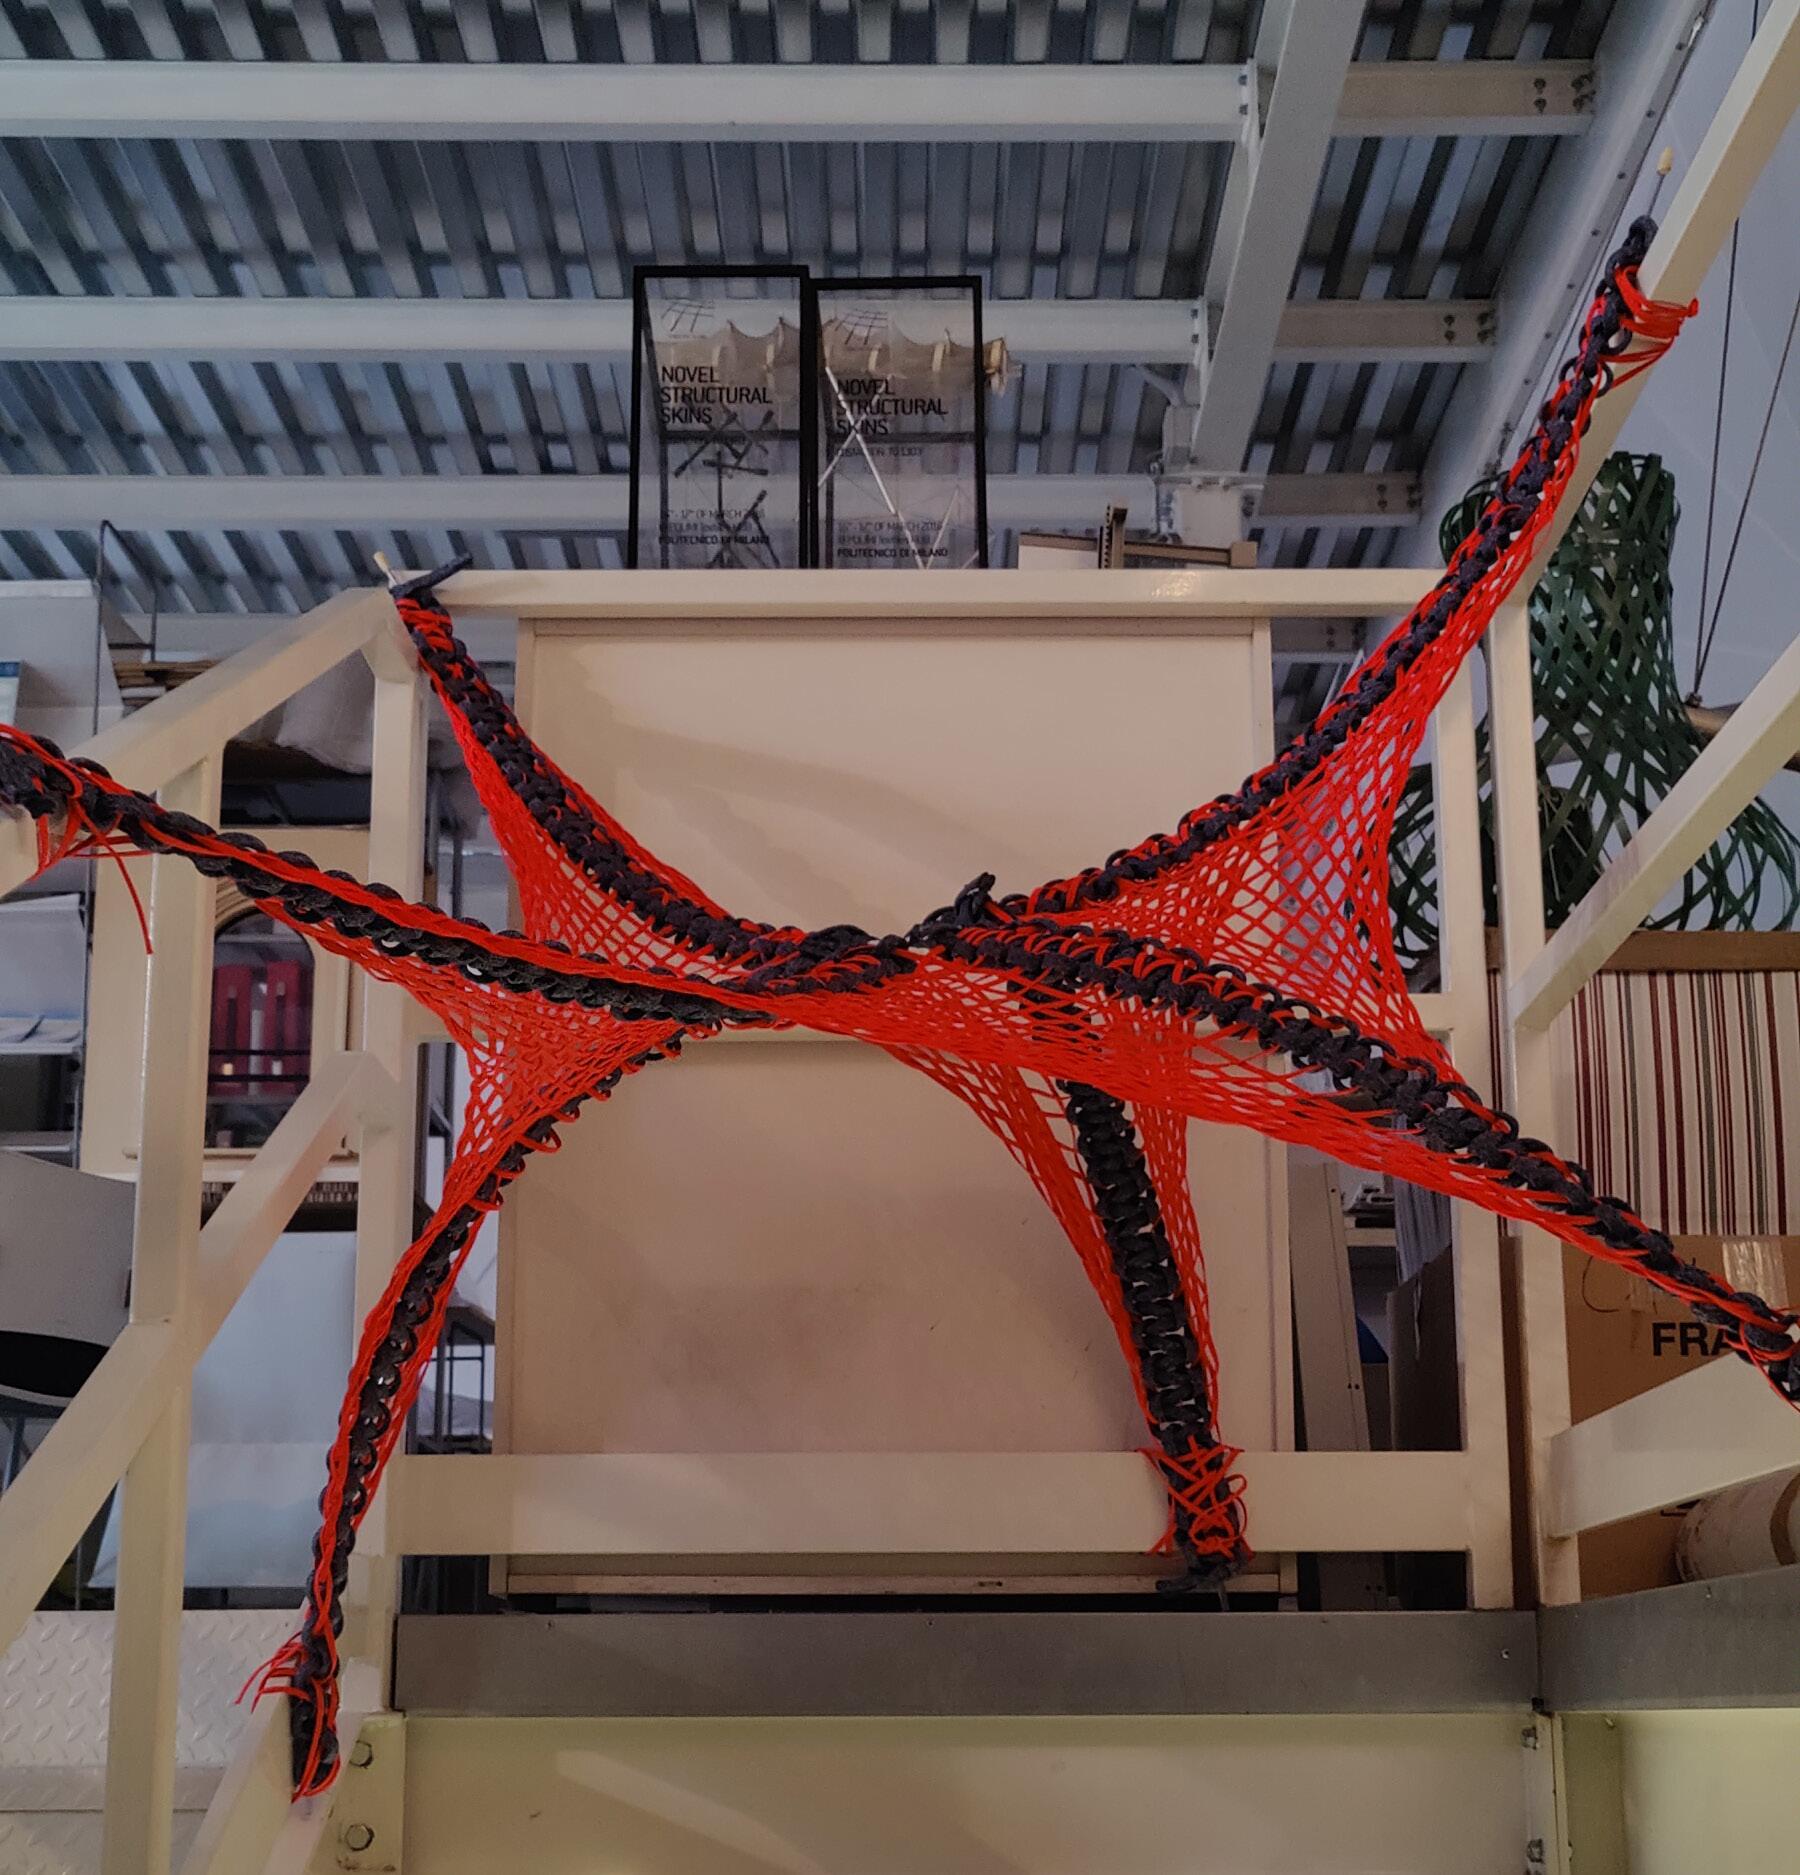
Kinetic Textile Facade exampled with the case Pedagogy in Secondary Education School


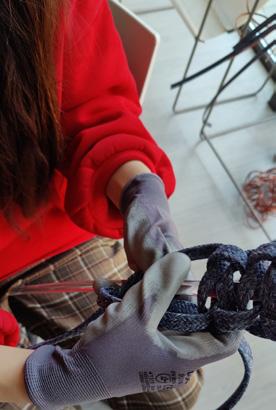
Assembling
Customer Requirement
Assembling according to Guidebook 1
Material use cost and "Weaving Octopus" Guidebook 1
Assembling according to Guidebook 2
Assembling
Disassembling Disassembling
Assembling

Assembling according to Guidebook 3 Disassembling


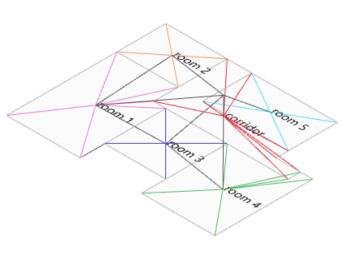
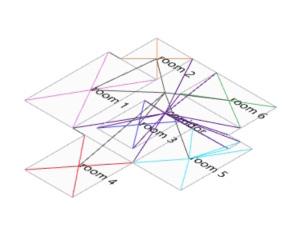
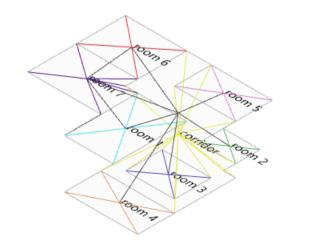
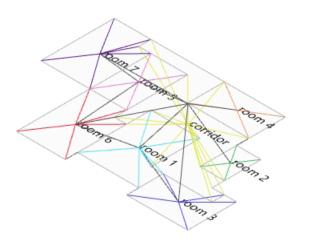
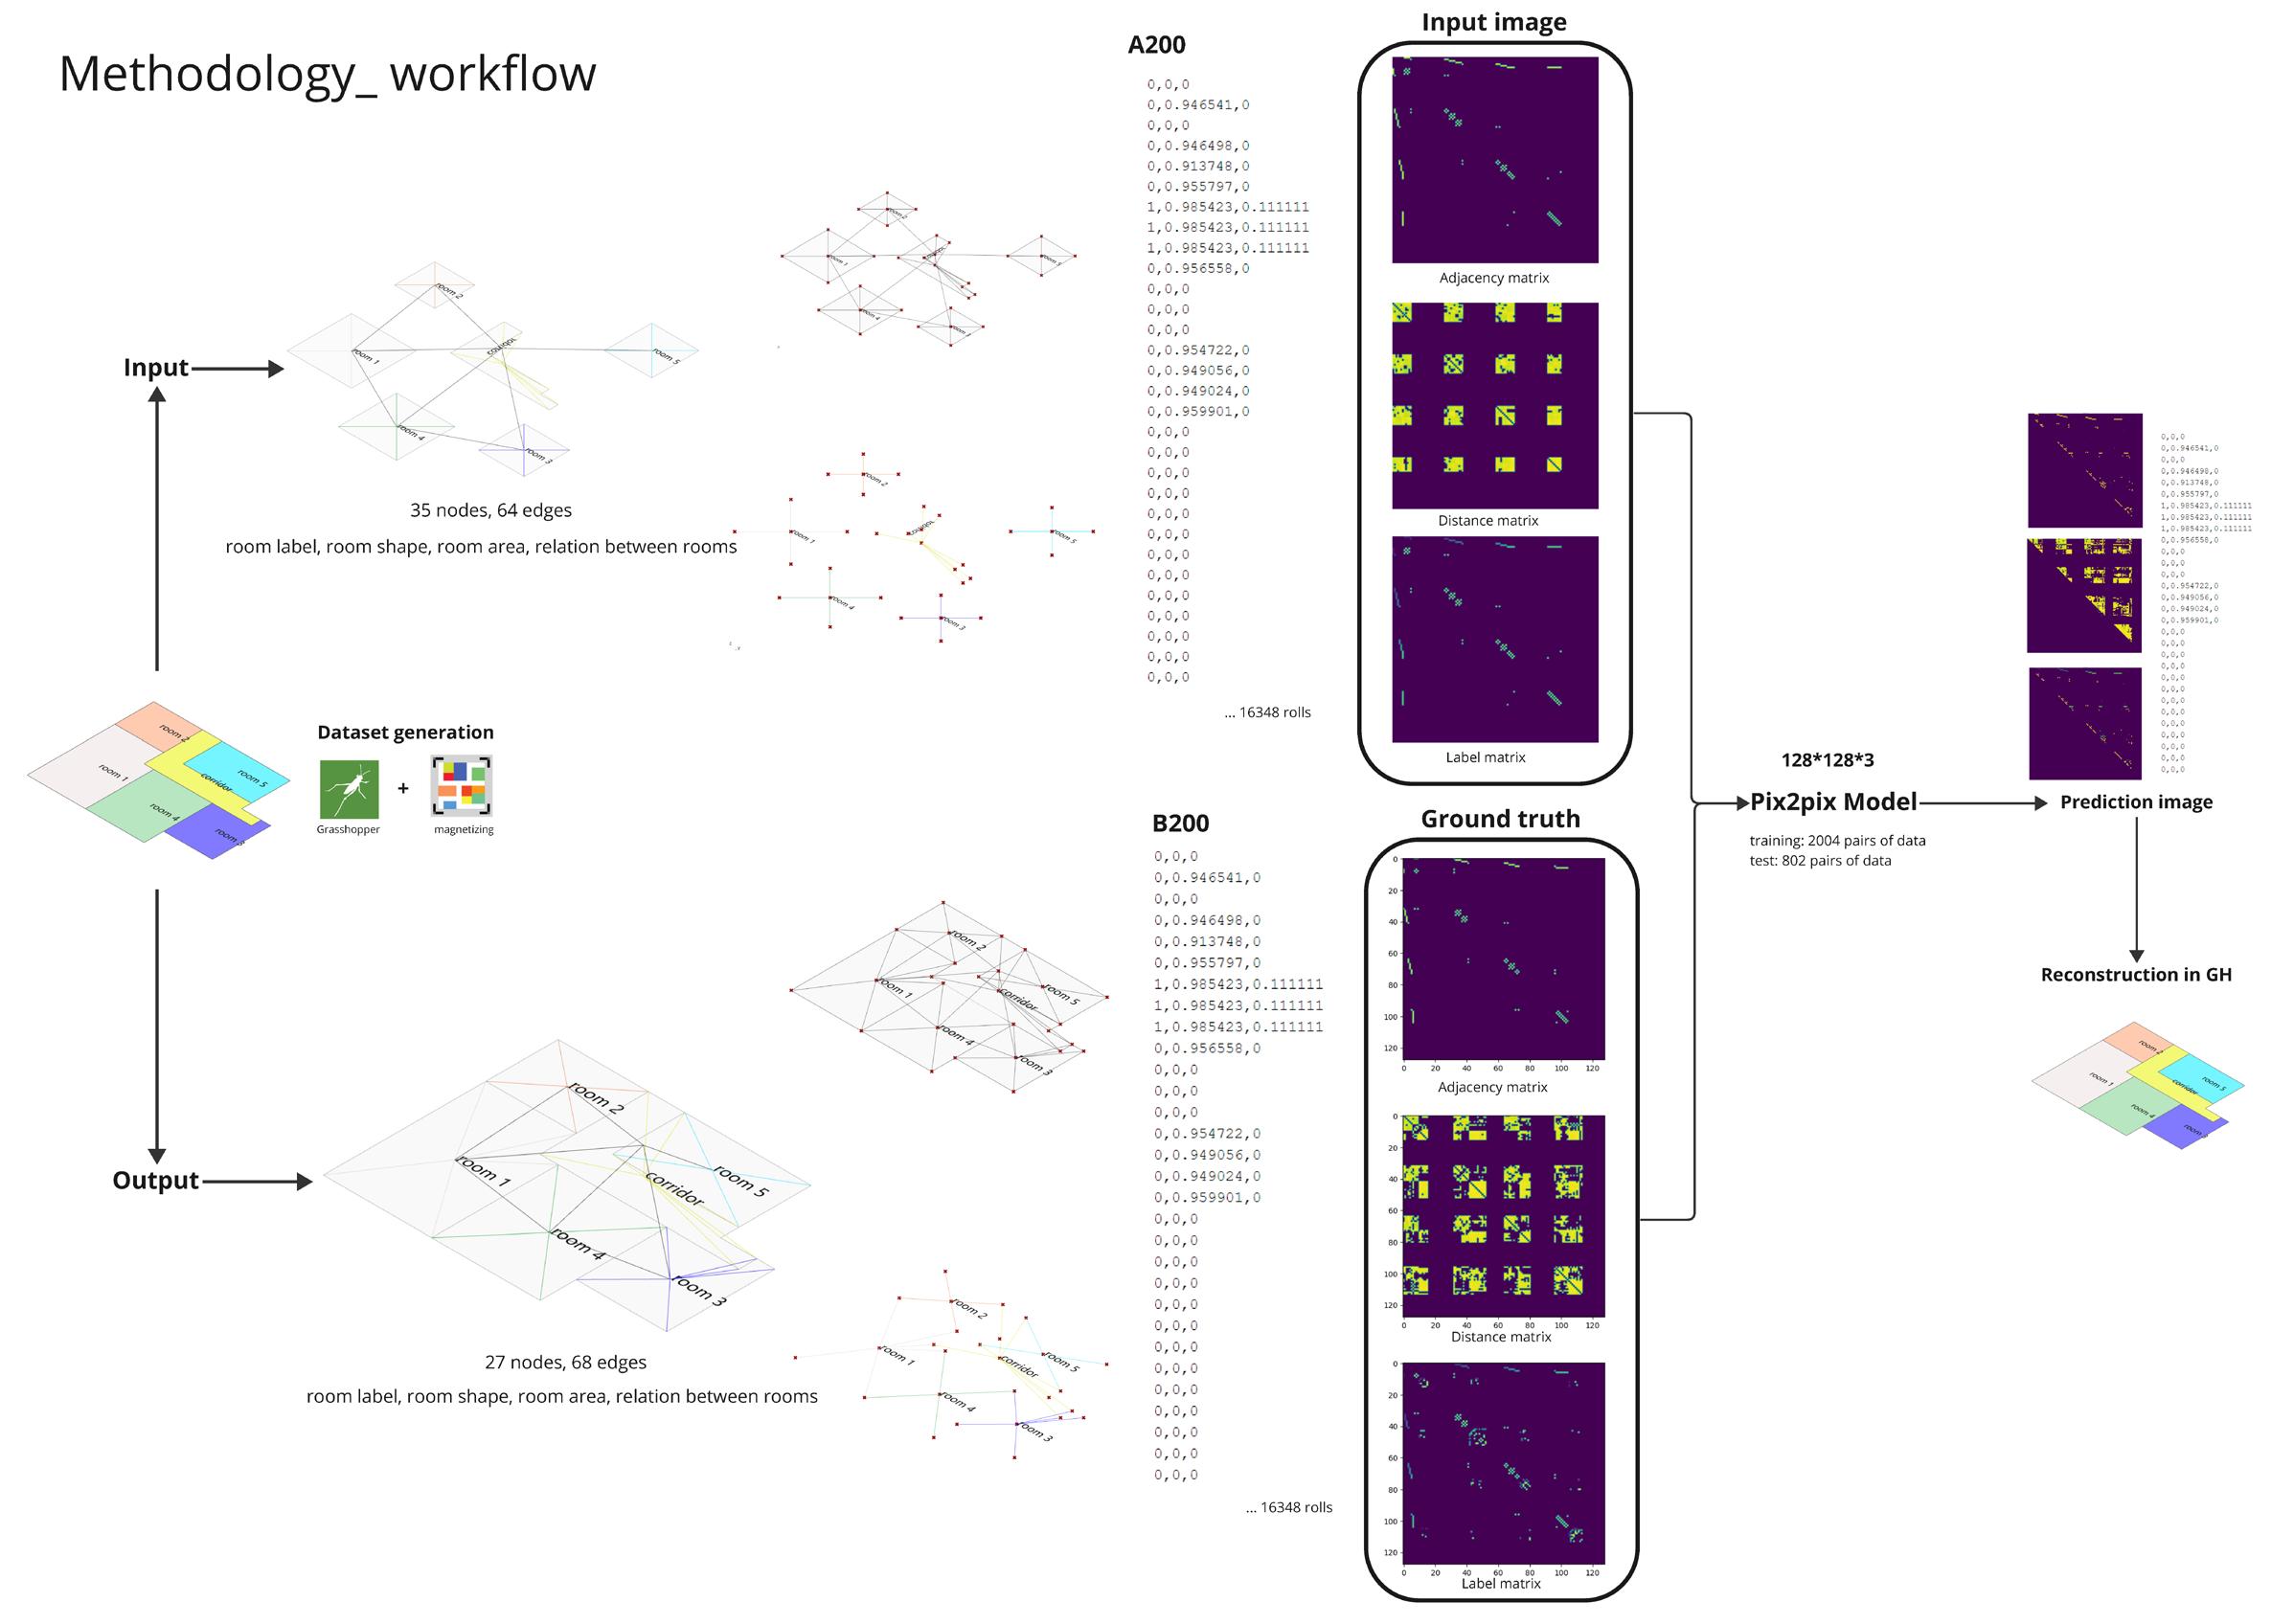
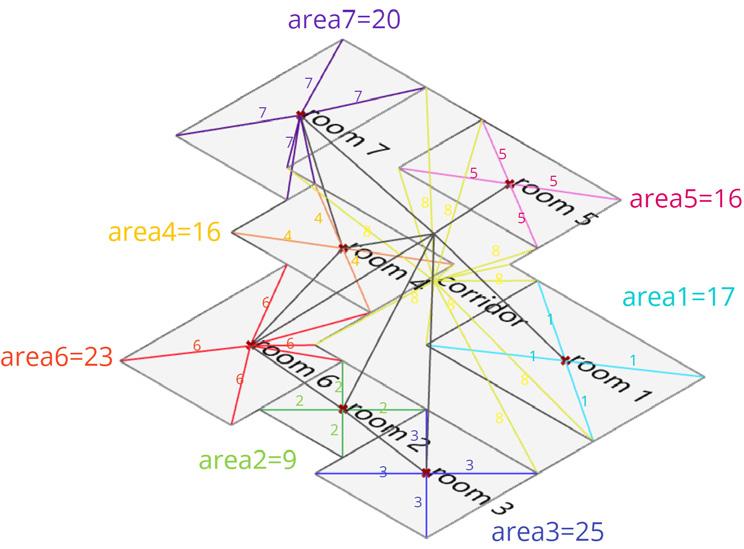
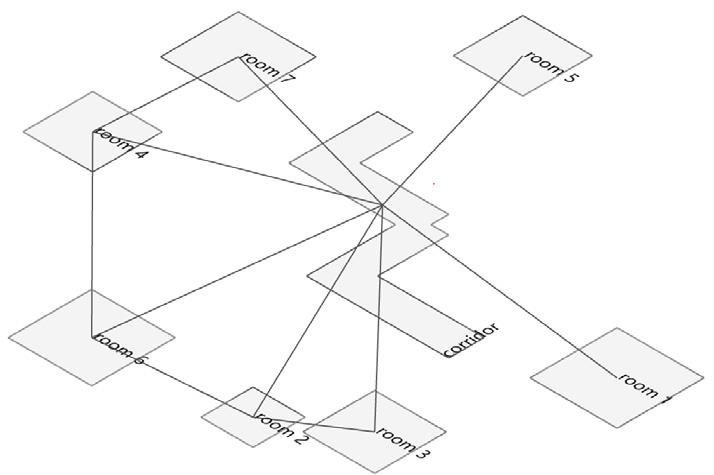
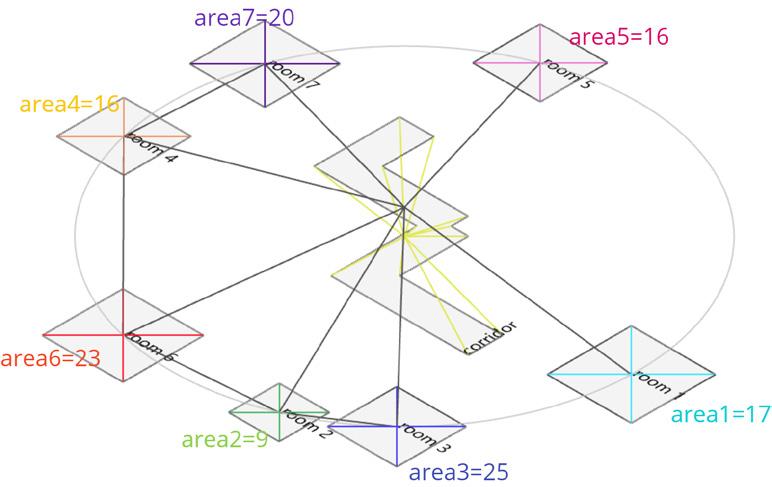
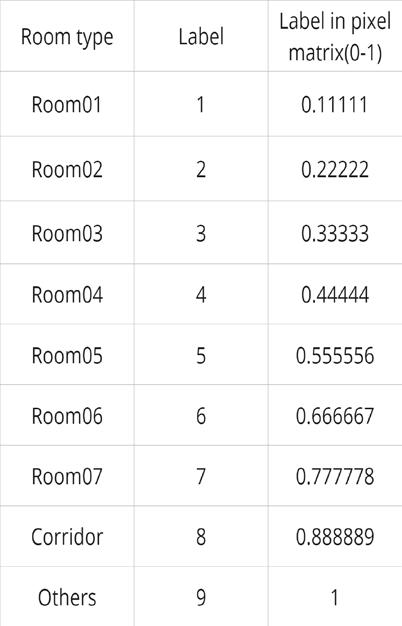
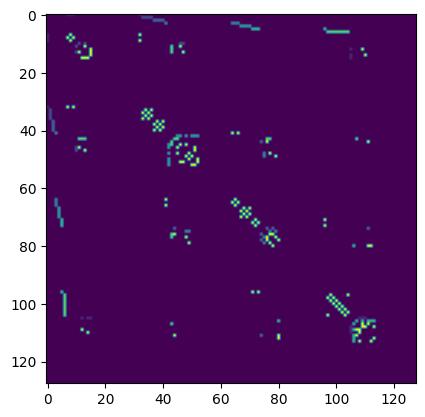
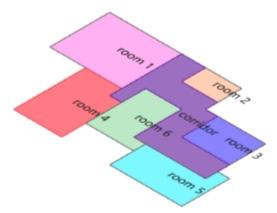
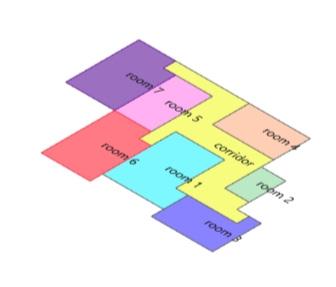
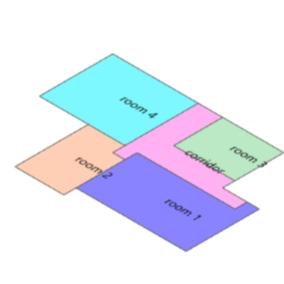
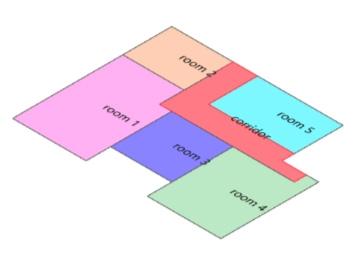
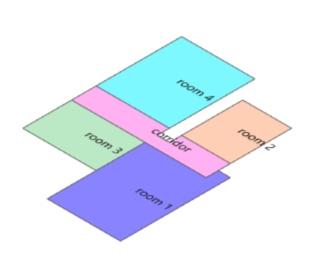
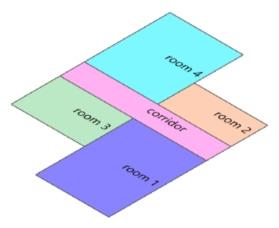
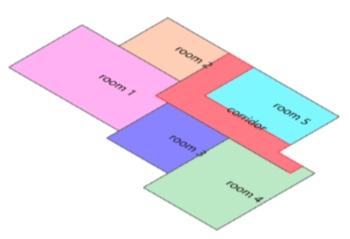
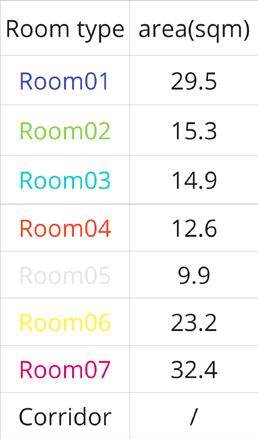
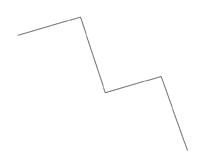
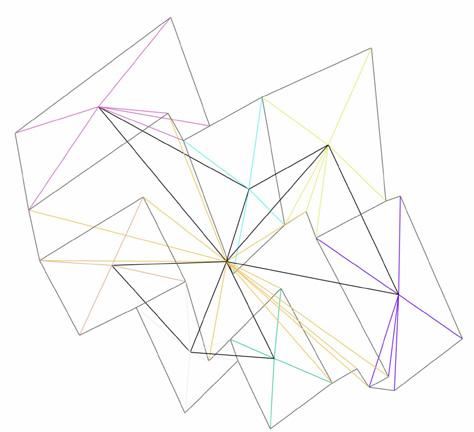
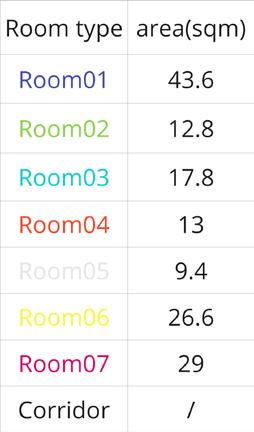
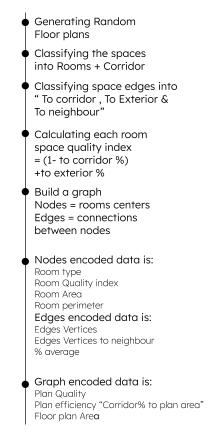
GAN-based floor plan generator
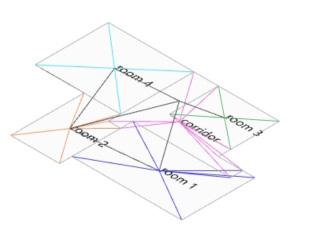
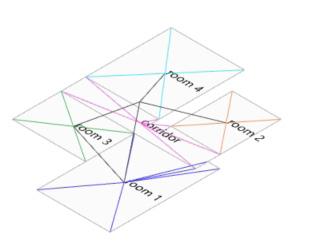
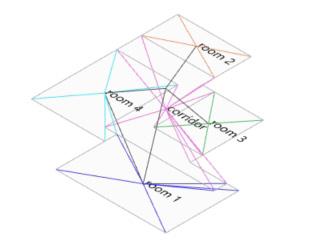
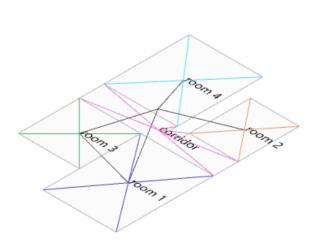
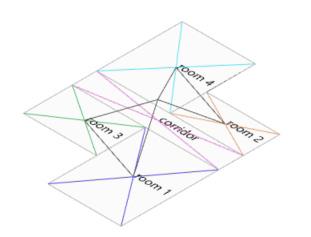
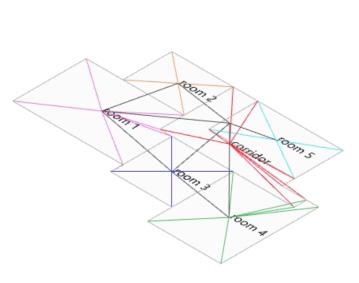

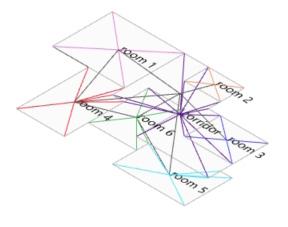
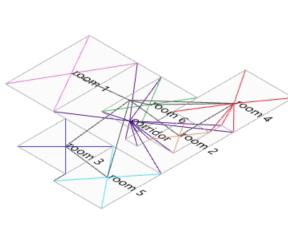
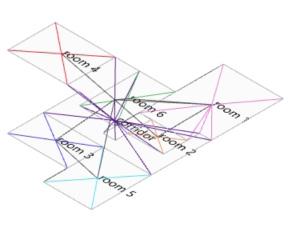
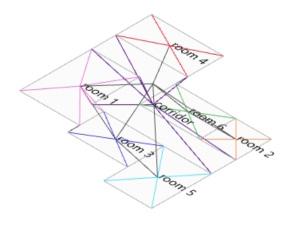
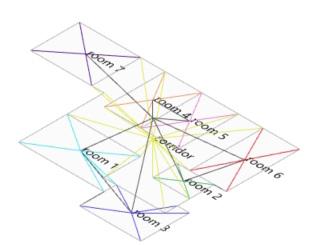
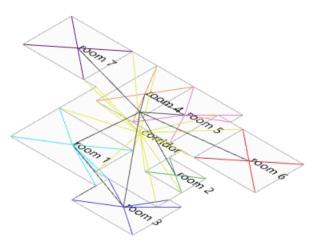
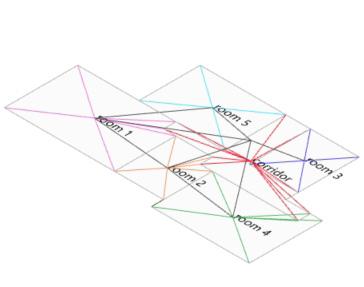
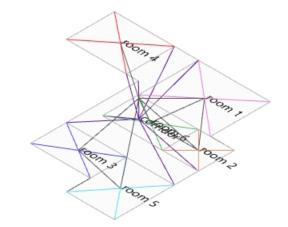
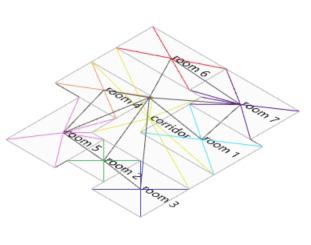
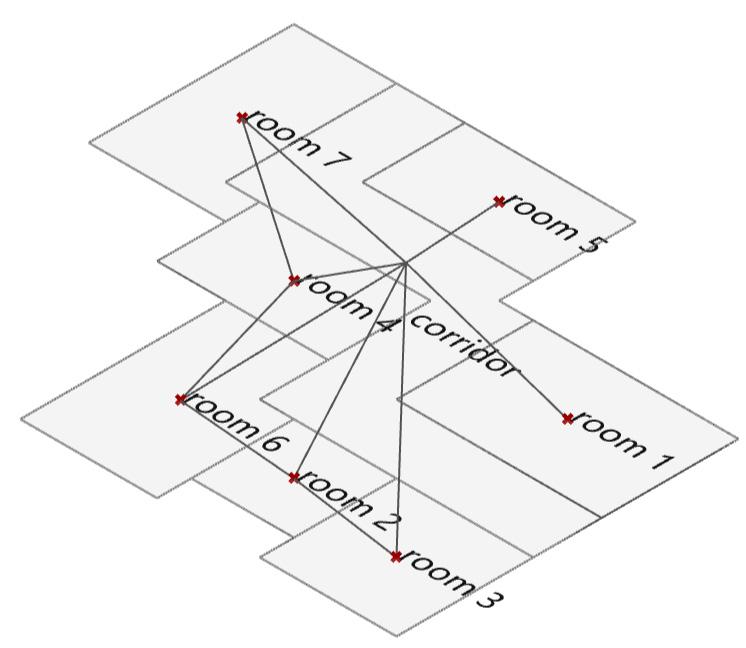

It


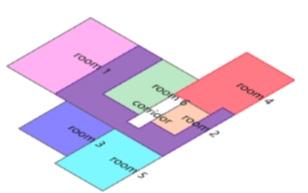
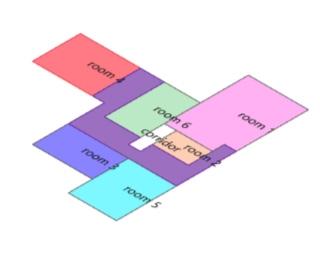
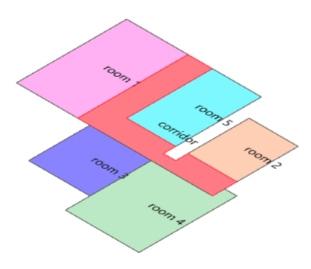
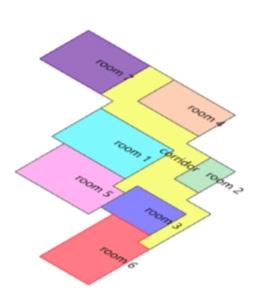
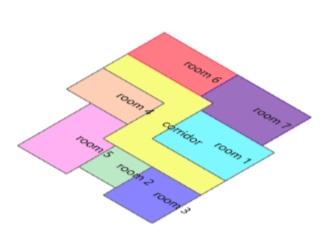
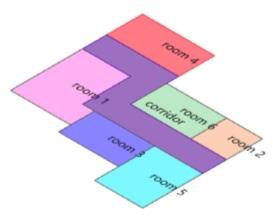
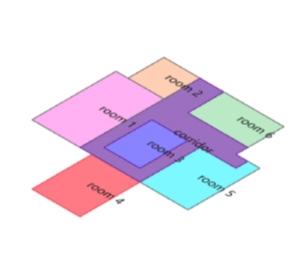
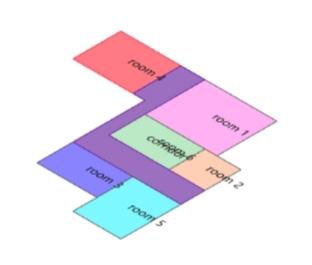
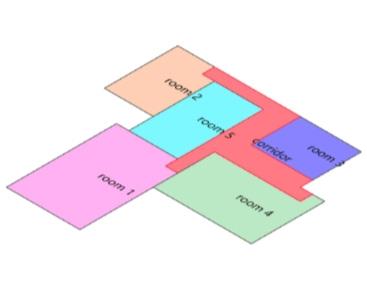
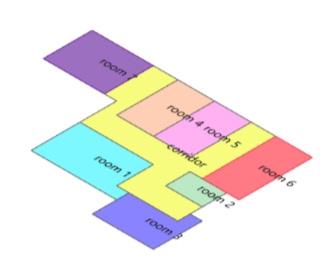
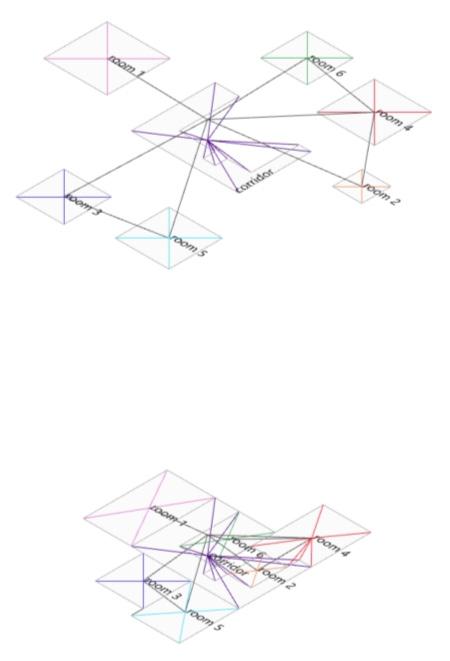
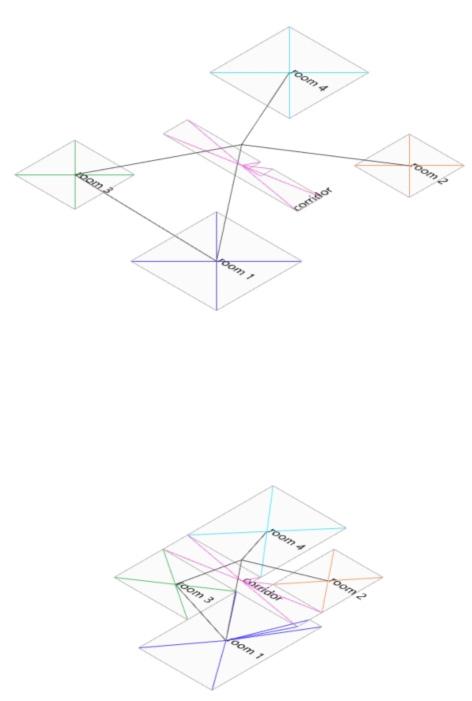
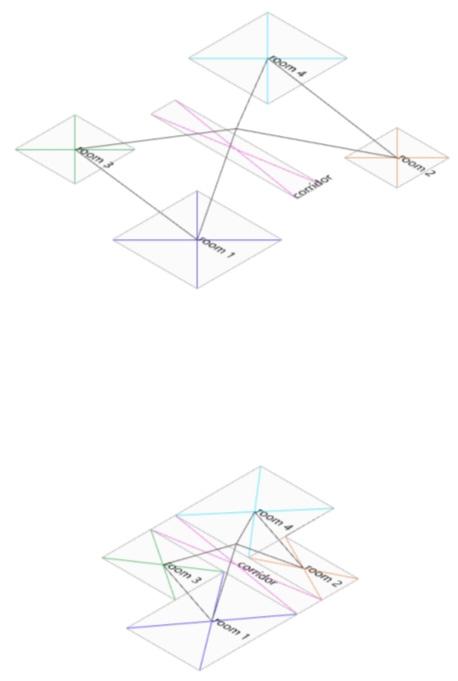
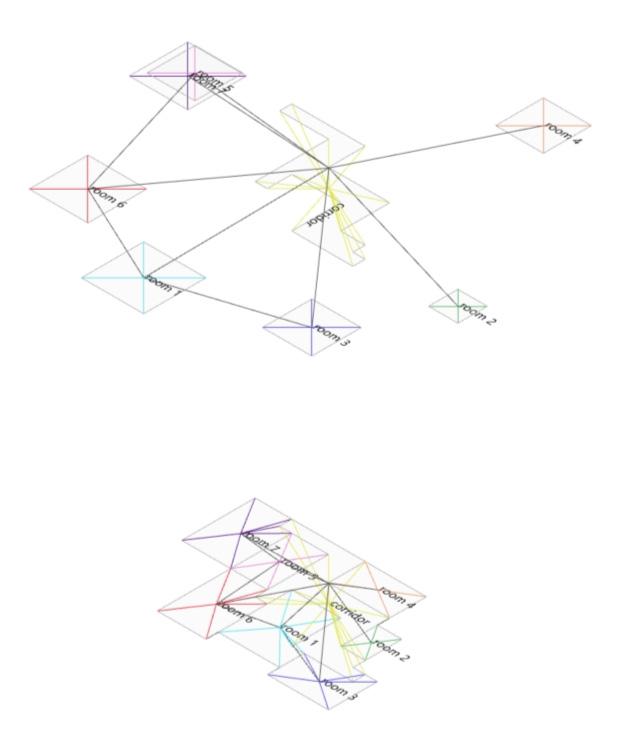
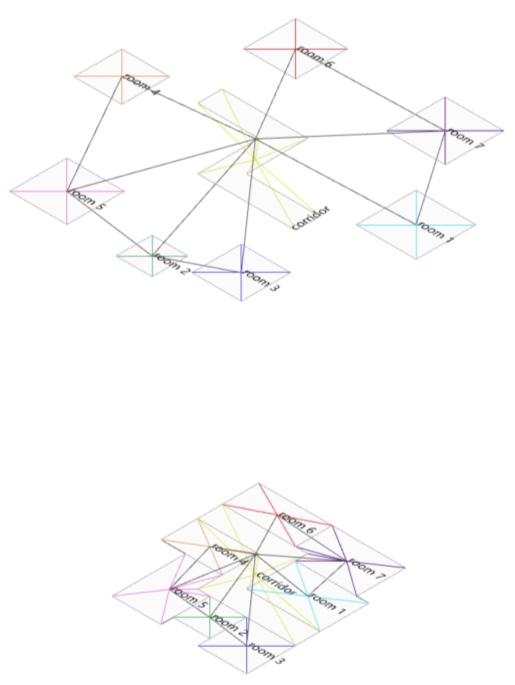
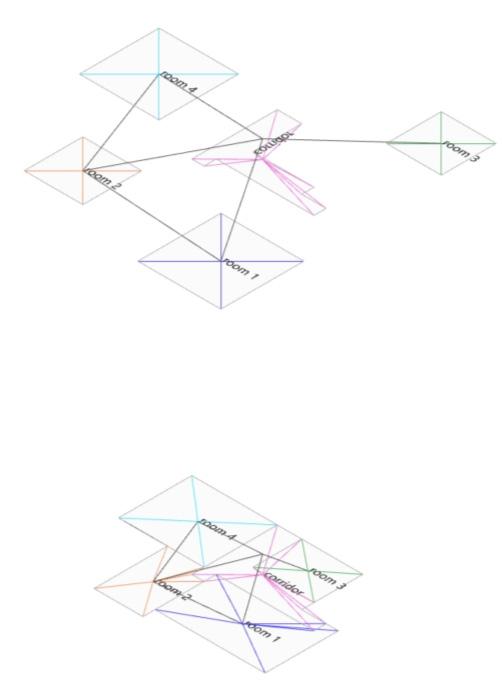
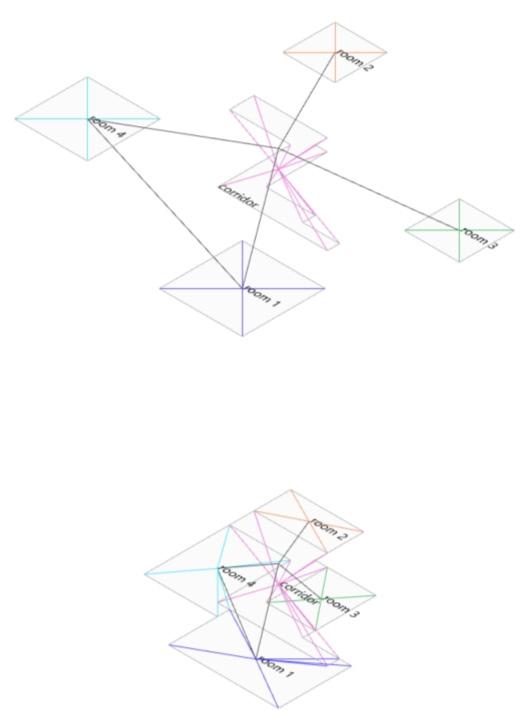
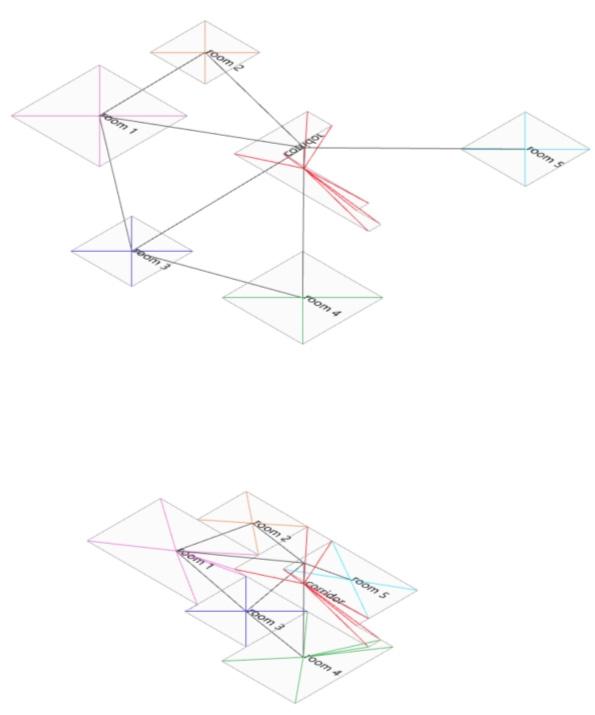
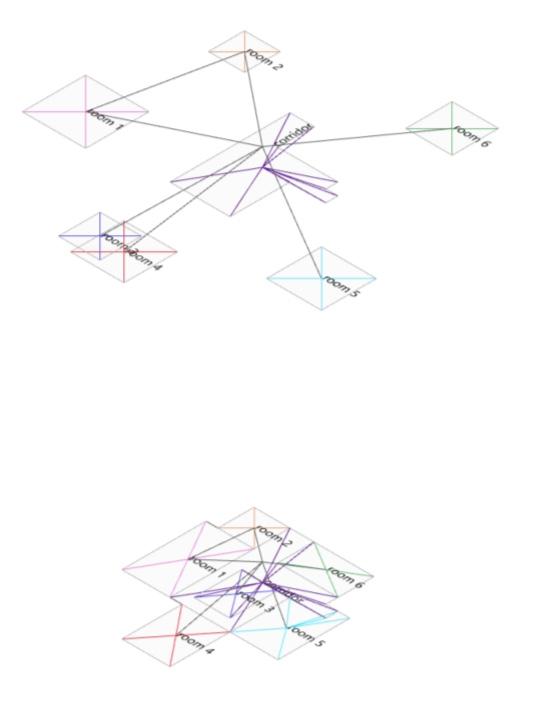
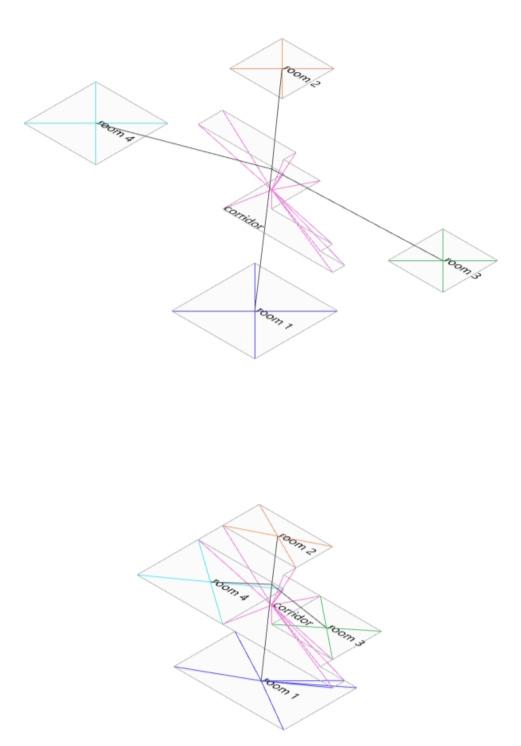
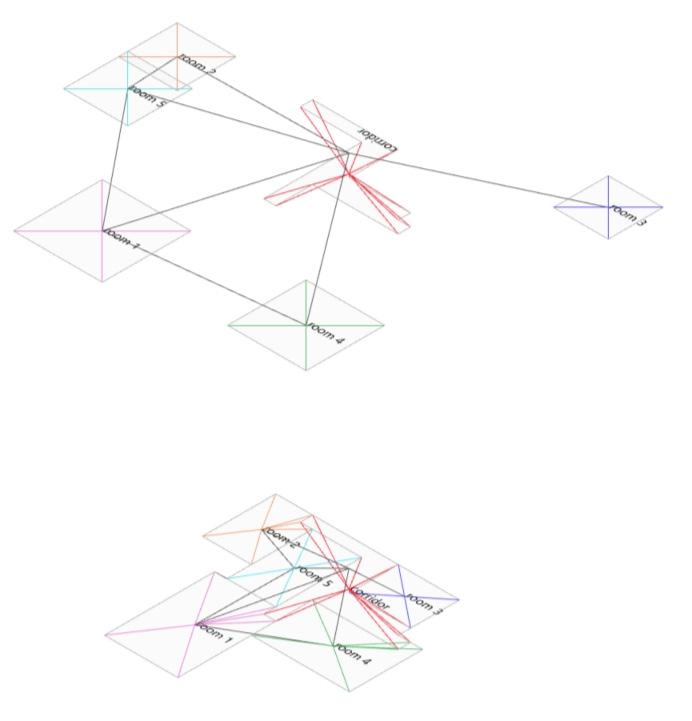
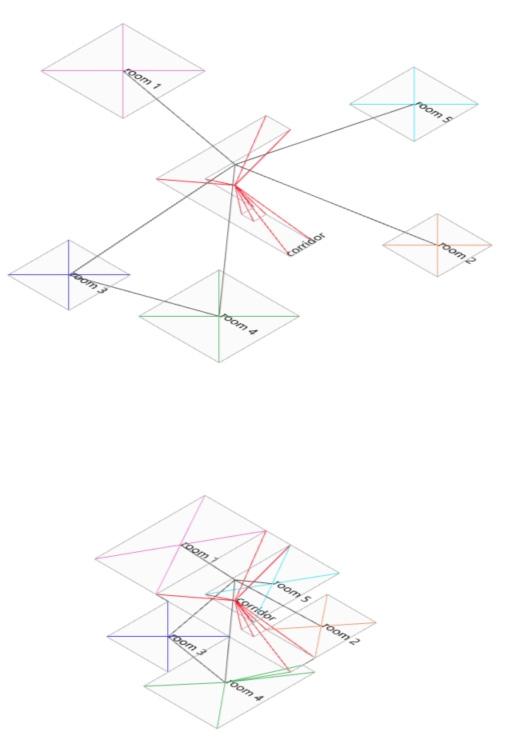
Grasshopper Generate Dataset
Dataset Variation
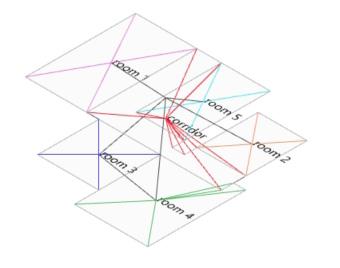
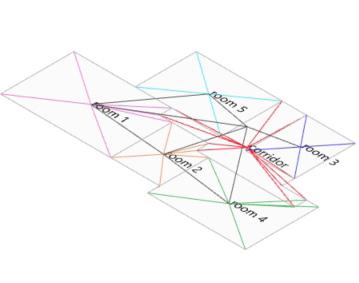
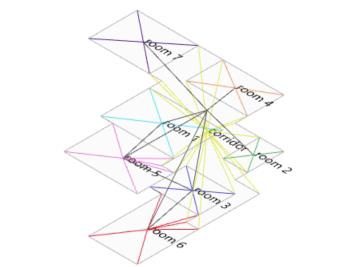
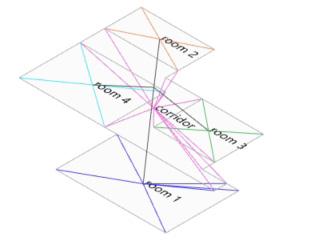
Around 2000 pairs of data with different area, rooms and configuration.
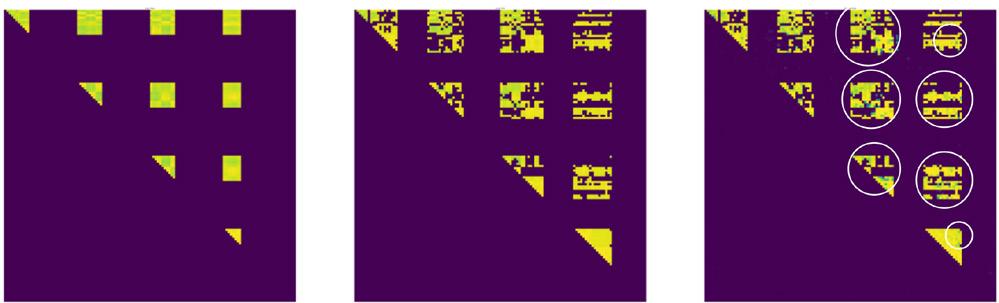
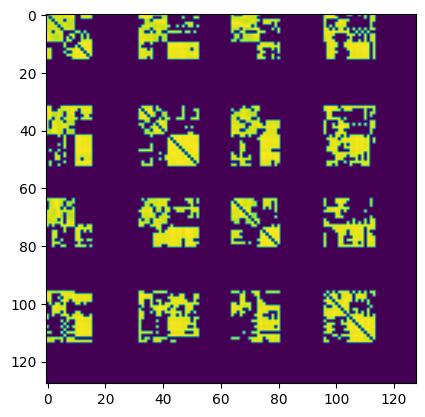
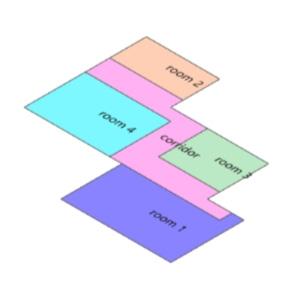
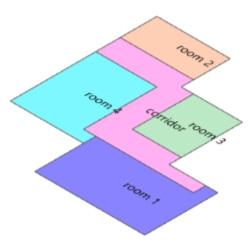
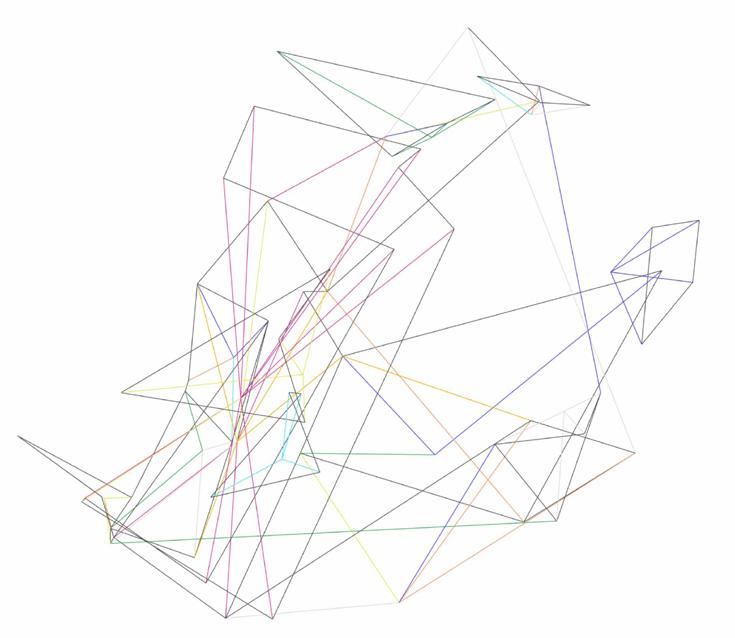
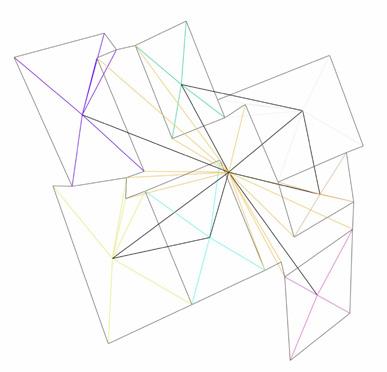
1st Reconstruction Result
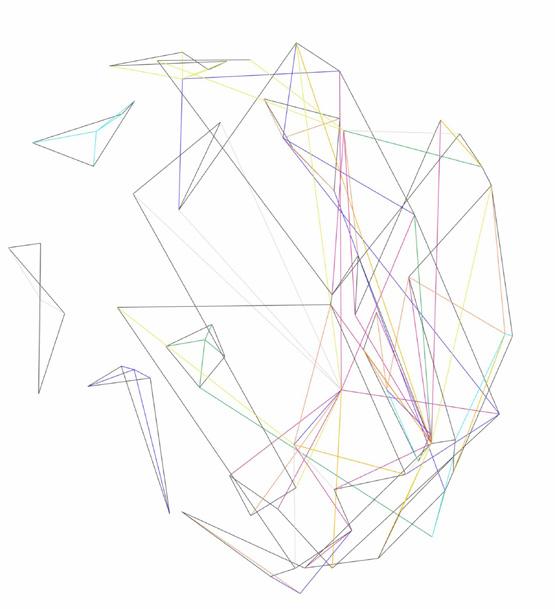
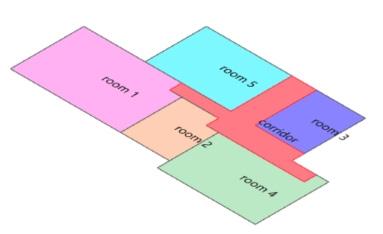
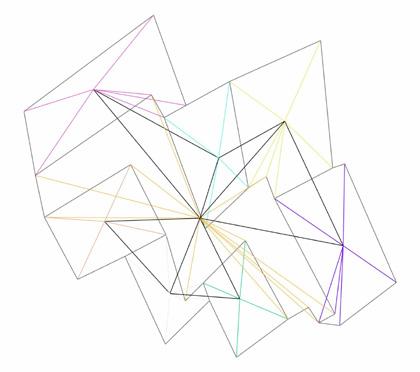
2nd Reconstruction Result
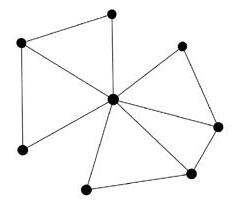
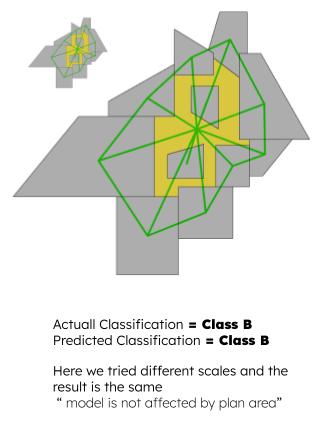
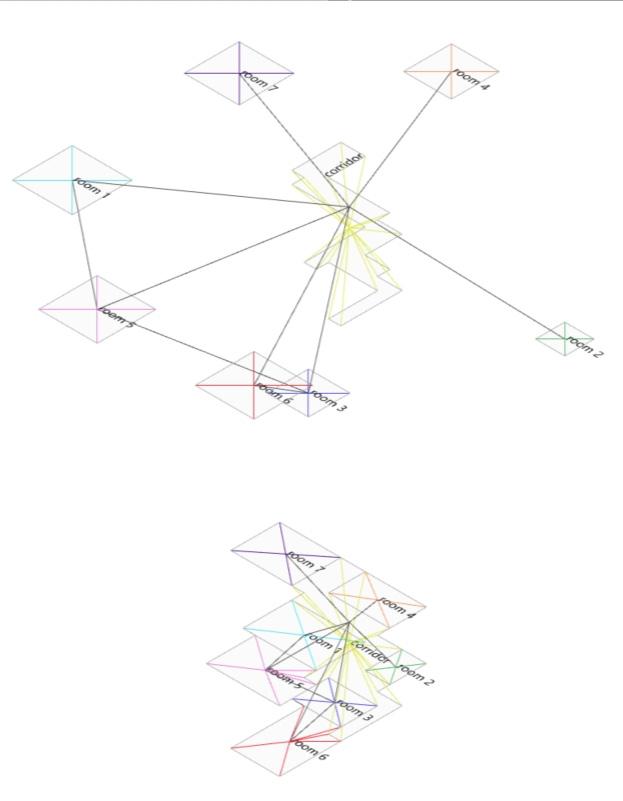
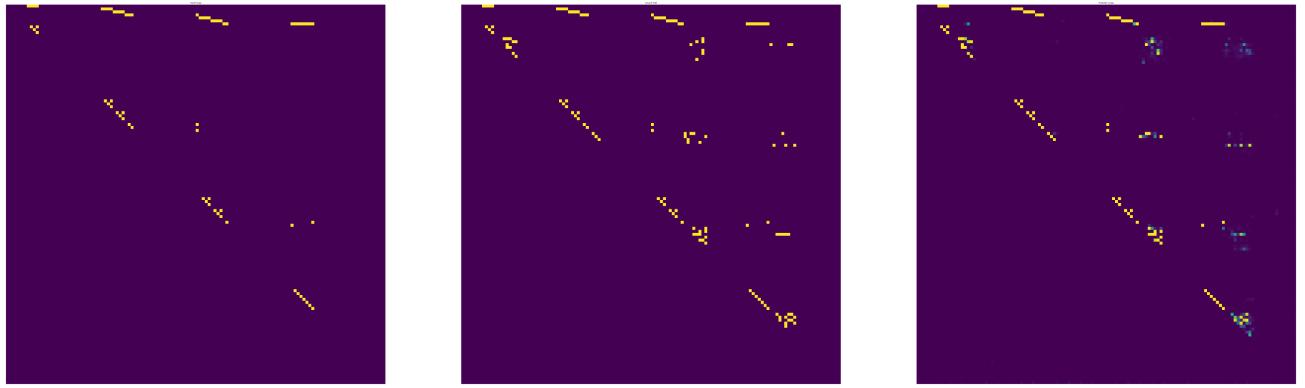
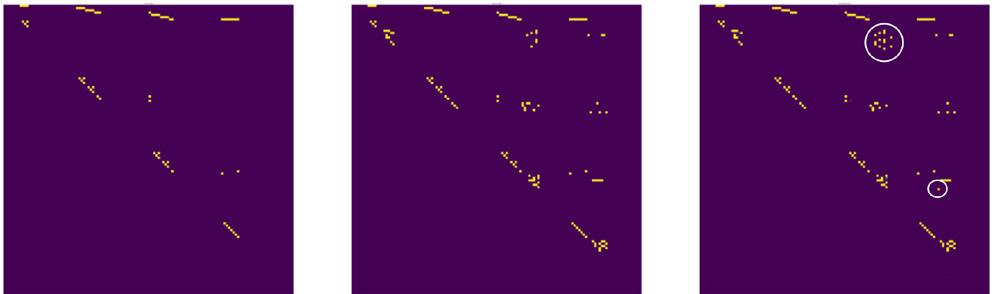
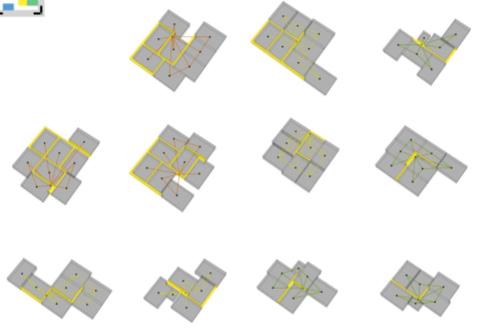
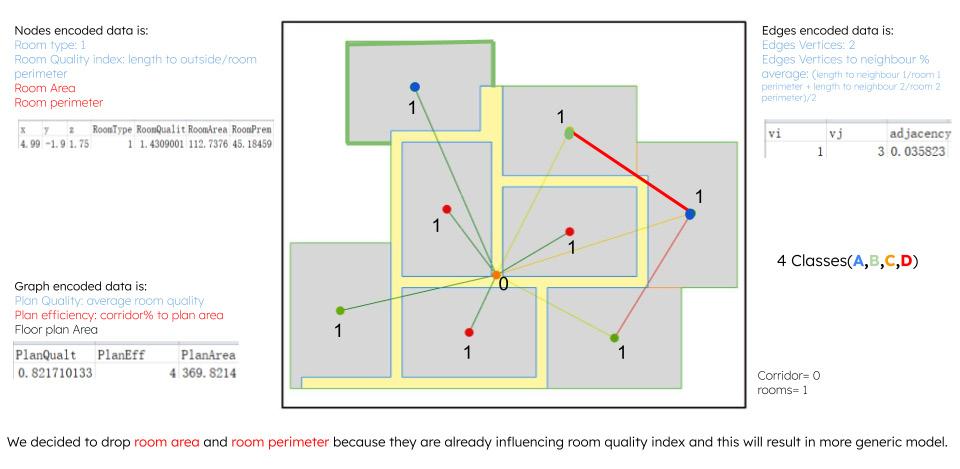
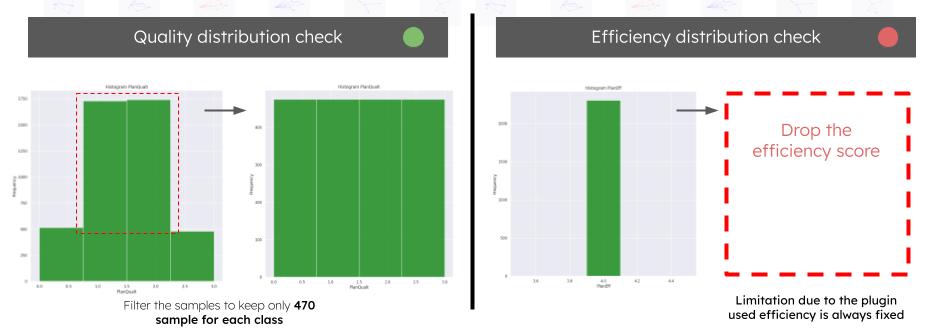
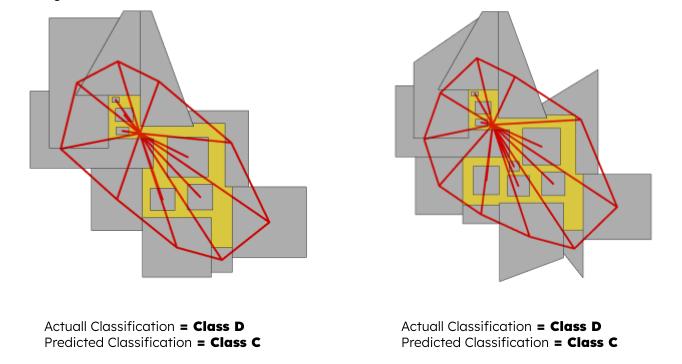
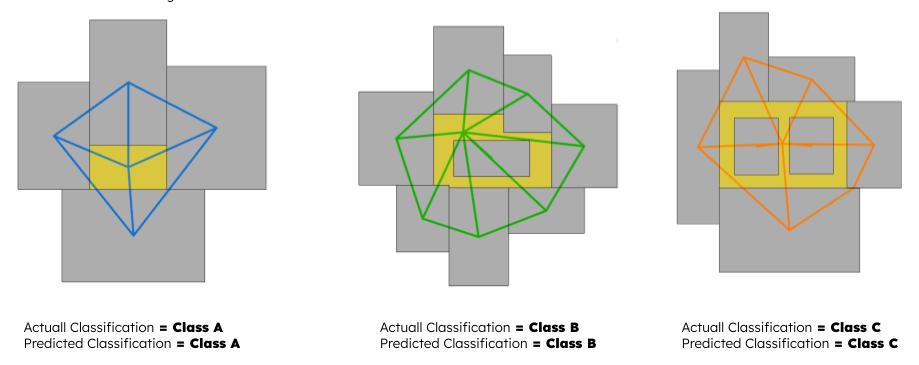
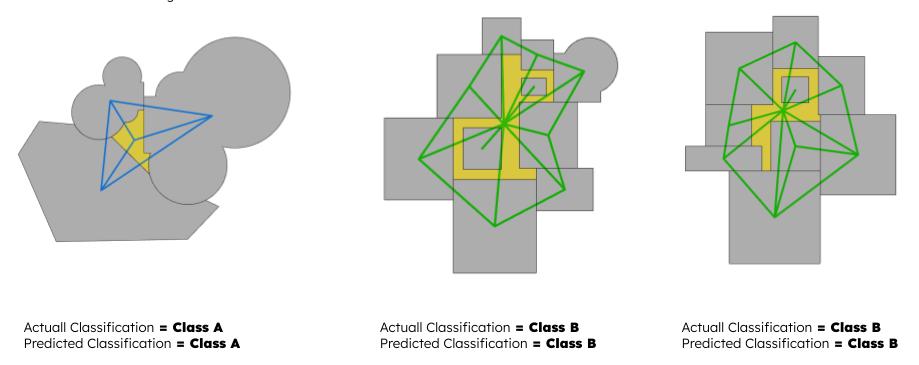
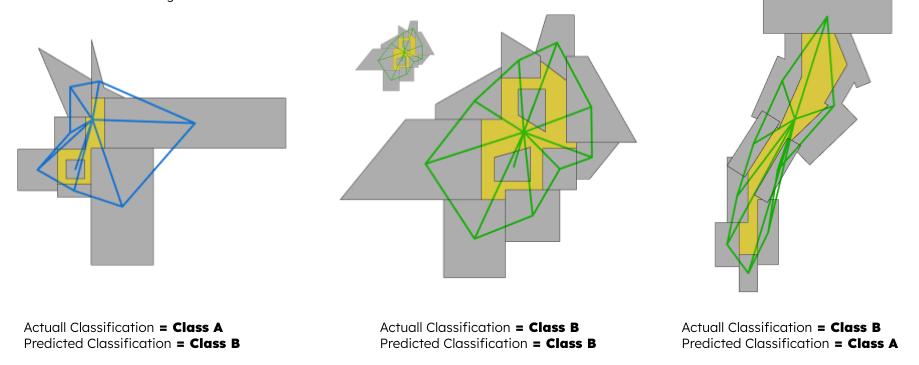
A GML based floor plan evaluator

Embed feature Dataset generation
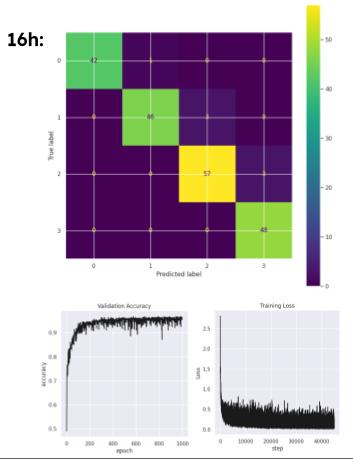
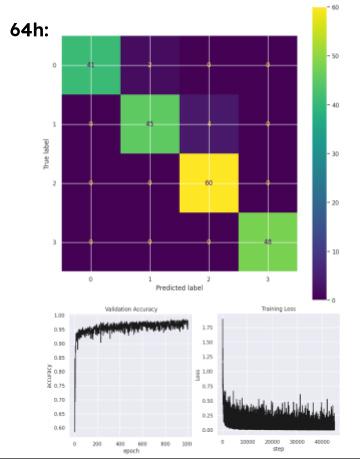
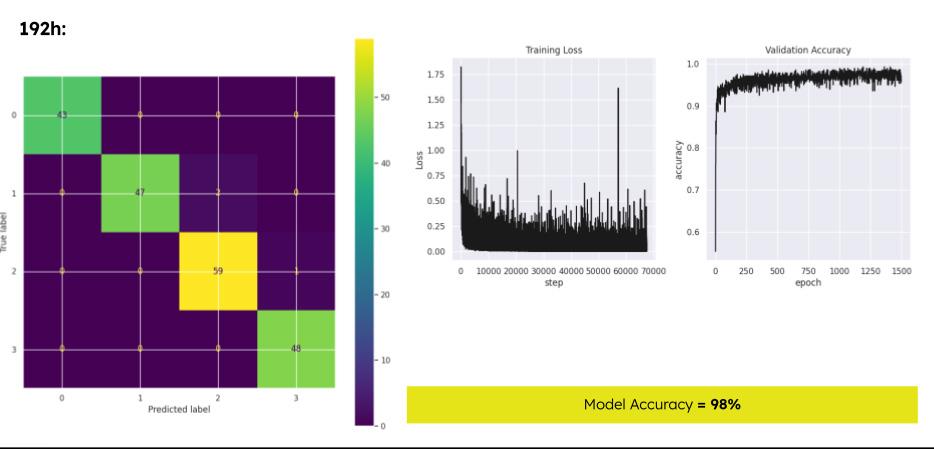
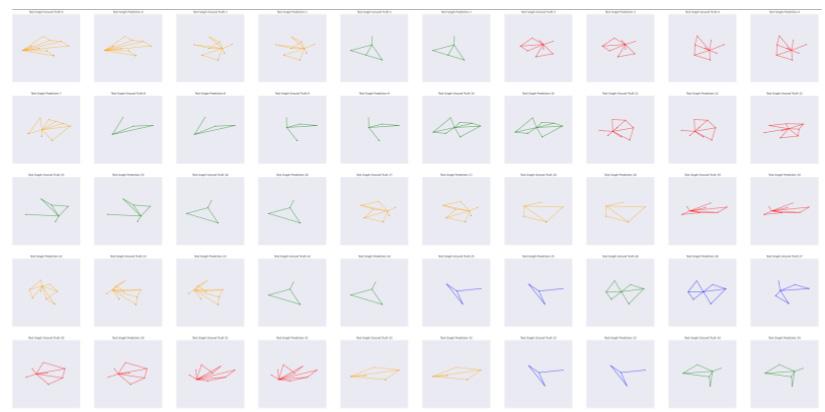
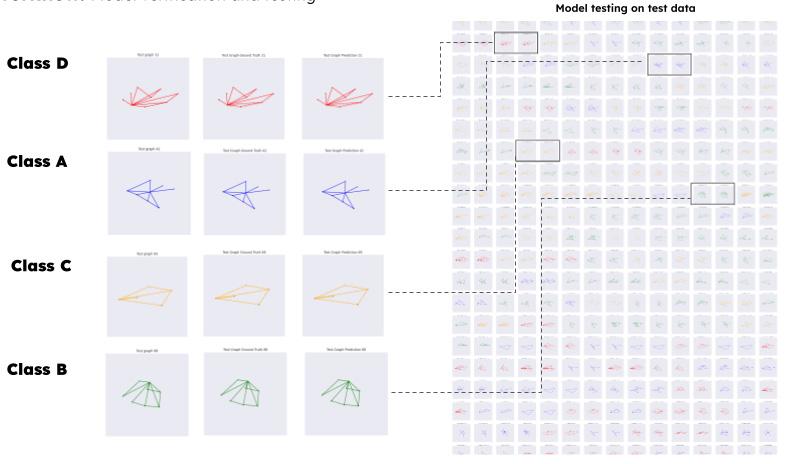
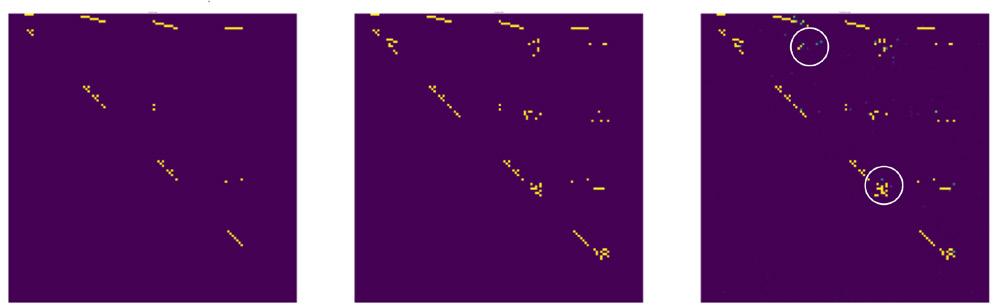
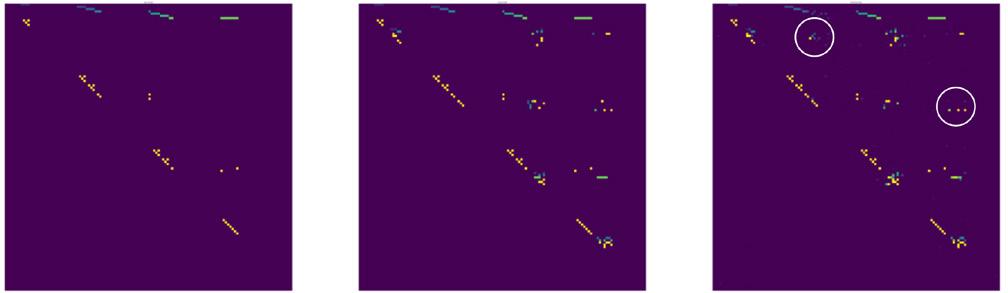
The model performed in a very goodway regarding predicting plans quality within training domain, also it’s performance was good for predicting unseen out of training domain data with a minor margin of error ( only one class up or down in some plans ), overall graph SAGE classification showed a very good potential for our particular problem with acceptable ability to generalize.
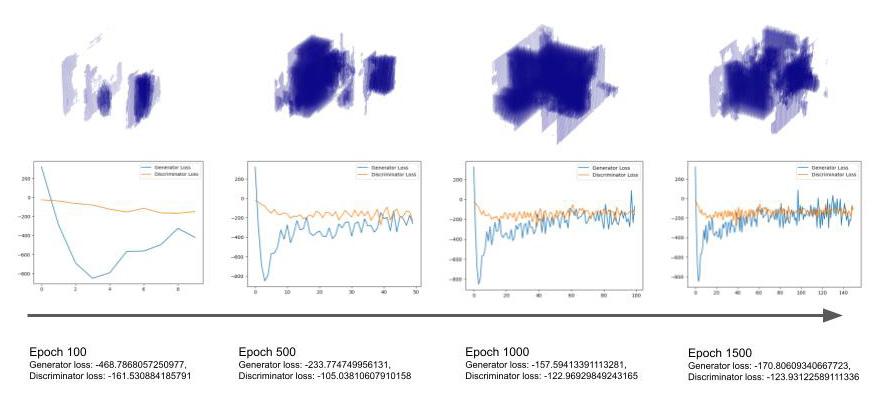
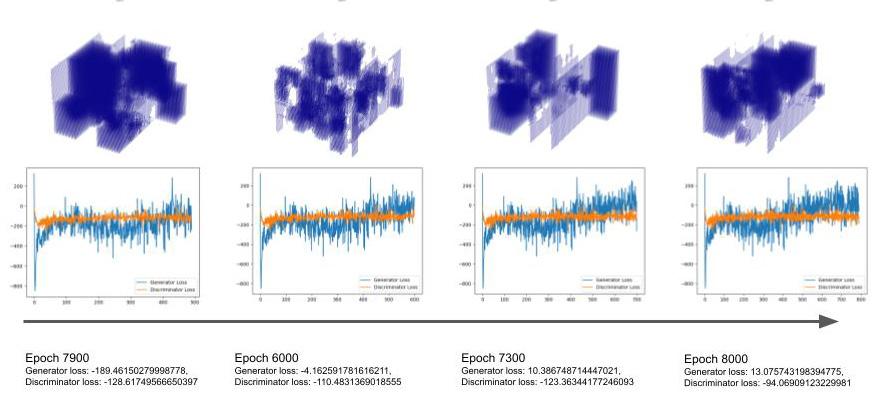
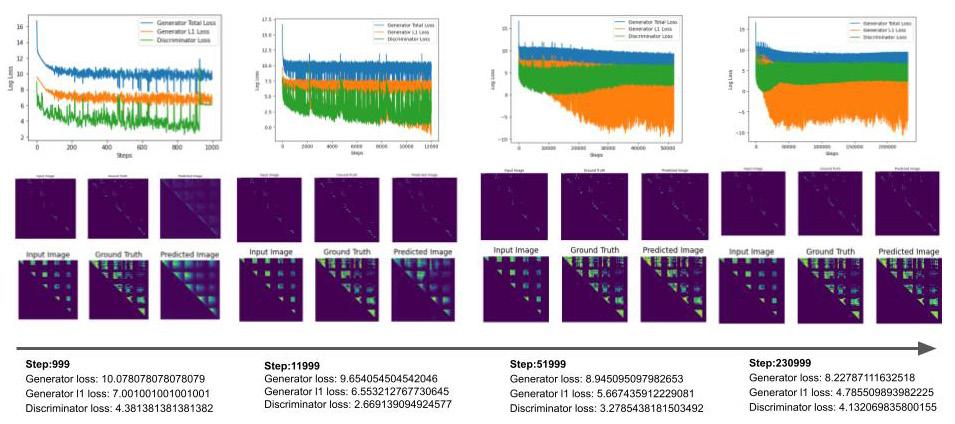
Two ways to use generative AI to reconstruct 3D building volumes
2023 Spring
AIA generative course
Faculty: Oana Taut,
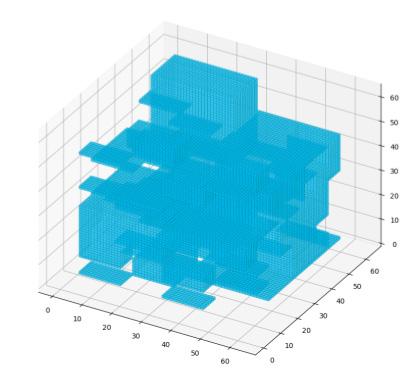
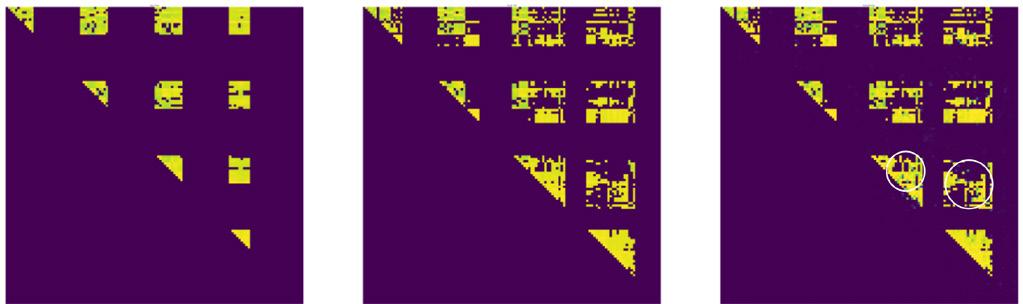
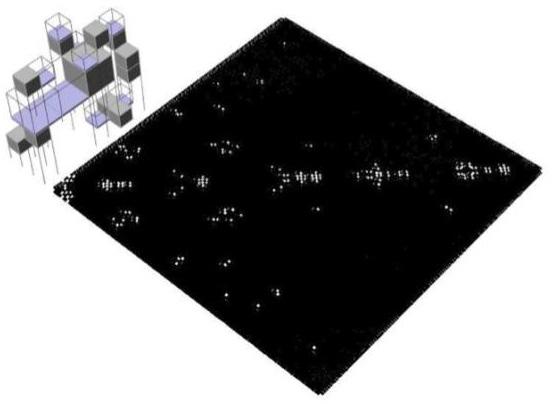
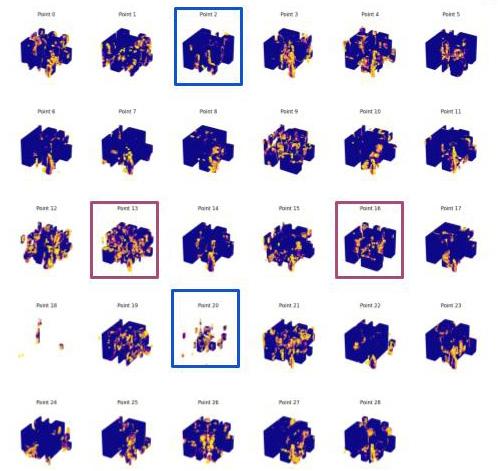
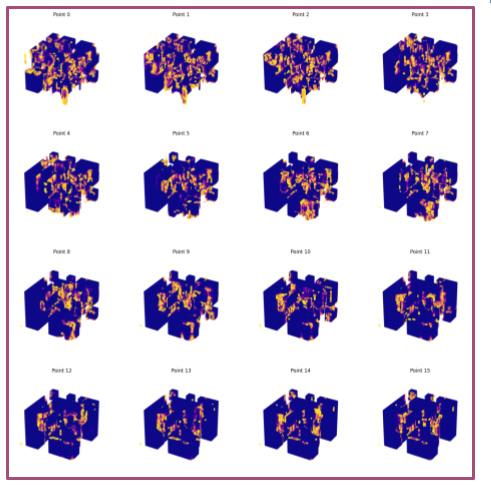
3D binary voxels + 3D convolutional network
Dataset generation: around 2000 samples
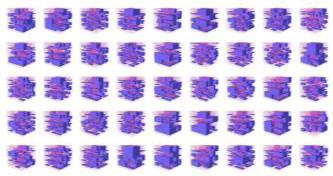
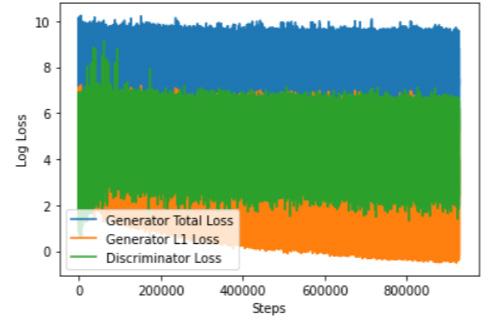
Training evolution
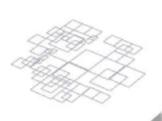
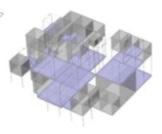
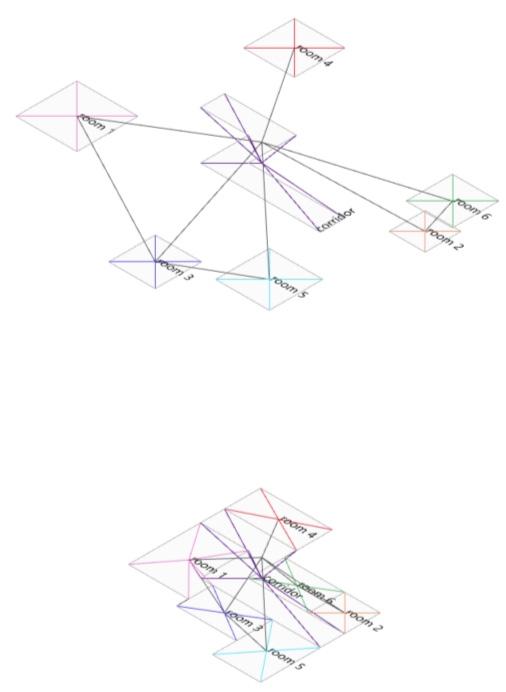
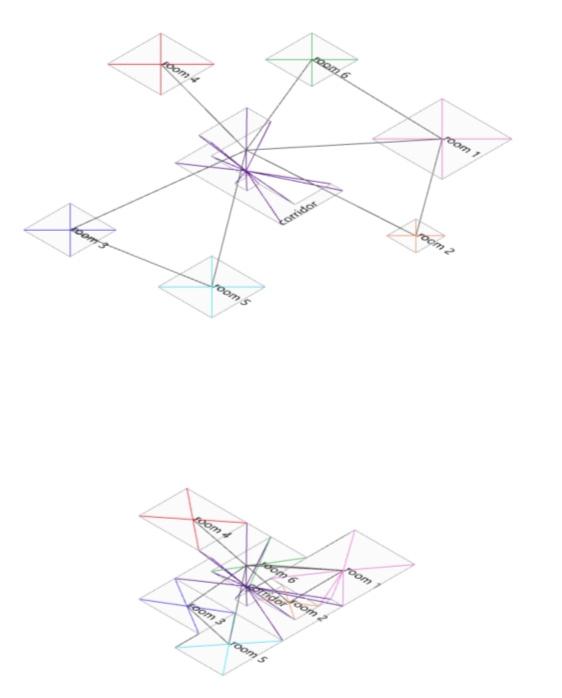
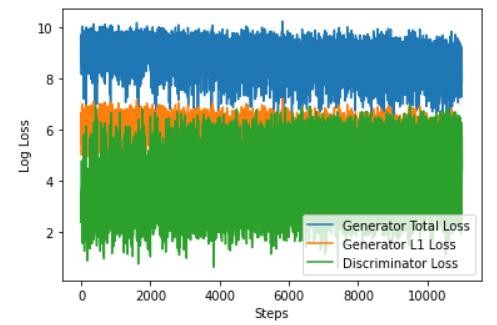
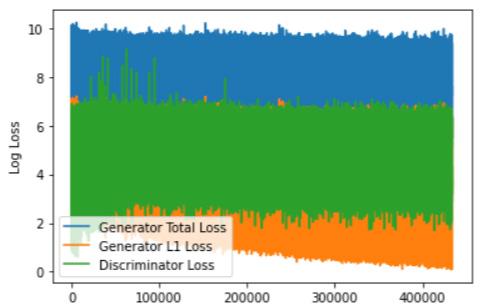
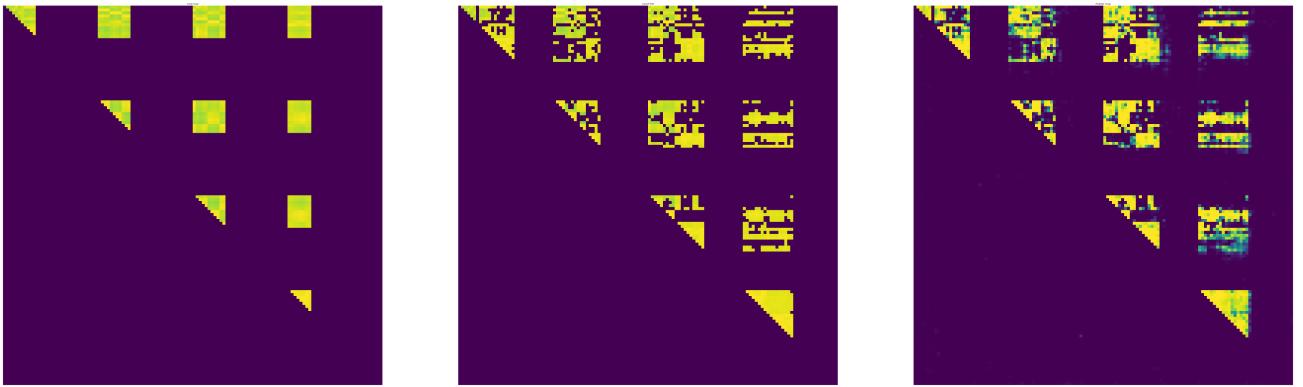
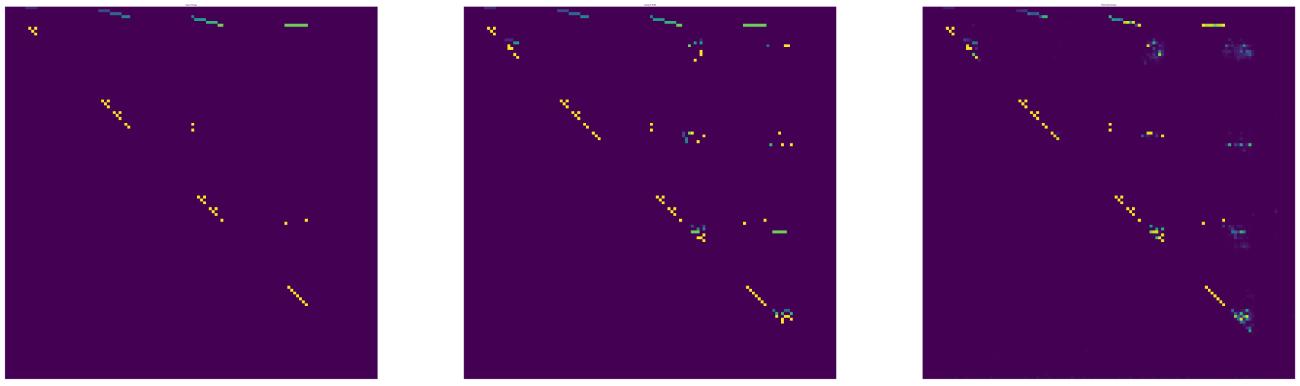
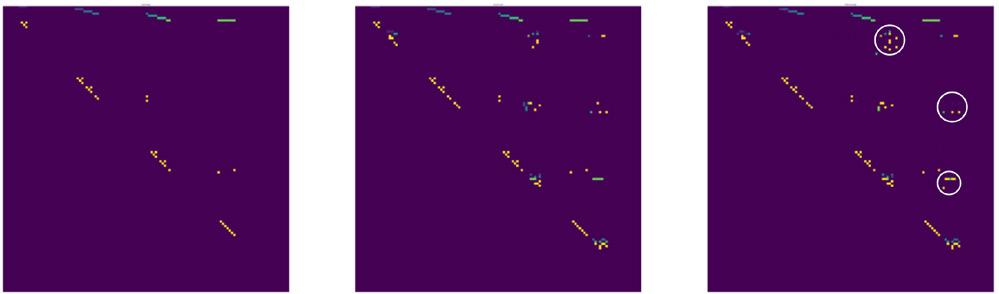
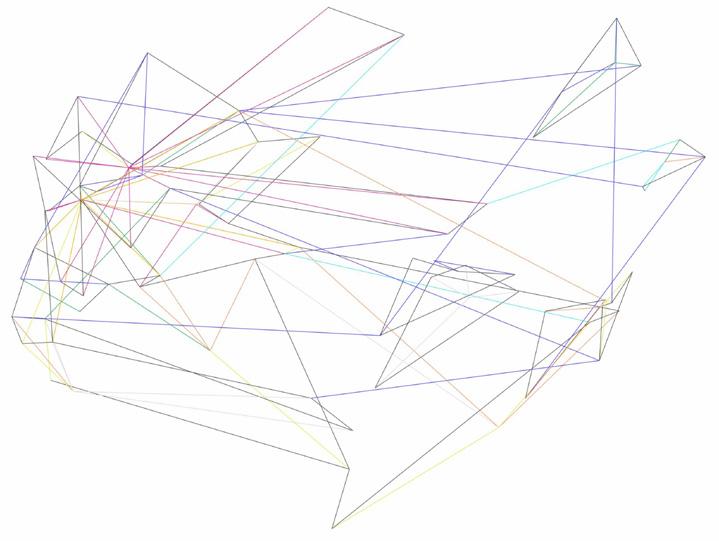
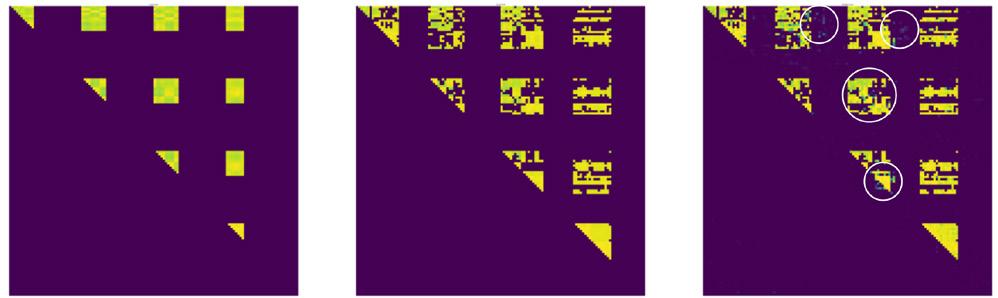
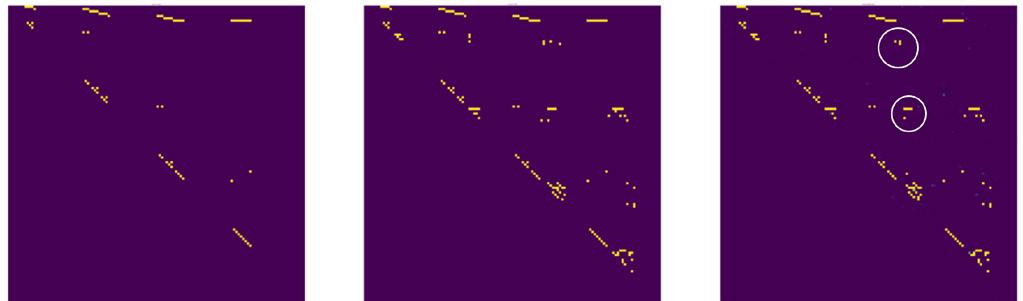
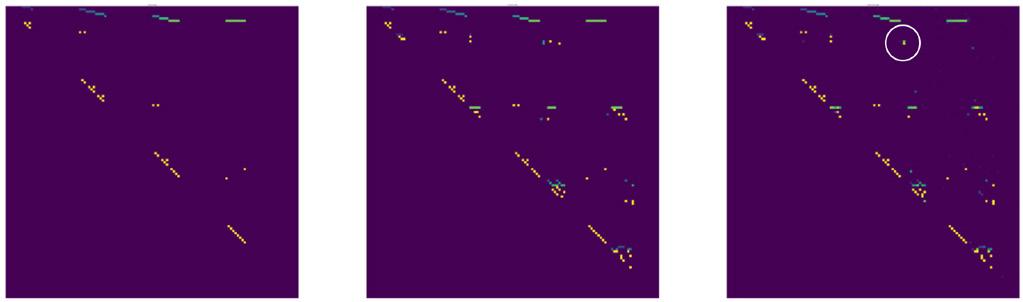
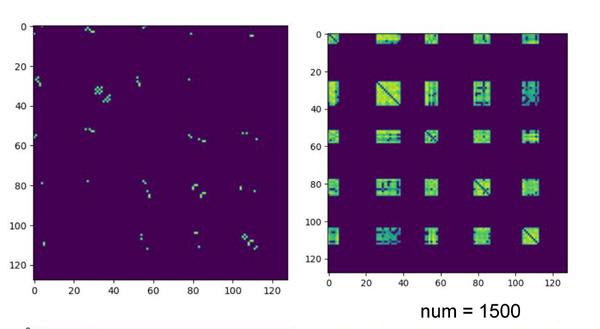
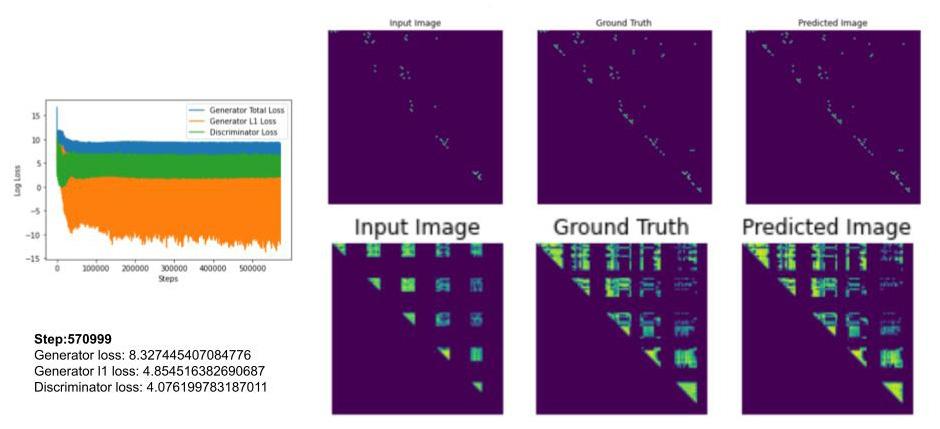
2d adjacency matrix + pix2pix model
Dataset generation: 1965 pairs of training and test dataset
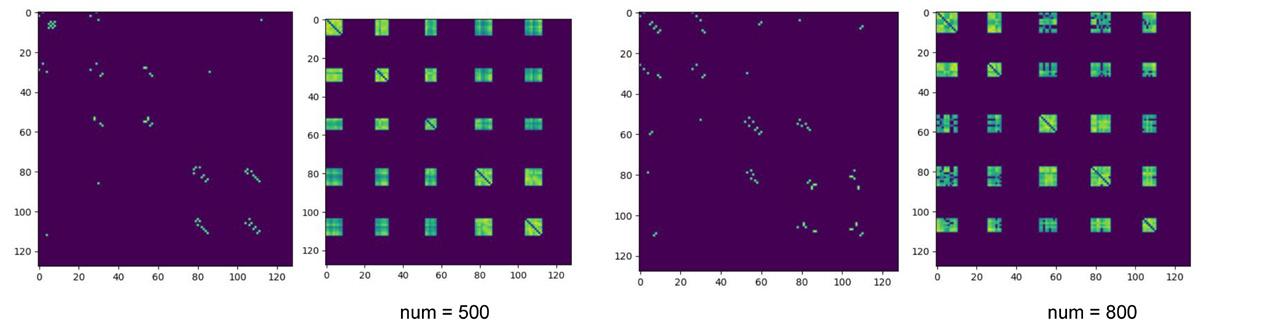
Training evolution


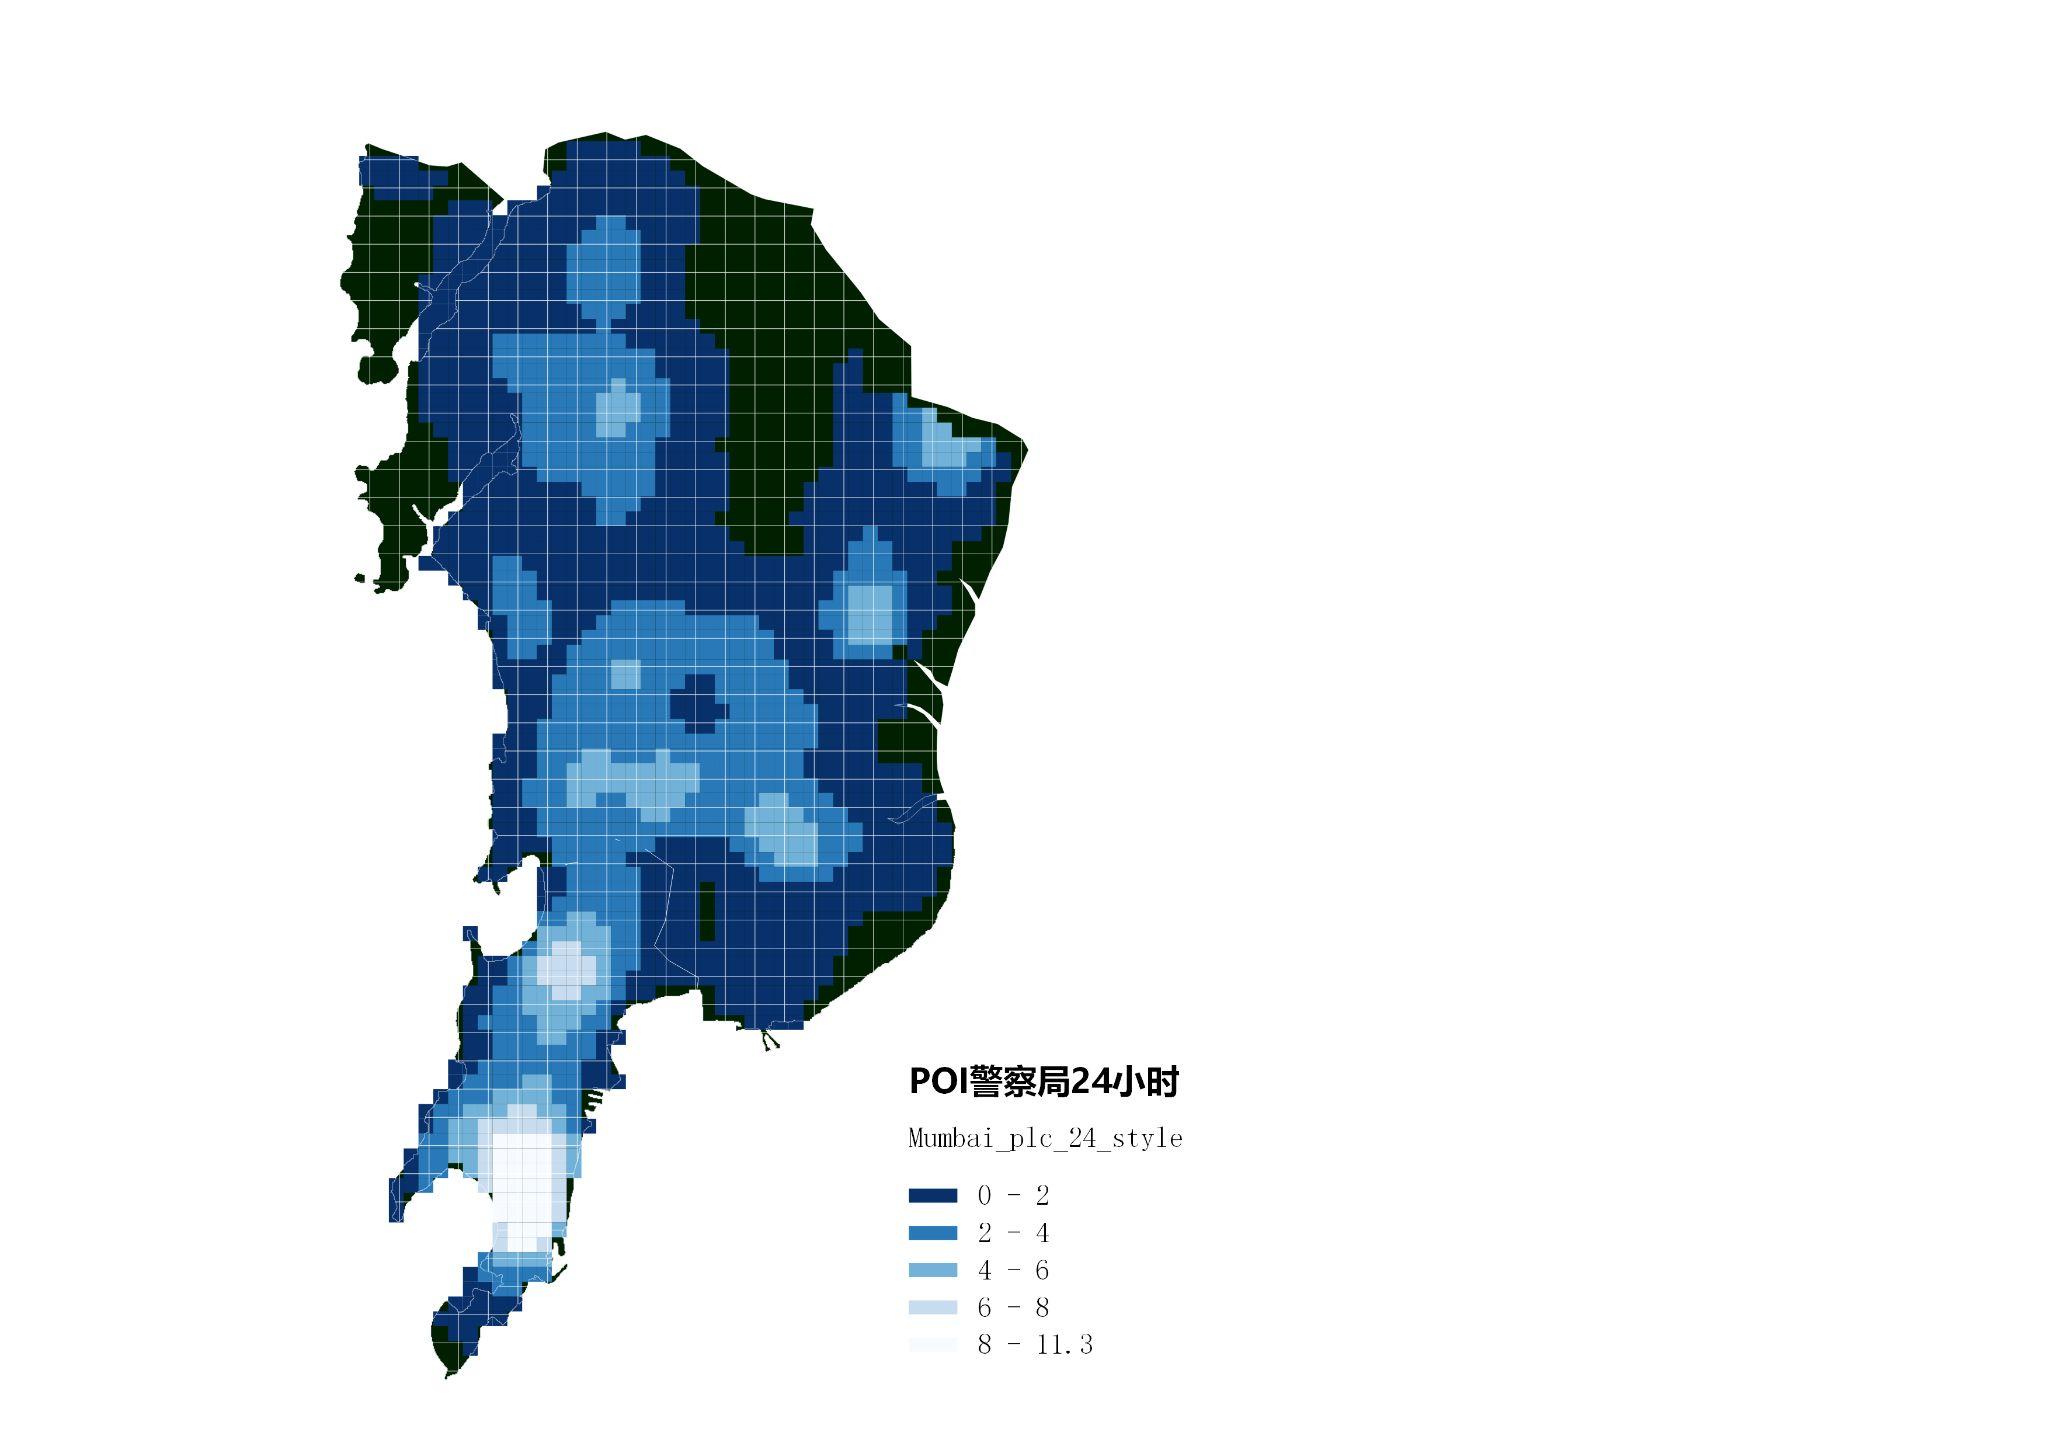
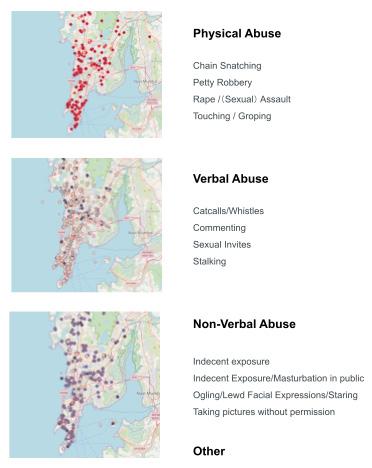
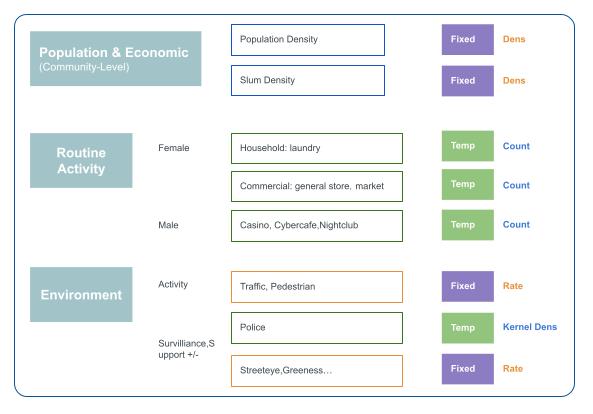
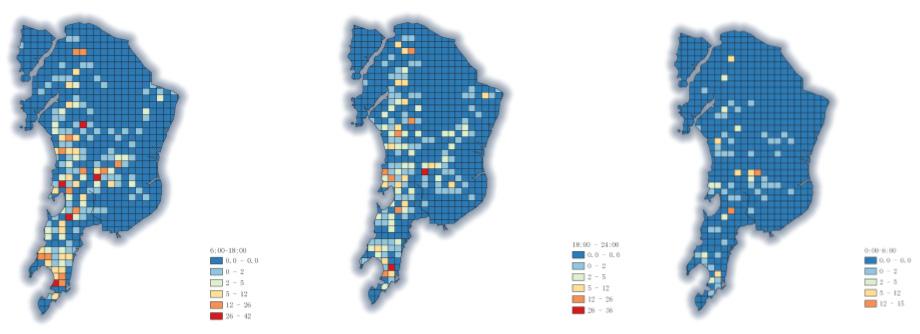
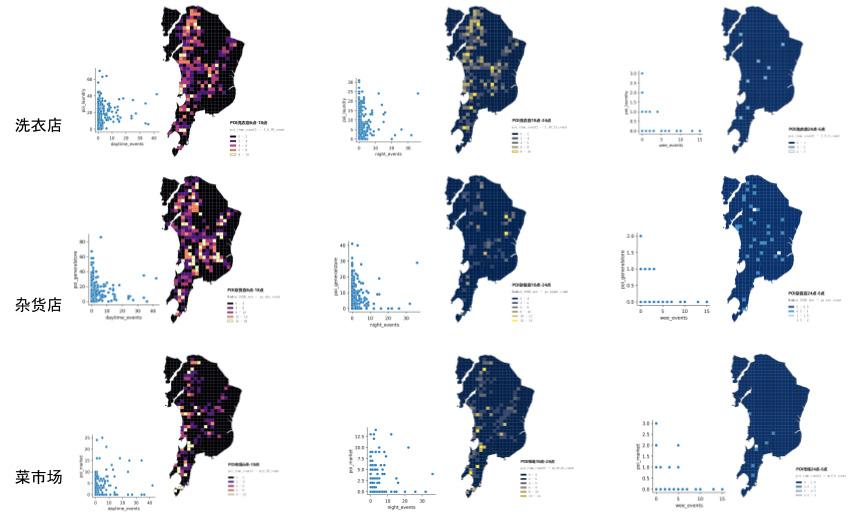
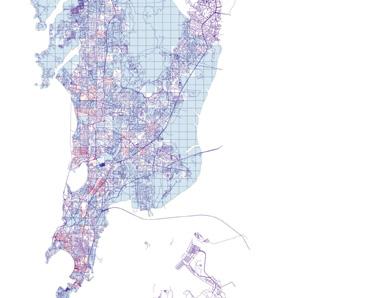
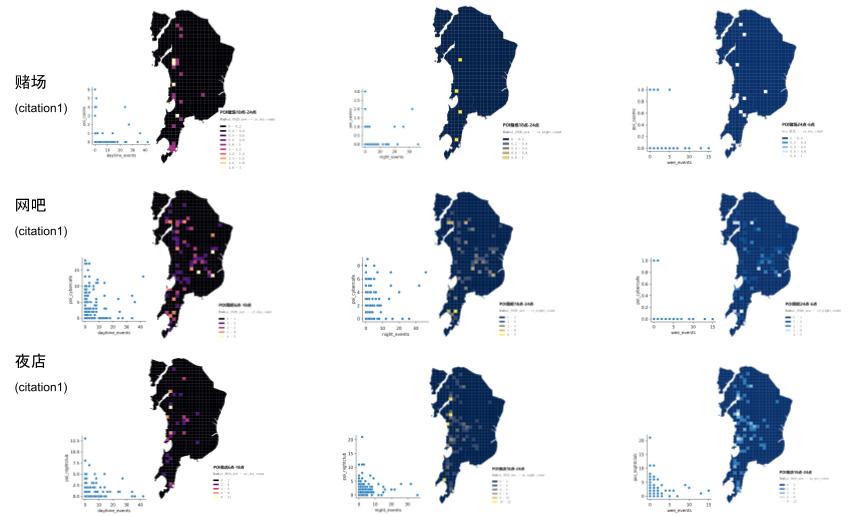
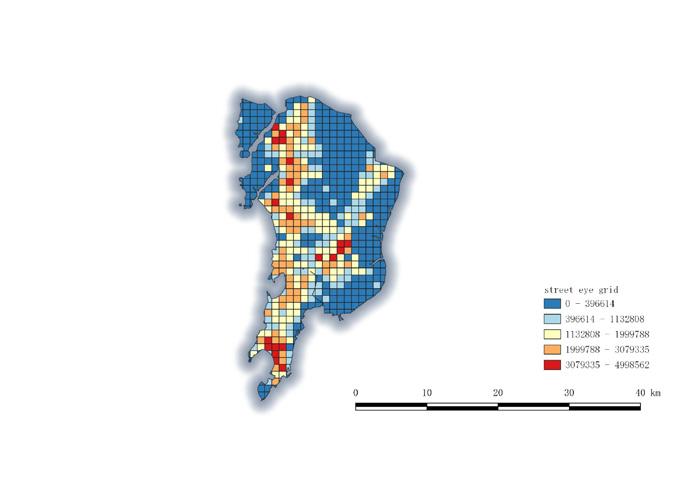
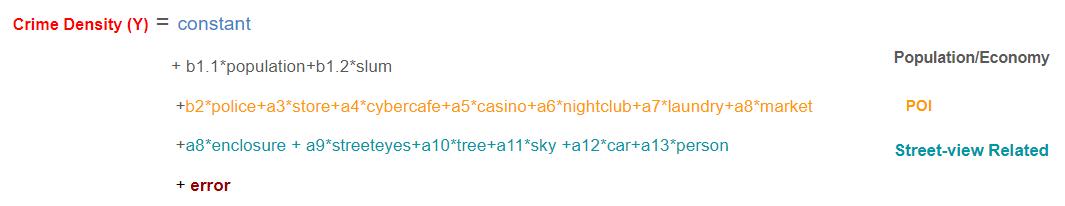
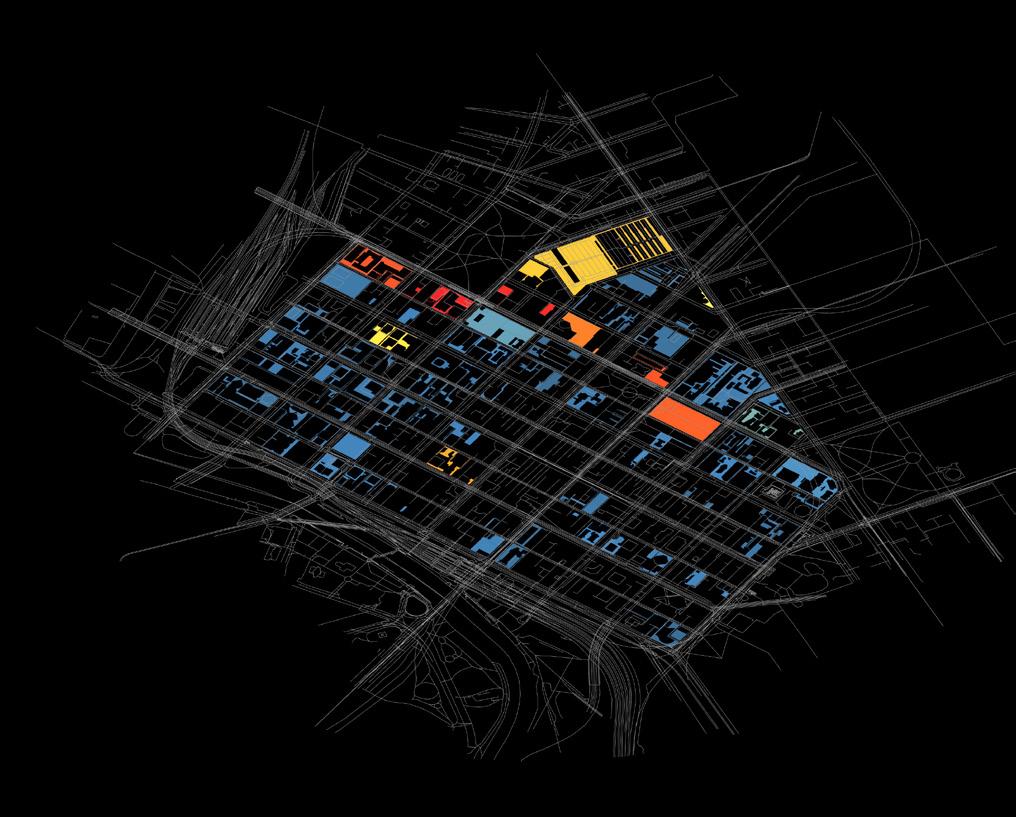
Spatiotemporal Prediction Model on VAW Incidents in Mumbai in relation to Urban Environmental Factors
A quantitative urban study by machine learning tools
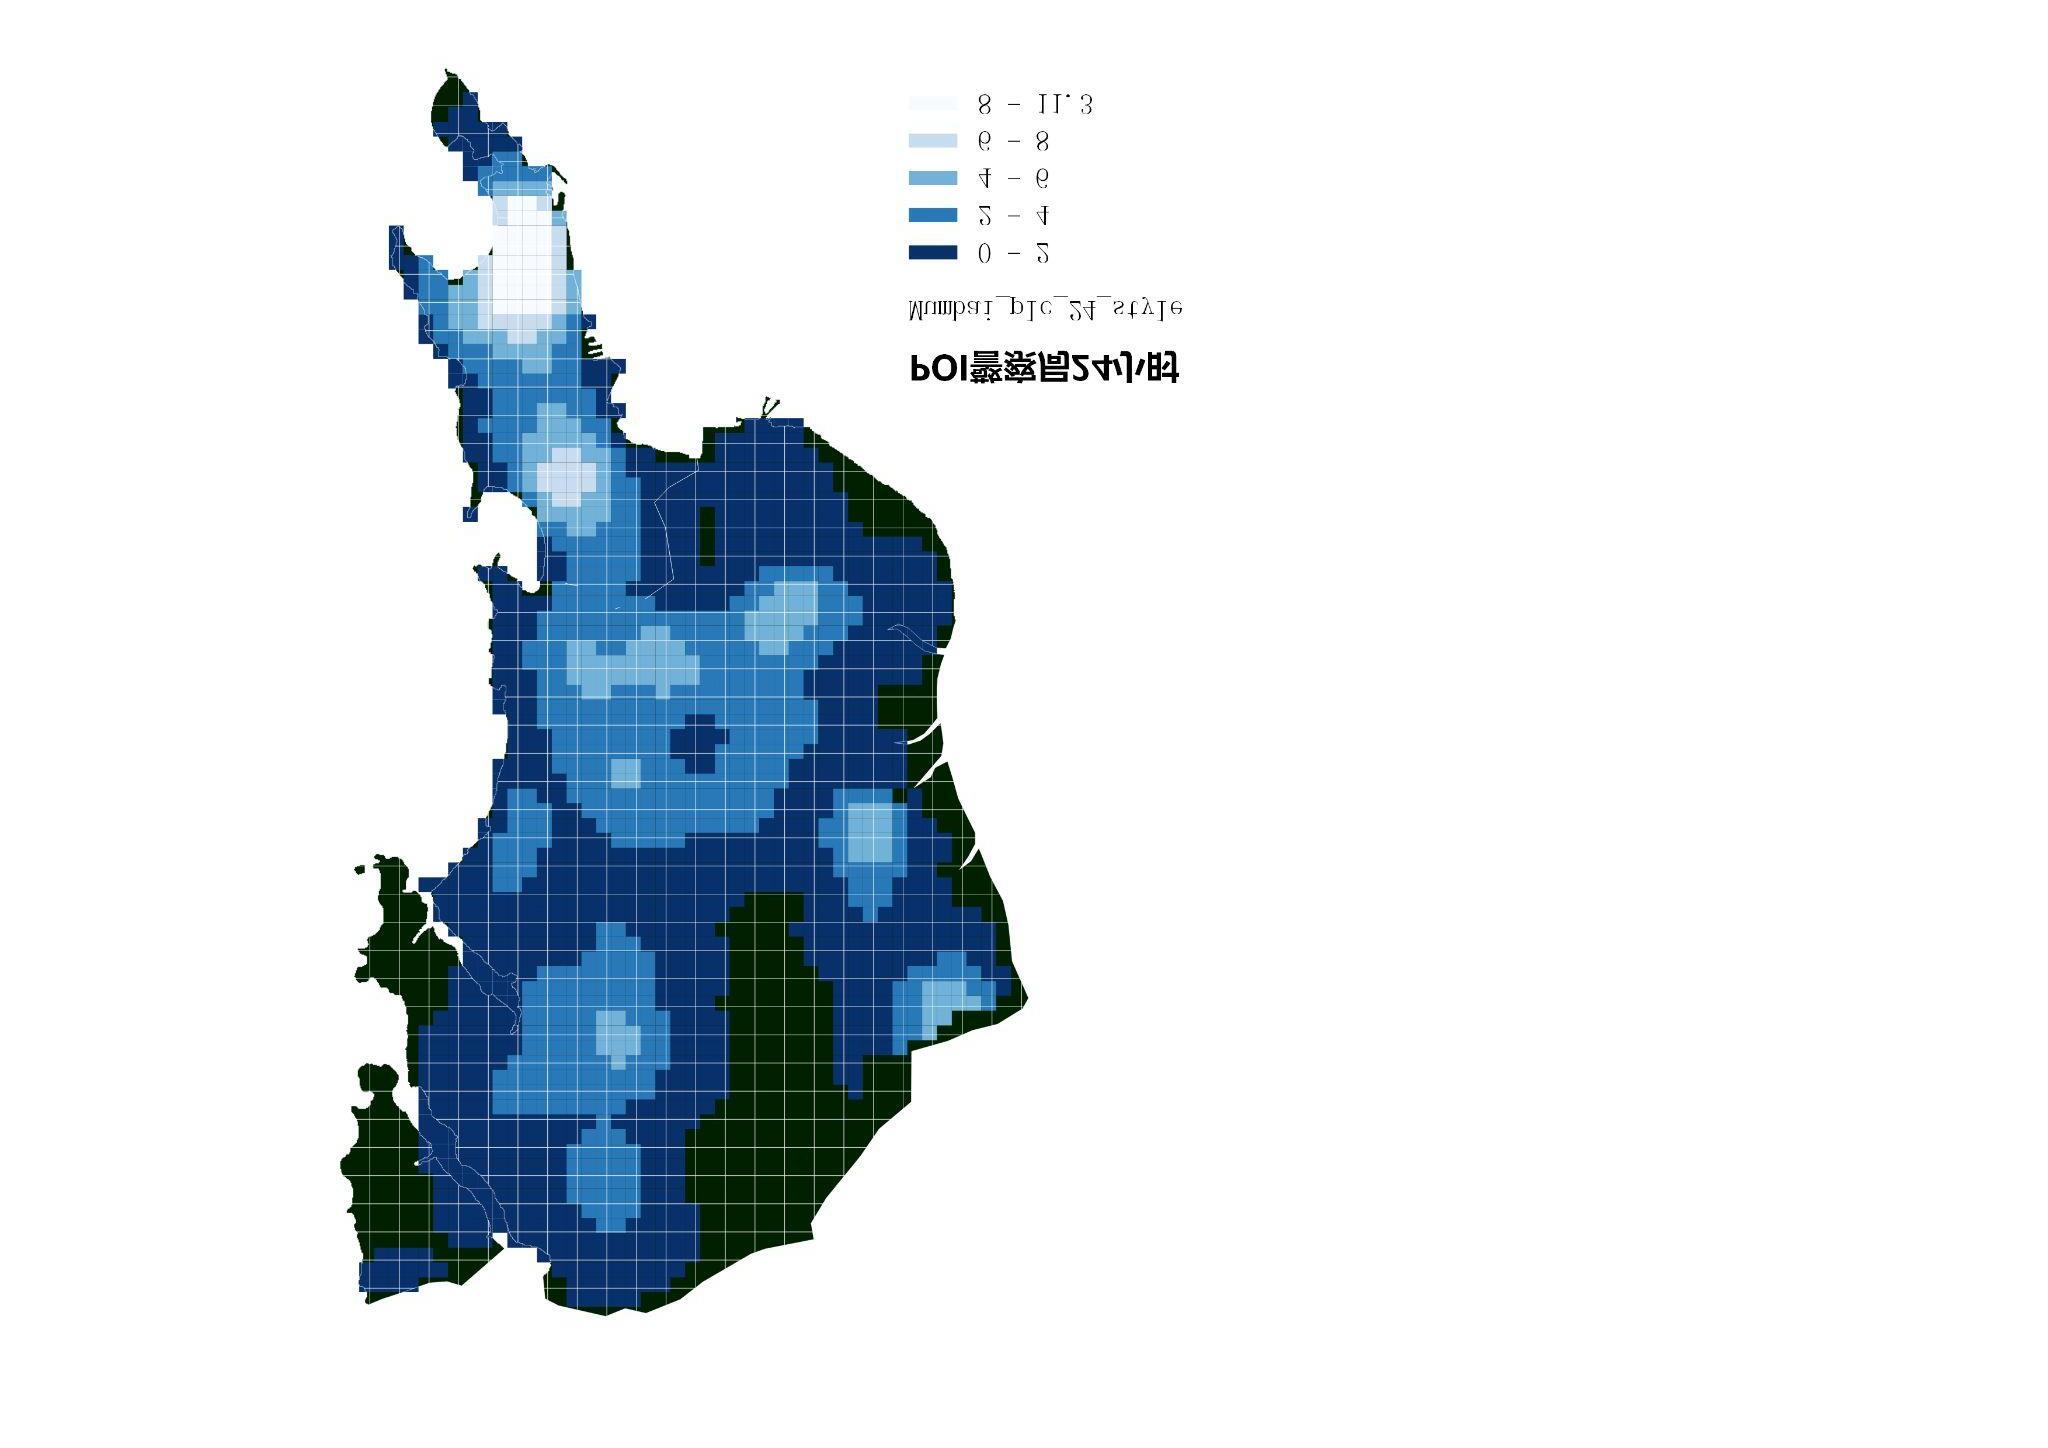
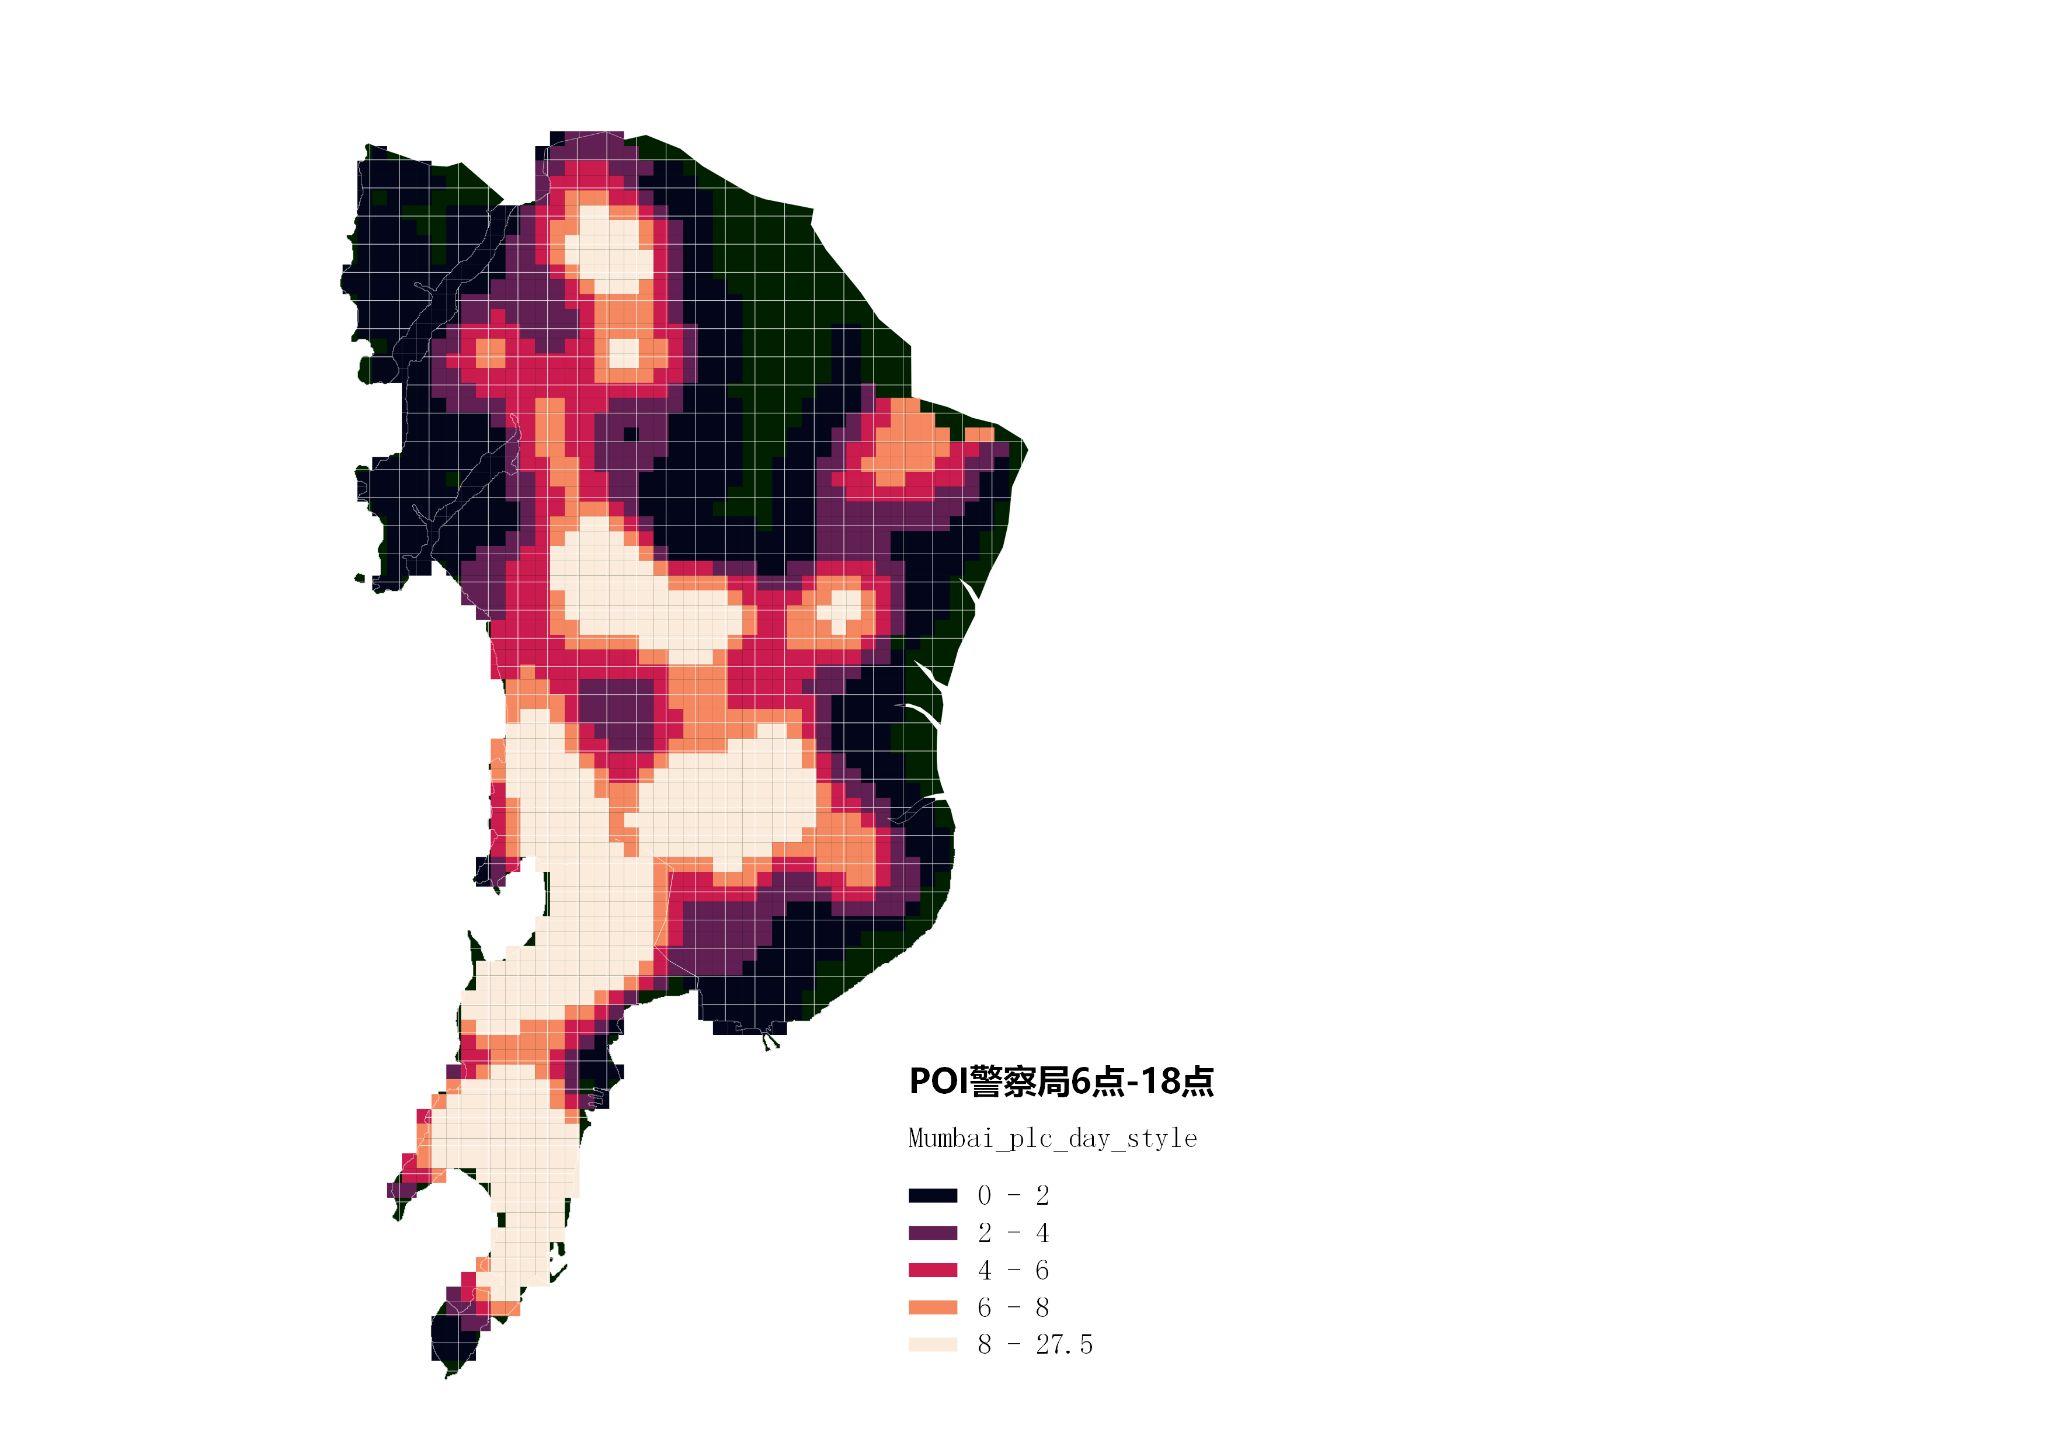
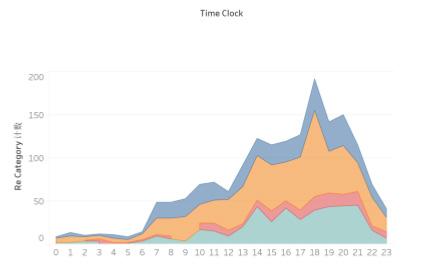
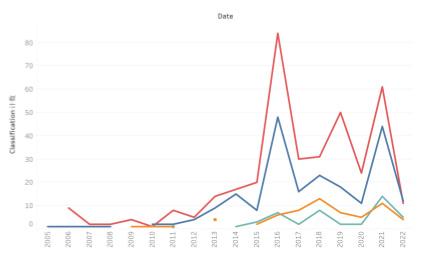
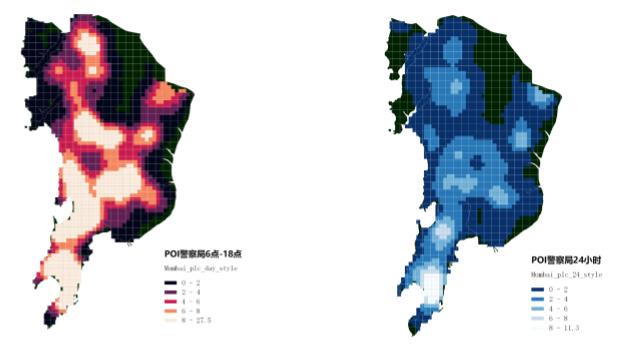
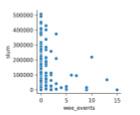
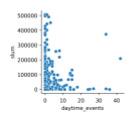
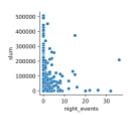
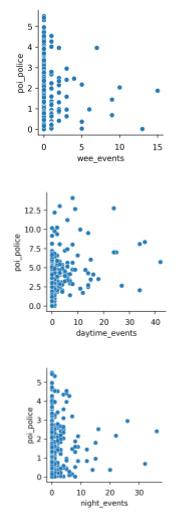
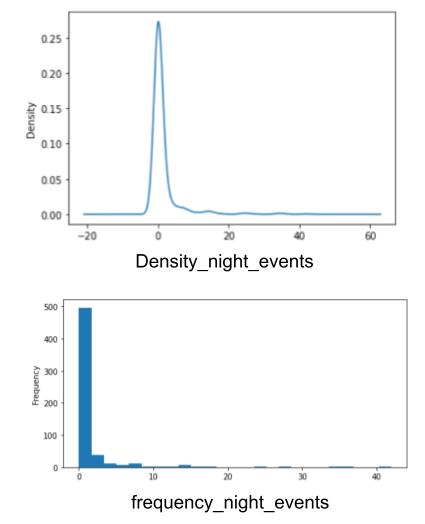
In Mumbai, the incidence of sexual violence and the spatial patterns of communities may have a high degree of similarity due to the high urban density and geographic proximity between communities. VAW events are not prevalent on a natural day/week and related scale, illustrating the pattern of daily activity.


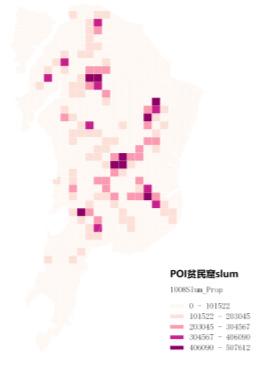
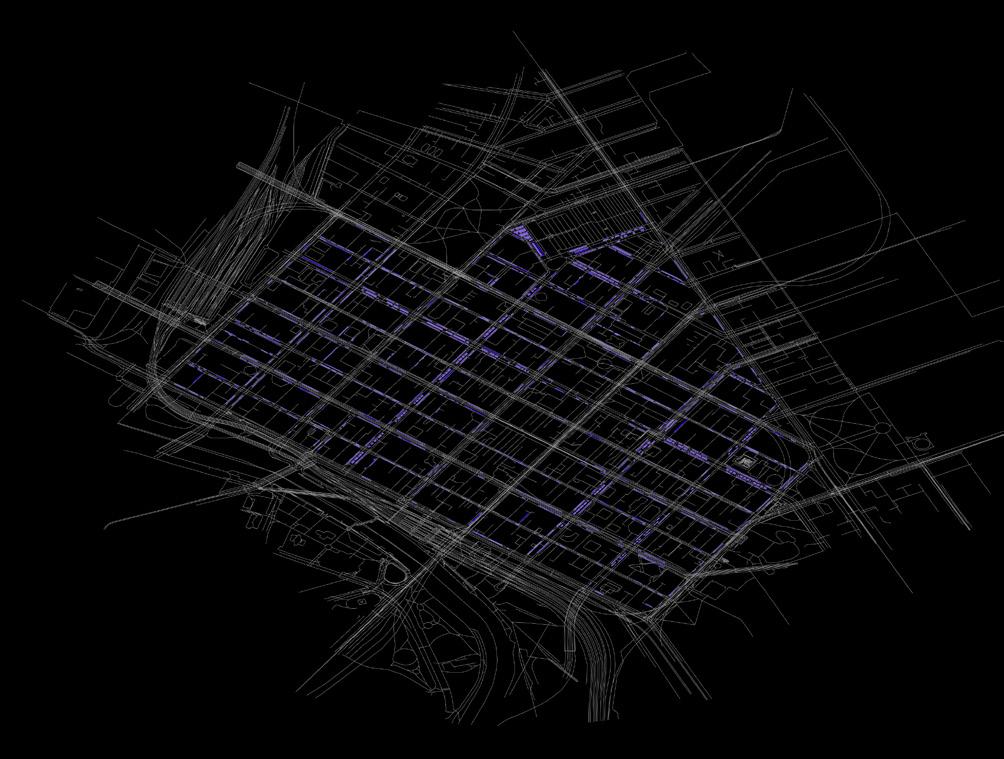
POI data & Open hours police station(Kernel Density)
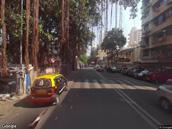
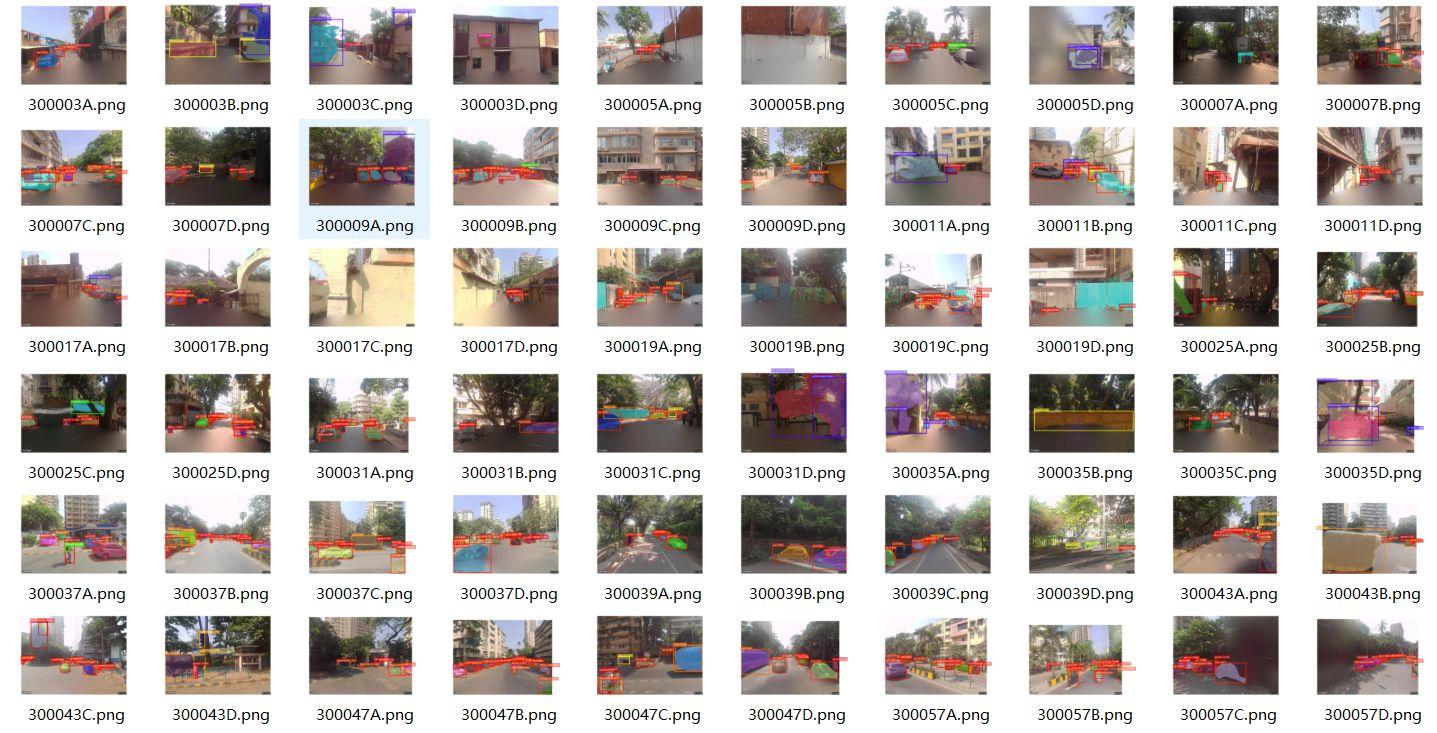
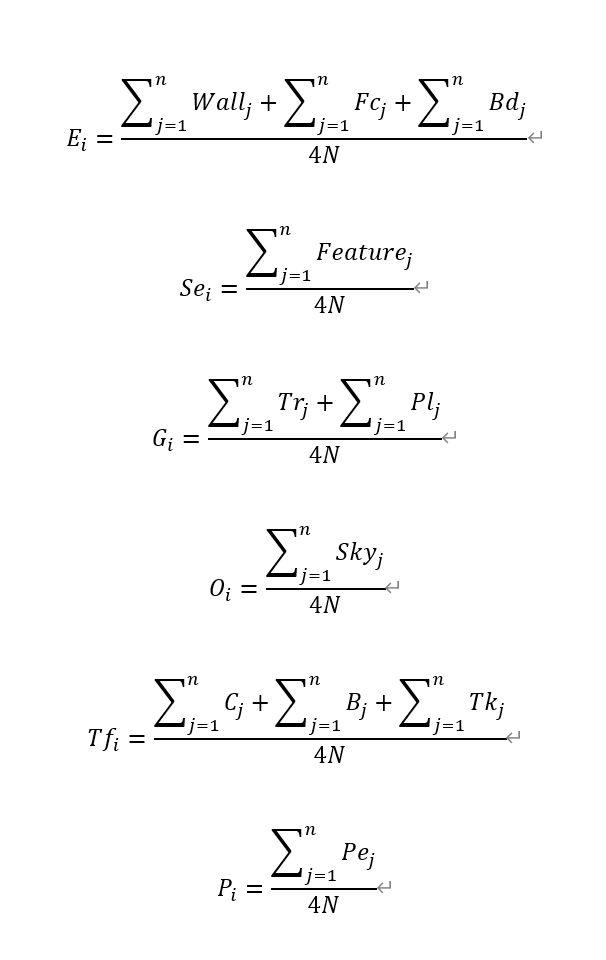
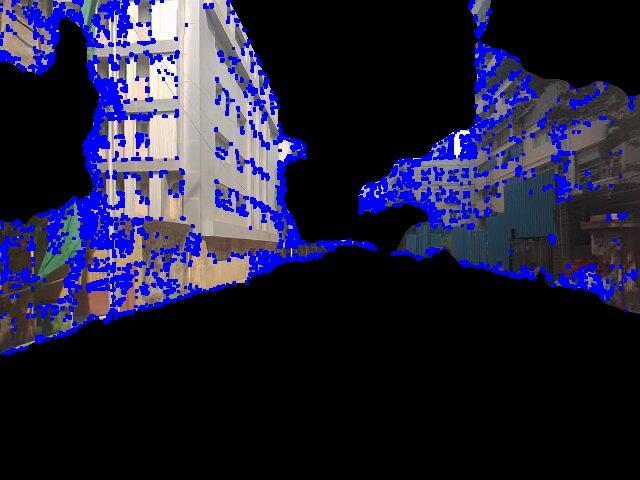
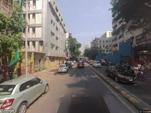
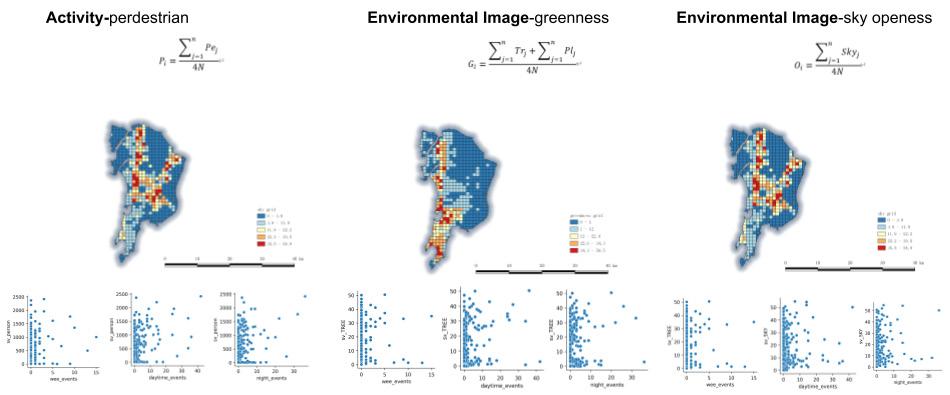
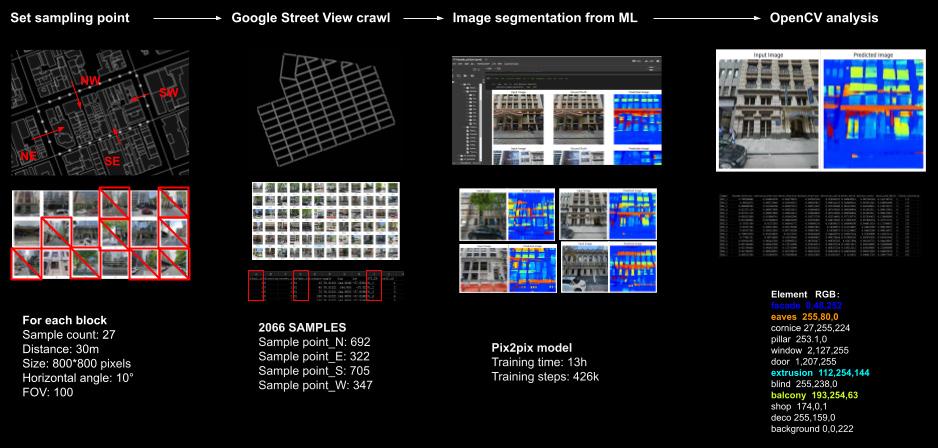
Streetview Data and Indicators
Streetview Data and Indicators
街景数据与特征计算
街景数据与特征计算
data & Open hours _ male label POI Streetview Data and Indicators

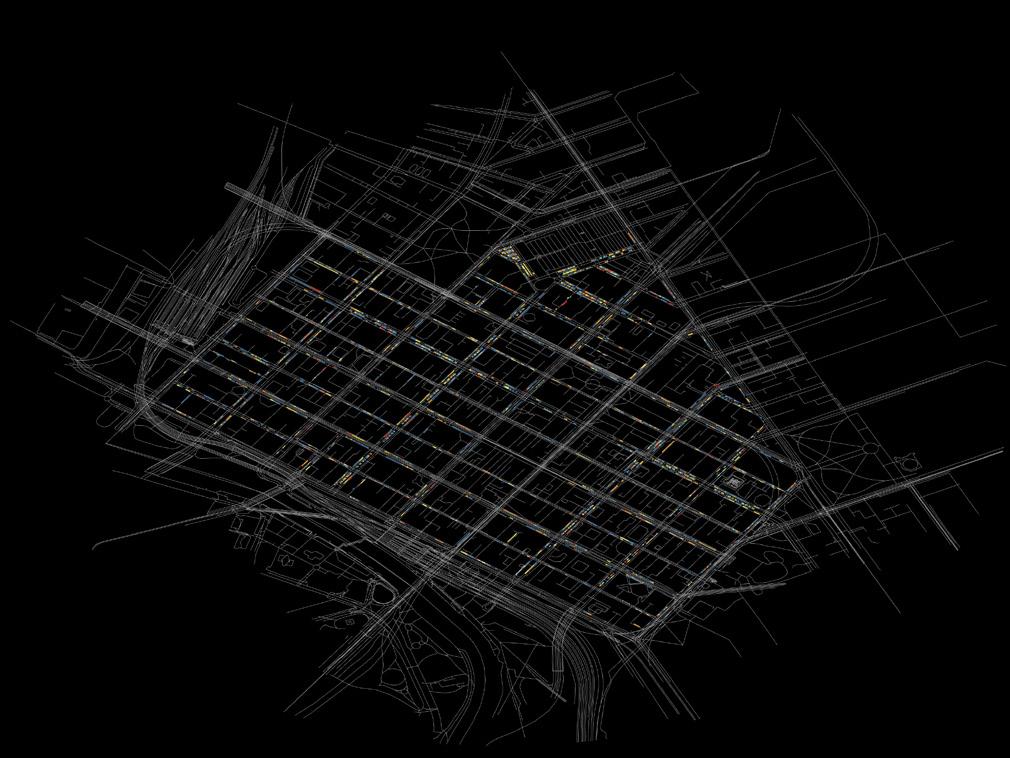
采集了沿着道路四个方向(即

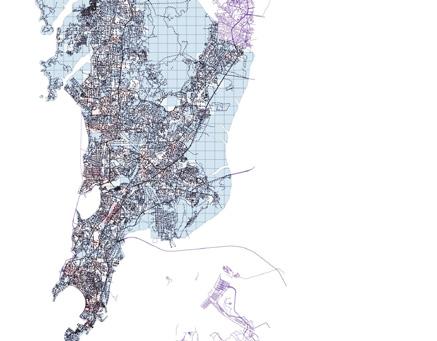
Streetview


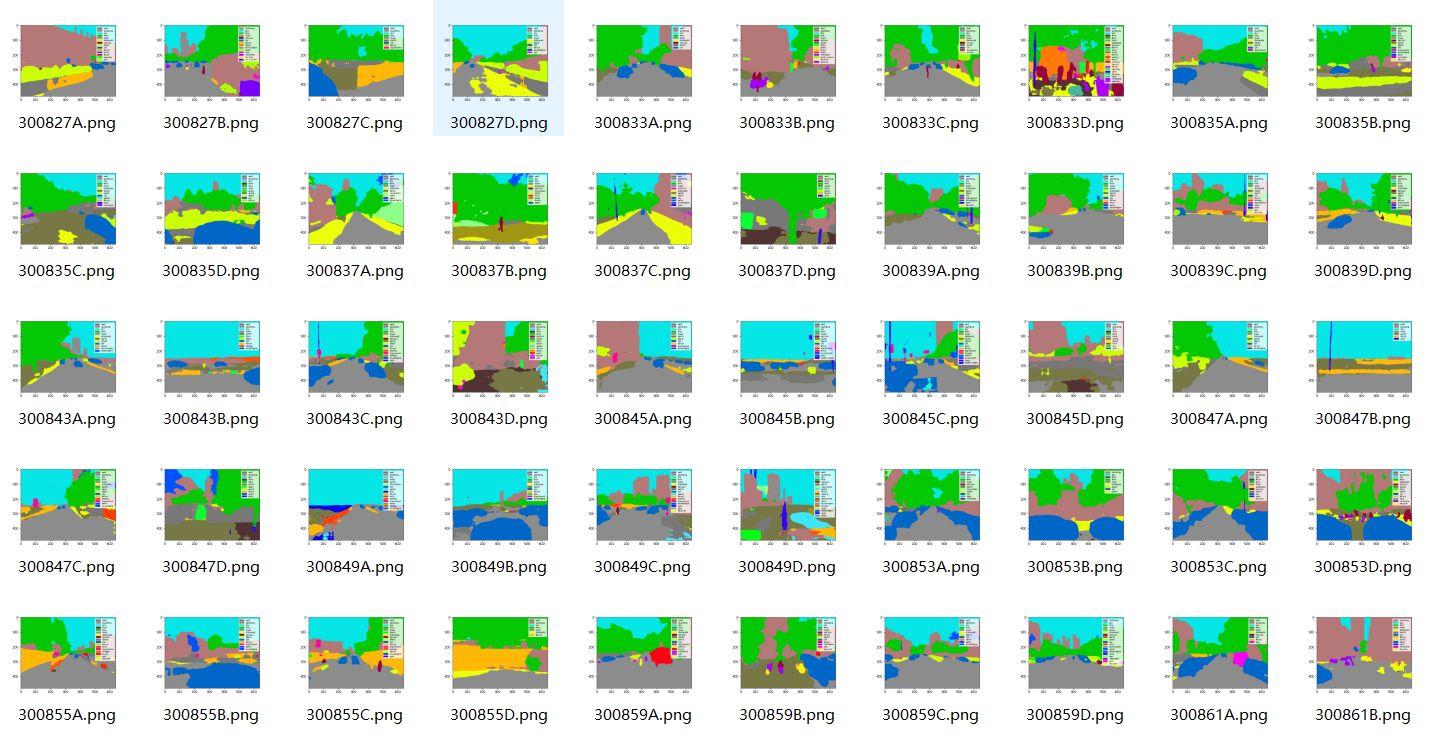
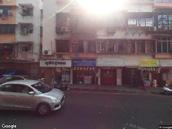
Sample size: 1382*4=55244

Streetview Data and Indicators
Streetview Data and Indicators
街景数据与特征计算
Territorial-enclosure
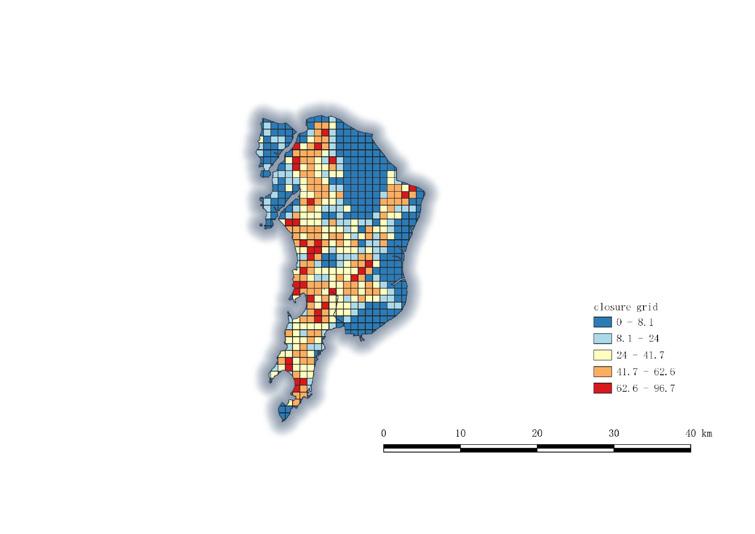
Images were collected along four directions of the
(Figure
×
pixels and a vertical angle of 0 degrees (spacing=0).
Sampling method: sampling every 200 meters. Select the point whose ID is an even number
Total: 13822 (average 21.26 points/ square)
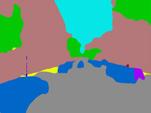

Surveillance
Activity-
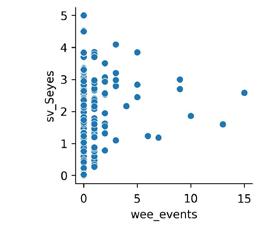
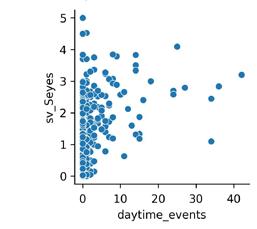
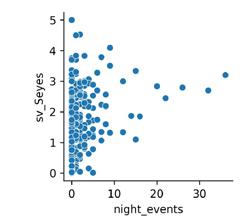
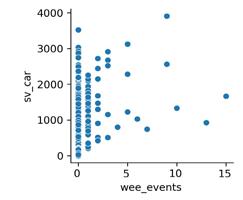
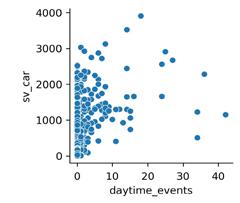
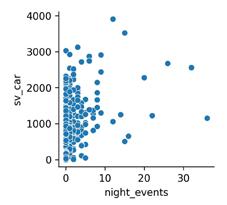
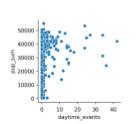
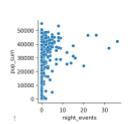
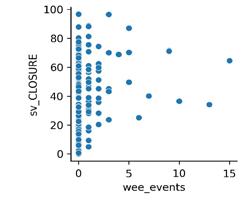
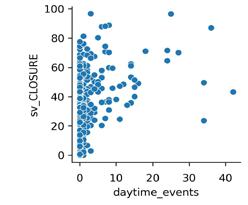
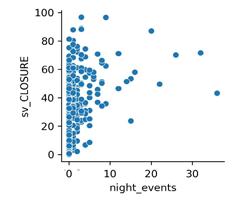
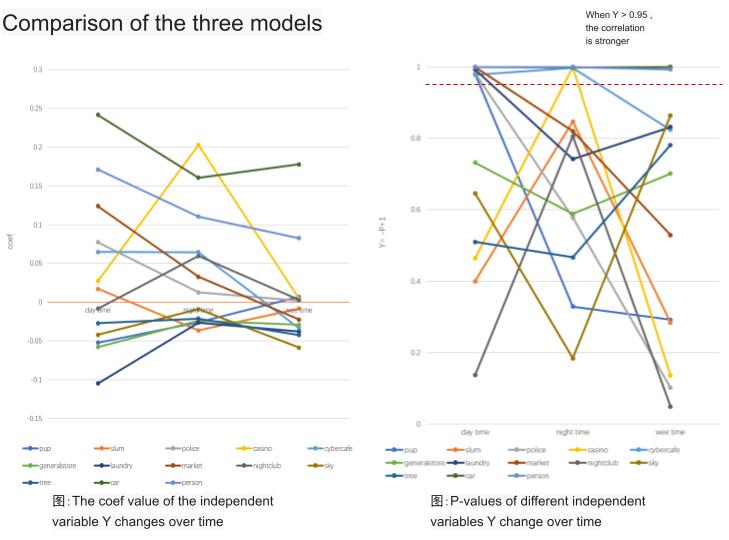
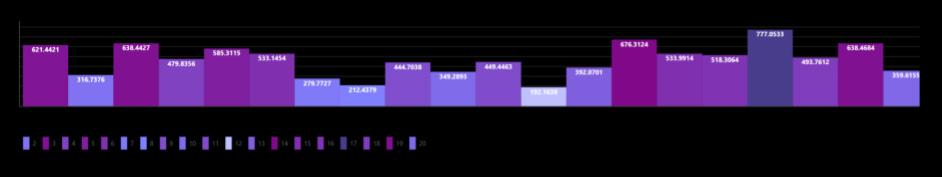
Model_daytime(06-18)
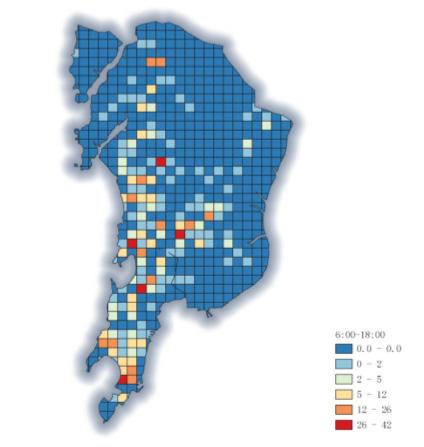
Model_daytime(06-18) correlation between X
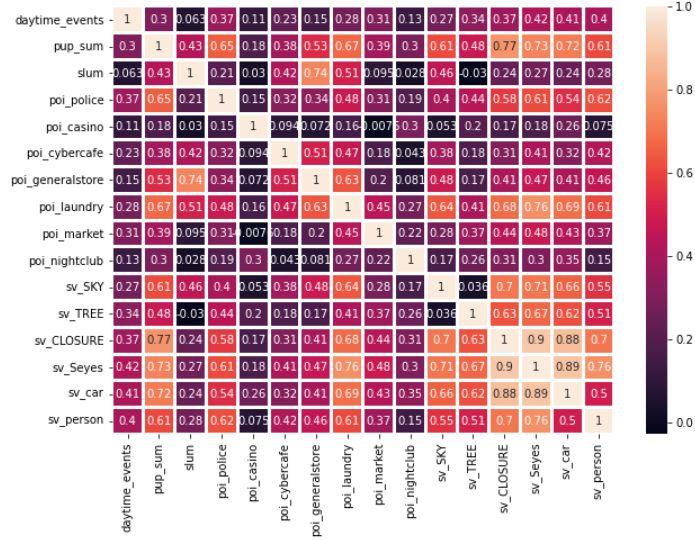
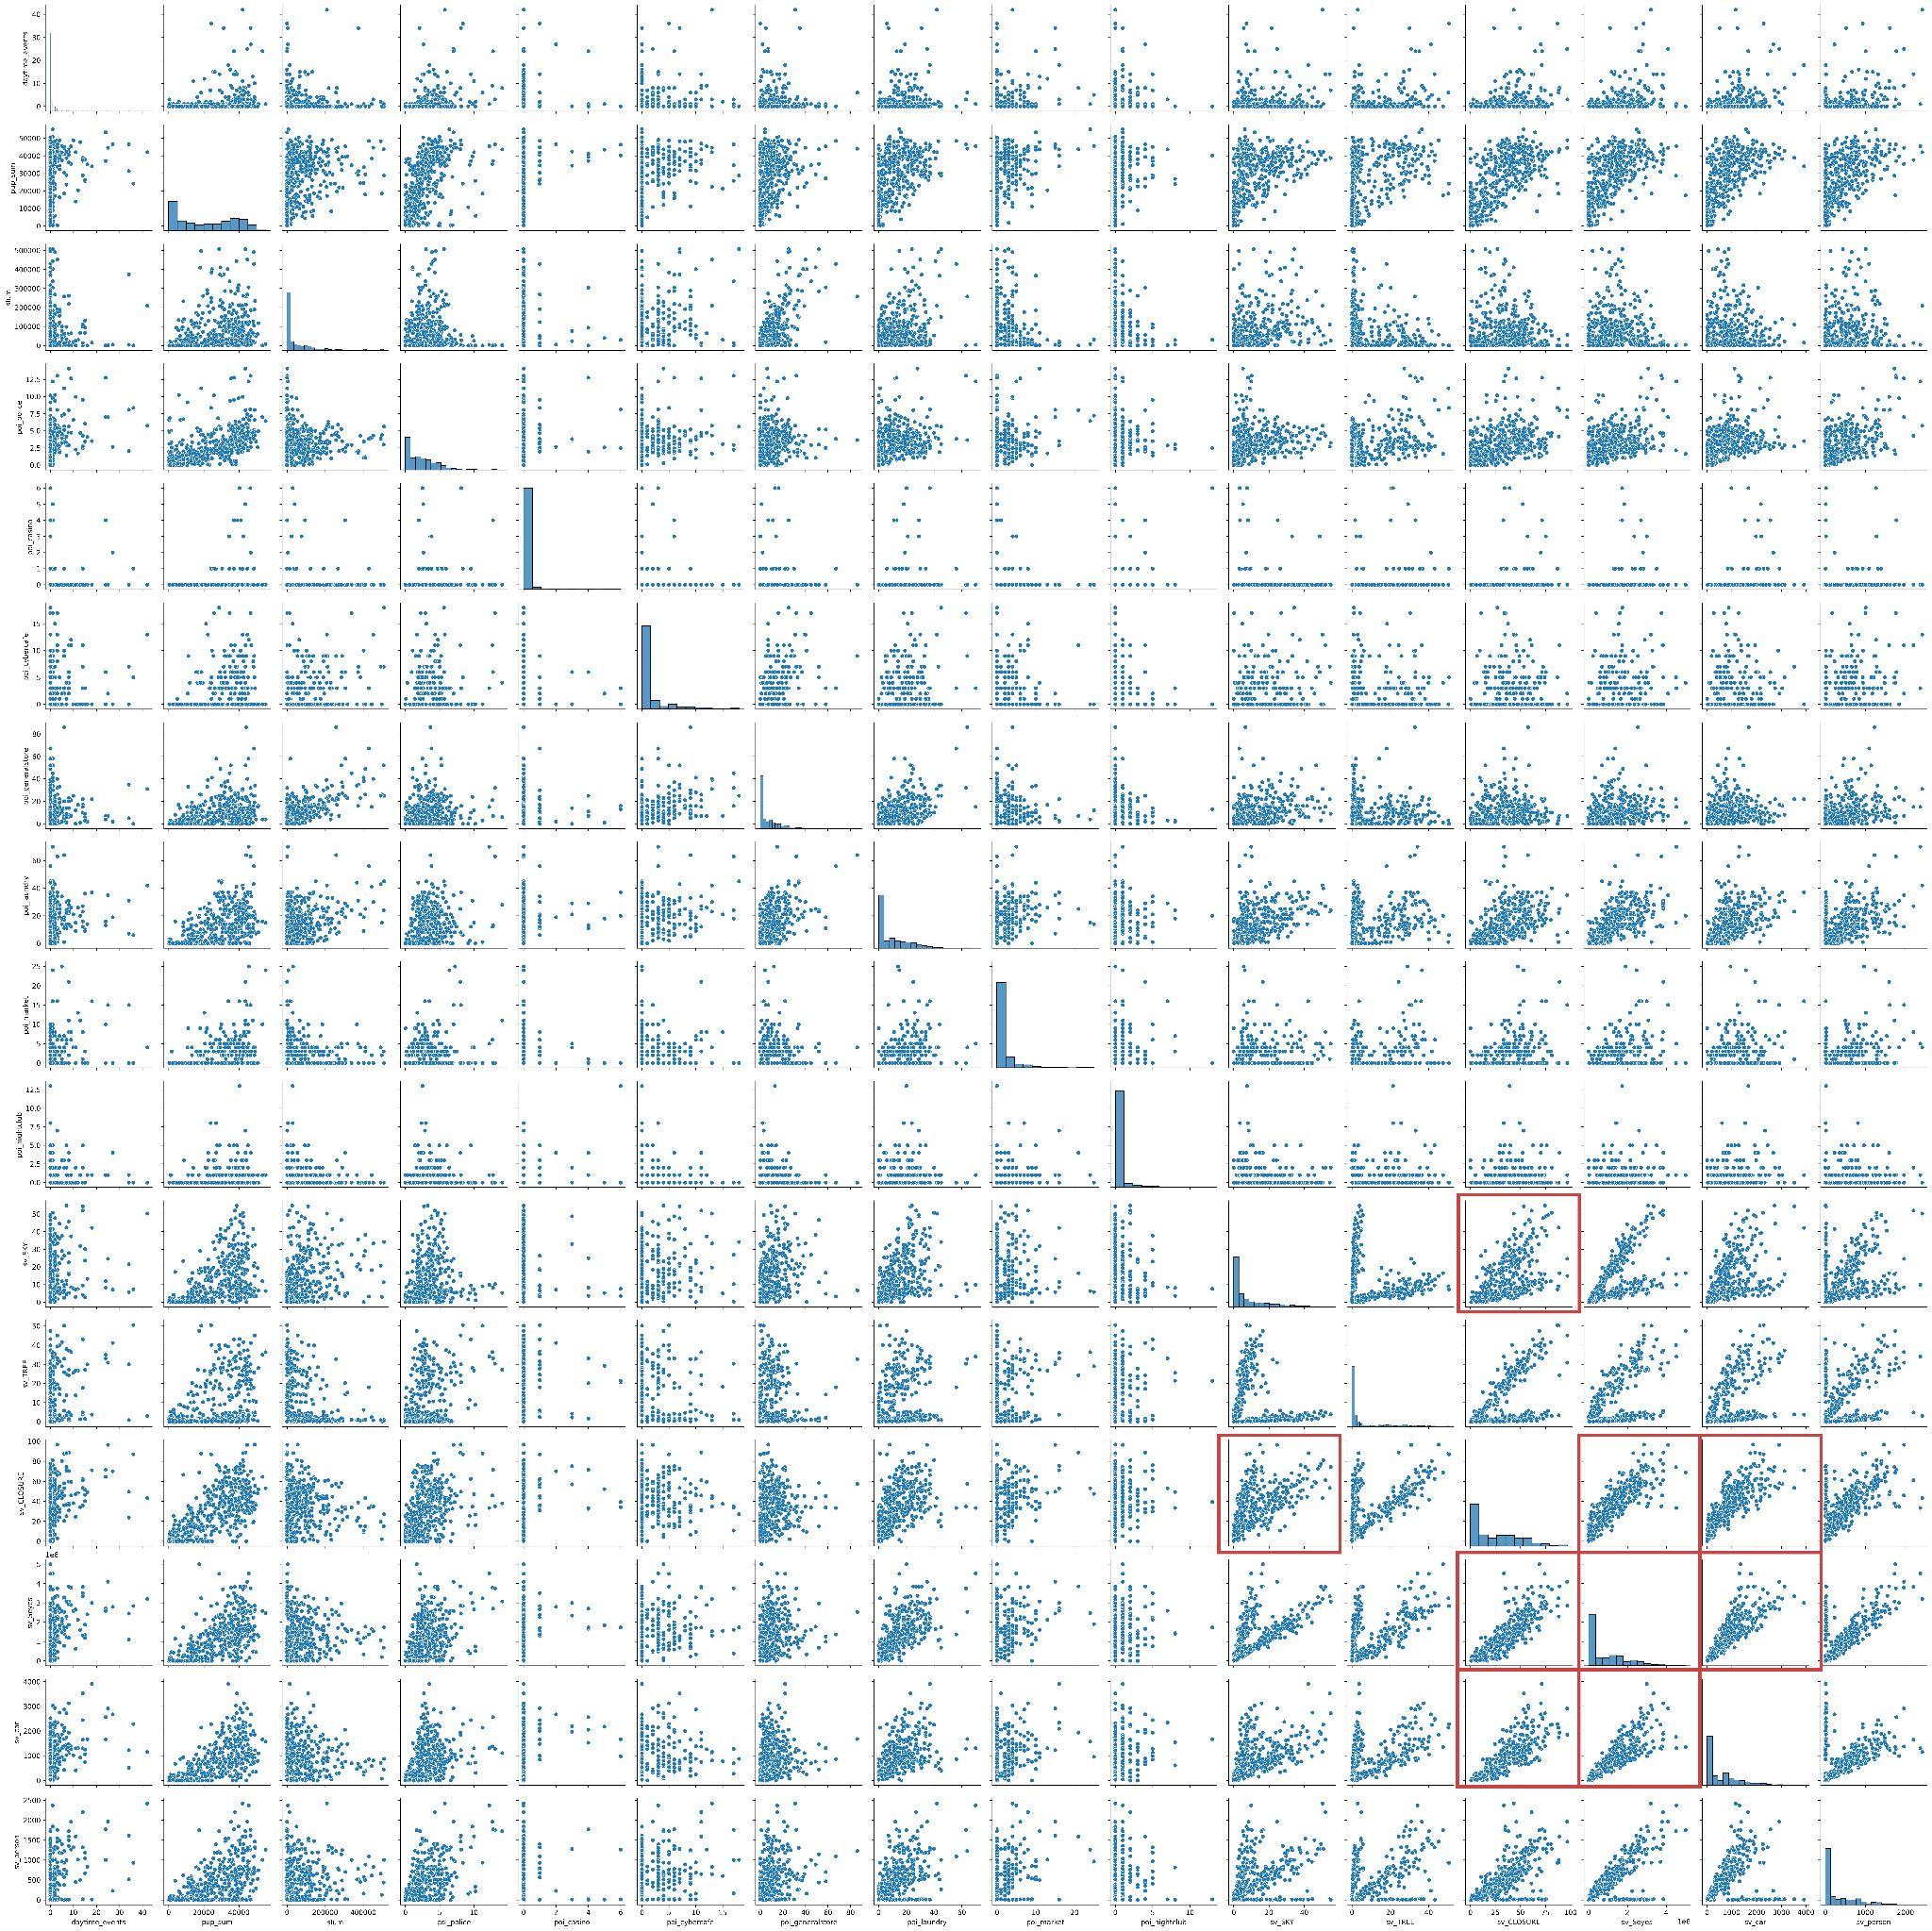
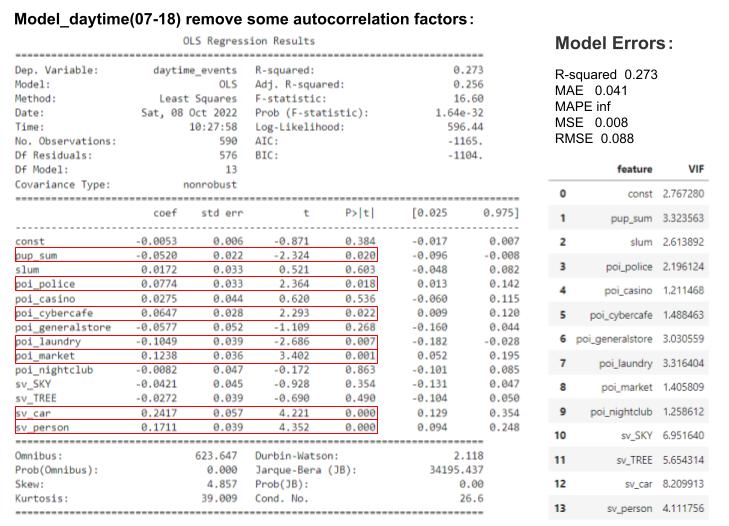
Positive Correlation: police(0.08)/ cyber_cafe(0.06)/ market(0.12)/ sv_car(0.24)/ sv_person(0.17)
Negative Correlation: pup_sum(-0.05)/ laundry(-0.10)
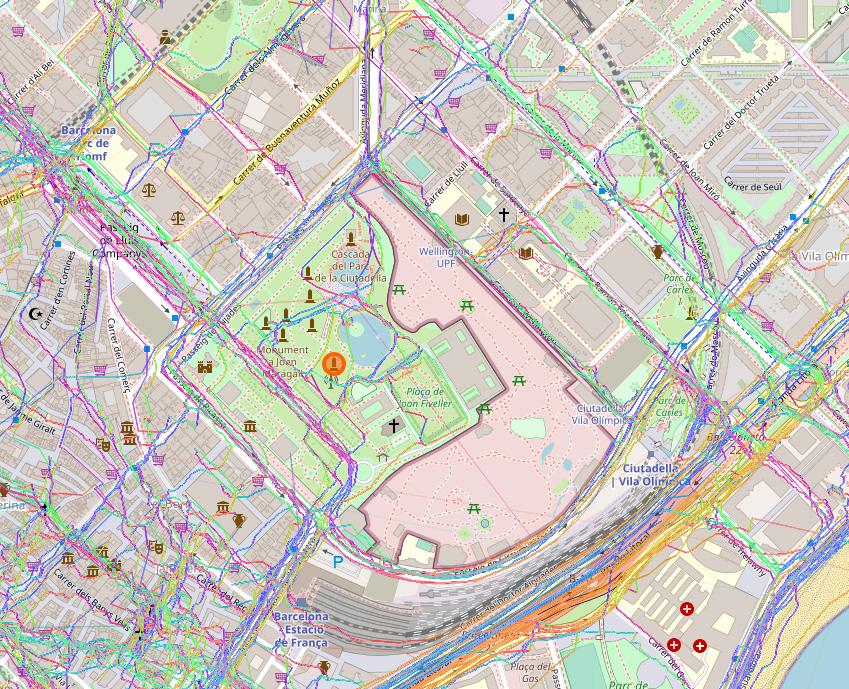
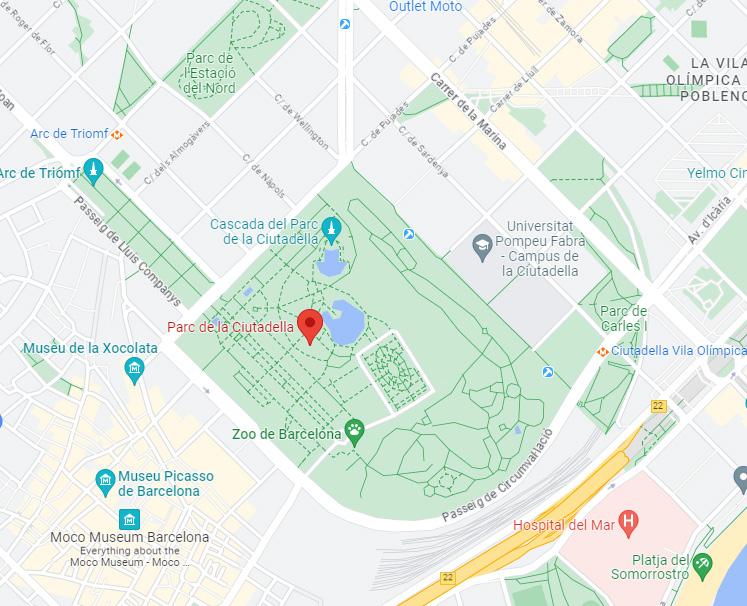
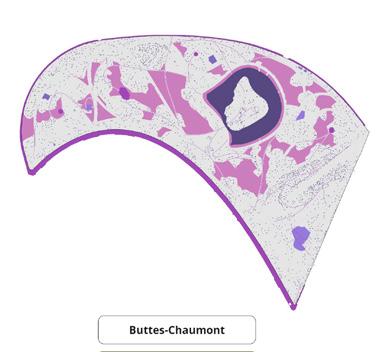
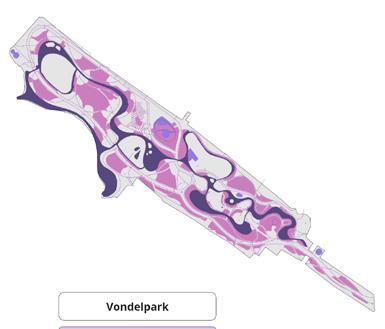
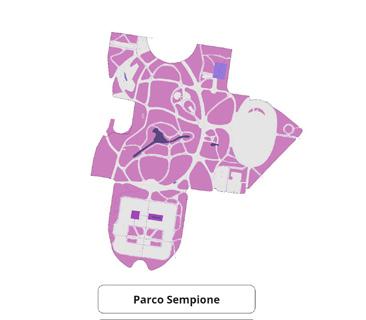
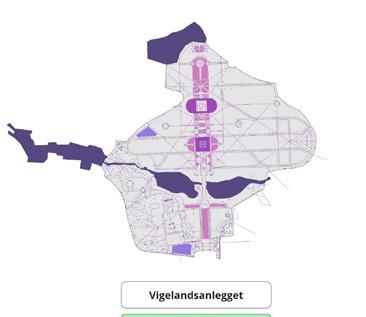
What makes a park popular?
A quantitative urban study by machine learning tools
picturesque buildings. Worth coming here for a calm walk. Dogs are not allowed unfortunately. Also a good spot for making photos. Many locals spend time here as well. The park is surrounded by many cafes so you can easy after find a place to sit and have a small snack”.
2023 Spring
AIA data-encoding course
tags_to_fetch =
[{'natural': 'tree'},
{'amenity': 'bench'},
{'amenity': 'fountain'},
{'amenity': 'drinking_water'},
{'historic': 'memorial'},
{'amenity': 'bicycle_parking',
{'amenity': 'bicycle_rental'},
{'amenity': 'waste_basket'},
{'amenity': 'playground'},
{'amenity': 'artwork'},
{'amenity': 'pcnic_site'},
{'amenity': 'restaurant'},
{'amenity': 'bar'},
{'amenity': 'toilets'},
{'highway': 'footway'},
{'landuse': 'grass'},
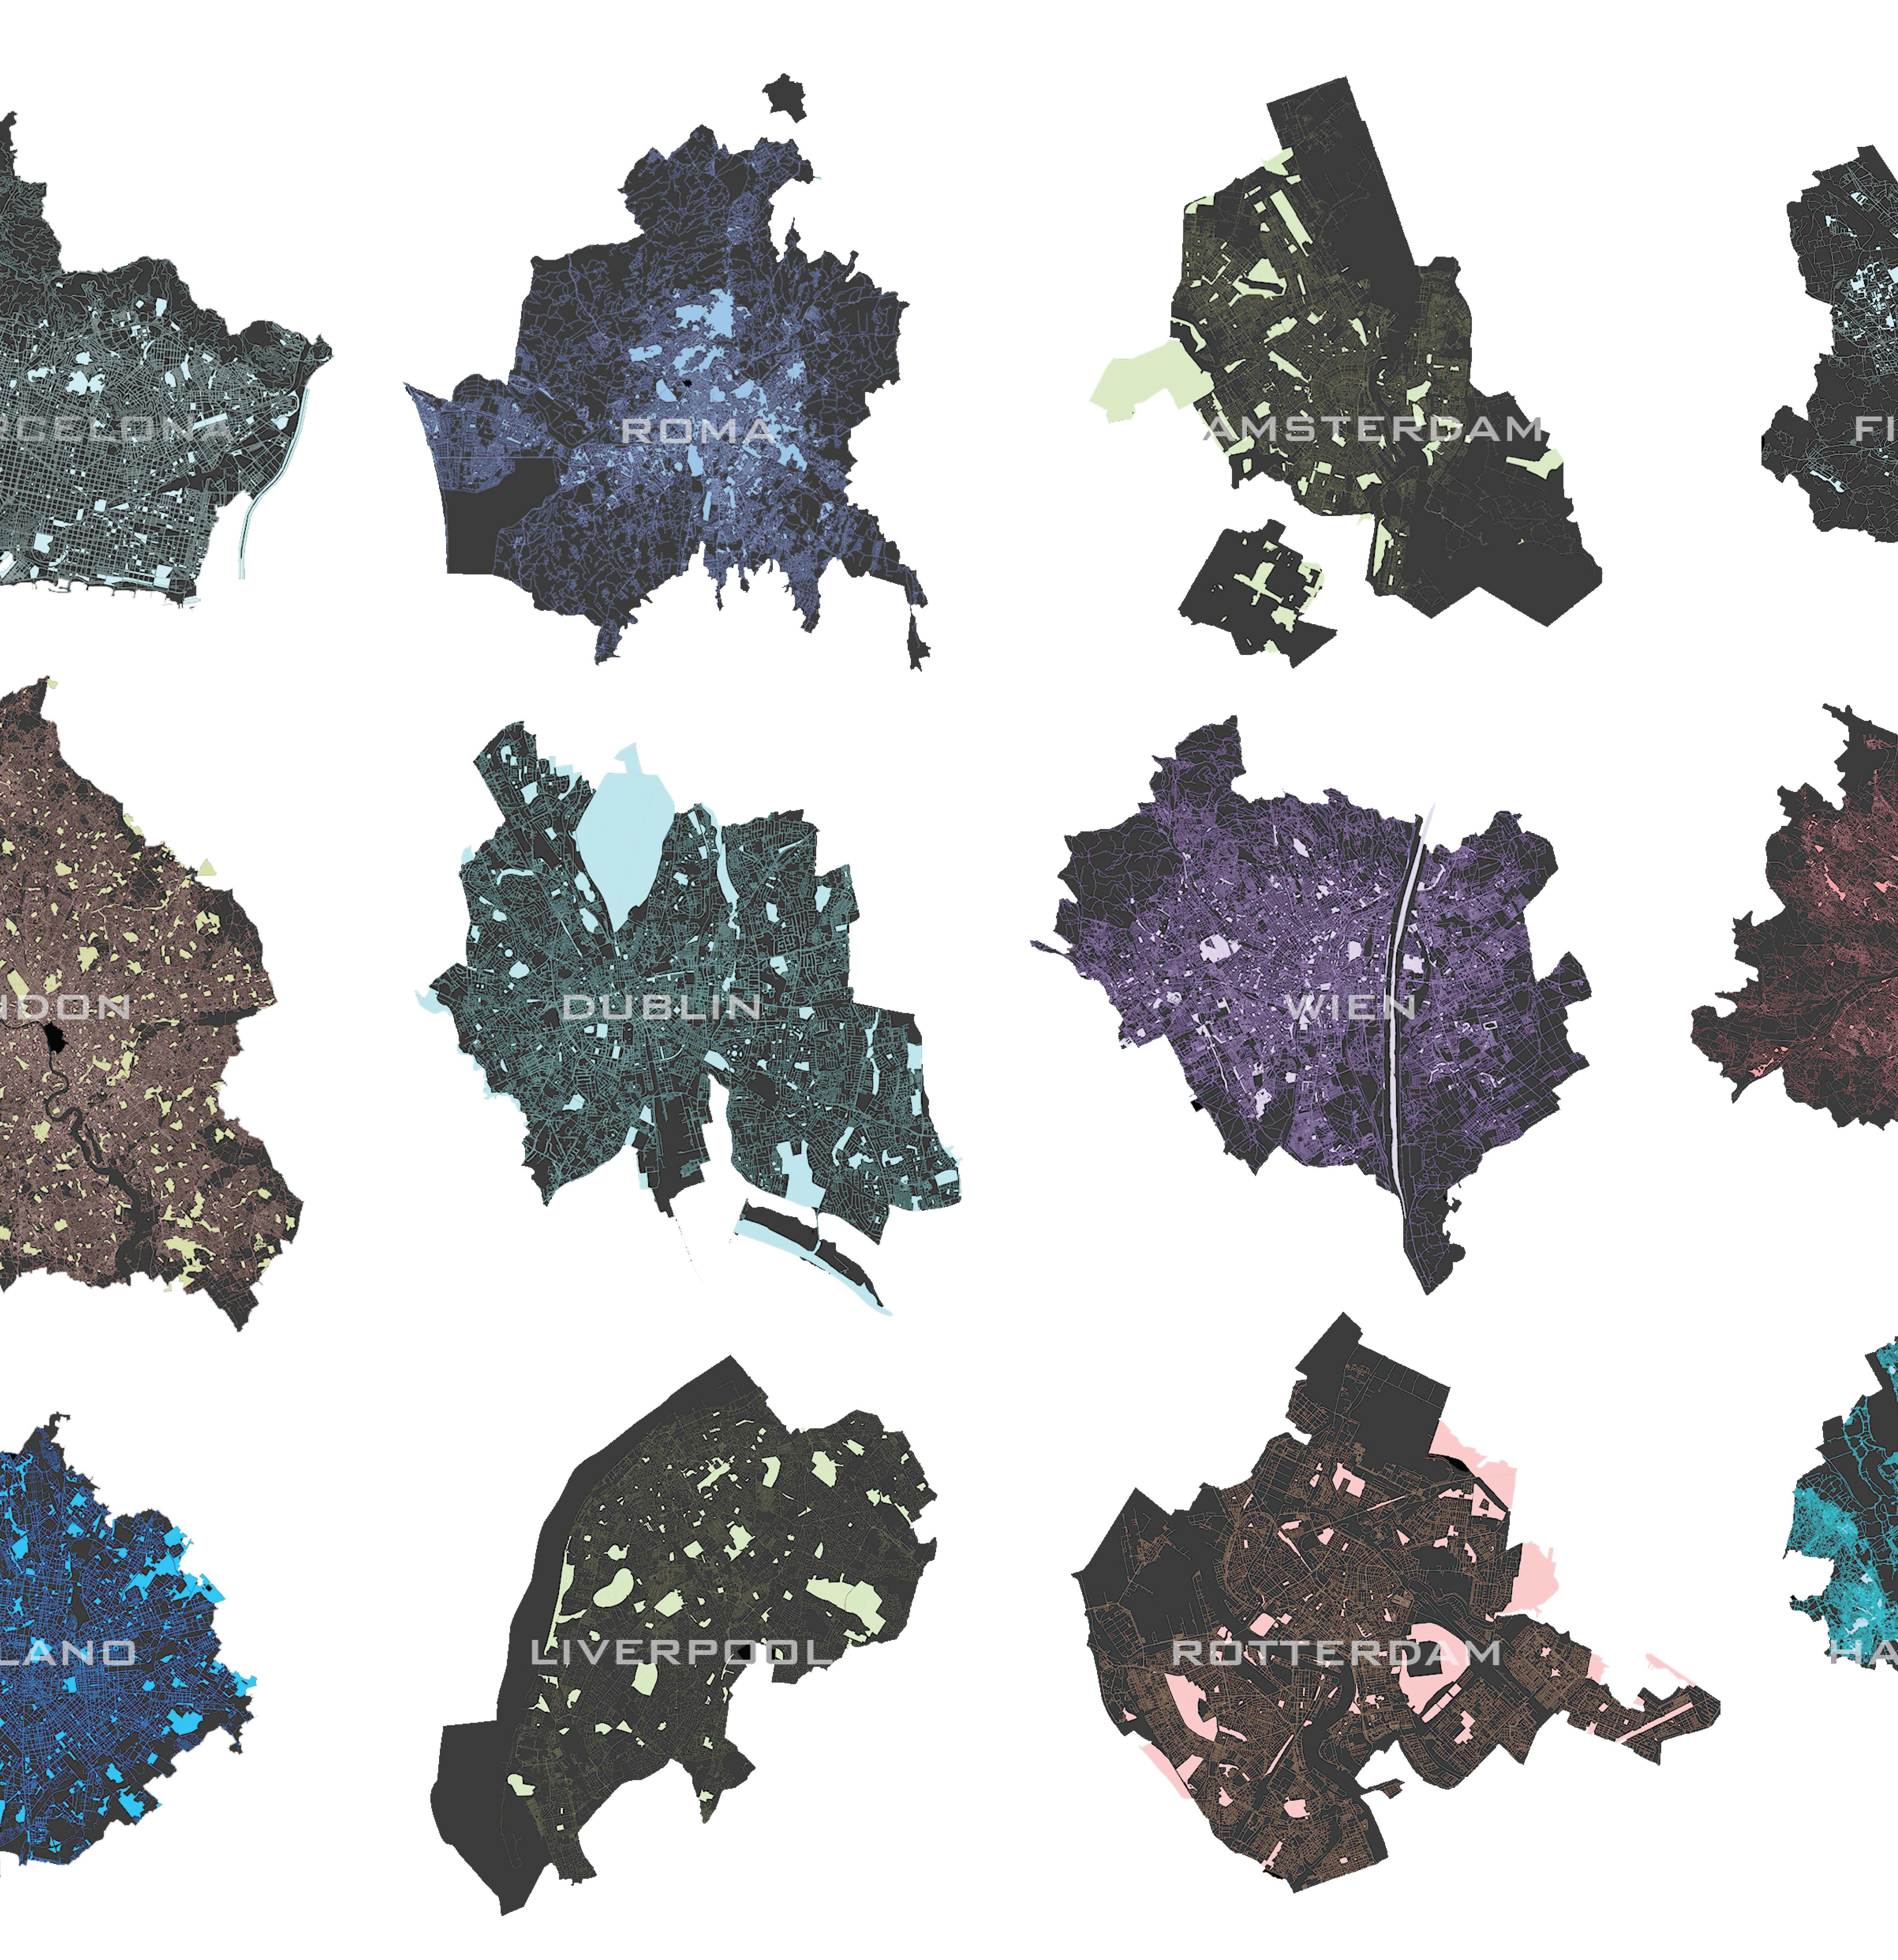
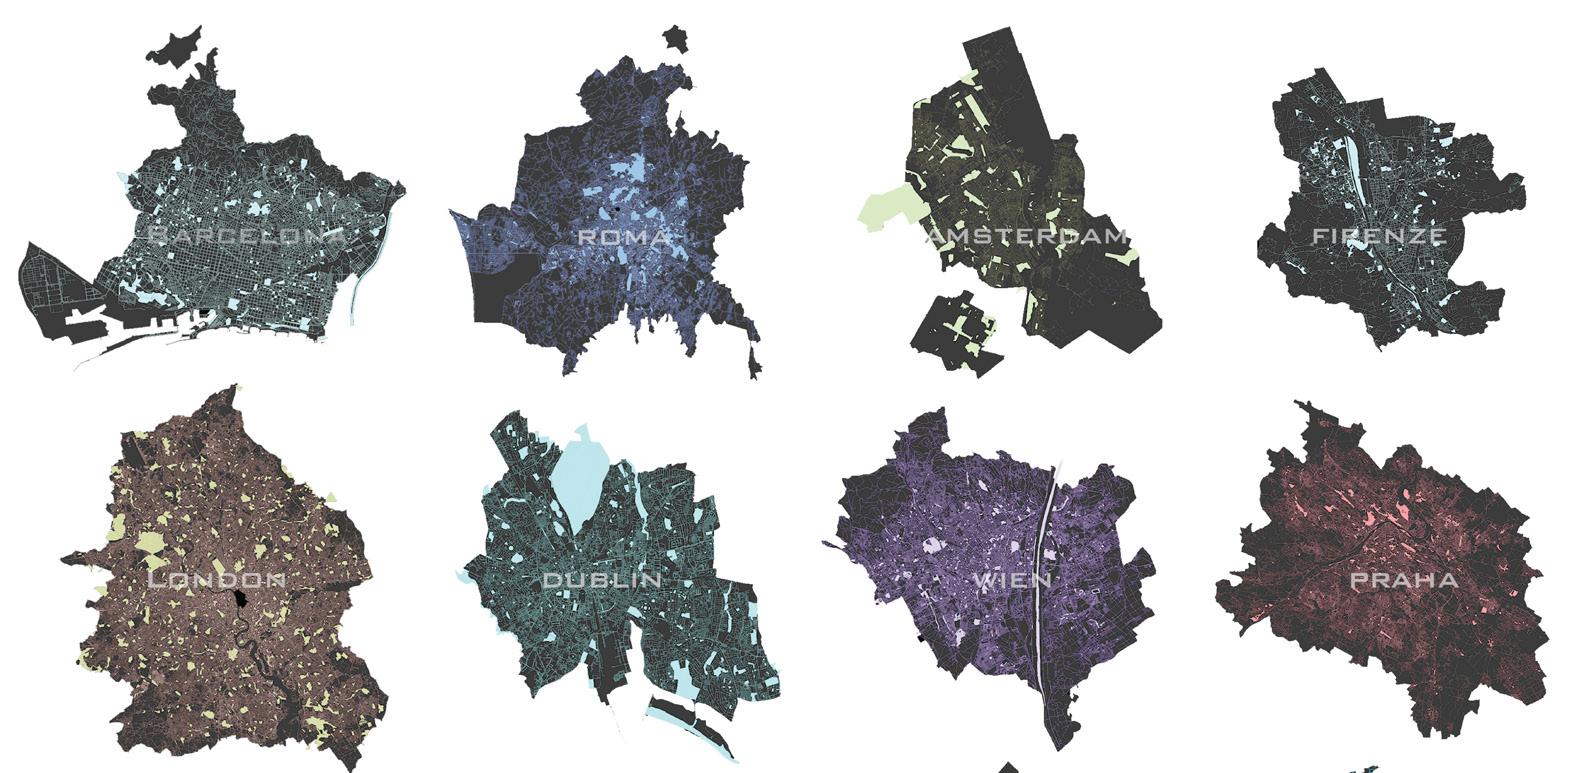
array( ['Firenze', 'Rotterdam', 'Utrecht', 'Lille', 'Venezia', 'Napoli', 'Toulouse', 'Bologna', 'Lisboa', 'Porto', 'Wien', 'Lyon', 'Stuttgart', 'Geneva', 'Kyiv', 'Frankfurt am Main', 'Marseille', 'Dublin', 'Strasbourg', 'Bordeaux', 'Nantes', 'Warszawa', 'Praha', 'Krakovia', 'Granada', 'A Coruña', 'Sevilla', 'Barcelona', 'Hamburg', 'Amsterdam', 'Luxembourg', 'Liverpool', 'Manchester', 'Munchen', 'Berlin', 'Paris', 'Bristol', 'Birmingham', 'Madrid', 'London', 'Milano', 'Roma']
{'natural': 'wood'}]

tags_to_fetch =
[{'natural': 'tree'}, {'amenity': 'bench'}, {'amenity': 'fountain'}, {'amenity': 'drinking_water'}, {'historic': 'memorial'}, {'amenity': 'bicycle_parking', {'amenity': 'bicycle_rental'}, {'amenity': 'waste_basket'}, {'amenity': 'playground'}, {'amenity': 'artwork'}, {'amenity': 'pcnic_site'}, {'amenity': 'restaurant'}, {'amenity': 'bar'}, {'amenity': 'toilets'}, {'highway': 'footway'}, {'landuse': 'grass'}, {'natural': 'wood'}]
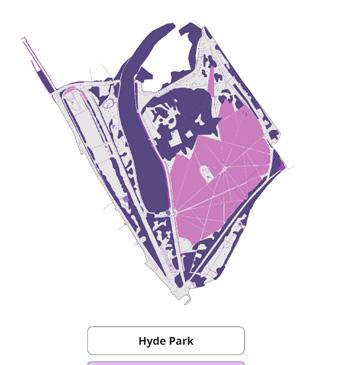
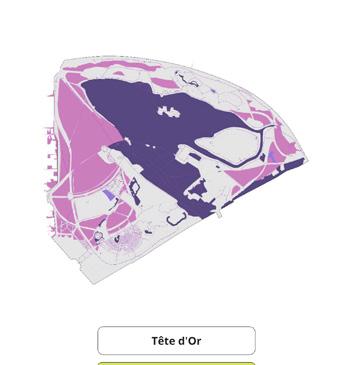
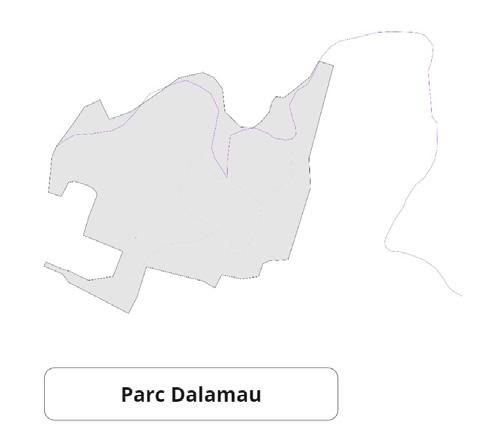
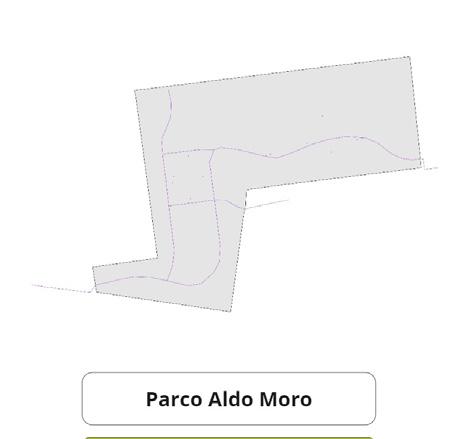
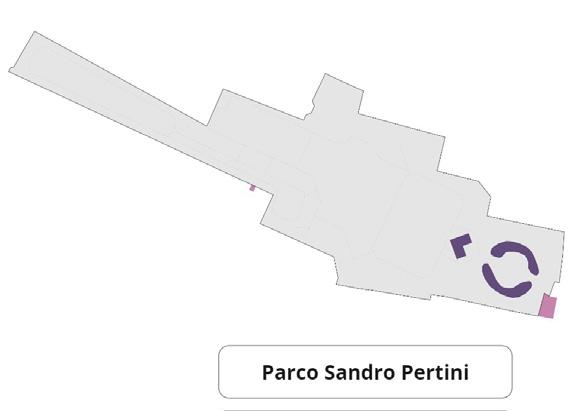
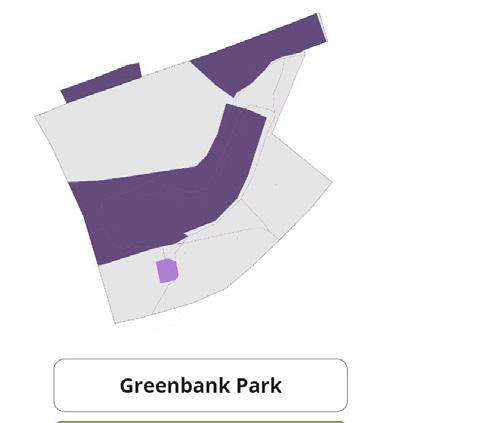
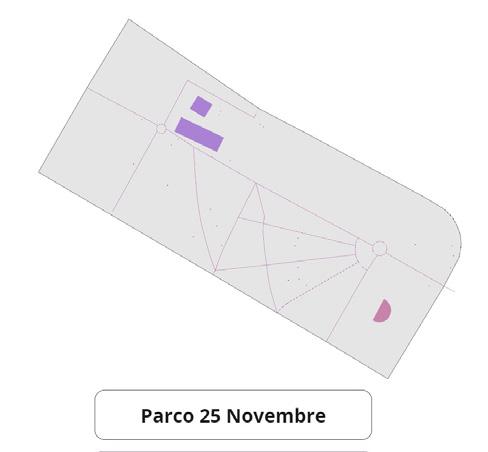
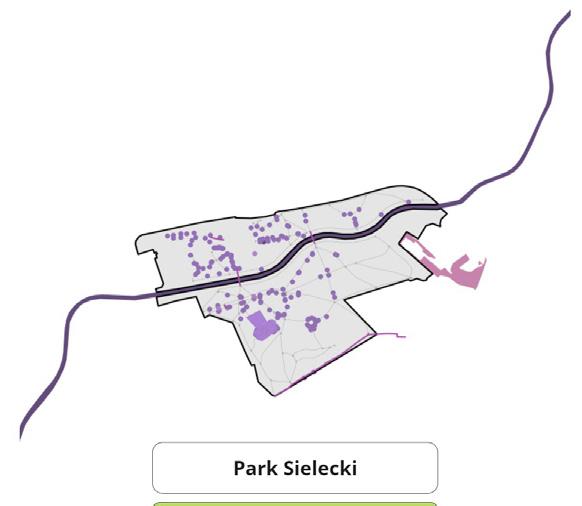
Public parks are vital urban assets. Their popularity depends on features like facilities,diversity, safety, and accessibility. Leveraging data on these features can help formulate strategies to improve lesser-used parks, increasing public engagement in urban spaces.
array( ['Firenze', 'Rotterdam', 'Utrecht', 'Lille', 'Venezia', 'Napoli', 'Toulouse', 'Bologna', 'Lisboa', 'Porto', 'Wien', 'Lyon', 'Stuttgart', 'Geneva', 'Kyiv', 'Frankfurt am Main', 'Marseille', 'Dublin', 'Strasbourg', 'Bordeaux', 'Nantes', 'Warszawa', 'Praha', 'Krakovia',

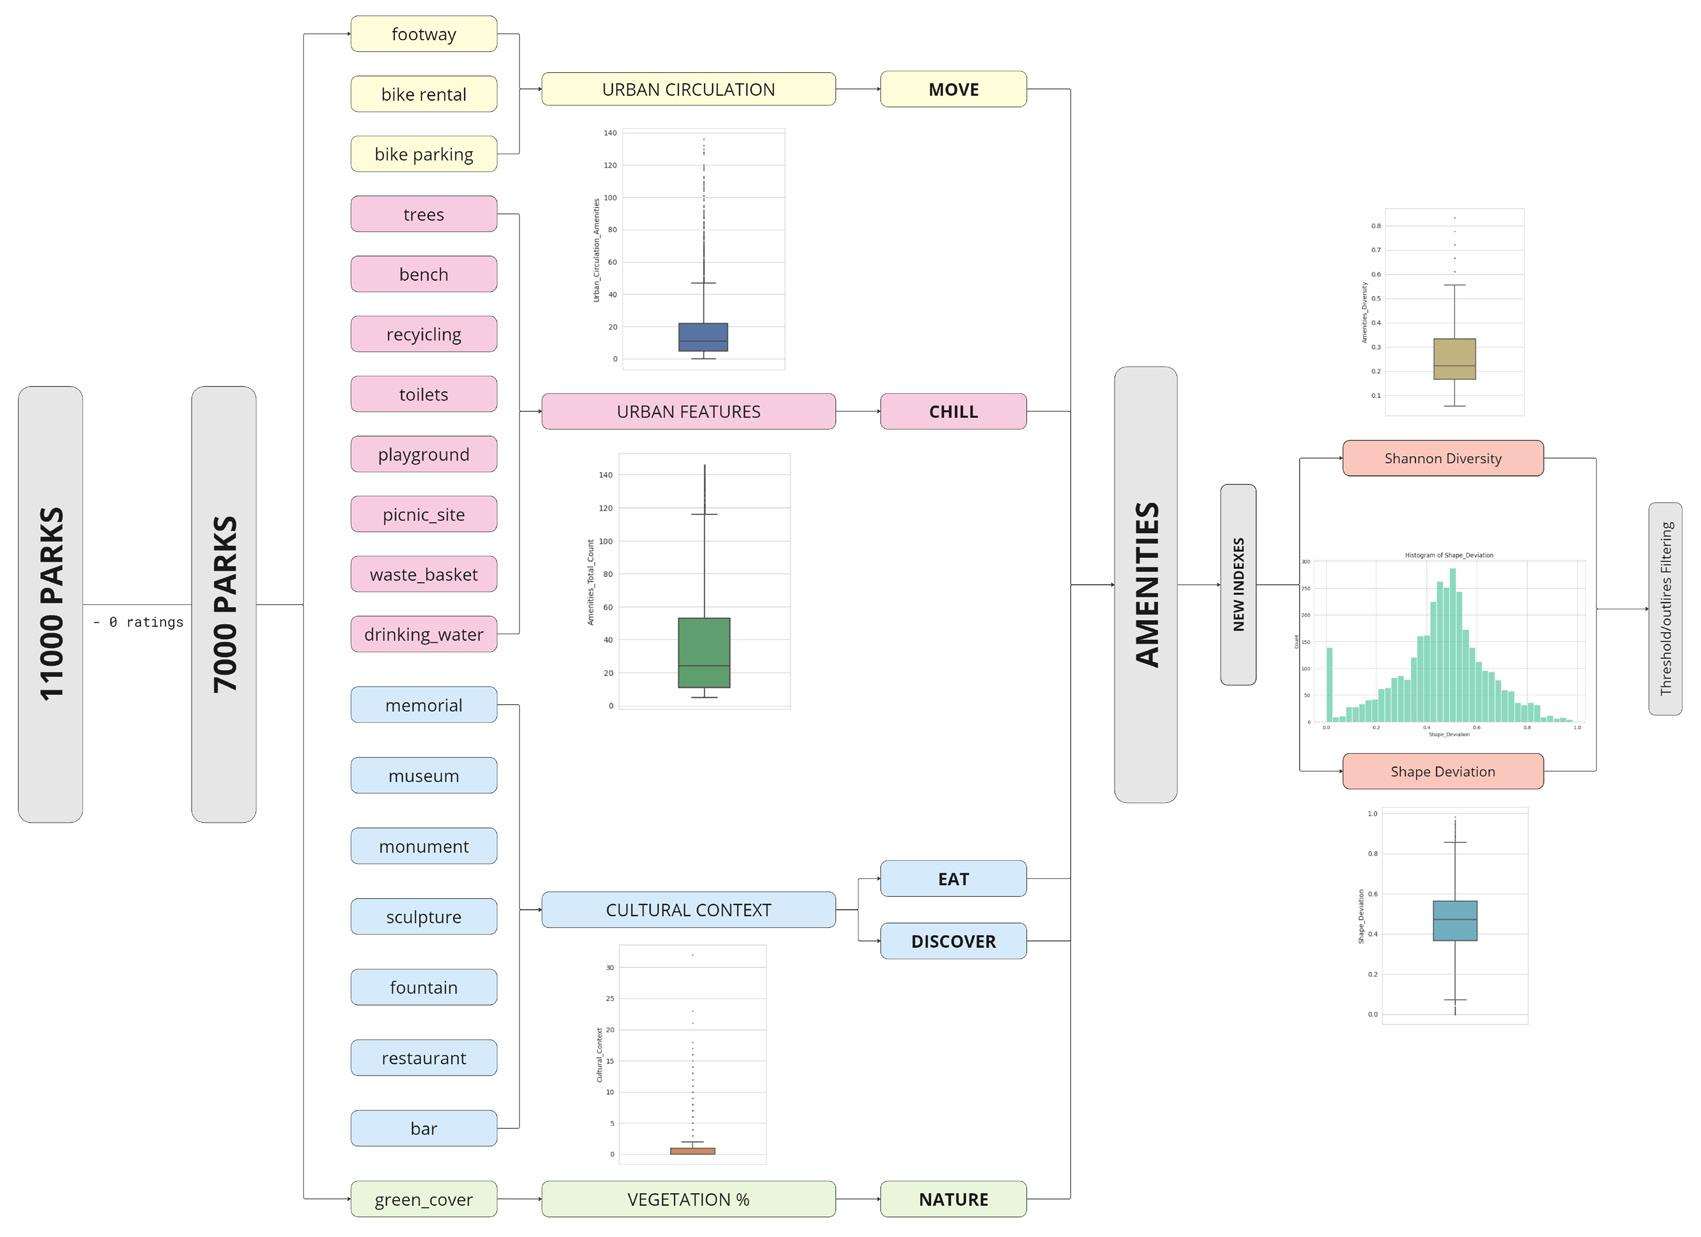
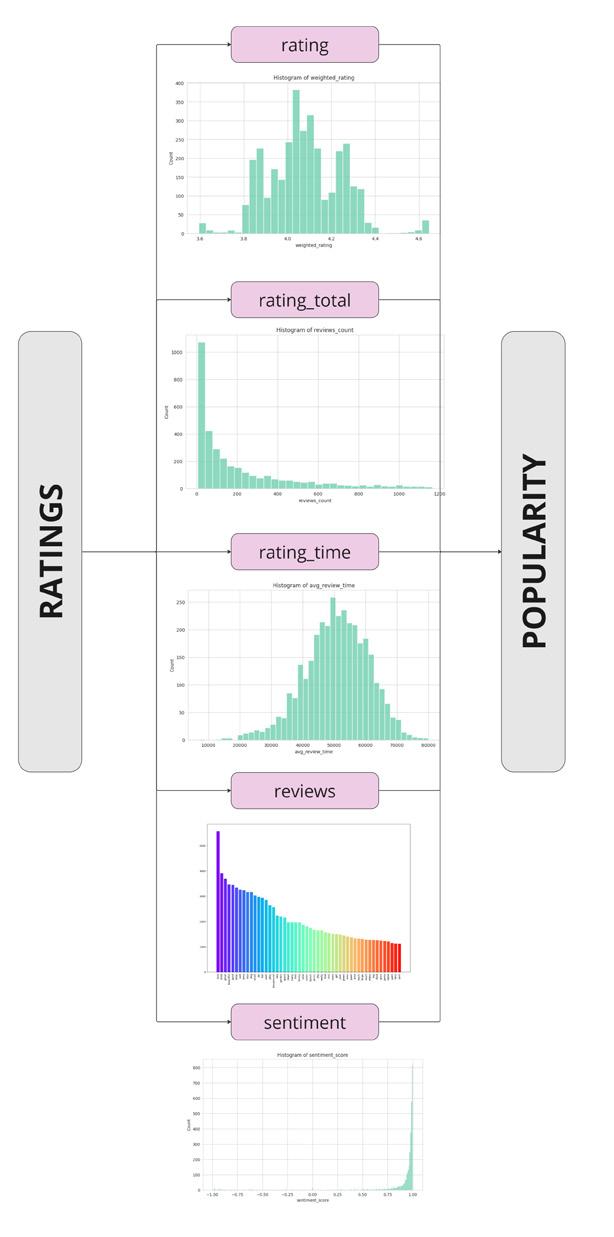
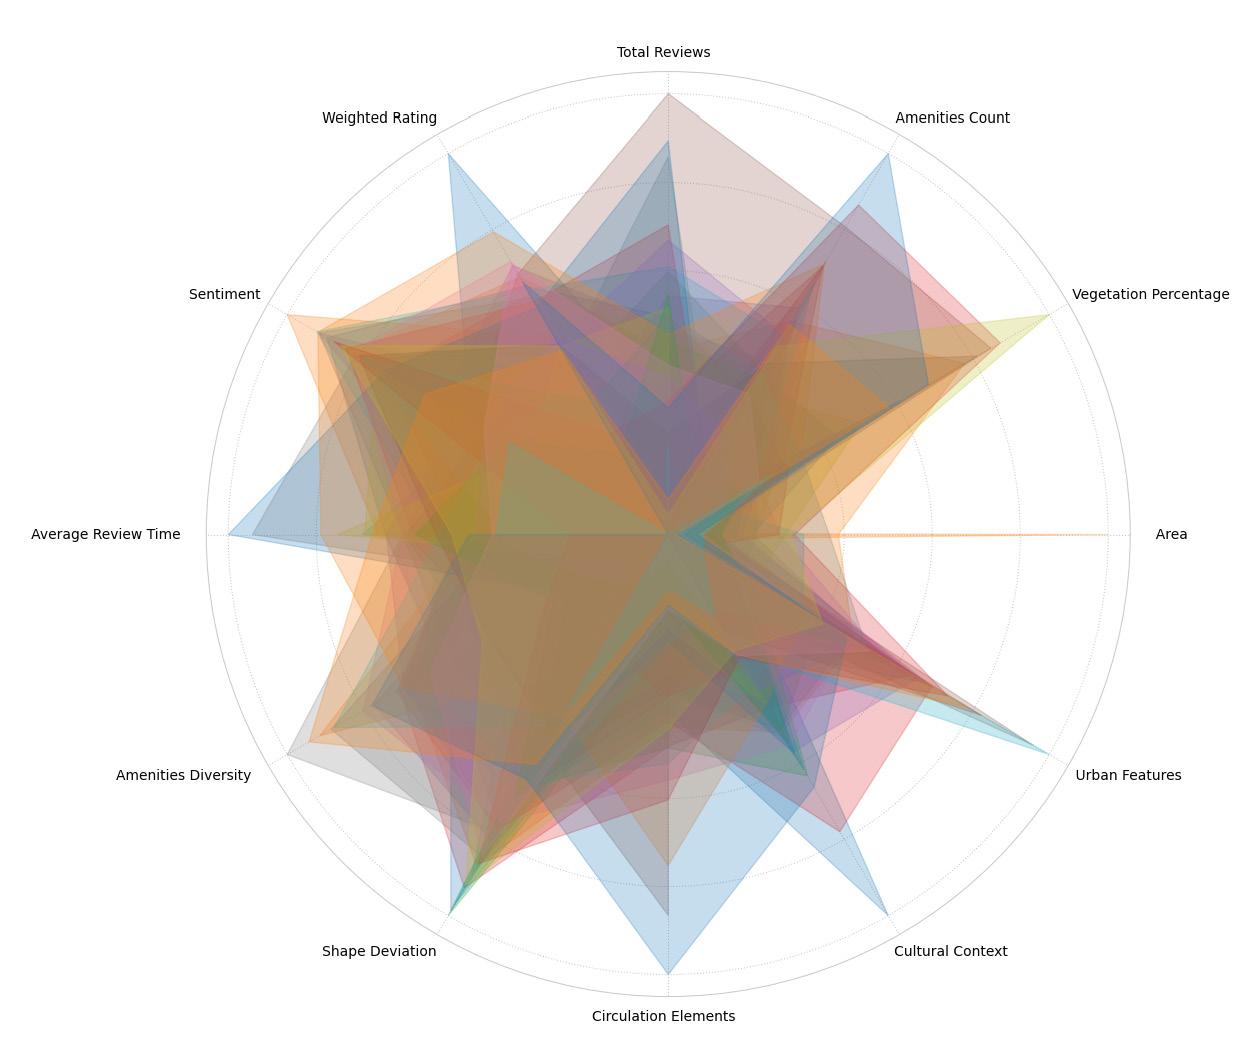
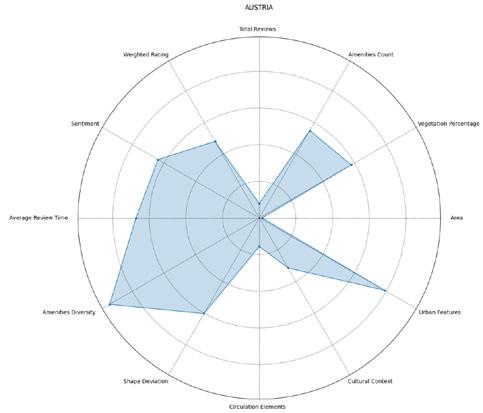
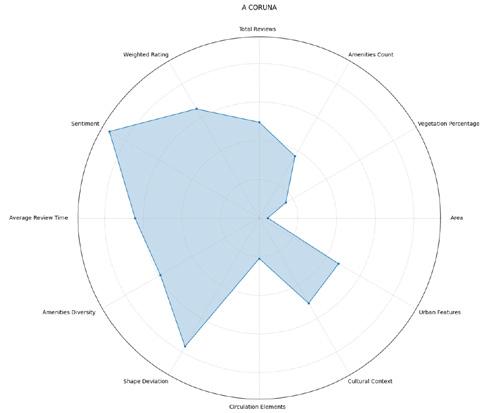
After all the direct application that didnt emerge acceptable patterns, we ended up with a 3000 points dataset and those notable features. We begin with a Parallel Coordinates Plot overlaid with a Spider Chart, representing grouped parks per cities. Though seemingly chaotic, the overlay provides a multi-dimensional perspective while we can distinguish weighted rating and sentiment score colors giving an initial segmentation for Italy and Germany.
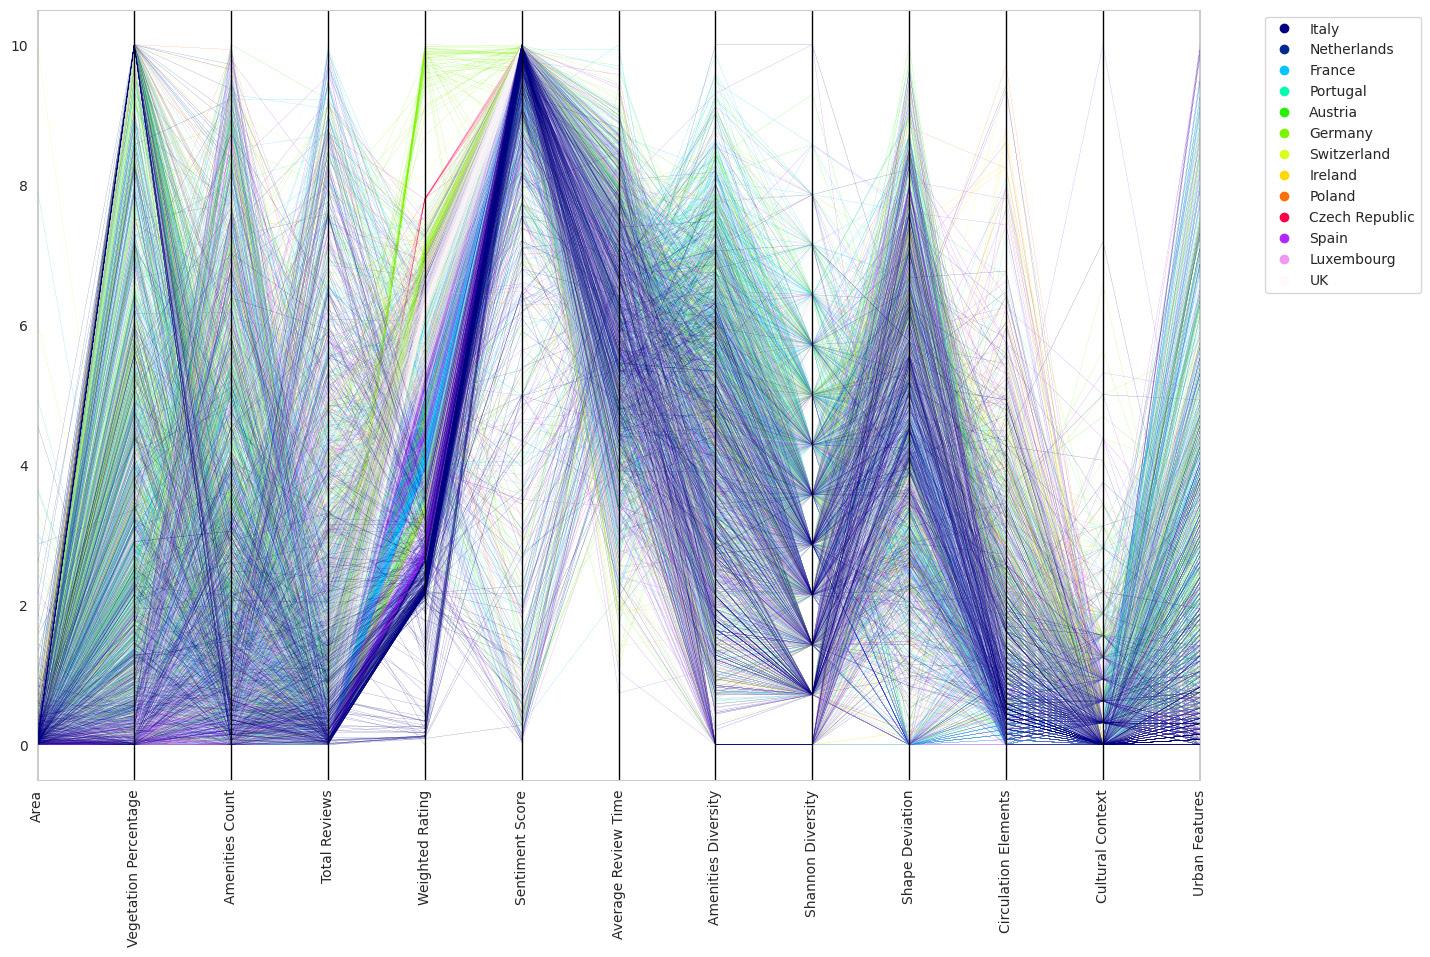
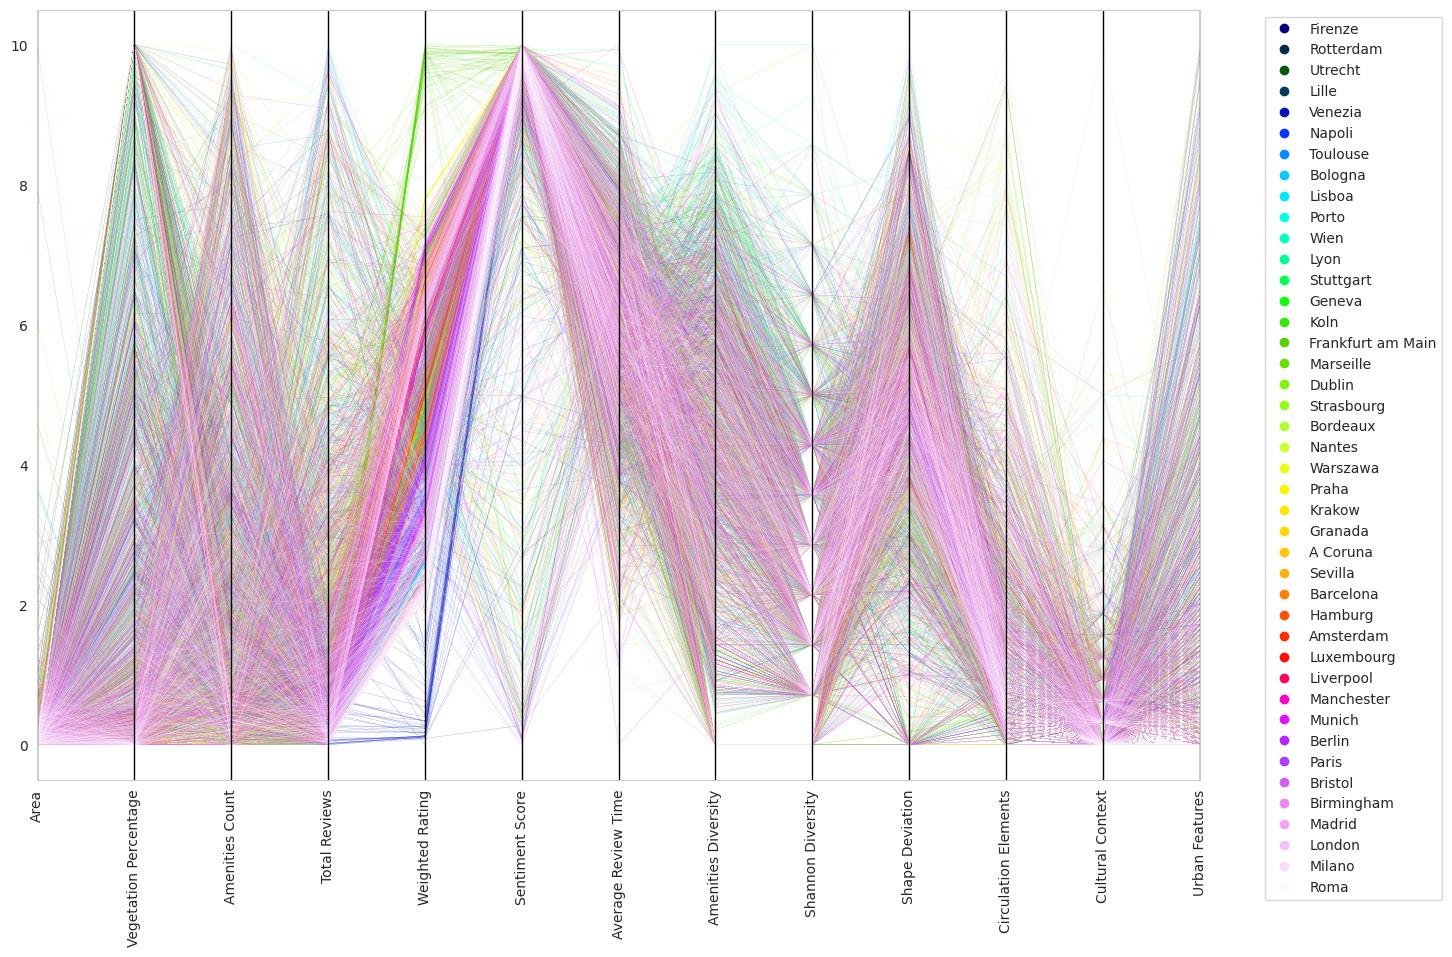
We now drill down to individual cities using the same plot structure. This city-centric view reveals local patterns that might be obscured in larger groups like the locally low ratings of Napoli and the high ratings of Stuttgart.
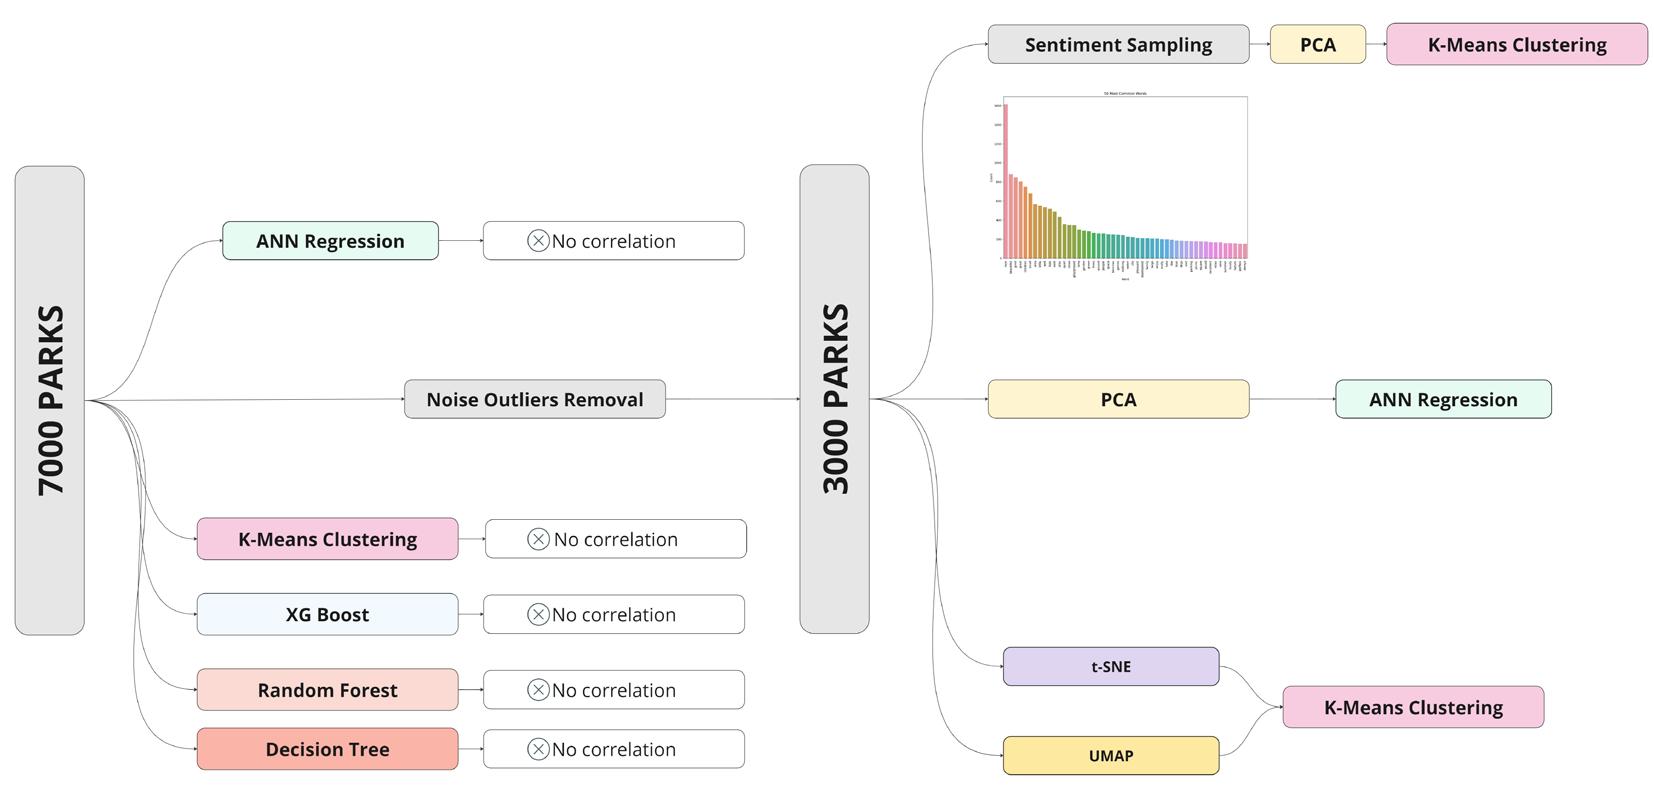
We started with a gut feeling that there was a direct and linear relation between the scores of a park and it’s appreciation but we had to rethink that very quickly as we didn’t find any relation. We removed the noise and reduced our dataset from ouliers to work on a smaller set that again wasn’t promising, what gave us a promising result was grouping a subset of parks that has a general very good feedback and we started to look for relations there leaving behind the attempt of finding a relation between people’s opinion an park’s urban design. Following a guidethrow of that process.

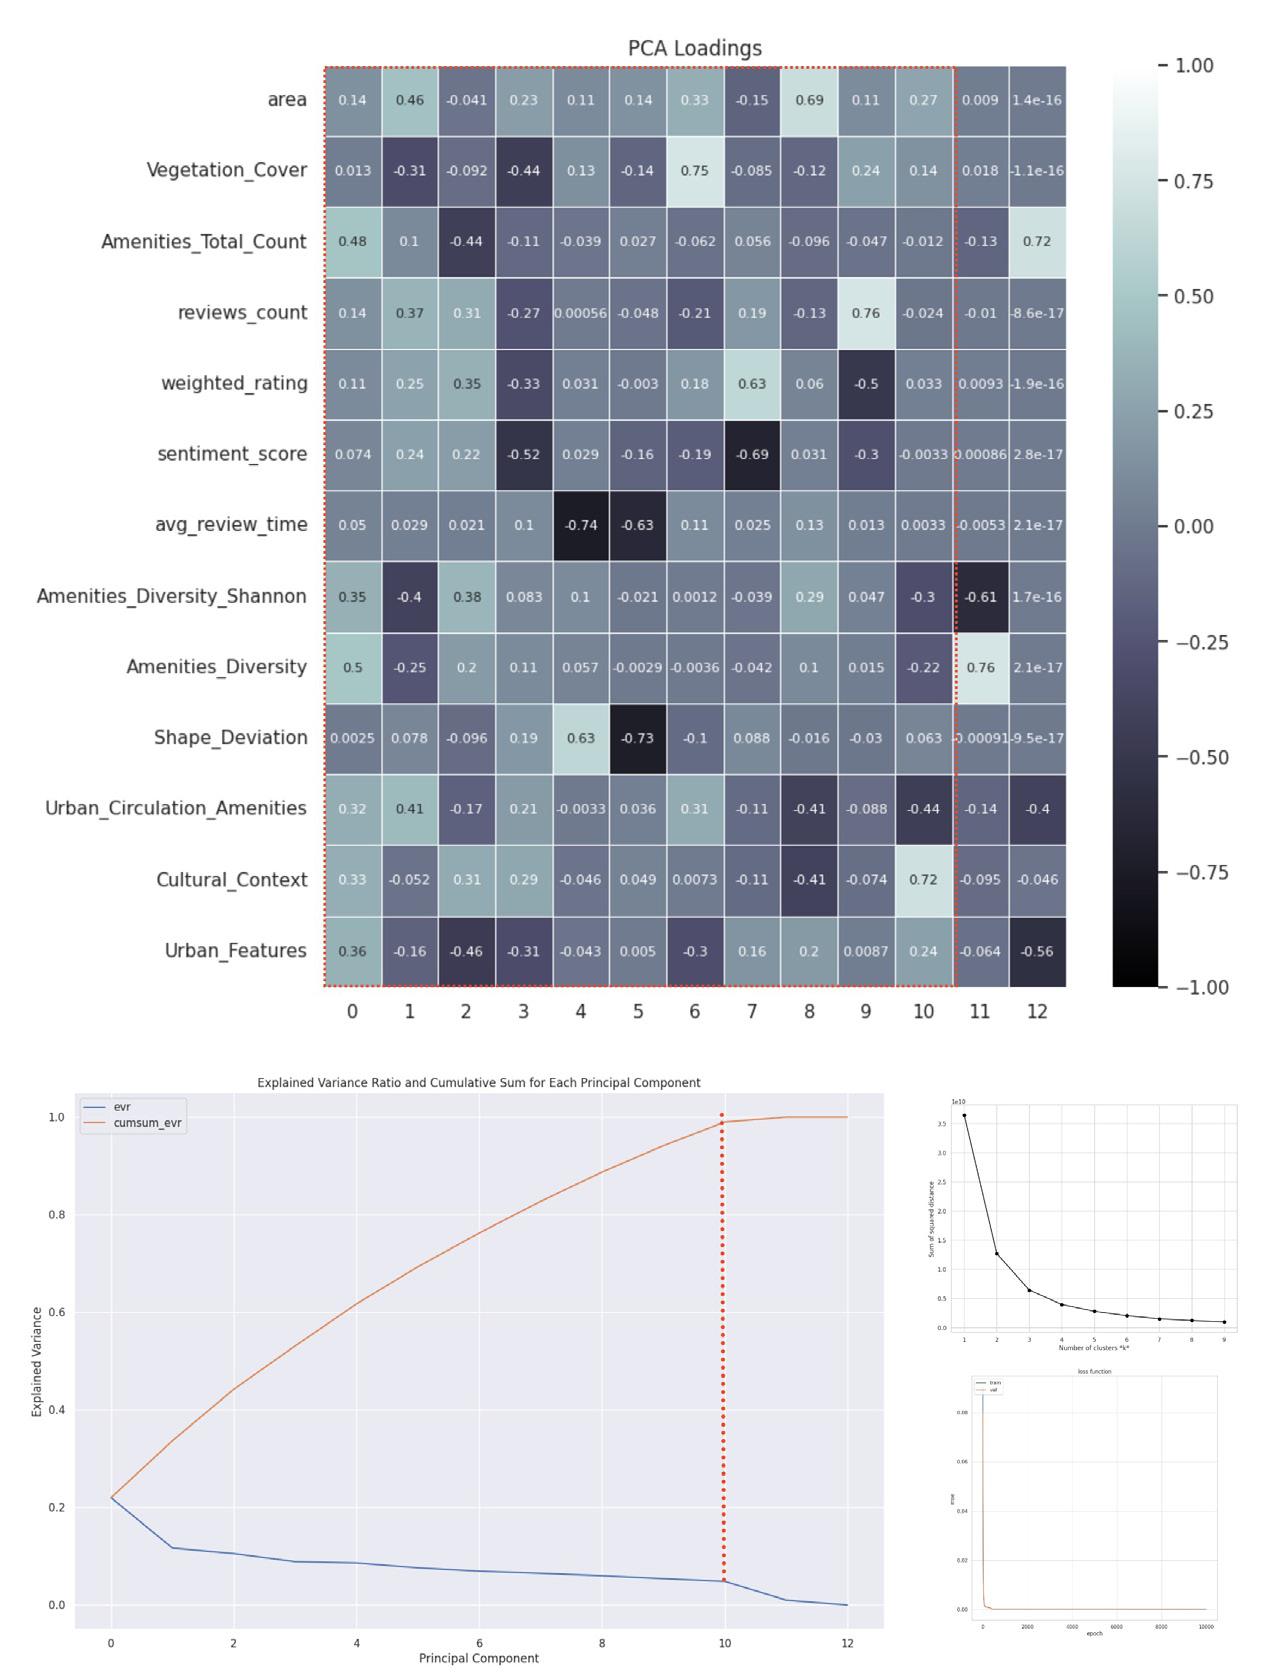
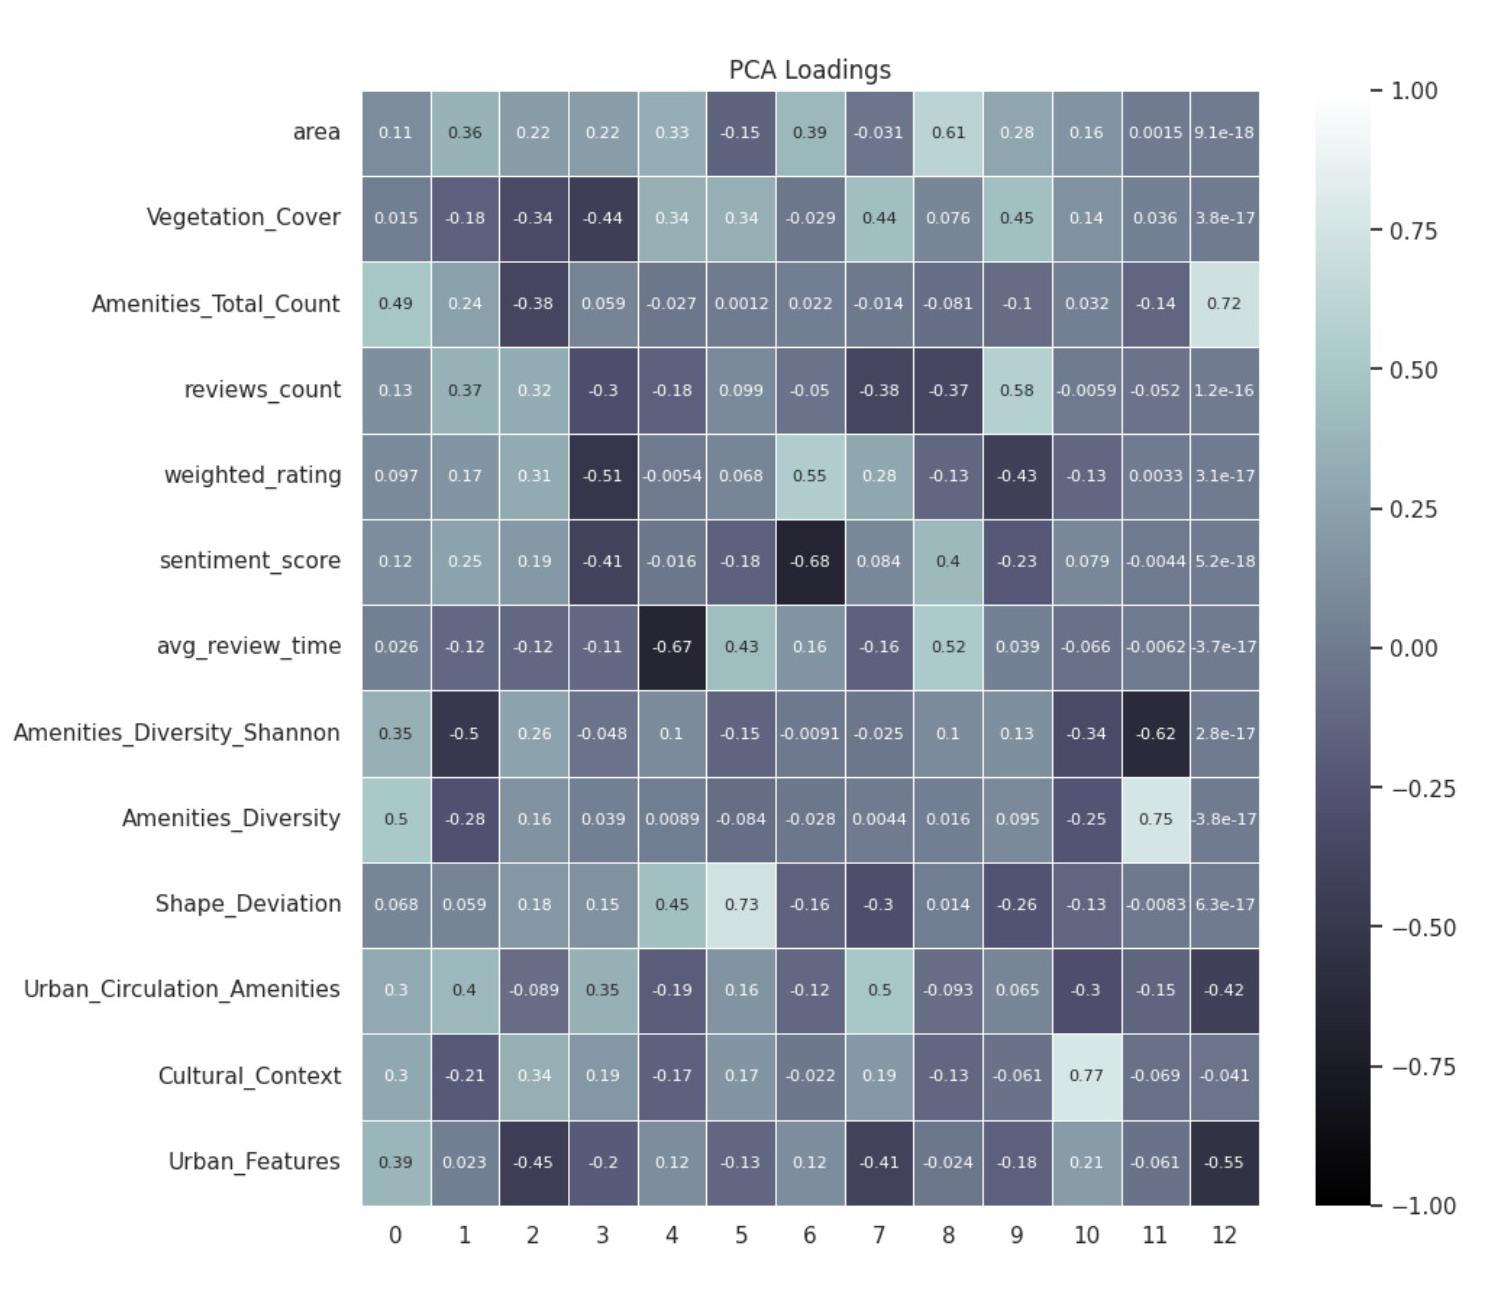
We've downscaled our dataset via Principal Component Analysis (PCA), which can be visualized through histograms, boxplots, and the heatmap, with convergence at PCA 10. This means our features almost equally describe our model.
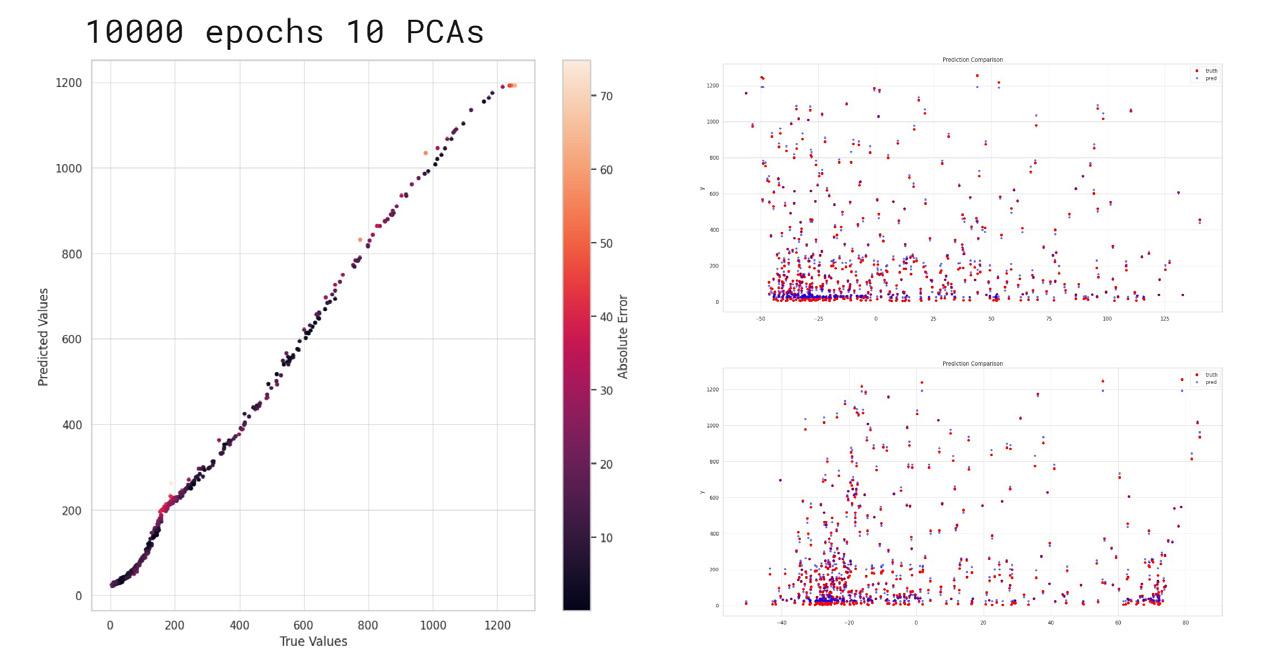
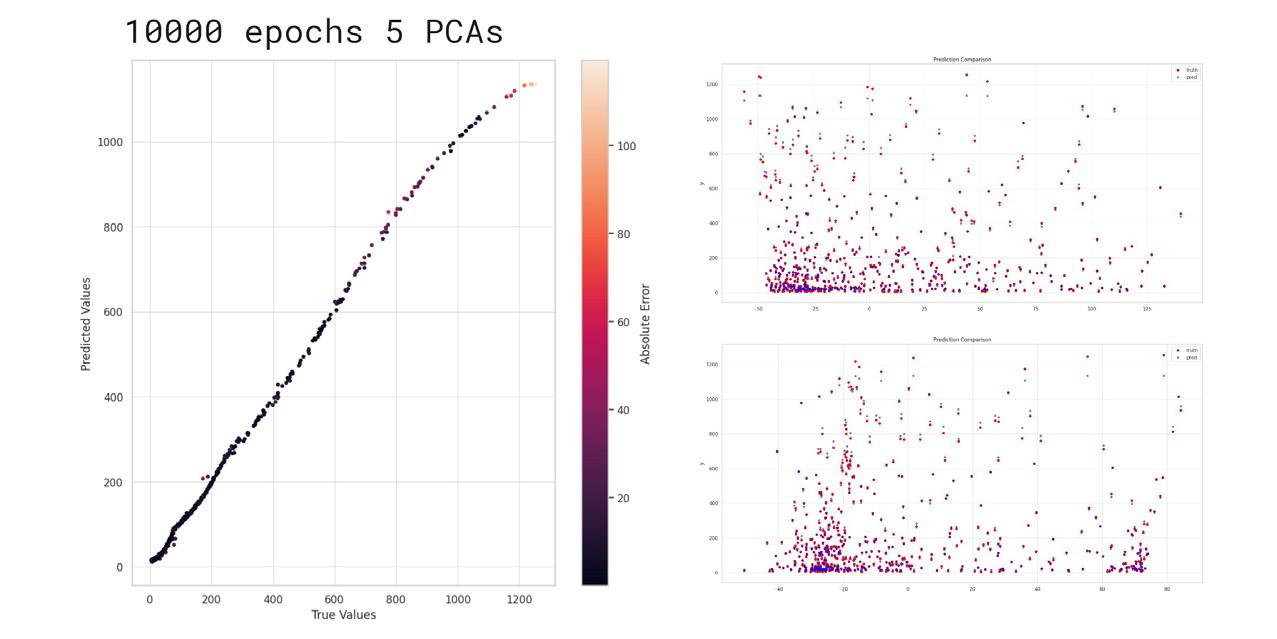
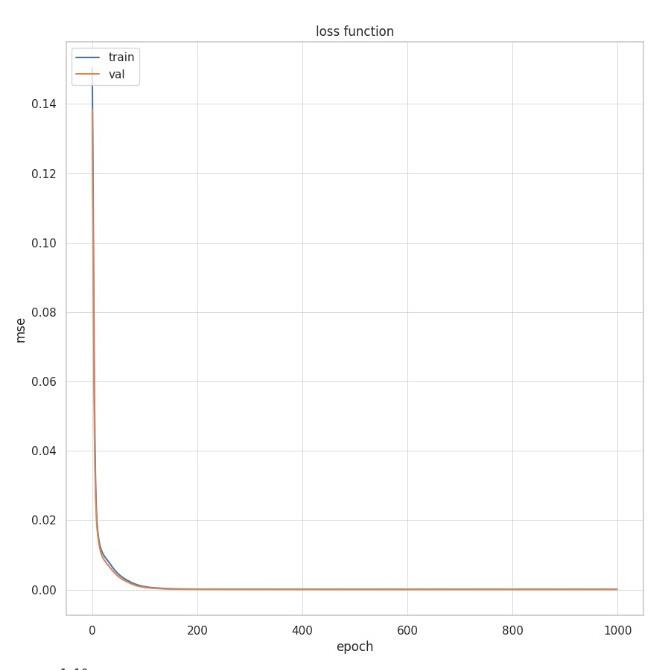
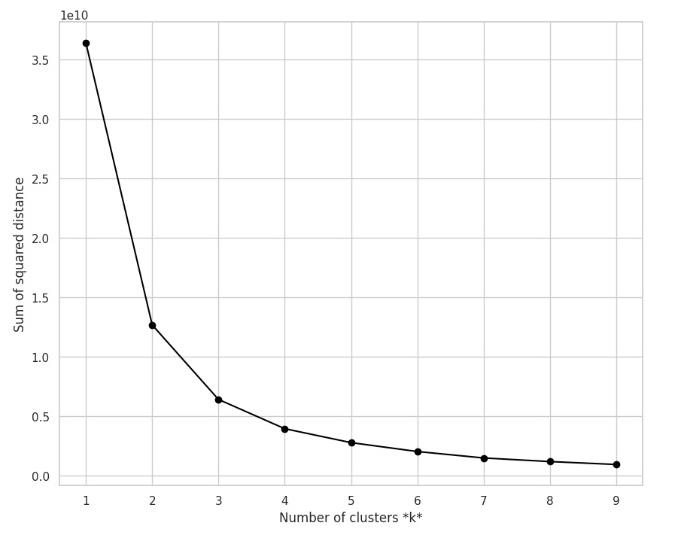
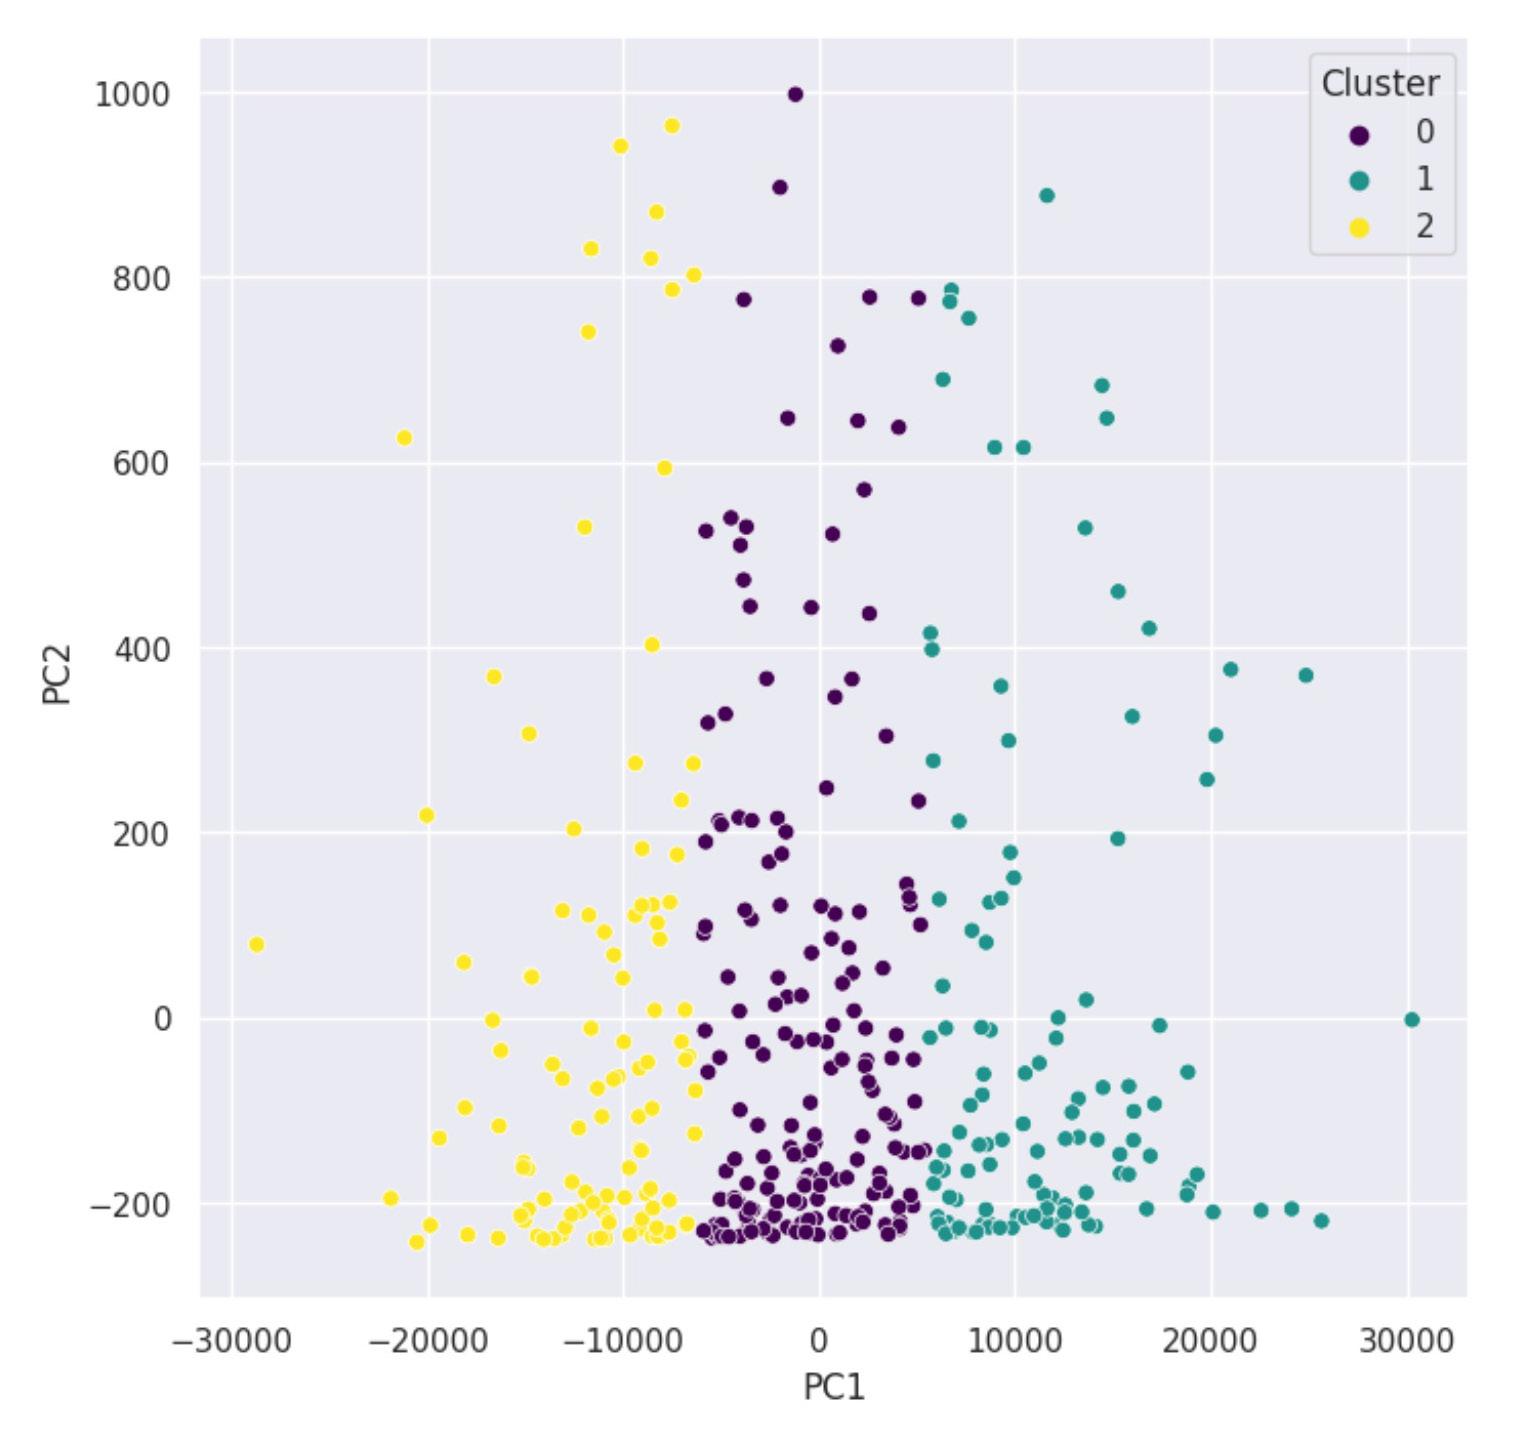
After an initial ANN failed, we implemented an ANN based on the PCA's matrix, yielding positive prediction results as you can view from the diagonals one note we suspect that due to the many filtering + outlier based on quantiles iterations the data somehow are formed in our intent and thats why the diagonals are so proper. We attempted K-means clustering on the pca clouds, but found distinct segmentation by review times - noon, afternoon, evening. The data structures can be seen here.
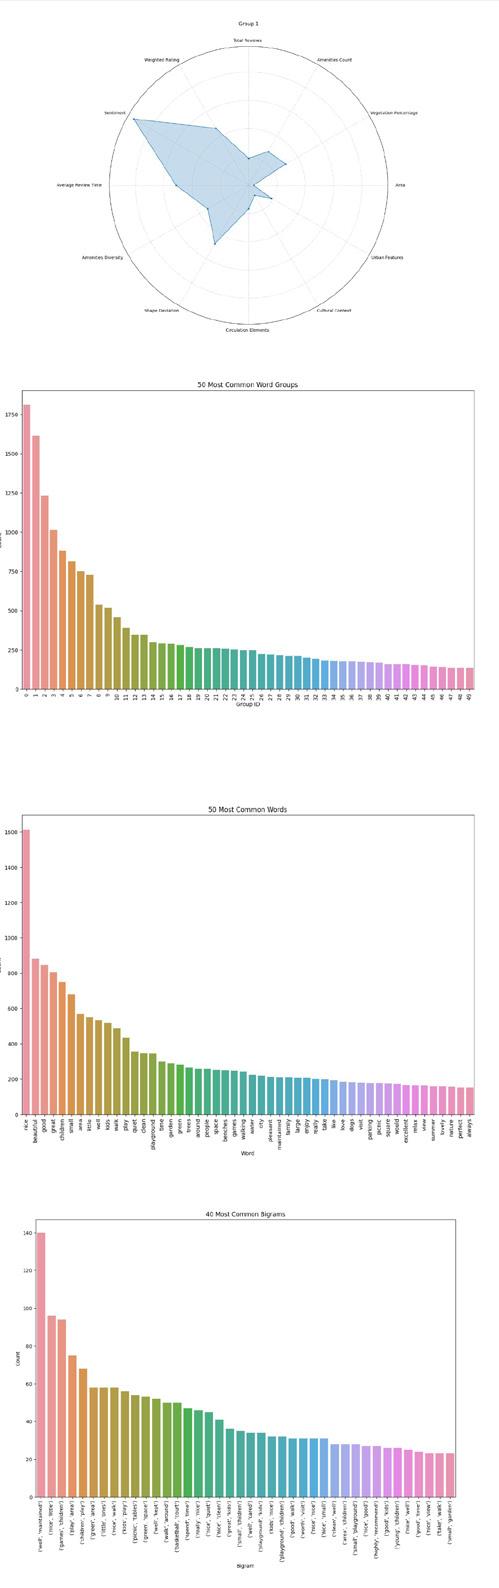
Then, we've sampled a smaller data group for experimentation. Following sentiment analysis, we analyzed word counts from reviews, grouped synonyms based on the top 100 most use words, and then applied PCA on the data attributes that contained those filters. Similar results on pca heatmaps and the kmeans led us to explore another method for tackling non-linearity."
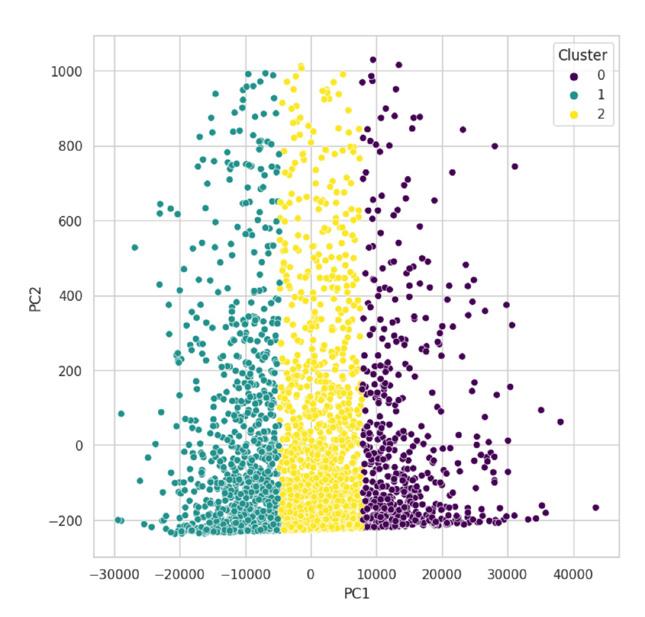
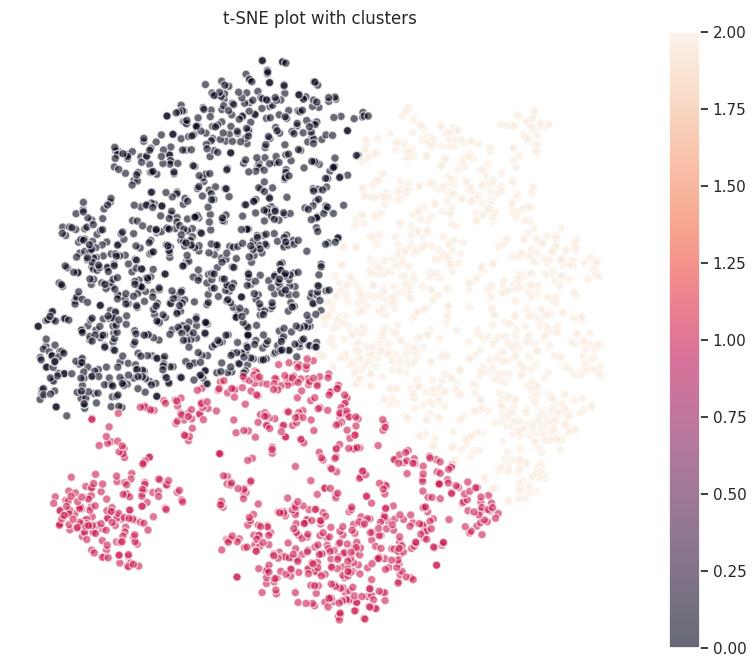
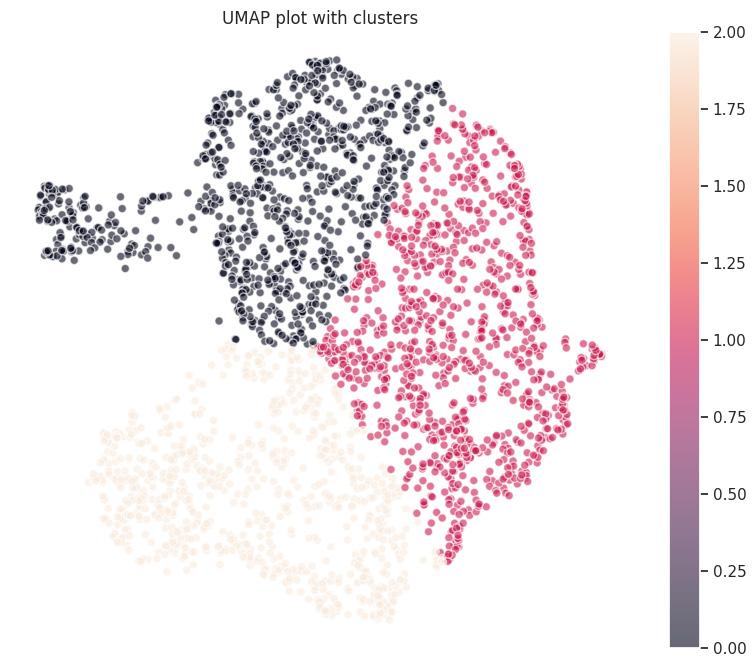
Our key finding: using t-SNE and UMAP. t-SNE, excels at preserving local structure and forming distinct clusters. UMAP, or Uniform Manifold Approximation and Projection, balances preserving global and local structure.
Initial visualizations show segmentations by feature color. However, after applying k means clustering on the output of those algorithms, three distinct groups emerged, a critical step forward in understanding our complex, multi-dimensional data."
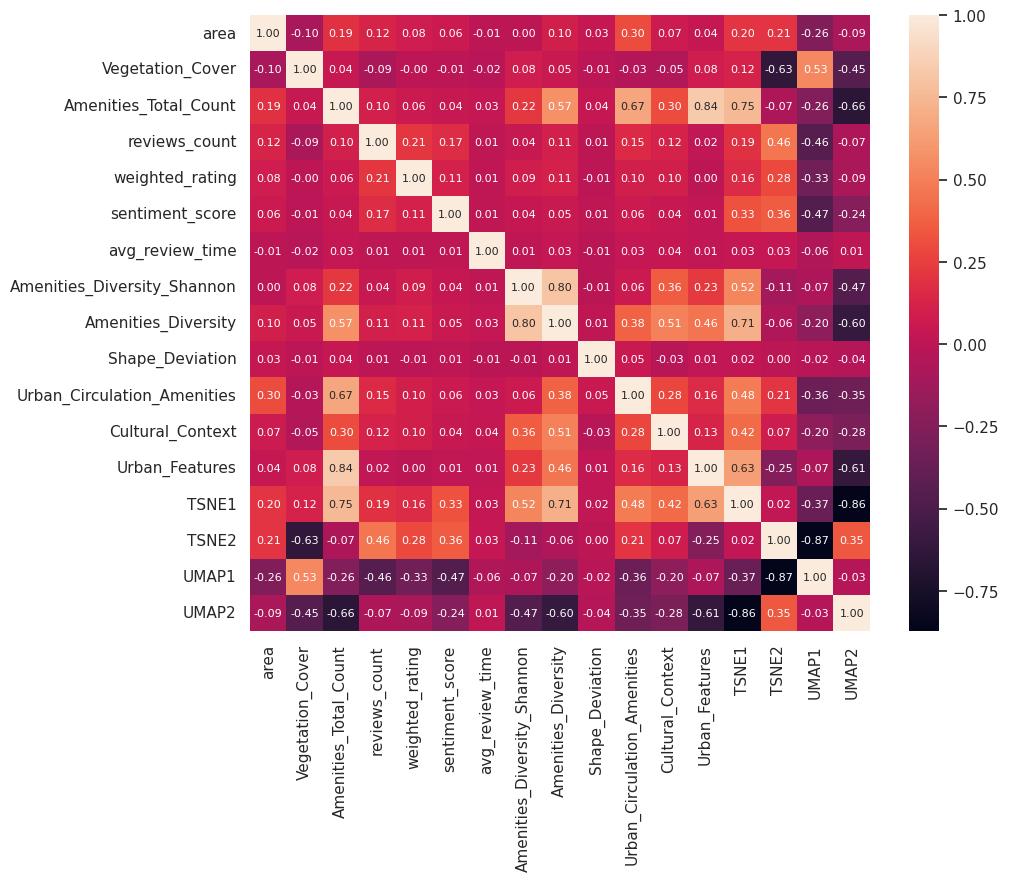
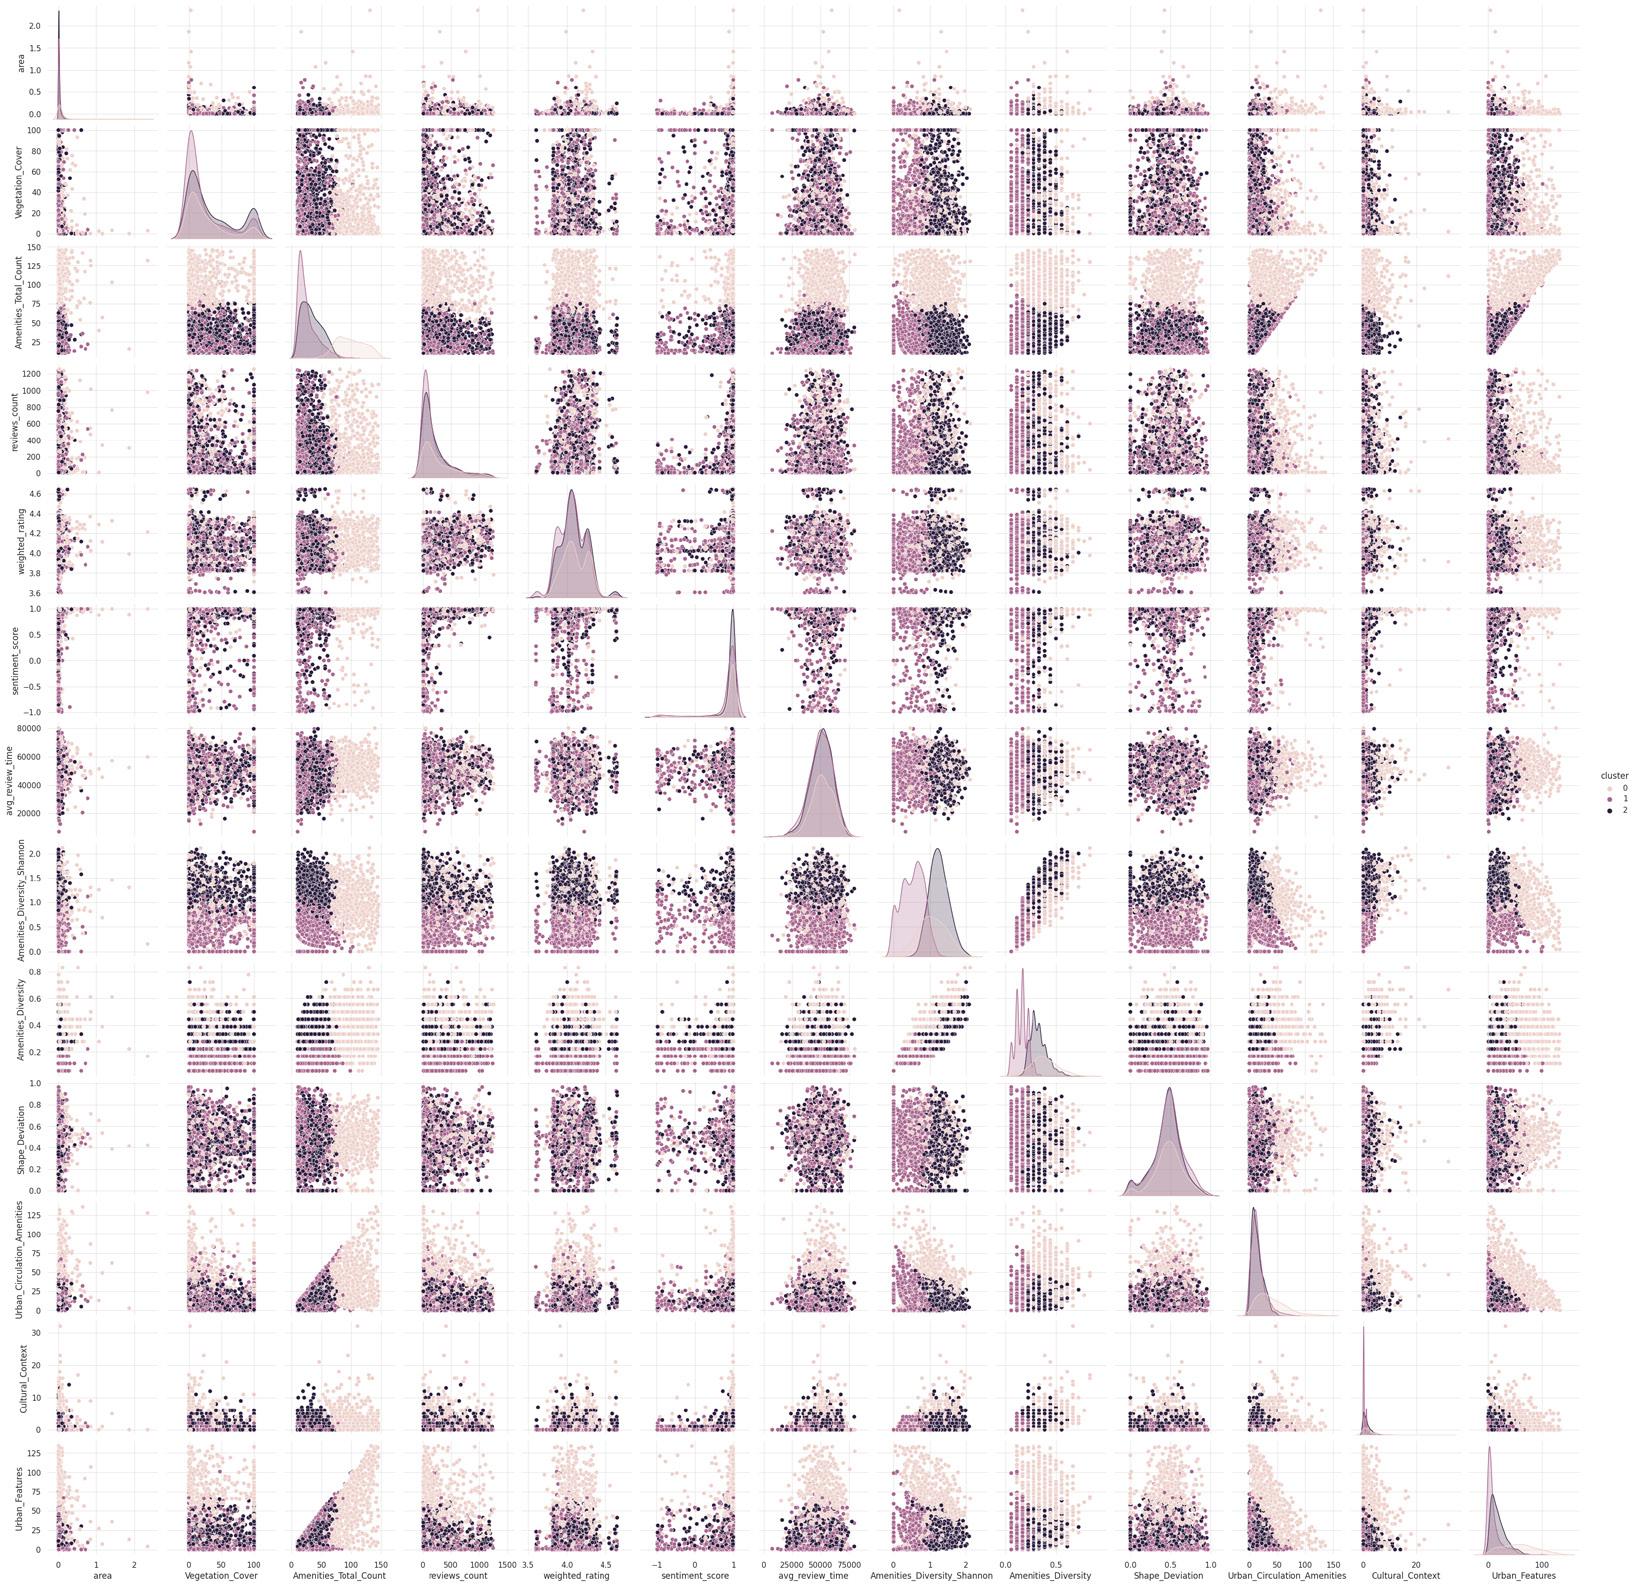
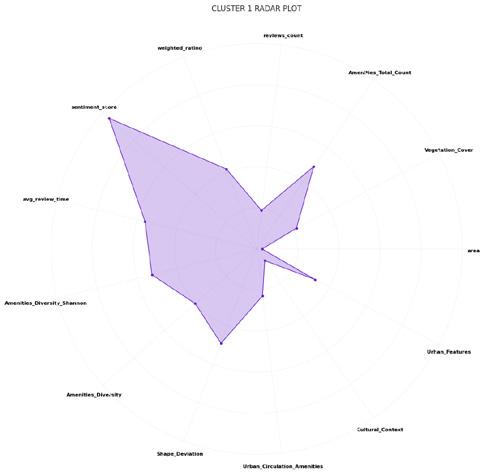
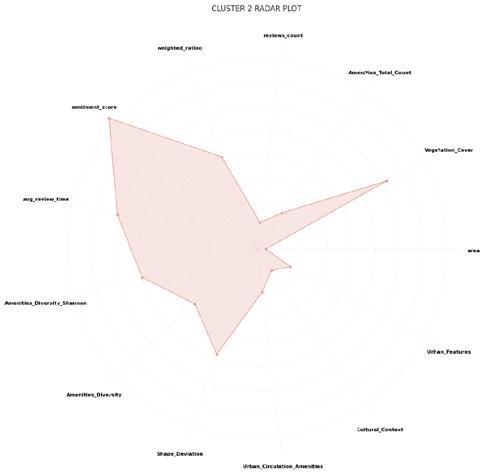
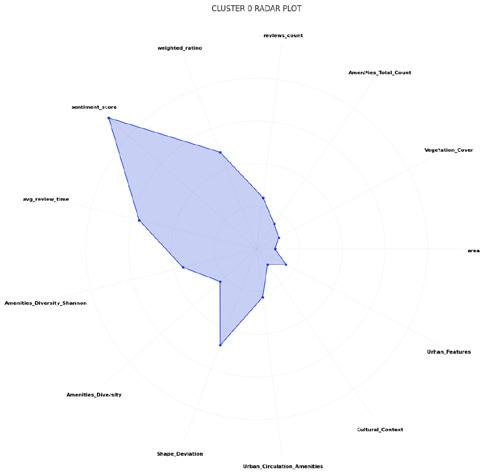
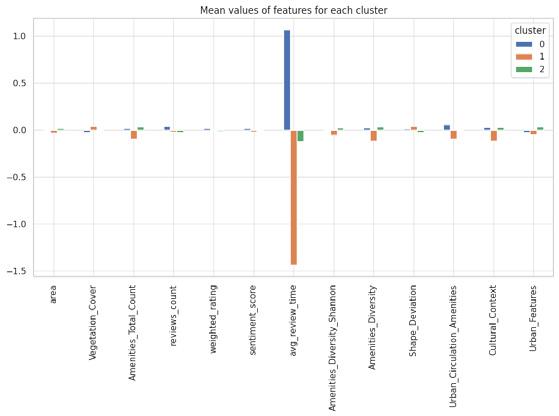
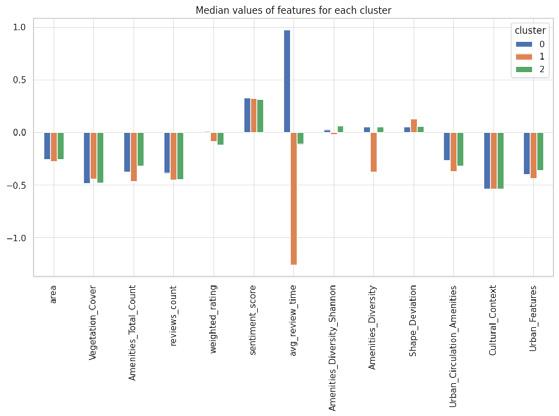
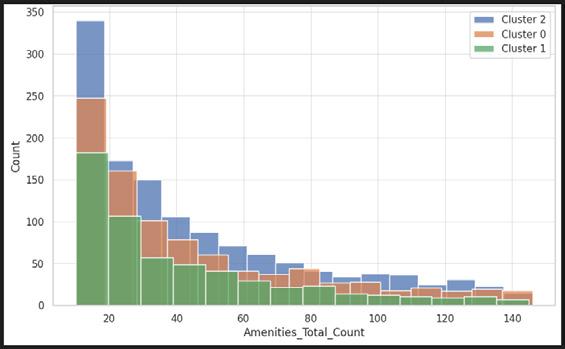
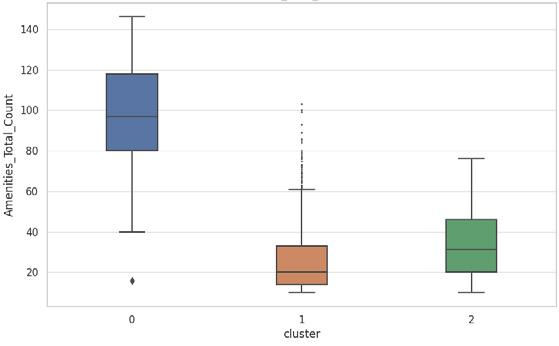
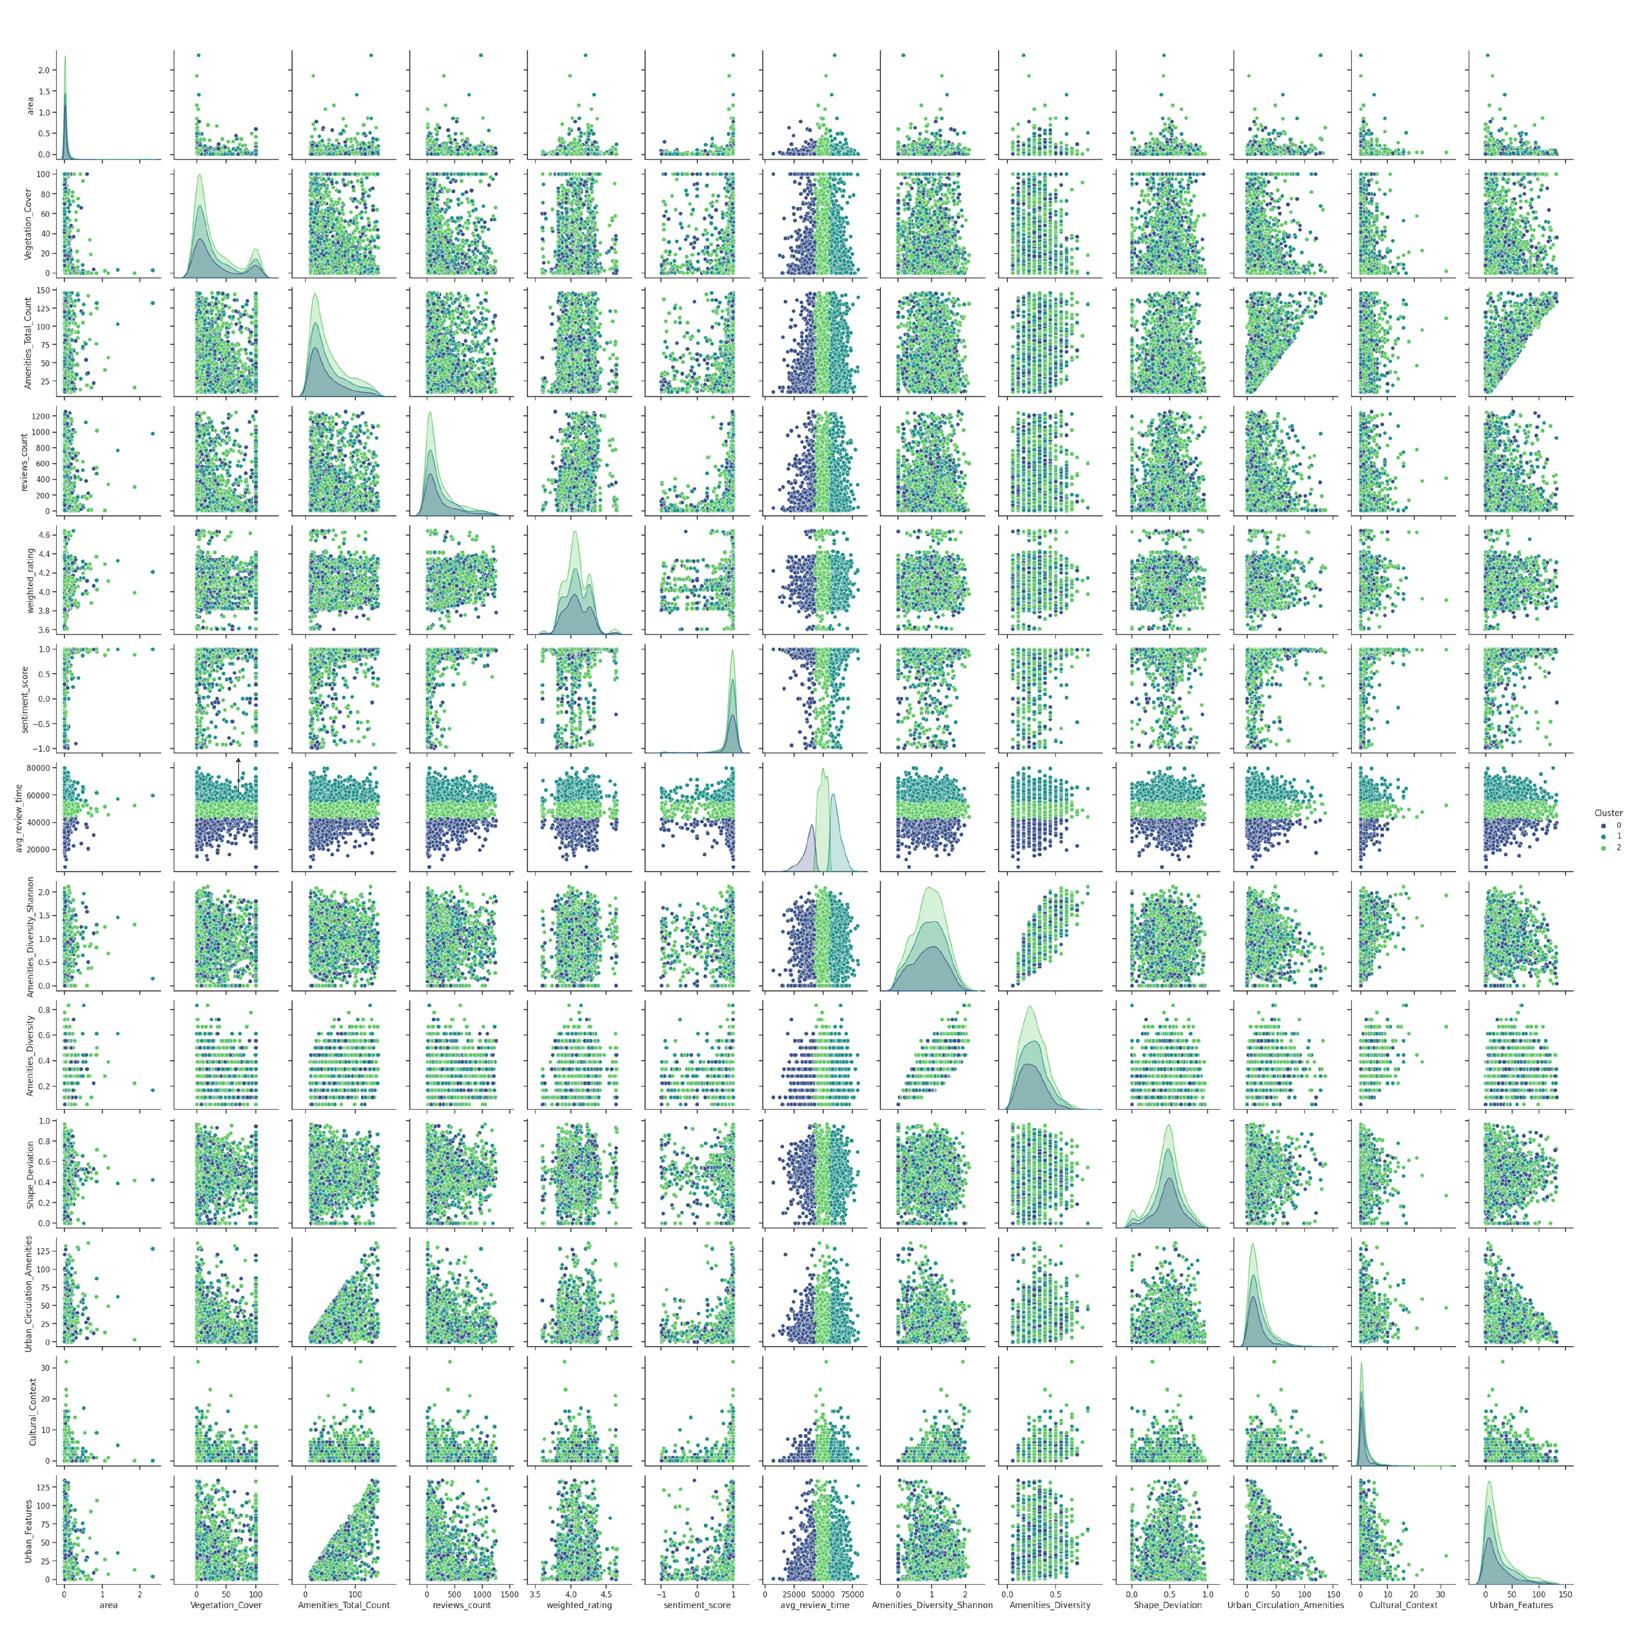
Moving further into K-means clustering, we can now better understand the structure of these data clusters by examining medians, averages, data distributions, and box plots. The pair plot we believe is successful into segmenting the features properly while of course some of them remain totally random due to the nature of our project and the webscrapping.
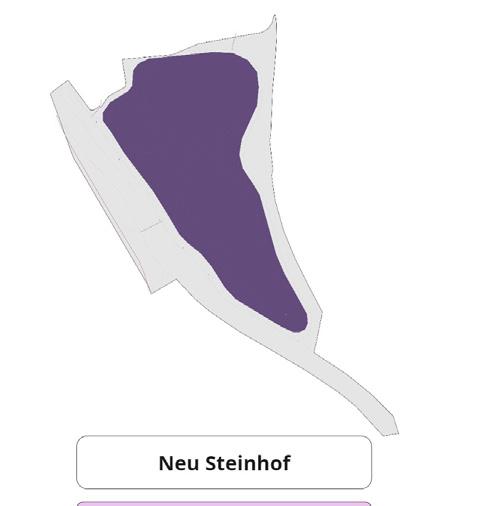
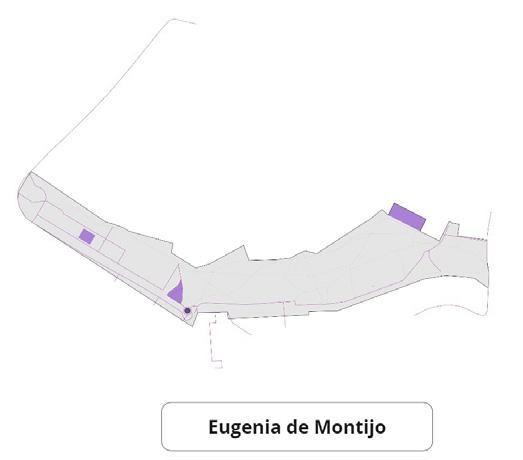
From our spider plots, we can discern diversity in vegetation cover and shape deviation among the three clusters.
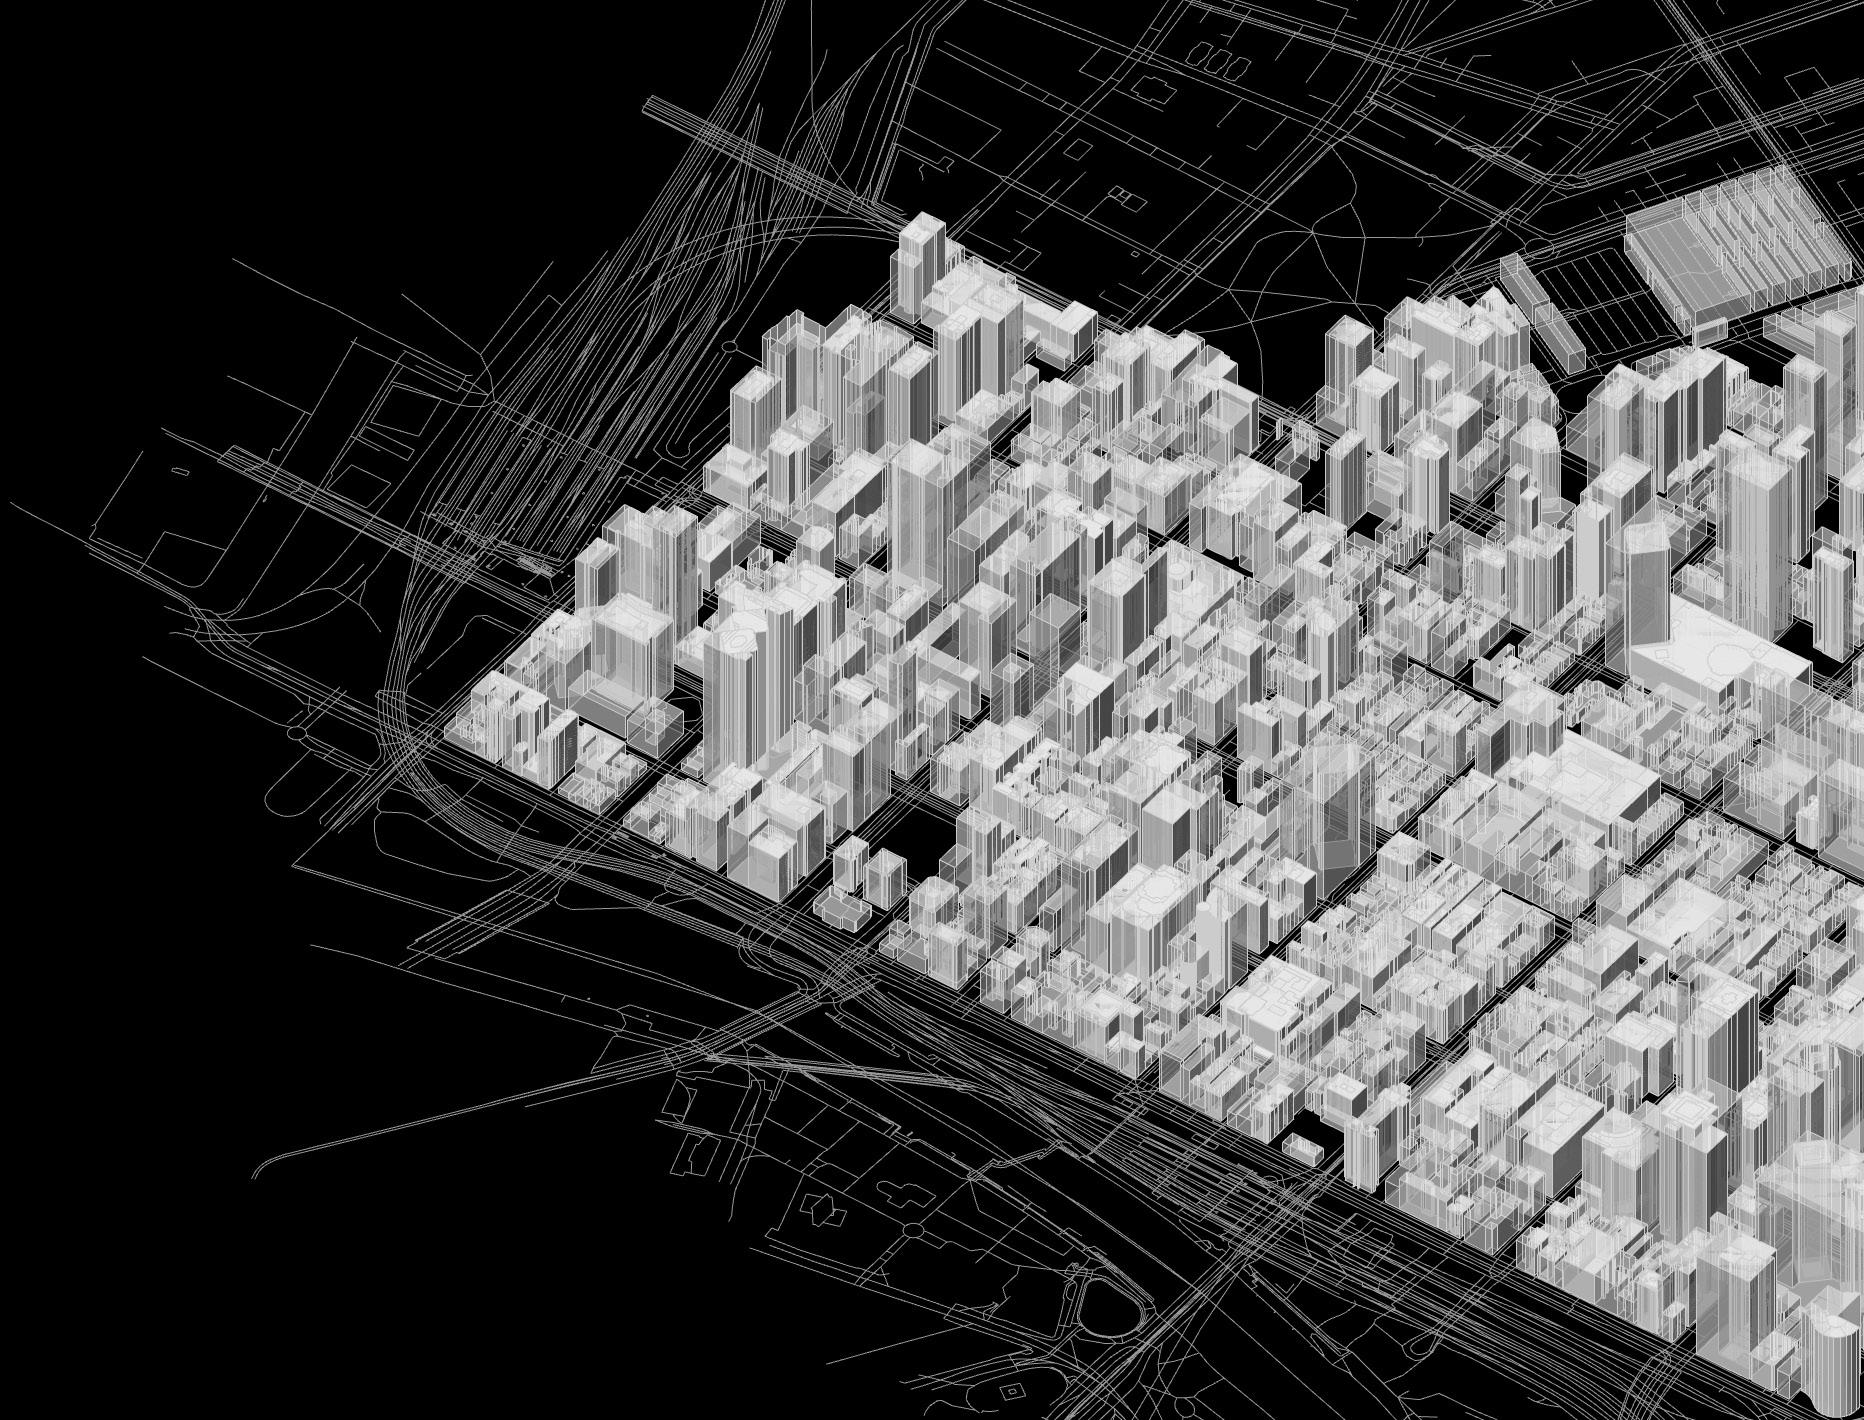
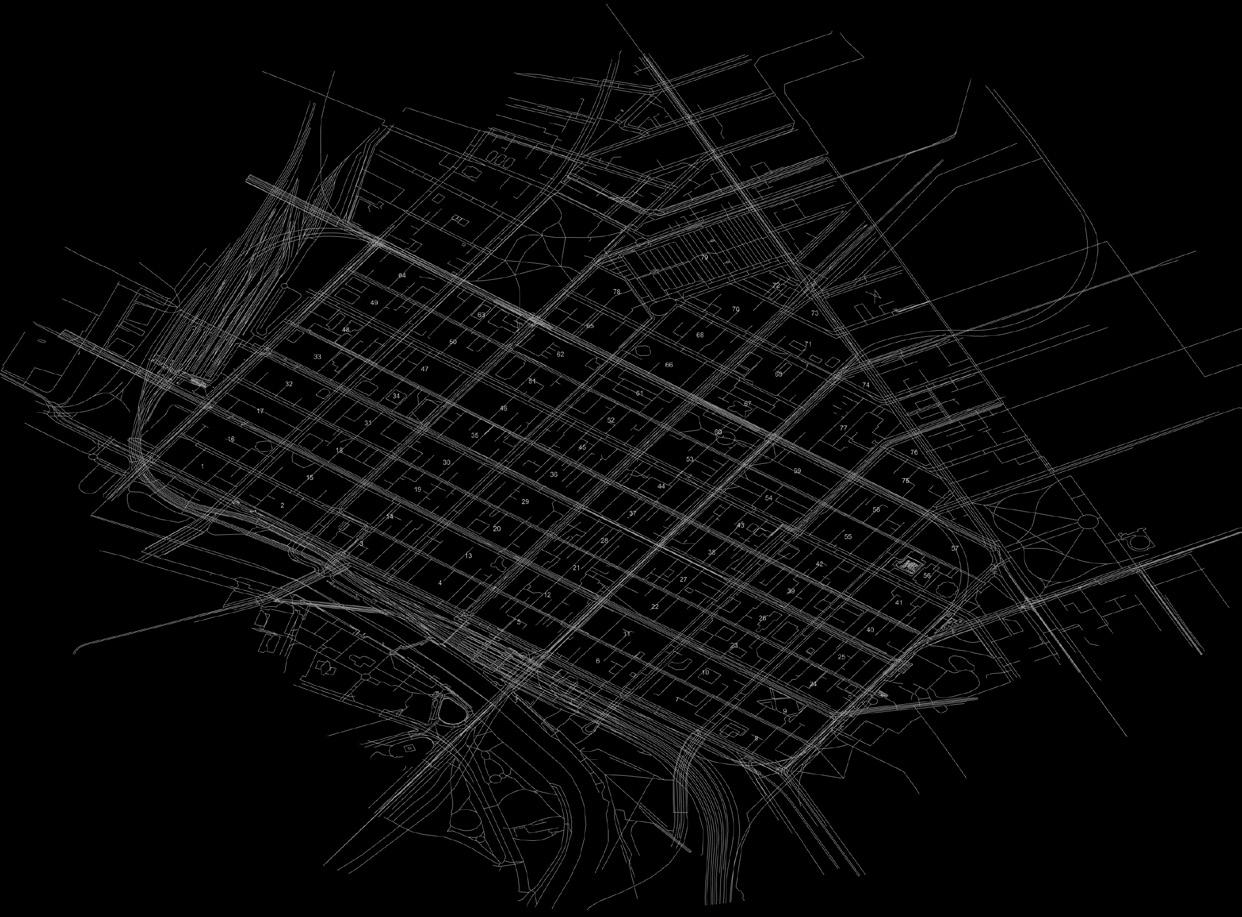
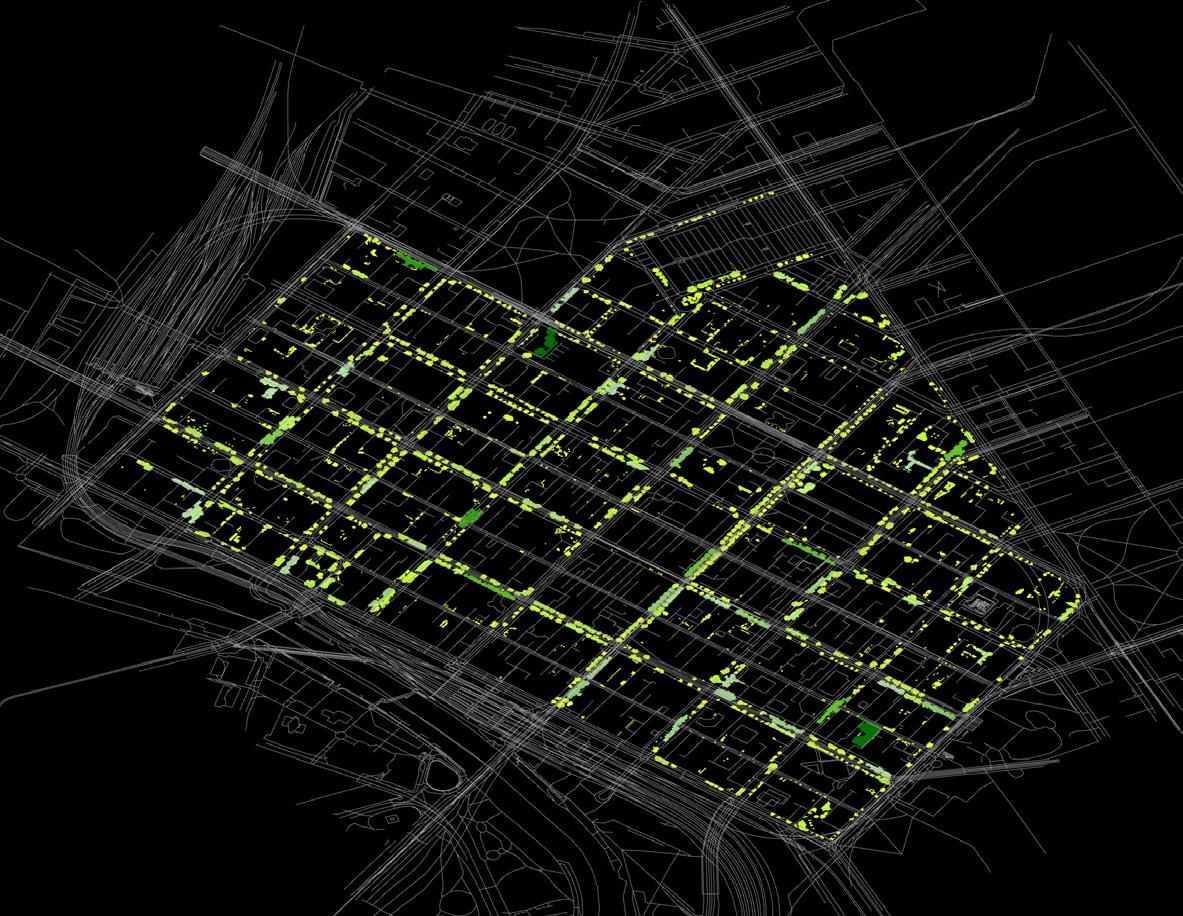
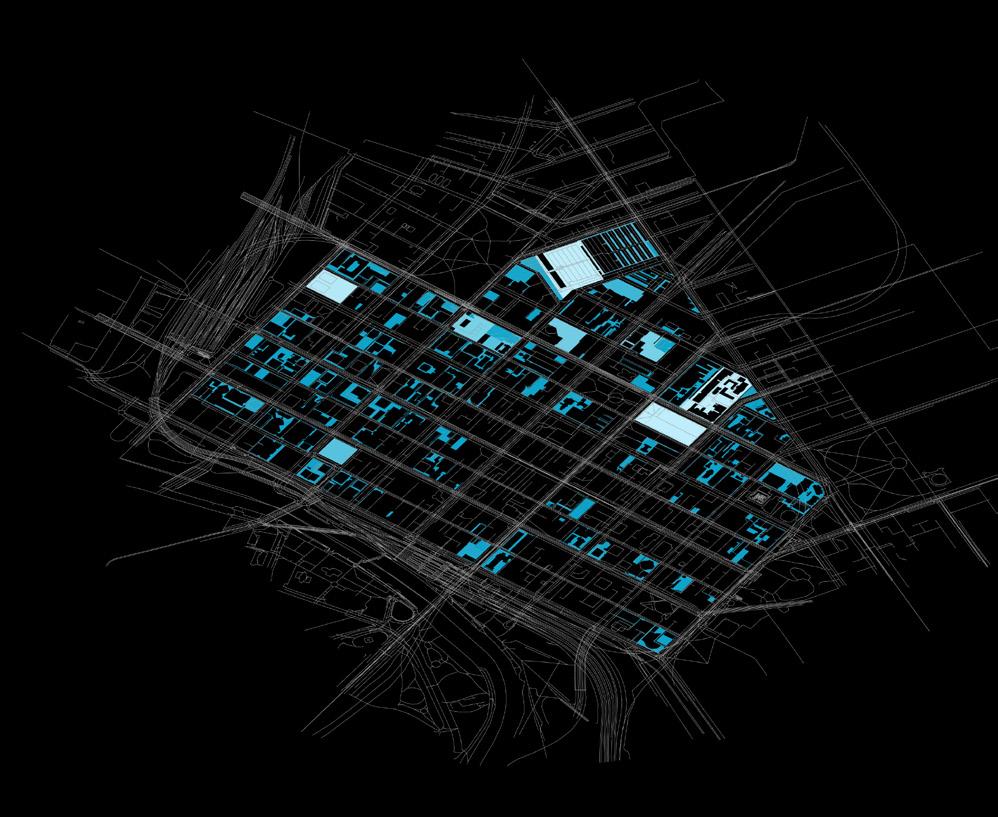
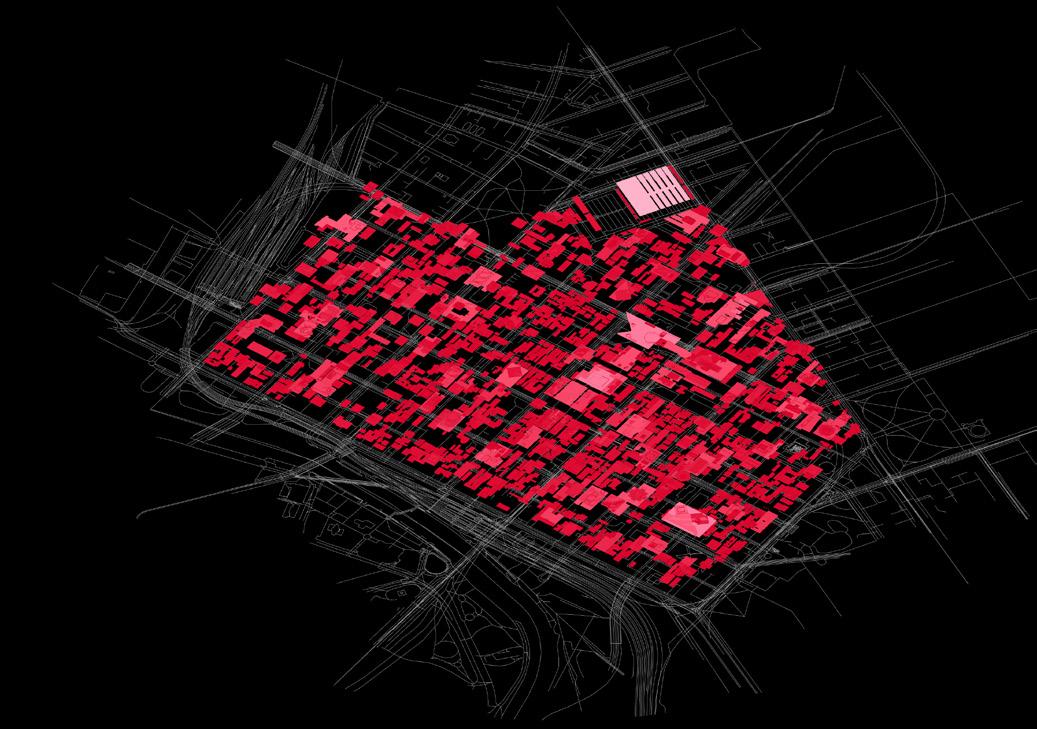
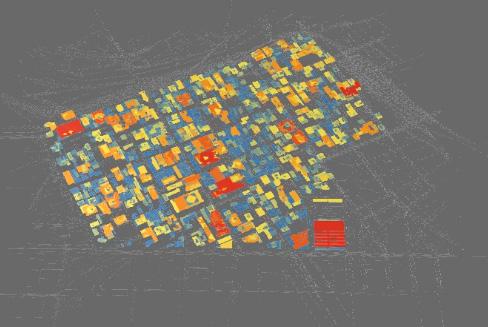
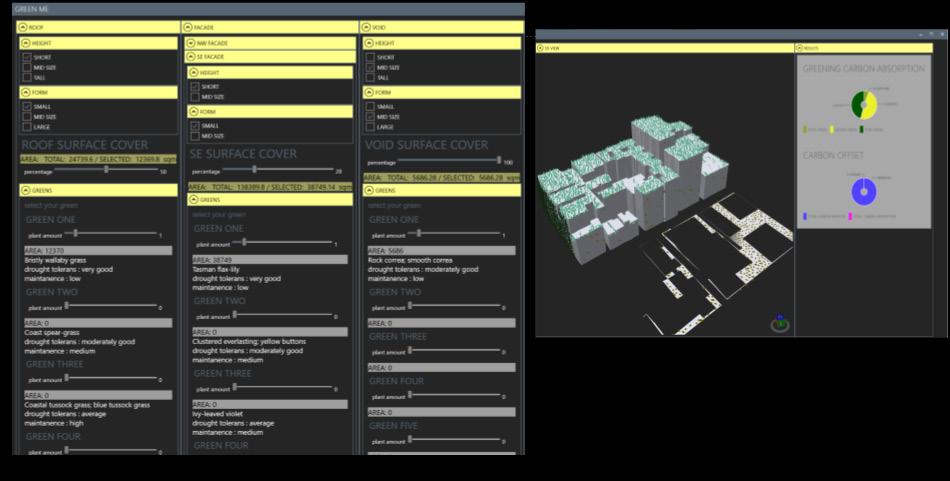
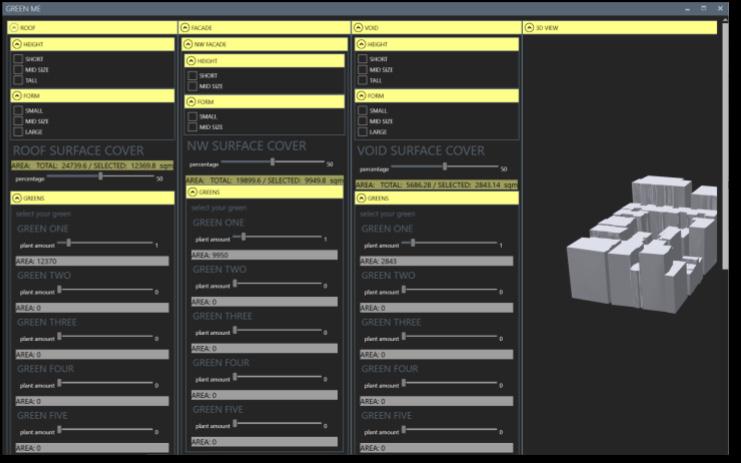
Unveiling the potential of urban blocks for greenery insertion in Melbourne: Offsetting carbon emission of the city blocks by implementing a comprehensive greening plan
Ziqi Cui, Ezgi
Littieri Machado Lamb 2023 Spring AI Urban Stuido
Faculty: Angelos Chronis, Ebrar Eke, Ondrej Vessely
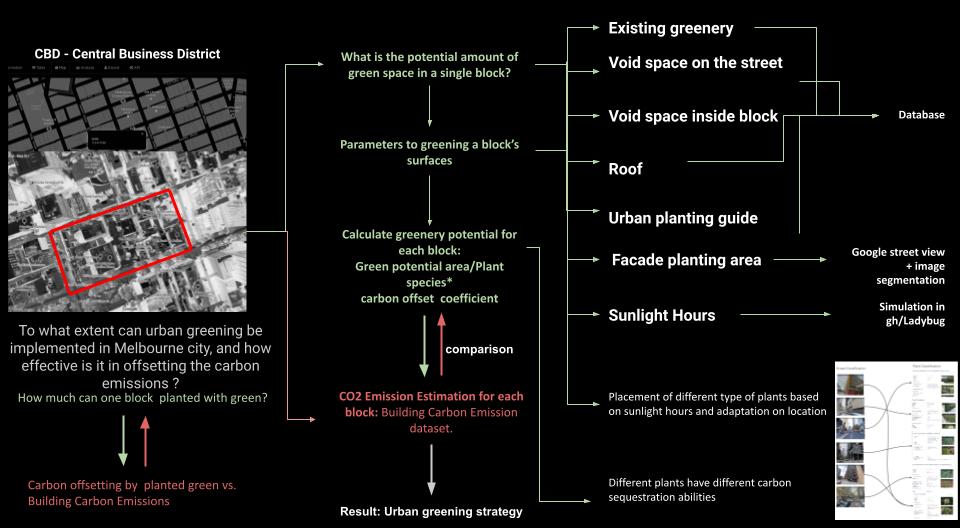
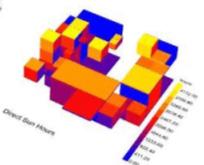
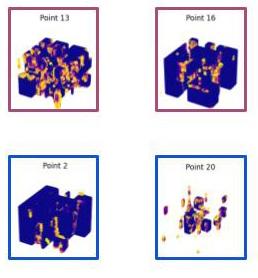
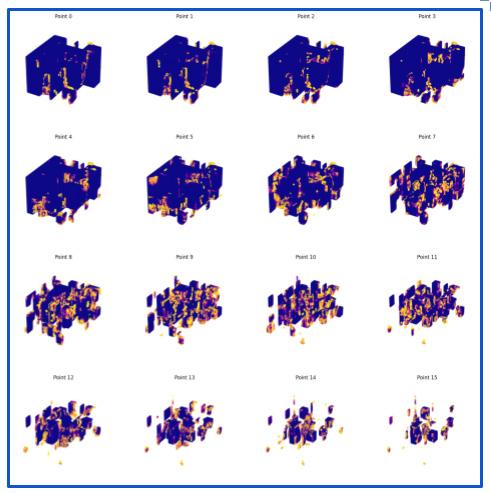
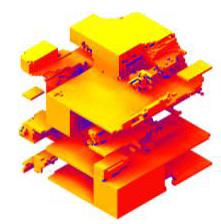
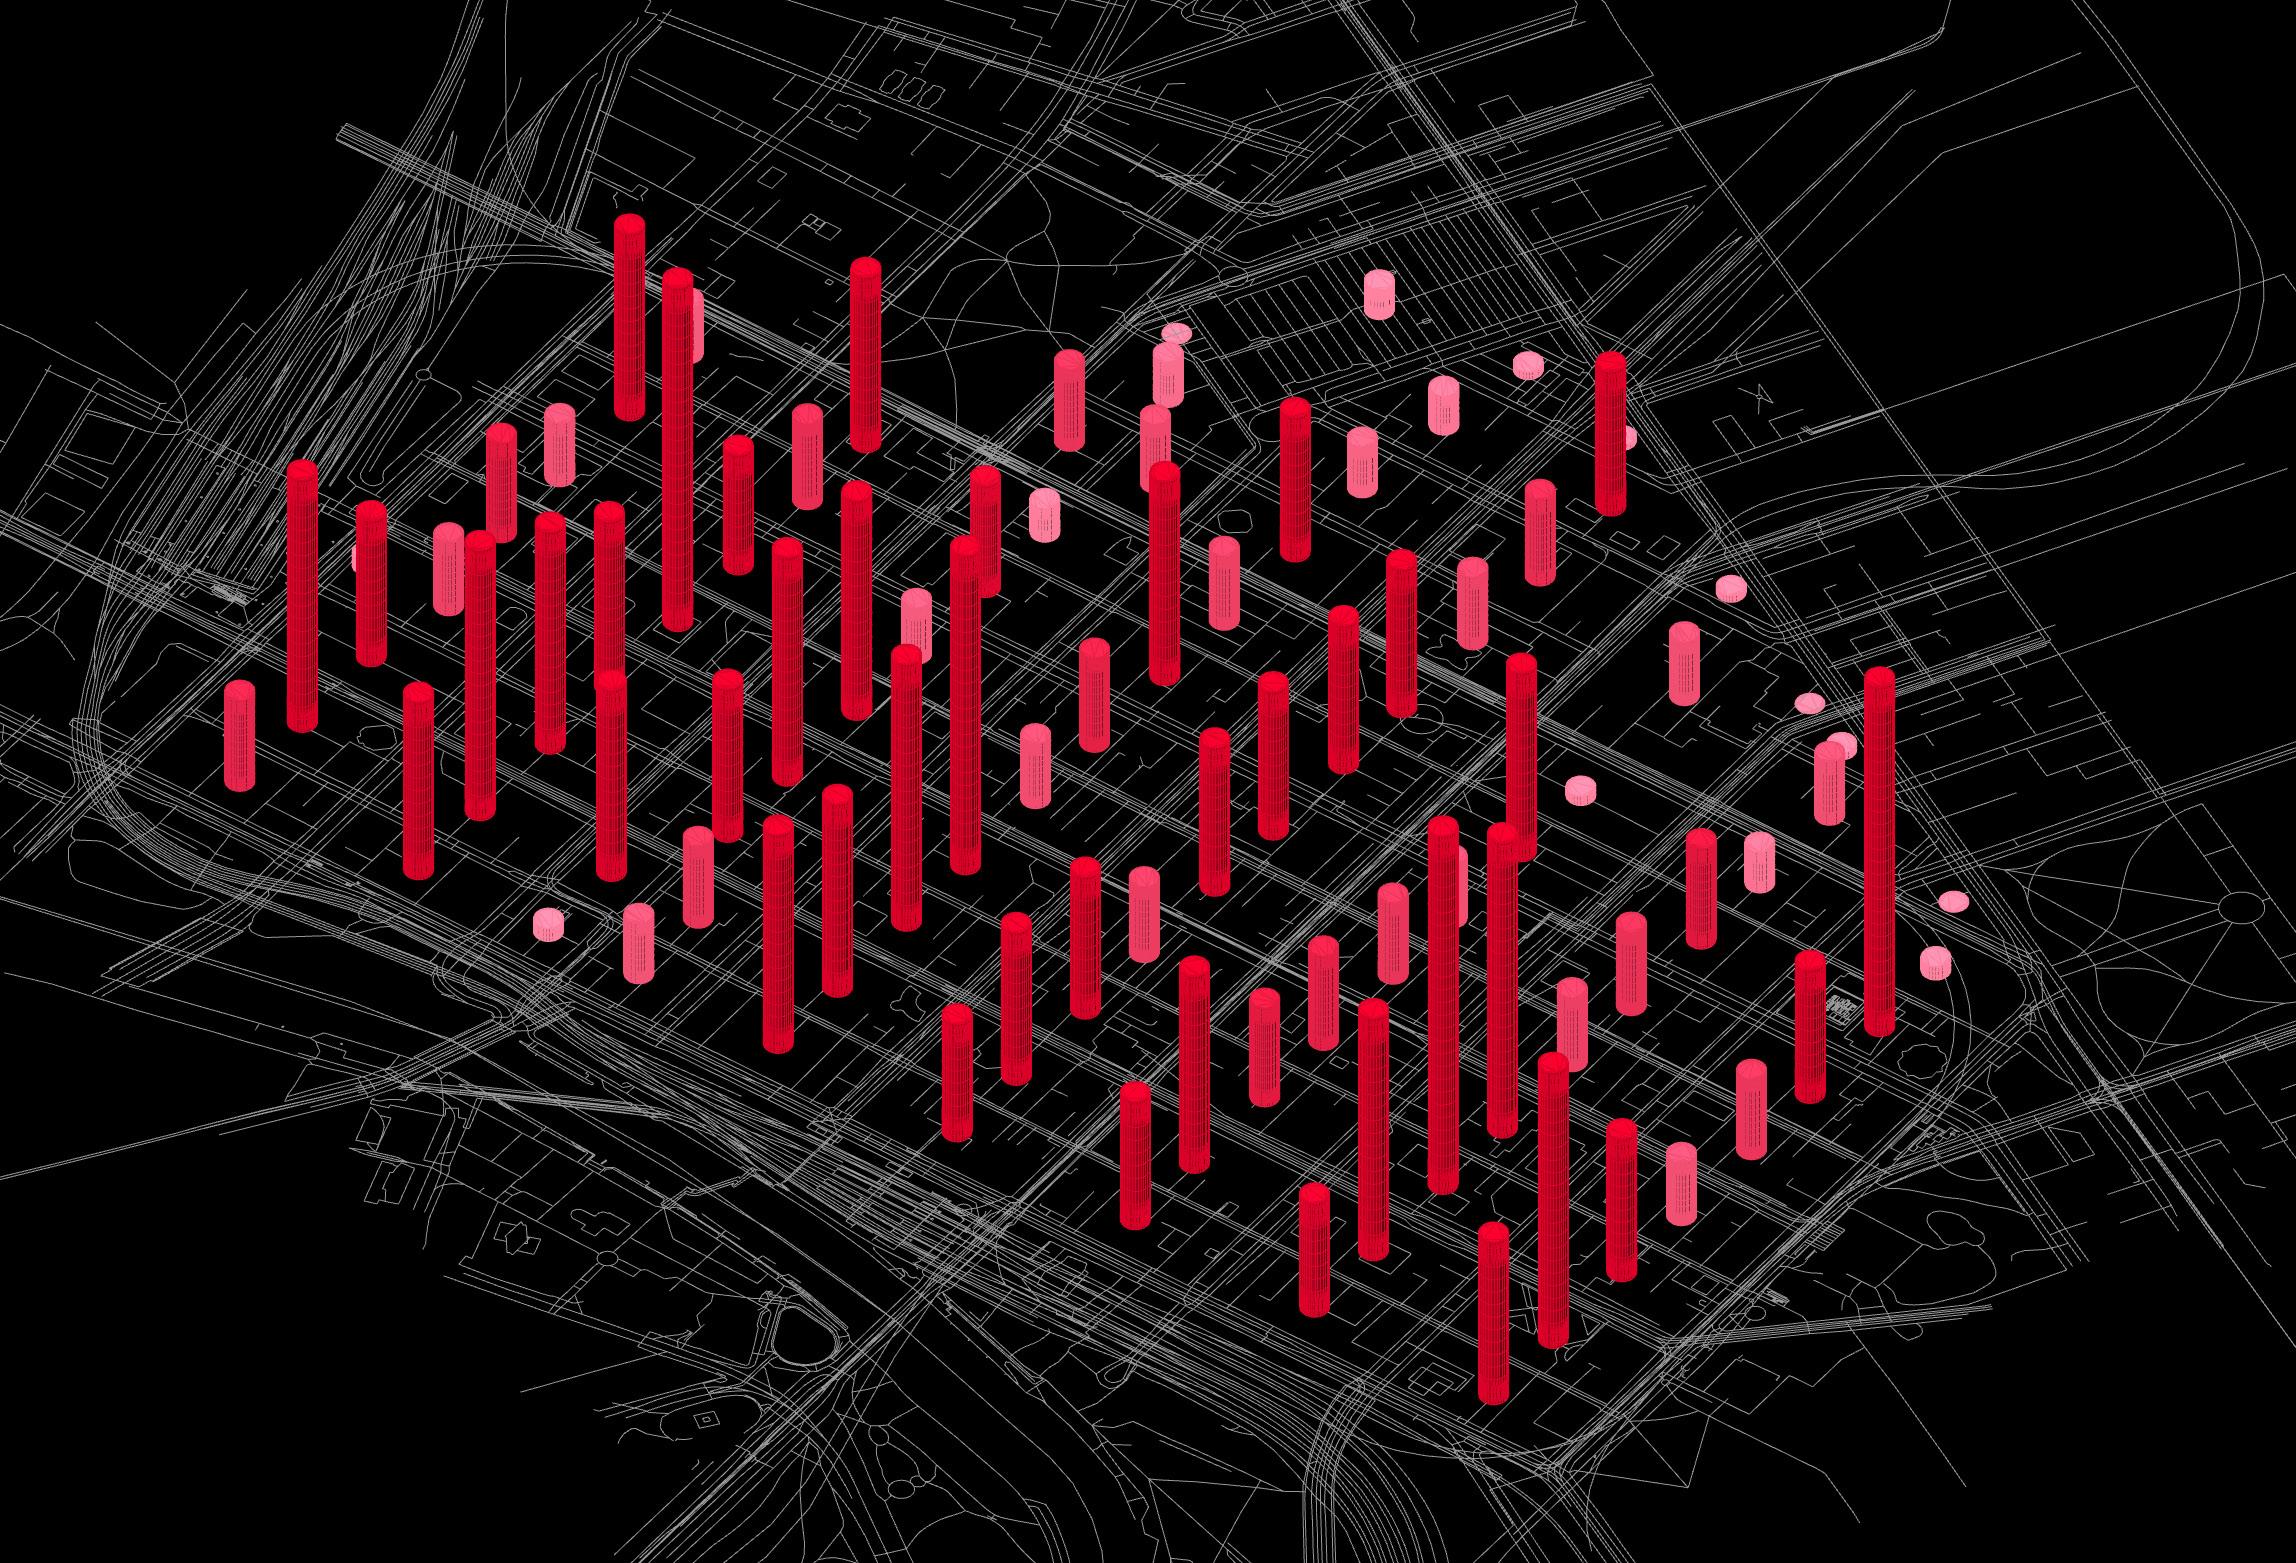
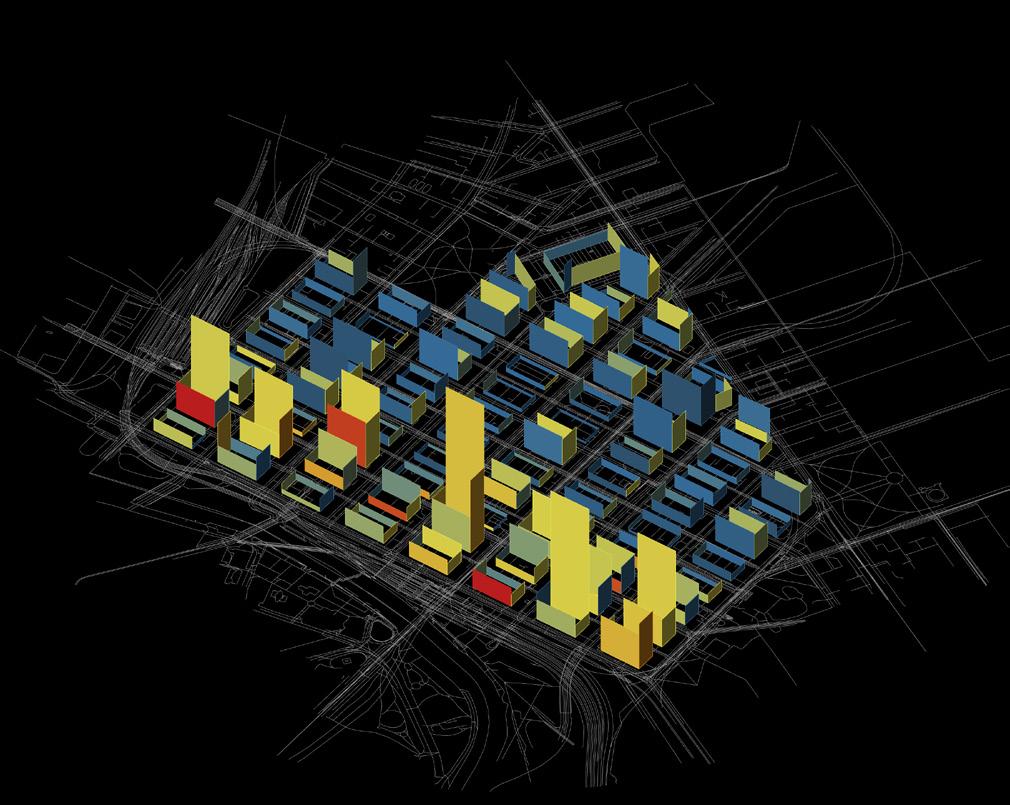
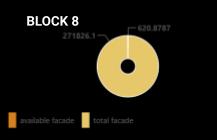
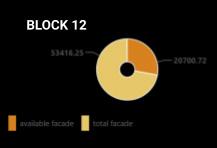
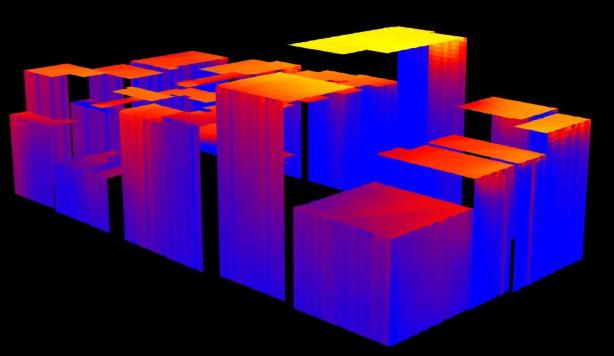
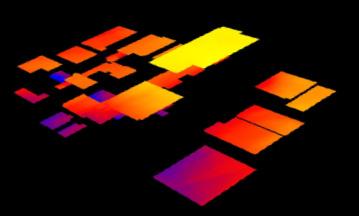
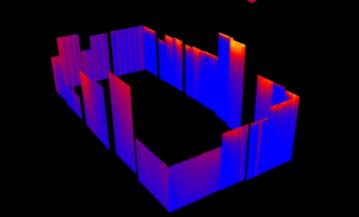
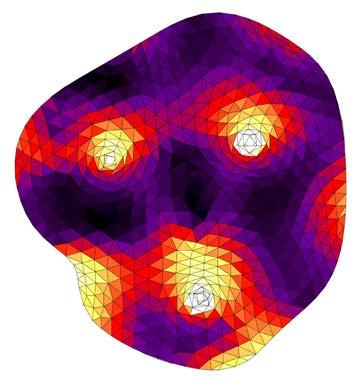
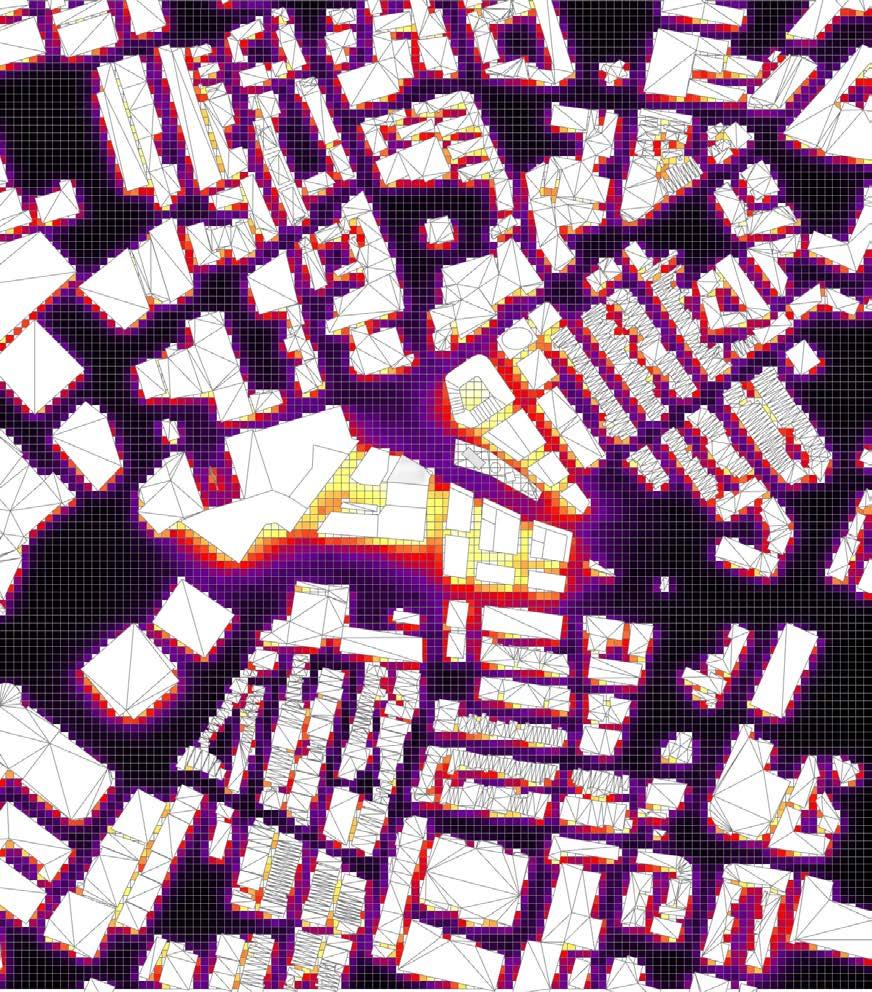
This proposal aims to uncover the untapped potential of surfaces within Melbourne city blocks for the implementation of greenery. It aims to identify suitable locations for the insertion of greenery, as well as quantify the CO2 absorption capacity resulting from the greenery. The objective` is to provide valuable insights for enhancing urban greening strategies and incentivizing carbon offsetting in the built environment to reinforce a sustainable city approach.
Area:3-2317sqm


Area:4-25395sqm
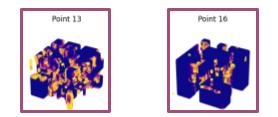
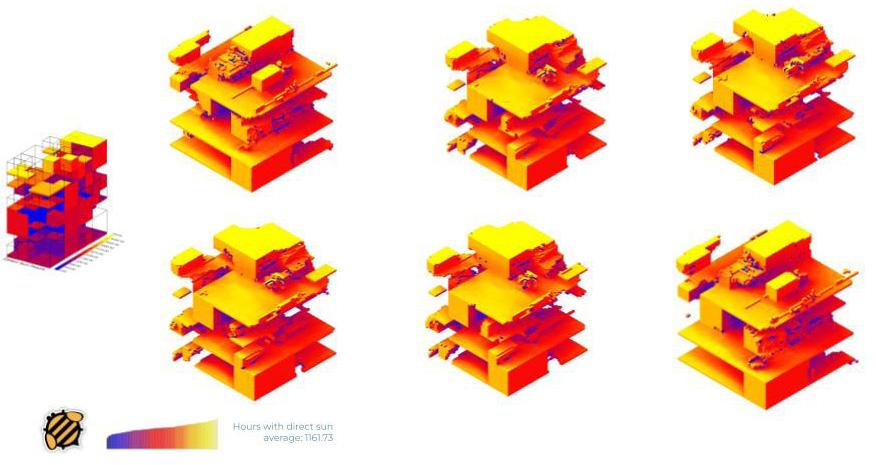
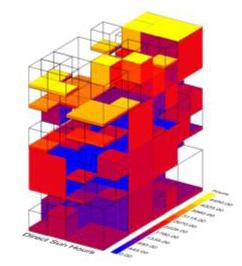
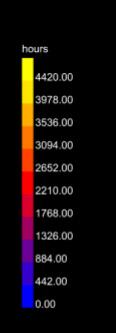
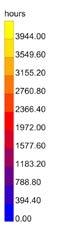
Sun hours:150-2124H/year

Area:0-182sqm
Sun hours:0-1099H/year
Area:155-37853sqm
Sun hours:1048-5070H/year

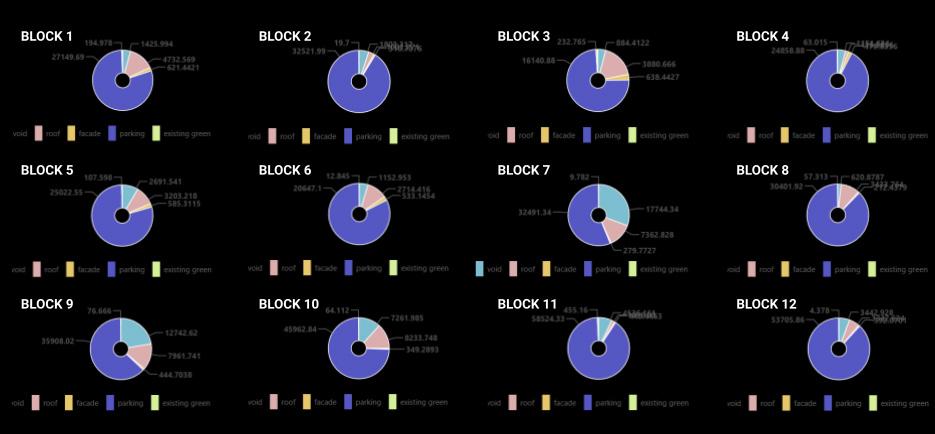
Carbon Emissions
Carbon Emissions (kgCO2) = Electricity Consumption (kWh) x Carbon Intensity (kgCO2/ kWh)
Carbon Intensity can vary depending on the region and the mix of energy sources (e.g., coal, natural gas, renewables) used to generate electricity.
a
basis,
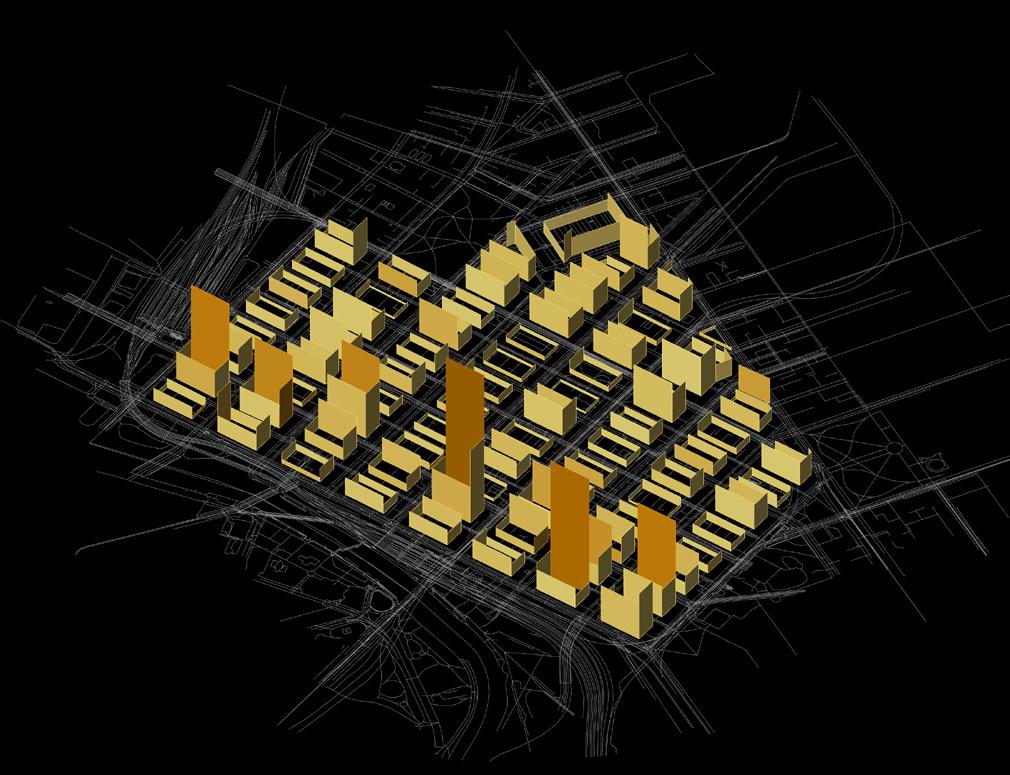
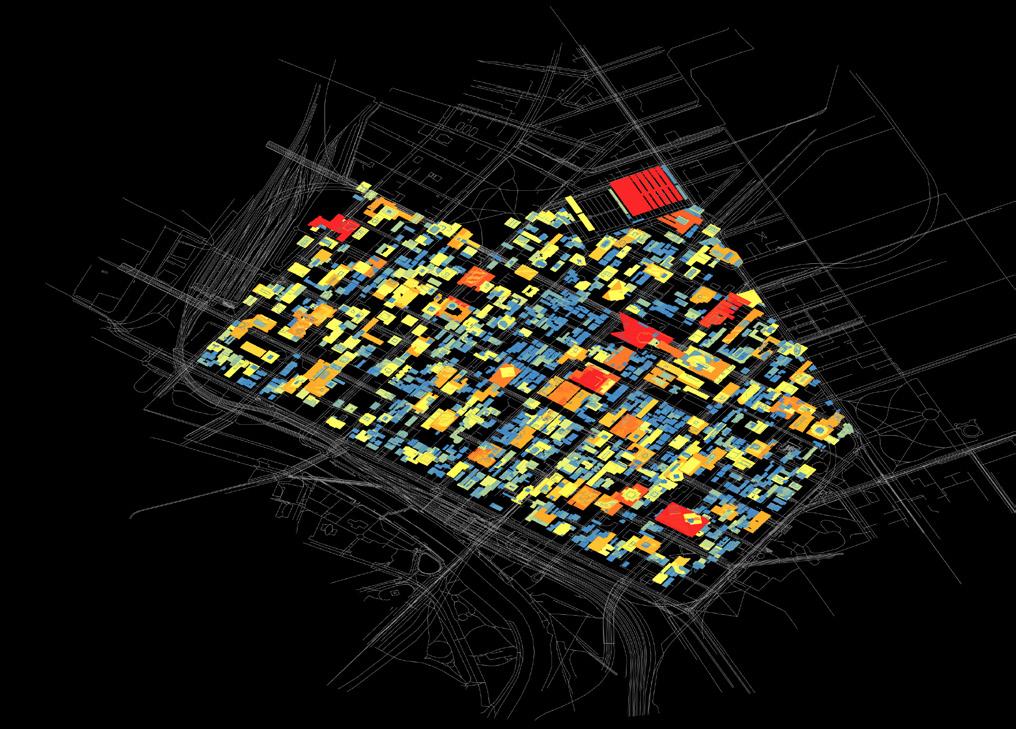
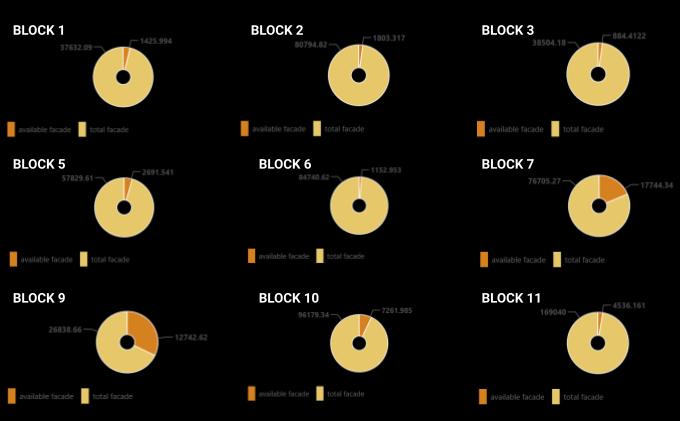
Data analysis: abailable planting area on facade
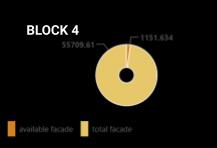


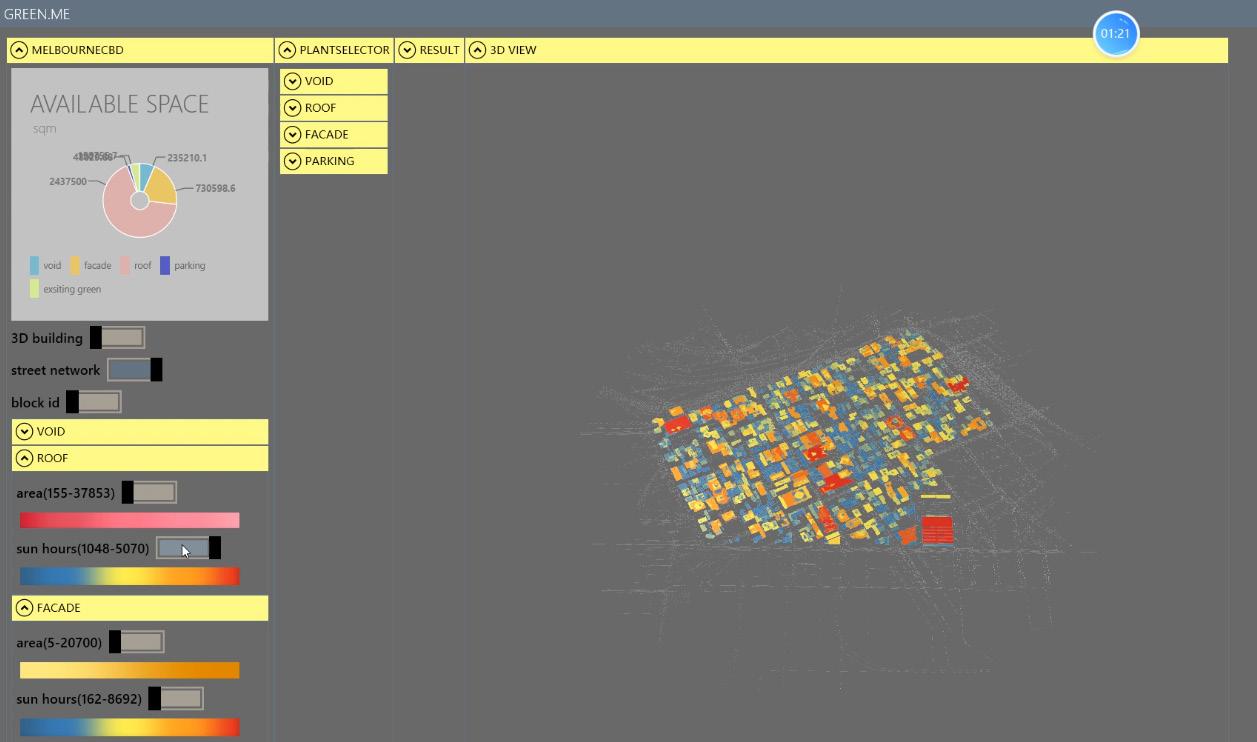
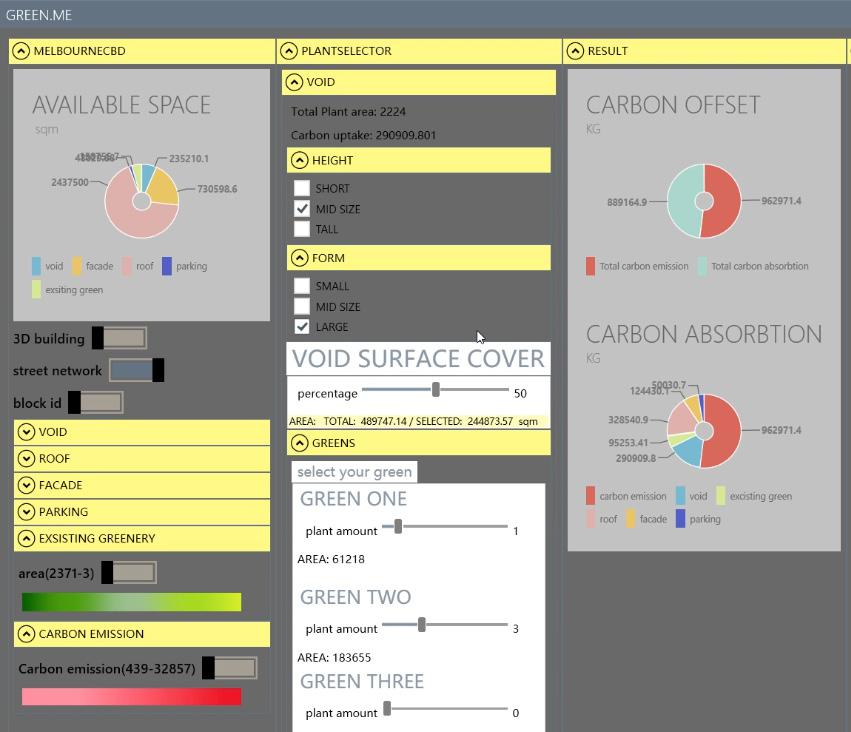
Roof space + full sun plants
Sun hours < 1700 facade space
+ shade plants
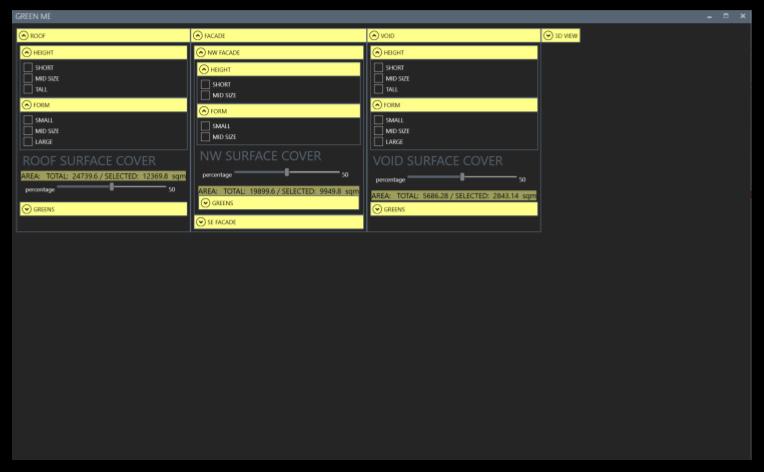
Sun hours > 1700 facade space
+ partial sun plants
void space + shade plants
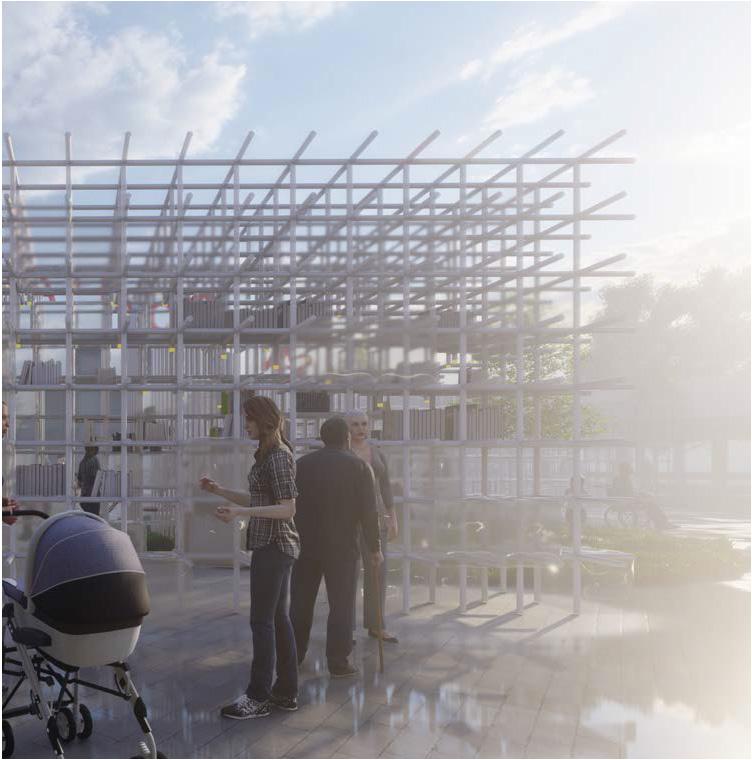
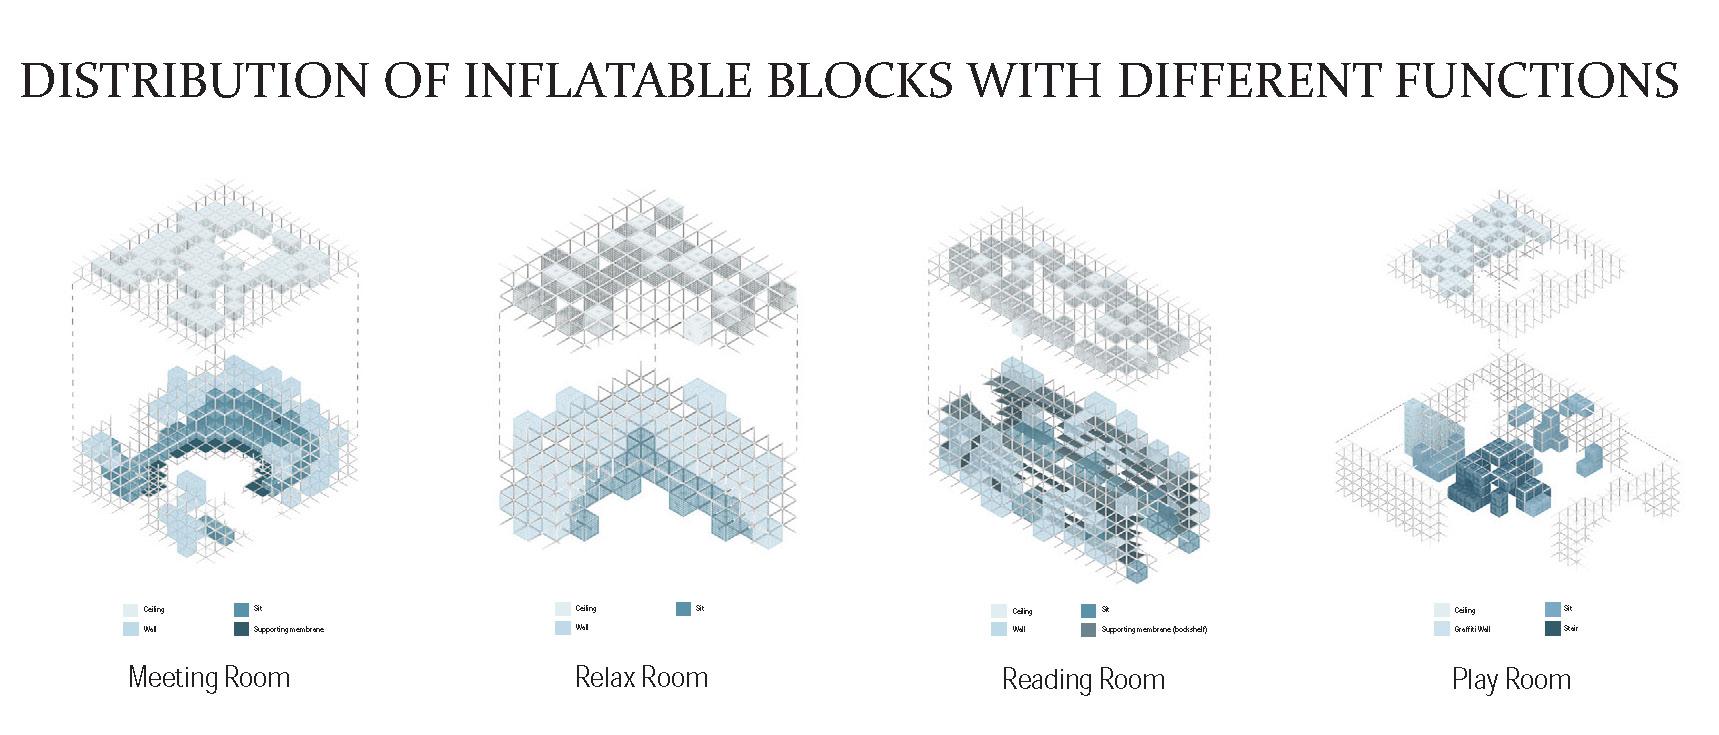
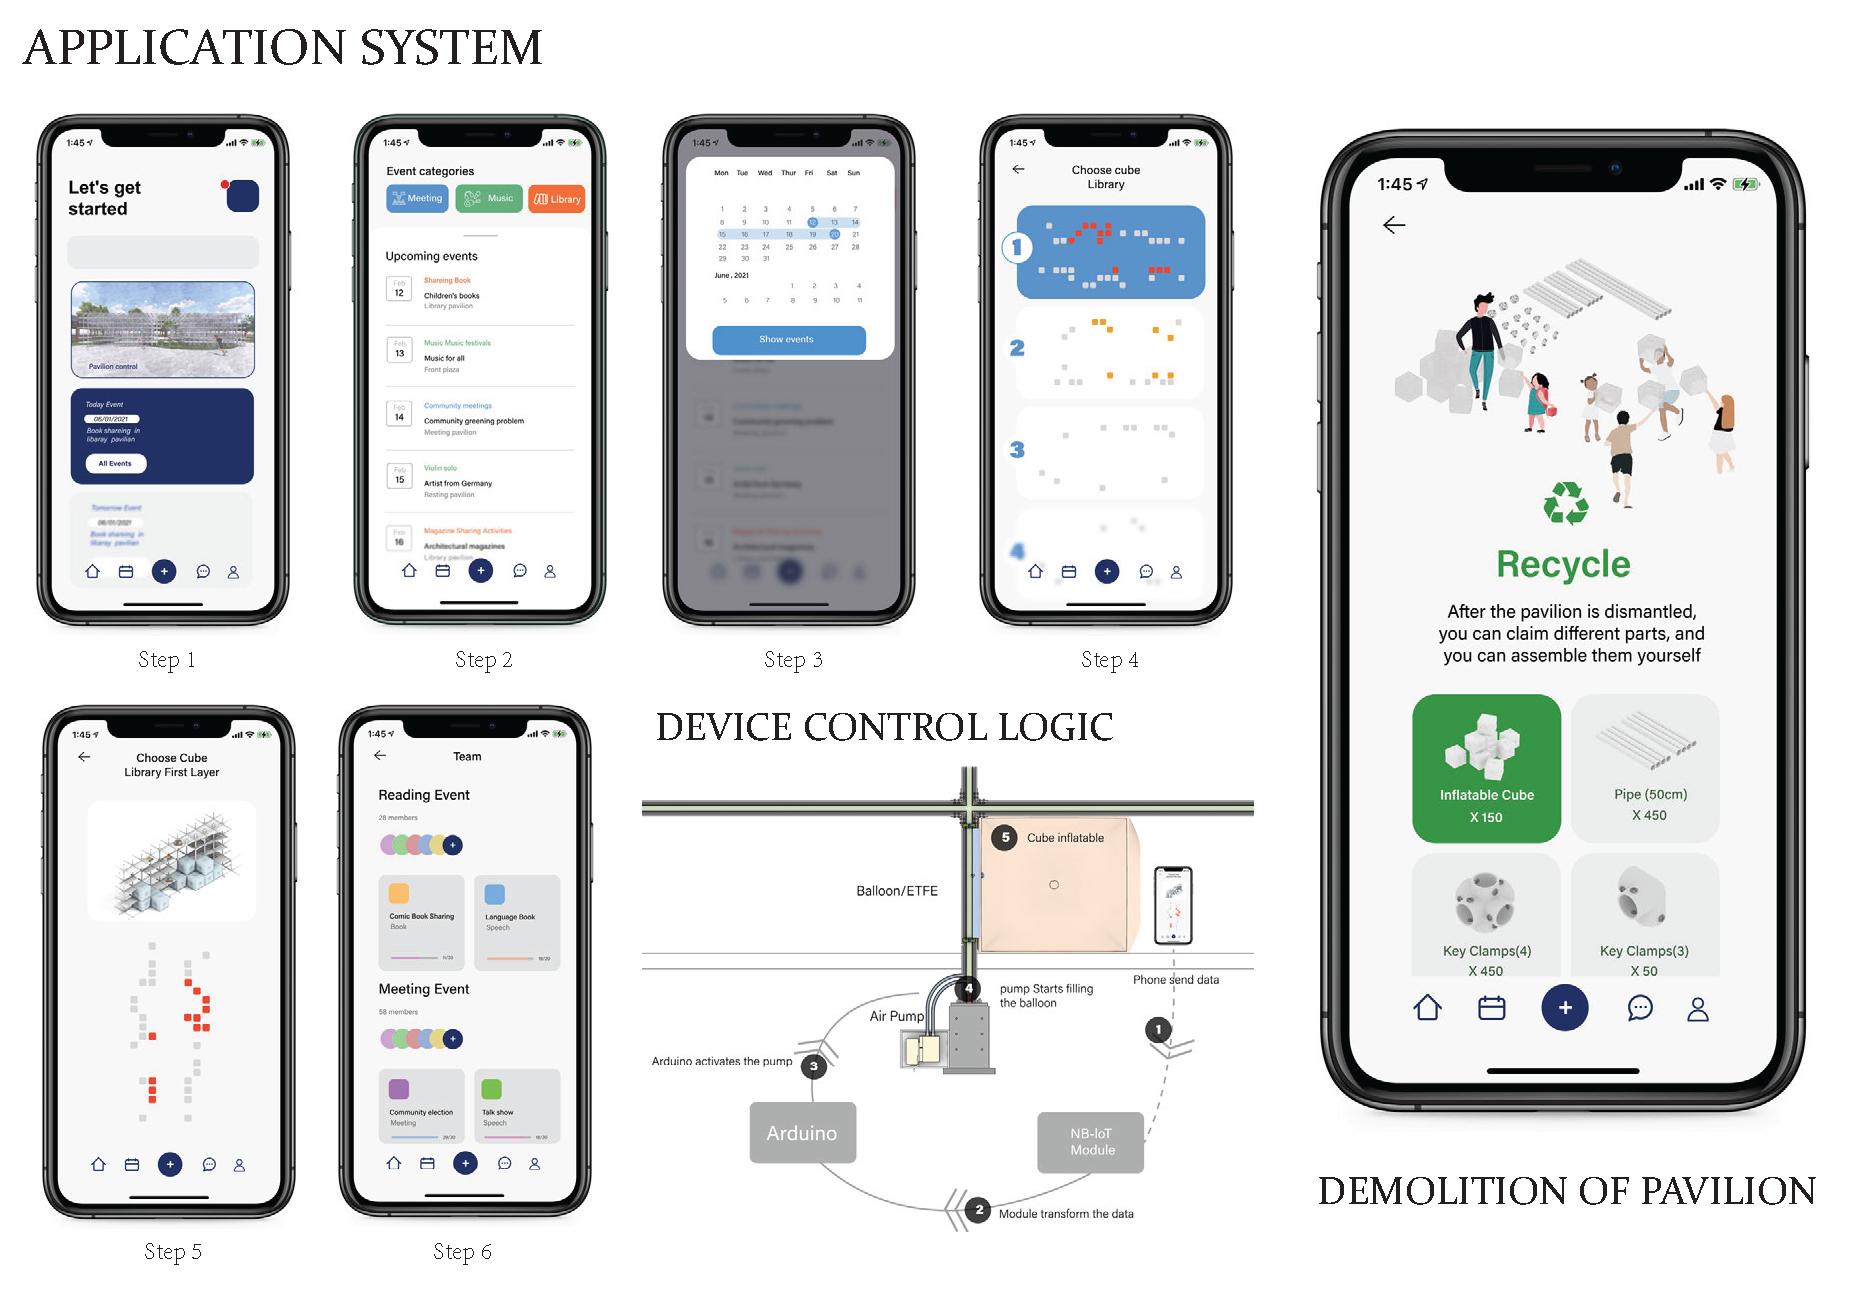
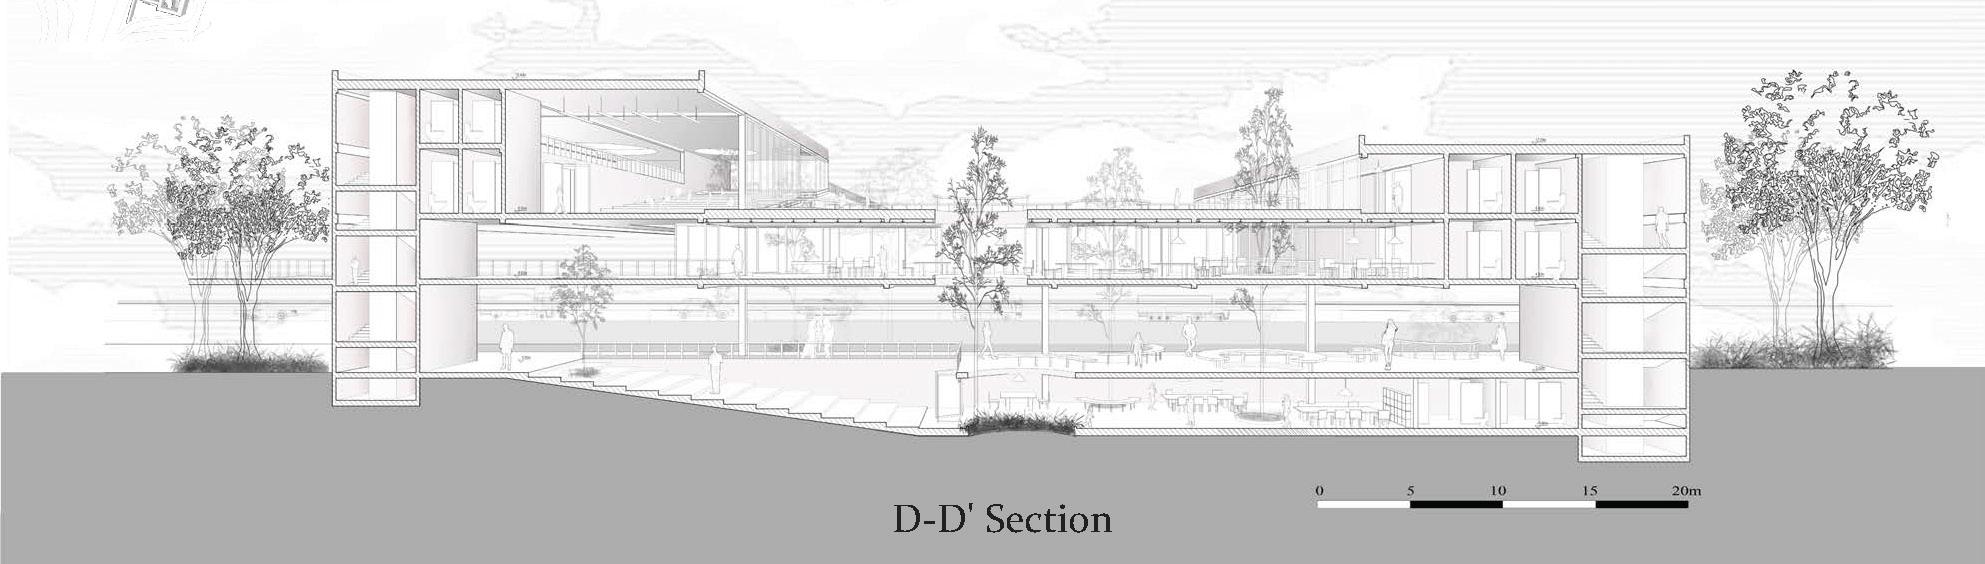
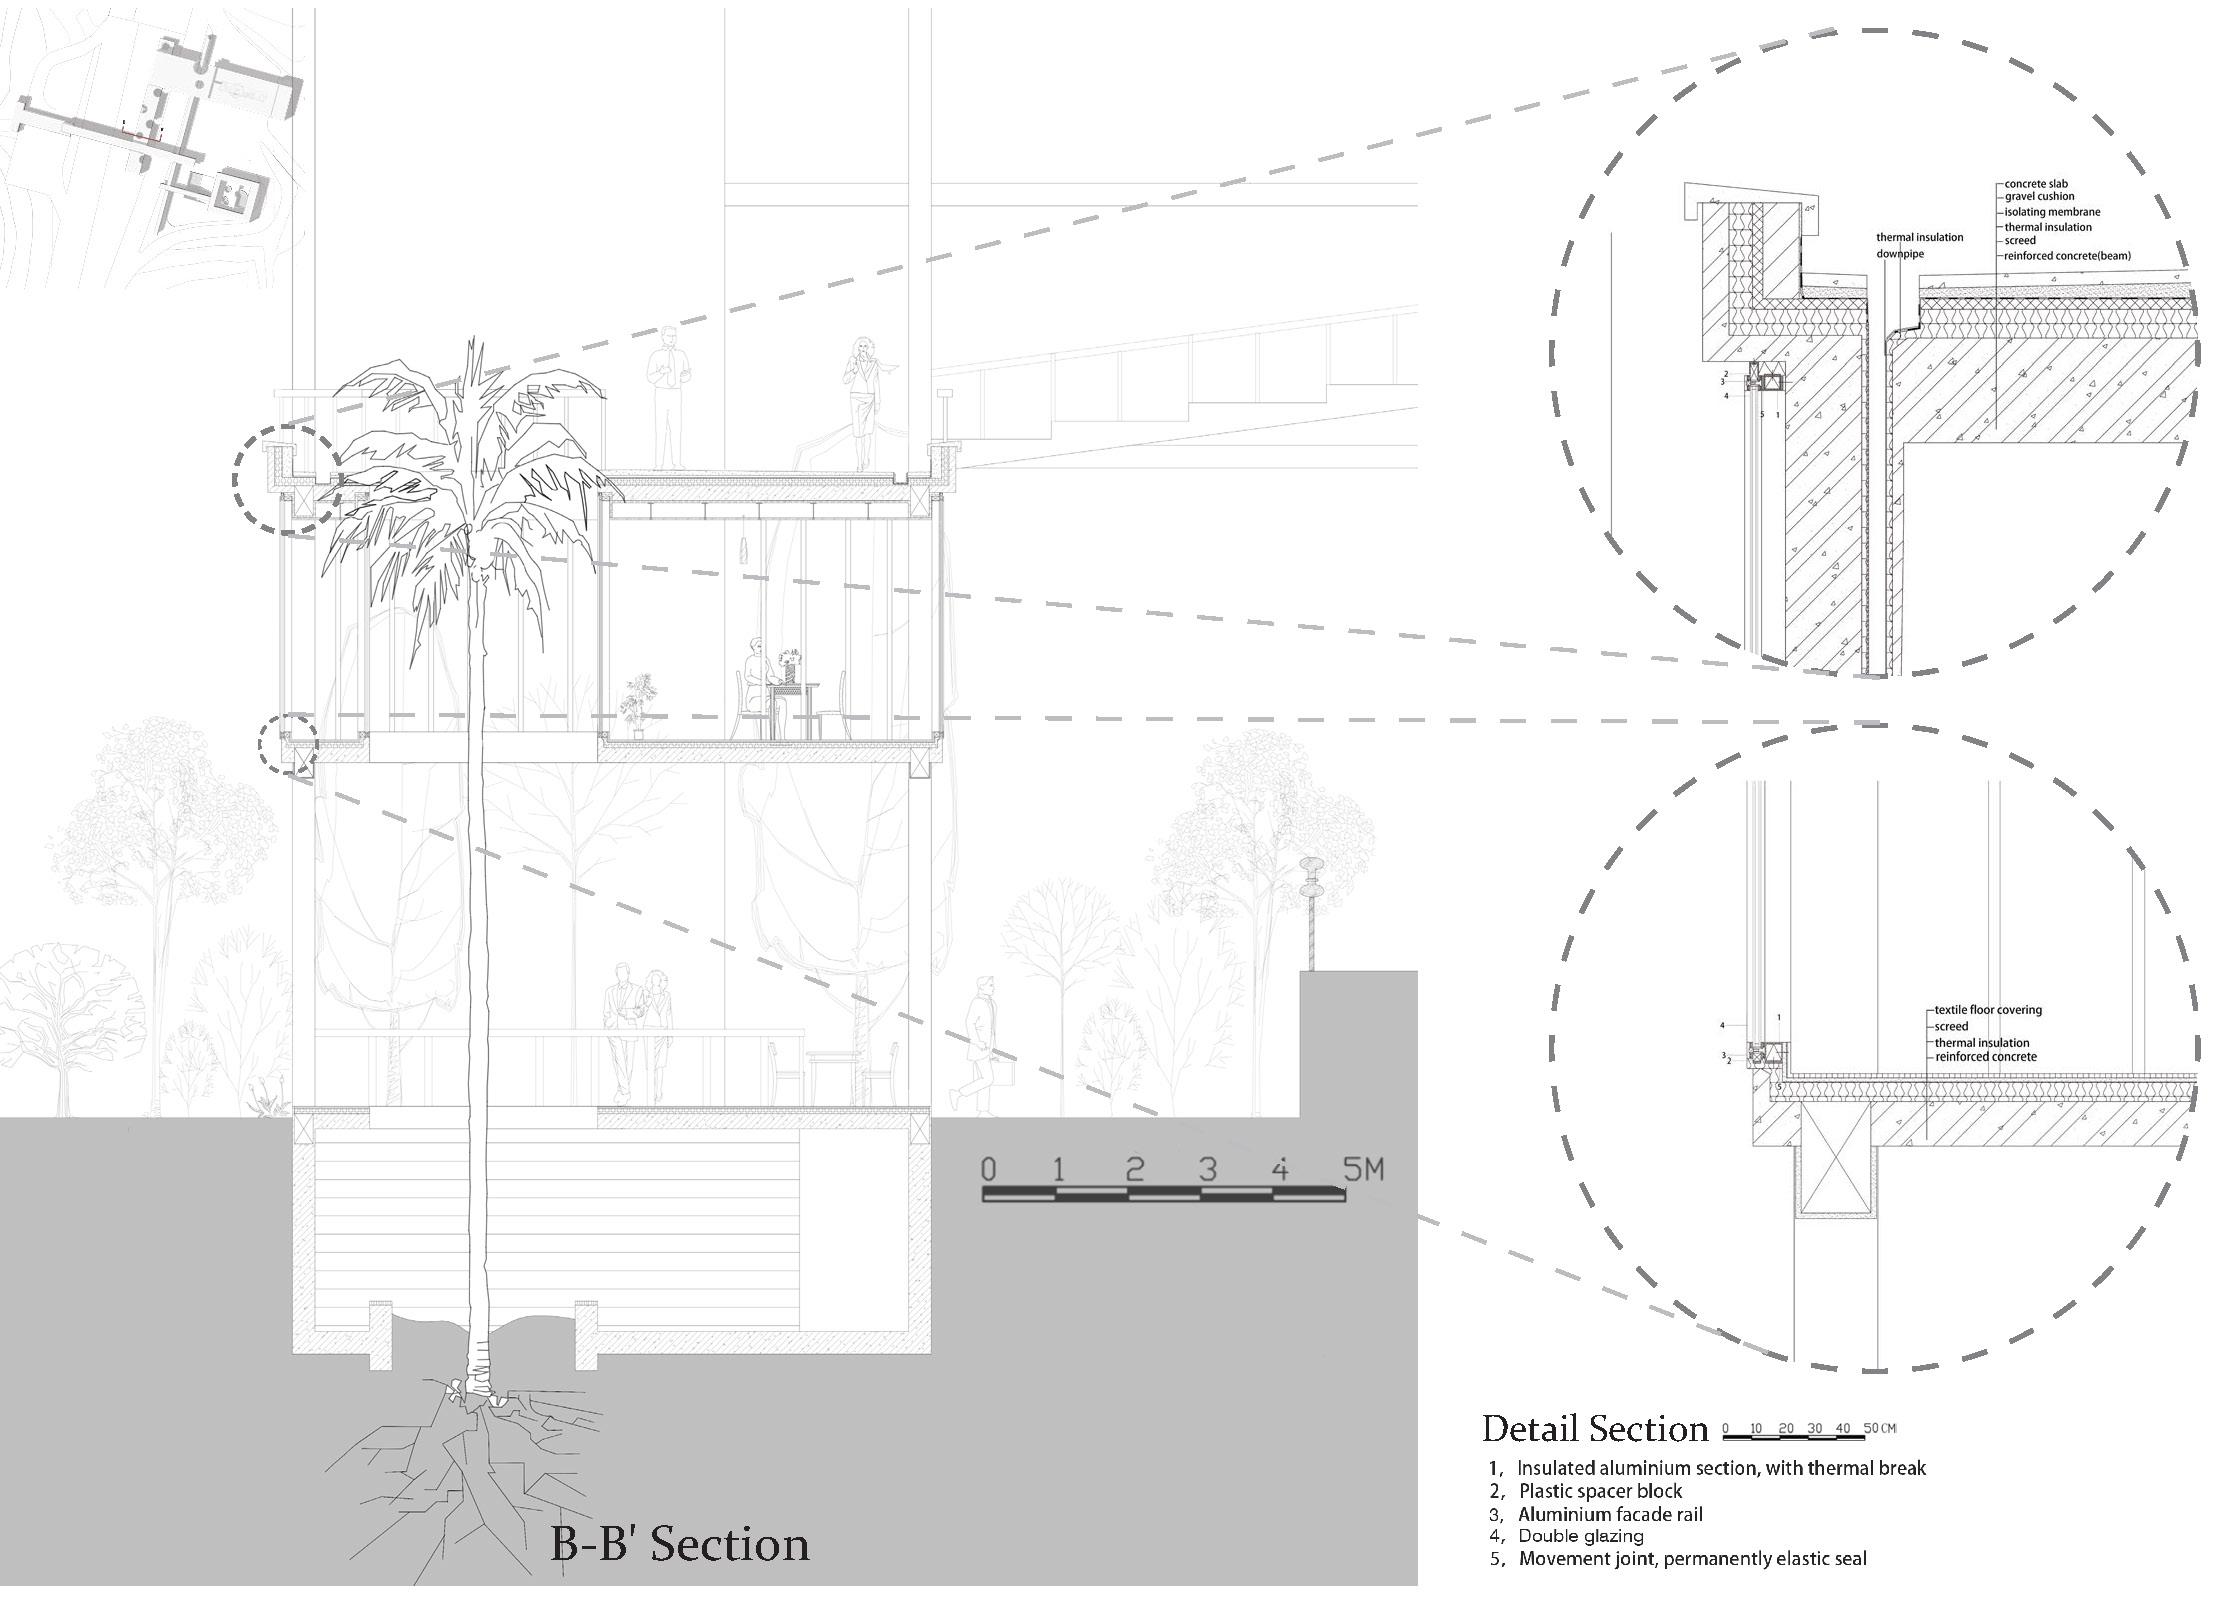
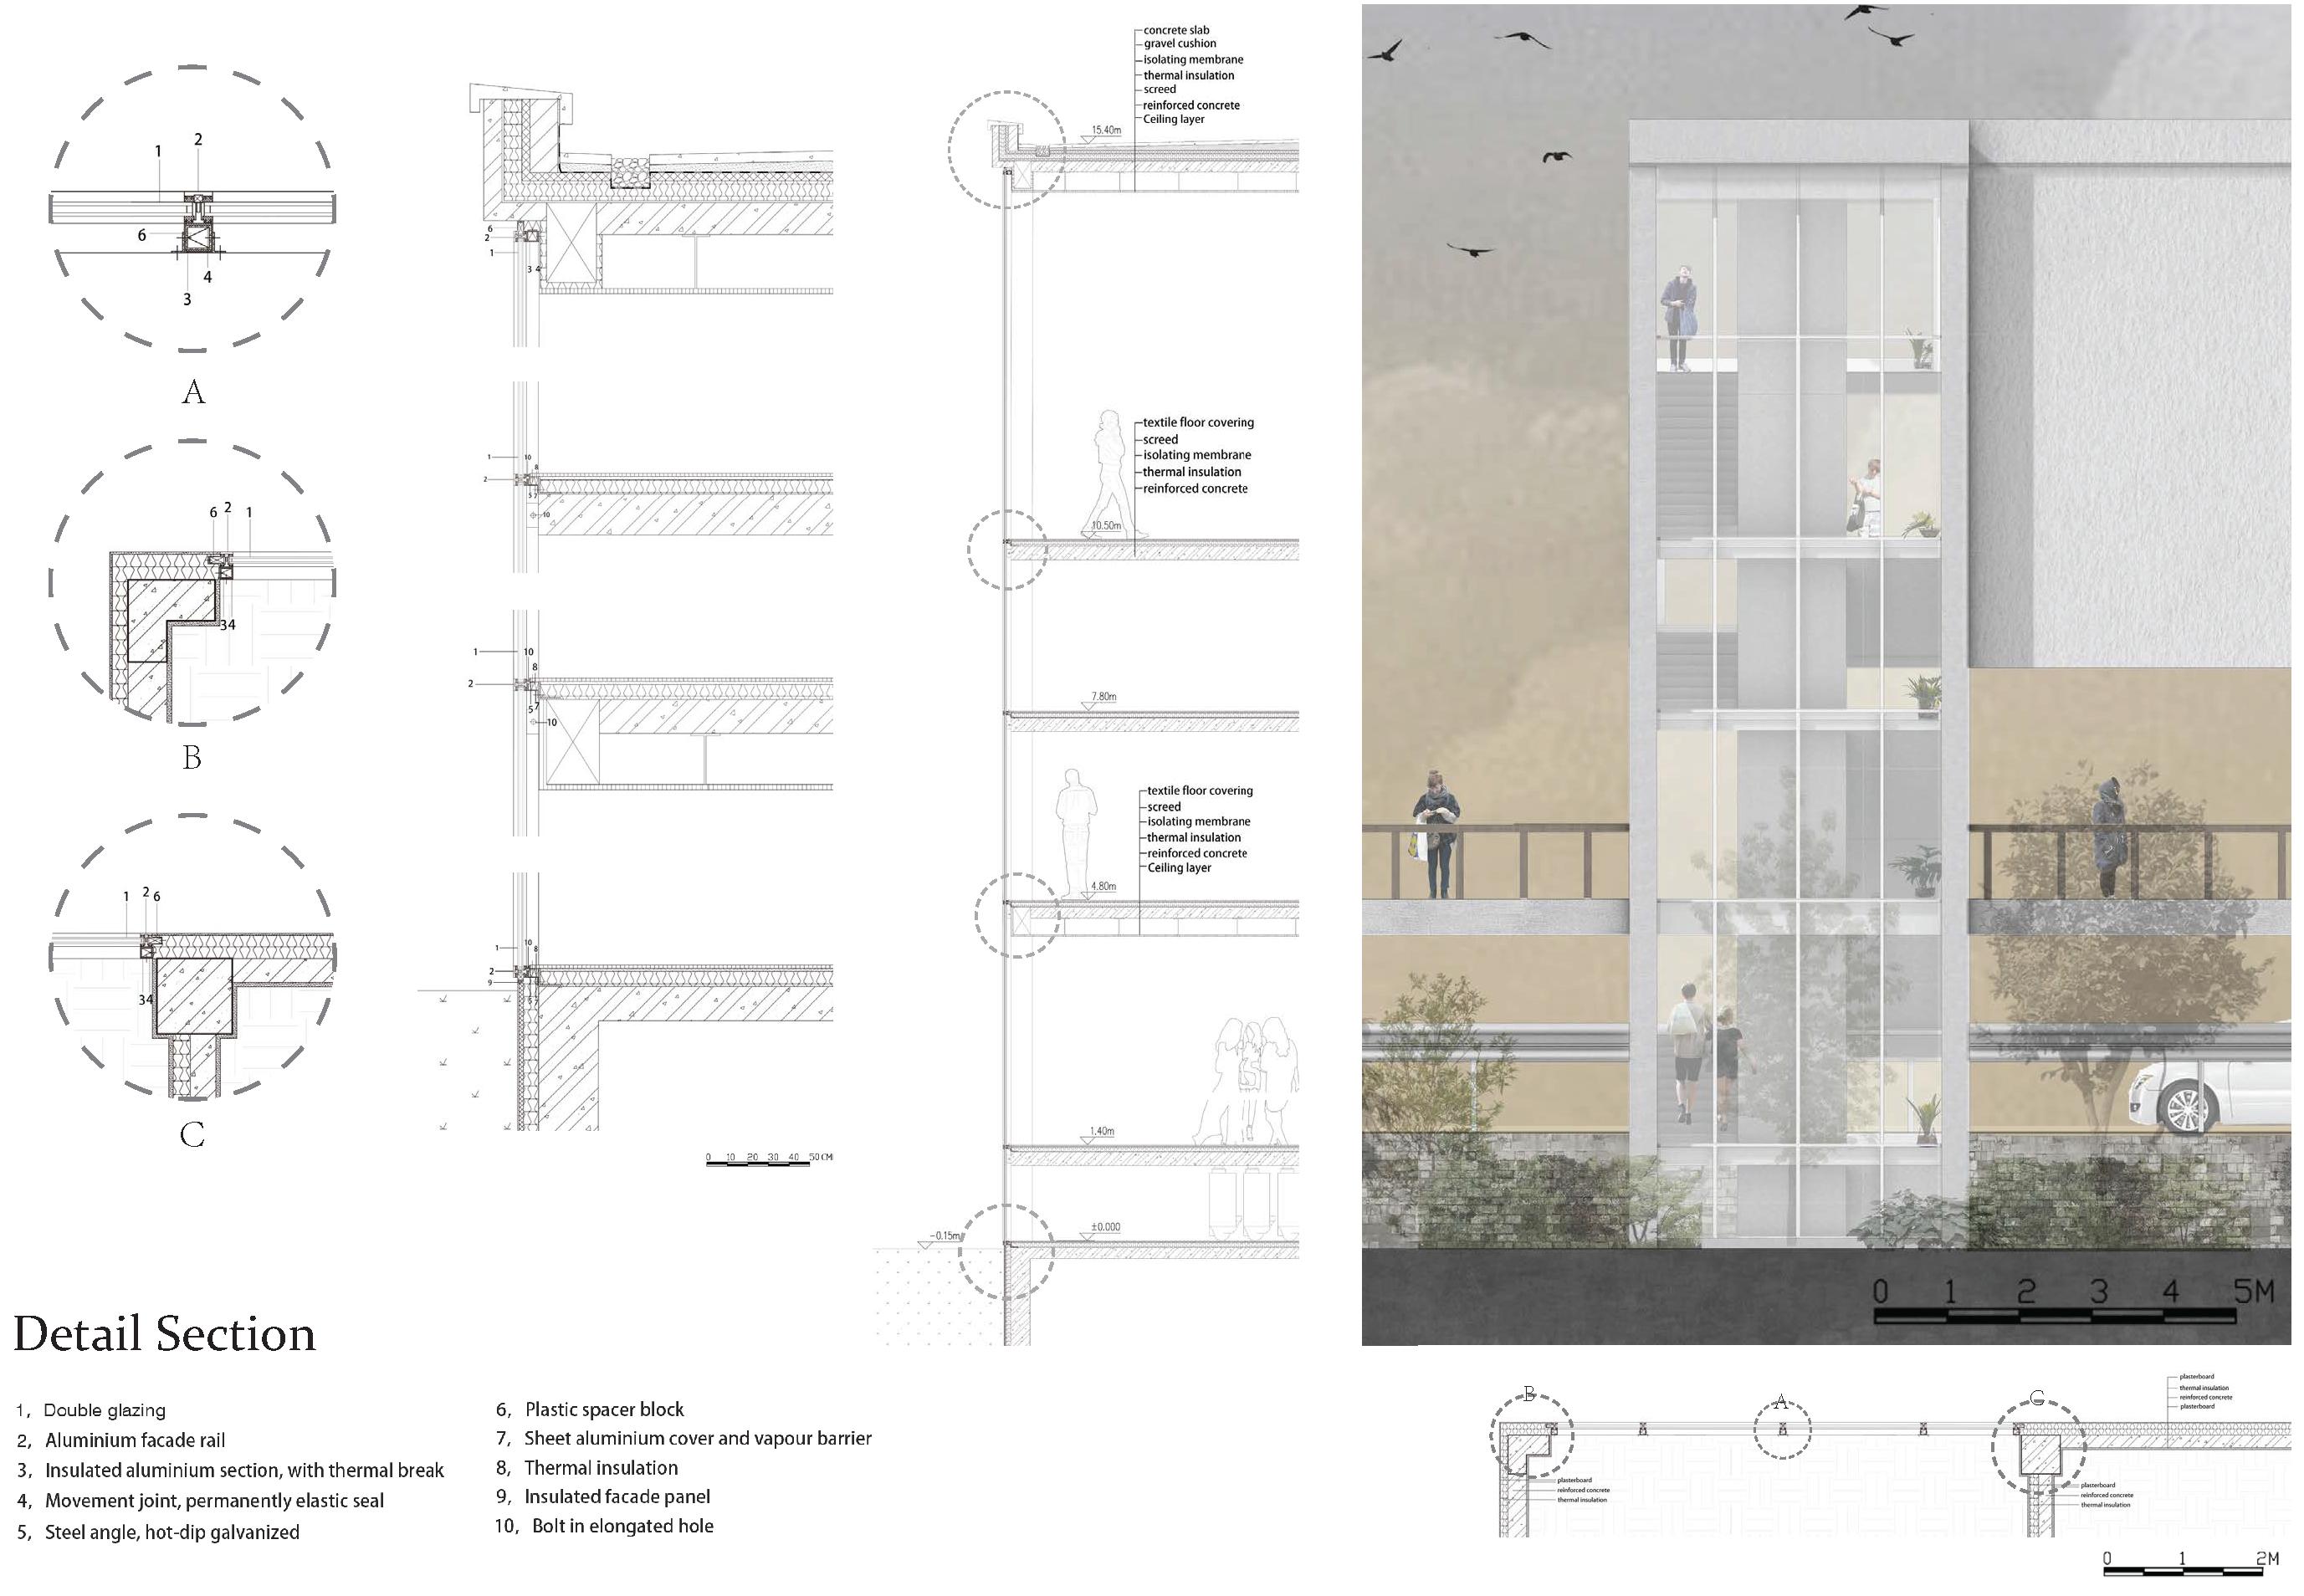
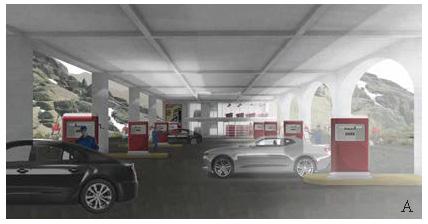
Building performance simulation and responsive design

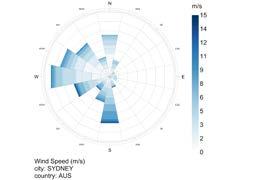
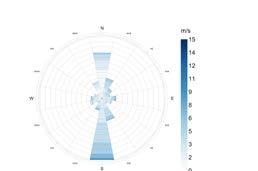
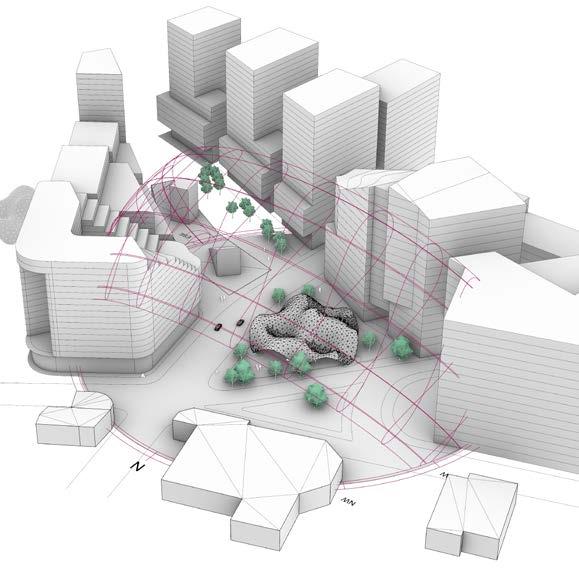
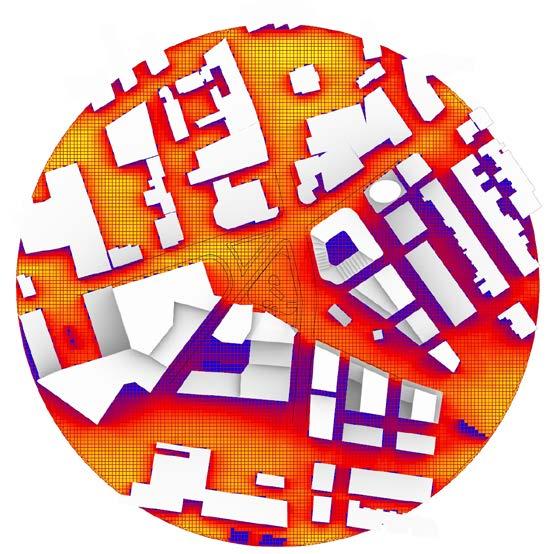


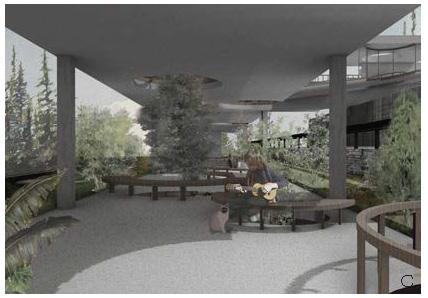
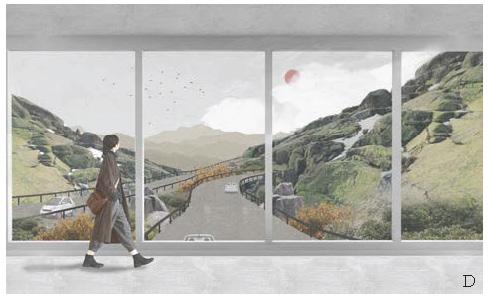
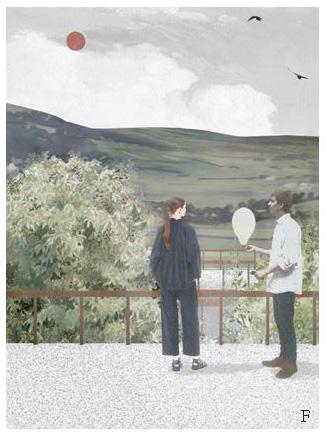
How will urban facilities meet the diverse and dynamic needs of the public?
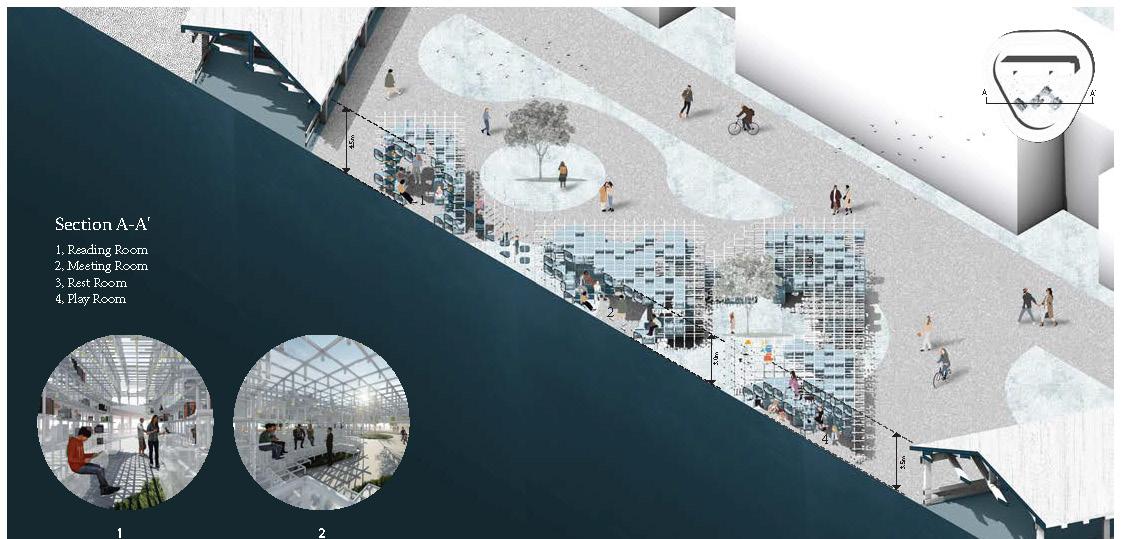


Rest room models from different perspectives

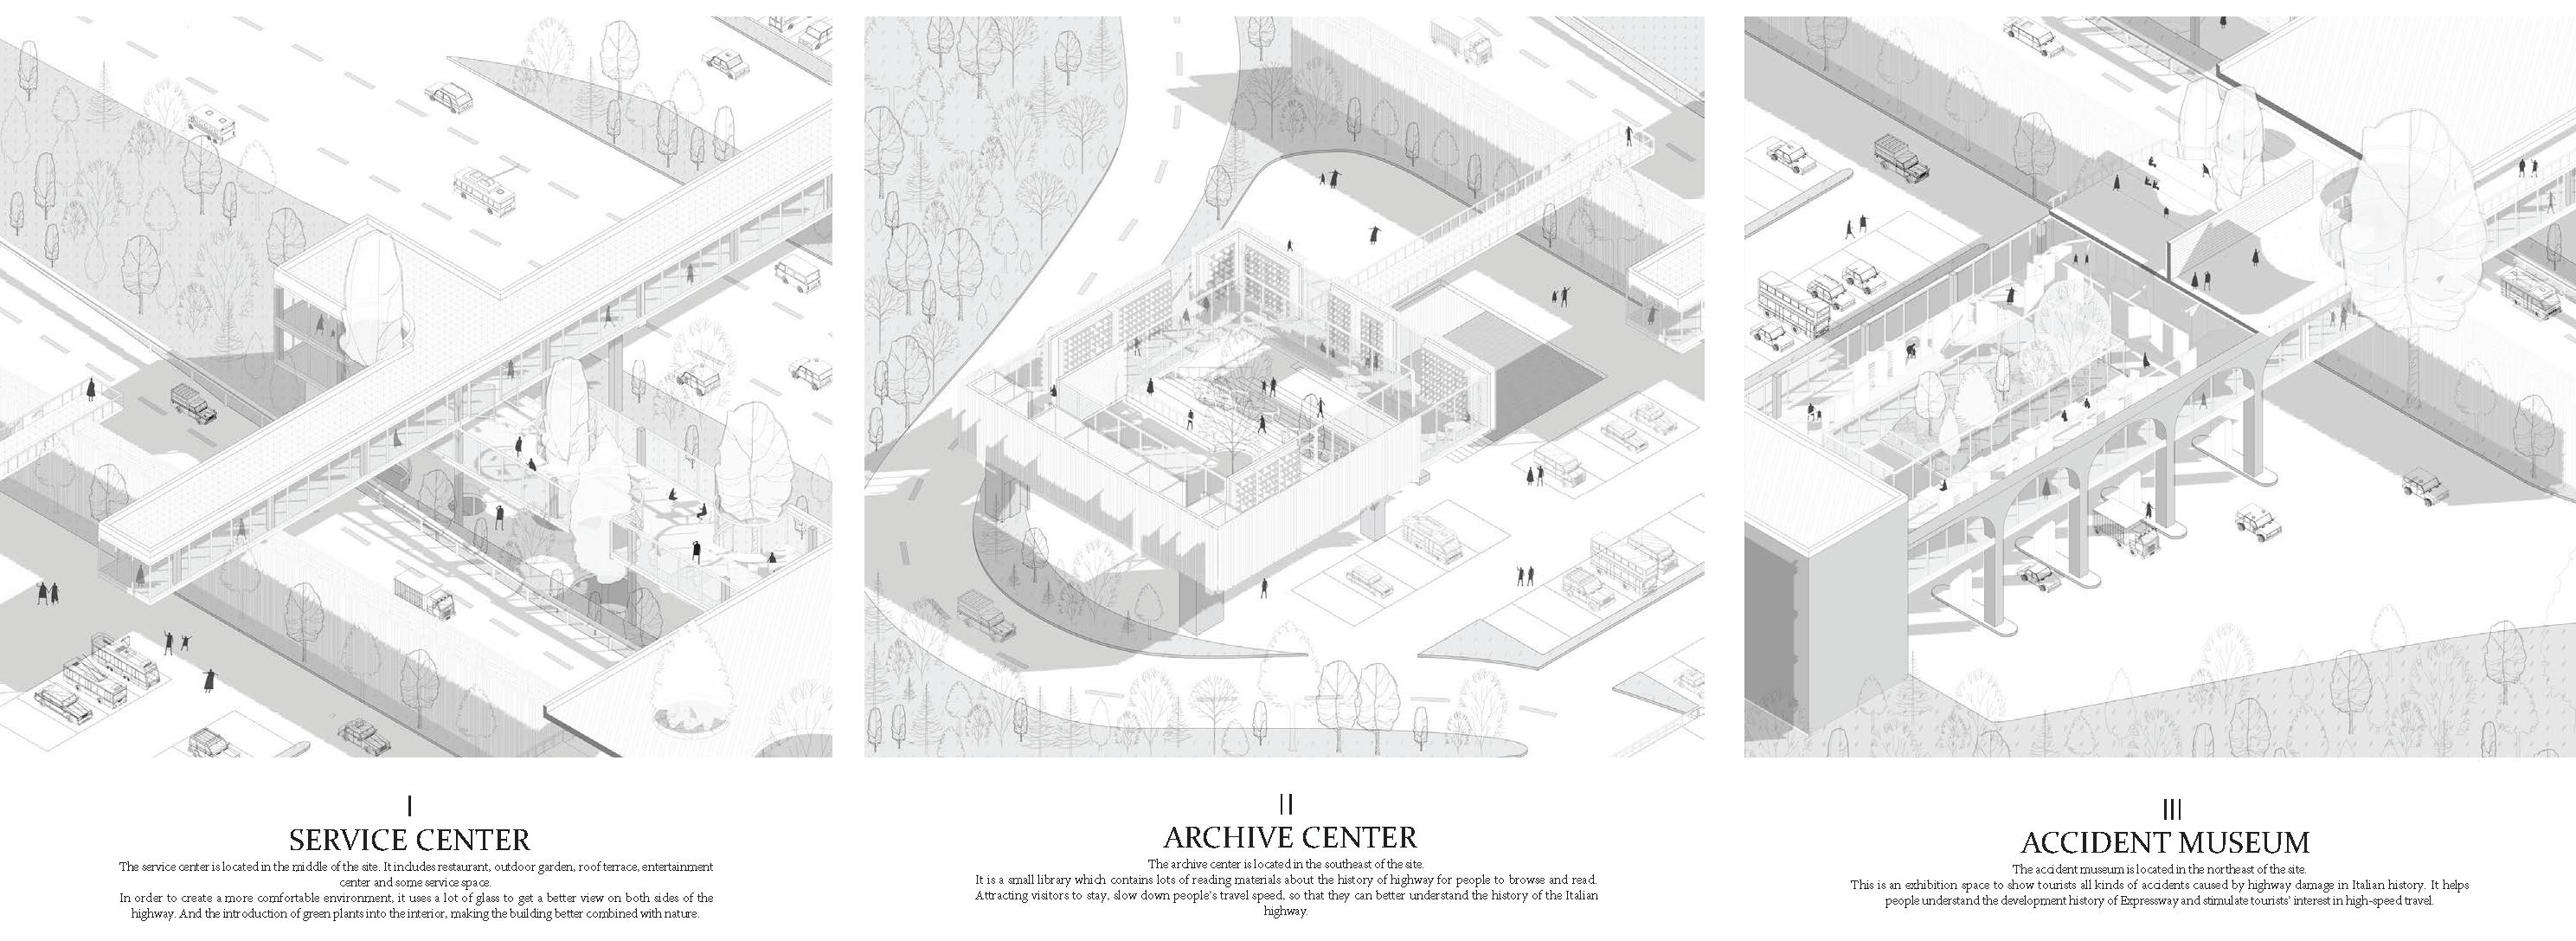
Highway service area design.
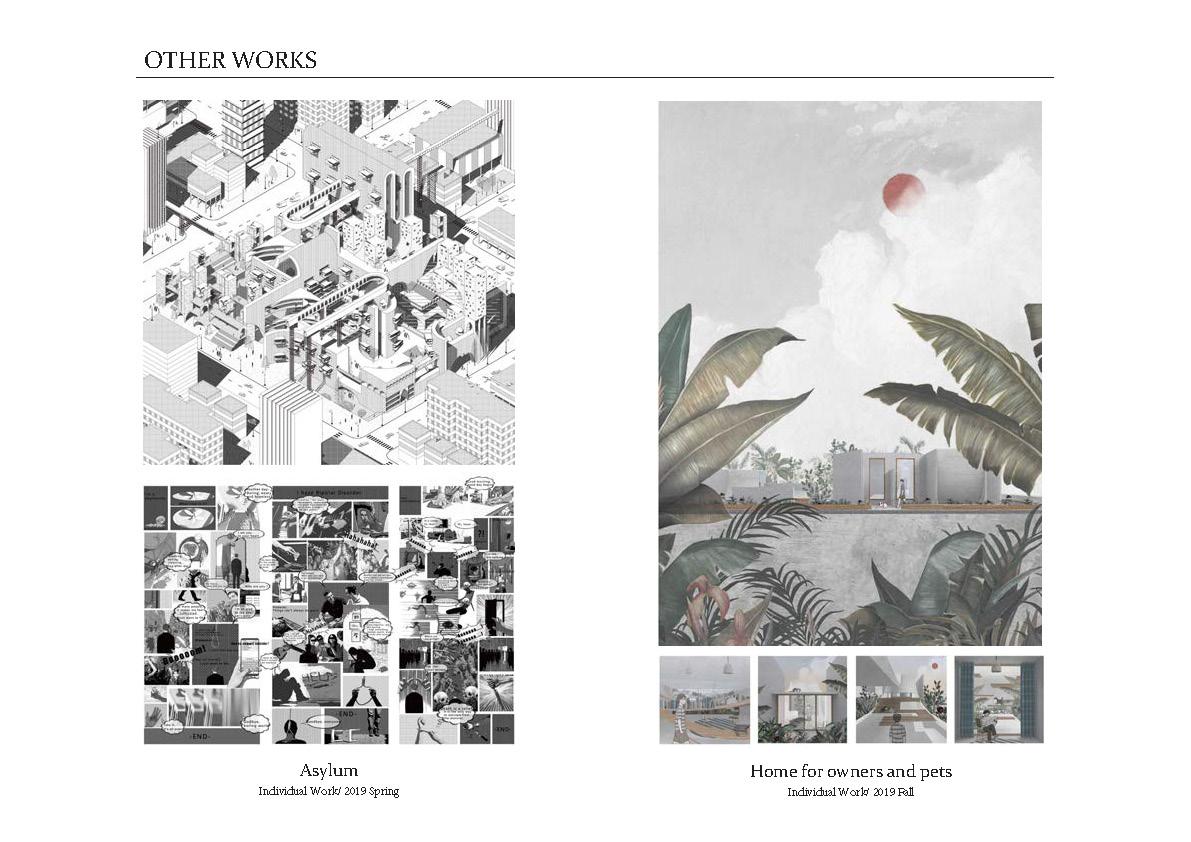
A physical and mental refuge from a shooting incident
Architecture Design Studio
Faculty: Wei Wu
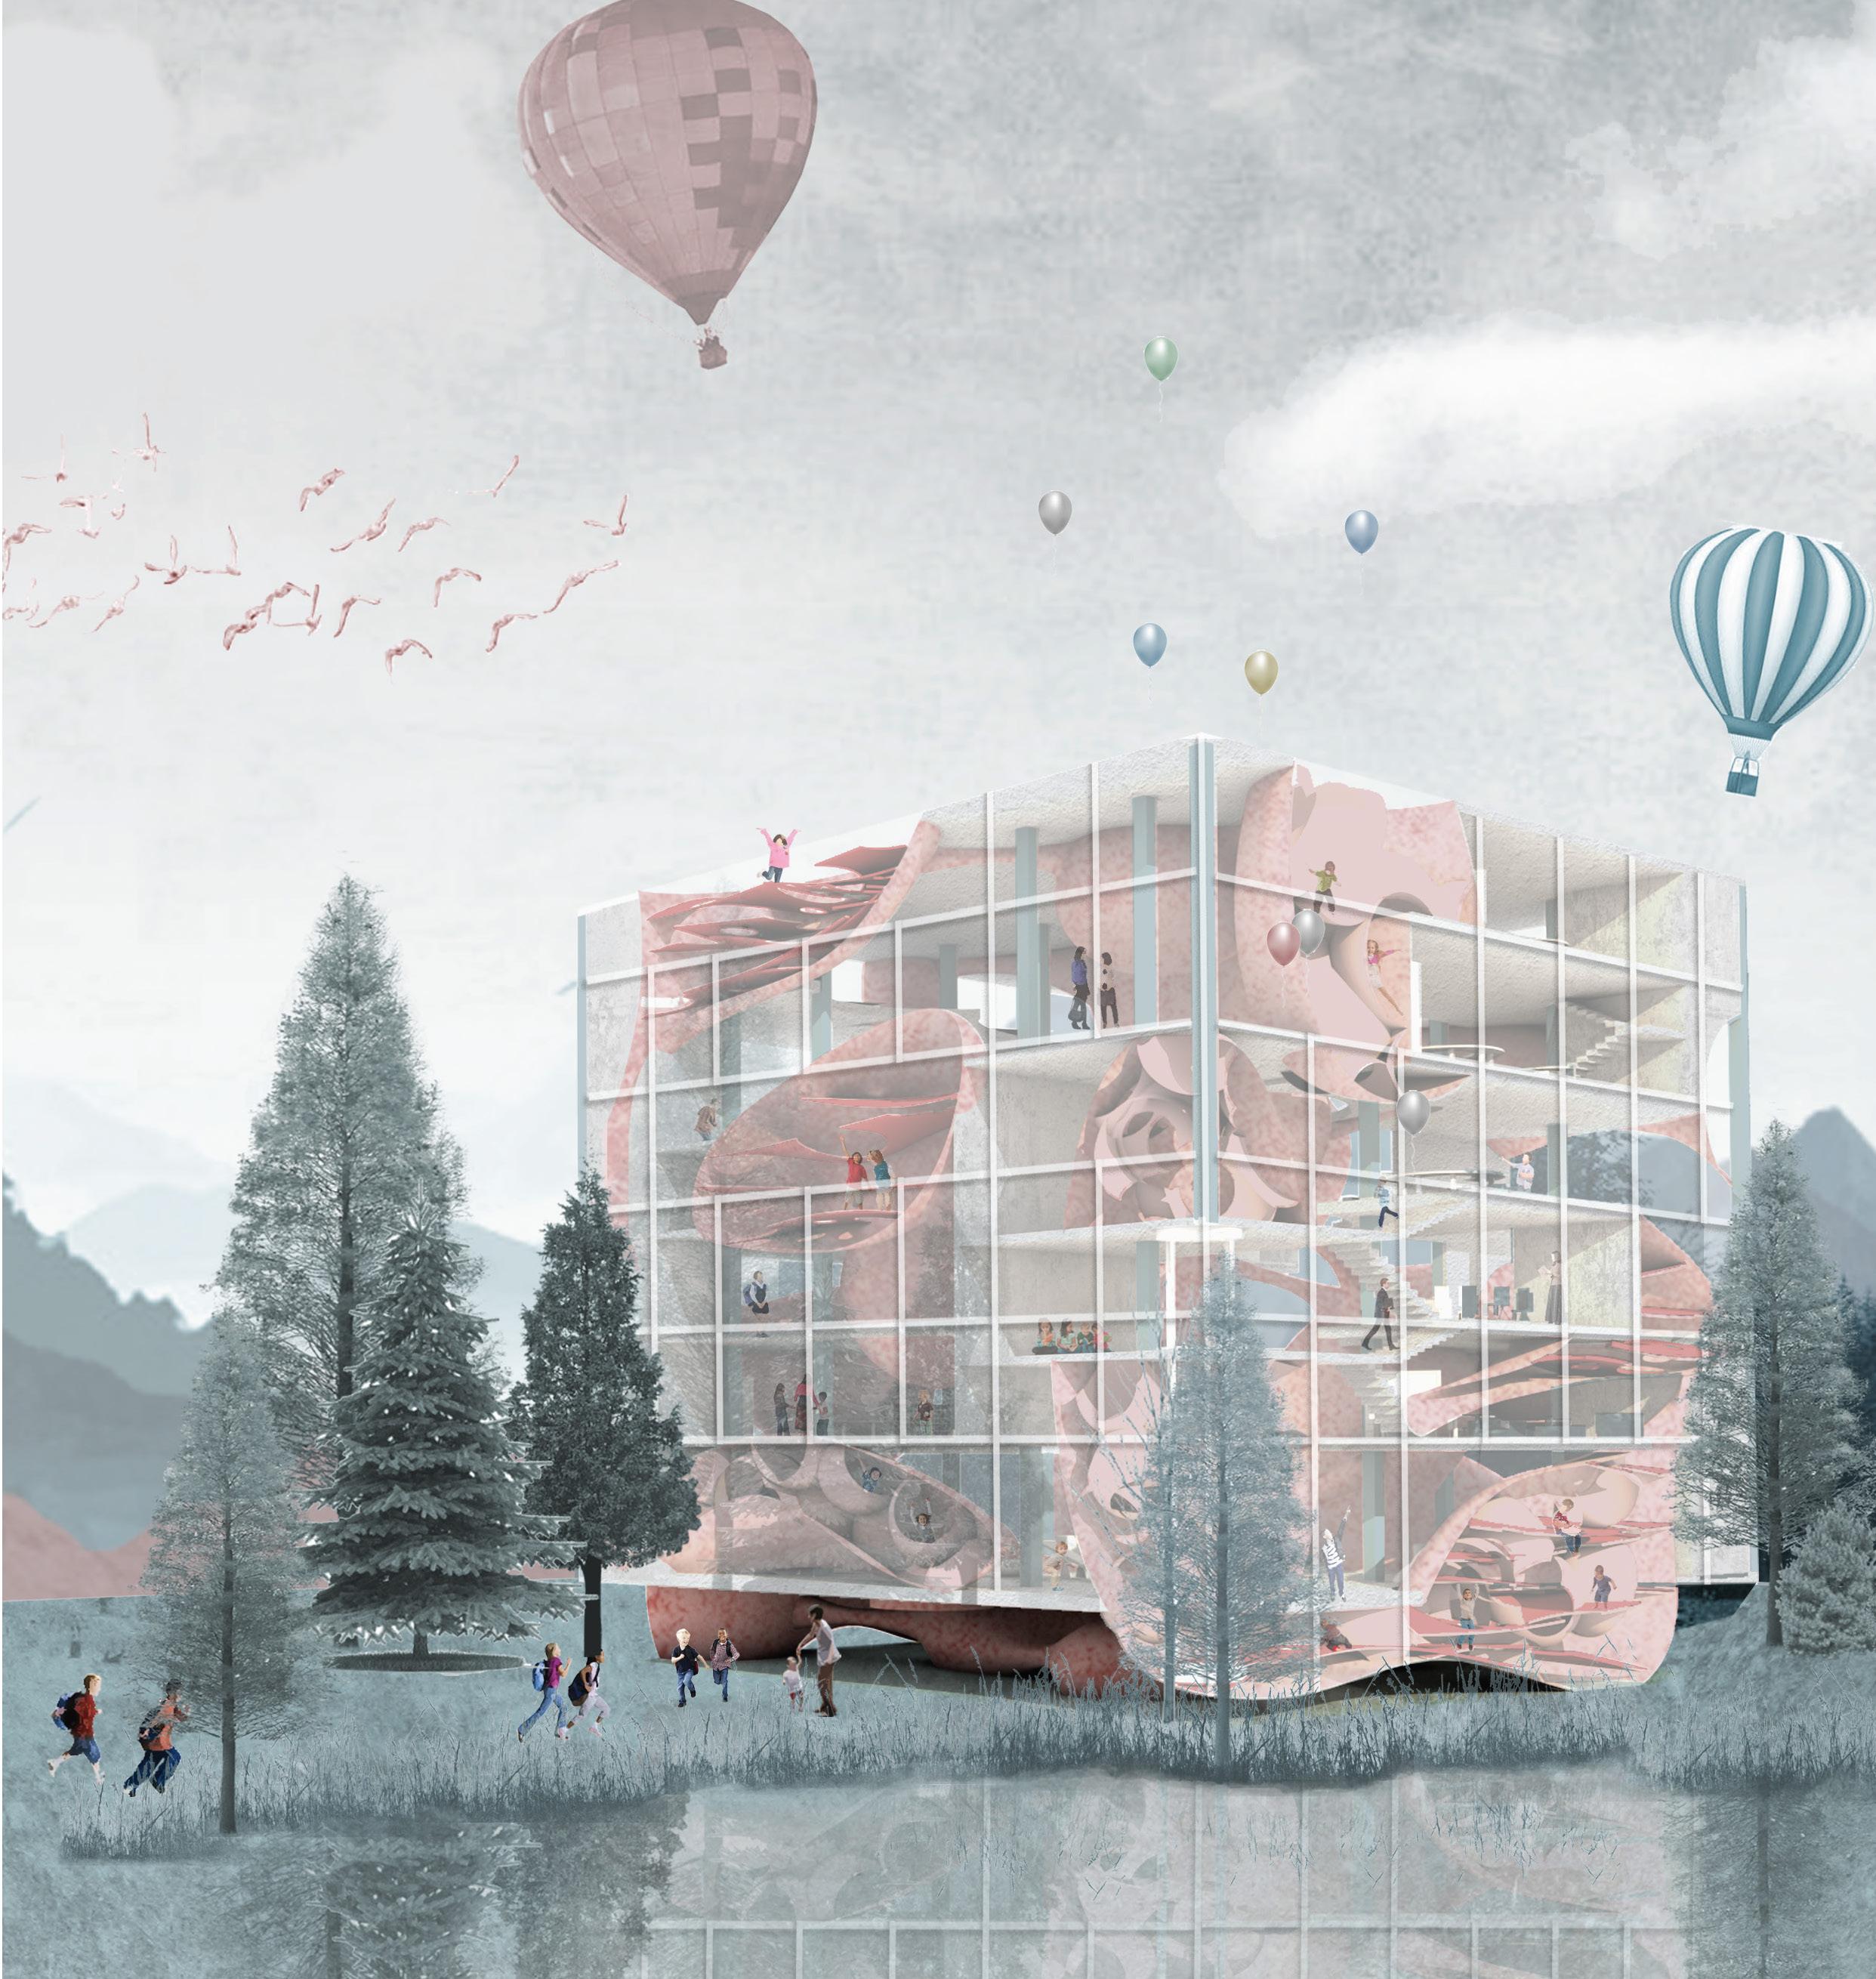
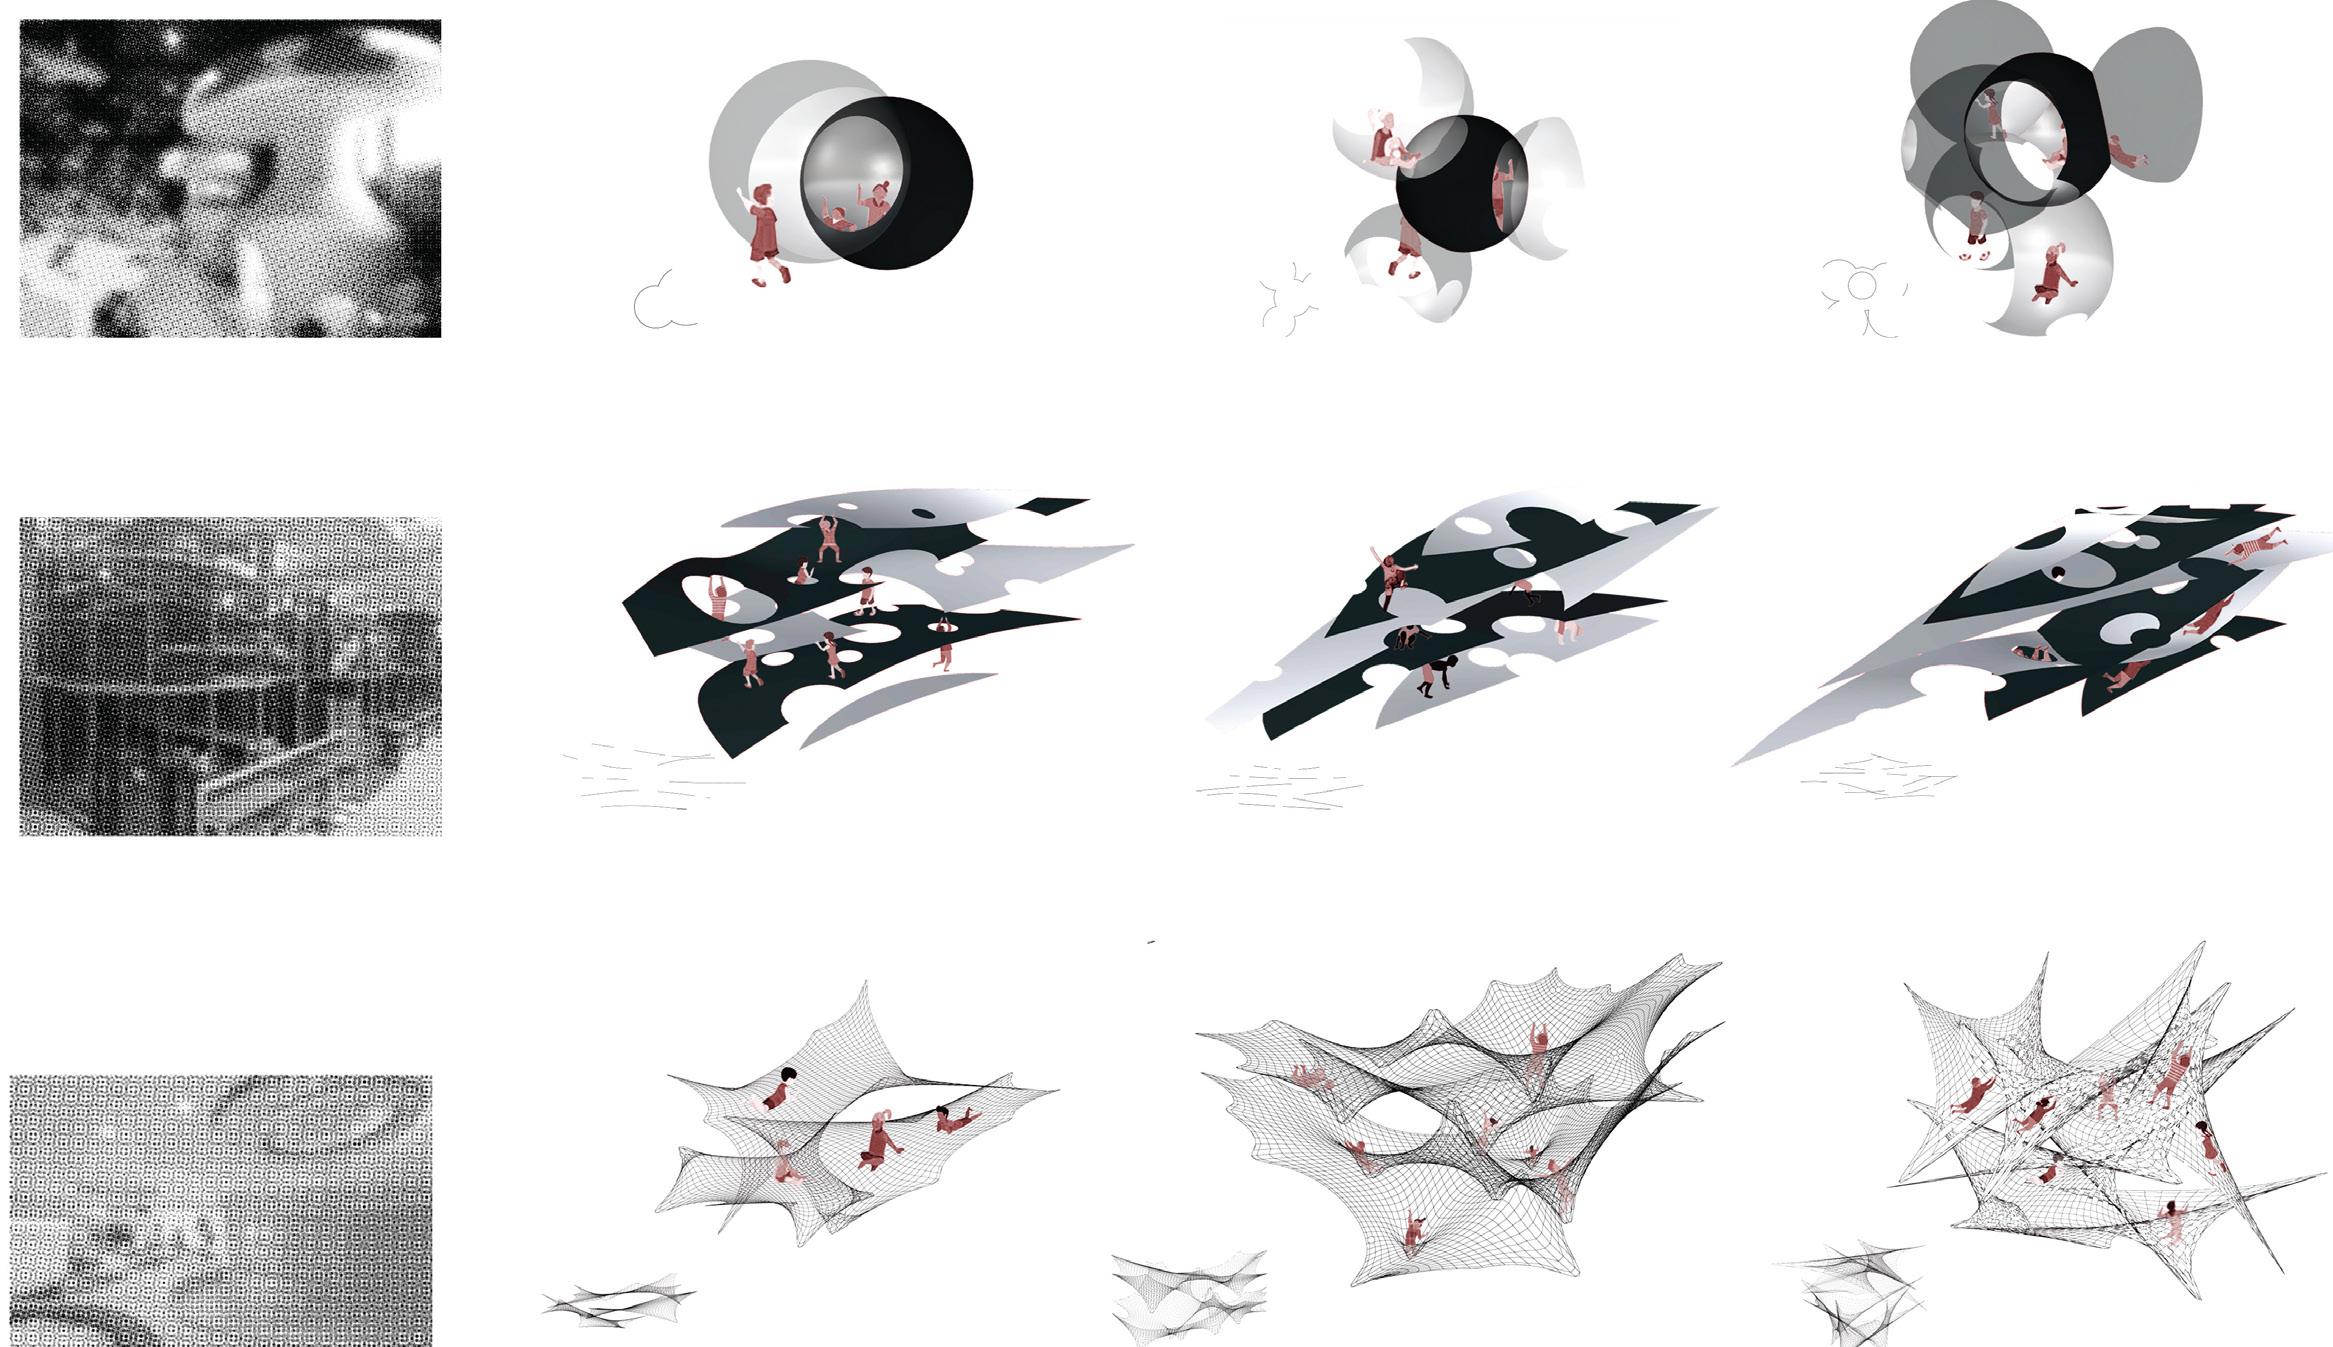
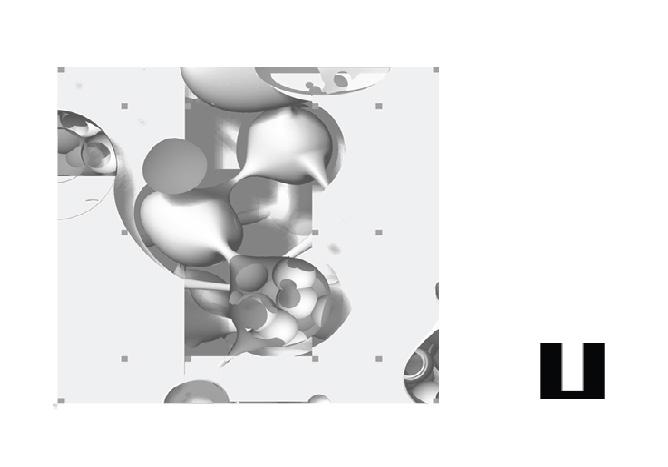
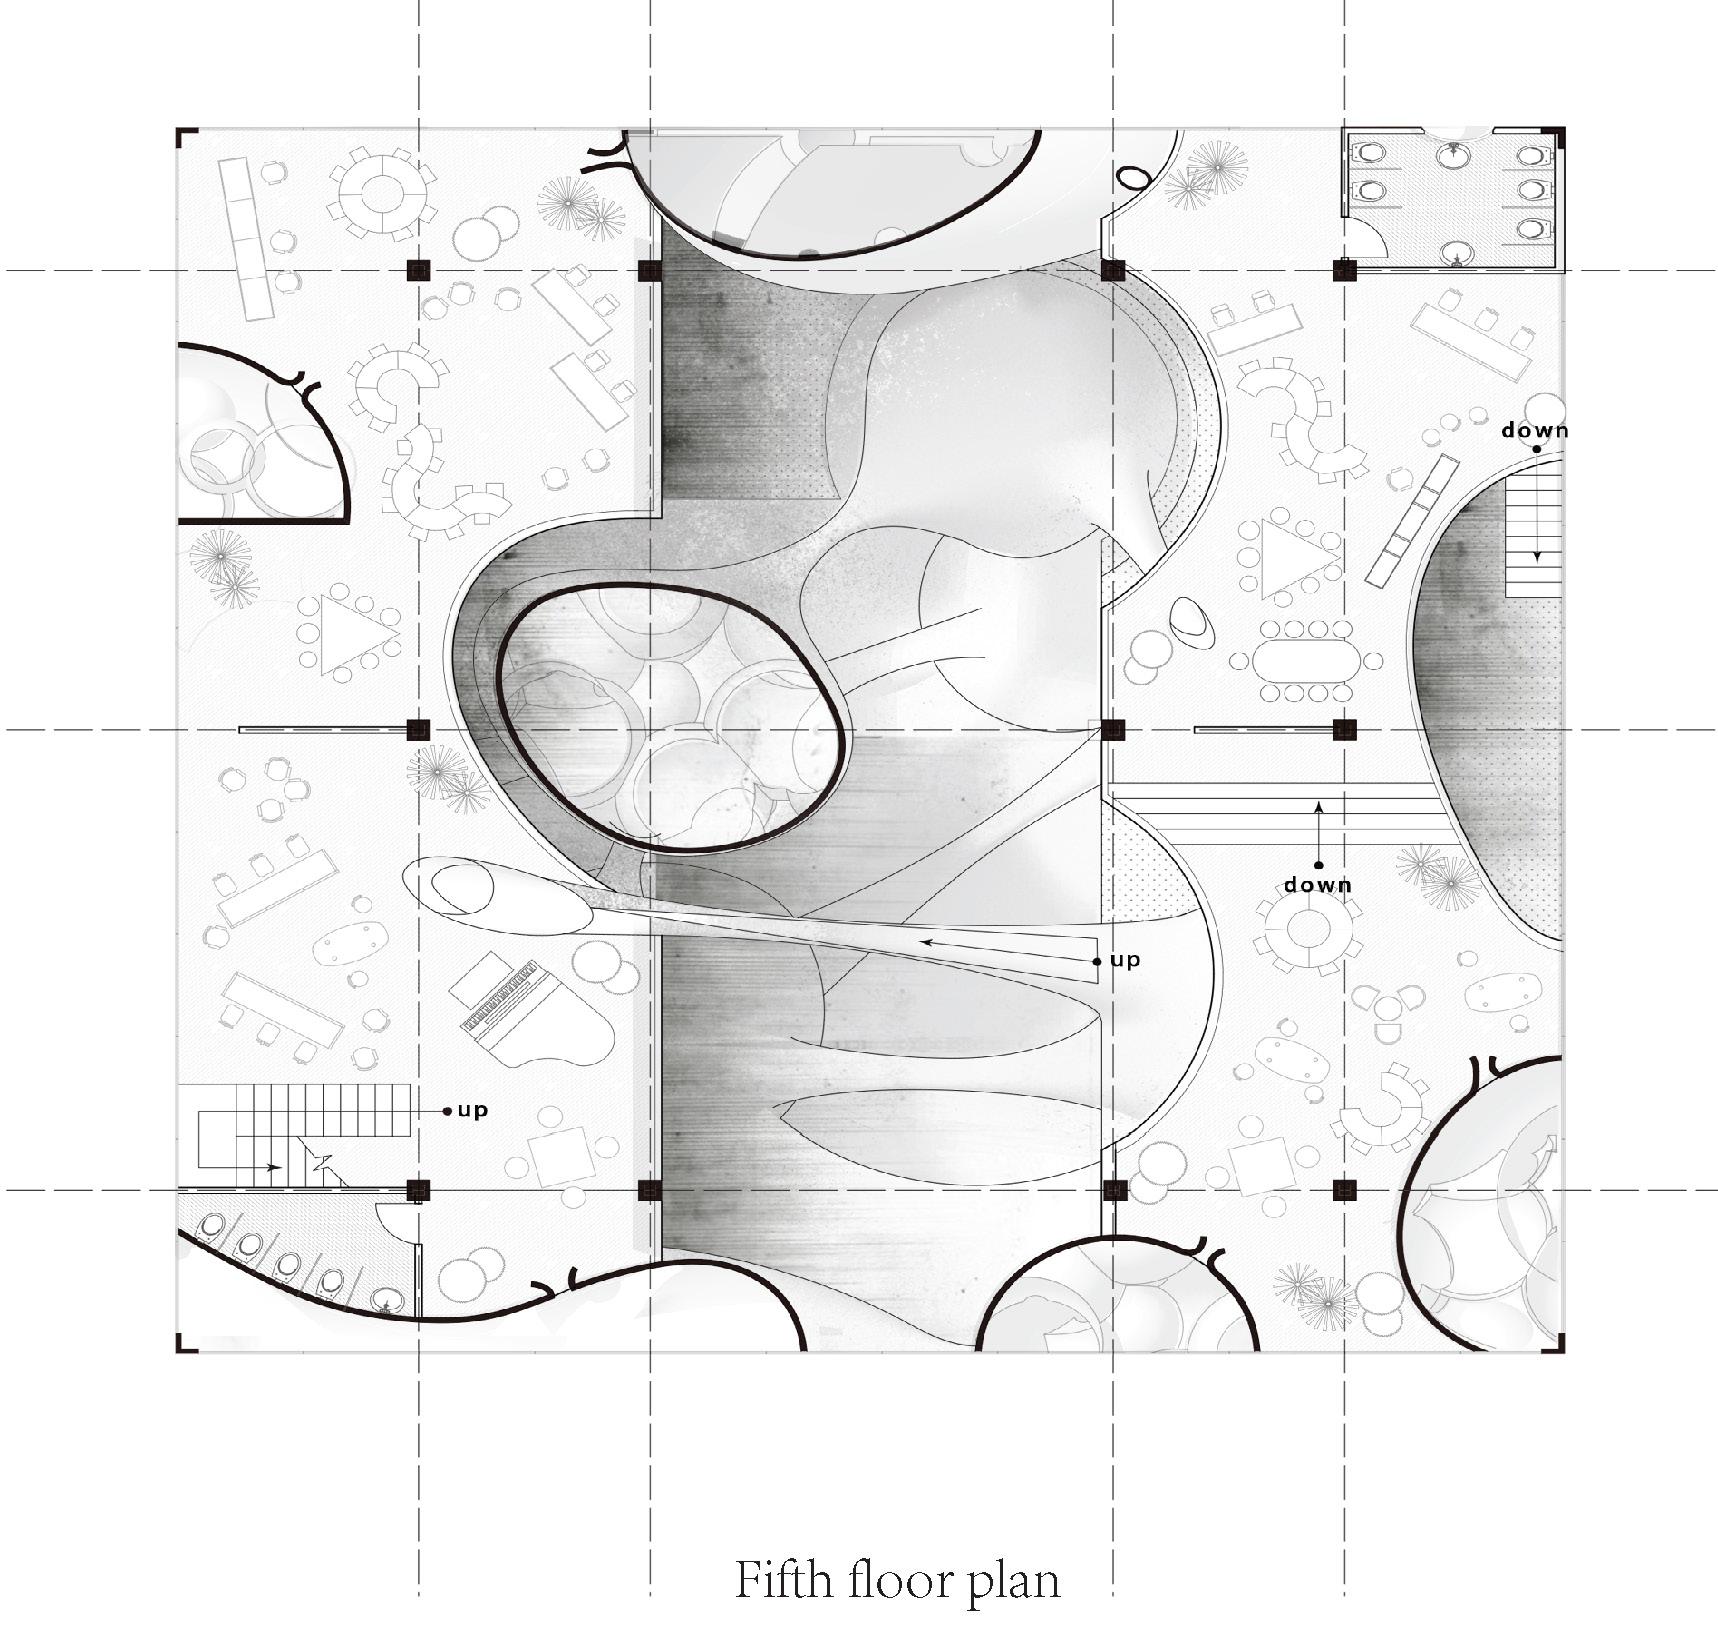
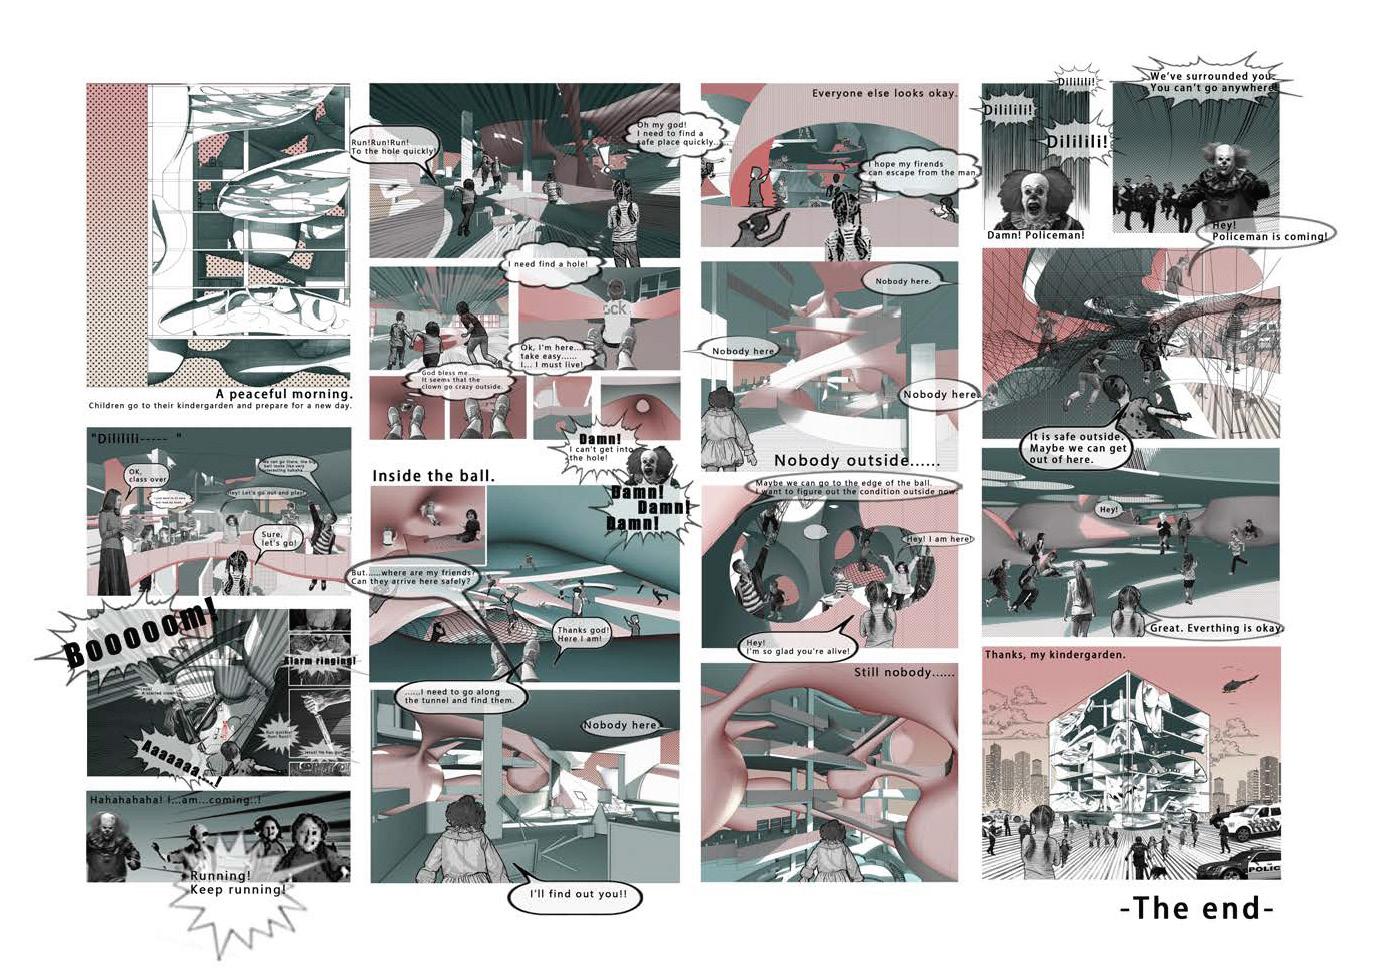
Sandy Hook shooting event lets people pay more attention to the Children protection. Comparing to teenagers who have more self-protection awareness, it is difficult for kids in kindergarten to protect themselves when they are in danger. Besides, children also face some increasing serious mentality problems. So, this project proposes a possible plan which can provide kids a useful protection in the school: when the danger is coming, channels around the building can let children exscape in a short time.These slide-like channels can take them into all kinds of irregular space which become a shelter for the moment. In normal times, as a relatively closed entertainment space, the irregular space can help children keep away from annoying reality and create a no teachers' pressure, completely free world.
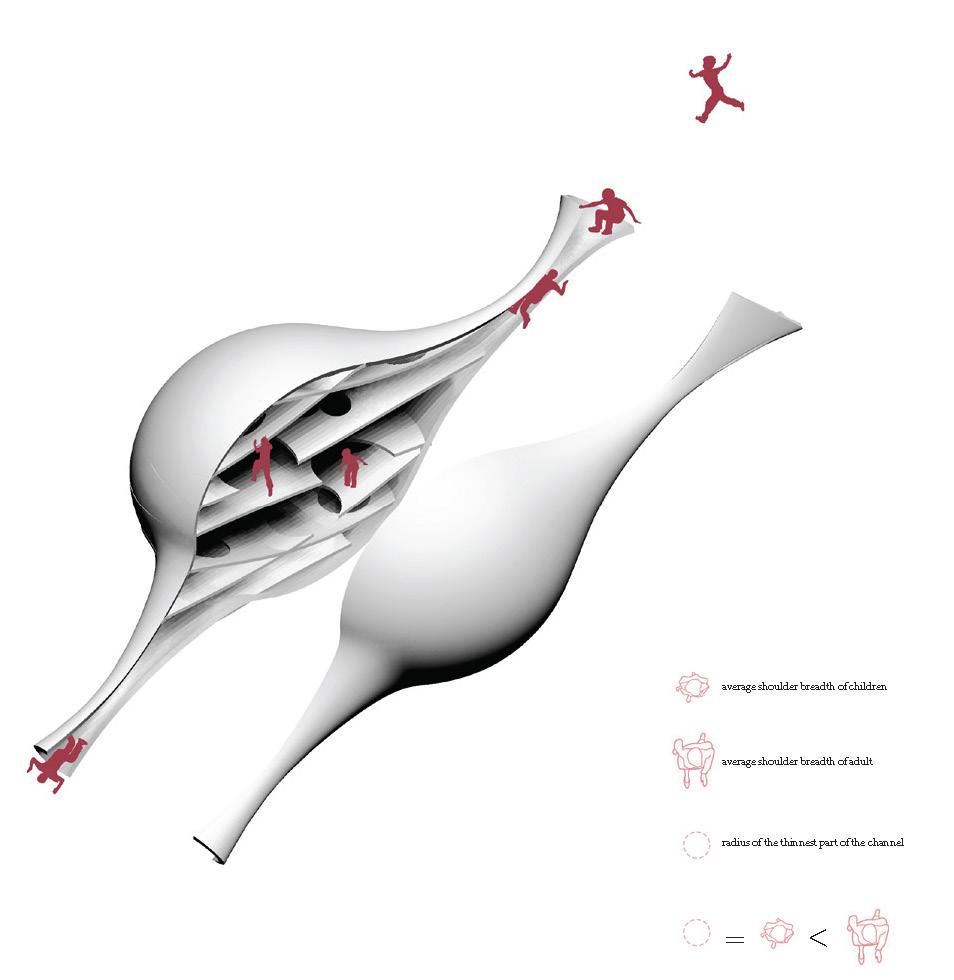
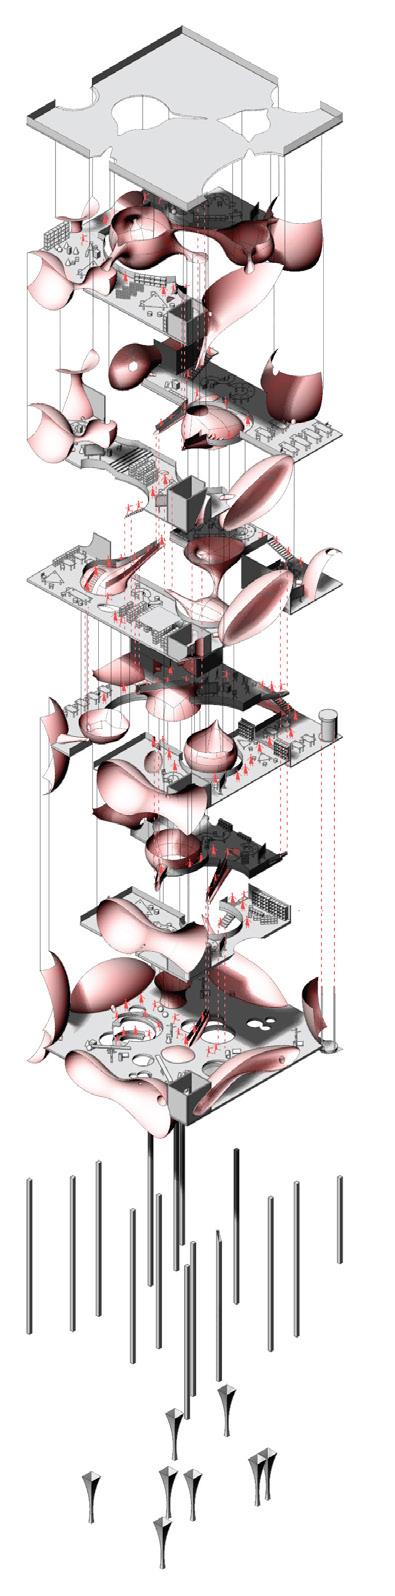
A specific irregular space: It shows that how to use the irregular space to escape.
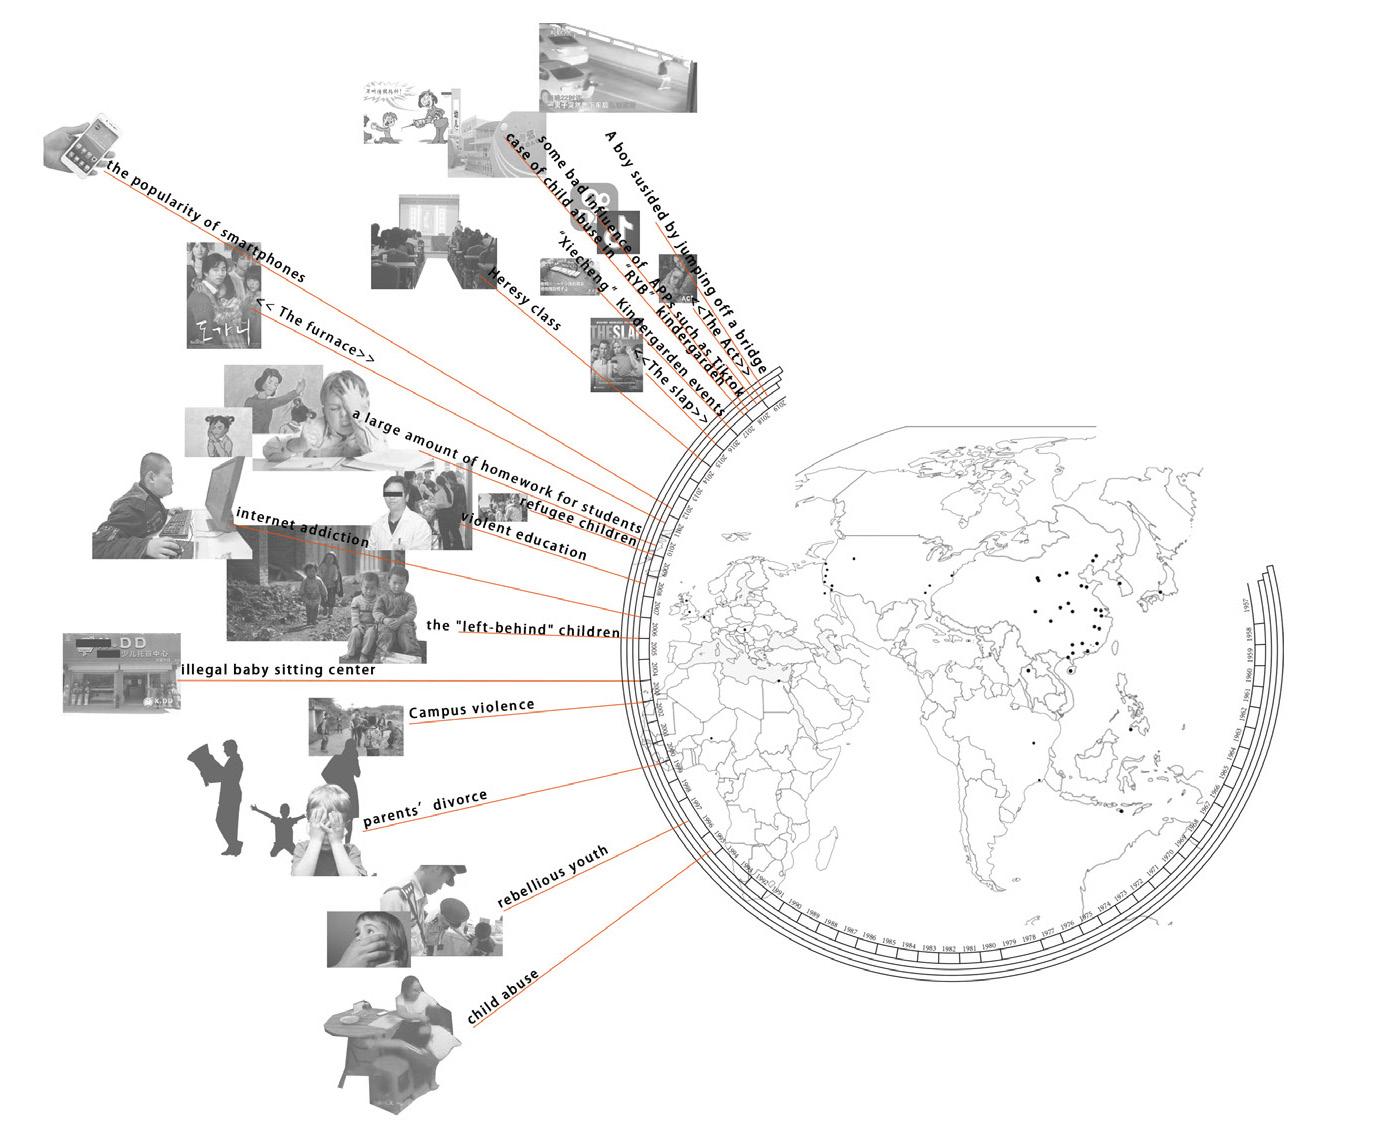
Other damage events for children (1995--2019.04 Incomplete statistics)
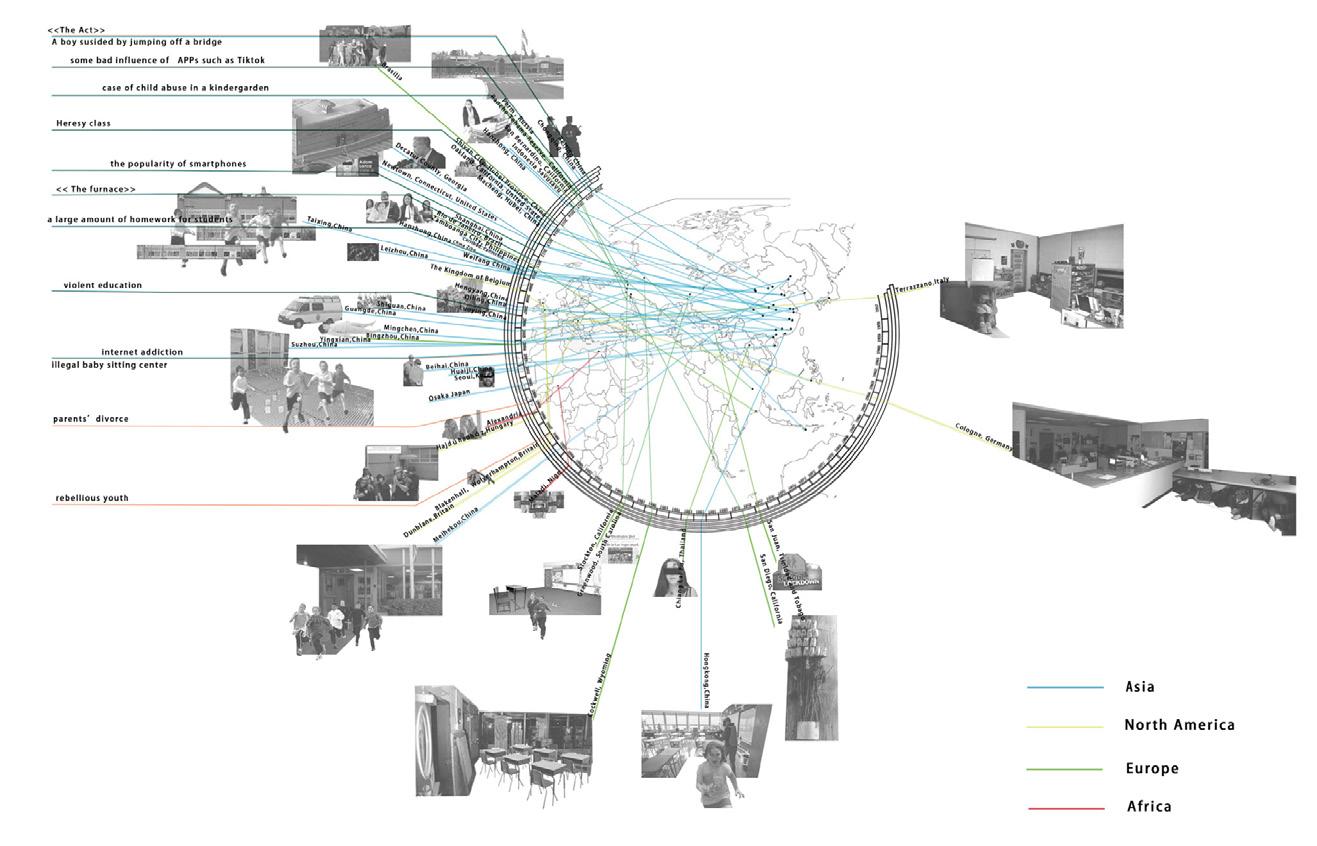
Primary school shooting events (1957--2019.04 Incomplete statistics)

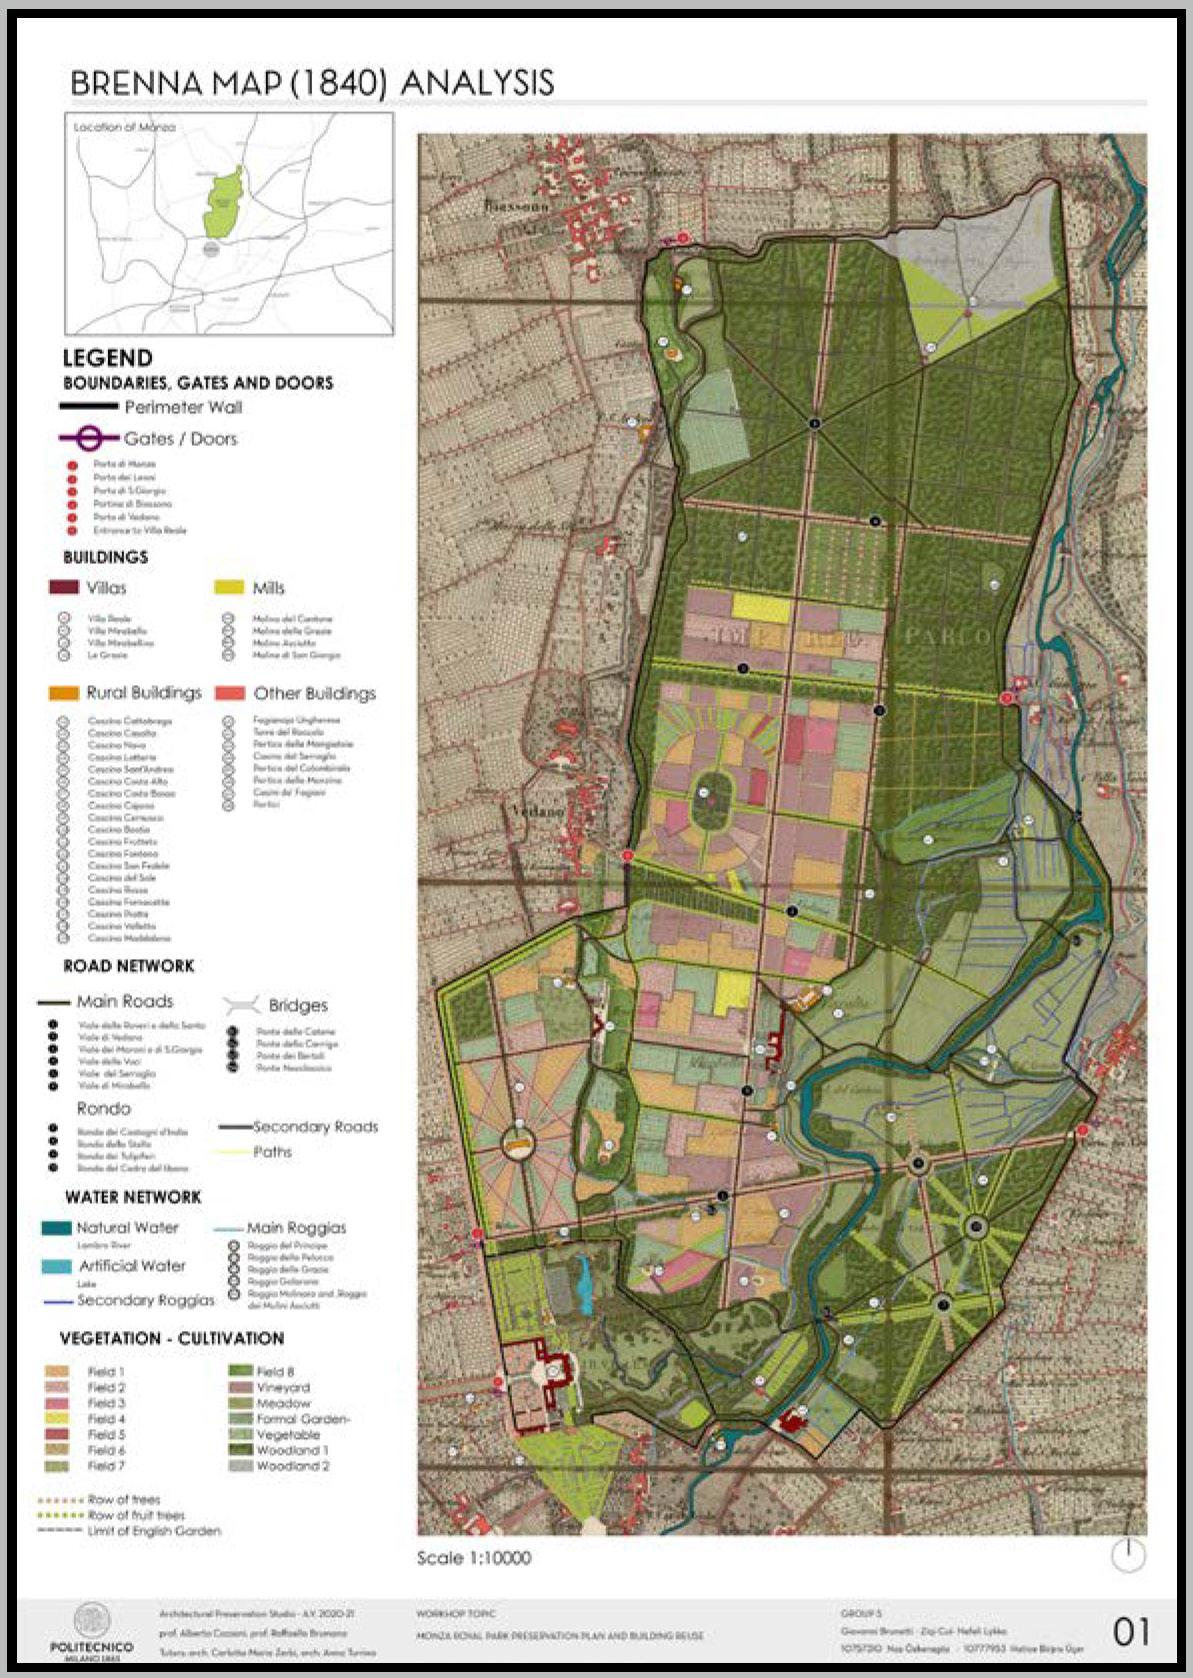
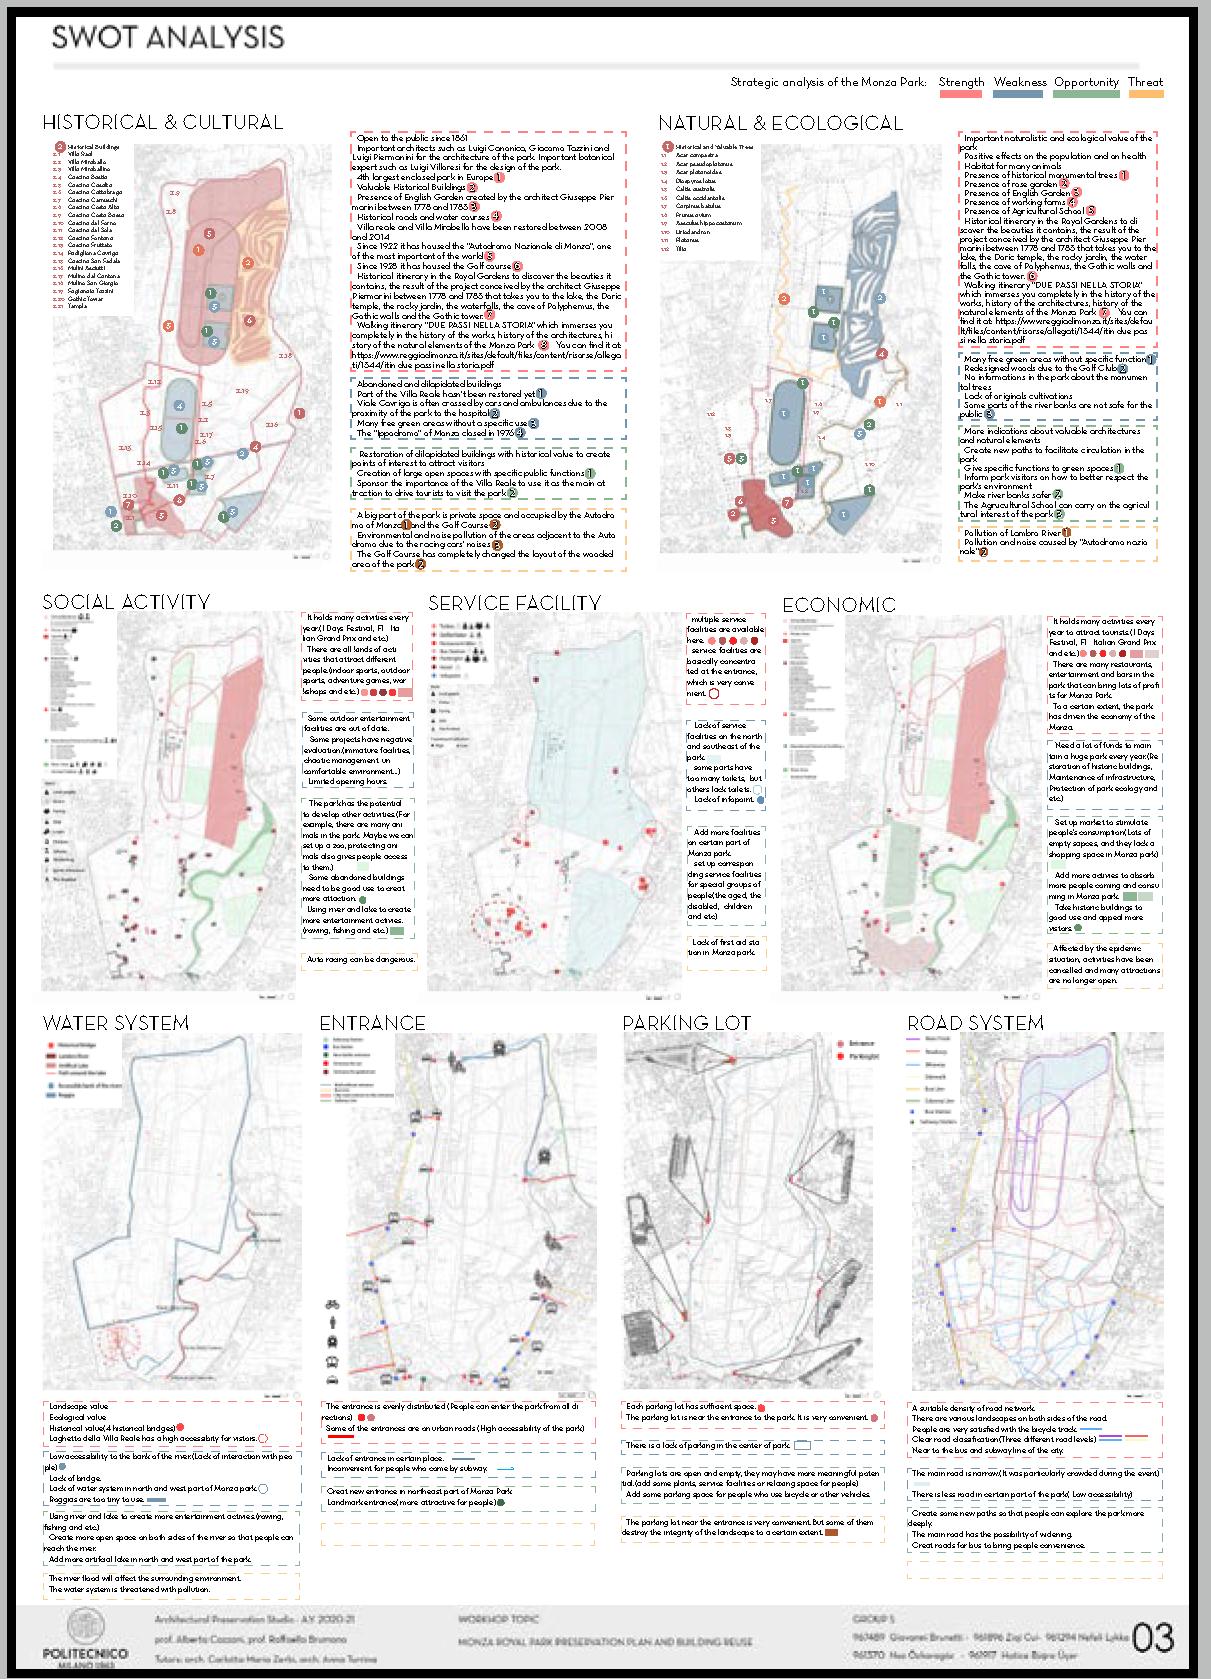
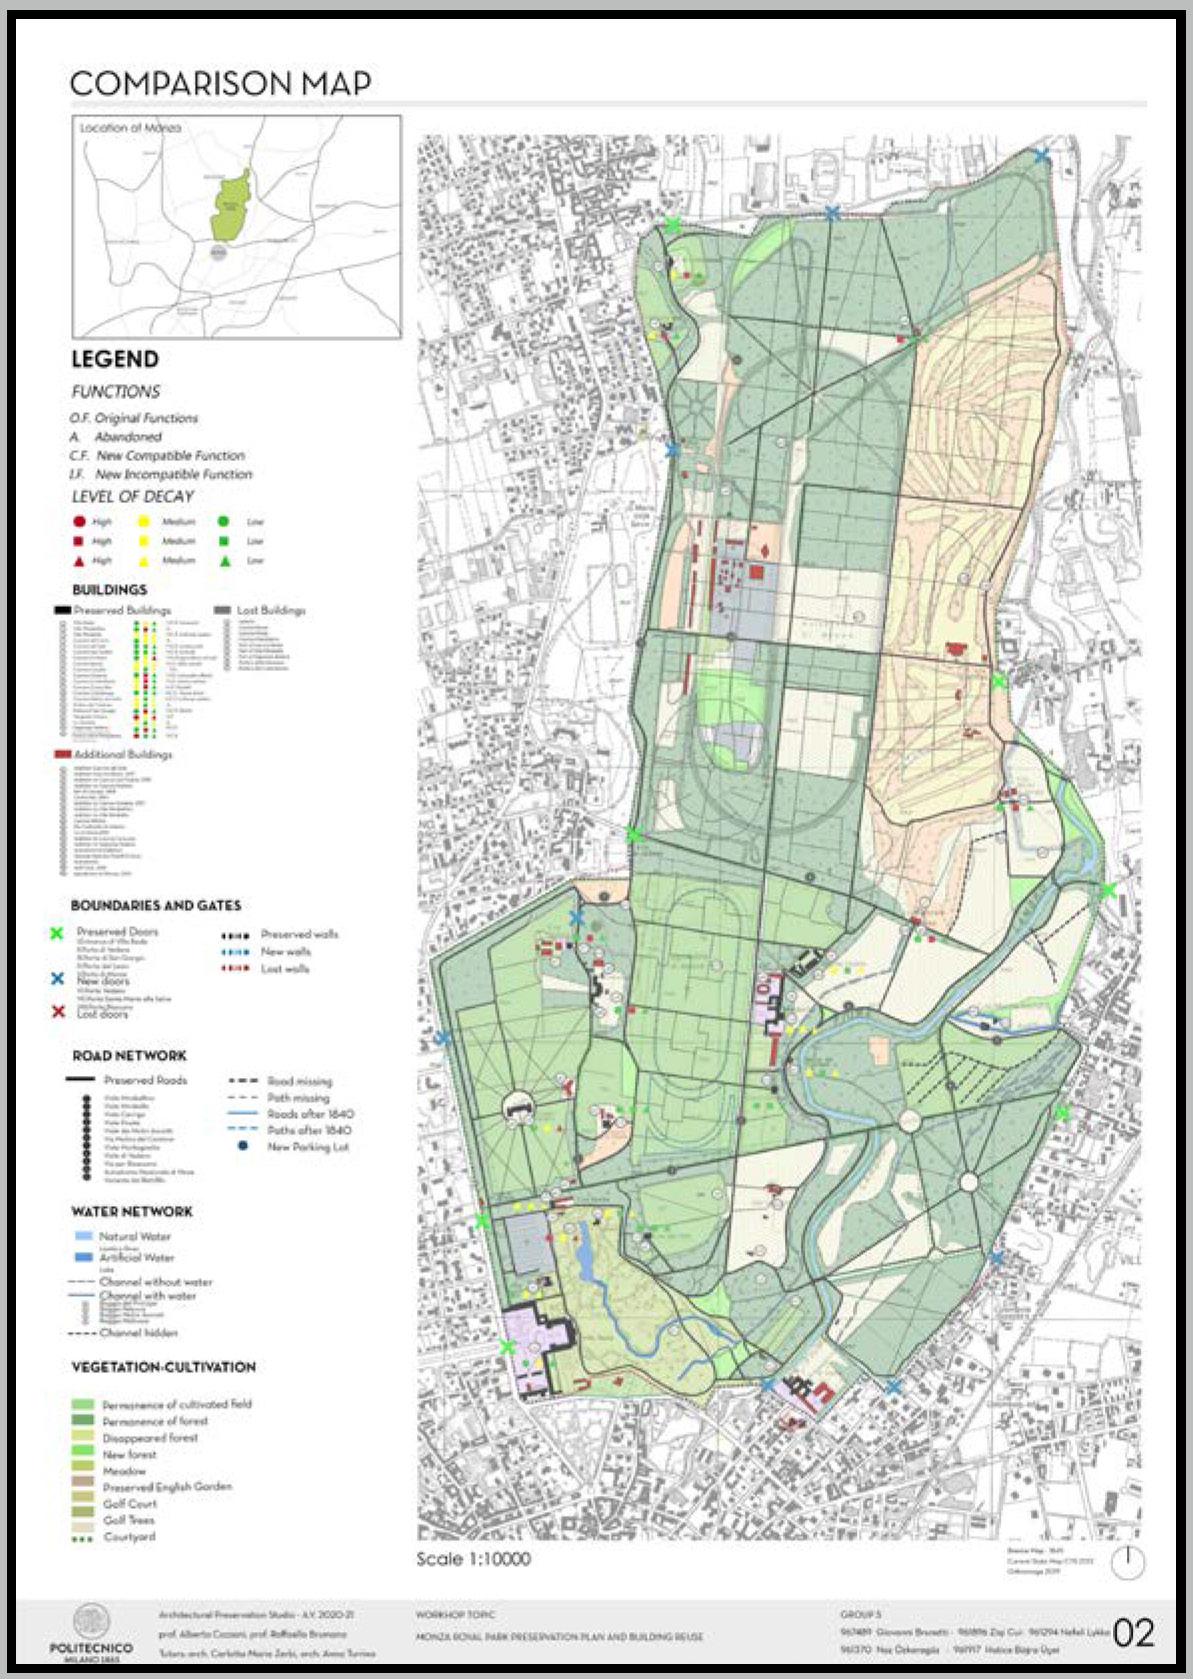
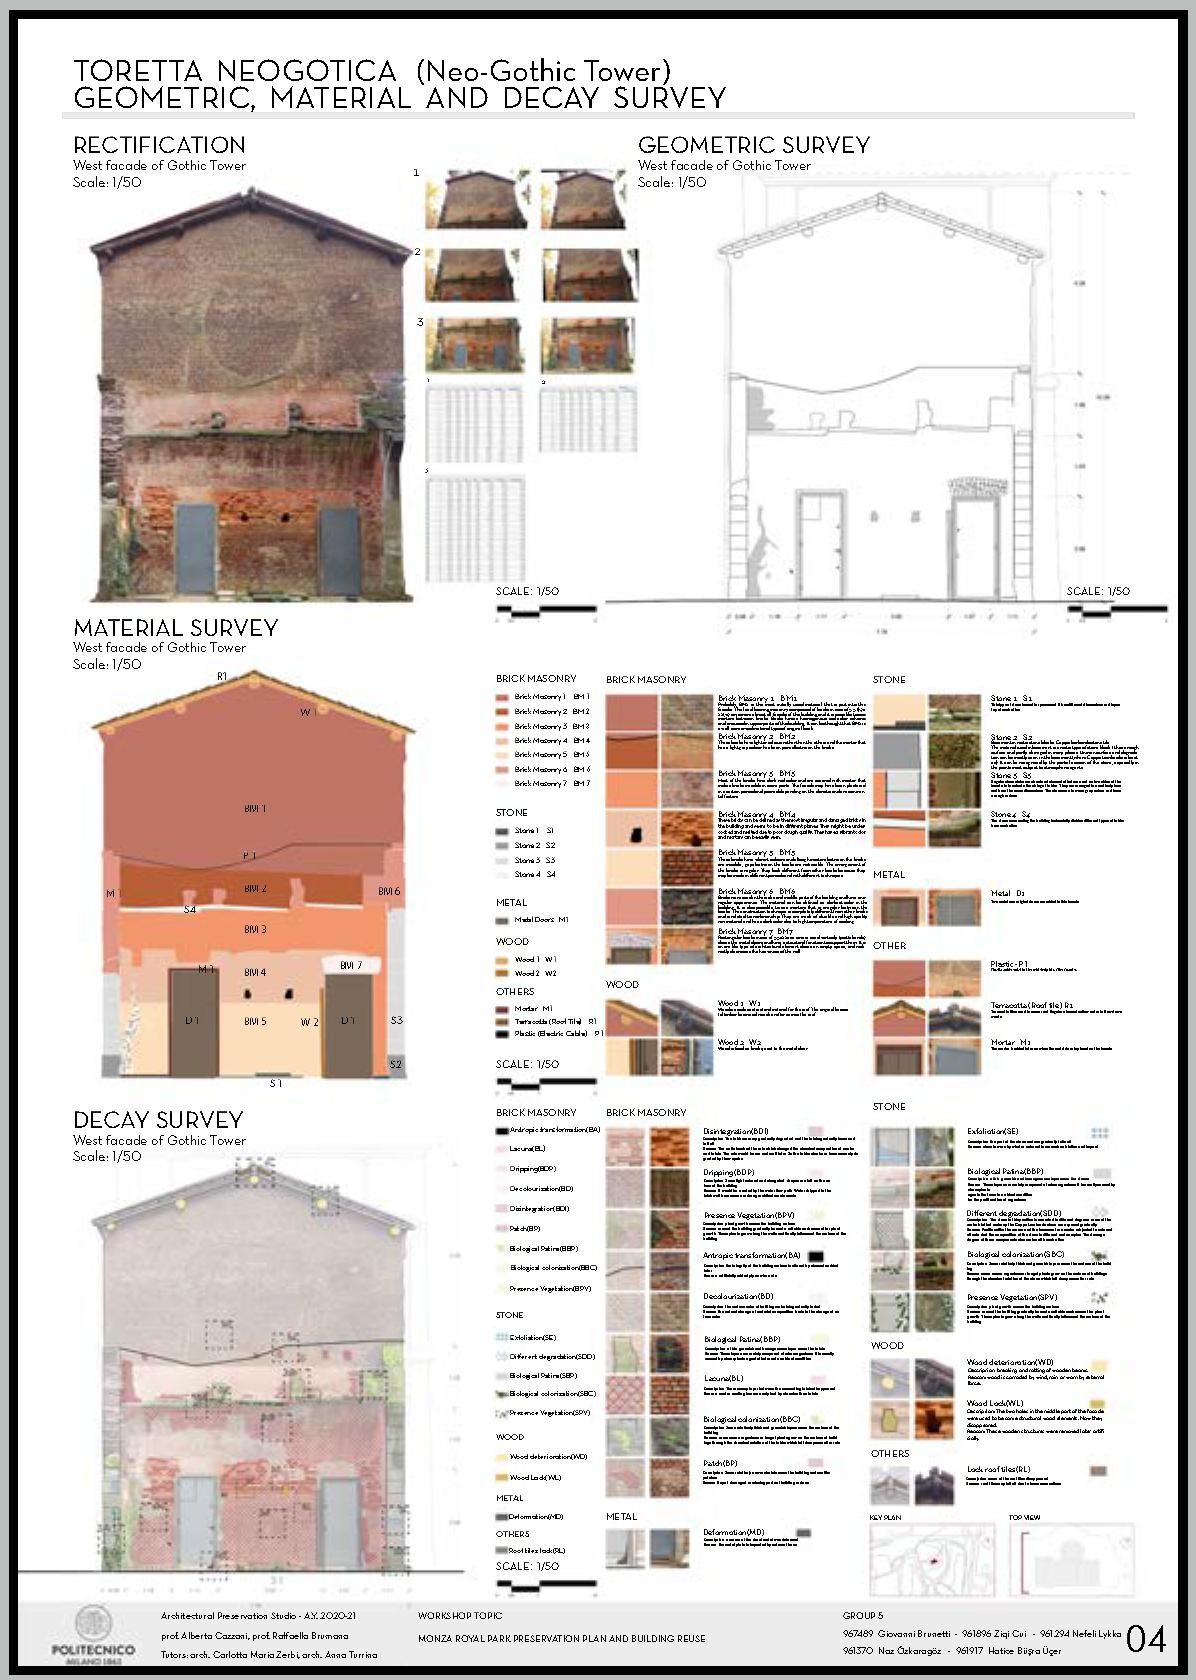
A preservation project of the royal park Monza Play with GH/ Blender/ UE5
Giovanni Brunetti, Zigi Cui, Nefeli Lykka Naz Ozkaragoz, Hatice Busra Ucer
2020 Fall Architecture Preservation Studio
Faculty: Prof.Alberta Cazzani, Prof.Raffaella Brumana