A.Executive Summary
From a survey of 16 Community Compost Hub participants performing a variety of functions (Volunteer, Lead/coordinator, Scrap Contributor)across4 locationsinthe City of Melbourne, we found that those people performing more engaged roles, with higher levels of agency and accountability reported feeling more improvements in their social and community experiences than their less engaged counterparts.
This was also the case with frequency of use; - the more people used the hub, the morelikelytheywereto reportimprovementsin their experience. This suggests that more interaction with this project was accompanied by greater feelings of community contribution and participation.
We also looked to a recent survey by Sustainability Victoria for comparison and found thatour respondents were more attuned to the impacts of climate change. This was reflected in higher levels of climate concern, higherlevels ofunderstanding of concepts like ‘circular economy’, more numerous reported climate-related health conditions and more extreme feelings about climate.


B. Background
To measure the social and community wellbeing outcomes of this project, we invited an estimated 100 people to complete a survey about their experience throughout the project (on themes of social inclusion, health, access to services and learning development, among others), as well as their feelings, knowledge and perceptionofclimate related issues.
Questions for social outcomes came from resources in the Centre for Social Impact’s “Community Services Outcome Tree” tool. These 19 questions asked respondents to reflect on a given area in their life (for example “Your ability to have a say in community”) and report whether they’ve felt this improved, got worse,orstayedthesamewhilethey were participatinginthe program. Respondents werealso ableto chooseifaquestionwas nota relevantquestionto them. It’s worth noting that all respondents chose either “improvement”, “unchanged” or “not relevant” - with none citing a decline in experience.
Our 8 questions relatingto climate perceptions and feelings came from Sustainability Victoria’s “State of Sustainability Report 2023” and measured foremotional reactions to climate issues, understanding of related concepts and experience/anxiety about adverse effects on life circumstances or climate-related health conditions.
C.Responses:
Wereceived16 responses (a16%response rate based on the pool of approximately 100 participants).Theprojectwas delivered across four locations in the City of Melbourne;
● Domain Park Apartments (5 respondents)
● Kathleen Syme Library and Community Centre (5 respondents)
● Kangan Institute (3 respondents)
● University of Melbourne Community Garden (3 respondents)
For the purposes of this survey, participants at these sites were broken into 3 core groups based on their type/level of participation; “Volunteer”, “Lead/coordinator”, and “I contributescraps only”.Theseproject roles were made up variously of staff, residents and students at the 4 sites.
This resulted in 3 Volunteers, 5 Lead/coordinators, and 8 Scrap only contributors (made up of 2 students, 7 staff members, and 7 residents at their respective locations).
D. Insights
Across all respondents, the below area’s rated the highest in terms of reported improved experience (all other responses were “unchanged” or “not relevant”):
F. Hypotheses
Goinginto thesurveywehad a number ofhypotheses to testagainstthedata. These are posed below as questions.
Question 1: Do the three main groups of; Volunteer, Lead/coordinator and Scrap
Contributor have differing experiences in social impact reported?
Findings: Based on the findings laidoutinDataTable 2 (below), it appears thatthe typeofcontribution to the project has a marked effect on the associated self-reported change (improvement) in experience.
In answering these 19 social impact questions, the responses from Volunteers andLead/coordinators wereof 70.2% and 67.4% improvement respectively,withahigherproportion of “a lot better” responses from Volunteers. This is as opposed to the 21.1%
improvement reported by participants solely contributing scraps. This suggests thatthe level ofengagement, competence and agency involved in the Volunteer and Lead/volunteer participation/duties correlates with greater feelings of satisfactionas reflectedinhighscores for questions aboutmeaning and purpose, as well as community connection and contribution.
Of course, the kinds of people attracted to or performing the Volunteer and Lead/coordinatorrolesaremorelikely to already have an interest in these kinds of projects and bring their own enthusiasm and knowledge. This is as opposed to the more ambient and (comparatively) passive role of contributing scraps only, which requires less engagement and may include a broader spread of demographics.
Baseline All respondents (16 people) 44.8%sawan improvement(23.7%“alot better”, 21.1% “a little better”), with 28.3% of respondents feeling their experience hadn’t changed, and 27% finding the questions not relevant.
Volunteers (3 respondents)
Leads & coordinators (5 respondents)
Contributors of scraps (8 respondents)
70.2%sawan improvement(47.4%“alot better”, 22.8% “a little better”), with 21.1% of respondents feeling their experience hadn’t changed, and 8.8% finding the questions not relevant.
67.4%sawan improvement(31.6%“alot better”, 35.8% “a little better”), with 23.2% of respondents feeling their experience hadn’t changed, and 9.5% finding the questions not relevant
21.1%sawan improvement(9.9% “a lot better”, 11.2% “a little better”), with 34.2% of respondents feeling their experience hadn’t changed, and 44.7% finding the questions not relevant.
Sense of meaning and purpose
Setting and pursuing of goals,
Your leadership, contribution and advocacy
Feeling of being valued and belonging,
Your ability to have a say in community
Setting and pursuing of goals
Social connections and relationships
Feeling of being valued and belonging
Your ability to have a say in community
Participation and engagement in education/training.
Sense of meaning and purpose
Capacity to have a say in services
Social connections and relationships
Question 2: Does the emotional, and health experiences in our cohort differ from Sustainability Victoria’s State of Sustainability report respondents?
Findings: It appears that our cohortexperiences and perceives climate relatedissues moreacutelythanthe more general population segment of Victorians surveyed by Sustainability Victoria in 2023. This is reflected in higher reported climateconcern,morenumerous reported climate-related health conditions and more extreme feelings about climate.
In their “State of Sustainability Report 2023” (p13) SV shows that 51% of respondents reportthemselves orafamily member having had a health condition linked to climate change. For the same question62.5% our respondents reported them or a family member having climatelinked health issues.
In thesamereport,SV cites 72%of surveyed Victorians being concerned about climate. In our cohort of respondents that figure was at 93.75% (62.5% “Very concerned”, 31.25% “Fairly concerned”).
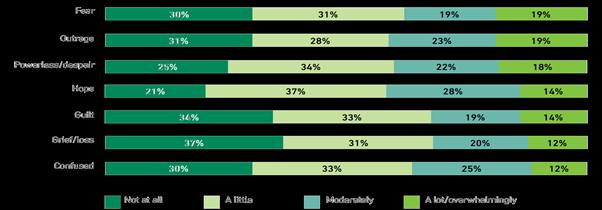
Respondents were asked to rate theirlevel ofemotioninrelationto climate change (across Fear,Outrage,Powerless/ Despair, Hope, Guilt, Grief / loss, and Confusion). SV’s respondents (see Table 4) all tended towards concern (feeling), but for each emotion a higher proportion selected“Notatall”thananyofourcohort (see Table 3). For example, 34% of SV’s cohort reported not feeling guilt “at all”, whereas 13% of our cohort felt no guilt. Our cohortseemedto experience most of these emotions in a more extreme fashion, for example 88% of our respondents reported Moderate-toOverwhelming Outrage, while SV’s cohort figure was less than half that (42%).
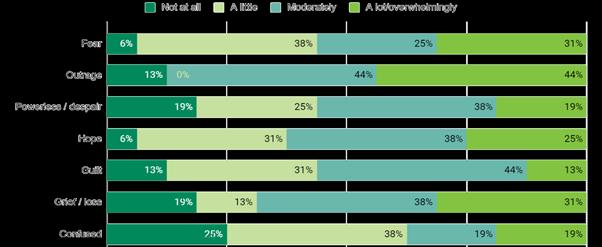
Table 4. Sustainability Victoria Respondents (courtesy of Sustainability Victoria)
Question: Does “circular economy” understanding differ between our cohort and Sustainability Victoria’s State of Sustainability Report respondents?
Findings: In their report SV says “The term ‘circular economy’ is not well understoodbyhouseholders, withovertwothirds havingneverheardofthe term or not really understanding what it means.” (p7). Forourrespondents,theinverseseems to be true (see Table 5), with “Not sure” or “never heard of” accounting for 37.5%, and “Know of” or “understand” making up the remaining 62.5%.
Question 3: Does compost deposit frequency make any difference in the social impact experiences reported and climate-related health conditions?
Findings: Increased deposit frequency appears to correlate with self-reported improvements insocial impactexperience across the 19 social impact questions. Highest frequency is associated with the highest reported improvement (63.2% improvement), and the two deposit frequency options covering monthly (or less frequent) visits shared the lowest improvement rates (both 36.8% improvement) (See Table 6)
Deposit Frequency Experience Breakdown
Multiple times a week
63.2% sawan improvement(31.6%“a lotbetter”,31.6%“a littlebetter”), with26.3% ofrespondents feelingtheirexperiencehadn’tchanged, and 10.5% finding the questions not relevant.
Once a week: 46.3% sawan improvement(24.2%“a lotbetter”,22.1%“a littlebetter”), with10.5% ofrespondents feelingtheirexperiencehadn’tchanged, and 43.2% finding the questions not relevant.
A few times a month:
36.8% sawan improvement(14.9%“a lotbetter”,21.9%“a littlebetter”), with53.5% ofrespondents feelingtheirexperiencehadn’tchanged, and 9.6% finding the questions not relevant.
Less than monthly: 36.8% saw an improvement (36.8% “a lot better”, 0% “a little better”), with 0% of respondents feeling their experience hadn’t changed, and 63.2% finding the questions not relevant.
In answering the multi-option question “Which, if any, of the following climate change impacts do you think will most impact yourself and your family?” respondents reporting a deposit at least weekly(50%)reportedthinkinganaverage of6.37 climateimpacts wouldaffectthem and theirfamily. Less thanweekly deposits (the other 50%) reported that thinking an average of 9.25 climate impacts would affect them.
Responses to the question "Have you or any of your family been directly affected by any of the following over the
past few years (or currently)?” suggested roughlyequal distribution (the two groups experienced an average of 1.5 and 1.4 health conditions respectively).
Reported interest in “the types of health conditions we need to be prepared forand howtoprotect ourselvesandfamily against these as climate change impacts increase”, and“...actions you can take that will benefit your health, and reduce your impact on climate change at the same time” was marginally lower in the less frequent deposits.
Question 4: Does deposit volume make any difference in social impact experiences reported and climate-related health conditions?
Findings:Splittingtherespondents into 2 groups - those who reported depositing less than or up to 500ml each visit (43.8% of participants) and those who reporteddepositingmore than 500ml (up to 5L) - (56.3% of participants), we found no trend in reported social impact outcomes (43.9% and 45.8% improved respectively)
Bothgroups reportedanaverage of 1.4 climate-related conditions for themselves or family.
Question 5: Does respondent origin make any difference in social impact experiences reported and climate-related health conditions? As opposed to contribution type.
Findings: Across the 19 social impact questions, the proportion of responses citing an improvement in experience varied across locations (see Table 7),sometimes byalmost29%points, however, through analysis of each location composition of roles - the differences in experiences are more directlytiedto the participationtype rather than their location (the Domain Park Apartments for example, come in below baseline because the cohort was composed of proportionally more “scrap contributors” - the lowest engaged group showing the lowest self reported improvements).
As outlined in row Table 2.
Concern about adverse climate impact and experience of climate-related health conditions did not seem affected by participation role or location of origin. There were marginally fewerclimate-relatedhealthconditions reportedbyVolunteers (an average of 0.6 per Volunteer versus, 1.37 per Scrap Contributor and 2 per Lead/coordinator) but these subcohort sizes are too small to treat as significant indicators alone.