Confidential to the recipient. Not for distribution
ISSN: 2703 5565
Input to your Strategy for Adapting to Challenges
Distribution beyond the direct email recipient is not permitted and this publication may not be loaded on any website or social media platform
Labour shortages
The outlook for growth in the New Zealand economy is challenging for a variety of reasons listed here a few weeks ago. Factors in play include the following.

• Supply chain disruptions which are likely to continue because of China’s failure to vaccinate its population against Covid 19.
• A very weak growth outlook for China’s economy as a result of drought, the substantial fall in property prices and construction, deteriorating trade relations with the United States, decreasing orders for goods fromothereconomiesas they weaken, and the shutdowns of cities, factories, ports etc. to fight Covid 19.
• A weak growth outlook and potential recession for the US economy as the Fed. fights inflation.
• Probable recessions in the UK and European Union due to tight monetary policies and soaring energy prices caused by Russia’s invasion of Ukraine.
• A retreat from record low interest rates here as our central bank fights against inflation.

• Retailers being hit by the ending of a two and a half year consumer spending binge on items like spas, kayaks, home renovations etc.
• Diversion of spending towards travel overseas.
• Falling housing paper wealth with average prices now 12% down from their peak and still falling.
• Falling house construction as the myriad of problems hitting the sector cause buyers to back off and switch back to looking at listings of existing dwellings.
• A 7.3% hike in the cost of living for the average Kiwi household over the past year.
• Reduced availability of credit to consumers.
• Net negative migration flows which are likely to continue through 2023 and 2024 following a net loss of over 12,000 people in the past year.
22 September 2022
email
Subscribe at http://tonyalexander.nz/test.php
But last week Statistics New Zealand confirmed that we did not slip into recession in the first half of this year with growth of 1.7% during the June quarter. As noted here previously, we are unlikely to go into recession because of the many factors which will support growth (at a below average pace) in the next couple of years.
Five key things in particular make this period of economic challenge less worrying than those in the past.
• The NZ dollar is down ten cents from a year ago and has not been at over valued levels for a great number of years. This is very positive for our export sector.
• Our commodity export prices are almost 20% higher than at the end of 2019 (before factoring in the lower NZ dollar), and our terms of trade (export versus import prices) are near a record high. There is a food price and quantity crisis offshore and we are a food exporter.
• Recessions offshore will constrain visitor flows here but the numbers will be far greater thissummer than lastsummer becauseof the reopening of the borders.

• The same goes for foreign students studying here with a potentially strongly positive impact on inner city Auckland through 2023.
• Cyclical weakness in the labour market will be constrained by the structural tightening of labour availability. This delivers high job security and an unwillingness if not outright inability of businesses to engage in the normal round of redundancies associated with periods of economic weakness.
It is the state of the labour market and the implications for businesses goingforward which is now likely to receive renewed focus because talk
of recession and potential freeing up of staff by other businesses is now moving off the table.

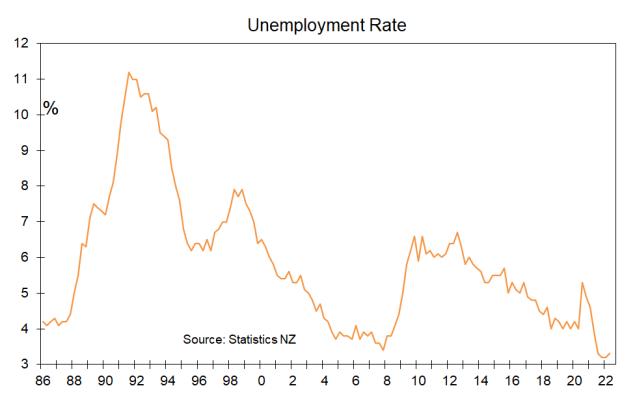
The tightness of our labour market is easily visible in a range of indicators. The unemployment rate is 3.3% and apart from the 3.2% of the March quarter this is the lowestrate sincerecordsstarted in 1986.
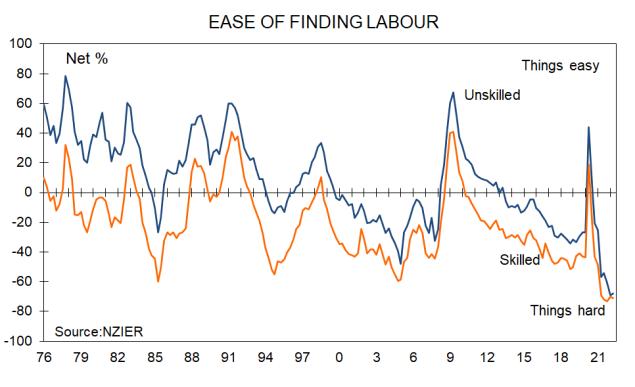
In the NZIER’s long running Quarterly Survey of Business Opinion a net 71% of businesses have reported that they are finding it difficult to get skilled staff. For the past year it has been more difficult to get such people than at any other time on record. The same goes for sourcing unskilled people, with both measures shown in the following graph.
Confidential to the email recipient Page | 2
If you looked only at the above graph you might say that the labour market tightness is largely a cyclical thing. But the graph of the unemployment rate tells us something different. If it were not for the shock of the recession our central bank caused in 2008 by tightening monetary policy too slowly from 2004, plus the doubling of that recession’s length caused by the Global Financial Crisis from late in the year, our labour market tightness would have been an ongoing cause of business difficulties from 2004.
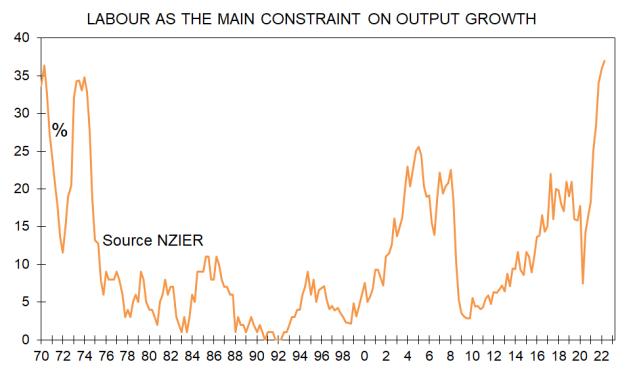
The GFC etc. interrupted the locking in of a permanent reduction in labour availability, and the locking in was further delayed from 2015 19 when net migration inflows soared as the number of working visas being issued climbed substantially.
Now, even with the severely negative impact of a global pandemic, lockdowns, and our borders being closed for two years, staff availability is poor. In fact, a record 37% of businesses responding in the NZIER’s survey say that lack of labour is the main reason they cannot raise their output.
run your operations and plan for the future with this paradigm shift.
When staff were readily available in New Zealand you could focus on acquiring more customers. Then, with orders secured you could hire more people, secure bigger premises, maybe get extra bank finance, and easily acquire more material inputs. That is no longer the case and if you run your business that wayyou risk failing to complete orders because of a lack of staff or one of the other increasingly constrained inputs.

You might hire lowly skilled and minimally motivated people to complete the contracted work then lose all your profits through having to redo
Thesework.
days you need to first of all estimate what resources will be available to you over the next five years or so. When you have worked out how quickly you can grow staff numbers, retain staff, train people up, etc you can then move to calculating what rate of growth in output you may be able to achieve if demand is good enough.
For some businesses the answer will be that growth can be achieved. But before you leap into accepting more orders you need to step back and ask how you have been coping with staff shortages so far.
Are you already working 80 hours a week in your business? When did you last get a holiday? How often are you spending time with family or pursuing your desired recreational activities?
I’d like to repeat the warning I have been giving to businesses since about 2005 regarding how to
For many businesses their level of output is already too high to allow one to enjoy the lifestyle sought when starting the business up in the first place.
Confidential to the email recipient Page | 3
So, what does one do if output needs to be cut?
Between 2005 and 2007 when I discussed this situation I focussed on the use of price as a means of rationing demand. I said raise your prices 10%. If the customers were still there after six months take prices up another 10%. Keep doing this until demand fell away to match input supply and lifestyle desires
The fact that this is such an easy option now for millions of businesses around the world facing more demand than they can service is why central banks are scared and pushing their interest rates up so quickly. They know that unless they can slashdemand many businesses will logically raise prices and the risk is that currently high inflation becomes entrenched as staff logically boost their wage demands to compensate for the higher cost of
Therefore,living.
tempting as it may be, if you want to avoid the Reserve Bank throwing our economy into a recession as deep as needed to control inflation, your incentive is to do something else.

Specifically, increase the proportionofyour output which achieves high profits. You do this by cutting out products you currently produce or services you currently deliver which yield little return. Kick them to the curb and devote your valuable scarce resources to your highest earning outputs.
An alternative way of doing this is to rank all your clients from highest return per unit of output to the lowest and inviting the low yielders to take their business elsewhere.

You might undertake this profitability ranking exercise in terms of the locations you operate in, the distribution systems you use, the production methods you employ.
The key is that you stop trying to be all things to all people. Focus on where you get your best returns and then because your revenue per unit of output will goupyoucanraise wages to retain and reward staff without having to jack your prices up sharply on the other side.
This adjustment process is a vital way of lifting productivity in the economy, output per person, remuneration, and our country’s overall standard of living. It may also stop you, a business owner, from having a nervous breakdown or whatever a stress overload is called these days.
Confidential to the email recipient Page | 4
Bank lending to investors
Each month in the survey I run of mortgage advisers I invite comments regarding bank lending policies and attitudes towards investors and first home buyers. Here are the comments submitted last week for investors.
• No changes, just difficult for investors
• No change really. Just a little harder with larger shaving off of rental income and higher servicing rates, but everyone is in the same boat. Generally investors have more means to purchase than others so still getting these across the line for the most part.
• No changes. Investors are mainly looking for brand new properties. Rental shortage is going to get worse for those at the bottom.
• Same as last month scaled rental income, build to be noted as pre or prior March 2020
• Only using50%of rental income (shading the rates, and then deducting rates and Ins) but xxx don't, creating inconsistency and different interpretation of the legislation.
• A lot more non bank activity as too hard at main bank
• Bigger focus on existing security value with house prices dropping.
• Rental income doesn't count for much.
• With the large discount applied to rental income, and LVRcaps, we find investors who "pass" the banks affordability calculator are generally not overly scrutinised further but passing at the outset is often the issue
• Not many investor applications these days because of the tax on rental income.
• Still a lack of uniformity when it comes to rental income and expenses relating to the rental income but that creates some opportunities for the third party distribution channel
• Lending restrictions still apply to rentals, 60% max LVR, rental income shaded by age of property
• No changes recently, just servicing with higher service rate.
• Highly sensitised rental income remains a challenge
• Just had xxx decline a deal 2 new builds on one title which will be subdivided same time as build. xxx stated they classify these clients as developers and need 40% deposit. Amended loan with xxx to 20% cash out and took 80% lending to another bank (had my pick of banks for this). Against the spirt of RB?
• Still applying some of the CCCFA tighter criteria
• Affordability is the biggest hurdle due to the tax changes I believe. The banks understand the numbers, probably more than investors themselves.
• Rental income continues to be scaled back heavily, mismatch of some lenders counting rates + insurance as an expense (on top of scaling back rental income) vs others who do not continues.
• 1 lender has slightly eased the shading on rental income. None of the banks are willing to go over 60% & the nonbanks often have a margin applied to investor loans.
• Double dipping on increased factoring of rental income with additional rates and insurance to be deducted
• Rationing rental income a lot
• Still nightmare with scaling and discounting rates, body corp and insurance after scaling.
• The same as it has been since the introduction of the CCCFA, although they are more prepared to look at mitigants.
What are property investors doing?
Here is a quick run through of data from my various surveys which give insight into the actions of residential property investors.
Survey of mortgage advisers
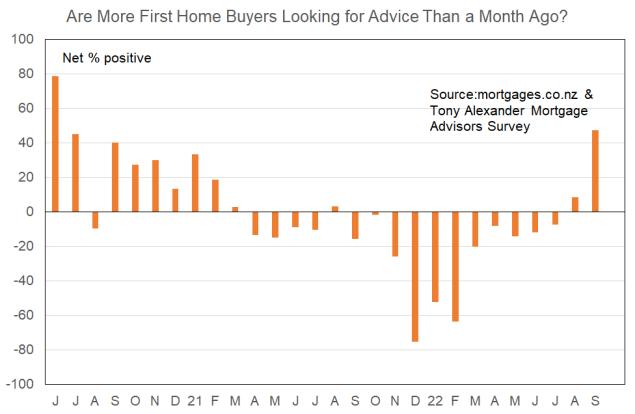
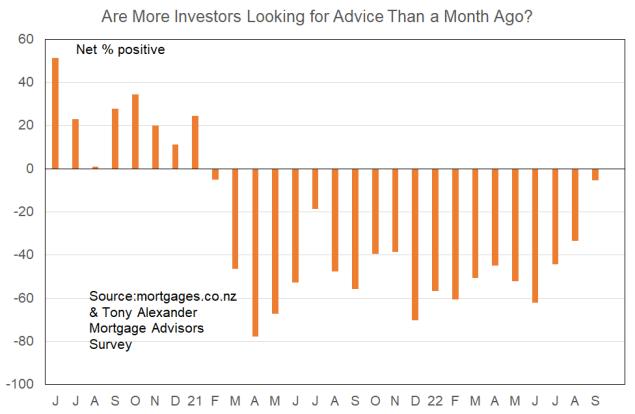
From the survey of mortgage advisers undertaken with mortgages.co.nz and released this week we see a net 5% saying that they are seeing fewer rather than more investors. But this was a sharp improvement from a net 33% seeing fewer investors last month and a net 62% three months ago.
Survey of real estate agents
From my most recent survey of real estate agents undertaken with REINZ at the end of August we see a net 34% saying that they are seeing fewer investors in the market. This was an improvement from a net 60% in July and 65%% three months ago. It is the least weak result since 33% in September last year and before that February
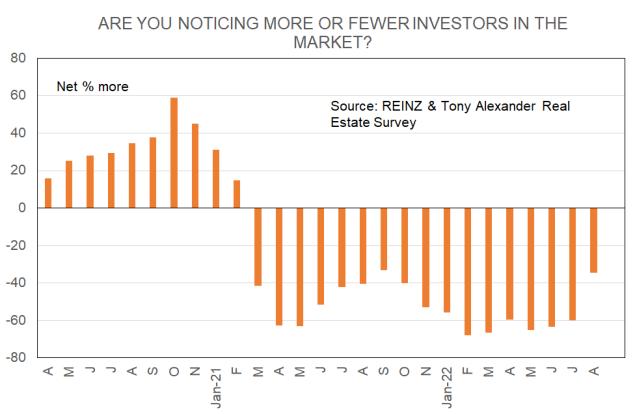
The latest result is the least weak in fact since 5% in February 2021 just before LVRs returned and then the announcement of tax changes affecting investors.
Note that this latest reading is still well removed from the net positive 47% of mortgage advisers who recently reported that they are seeing more first home buyers stepping forward.
is not as stark as that revealed by mortgage advisers. That likely reflects the three week gap between the surveys (advisers being just last week), and the fact investors are highly likely to want to get up to date on finance
The2021.turnaround
availability before they start actively looking for
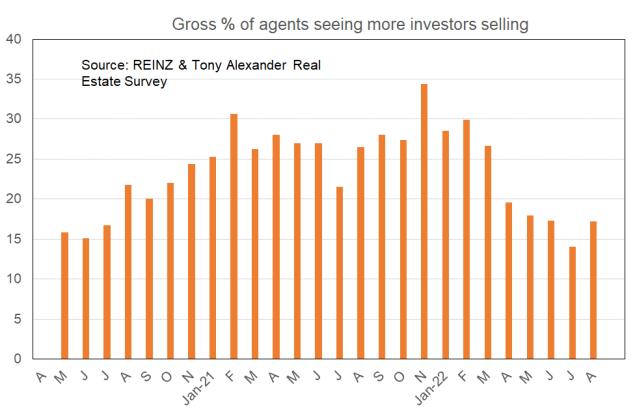
Fromproperty.the
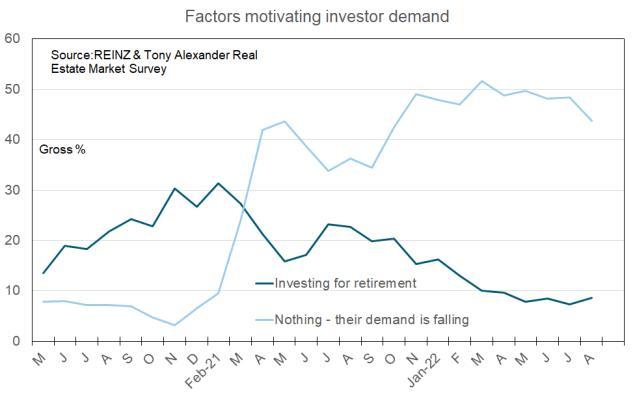
real estate agent survey we also gain insight into selling by investors. As noted this past year and a half, there is no evidence of a wave of selling following the tax change of March 2021. Thoughts of selling peaked in November last year and have been falling since apart from a blip up at the end of August. That blip looks entirely seasonal the onset of spring effect seen in 2020 and
Survey of portfolio investors
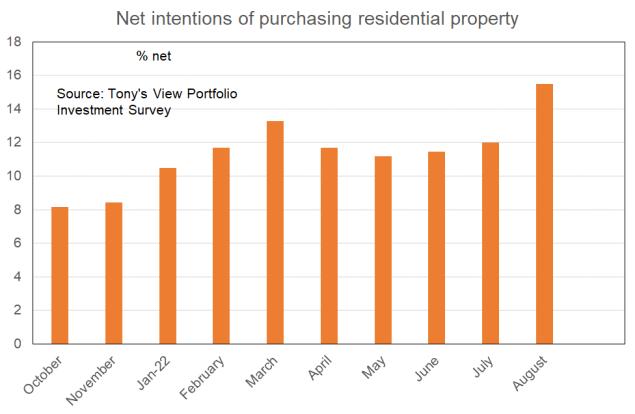
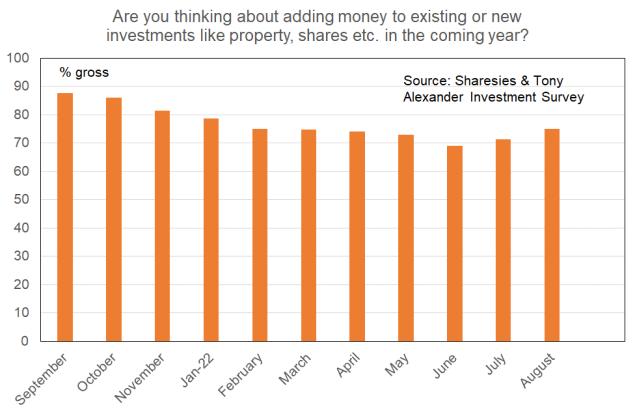
From my most recent monthly survey of portfolio investors undertaken with Sharesies four weeks ago we can construct a measure of net intentions of purchasing residential property. This rose to 15% last month from 12% in July and 11% in the previous two months.
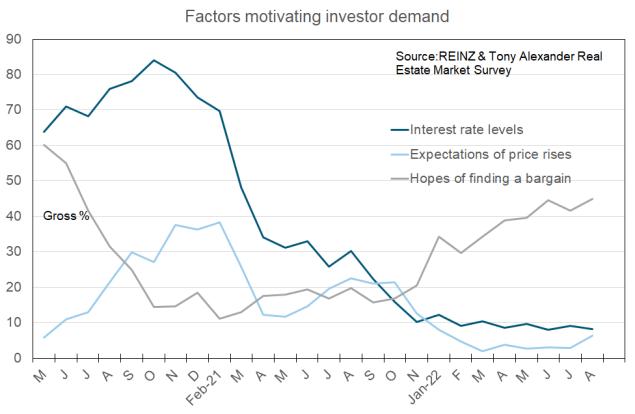
also other information regarding investors which can be extracted from my real estate agent survey. I ask agents what the main factors are currently motivating investors. The results are shown in the two following graphs. We can see as the grey line below that hopes of finding a bargain are trending up at a steady pace.. Expectations of price gain however have yet to sustainably lift the light blue line below. Interest rates (low) stopped being a motivator a long time ago.
I will have results from this month’s survey in hand soon. The preliminary numbers suggest that a further rise in property investment intentions has occurred this past month.
Survey of householders
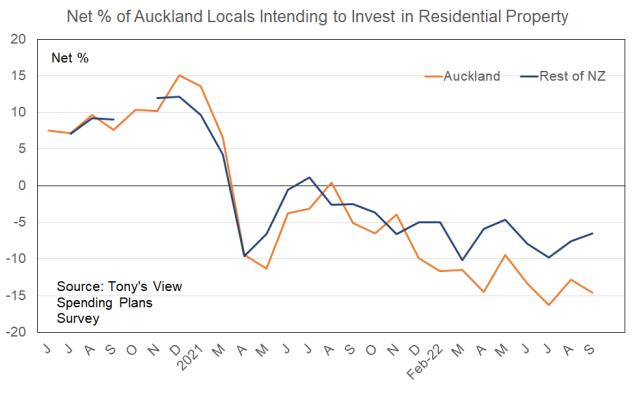
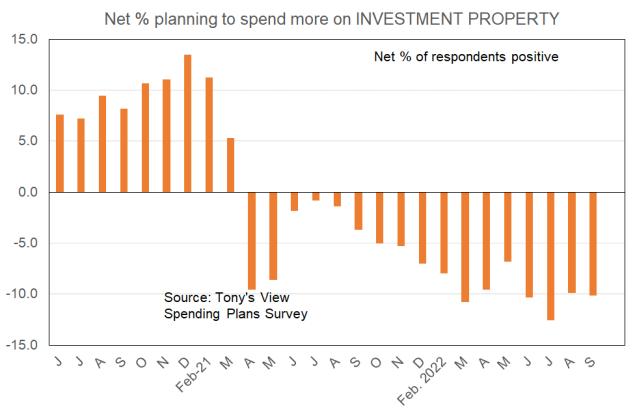
My monthly Spending Plans Survey released a week and a half ago showed no improvement in intentions of investing in residential property.
Confidential to the email recipient Page | 7
There2021.is
But note how this survey lags behind the others. It did not register a big decline into the negative until April 2021 as compared with March for the surveys of mortgage advisers and real estate
Noteagents.also
that Auckland is lagging behind the rest of the country when it comes to thoughts about investing in residential property. This may reflect the high visibility of increasing supply, the absence of foreign students, and a temporary shrinkage in population because of the pandemic.
It is not possible to call this development an upward trend yet. But the magnitude of the jump from August’s survey is interesting.
Survey of residential property investors
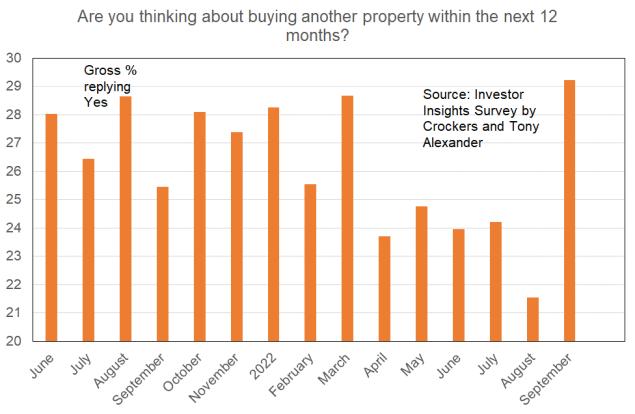
Finally, there is my monthly survey of existing residential property investors undertaken with Crockers Property Management. I am writing up results of the latest survey at the moment. The preliminary results show a lift in the proportion of investors thinking about buying a property to 29% from 22% last month and 24% three months ago. This result is the strongest since March.
Confidential to the email recipient Page | 8
Interest rates below average – sort of
The average one year fixed mortgage rate currently sits atabout 5.2%.Theaverage two year rate is around 5.4% and the three year rate is near 5.7%. 15 months ago these rates were respectively 2.2%, 2.6%, and 3.0%.
We can reasonably say that there is an interest rates shock running through the economy, brought on by our central bank belatedly shifting to fighting inflation rather than preventing any pandemic driven rise in the unemployment rate.
All attention is on the impact on the finances of those people who signed up for the low rates of 15 months ago and are now rolling into much higher borrowing costs.
There are four points worth noting which help explain why a housing and economic apocalypse is not underway despite interest rates rising more in 15 months than it took the same rates to rise less than 3% in four and a half years pre GFC.
First, no-one borrowing at record low rates last year was left in any illusion with regards to the ability of such borrowing costs to remain at record lows. It was logical to expect that ending of the pandemic would see monetary policy tightened and it was obvious a year ago that we were not in recession and a day of adjustment was looming.
Second, only one third of households have mortgages and the overwhelmingmajority of them have had their mortgages for many years during which principal debt levels have been reduced.
Third, banks required all borrowers to prove that they could service their mortgages with interest rates of around 6% 6.5% before they would advance them the money to make a purchase. A substantial cash flow buffer exists for virtually all borrowers and with the labour market so
extremely tight there will be very few people under employment and interest rate driven servicing
Fourth,stress.
the jump in borrowing costs from 15 months ago is large. But rates have only returned to about where they averaged in the decade leading into the extraordinary 0.75% easing of monetary policy in 2019.
The orange bars in the following graph show where fixed lending rates commonly sit at the moment. The red line shows averages from 2009 through to and including 2018.
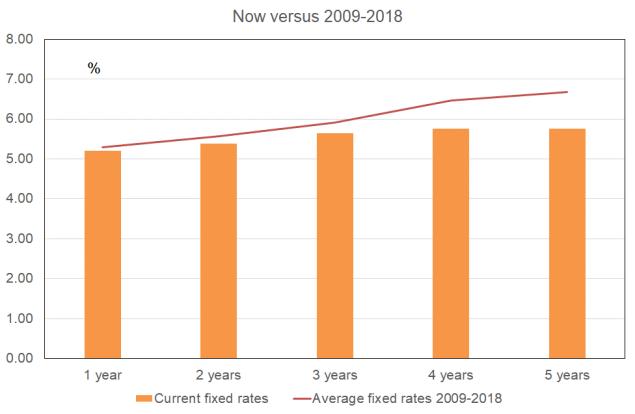
Rates are below the average levels before the extraordinary circumstances of 2019’s deflation worries and the 2020-2021 pandemic
Ofenvironment.courseother
things have changed which tell us current rates are having a greater restrictive impact than back then.
• House prices are higher so debts are as a proportion of income.
• Credit availability has tightened up.
Bedroom preferences
Tomorrow I will release results from my latest survey of property investors undertaken with Crockers Property Management. We usually get just over 300 responses and if you want to go on the survey list to give your thoughts every now and then just email me at tony@tonyalexander.nz
Some of the information gathered in the survey I don’t usually put into the monthly report because the results don’t change all that much or because the report would simply end up being too big. But here are a few extra insights which one or two people might find interestingin some way or not.
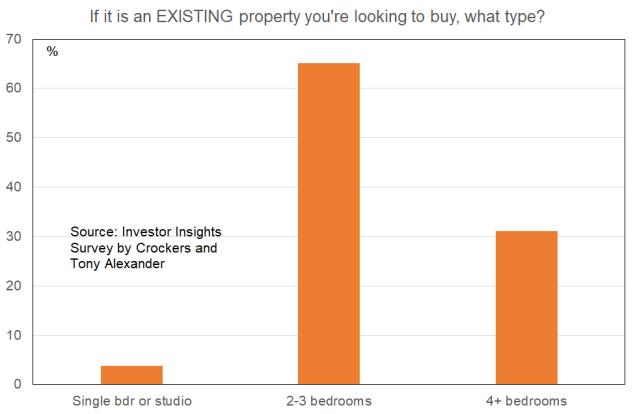
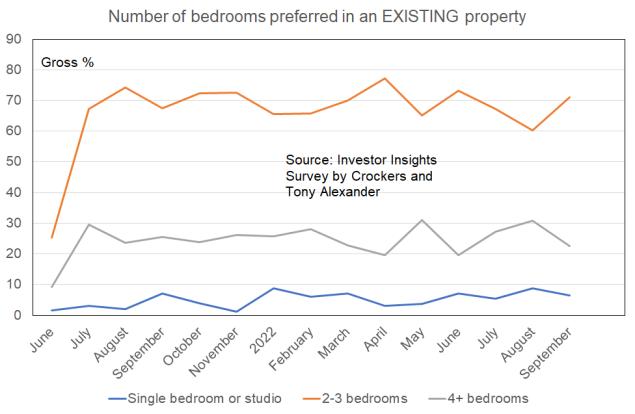
We ask people if they are thinking about buying another property in the next few months. A record gross 29% this month replied yes.
This preference is even greater for those looking at buying an existing property. Few people want an existing property with only one bedroom or a
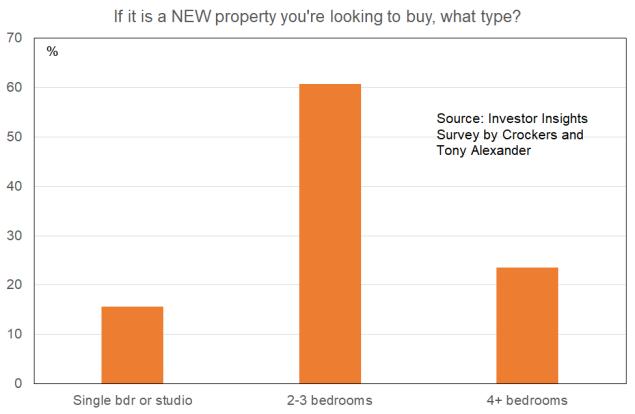
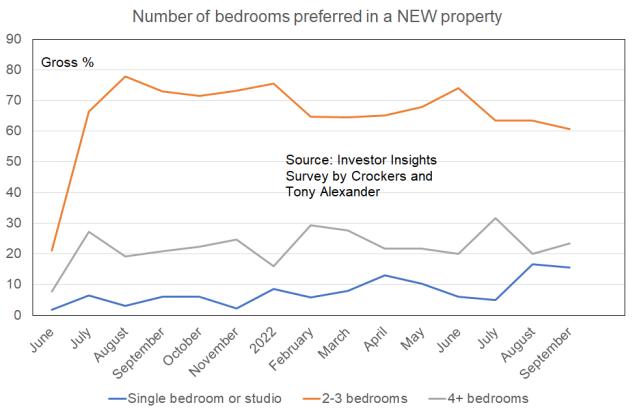
We ask how many bedrooms they would like their new property to have. For those looking at buying a newly built property the preferred number is two three.
is a very small downward trend in the strength of the preference for a 2 3 bedroom property held by those contemplating buying a newbuild.
Therestudio.
For those looking at buying an existing property there might be a small upward trend in preference for a studio or one bedroom unit. But you’ve got to squint to see it.
Confidential to the email recipient Page | 11
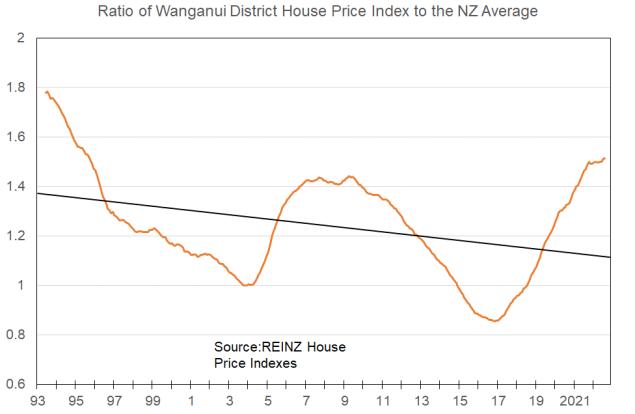
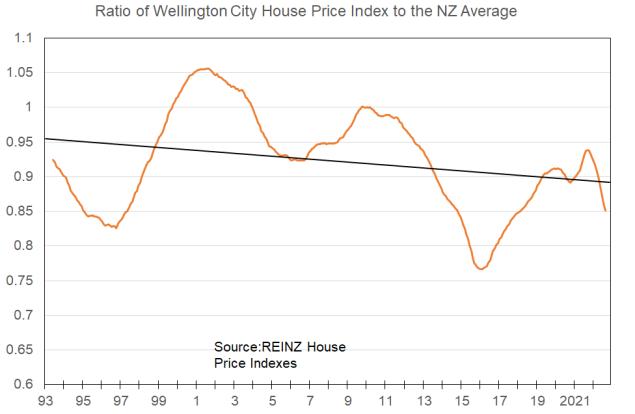
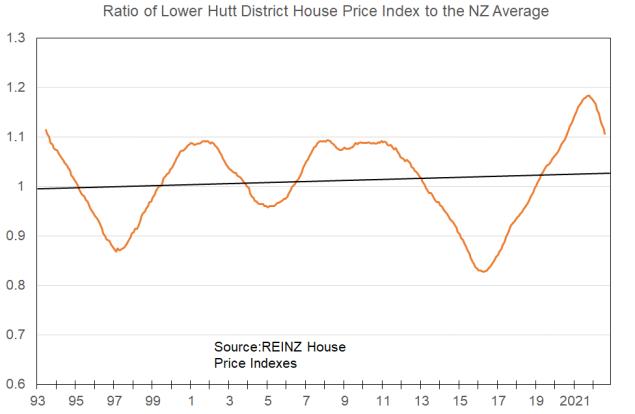
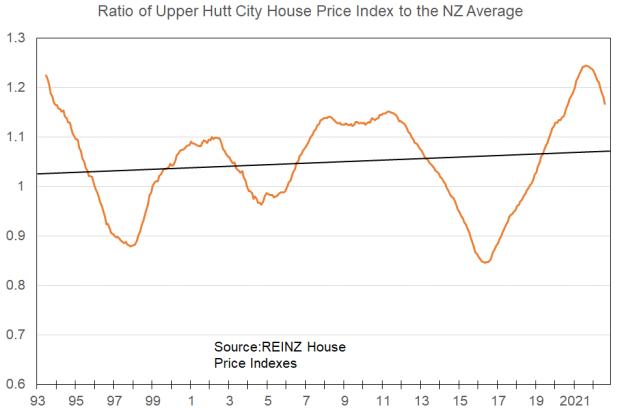
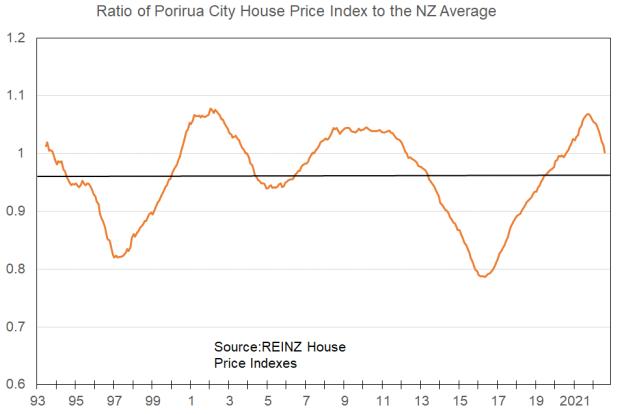
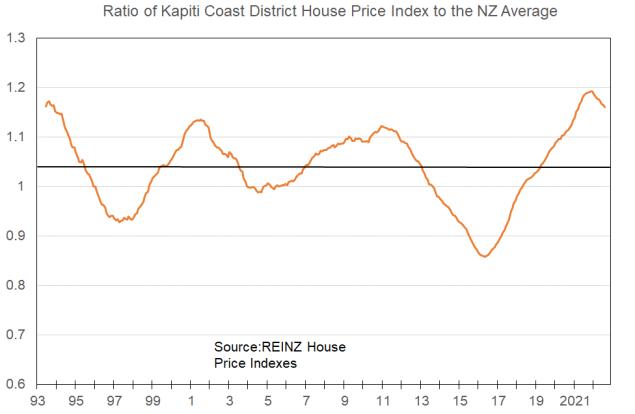
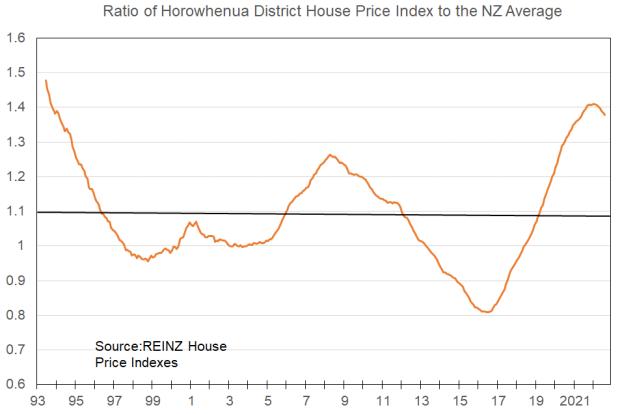
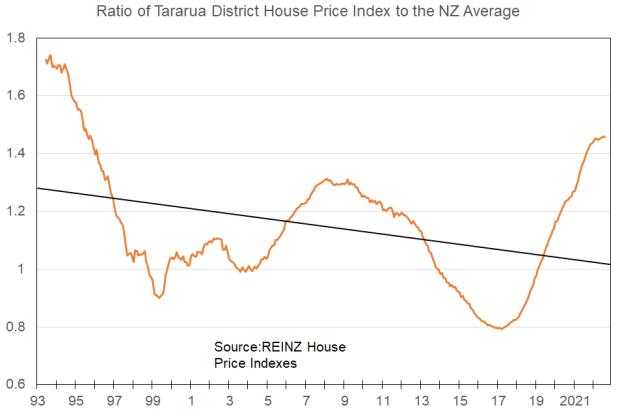
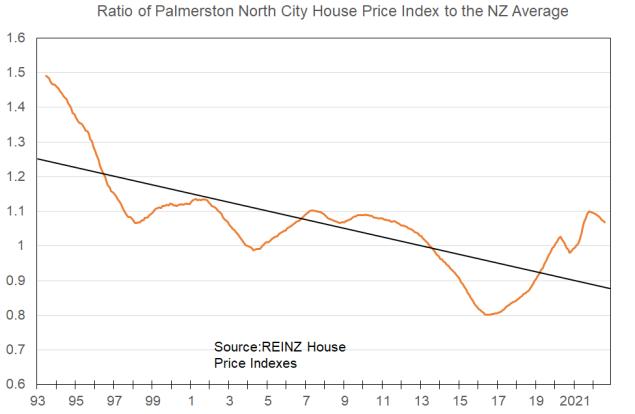
Local House Price Momentum
This week I take a look at where things have been going recently for prices for houses on average from Wanganui down to Wellington City including Palmerston North, Porirua, the Hutt Valley.
These indexes are based on a comparison of the price of properties sold with their CVs. Calculation of the average divergence is applied to an index for the whole area to get a good measure of price change not biased by variations from month to month in the types of properties sold.
The following table shows how much each location’s average house prices have changed in the past three months, the change in the three months before that, and the change since just before the pandemic.Past
3 Previous Since months 3 months Pre Covid % % %
Wanganui 4.2 4.7 41.9
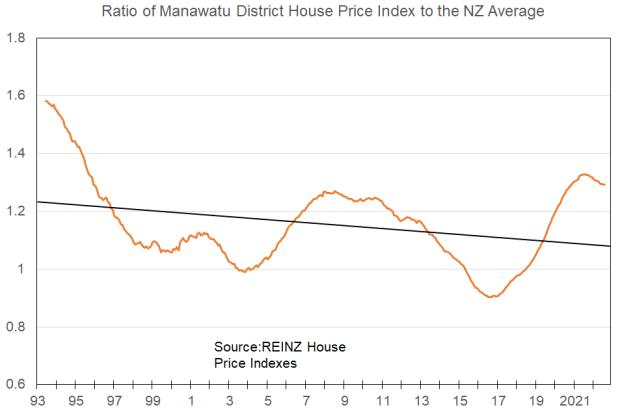
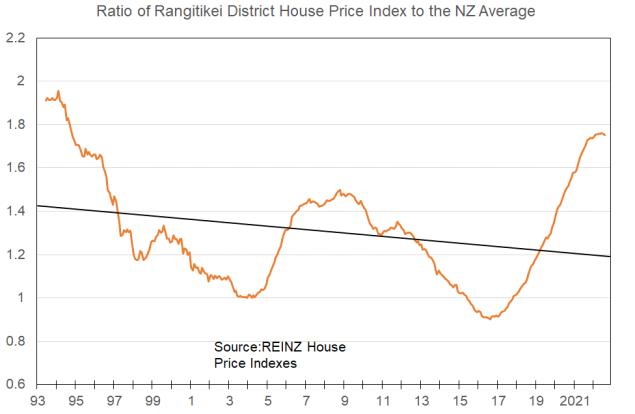
Rangitikei 7.9 3.4 41.5 Manawatu -4.7 -1.2 33.0
Palmerston North 6.6 3.3 29.2 Tararua 4.5 0.2 55.2 Horowhenua 6.7 6.1 29.9
Kapiti Coast 1.1 2.1 55.5
Porirua 8.6 5.5 19.0
Upper Hutt 8.4 7.6 23.6
Lower Hutt 7.4 8.2 22.9 Wellington 7.9 9.1 12.2 NZ -5.0 -4.0 27.7 NZ ex. Auckland 5.6 6.8 16.5
With regard to getting a feel for whether a location might be priced well away from trend we can use long term graphs showing average prices compared with the NZ average. Kawerau, Waitomo, and South Waikato prices on average are substantially out of line with long term trends.
Confidential the
to
email recipient Page | 13
What the surveys tell us
Mortgages.co.nz & Tony Alexander Mortgage Advisors Survey
This survey gives insight into property demand from investors and first home buyers from the unique position of mortgage brokers. We can also gain insight regarding how banks are changing lending policies towards property buyers. Usually near 70 responses.
The main themes to come through from the statistical and anecdotal responses include these.
• First home buyers have returned to the market.
• The decline in investor requests for mortgage advice has almost ended but not quite.
• Banks have increased their test interest rates and that constraint is offsetting some easing of expense calculations and assumptions
intentions for the second month in a row to 11% from 18% last month and a record 27% in July.
Tony’s View Spending Plans Survey
This month’s survey of the over 28,000 subscribers to my weekly Tony’s View publication yielded 1,676 responses. The main result is an improvement in net spending
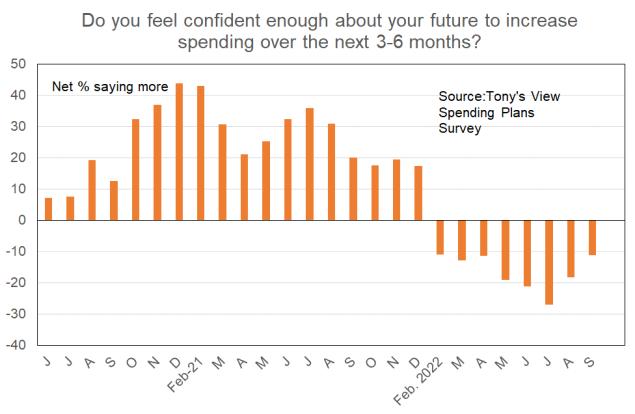
A net 10% of people plan cutting spending on motor vehicles. This is the least negative reading since February, but it is still negative. A net 14% of people plan cutting spending on furniture and appliances. A net 22% plan cutting spending on eating out.
A net 10% of people have noted that they plan cutting their spending on residential investment property. This is unchanged from August and revealing of no improving trend as yet. We get an indication of owner occupier demand improving from this Spending Plans Survey via the change to a net 2.7% of people planning to reduce spending on housing to live in from 3.8% in August and 4.5% in July.
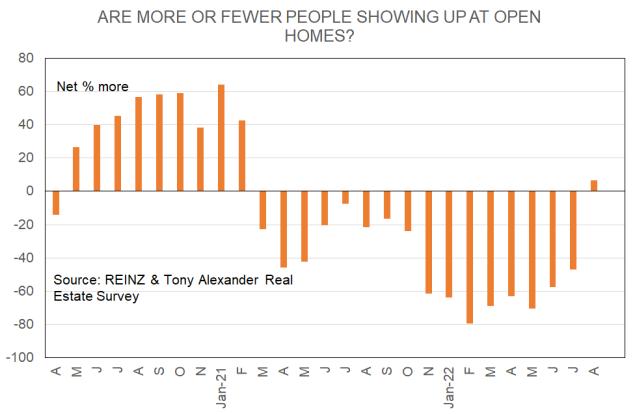
REINZ & Tony Alexander Real Estate Survey
This survey gathers together the views of licensed real estate agents all over New Zealand regarding how they are seeing conditions in the residential property market in their areas at the moment.
The key results from this month’s survey include the following.
• For the first time since September 2021 more agents report seeing more first home buyers in the market than report they are seeing fewer.
• There has been a firm lift in requests for property appraisals.
• For the first time since February 2021 agents are on average seeing more people showing up at open homes.
• Buyer concerns about high interest rates, access to finance, and the risk of buying then watching prices fall further remain elevated. But all three concerns have eased this month.
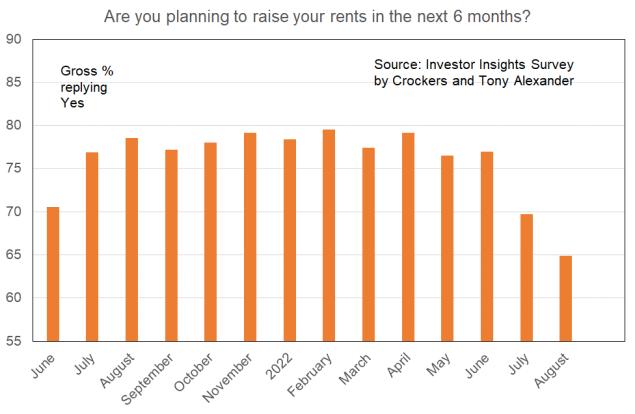
Crockers & Tony Alexander Investor Insight
This survey gives insight into the plans of residential property investors. It delivers insight into the impact of policy and interest rate changes.
• The proportion of investors looking to increase their rents in the next 12 months continues to decline as does the average rent rise sought.
• Consistent with data from other sources, bank willingness to lend is seen by investors to be improving.
• Net plans for purchasing more investment property have fallen away this month.
Portfolio Investment Survey Sponsored by Sharesies
This survey gives insight into changes in the asset types people are favouring. The key results from our latest survey which yielded 975 responses include the following.
• There has been a firm rise in plans to purchase additional assets for one’s portfolio.
• Interest in purchasing shares using an app has recovered to a seven month high.
• Investors in shares have pulled back from defensive positioning towards favouring Growth and Aggressive portfolios.
• Intentions of investing in residential property have lifted from 25% in July to 29% this month.
• Of those planning a purchase, interest in a new build has declined, driven perhaps by concerns about developer ability to deliver amidst many resourcing problems.
• Investor concerns about rising interest rates are abating.
Confidential to the email recipient Page | 15
Interest Rates
Nothing I write here or anywhere else in this publication is intended to be personal advice and you should discuss your financing and investment options with a professional.

More rate rises
With prospects for labour markets and wages growth in economies like the United States and our own looking better than expected, worries about the speed with which currently high inflation rates will decline have grown in recent weeks. We are learning that the traditional response of businesses to challenging conditions of laying off staff is turning out to be weaker than seen in the past.
The inflation numbers coming out offshore have also tended to be higher than anticipated. The upshot is that with central bankers issuing strong warnings about ongoing high inflation risks wholesale interest rates have been on a firm trajectory upward recently.
In the United States, following a widely expected third increase of 0.75% in the Fed funds rate the benchmark ten year government bond yield has risen to 3.5% from 3.4% last week and 2.75% early in August.
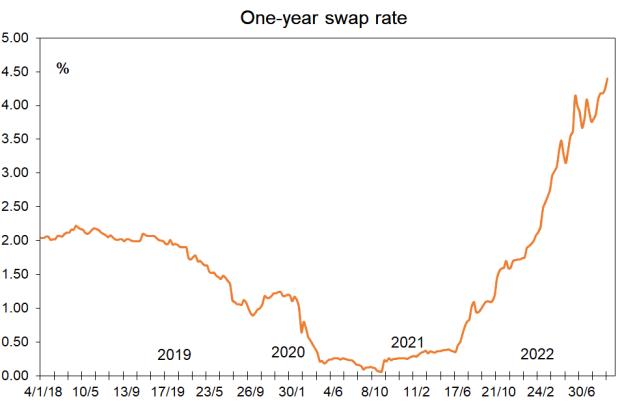
from 4.24% last week and a low of 3.75% early last month. The three year wholesale borrowing cost is now near 4.4% from 4.23% last week and 3.6% early in August.
The NZ one year wholesale borrowing cost facing NZ banks has climbed further to 4.4%
From these levels additional rises will probably require additional indicators of stronger than expected growth or higher than expected inflation either here or in the United States.
For now the most likely scenario worth factoring in is rates not falling much until the latter part of 2023 all going well.
If I were a borrower, what would I do?
I would probably just fix one year though having part of one’s mortgage fixed for two years would suit many people.
To see the interest rates currently charged by major lenders go to www.mortgages.co.nz
The following graphs show levels of the one, two, three, and five year fixed mortgage rates over the past three decades and are included each week in Tview Premium.

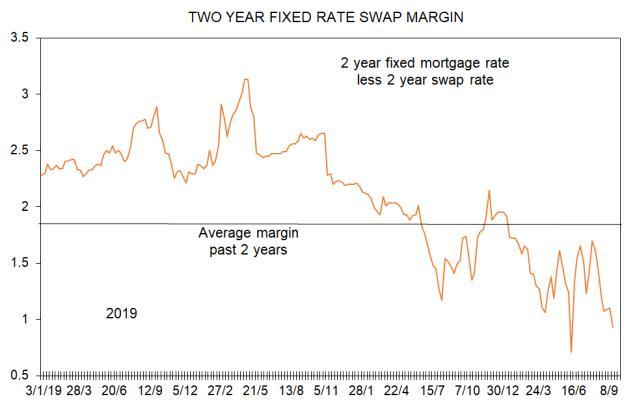
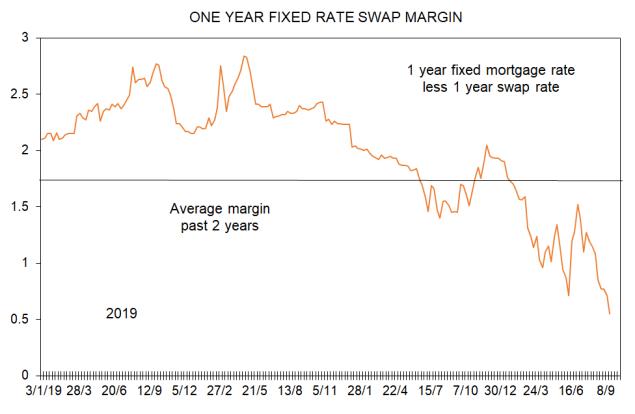
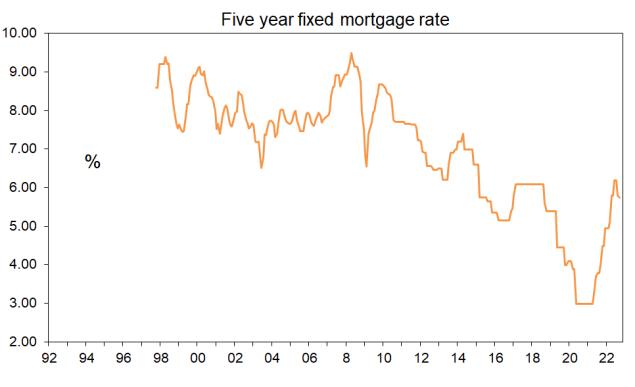
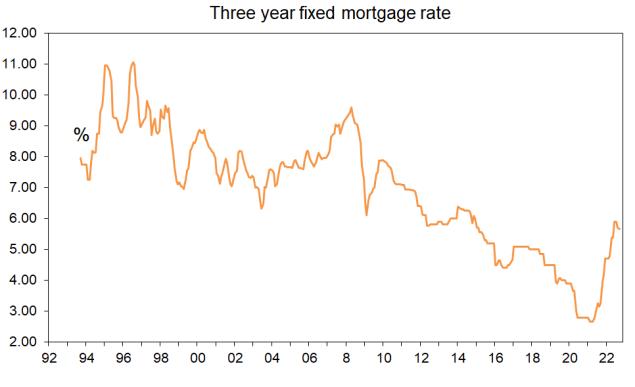
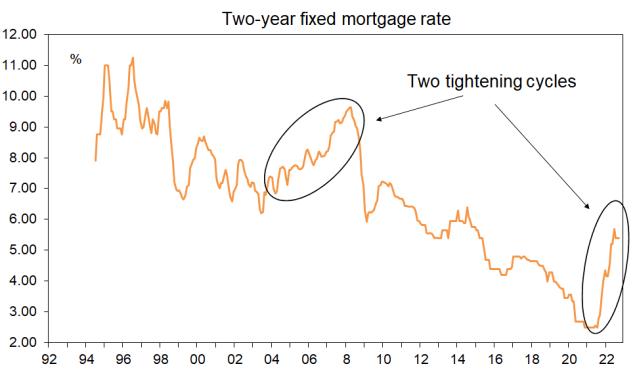
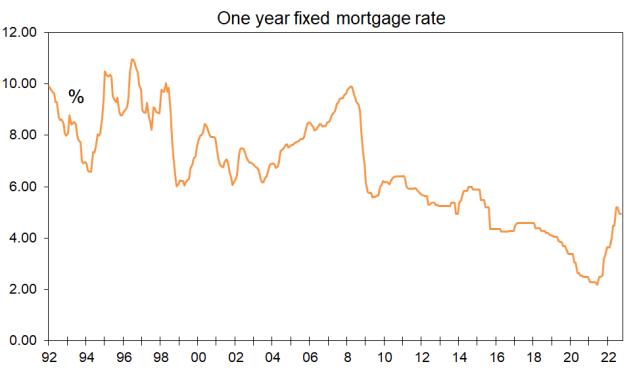
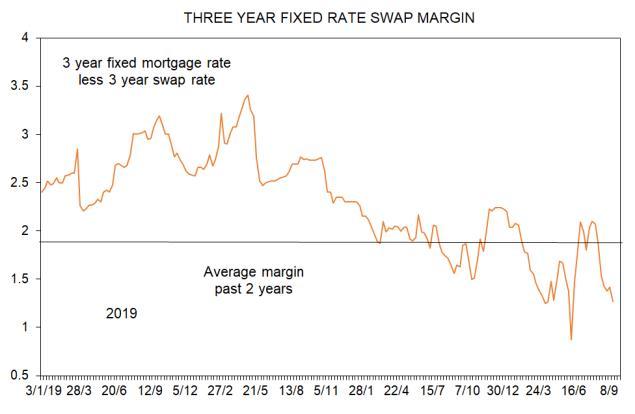
These next four graphs show the margins for fixed rate loans. You can use them to get a feel for whether rates offered by banks are at unusually and potentially unsustainably low or high levels and could change even without their borrowing costs altering. Good luck. I can’t predict these margin shifts.
Confidential to the email recipient Page | 17
Confidential the
To enquire about advertising in Tony Alexander publications email me at tony@tonyalexander.nz
This publication has been provided for general information only. Although every effort has been made to ensure this publication is accurate the contents should not be relied upon or used as a basis for entering into any products described in this publication. To the extent that any information or recommendations in this publication constitute financial advice, they do not take into account any person’s particular financial situation or goals. We strongly recommend readers seek independent legal/financial advice prior to acting in relation to any of the matters discussed in this publication. No person involved in this publication accepts any liability for any loss or damage whatsoever which may directly or indirectly result from any advice, opinion, information, representation or omission, whether negligent or otherwise, contained in this publication.

to
email recipient Page | 18