
South Fork Market Summary
The Hamptons market remained resilient through the end of the first quarter, despite broader economic factors, including tariffs, delayed interest rate cuts, and persistent inflation, which introduced some hesitation among buyers. This led to a slower start to the second quarter, with a more cautious pace of decision-making. Still, despite a 6.8% year-over-year decline in sales, both total dollar volume and prices continued to rise. As the quarter progressed, buyer confidence steadily returned. Activity picked up, more buyers came back to the table, and we saw encouraging momentum heading into the summer season.
There were 410 sales, down slightly from 440 the year before, but up from 394, reflecting a quarter-over-quarter increase in activity. Sales volume climbed 3.6% year-over-year to just over $1.5 billion. The average sale price rose 11.2% to $3,665,628, and the median price ticked up 3.0% to $2,055,000, indicating a market that continues to favor quality over quantity.
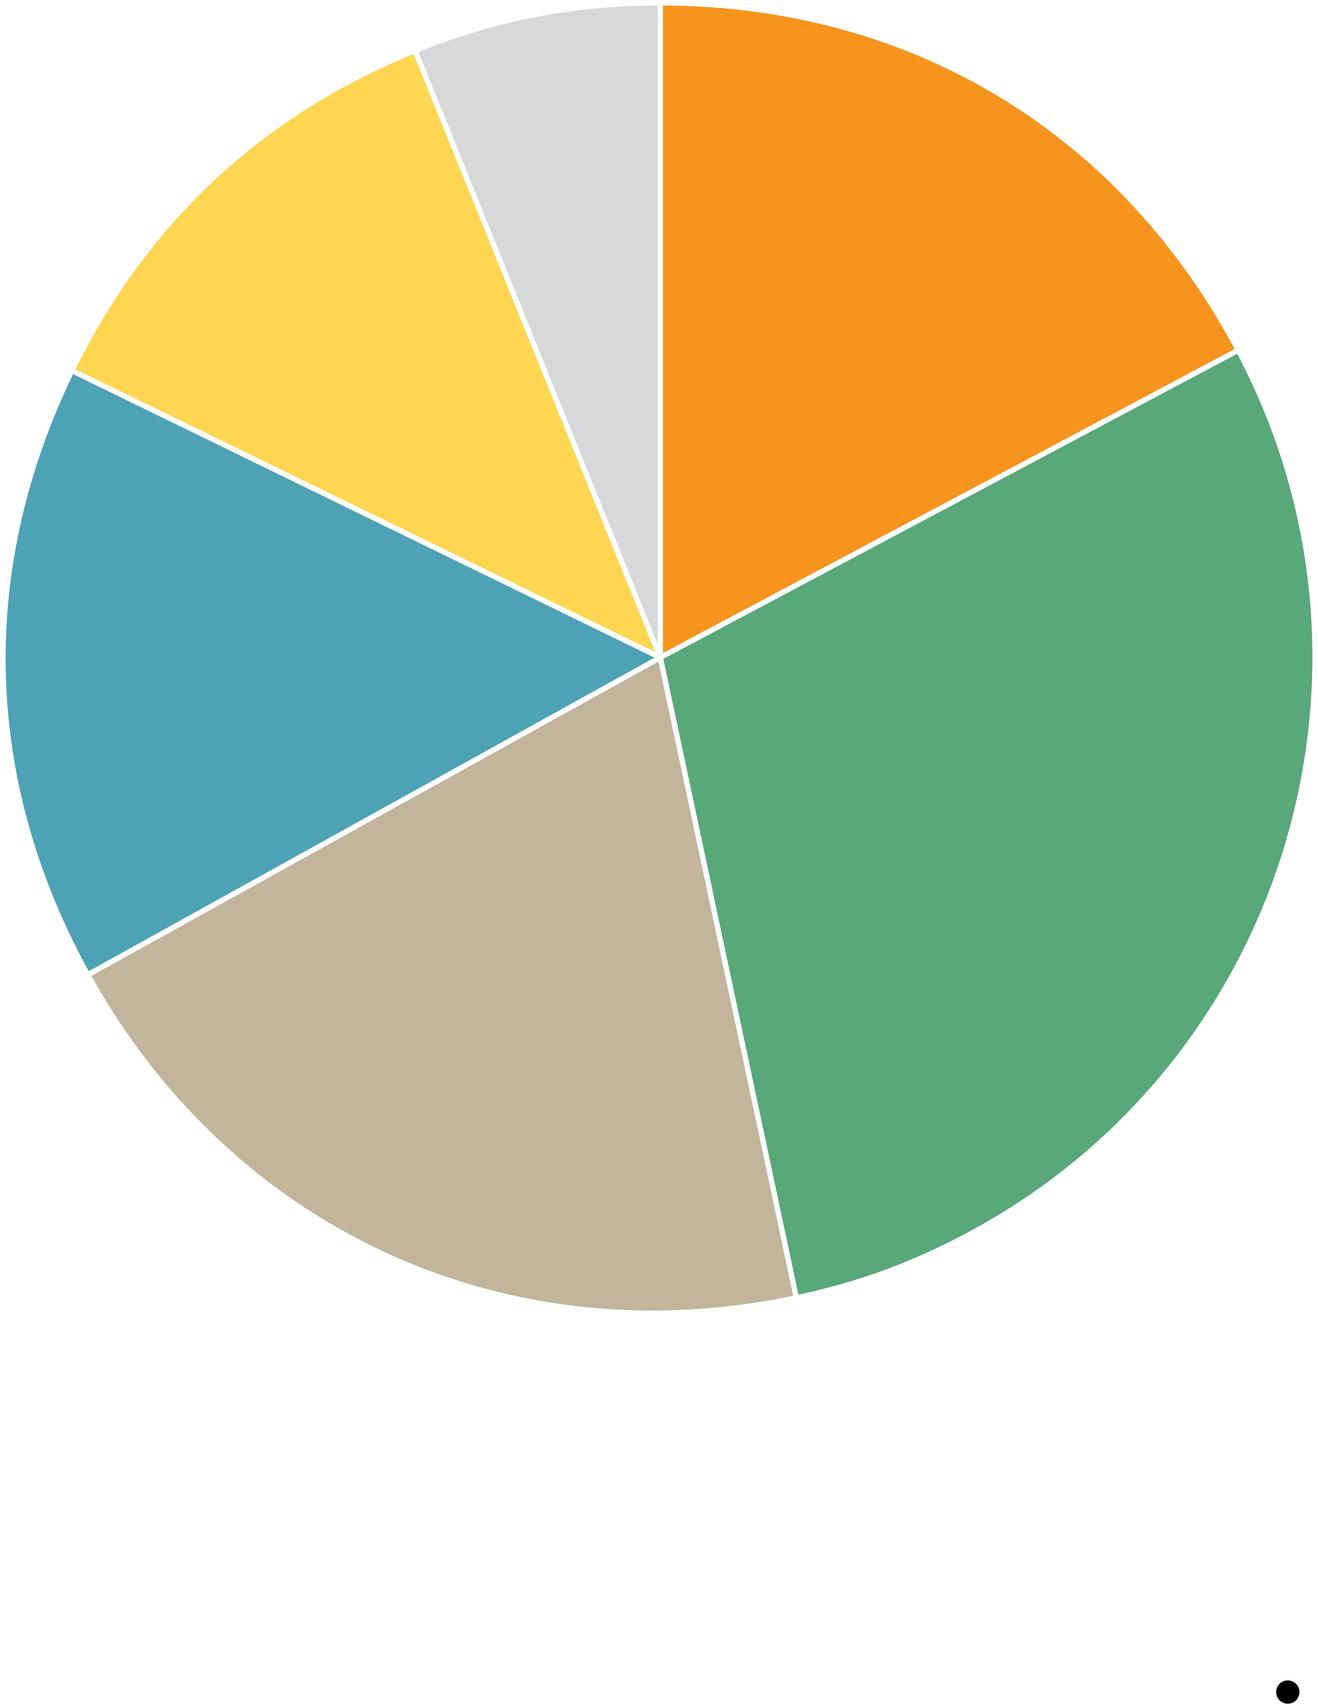
East Hampton led this quarter with 128 sales, accounting for over 30% of all transactions. The average sale price rose an impressive 20.2%, while the median dipped slightly by 3.3%, reflecting strong activity at the high end. Southampton saw the largest increase in median price, up 25% to $1,812,500, while Sag Harbor posted the biggest jump in sales, rising 24.5% yearover-year
However, not all markets were as active. West of the canal experienced a slowdown, with Westhampton experiencing 18.1% fewer sales and a 27.9% drop in dollar volume compared to last year. Across the region, pricing still presents an issue for buyers. More than 40% of active listings have experienced at least one price correction, signaling that many sellers are still adjusting to current market conditions
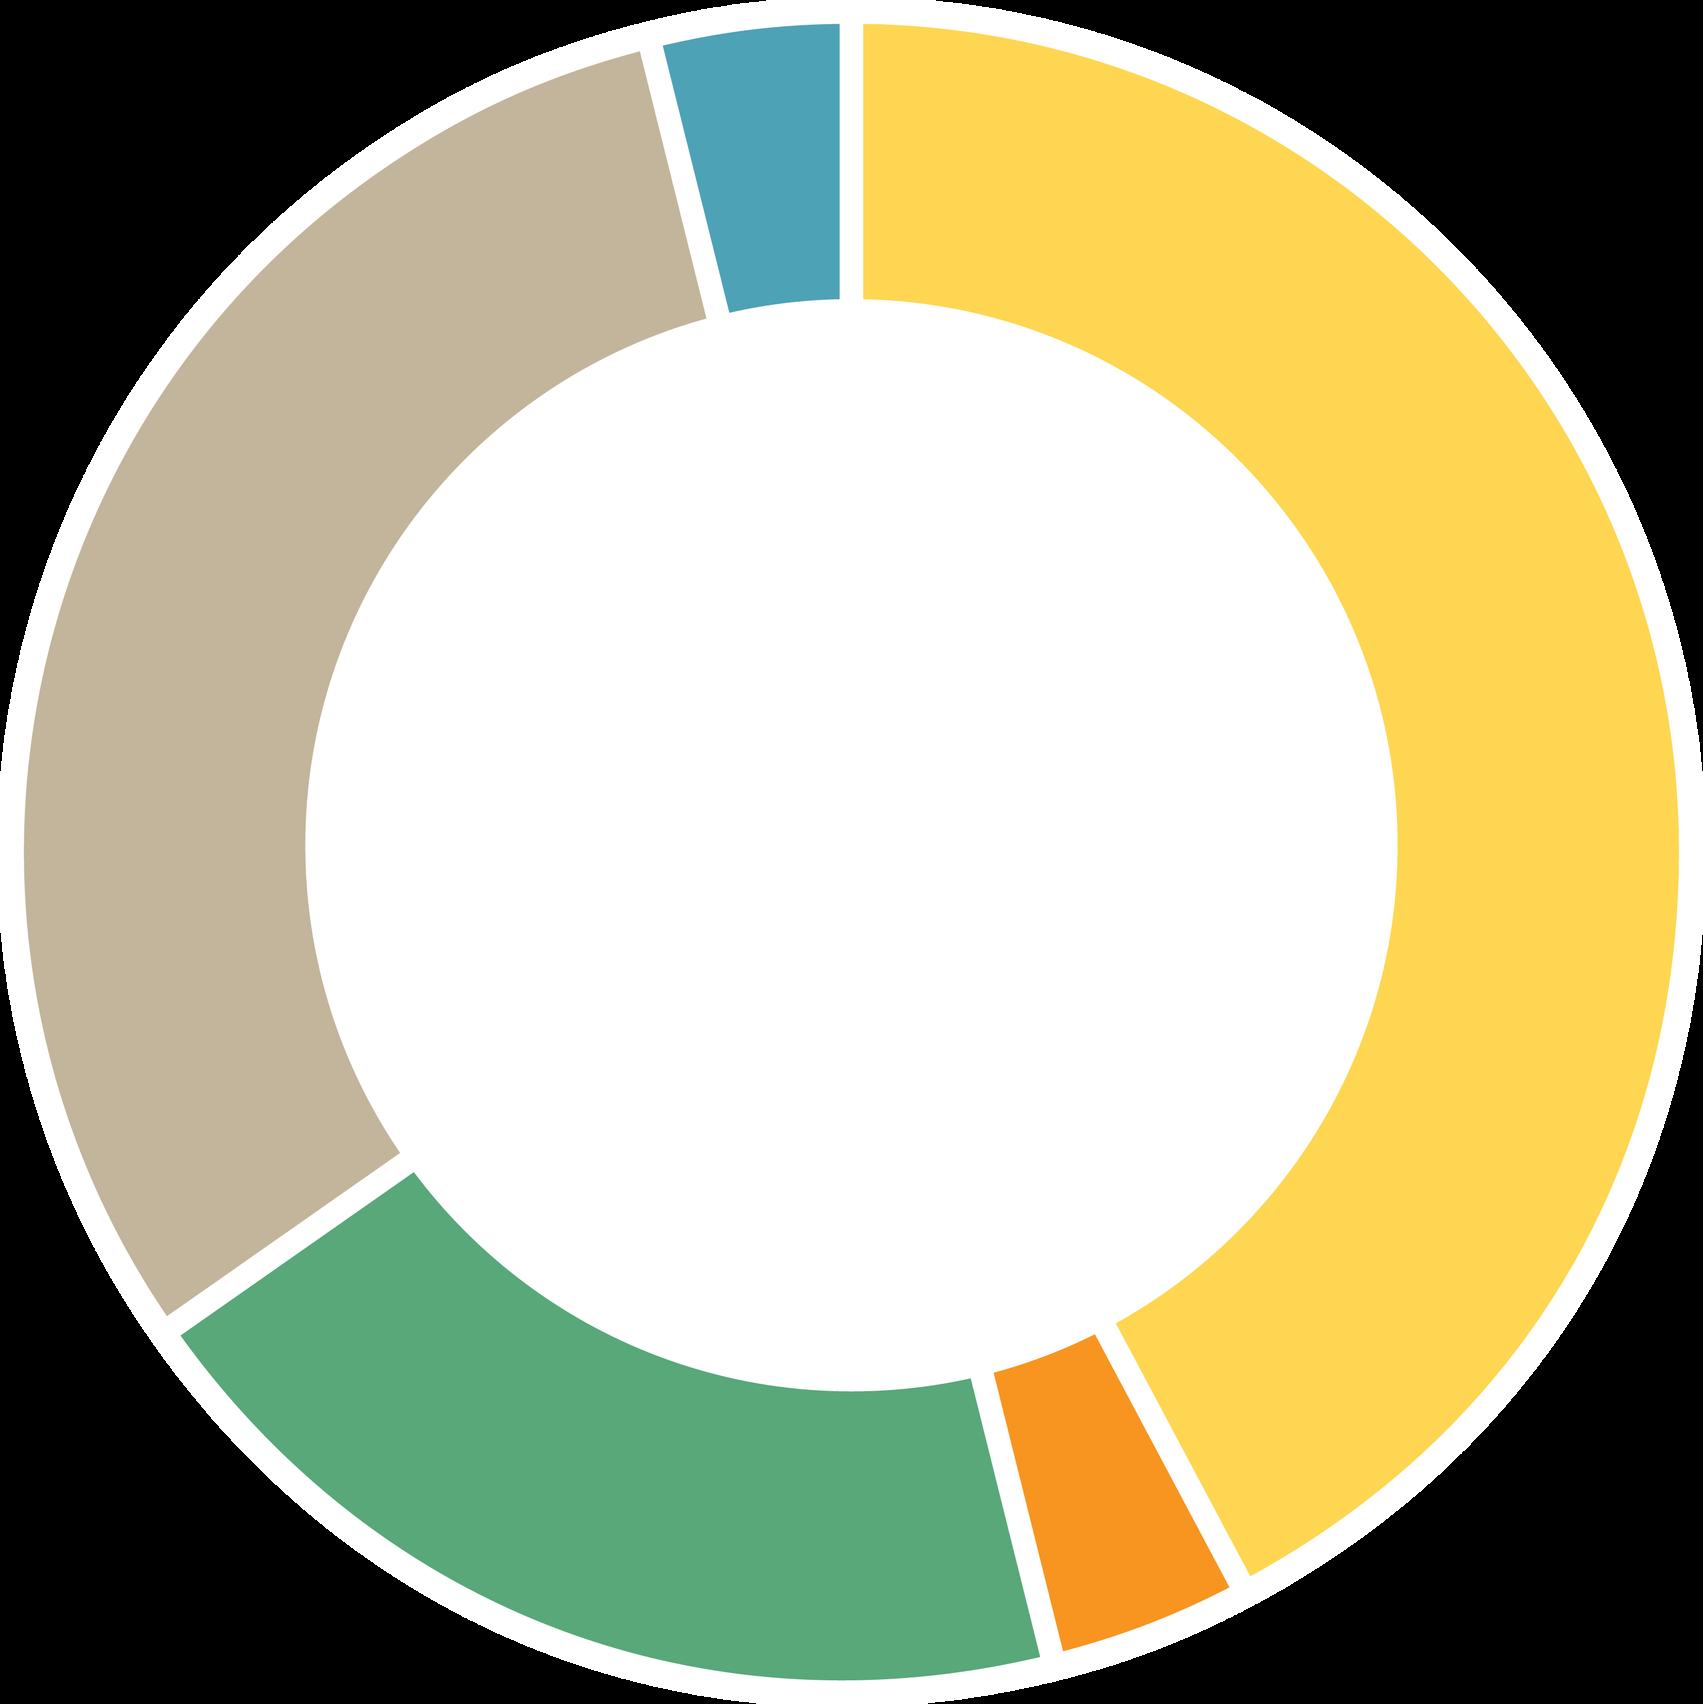
The ultra-luxury segment had a standout quarter, with 26 sales over $10 million, up from 22 last year and higher than the 21 recorded last quarter. East Hampton led with 11 of those trades, totaling nearly $229 million, including the quarter’s largest sale: 294 Further Lane for $48.5 million. These deals were spread across East Hampton Village, Amagansett, Wainscott, and Montauk, reflecting broad high-end demand across the town Southampton followed with 8 transactions, primarily in the Village and Water Mill.
Bridgehampton contributed 5, including a $32 million sale on Surfside Drive. Sag Harbor and Quogue each logged a $10 million-plus deal as well, highlighting how top-tier demand continues to extend across more areas of the East End.
The market showed real signs of life at the end of the quarter, just as summer got into full swing and more active buyers returned to the market. Activity in the ultra-luxury segment remained strong, reflecting continued confidence at the top end. Several economic forecasts for the second half of the year are cautiously optimistic. While inflation is expected to rise, interest rate cuts could materialize, resulting in stronger buyer momentum in the coming months. The energy in the market is clearly building.
–Joe Fuer
Managing Director
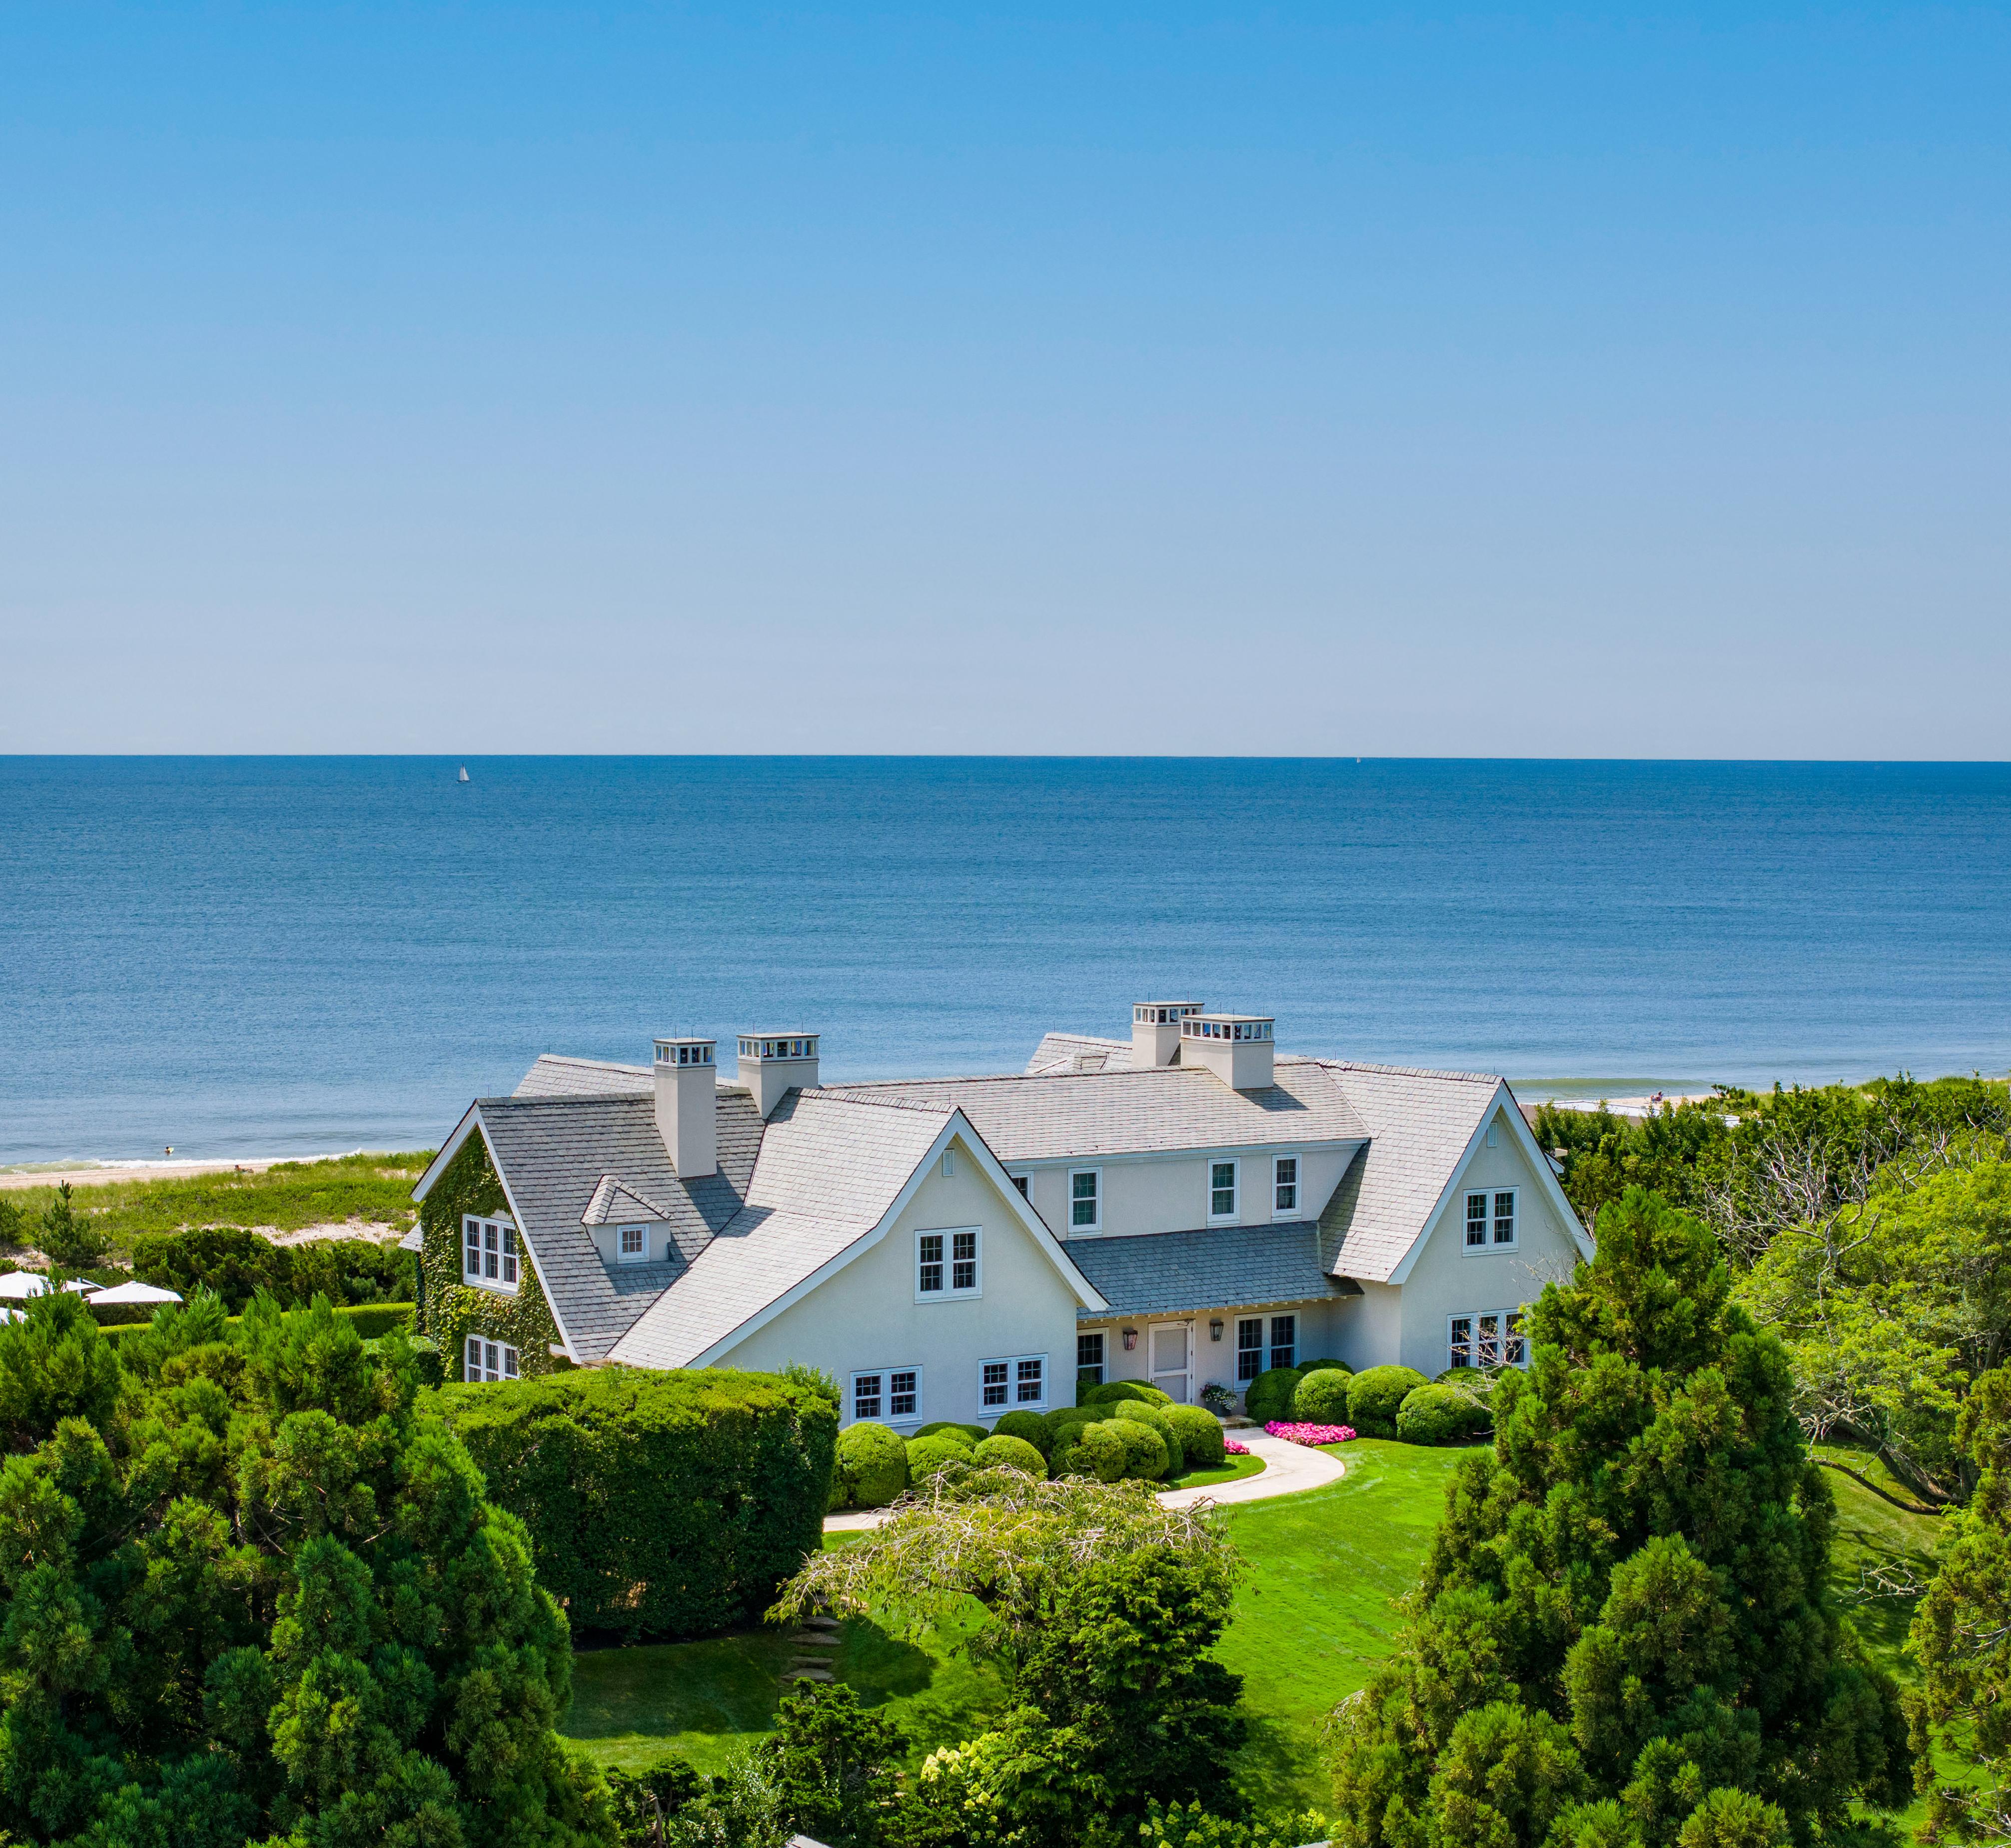
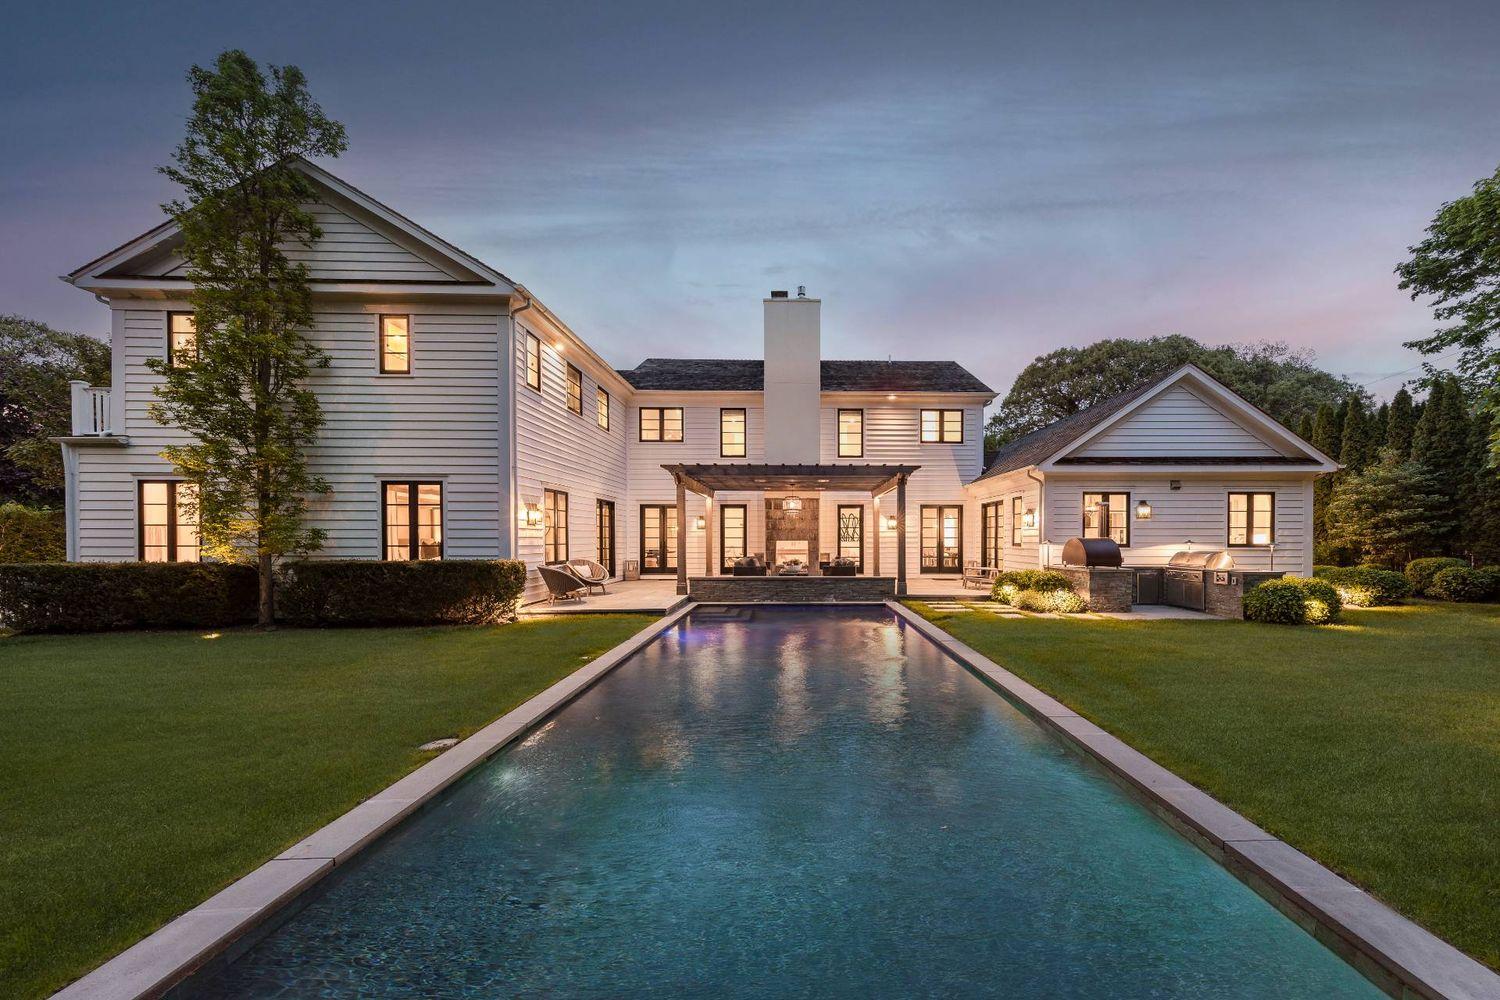
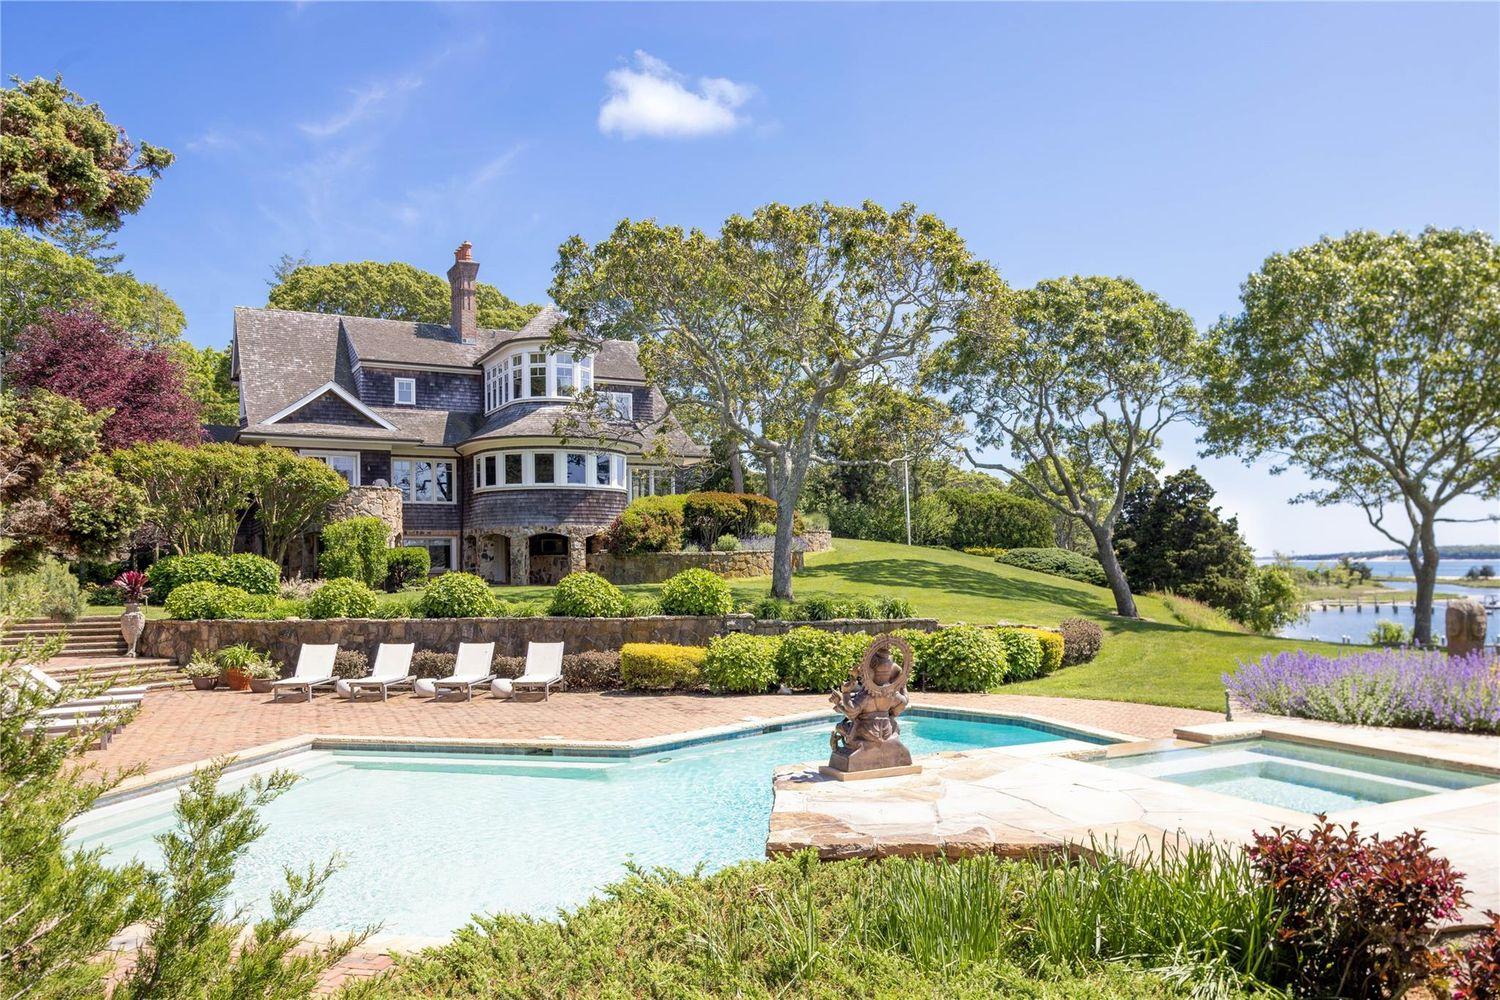
$2,055,000 Pictured on the cover page: 43 East Dune Lane East Hampton
Submarket
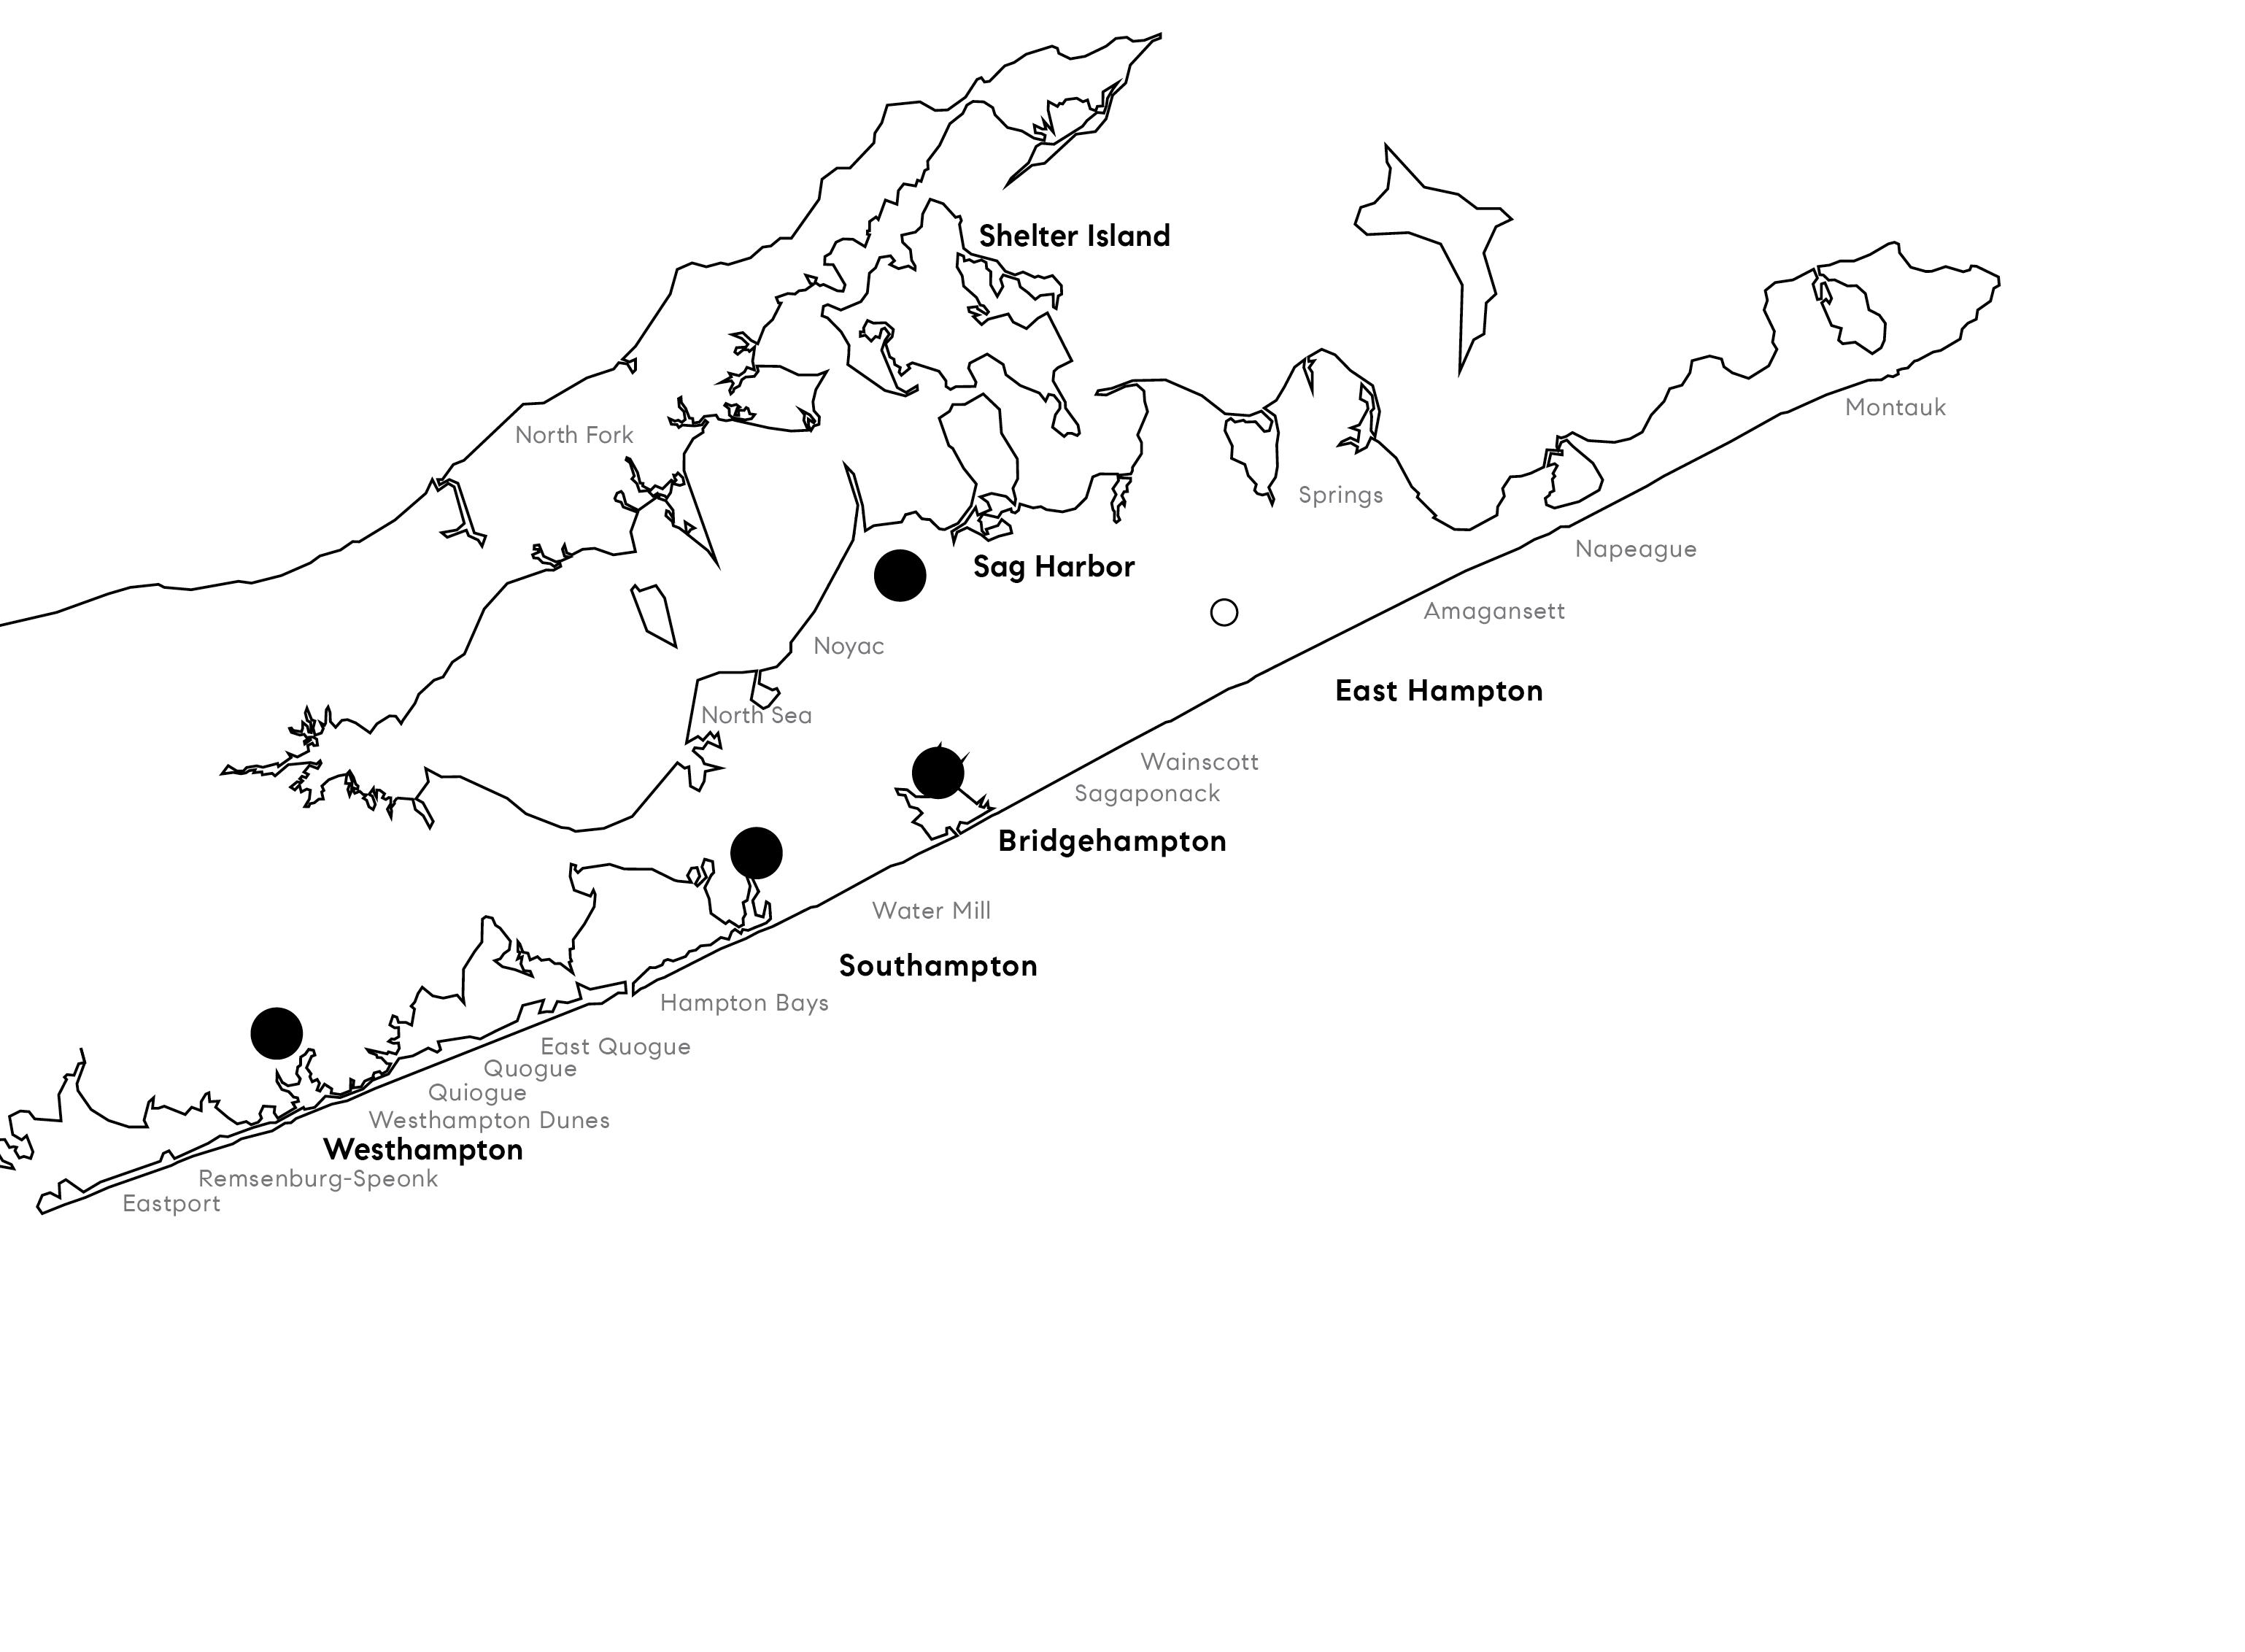
East Quogue, Hampton Bays, Quiogue, Quogue, Remsemburg, Speonk, Westhampton, Westhampton Beach, and Westhampton Dunes
Bridgehampton and Sagaponack
Amagansett, East Hampton, East Hampton Village, Montauk, Northwest Woods, Springs, and Wainscott
Southampton, Southampton Village, and Water Mill
North Haven, Noyac, Sag Harbor and, Sag Harbor Village
South Fork - Single Family
TOTALS
South Fork - Single Family

100 BAY STREET
SAG HARBOR
West of the Canal - Single Family
West of Canal - Single Family
PRICE POINTS


East of the Canal - Single Family
TOTALS
East of Canal - Single Family
PRICE POINTS

Your home. Your choice.
OWN THE NARRATIVE
THE 3-PHASED MARKETING STRATEGY

DEVELOP YOUR STRATEGY WITH COMPASS

WEST OF CANAL EAST OF CANAL
THE GABLES AT WESTHAMPTON BEACH
Trades Over $10M+
Submarket

South Fork - Single Family
TOTALS
Bridgehampton
Sag Harbor
Shelter Island
East Hampton
Westhampton - Single Family
East Quogue
Hampton Bays
Quiogue
Quogue
Westhampton - Single Family
TOWN
Speonk
$62,150,489
$3,271,078
$2,488,489
Westhampton Beach
Westhampton
Remsenburg
Westhampton Dunes
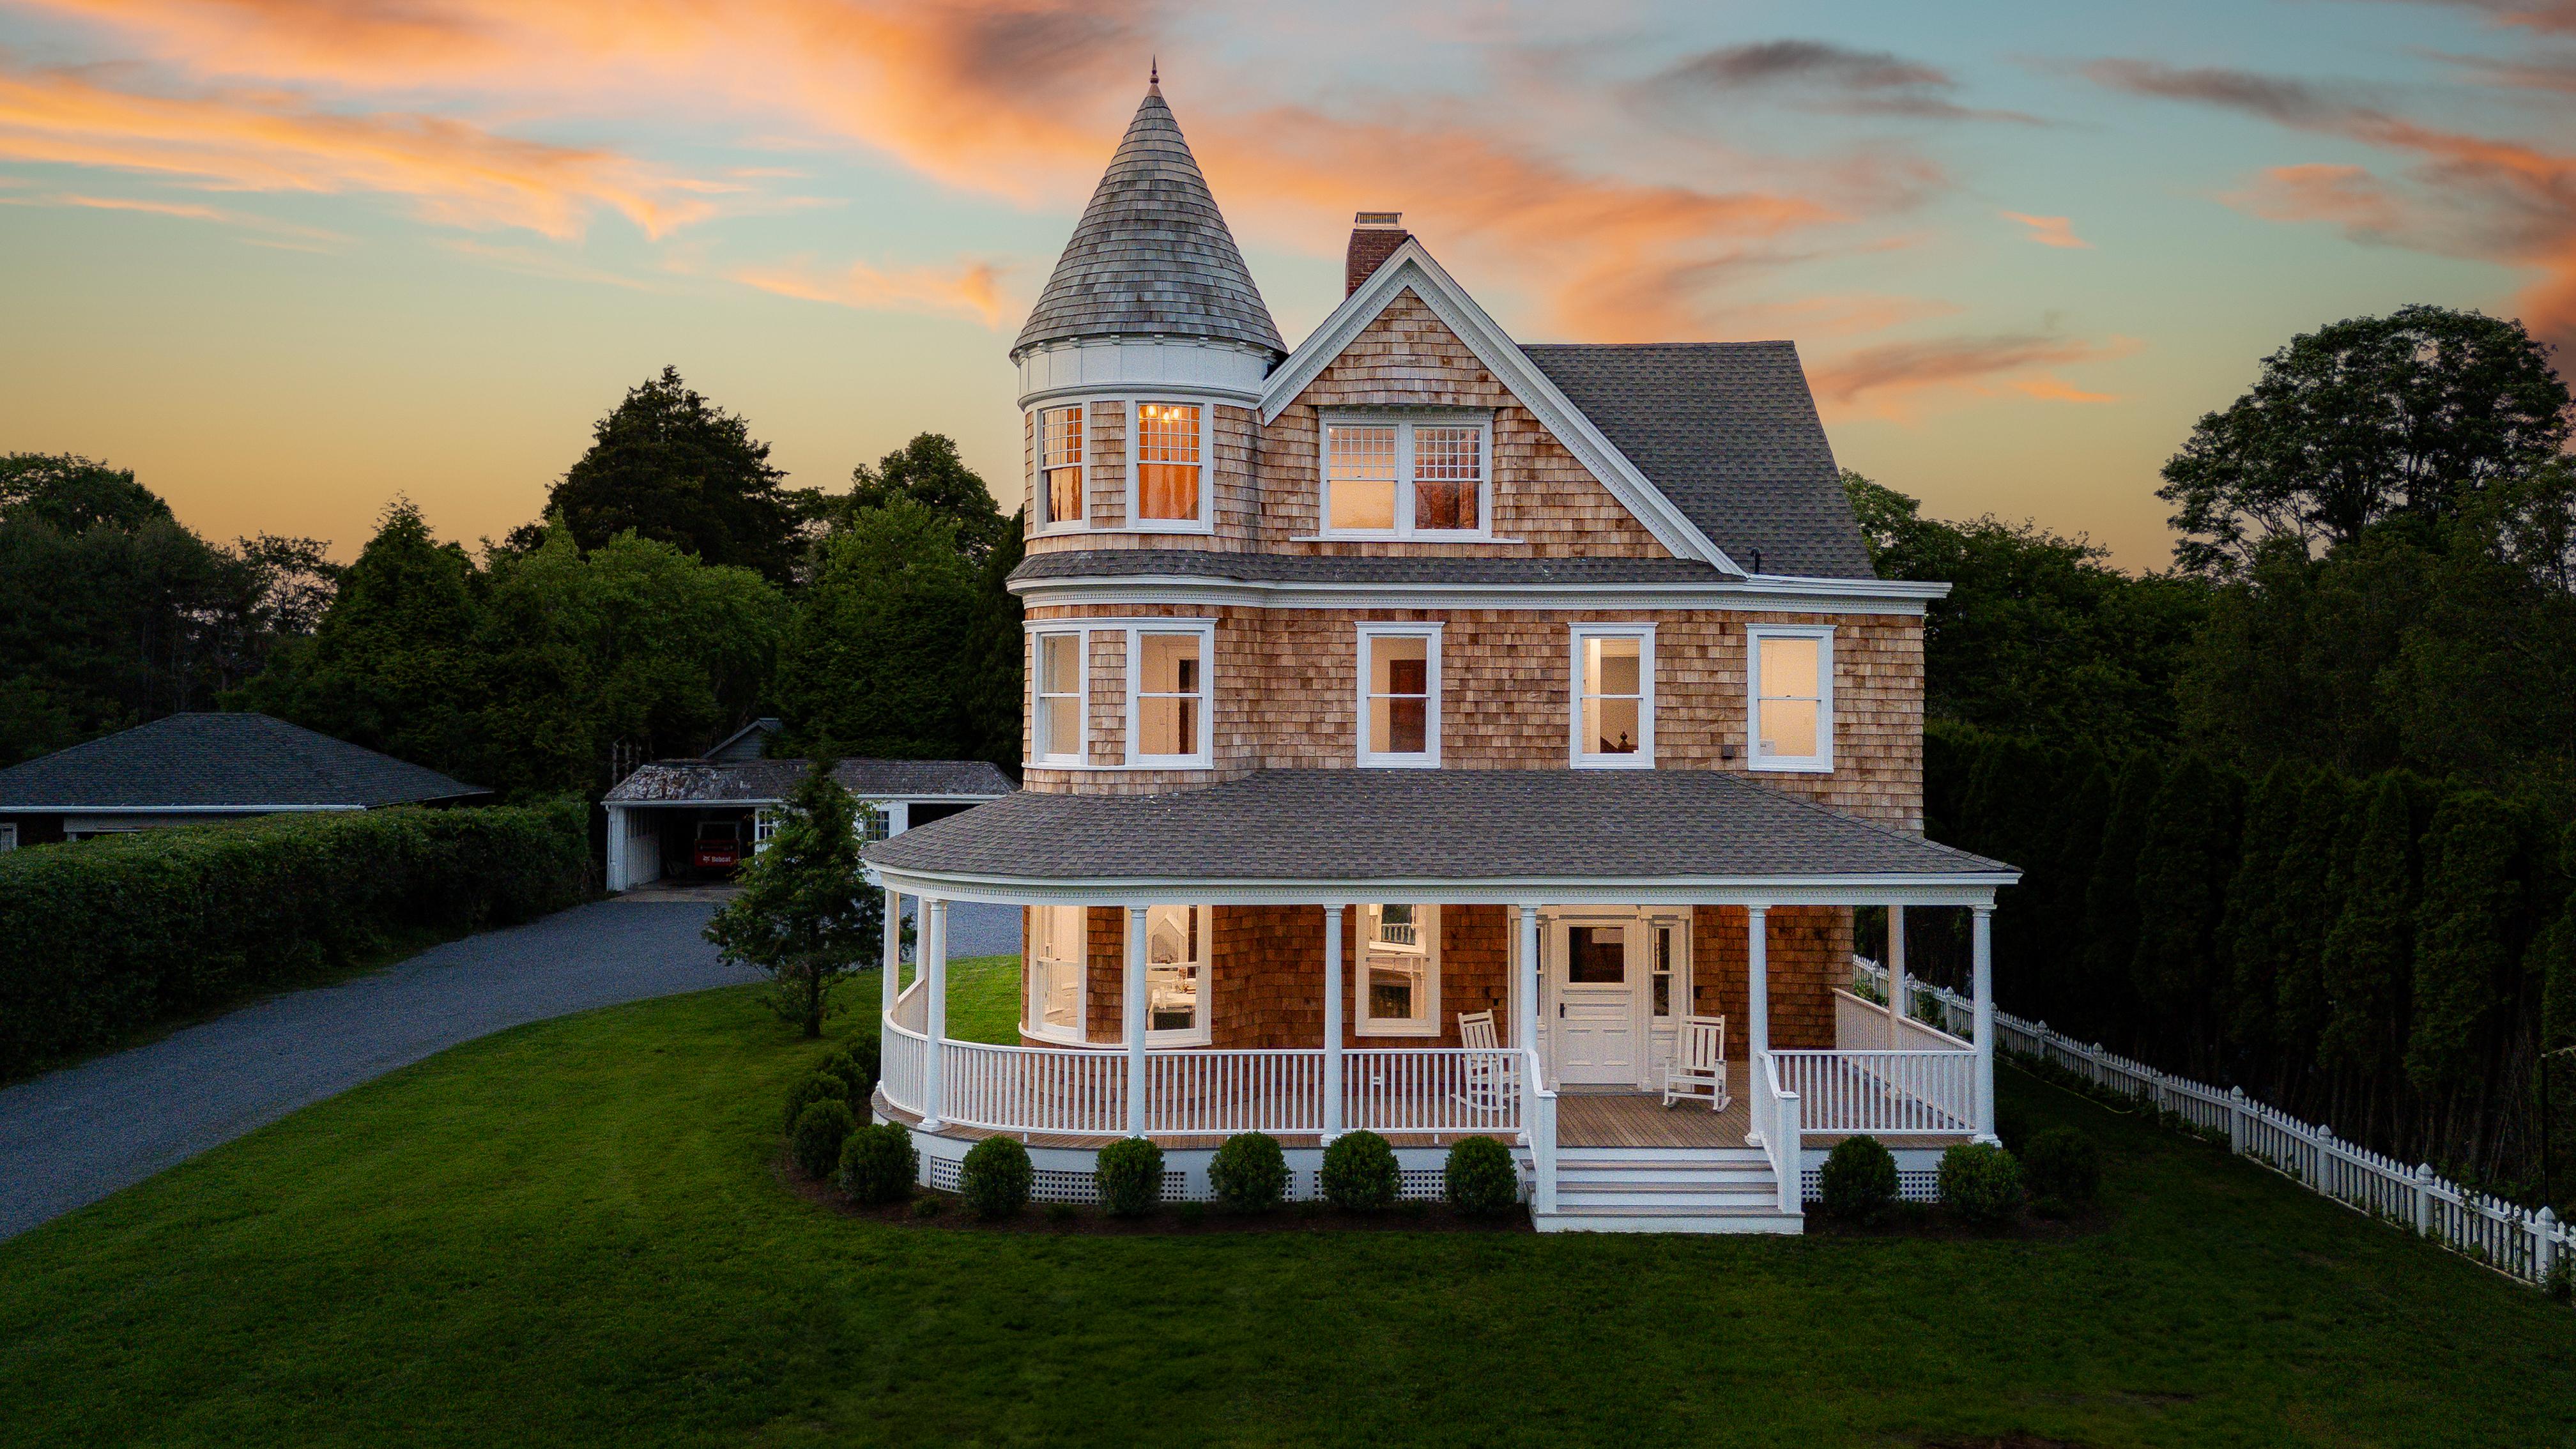
30 HUNTTING LANE
TOWN
North Sea
Southampton Village Southampton
Water Mill
$5,495,083 $5,850,000
Bridgehampton - Single Family
TOWN
$126,245,000
$5,738,409
$3,905,000
$3,822,500
$3,822,500
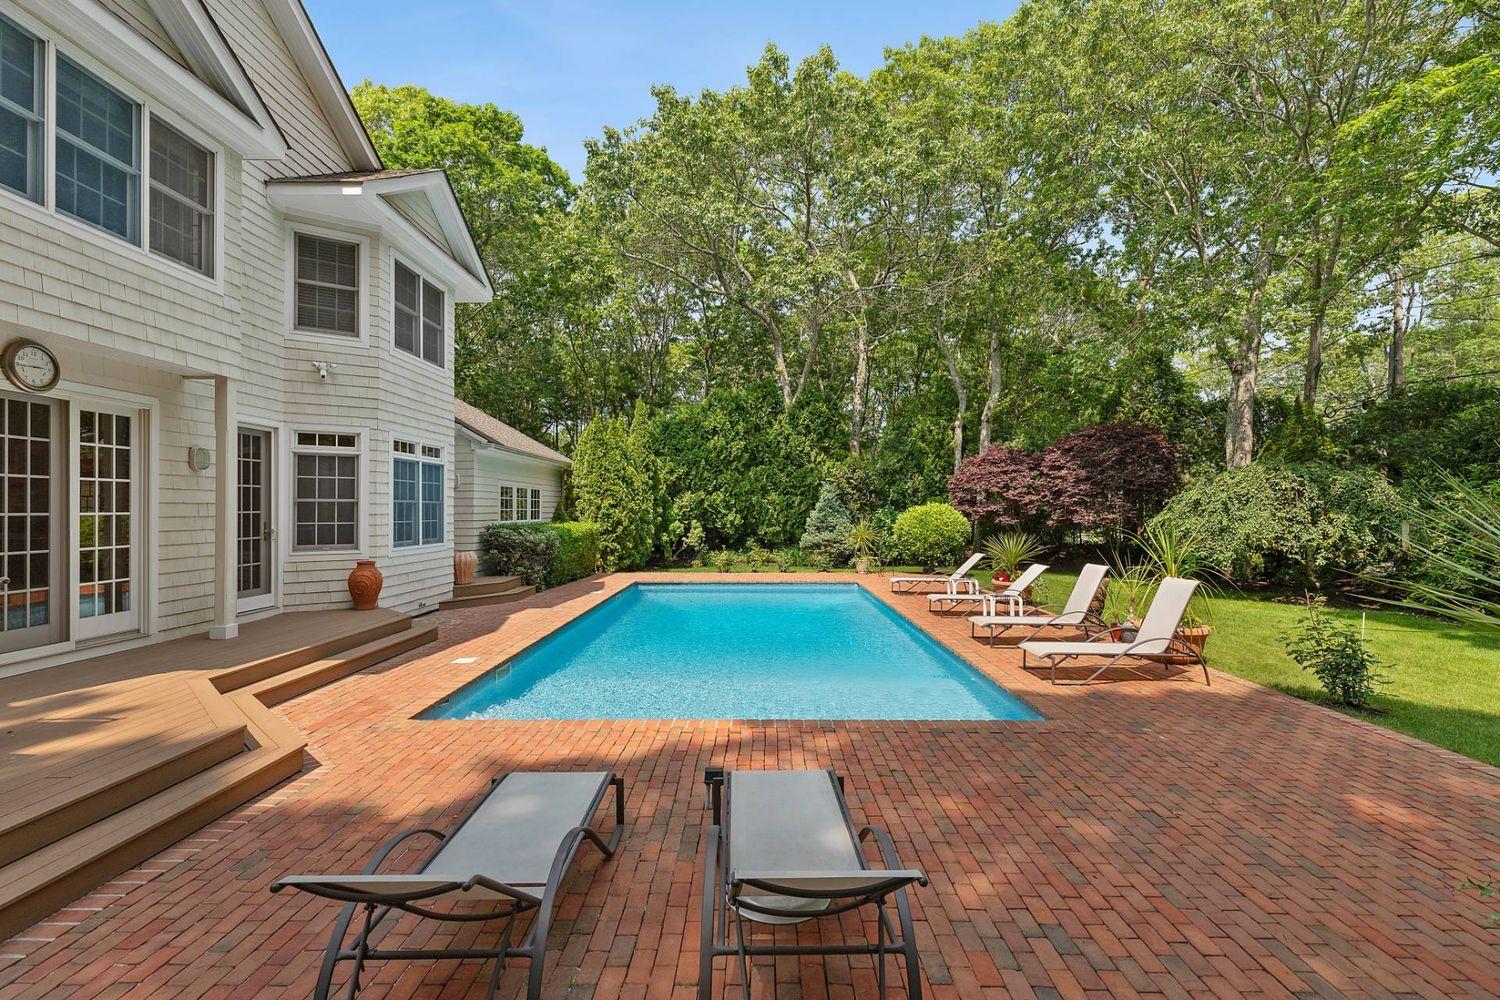
Bridgehampton
Sagaponack
Sag Harbor - Single Family
2528 NOYACK ROAD, SAG HARBOR
North Haven
Shelter Island - Single Family
TOWN
Shelter Island
$22,924,000
$1,763,385
$1,540,000
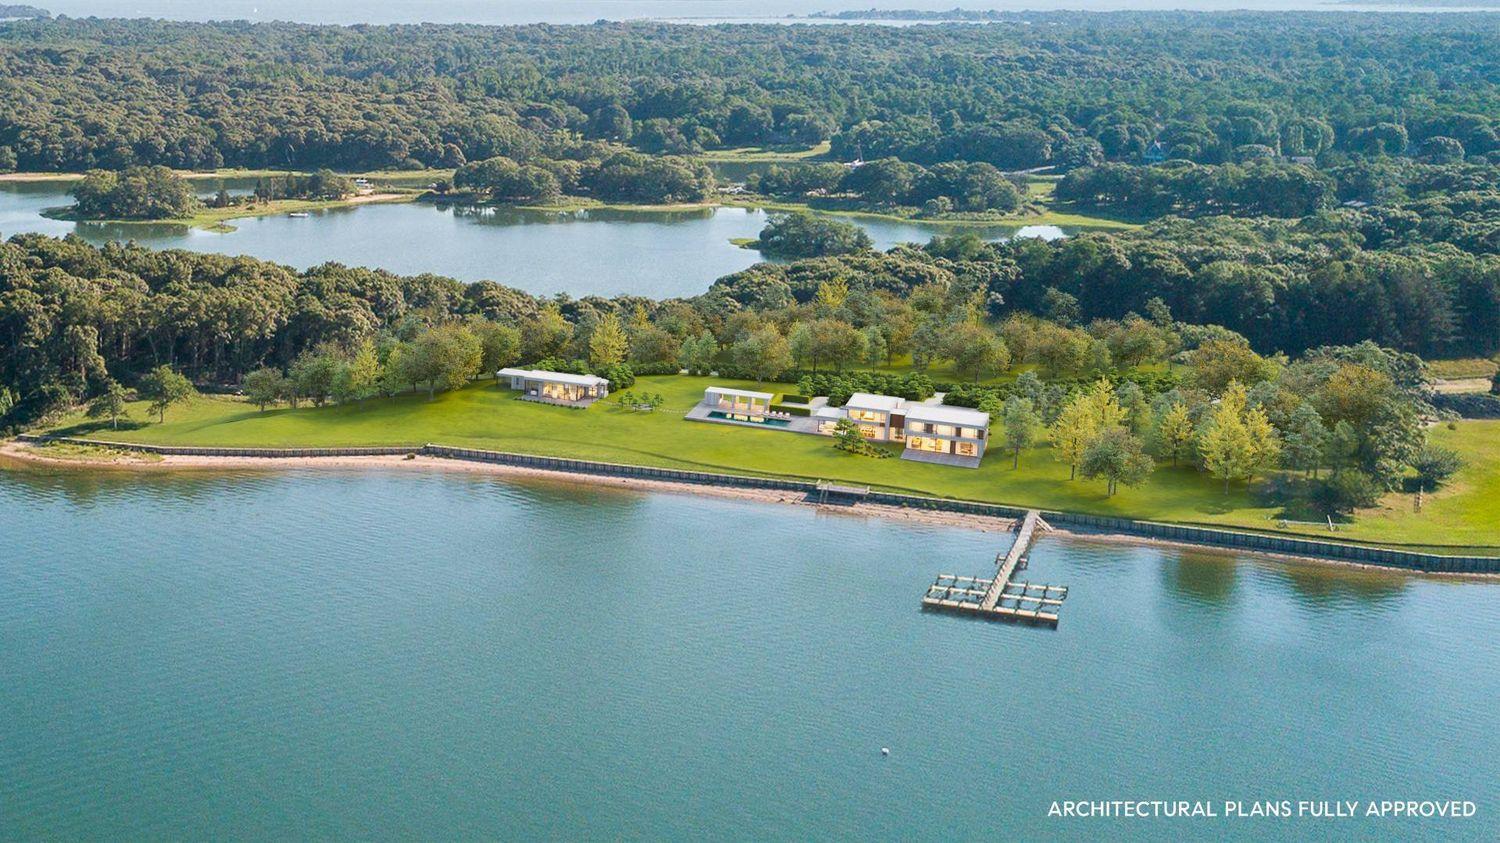
East Hampton - Single Family
$6,233,792
$6,170,000
Montauk
East Hampton Village East Hampton Amagansett
East Hampton - Single Family
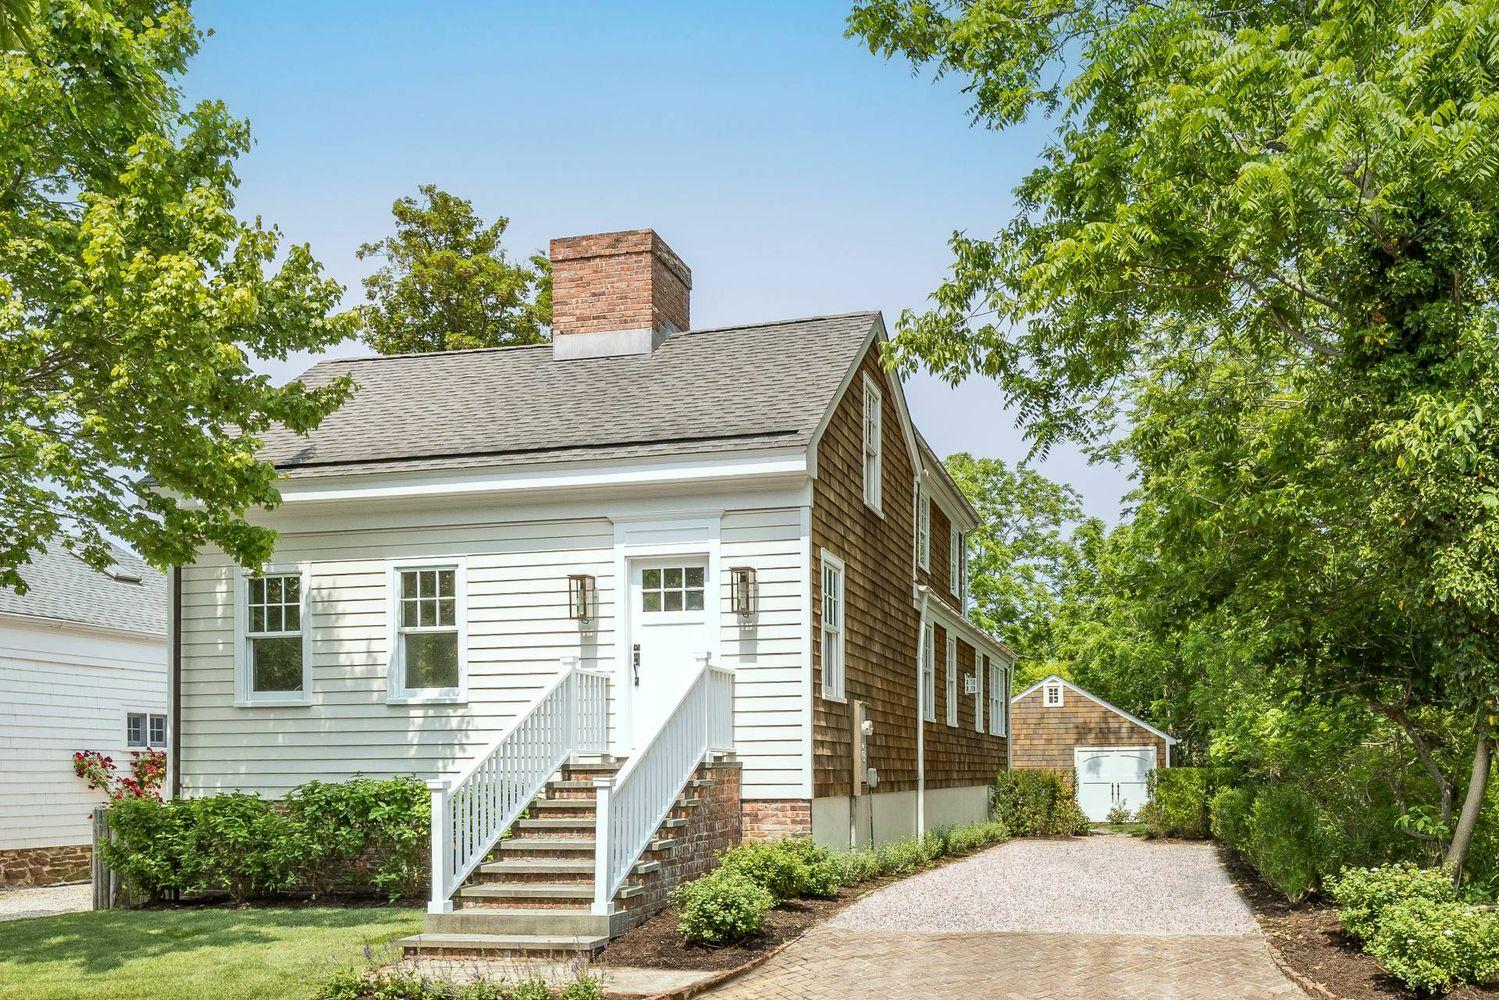
North Fork Market Summary
In the second quarter of 2025, the North Fork single-family market recorded 102 sales, a 9.7% decline from the same period last year. Still, total sales volume rose 5.1% to $134,840,492, as demand for quality homes at higher price points continued to drive market strength. The average sale price climbed 16.4% year-over-year to $1,321,966, and the median price increased 10.5% to $975,000, reflecting consistent upward pressure on pricing in a limited-inventory environment.
Sales activity varied across the region. While Southold and Cutchogue saw noticeable declines in transactions, down 37.9% and 27.8% respectively, several other areas posted strong gains. Mattituck recorded a 16.7% increase in sales and an 85.7% jump in volume, while Laurel saw a 300% surge in transactions. Aquebogue, East Marion, Orient, and Peconic also posted double volume growth, suggesting expanding buyer interest in less saturated markets.
On the pricing side, many towns outpaced the already-strong overall averages. Jamesport South Jamesport led the pack with a 76.9% increase in average price and a 62.1% rise in median. Mattituck’s average jumped 59.1%, and East Marion and Greenport followed with 21.2% and 28.4% gains in average price, respectively. Even in submarkets where transaction volume dipped, like Cutchogue, pricing strength held and average prices increased by 28%. Southold, however, bucked the broader trend, with both median and average prices declining year-over-year, down 6.3% and 6.8%, respectively, signaling a potential rebalancing in one of the region’s historically most active submarkets.
Overall, the data points to a market still adjusting: while fewer homes are trading hands, strong pricing across much of the North Fork reflects steady demand, especially for well-located or move-in-ready properties. As we head into the second half of the year, interest continues to shift east and upward in price point, as buyers pursue lifestyle, value, and long-term potential.
Managing Director – Joe Fuer
$975,000
North Fork - Single Family
TOTALS
ONE PLACE FOR HOME
The only platform designed to connect you and your agent through every phase of your real estate journey.
STEP INSIDE COMPASS ONE

North Fork
Aquebogue
Baiting Hollow
Cutchogue
East Marion
North Fork
Mattituck
Laurel
Jamesport & South Jamesport
Greenport
