Contents
Directors' Report
Financial statements and explanatory notes
Report of the Board of Statutory Auditors
Report of the Independent Auditors
Comer Industries S.p.A.
Registered Office and Administrative Offices: 42046 Reggiolo (RE) Italy - Via Magellano, 27 Reggio Emilia Business Register no. 07210440157
Approved share capital 18,487,338.60 euros entirely subscribed and paid-up

Tax Code 07210440157 - VAT code IT 01399270352
Art. 2497 bis of the Italian Civil Code - The company is subject to management and coordination activities
by Eagles Oak S.r.l., with registered offices in 41126 Modena, Via del Sagittario 5
Share Capital 2,000,000 euros entirely paid-up - Modena Business Register no. 03699500363
DIRECTORS’ REPORT FOR THE YEAR 2022
Financial Statements at December 31, 2022 1
Summary of the results of Comer Industries S.p.A.
(*) on December 31, 2021, the figure was adjusted by the item “Write-downs of receivables and other provisions for risks and charges” to make it uniform with December 31, 2022, in light of the new representation of that indicator.
Financial Statements at December 31, 2022 2
(mn euros) December 31, 2022 December 31, 2021 Change % SALES REVENUES 427.5 354.9 20.4% EBITDA 48.8 32.5 (*) 50.1% % of revenues 11.4% 9.1% Amortization, depreciation and write-downs (13.1) (13.6) (3.4%) EBIT 35.8 19.3 85.0% % of revenues 8.4% 5.4% NET PROFIT 38.0 15.9 139.5% % of revenues 8.9% 4.5% COMMERCIAL WORKING CAPITAL 77.4 46.5 % of revenues 18.1% 13.1% INVESTED CAPITAL 477.9 467.8 ROI [EBIT over Invested capital (%)] 7.5% 4.1% NET FINANCIAL POSITION (178.5) (193.5) TOTAL OPERATING CASH FLOW 18.0 31.5 CAPEX 11.3 11.5 % of revenues 2.6% 3.2% SHAREHOLDERS’ EQUITY 301.3 276.9 Net financial position / Equity 0.59 0.70 ROE [Net profit / Equity] 12.6% 5.7% EPS [Net profit / Number of shares] 1.33 0.55 AVERAGE NUMBER OF EMPLOYEES DURING THE PERIOD 955 877
1. SIGNIFICANT EVENTS IN THE 2022 FINANCIAL YEAR
The year 2022 was marked by geopolitical factors that increased the market volatility that began during the year 2021.
Inflation is a global phenomenon, brought about by supply chain disruptions and the impact of the RussiaUkraine conflict on the prices of food, energy and raw materials among others, with consequences for economies around the world. Please note that the Company has no significant exposures to the areas concerned by the conflict.
Demand has been particularly strong, especially in the Agriculture sector where the Group holds a leading position. This context has forced everyone to approach situations differently, to ask some new questions and to question the status quo in order to adapt to the new context.
Actions to integrate Comer Industries and Walterscheid Powertrain Group (“WPG Group”) began in 2022 and are still ongoing. The two companies have long histories – 50 years for Comer, 100 for Walterscheid – and, as a result, established traditions need to be merged into a common vision while respecting cultural differences.
On July 28, 2022 the deed of merger of the subsidiary WPG Holdco B.V. (non-operating parent company of the newly acquired WPG Group) into Comer Industries S.p.A. was signed, which had already been resolved by the Shareholders' Meeting of April 27, 2022. The transaction became effective as of August 2, 2022 after the merger deed was filed at the competent Reggio Emilia Business Register. This transaction resulted in the recognition of a merger deficit of 143.4 million euros allocated to the equity investments in WPG German Holdco Gmbh (for 93.2 million euros) and WPG US Holdco LLC (for 50.2 million euros), as commented on below.
On December 6, 2022, the Company Comer Industries S.p.A. acquired shares representing 100% of the share capital of Walterscheid Monguelfo S.p.A. owned by the subsidiary Powertrain Services UK Ltd at a price of 19 million euros in order to pursue the objective of integration and simplification of the entire Comer Industries Group after the acquisition of the WPG Group.
2. THE GLOBAL MACROECONOMIC SCENARIO AND THE REFERENCE MARKET
The year that just ended was a turbulent one. After the pandemic crisis, we were convinced that we were on the road to recovery, but the geopolitical crisis and the ensuing economic consequences further complicated the international scenario.
In a world in which the economic crisis linked to the COVID-19 pandemic is still being felt (particularly in China), the consequences of the war between Russia and Ukraine (first and foremost rising energy and commodity prices) and the relative uncertainty further impacted global economic activity.
Financial Statements at December 31, 2022 3
The table below provides the forecasts published by the Organization for Economic Co-operation and Development (OECD) 1 in its most recent Market Outlook from November 2022.
source: OECD Economic Outlook November 22, 2022.
In this specific economic context, for 2022 the OECD estimates a global Gross Domestic Product (GDP) growth rate declining by 2.8 p.p., against growth of 5.9% recorded in 2021.
One of the main factors in the global macroeconomic scenario is the price growth rate, which has not been this high for many decades in developed countries. The expected average inflation in OECD countries for 2022 is 9.4%, nearly six times the average of 1.6% seen in the 2013-2019 period. Inflation is weighing down on economic outlooks, as it corresponds to higher production costs for businesses and a reduction in real income for households, and because it forces central banks to enact restrictive monetary policies, thus slowing down economic activity, in order to pursue their statutory monetary policy objectives. The global economy will need to face 2023 in a context in which growth has lost steam, with persistent high inflation, weaker confidence and high uncertainty.
1 OECD Economic Outlook November 22, 2022
Financial Statements at December 31, 2022 4
Average 2013-2019 2021 2022 2023 2024 Per cent Real GDP growth World 3.4 5.9 3.1 2.2 2.7 G20 3.5 6.2 3.0 2.2 2.7 OECD 2.2 5.6 2.8 0.8 1.4 United States 2.4 5.9 1.8 0.5 1.0 Euro area 1.9 5.3 3.3 0.5 1.4 Japan 0.8 1.6 1.6 1.8 0.9 Non-OECD 4.4 6.2 3.4 3.3 3.8 China 6.8 8.1 3.3 4.6 India 6.8 8.7 6.6 5.7 6.9 Brazil -0.4 4.9 2.8 1.2 1.4 OECD unemployment rate 6.5 6.2 5.0 5.3 5.5 Inflation G20 3.0 3.9 8.1 6.0 5.4 OECD 1.6 3.8 9.4 6.5 5.1 United States 1.4 4.0 6.2 3.5 2.6 Euro area 0.9 2.6 8.3 6.8 3.4 Japan 0.9 -0.2 2.3 2.0 1.7
Source: OECD Global activity indicator November 2022 Source: OECD Consumer Confidence November 2022
On these bases, for 2023 the OECD estimates that global GDP growth will reach 2.2%, slowing compared to the 3.1% estimated for the year that just ended.
Source: OECD Global GDP growth November 2022
Annual inflation is expected to decline in OECD economies, from 9.4% in 2022 to 6.5% in 2023. However, across many economies consumer price inflation will remain higher for longer than previously expected, despite a broader and more rapid tightening of monetary policy in most of the world and the gradual easing of some supply chain bottlenecks. This reflects in part the war in Ukraine, especially in Europe, where the implications of sharp increases in the price of imported natural gas in 2022 will continue to be felt in 2023 as well. However, with official interest rates generally rising in 2023 and energy price inflation slowing, inflation is expected to decline and will move closer to central bank targets in 2024. On the other hand, price pressures should relax considerably in 2023 in the United States, Canada, Australia and South Korea and remain moderate in Japan.
However, economic outlooks for 2023 will be uneven across the individual major economies.
• North America
In the United States, real wages have fallen and the tighter monetary policy has driven interest rates upwards for all maturities, weakening investments, especially in the real estate market. Rising interest rates have also strengthened the dollar, which has in turn slowed exports. GDP growth should slow from 1.8% in 2022 to 0.5% in 2023. Slower growth will attenuate job market tensions, weakening demand-pull inflationary pressures, and an easing of supply chain disruptions will allow inflationary pressures to gradually dissipate. Core inflation is expected to return close to the Federal Reserve’s 2% target towards the end of 2024, allowing for a certain relaxation of monetary policy.
Financial Statements at December 31, 2022 5
-5 0 5 10 15 20 25 30 35 Retail sales Industrial production Trade 94 95 96 97 98 99 100 101 102 103 OECD United States Euro area 2,8% -3,2% 5,9% 3,1% 2,2% 2,7% -4% -2% 0% 2% 4% 6% 8% 2019 2020 2021 2022 2023 2024 November 2022 projection
The Canadian economy is subject to many of the same forces and it is expected to have a similar inflation and growth profile.
• Europe
Growth in Europe is slowing sharply at the end of 2022 due to the war in Ukraine and weak external demand, with production expected to fall in many countries during the winter. Held back by high energy and food prices, low household and business confidence, continuous supply-side bottlenecks and the initial impact of a more restrictive monetary policy, annual growth in the Eurozone should reach 0.5% in 2023, after marking 3.3% in 2022. The implementation of Next Generation EU should however support investments over the coming years. Modest growth in demand will contribute towards moderating inflation, but tense job markets and the expectation that high wholesale energy prices will continue to drive retail prices in 2023 will result in a gradual reduction in inflation.
• Asia
In China, waves of recurring lock-downs enacted due to the Zero-COVID policy of the government in Beijing interrupted economic activity in 2022. With weaker real estate investments that continue to be a significant obstacle for the recovery, growth will be supported in 2023 by infrastructure investments and other economic measures taken by the government to moderate the correction in the real estate sector. After reaching just 3.3% in 2022, GDP growth should rise to 4.6% in 2023. However, China will still be far from the average growth rates of 6.8% seen in the 2013-2019 period. Consumer price inflation should remain moderate, supported by the energy and food price management policies enacted by the government.
In Japan, growth is expected to remain higher than its potential, albeit gradually slowing. Higher energy prices have hindered growth in the real income of households and undermined business confidence and investments, and a loss of economic steam for its main trade partners is holding back export growth. GDP growth should reach 1.8% in 2023 from 1.6% in 2022.
In India, growth is forecast to fall from 6.6% in the current fiscal year to 5.7% in 2023 before rebounding to 6.9% in fiscal year 2024, substantially aligned with the pre-pandemic trend.
• Brazil and Emerging countries
Brazil’s expected GDP growth is 2.8% in 2022 and 1.2% in 2023. Household consumption, private investments and exports will continue to be the main drivers of growth, although export growth is expected to slow in 2023. Inflation is forecast to decline as the effects of rising energy and food prices diminish.
Expectations for the other main emerging market economies, which are more resilient to global headwinds, are relatively positive for the coming year and will see only a modest and short-term increase over inflation targets.
Financial Statements at December 31, 2022 6
Lastly, job market conditions are generally remaining tight. Wage increases have not kept pace with price inflation, weakening real incomes despite the actions taken by governments to alleviate the impact of food and energy price increases for households and businesses, which have seen their buying power erode significantly. The OECD expects the unemployment rate to increase to around 5.5%, roughly 0.5 percentage points higher than the low recorded in mid-2022.
Source: OECD Inflation November 2022
Main Risks of 2023
• Increase in energy prices
European economies are continuing to deal with significant challenges due to ongoing and planned embargoes on Russian coal and oil imports via sea and the decrease in gas supplies from Russia to the European market. A key risk relating to the projections is that the associated increase in energy prices may turn out to be much more disruptive and persistent than what has been assumed.
• Tightening of monetary policy
There are increasing risks that the rapid rise in interest rates, more rigid global financial conditions and significant asset repricing may expose longstanding financial vulnerabilities in developed and emerging economies alike. Rising costs for debt servicing in the private sector and lower bond market liquidity are key risks in developed economies.
Source: OECD Policy interest rate November 2022
• Financial vulnerabilities in emerging market economies
Stricter financial conditions, rising debt, the strong appreciation of the US dollar and slower export market growth are exacerbating vulnerabilities in emerging market economies. Risk premiums have risen, capital
Financial Statements at December 31, 2022 7
9,4% 6,5% 5,1% 0,00% 2,00% 4,00% 6,00% 8,00% 10,00% 12,00% '22 '23 '24 OECD -2 0 2 4 6 2020 2021 2022 2023 2024 United States Euro area Japan
outflows have accelerated and international reserves have declined in many countries. In China, the resurgence of COVID-19 outbreaks or contagion from financial fragility in the real estate sector, considerably indebted with respect to the rest of the economy, could translate into a more significant slowdown in growth than expected. Various economies in the emerging and developing markets are also facing food security risks due to high food, energy and fertilizer costs and supply shortages.
Reference market
Agricultural sector
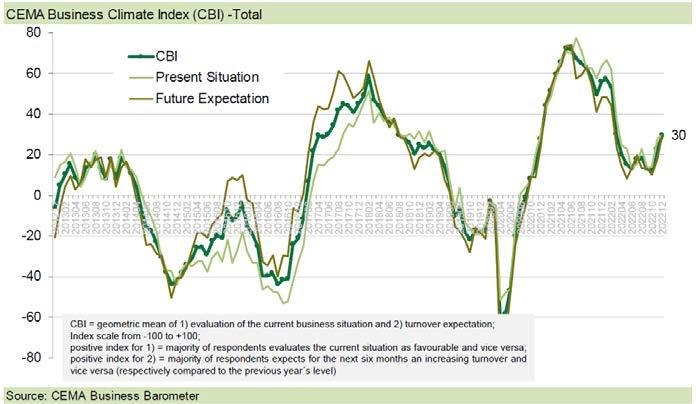
The general economic climate index for the agricultural machines industry in Europe (CEMA December business climate index) closed 2022 at +30 (on a scale of -100 to +100), showing a significant upward trend after the sharp drops recorded in the first part of 2022, particularly penalized by the onset of the Russia-Ukraine conflict.
As regards expectations for 2023, although the initial indications from January are consolidating year-end values, confirming the ongoing recovery, European industry representatives remain cautious with regard to future outlooks. 45% of survey participants expect stable turnover in the first six months of 2023, while as regards orders - for the same period - 48% expect a level equal to that of the same period of the previous year, as current stocks of new and used machinery retailers remain low throughout Europe and could still be below optimal levels in certain markets.
In the US market, the data published by AEM (Association of Equipment Manufacturers) in December 2022 relating to 2021 saw a 14.8% contraction in the overall market in terms of units sold compared to 2021. Within the tractor range, those with 100+ HP 2 are the only ones with positive performance, up 11.3% year on year. The production of combine harvesters also recorded growth, of 15.8% in 2022 over 2021.
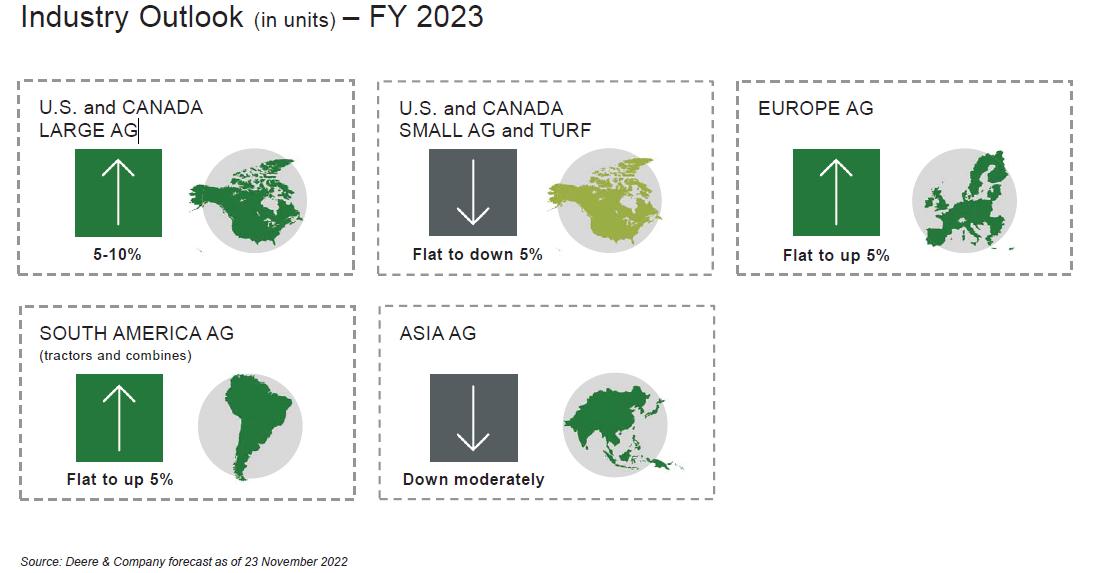
The forecasts for 2023 published in November by John Deere, one of the main agricultural machinery manufacturers in the world along with CNH Industrial and AGCO, depict a North American market running at two speeds in 2023: growth between 5% and 10% for the Large Agriculture segment, and no change or a slight
Financial Statements at December 31, 2022 8
2 Tractors with over 100 horsepower
decline of 5% for Small Agriculture. As far as Europe and South America are concerned, the market is expected to remain stable or record slight growth of around 5%. On the other hand, the Asian market is forecast to contract slightly in 2023 compared to the year just ended.
Industrial sector and wind power
The industrial sector was characterized by concerns in the course of 2022 regarding a global recession triggered by geopolitical tensions and surging input prices in the first part of the year, while there was a gradual recovery in the final months. Roughly half of the participants in the December 2022 CECE (Committee for the European Construction Equipment) Business Barometer expect there to be an increase in earth-moving machine sales in 2023 of between 3% and 10% compared to 2022, driven by demand in North American, Latin American and Middle Eastern countries.
Uncertainties are significant as a result of the macroeconomic scenario for 2023, particularly for residential and non-residential building, due to higher interest rates and fears of a recession, which point to a significant slowdown in construction investments in the coming year. Investments in homes benefited from the availability of low-cost mortgages and the accumulation of savings during the pandemic. However, rising interest rates, the higher cost to build and lower real incomes should reduce the financial accessibility of and lower demand for private dwellings. These negative effects may be offset by the support flowing from the Next Generation EU program, the drive towards “green” energy-saving construction and the gradual reduction of the backlog accumulated in 2022.
Overall, the CECE macroeconomic bulletin published in November 2022 expects a slowdown in construction investment growth from 5.1% in 2021 to 2.8% in 2022, followed by a significant decline of 0.1% in 2023.
Financial Statements at December 31, 2022 9
(
Lastly, as regards the wind sector, after a record year of new offshore installations installed (in terms of megawatts) in 2021, 2022 saw a sharp deceleration, primarily due to the economic slowdown. Medium/longterm growth outlooks remain positive, driven by the need to increase recourse to sustainable energy sources to combat climate change; although the sector is significantly influenced by environmental policies and the relative regulations which could slow its growth.
3. COMMENTS ON KEY PERFORMANCE INDICATORS
Comer Industries S.p.A. monitors its performance using various indicators that may not be comparable to similar measurements adopted by other groups. Company Management considers that these indicators provide a comparable measurement of the results on the basis of standardized performance factors, facilitating the identification of operating trends and allowing management to take action also during the year with swift corrective actions whenever necessary.
3.1. DEFINITION OF THE INDICATORS.
The performance indicators used by the Company and disclosed in this report are based on the following definitions, which are reviewed every year, with the resulting restatement of comparative data:
“Capex”: indicates, for each Reference Period, the increase occurring in investments in tangible and intangible fixed assets (net of revaluations, capital grants and the effects of currency conversion) which, following International Accounting Standards, are recorded in the corresponding heading in the balance sheet, reduced by disinvestments and excluding the equity effects of (i) internal capitalizations of costs for internally generated development activities, (ii) the impacts related to the application of IFRS 16.
“Commercial Working Capital”: indicates the algebraic sum of the following items:
(+) non-current and current assets:
Inventories;
Trade Receivables;
(-) non-current and current liabilities: Trade payables.
“Invested Capital”: indicates the algebraic sum of the following items:
(+) Commercial working capital;
(+) Tangible (including Rights of use), intangible and financial fixed assets;
(+) Tax and deferred tax assets, current tax assets;
(+) Other short and long-term receivables, of a non-financial nature;
(
- ) Other short and long-term payables, of a non-financial nature;
(+) Current and deferred tax liabilities;
- ) Severance Indemnity Fund (TFR) and provisions for liabilities and charges.
“Cash Conversion rate”: is the ratio of operating cash flow to EBITDA
Financial Statements at December 31, 2022 10
“EBITDA”: represents the value of Operating Profit (EBIT) adjusted by the amount of the following entries:
(+) Amortization, depreciation and other write-downs of fixed assets, in particular:
• amortization of intangible fixed assets;
• depreciation of tangible fixed assets;
• other write-downs of fixed assets;
“EBIT”: is the Operating Profit in the income statement.
“EPS (Earning per share)”: Net profit, as defined below, on total number of shares outstanding at the date of approval of the financial statements.
“Cash flow from operations”: Cash flow from operating activities - Net cash flow from investing activities (excluding IFRS 16 impacts).
"Net Financial Position": indicates the net financial position calculate as the difference between cash and cash equivalents and debt of a financial nature as follows:
(+) non-current and current assets (A):
• Other short-term financial receivables
• Marketable securities at fair value
• Cash and cash equivalents
(-) non-current and current liabilities (B):
• Long-term loans
• Long-term derivative financial instruments
• Short-term loans
• Short-term derivative financial instruments
• Other short- and long-term financial payables (including payables relating to lease contracts recognized in accordance with IFRS 16)
• Non-current trade payables
Net Financial Position.
The net financial position, as represented, achieved the same results that would have been obtained according to the recommendations set forth in warning notice no. 5/21 of April 29, 2021 issued by Consob, which makes reference to ESMA Guidelines 32-382-1138 of March 4, 2021.
Financial Statements at December 31, 2022 11
“Equity”: indicates the algebraic sum of share capital, statutory reserves, profits/losses and other similar reserves corresponding to the total of the “Share capital and reserves” heading.
“Average staff in the year”: simple average on the basis of the workforce employed by the Company, including outsourced workers.
“ROE (Return on equity)”: ratio between Net profit and Equity.
“ROI (Return on investment)”: ratio between EBIT and Invested capital.
"Net profit": indicates the result of the income statement.
The Company prepares the income statement according to the nature of costs and the cash flow statement with the indirect method.
3.2. COMMENTS ON THE INDICATORS.
Revenues of Comer Industries S.p.A. stand at 427.5 million euros, up by 20.4% compared with the previous year (354.9 million euros). This result was achieved thanks to an increase in demand and a price effect in the markets in which the Company operates. In this context, at geographical level, the increase was seen with roughly the same percentage growth both outside national borders and particularly in Europe and North America, as well as within the country.
In line with the previous year and thanks to the consolidation of the Walterscheid brands, agriculture continues to be the driving sector, closing the year with +27.7%. The industrial sector instead closed the year at +4.3% over the prior year.
The Company has demonstrated its ability to fully seize market opportunities in addition to benefiting from the consolidation of the new brand acquired at the end of the previous year.
EBITDA came to 48.8 million euros, equal to 11.4% of revenues from 2022, up compared to last year in absolute value (+50.1%) as well as in percentage terms on revenue (11.4% compared to 9.1% in 2021). This result is primarily due to continuous process improvements and efficiency projects at production sites.
The net financial position showed a negative balance of 178.5 million euros, marking an improvement of 15.0 million euros compared to December 31, 2021. The balance included 73.4 million euros in liquidity and 56.6 million euros in current financial receivables from the WPG Group, offset by 237.4 million euros in short and medium/long-term financial payables to credit institutions (net of up-front commissions) and 50.3 million euros in financial payables to subsidiaries.
Comer Industries S.p.A. generated cash from operating activities for 30.6 million euros and was able to distribute dividends of 14.3 million euros. In a year marked by tensions throughout the supply chain and particularly sustained demand, the Company chose to protect relationships with key suppliers by significantly reducing payment terms compared to the previous year.
Net profit amounted to 38.0 million euros (equal to 8.9% of revenues, 4.5% in 2021), benefiting from dividend income from subsidiary companies equal to 12.5 million euros (2.7 million euros in 2021).
Financial Statements at December 31, 2022 12
ROE, calculated on net profit, stands at 12.6% compared to 5.7% in the previous year and benefited from the growth in operating income. Earnings per share stand at 1.33 euros per share (0.55 per share in 2021).
4. INVESTMENTS
During the year, Comer Industries S.p.A. invested 11.3 million euros in tangible and intangible fixed assets, excluding internal capitalizations and the impact of the IFRS 16 accounting standard. The ROI was 7.5% (4.1% in 2021).
During the year 2022, two new horizontal machining centers dedicated to the flow of cast iron and a gear cutting machining center went into operation at the Italian plant in Reggiolo.
Also as part of the long-term plan for renewal and upgrading of the machine inventory, two additional horizontal machining centers for the cast iron flow and a new robotic cell for the gear machining flow were purchased. The latter is equipped with an anthropomorphic robot and with a numerical control gear cutting machine which does not use lubricants for gear cutting, confirming the choice of environmentally friendly technologies for steel processing. These last assets will enter operation in the second quarter of 2023. Further investments were also made in Industry 4.0 to optimize production processes and logistics flows at the assembly and painting plant. Specifically, a new semi-automatic assembly line equipped with cyber-physical systems went into operation and new vertical automated warehouses were purchased that are fully interconnected to factory logistics systems. From the green and sustainable perspective, an investment was also made for the acquisition and installation of electric vehicle charging stations.
5. RESEARCH AND DEVELOPMENT
In 2022, the Company significantly increased its new product and service research and development capacities. In particular, for the agricultural market, a new hay baler axle was launched in the market with a capacity of up to 5 tons as was a new generation drive shaft - born from the collaboration between Walterscheid and Comer Industries - with a static load capacity increased by 15% and a maximum length of use increased by 20%, and the project was also defined for a new front axle for tractors with power of up to 120 kW. In the industrial sector, on the other hand, it is necessary to note the completion of a new transmission for electric drive axles with power up to 45 kW and the launch in the market of the new 17C size of Mechanics industrial shafts for torques up to 120,000 Nm. Lastly, in the Group product digitalization field, a new smartphone app was launched in the market, which makes it possible to monitor the use of agricultural shafts equipped with completely internally developed sensors in real time.
The Comer Industries Group’s advanced systems were developed at design offices located in Italy, Germany and the United States, which are later validated and approved in four different specialized validation centers located in Reggiolo and Welsberg-Monguelfo in Italy, Lohmar in Germany and Rockford in the United States.
Financial Statements at December 31, 2022 13
6. SOCIAL RESPONSIBILITY
For a few years now, when we speak of sustainability, we are referring to a concept that embraces a number of areas of intervention which companies are asked to approach in a proactive and immediate manner. Education, Community, Innovation, Sports and Culture are the key words underlying the social responsibility of Comer Industries: all areas with one single common denominator: people. In line with the United Nations Sustainable Development Goals, the concrete commitment of Comer Industries begins from an awareness of having significant responsibility to the environment and society. The area in which the company operates and the communities of which it is a member are the point of departure of initiatives, programs, support activities and partnerships linked to the creation of value for ourselves and for future generations. Aware that only starting from our roots can we continue to grow, the Comer Industries Group invests first and foremost in the enhancement of resources in its local area to foster economic, social and cultural development. One example of this is Palazzo Sartoretti in Reggiolo, the headquarters of the Municipal Administration, and the adjacent park, which today is a meeting place for different activities and expressive languages that have given rise to veritable workshops, thanks to a partnership between Comer Industries, the Municipality of Reggiolo, the Reggio Children Foundation and the Lower Reggiana Services Company: a 360-degree educational course for children and adults, founded with a view to investigating mechanics and gear-related topics, while welcoming a number of other associated languages (graphic, digital, etc.) that are blended together in laboratories and embrace a number of aspects of both education and experimentation. The projects linked to education and training in which the company believes go beyond the places in which Comer Industries is rooted, as can be seen from its now long-term collaborations with the “Namaste, Onore a te” volunteer organization thanks to which the company provides concrete support to the community of Bangalore, India, covering the cost of food, lodging, university expenses and all resources necessary for several deserving female students to cultivate their talents and become nurses. It is also involved in a number of collaborations with Italian and international universities, with projects that join a dual objective, educational and also social, like "ÜFA", the training company established for the first time in August 1985 at the registered office of Walterscheid - Lohmar, characterized by a real flow of money and goods; unlike normal companies which operate only for economic purposes, the profit generated at the end of the business year is donated to a local social project. Thanks to the ÜFA project, the young people have the opportunity to take on personal accountability much more rapidly and to transfer training content into real life. The company’s commitment to sustainability also includes support for projects that bring with them a real culture of innovation: the participation of Comer Industries in the Le Village by Crédit Agricole project in Parma, the first Benefit Corporation of the Crédit Agricole Italia Group, as well as one of the first European innovation hubs to obtain that recognition, and the development of the DeepTier platform in partnership with Iungo and Gellify, go in this direction. Le Village is an incubator that fosters knowledge and interaction between start-ups and financial and industrial businesses of the region, and offers opportunities for mutual development and exchange. DeepTier is a model of a fintech platform that offers support to the entire supply chain, from supply chain managers to sub-suppliers, both local and foreign, allowing all players in the chain to access different forms of advances and financing from financial institutions quickly and at advantageous conditions. In the sports realm, incentivizing employees to spend their free time in a healthy manner is the objective underlying the two partnerships engaged in by Comer Industries with Padel Club of Reggiolo and the Carpi Sessantallora amateur sports association, which
Financial Statements at December 31, 2022 14
promotes a number of activities in the areas of cycling, mountain biking and triathlons. Sustainability also means preserving the landscape, artistic and cultural beauty of our country, which is why Comer Industries has for years now supported the Italian Environmental Fund (FAI) by participating in the Corporate Golden Donor membership program.
For Comer Industries, sustainability is a key factor for the creation of long-term value and is an increasingly integral part of its way of doing business.
7. ENVIRONMENT AND SAFETY
Within a dynamic context characterized by rapid changes in production structures following the acquisition of Walterscheid, the Company has maintained high standards in the protection of occupational health and safety. In the course of 2022, a total of 29 injuries were recorded (31 in 2021), with the frequency indicator coming to 4.04, against more than 1,436,000 hours worked. Against an uncertain, albeit improving, health scenario for the majority of the year, the Company continued to apply the Company Protocol to combat the spread of the COVID-19 virus, carefully reviewing it on the basis of the evolution of the context and governmental provisions and always guaranteeing a safe environment to all workers.
In terms of the commitment to the well-being of its people, the company policy on smart working was consolidated, and became structural after the emergency phase with significant benefits in terms of work-life balance and commuting. In parallel, a risk assessment was performed on human rights, involving the internal offices as well as the supply chain, laying the bases for the subsequent definition and dissemination of an Integrated Human Rights Policy, which was also published on the company website.
In continuity with the process already initiated in prior years, the Company began to develop a roadmap on a two-year horizon for the integration of the Occupational Health and Safety Management System according to the ISO 45001:2018 standard in all locations in the new scope, guaranteeing uniform management of all aspects linked to health and safety.
The Company’s commitment to environmental sustainability was developed over the course of the year with various projects promoting energy efficiency and a lower environmental impact. In particular, the machinery renewal program continued, with the introduction of high energy efficiency processing units with lower lubricant consumption. At the same time, in order to optimize energy consumption, the Company benefited from the digital monitoring systems installed in previous years, allowing for the real-time analysis of trends and peaks and taking prompt corrective actions when necessary. These actions allowed for energy savings in excess of 15% in the Comer Industries scope. Furthermore, in the course of 2022 the Company significantly increased its share of electricity deriving from renewable sources to fuel its processes, extending the procurement of green energy to the Reggiolo and Pegognaga facilities.
In 2022, the Company contributed to the development of sustainable mobility by including hybrid and electric models in the company fleet and developing products intended for electric vehicles, which are innovative in
Financial Statements at December 31, 2022 15
terms of reducing weight, lubrication and noise. Furthermore, within the company areas were set up with dual charging stations for electric vehicles.
No critical issues have emerged during the year with relation to the environment.
Financial Statements at December 31, 2022 16
8. INTERGROUP RELATIONS AND DEALINGS WITH RELATED PARTIES
Comer Industries S.p.A. has dealings with subsidiaries and other related parties at market conditions considered as normal in the respective reference market, taking account of the characteristics of the assets and the services provided. Transactions between Comer Industries S.p.A. and its subsidiaries, in compliance with IAS 24, are disclosed below:
Financial Statements at December 31, 2022 17
Company (thousand euros) Sales of goods and services Purchase and other operating costs Financial income Financial charges Royalties Dividends Comer Industries Components 4,723 73,410 39 0 0 1,900 Comer Industries Inc 78,579 (10) 0 49 0 3,358 Comer Industries (Shaoxing) Co. Ltd. 0 5,558 0 0 0 6,916 Comer Industries (Jiaxing) Co. Ltd. 1,994 29,243 0 163 6,048 0 Comer Industries UK Ltd 2,951 253 0 0 0 295 Comer Industries GmbH 0 0 0 0 0 0 Comer Industries Sarl 0 0 0 0 0 0 Comer Industries India Pvt Ltd 721 728 0 0 886 0 Comer Industries do Brasil EIRELI 2,292 107 0 0 0 0 WPG German Holdco GmbH 0 0 2,095 0 0 0 WPG US Holdco LLC. 0 0 4,383 0 0 0 WPG UK Holdco Ltd. 0 0 194 0 0 0 WPG Monguelfo 0 36 0 0 0 0 Walterscheid Gmbh 95 0 0 0 0 0 Powertrain Rockford Inc 28 0 0 0 0 0 Walterscheid Getriebe GMBH 12 0 0 0 0 0 Walterscheid Inc. Woodridge 28 0 0 0 0 0 Total 91,424 109,326 6,711 212 6,934 12,469 Company (thousand euros) Trade Receivables Trade Payables Other Receivable s Other Payable s Financial Receivables Financial Payables Comer Industries Components 1,760 7,213 0 0 6,100 0 Comer Industries Inc 21,389 124 0 0 0 7,008 Comer Industries (Shaoxing) Co. Ltd. 0 1,228 0 0 0 0 Comer Industries (Jiaxing) Co. Ltd. 1,958 15,423 0 0 0 8,267 Comer Industries UK Ltd 556 37 0 0 0 0 Comer Industries GmbH 0 100 0 0 0 0 Comer Industries Sarl 0 0 0 0 0 0 Comer Industries India Pvt Ltd 1,018 465 4 0 0 0 Comer Industries do Brasil EIRELI 672 25 0 0 0 0 WPG German Holdco GmbH 0 0 0 0 40,365 10,973 WPG US Holdco LLC. 0 0 0 0 93,471 6,020 WPG UK Holdco Ltd. 0 0 0 0 19,270 0 WPG Monguelfo 28 23 0 0 0 0 Walterscheid Gmbh 110 8 0 0 0 0 Off-Highway Pow. Service Franc 2 0 0 0 0 0 Walterscheid Cardan GmbH 1 0 0 0 0 0 Off-Highway Powertrain Service 2 0 0 0 0 0 Powertrain Rockford Inc 4 0 0 0 0 0 Powetrain Services Uk Ltd 0 0 0 0 0 18,000 Walterscheid Getriebe GMBH 13 0 0 0 0 0 Walterscheid Inc. Woodridge 28 0 0 0 0 0 Total 27,541 24,645 4 0 159,206 50,269
The “Financial income” and “Financial charges” headings refer to interest accruing in the period on intra-group loans. At December 31, 2022 the following intra-group loans were outstanding:
• Loan in favor of Comer Industries S.p.A. from Comer Industries (Jiaxing) Co. Ltd. for 8.0 million euros;
• Loan to Comer Industries S.p.A. from WPG German Holdco Gmbh for 10.9 million euros (deriving from the merger by incorporation of WPG Holdco BV);
• Loan to Comer Industries S.p.A. from Powertrain Services UK for 18 million euros (deriving from the sale of the equity investment of the subsidiary Walterscheid Monguelfo S.p.A.);
• Loan to WPG German Holdco Gmbh from Comer Industries S.p.A. for 39.8 million euros;
• Loan to WPG US Holdco LLC. from Comer Industries S.p.A. for 91.8 million euros;
• Loan to WPG UK Holdco Ltd from Comer Industries S.p.A. for 18.2 million euros (deriving from the merger by incorporation of WPG Holdco BV);
• Loan to Comer Industries Components S.r.l. for 6.1 million euros.
Dealings with parent companies
Comer Industries S.p.A. does not have commercial dealings with the majority shareholder, Eagles Oak S.r.l.
Relations with other related parties
It is disclosed that the “Other operating costs” heading includes professional consultancy provided by two Directors of the parent company Comer Industries S.p.A. for non-significant amounts.
9. THE COMPANIES IN THE GROUP
At December 31, 2022, the Comer Industries Group is organized in a structure with Comer Industries S.p.A. at the top, possessing directly or indirectly 100% of 26 Italian and foreign subsidiaries that constitute the scope of consolidation.
The key figures of the consolidated subsidiary companies are summarized in the table below:
Financial Statements at December 31, 2022 18
Financial Statements at December 31, 2022
Statement of changes in equity
28
(thousand euros) Share capital Share Premium Reserve Stock grant reserve Legal reserve Extraord. reserve F.T.A. reserve Exchange gains reserve Others Profit (loss) for the year Total equity Equity at January 01, 2021 13,109 27,944 5,987 2,622 39,624 336 2 (172) 14,399 103,851 Profit/(Loss) for the period - 15,884 15,884 Components of the comprehensive profit/(loss): IAS 19.93AActuarial gains - (126) (126) Components of the comprehensive profit/(loss): Change in CFH reserve -Subtotal: Res of comprehensive income/(loss) statement - - - - - - - (126) 15,884 15,757 Distribution of dividends (10,205) (10,205) Allocation of 2020 profit 14,402 (2) (14,399)Capital increase from acquisition of equity investments 5,139 5,139 Capital increase resulting from the exercise of warrants 239 239 Share premium reserves from exercise of warrants 2,151 2,151 Share premium reserves from acquisition of equity investments 157,787 157,787 Notional stock grant cost 2,194 - 2,194 Equity at December 31, 2021 18,487 187,881 8,181 2,622 43,821 336 - (298) 15,884 276,913 Profit/(Loss) for the period - 38,044 38,044 Components of the comprehensive profit/(loss): IAS 19.93AActuarial gains - 726 726 Components of the comprehensive profit/(loss): Change in CFH reserve -Subtotal: Res of comprehensive income/(loss) statement - - - - - - - 726 38,044 38,770 Distribution of dividends (14,339) (14,339) Allocation of 2021 profit 794 15,090 - (15,884)Equity at December 31, 2022 18,487 187,881 8,181 3,416 44,571 336 - 427 38,044 301,344
Other reserves
1. GENERAL INFORMATION
Comer Industries S.p.A. is an Italian company, with administrative and registered offices in Via Magellano 27 in Reggiolo (RE), Tax code and registration in the Business Register at no. 07210440157 with approved share capital of 18,487,338.60 euros entirely subscribed and paid-up at December 31, 2021. At the date of approval of these financial statements the share capital amounts to 18,487,338.60 euros subdivided into 28,678,090 shares.
The Company designs and produces advanced engineering systems and mechatronics solutions for power transmissions, supplied to important global manufacturers of agricultural and industrial machinery. Comer Industries S.p.A. is structured into three operating units specialized by product families spread over the provinces of Reggio Emilia, Modena and Mantua. For information on the Group’s operations, please refer to the “Directors' Report” presented along with the Consolidated financial statements.
In accordance with art. 2497 bis of the Italian Civil Code, Comer Industries S.p.A. is subject to management and coordination by Eagles Oak S.r.l. with headquarters in Modena, Viale del Sagittario 5, Share Capital of 2,000,000 euros entirely paid-up, Tax Code and business register no. 03699500363, which has control over it, as holder of the absolute majority of its shares.
The Company also prepares the Group’s Consolidated financial statements on the basis of legal requirements.
During the year, the business was run normally, and no events took place that significantly modified operating performance which would require applying any exemptions to IFRS.
The financial statements as at December 31, 2022, drafted on a going concern basis, with respect to which there are no aspects of uncertainty, were approved by the Board of Directors on March 21, 2023.
At the date of approval of these financial statements the share capital amounts to 18,487,338.60 euros subdivided into 28,678,090 shares.
Financial Statements at December 31, 2022 29
2. ACCOUNTING STANDARDS ADOPTED
2.1. DECLARATION OF COMPLIANCE WITH IFRS
The financial statements of Comer Industries S.p.A. have been drawn up in compliance with the International Financial Reporting Standards (IFRS), issued by the International Accounting Standards Board (“IASB”) and approved by the European Union and in force at the balance sheet date. The notes to the financial statements have been integrated, on a voluntary basis, with the additional information required by Consob and by the provisions issued by it in implementation of art. 9 of Italian Leg. Dec. 38/2005 (resolutions 15519 and 15520) of July 27, 2006 and the DEM/6064293 communication of July 28, 2006, pursuant to art. 78 of the Issuers’ Regulations, the EC document of November 2003 and, where applicable, the Italian Civil Code. “IFRS” also refers to the International Accounting Standards (“IAS”) still in force, as well as all the interpretive documents issued by the IFRS Interpretation Committee, previously called the International Financial Reporting Interpretations Committee (“IFRIC”) and before that, the Standing Interpretations Committee (“SIC”).
2.2. CONTENTS AND FORM OF THE FINANCIAL STATEMENTS
The unit of currency used is the euro, and all values are expressed in thousands of euros unless otherwise indicated.
The presentation layout for the balance sheet makes a distinction between current and non-current assets and liabilities, in which:
• non-current assets include balances of assets realizable after more than one year and include intangible, tangible and financial assets and deferred tax assets;
• current assets include the balances of assets realizable within 1 year;
• non-current liabilities include payables falling due after more than 1 year, including financial debts, provisions for liabilities and charges and liabilities for employee benefits and deferred tax liabilities;
• current liabilities include payables falling due within 1 year, including the short-term portion of medium-long-term loans and of provisions for liabilities and charges and liabilities for employee benefits.
The income statement is presented according to a “costs by nature” classification.
The cash flow statement has been drawn up on the basis of the indirect method and is presented in compliance with IAS 7, classifying cash flows between operating, investment and financing activities.
2.3. RELEVANT ACCOUNTING STANDARDS
For the preparation of the financial statements, Comer Industries S.p.A. adopted International Accounting Standards and International Financial Reporting Standards as of 2018, with the transition date to IFRS effective January 1, 2017.
The financial statements as at December 31, 2022 were therefore drawn up according to the IAS / IFRS adopted by the European Union.
The financial statements are presented in thousands of euros and are prepared on a cost basis, except for financial instruments that are measured at fair value.
The preparation of the financial statements in accordance with IFRS (International Financial Reporting Standards) requires judgments, estimates and assumptions that have an effect on the assets, liabilities, income and expenses. The actual results may differ from the results obtained using these estimates.
Financial Statements at December 31, 2022 30
2.4. TREATMENT OF FOREIGN CURRENCY TRANSACTIONS
The functional and presentation currency of Comer Industries S.p.A. is the euro. Transactions in foreign currencies are converted into euros on the basis of the exchange rate at the transaction date. The monetary assets and liabilities are converted at the exchange rate on the balance sheet date. Any exchange rate differences arising out of conversion are recognized in the income statement. Non-monetary assets and liabilities measured at historical cost are converted at the exchange rate at the transaction date. The monetary assets and liabilities measured under fair value are converted into euros at the exchange rate on the date the fair value was determined.
2.5. PROPERTY, PLANT AND EQUIPMENT
(i) Owned fixed assets
Property, plant and equipment are measured at historical cost and are reported net of depreciation (see next point (iv)) and impairment losses (see para. 2.8). The cost of fixed assets manufactured internally includes materials, direct labor and a share of indirect manufacturing costs. The cost of fixed assets, whether purchased externally or manufactured internally, includes incidental costs directly chargeable and necessary to operate the asset and, when relevant and subject to contractual obligations, the current value of the estimated cost for the dismantling and removal of fixed assets. Financial charges relating to specific loans used for the acquisition of tangible fixed assets are charged to the income statement on an accruals basis. According to the provisions of IAS 20, any capital grants obtained as a result of investment incentives granted by the public administration are deducted from the historical cost of any related capitalized fixed assets, when put into operation. No fixed assets are available for sale.
(ii) Fixed assets under finance leases
Assets held by the Company under leasing contracts, including operating leases, are recognized as assets with a balancing entry in financial payables in accordance with IFRS 16. In particular, assets are recognized at a value equal to the current value of future payments at the date of signing the contract, discounted using the applicable incremental borrowing rate for each contract.
(iii) Subsequent costs
The costs of replacing certain parts of the fixed assets are capitalized when it is probable that these costs will result in future economic benefits and can be reliably measured. All other costs, including the costs of maintenance and repairs, are attributed to the income statement as incurred.
(iv) Depreciation
Depreciation is charged to the income statement on a straight-line basis and on the estimated useful life of fixed assets and their residual possible use. Land is not depreciated. The estimated useful life results in the following depreciation rates by homogeneous category:
Financial Statements at December 31, 2022 31
The estimated useful life of assets is revised annually and any changes in rates, where necessary, are made prospectively.
For assets purchased and/or that became operational during the year, depreciation is calculated using the rates set out above, but adapted pro-rata temporis to any such set-up date.
2.6. OTHER INTANGIBLE FIXED ASSETS
(i) Research and development costs
The costs of research with the aim of acquiring new technical knowledge are charged in the income statement when incurred.
The development costs incurred for the creation of new products, versions, accessories or new production processes are capitalized when:
o these costs can be reliably determined;
o these products, versions or processes are technically and commercially feasible;
o the expected volumes and realization values indicate that the costs incurred for development will generate future economic benefits;
o the resources to complete the development project exist. The capitalized cost includes the materials and the mere cost of direct labor. Other development costs are charged to the income statement when incurred. The capitalized development costs are measured at cost, net of accumulated amortization, (see next point (v)) and impairment losses (see para. 2.8).
(ii) Other intangible fixed assets
Other intangible fixed assets, which all have finite useful lives, are measured at cost and are recorded net of accumulated amortization, (see next point (v)) and impairment losses (see para. 2.8). The use of software licenses is amortized over their period of use (3-5 years).
The costs incurred internally for the creation of trademarks or goodwill are charged to the income statement when incurred.
(iii) Subsequent costs
Subsequent costs incurred for intangible fixed assets are capitalized only if they increase the future financial benefits of the specific capitalized fixed asset, otherwise they are charged in the income statement as incurred. Incidental financing costs.
Financial Statements at December 31, 2022 32 Buildings 2.5%-3% Light construction, general and specific equipment 10 – 15.5% Equipment, models and molds 20 - 25% Furniture and furnishings 12% Electronic office equipment 18 - 20% Motor vehicles and internal transport 20 - 25%
(iv) Accessory financing costs
Accessory financing costs are recognized as a reduction of the loans when they are disbursed.
(v) Amortization
Amortization is charged to the income statement on a straight-line basis based on the estimated useful life of the capitalized fixed assets. The estimated useful lives are as follows:
Patents and trademarks
Development costs
Licensing of software
5 years
3-5 years
5 years
The useful life is reviewed annually and any changes in rates, where necessary, are made prospectively.
2.7. IMPAIRMENT OF ASSETS
The book values of the assets, except for stocks, financial assets regulated by IFRS 9 and deferred tax assets, are subject to review at the balance sheet date, in order to determine if any impairment indicators exist, particularly with reference to equity investments. If the assessment reveals the presence of such indicators, the estimated realizable value of the asset is calculated in the manner indicated below.
A tangible or intangible asset suffers an impairment if it is not able to recover the book value at which the asset is recorded in the financial statements through the use or sale thereof. The purpose of the verification (impairment test) provided by IAS 36, is to ensure that non-current assets are not carried at a value higher than their realizable value, consisting of the net realizable value or value in use, whichever is higher. Value in use is the current value of future cash flows expected to be derived from the asset or the cashgenerating unit to which the asset belongs. Expected cash flows are discounted using a pre-tax discount that reflects the current market estimate of the cost of money reported at the time and risks specific to the asset. If the book value is higher that the realizable value, the assets or cash-generating unit to which they belong are written down to reflect the realizable value. These impairment losses are recognized in the income statement.
If the conditions that led to the impairment cease to exist, the assets previously written down are proportionally reversed. Reinstatements of values are recorded in the income statement. The goodwill value previously written down can never be reinstated.
2.8. EQUITY INVESTMENTS
Equity investments in subsidiary companies are measured at cost. If at the balance sheet date impairment with respect to the carrying amount is detected, applying the impairment methodology described in the previous paragraph, the equity investment is written down accordingly.
Investments in associates and others are valued according to the equity method, as set forth in IAS 28, which requires initial recognition at acquisition cost and the subsequent write-down or revaluation of the carrying amount to recognize the share pertaining to the investor of the investee’s profits or losses after the acquisition date.
Financial Statements at December 31, 2022 33
2.9. CASH AND CASH EQUIVALENTS
Cash and cash equivalents include cash on hand, bank and postal deposits and securities with an original maturity of less than three months.
2.10. CURRENT FINANCIAL ASSETS, RECEIVABLES AND OTHER ASSETS
Financial assets, as provided for by the new IFRS 9 –“Financial Instruments: recognition and measurement” (as revised in July 2014) which replaces IAS 39 - "Financial Instruments: Recognition and Measurement", are classified, on the basis of the Company's management methods and the related contractual cash flow characteristics, in the following categories:
o Amortized cost: financial assets held exclusively for the purpose of collecting the contractual cash flows are classified in the Amortized cost category. They are valued using the amortized cost method, recording the income in the income statement using the effective interest rate method;
o Fair value through other comprehensive income ("FVOCI"): financial assets whose contractual cash flows are represented exclusively by the payment of principal and interest and which are held in order to collect the contractual cash flows as well as the flows deriving from the sale of the same are classified in the FVOCI category. They are measured at fair value. Interest income, exchange rate gains/losses, impairment losses (and related write-backs) of financial assets classified in the category FVOCI, are recorded in the income statement; other changes in the fair value of assets are recorded among the other components of OCI. When these financial assets are sold or reclassified to other categories, due to a change in the business model, the cumulative gains or losses recognized in OCI are reclassified to the income statement;
o Fair value through profit or loss ("FVTPL"): the FVTPL category is residual in nature by collecting financial assets that do not fall under the Amortized cost and FVOCI categories, such as financial assets purchased for trading or derivatives, or assets designated as FVTPL by management at the date of initial recognition. They are measured at fair value. Gains or losses resulting from this measurement are recognized in the income statement;
o FVOCI for equity instruments: financial assets represented by equity instruments of other entities (i.e. investments in companies other than subsidiaries, associates and joint ventures), not held for trading purposes, can be classified in the FVOCI category. This choice can be made instrument by instrument and requires changes in the fair value of these instruments to be recognized in the OCI and not to be reversed to the income statement either on sale or on impairment of the same. Only dividends from these instruments will be recognized in the income statement. The fair value of financial assets is determined on the basis of quoted bid prices or through the use of financial models. The fair value of unlisted financial assets is estimated using specific valuation techniques adapted to the specific situation. Valuations are regularly carried out in order to verify whether there is objective evidence that a financial asset or group of assets may be impaired. If there is objective evidence, the impairment loss is recognized as a cost in the income statement for the period.
Financial Statements at December 31, 2022 34
2.11. DERIVATIVE FINANCIAL INSTRUMENTS
Until the previous year, Comer Industries S.p.A. held derivative financial instruments subscribed for hedging purposes; however, in cases in which the derivative financial instruments do not meet all the conditions applicable to hedge accounting as per IFRS 9, the changes in fair value of these instruments are recorded in the income statement as financial charges and/or income. Therefore, the derivative financial instruments are recorded in compliance with the hedge accounting regulations when:
o the hedge ratio is formally designated and documented at the beginning of the hedge;
o it is presumed that the hedge is highly effective;
o the effectiveness can be reliably measured and the hedge itself is highly effective during the designated periods.
The fair value of derivative financial instruments against exchange risks (forward) is their market value on the balance sheet date, which coincides with the discounted market value of the forward. The accounting method for derivative financial instruments varies depending on whether or not the conditions and requirements of IAS 9 are met. Specifically:
(i) Cash flow hedges
In the case of a derivative financial instrument for which the hedging ratio to variations in cash flows generated by an asset or liability or a future transaction (underlying hedged item) believed to be highly probable and that could affect the income statement is formally documented, the effective portion, originating from the adjustment of the derivative financial instrument to the fair value, is charged directly to a reserve under capital and reserves. When the underlying hedged cash flow occurs, any such reserve is removed from capital and reserves and assigned to the income statement as operating charges and revenues, while any non-effective portion or overhedging portion is immediately allocated to the income statement as financial charges and/or income.
When a hedging instrument reaches maturity, is sold or exercised, or the company changes the relationship with the underlying hedged item, and the forecast transaction, though it has yet to take place, is still considered likely, the resulting profits or losses originating from the adjustment of the financial instrument to the fair value remain under capital and reserves and are charged to income statement when the transaction takes place as described above. If the probability of the underlying transaction occurring is no longer likely, the related profits or losses from the derivative contract, originally recorded under capital and reserves, are immediately charged to the income statement.
(ii) Hedges of monetary assets and liabilities (Fair value hedges)
Where a derivative financial instrument is used to hedge changes in value of monetary assets or liabilities already recorded in the financial statements that could affect the income statement, profits and losses related to changes in fair value of the derivative financial instruments are immediately recorded in the income statement. Likewise, the profits and losses relating to the hedged item modify the carrying amount of any such item and are recorded in the profit and loss account.
Financial Statements at December 31, 2022 35
2.12. INVENTORIES
Stocks are recorded, in each homogeneous category, at the purchase cost, including incidental and production costs and the corresponding net realizable or market value at year-end, whichever is lowest. The cost is determined using the weighted average cost method
As far as goods manufactured by the Company (semi-finished, work in progress and finished goods) are concerned, the cost of production includes all directly chargeable costs (raw materials, consumables, energy utilities, direct labor), and the cost of manufacturing (indirect labor, depreciation, etc.) in the amount reasonably attributable to the products.
Any stock impairment risks are hedged by the relevant stock depreciation allowance recorded as an adjustment to the corresponding assets item. Amounts thus obtained do not differ significantly from current costs on the closing date of accounts.
2.13. INTEREST-BEARING FINANCIAL PAYABLES
All interest-bearing financial payables are valued with the amortized cost method. The difference between this value and the settlement value is charged to the income statement during the term of the loan.
2.14. LIABILITIES FOR EMPLOYEE BENEFITS
(i) Defined contribution plans
Comer Industries S.p.A. participates in public or private defined contribution pension schemes on a mandatory, contractual or voluntary basis. The payment of contributions fulfills Comer Industries S.p.A.'s obligation towards its employees. The contributions are costs recognized in the period in which they are due.
(ii) Defined benefit plans for employees
The defined benefit plans for employees are payable on or after the termination of the period of employment in the Company. These mainly include the severance indemnities which are calculated separately for each plan using actuarial methods to estimate the amount of future benefit accrued to employees during the year and in previous years. The resulting benefit is discounted and recorded net of the fair value of any related assets. The interest rate used to calculate the present value of the obligation was determined in accordance with para. 78 of IAS 19, from the Iboxx Corporate A index with a duration of 10+ as recorded on the valuation date. To this end, the yield for a duration comparable to the overall duration of the worker's covered by the assessment was chosen.
In the case of increases in plan benefits, the portion of the increase relating to the previous employment period is charged to the income statement on a straight line basis over the period in which the related rights will be acquired. If the rights are acquired immediately, the increase is immediately recorded in the income statement.
The expected present value of benefits payable in the future related to the length of employment in the current period, conceptually similar to the accrued share of the employee severance indemnity, is classified under personnel costs in the income statement while the implicit financial charges are reclassified in the applicable financial section.
Financial Statements at December 31, 2022 36
2.15. INCOME TAXES
Income taxes recognized in the income statement include current and deferred taxes. Income taxes are generally charged to the income statement, unless they relate to items recognized directly under capital and reserves. In this case, the income taxes are also charged directly to capital and reserves, as a variation to the amount recorded.
Current taxes are taxes calculated by applying the tax rate in effect on the balance sheet date and adjustments to prior year taxes to taxable income
Deferred taxes are calculated using the so-called liability method on timing differences between the amount of assets and liabilities recorded in the financial statements and the corresponding values recognized for tax purposes. Deferred taxes are calculated according to the designated method of reversal of timing differences, on the basis of realistic estimates of financial charges resulting from the application of the tax legislation in force at the date in which the financial statements were prepared. Deferred tax assets are recognized only if it is probable that sufficient taxable income will be generated in future years to realize these deferred taxes.
2.16. PROVISIONS FOR RISKS AND CHARGES
Provisions for risks and charges relate to costs and charges of a specific nature and certain or likely existence, the amount and date of occurrence of which are not known at the close of the period. Provisions are recognized when:
o the existence of a pending liability arising from a past event is probable;
o it is likely that the fulfillment of the obligation will require an outflow of resources;
o the amount of the obligation can be estimated reliably.
Provisions are recorded at the value reflecting the best estimate of the amount the company would reasonably pay to settle the obligation or transfer it to third parties at the end of the period.
The costs that Comer Industries S.p.A. expects to incur to carry out restructuring plans are recorded in the financial year in which the Company formally defines the plan and the interested parties have a valid expectation that the restructuring will happen.
The provisions are periodically updated to reflect any variations in estimates of costs and realization times. Revisions of the provision estimates are charged in the same income statement item that had previously held the provision.
The notes to the consolidated financial statements illustrate the contingent liabilities consisting of:
o possible, but not probable, obligations arising from past events, the existence of which will be confirmed only by the occurrence or non-occurrence of one or more uncertain future events not wholly under the control of the company;
o present obligations arising from past events the amount of which cannot be reasonably estimated or the fulfillment of which will probably not be burdensome.
Financial Statements at December 31, 2022 37
2.17. CURRENT FINANCIAL LIABILITIES, TRADE PAYABLES AND OTHER PAYABLES
Trade payables and other payables, which mature within the normal commercial terms, are not discounted and are recognized at cost (identified by nominal value) reflecting their settlement value. Current financial liabilities include the short-term portion of borrowings, including payables for cash advances and other financial liabilities. Financial liabilities are measured at amortized cost by recording charges in the income statement using the effective interest rate method, with the exception of financial liabilities purchased for trading purposes or derivatives, or those designated as FVTPL by management at the date of initial recognition, which are measured at fair value through profit or loss (see para. Financial derivatives).
2.18. DERECOGNITION OF FINANCIAL ASSETS AND LIABILITIES
Financial assets
A financial asset is derecognized when:
o the rights to receive cash flows from the asset are extinguished;
o the Company retains the right to receive cash flows from the asset, but has assumed the contractual obligation to pay them in full and without delay to a third party;
o the Company has transferred the right to receive cash flows from the asset and has transferred substantially all risks and rewards of ownership of the financial asset or has neither transferred nor retained all risks and rewards of ownership of the asset, but has transferred control of the asset. In cases where the Company has transferred the rights to receive cash flows from an asset and has neither transferred nor retained all the risks and benefits or has not lost control over it, the asset is recognized in the balance sheet to the extent of its residual involvement in the asset. The residual involvement that takes the form of a guarantee on the transferred asset is valued at the lower of the initial book value of the asset and the maximum amount that the Company could be required to pay.
In cases where the residual involvement takes the form of an option issued and/or purchased on the transferred asset (including options settled in cash or similar), the extent of the Company's involvement corresponds to the amount of the transferred asset that the Company may repurchase; however, in the case of a put option issued on an asset measured at fair value (including options settled in cash or similar), the extent of the Company's residual involvement is limited to the lower of the fair value of the transferred asset and the option exercise price.
Financial liabilities
A financial liability is derecognized when the obligation underlying the liability is extinguished, canceled or discharged.
In cases where an existing financial liability is replaced by another from the same lender, under substantially different conditions, or the conditions of an existing liability are substantially changed, this exchange or change is treated as a derecognition of the original liability and the recognition of a new liability, with any differences between the carrying amounts recognized in the income statement.
In the case of changes to financial liabilities defined as non-substantial, the financial liability is not derecognized and the value of the debt is recalculated keeping the original effective interest rate unchanged, discounting the modified cash flows, thus generating a positive or negative effect on the income statement.
Financial Statements at December 31, 2022 38
2.19. REVENUES
Revenues are recognized to the extent in which it is probable that the economic benefits will be achieved by the Company and the related amount can be reliably determined, regardless of the date of payment. Revenues are measured at the fair value of the amount received or to be received, taking into account the contractually defined payment terms and excluding taxes and duties. Revenue from the sale of goods is recognized when the Company has transferred all significant risks and rewards connected with ownership of the goods to the purchaser. Revenue is measured at the fair value of the consideration received or to be received, net of returns and rebates, commercial discounts and volume reductions.
2.20. COSTS
Costs are recognized when they relate to goods and services purchased and/or received during the period or by systematic allocation of an expense from which future benefits are spread over time.
2.21. FINANCIAL INCOME AND CHARGES
The financial income and charges are reported on an accrual basis based on the interest accrued to the net value of the related financial assets and liabilities by applying the effective interest rate. The financial income and charges include gains and losses on exchange and gains and losses on derivative instruments that must be recognized in the income statement if they fail to meet the requirements to be considered hedging.
2.22. DIVIDENDS
Dividends are recognized when, as a result of the resolution passed by the shareholders' meeting of the investee company to distribute the profit or possibly the reserves, the right to collect them arises for the investor. The dividend is recognized as financial income, irrespective of the nature of the reserves distributed. The investor company verifies that, following distribution, the recoverable amount of the equity investment has not declined to such a point so as to require the recognition of an impairment loss.
2.23. SHARE-BASED PAYMENTS - EQUITY-SETTLED PAYMENT TRANSACTIONS
Comer Industries S.p.A. has adopted an incentive plan based on ordinary shares of the Company (Stock Grant Plan), reserved to its C.E.O., which ended with year-end close in 2021.
The cost of transactions settled with capital instruments is determined by the fair value on the date on which the assignment is made, using an appropriate valuation method. Such cost, corresponding to the increase in shareholders' equity, is recorded under personnel costs over the period in which the conditions relating to the achievement of objectives and/or the provision of the service are met. The cumulative costs recognized for these transactions at the end of each financial year up to the vesting date are commensurate with the expiry of the vesting period and the best estimate of the number of equity instruments that will actually accrue.
Service or performance conditions are not taken into account when the fair value of the plan at the grant date is defined. However, the likelihood that these conditions are met in defining the best estimate of the number of equity instruments that will be accrued is considered. Market conditions are reflected in the fair value at the grant date. Any other condition linked to the plan, which does not involve a service obligation, is not considered as a maturity condition. Non-accruing conditions are reflected in the fair value of the plan and
Financial Statements at December 31, 2022 39
imply the immediate recognition of the cost of the plan, unless there are also service or performance conditions.
No cost is recognized for rights that do not accrue because the performance and/or service conditions are not met. When the rights include a market condition or a non-vesting condition, they are treated as if they had accrued regardless of whether or not the market conditions or other non-vesting conditions to which they are subject are met, it being understood that all other performance and/or service conditions must be met.
If the conditions of the plan are modified, the minimum cost to be recognized is the fair value at the grant date in the absence of the modification, assuming that the original conditions of the plan are satisfied. In addition, a cost is recognized for each change that results in an increase in the total fair value of the payment plan, or is otherwise favorable to employees; this cost is measured with reference to the date of the change. When a plan is derecognized by the entity or the counterparty, any remaining element of the plan's fair value is immediately expensed to the income statement.
2.24. USE OF ESTIMATES
The preparation of the financial statements requires that the Directors apply accounting standards and methods that, in certain circumstances, are based on difficult and subjective valuations and estimates based on past experience and assumptions which are from time to time considered reasonable and realistic depending on the relative circumstances. The application of these estimates and assumptions affect the amounts reported in the schedules forming the financial statements, such as the Statement of financial position, the Income statement, the Statement of Comprehensive Income, the Cash flow Statement and the Statement of Changes in Equity, as well as the disclosure provided. The final values of the accounting items for which these estimates and assumptions were used may differ from those reported in the financial statements due to uncertainties regarding the assumptions and the conditions on which the estimates are based. Estimates and assumptions are reviewed periodically and the effects of each variation recognized in the period in which the estimate is revised if the revision affects only the current period, or even in subsequent periods if the revision affects the current period and those in the future. The financial statement items which, more than others, require a greater degree of discretion by the directors when making estimates and for which a change underlying the assumptions used could have a significant impact on the financial statements are: impairment of equity investments, deferred tax assets, allowance for doubtful accounts, provisions for product warranty risks, other provisions for legal risks, the inventory write-down provision for semi-finished and finished products and transactions with payment settled with equity instruments.
Financial Statements at December 31, 2022 40
2.25. PUBLIC GRANTS
Public grants are recognized when there is reasonable certainty that they will be received and that all the conditions referring to them have been satisfied. Grants relating to components of cost are recognized as revenues, but are systematically spread over a number of financial periods so as to match the recognition of the costs they are intended to offset. A grant relating to an asset is recognized as a revenue in constant amounts along the expected useful life of the asset in question.
In the event the Company receives a non-monetary grant, the asset and the relative grant are recognized at nominal value and released in the income statement in constant amounts along the expected useful life of the asset in question.
Law 124 of 2017 provides for compulsory disclosure of subsidies, grants, appointments or economic advantages received from the Public Administration or, in any case, involving public resources.
From a systematic reading of the regulation, the facilitating measures aimed at all companies have not been included (by way of example but not limited to tax facilitating measures such as hyper-amortization, superamortization, tax credit for research and development and facilitating measures such as the Wages Guarantee Fund) as these advantages are not aimed at a specific company.
During the year, the Company only received State Aid that targeted all companies, and therefore for any details reference should be made to the National Register of State Aid.
2.26. ACCOUNTING STANDARDS.
2.26.1. IFRS ACCOUNTING STANDARDS, AMENDMENTS AND INTERPRETATIONS APPLIED WITH EFFECT FROM JANUARY 1, 2022
The following IFRS accounting standards, amendments and interpretations have been applied for the first time by the Group starting from January 1, 2022:
On May 14, 2020, the IASB published the following amendments:
o Amendments to IFRS 3 Business Combinations: the amendments are intended to update the reference in IFRS 3 to the Conceptual Framework in the revised version, without resulting in any changes to the provisions of the standard.
o Amendments to IAS 16 Property, Plant and Equipment: the purpose of the amendments is not to allow the deduction from the cost of property, plant and equipment of the amount received from the sale of goods produced during the testing phase of the asset itself. These sales revenues and related costs will therefore be recognized in the income statement.
o Amendments to IAS 37 Provisions, Contingent Liabilities and Contingent Assets: the amendment clarifies that all ‘costs that relate directly to the contract’ must be considered when estimating whether a contract is onerous. Accordingly, the assessment of whether a contract is onerous includes not only incremental costs (such as the cost of direct material used in the work), but also all costs that the company cannot avoid because it has entered into the contract (such as the portion of the depreciation of machinery used to fulfill the contract).
Financial Statements at December 31, 2022 41
o Annual Improvements 2018- 2020: amendments were made to IFRS 1 First-time Adoption of International Financial Reporting Standards, IFRS 9 Financial Instruments, IAS 41 Agriculture, and Illustrative Examples of IFRS 16 Leases.
The adoption of these amendments had no effect on the Company’s financial statements.
2.26.2. ACCOUNTING STANDARDS AND AMENDMENTS NOT YET APPLICABLE AND NOT YET ADOPTED IN ADVANCE BY THE COMPANY AT DECEMBER 31, 2022
On May 18, 2017, the IASB published IFRS 17 – Insurance Contracts, which is intended to replace IFRS 4 - Insurance Contracts
The objective of the new standard is to ensure that an entity provides relevant information that faithfully represents the rights and obligations arising from insurance contracts issued. The IASB has developed the standard to eliminate inconsistencies and weaknesses in existing accounting policies by providing a single principle-based framework for all types of insurance contracts, including reinsurance contracts that an insurer holds.
The new standard also includes presentation and disclosure requirements to improve comparability between entities in this segment.
The new standard measures an insurance contract on the basis of a General Model or a simplified version of it, called the Premium Allocation Approach ("PAA").
The main features of the General Model are:
o the estimates and assumptions of future cash flows are always current;
o the measurement reflects the time value of money;
o the estimates make extensive use of information observable on the market;
o there is a current and explicit measurement of risk;
o the expected profit is deferred and aggregated into groups of insurance contracts at the time of initial recognition; and,
o the expected profit is recognized in the contractual hedging period taking into account the adjustments resulting from changes in the cash flow assumptions relating to each group of contracts.
The PAA method involves measuring the liability for the residual coverage of a group of insurance contracts provided that, at the time of initial recognition, the entity expects the liability to reasonably represent an approximation of the General Model. Contracts with a coverage period of one year or less are automatically eligible for the PAA method. The simplifications arising from the application of the PAA method do not apply to the measurement of liabilities for outstanding claims, which are measured using the General Model. However, it is not necessary to discount those cash flows if it is expected that the balance to be paid or collected will occur within one year of the date on which the claim occurred.
An entity shall apply the new standard to insurance contracts issued, including reinsurance contracts issued, reinsurance contracts held and also investment contracts with a discretionary participation feature (DPF).
Financial Statements at December 31, 2022 42
The standard applies from January 1, 2023 but early application is permitted only for entities that apply IFRS 9 - Financial Instruments and IFRS 15 - Revenue from Contracts with Customers
The Directors do not expect a significant effect in the Company’s financial statements from the adoption of this standard.
On December 9, 2021, the IASB published an amendment called “Amendments to IFRS 17 Insurance contracts: Initial Application of IFRS 17 and IFRS 9 – Comparative Information”. The amendment is a transition option relating to comparative information on financial assets presented at the date of initial application of IFRS 17. The amendment aims to avoid temporary accounting misalignments between financial assets and insurance contract liabilities, and therefore to improve the usefulness of comparative information for readers of financial statements. The modifications will be applied from January 1, 2023 along with the application of IFRS 17.
The Directors do not expect a significant effect in the Company’s financial statements from the adoption of this amendment.
On February 12, 2021, the IASB published two amendments called “Disclosure of Accounting Policies—Amendments to IAS 1 and IFRS Practice Statement 2” and “Definition of Accounting Estimates Amendments to IAS 8”. The amendments are intended to improve disclosure about accounting policies so as to provide more useful information to investors and other primary users of financial statements as well as to help companies distinguish changes in accounting estimates from changes in accounting policy. The modification will be applied from January 1, 2023, however, early application is permitted.
The Directors do not expect a significant effect in the Company’s financial statements from the adoption of these amendments.
On May 7, 2021, the IASB published an amendment called “Amendments to IAS 12 Income Taxes: Deferred Tax related to Assets and Liabilities arising from a Single Transaction”. The document clarifies how deferred taxes should be accounted for on certain transactions that can generate assets and liabilities of equal amounts, such as leases and decommissioning obligations. The modification will be applied from January 1, 2023, however, early application is permitted. The Directors do not expect a significant effect in the Company’s financial statements from the adoption of this amendment.
2.26.3. ACCOUNTING STANDARDS, AMENDMENTS AND IFRS INTERPRETATIONS NOT YET APPROVED
BY THE EUROPEAN UNION
At the reference date of this document, the competent bodies of the European Union have not yet completed the approval process necessary for the adoption of the amendments and principles described below.
Financial Statements at December 31, 2022 43
On January 23, 2020, the IASB published an amendment called “Amendments to IAS 1 Presentation of Financial Statements: Classification of Liabilities as Current or Non-current” and on October 31, 2022 published an amendment named “Amendments to IAS 1 Presentation of Financial Statements: Non-Current Liabilities with Covenants”. The purpose of the documents is to clarify how to classify debt and other short-term or long-term liabilities. The modification applies from January 1, 2024, however early application is permitted.
The Directors do not expect a significant effect in the Company’s financial statements from the adoption of this amendment.
On September 22, 2022, the IASB published an amendment called “Amendments to IFRS 16 Leases: Lease Liability in a Sale and Leaseback”. The document requires the seller-lessee to value the lease liability deriving from a sale & leaseback transaction so as not to recognize a gain or loss referring to the right of use retained. The modification will be applied from January 1, 2024, however, early application is permitted.
The Directors do not expect a significant effect in the Company’s financial statements from the adoption of this amendment.
3. FINANCIAL AND NON-FINANCIAL RISK MANAGEMENT
Comer Industries S.p.A.'s business is exposed to various financial risks: market risk (including exchange rate risk and interest rate risk), credit risk, liquidity risk, price and cash flow risk and other non-financial risks linked to climate change and IT security. The risk management program is based on the unpredictability of financial markets and aims to minimize any negative impact on the financial performance of the Company. The Company does not use financial derivatives for speculative purposes. Under this procedure financial risk hedging is planned by a central function of the Company which coordinates all the operating companies, reporting directly to the Chief Executive Officer.
(a) Market
risk
(i) Exchange rate risk
Comer Industries S.p.A. operates internationally and is exposed to exchange rate risk due to exposure mainly to the US dollar, but also the Canadian dollar, Brazilian real, British Pound and the Chinese Yuan. The exchange rate risks are generated by forecasts of future commercial transactions and recognized assets or liabilities.
In order to manage the exchange rate risk generated by forecasts of future commercial transactions and recognized assets or liabilities denominated in a currency other than the functional currency (euro), Comer Industries uses repurchase agreements (forwards).
In particular, the Company is exposed in dollars for sales and purchases made with third parties primarily in the US currency; the Comer Industries S.p.A. policy is to manage collections and payments through current accounts in foreign currency, for natural hedging purposes.
If expected cash flows point to an excess of more than 70 percent between collections and payments, suitable forward derivative contracts are entered into to hedge the risk.
(ii) Interest rate risk
Financial Statements at December 31, 2022 44
Interest rate risk is derived from medium-long term loans at variable rates. The Company's current policy is to use floating rate loans, monitoring the interest rate curve.
(b) Credit risk
Comer Industries S.p.A.'s policy is to sell to customers after an evaluation of their credit capacity and therefore within pre-set credit limits. Historically, the Company has not suffered significant losses on receivables.
(c) Liquidity risk
Prudent management of liquidity risk implies maintaining sufficient available cash and cash equivalents and sufficient credit lines from which to draw. Due to the dynamic nature of the business, Comer Industries S.p.A.'s policy is to have revolving standby credit facilities that can be utilized at short notice.
(d) Price and cash flow risk
Comer Industries S.p.A is subject to the risk of fluctuations in metal prices, in particular, aluminum, copper and steel. The Group's policy is to cover the risk where possible, through commitments from suppliers in the medium term, with stockpiling policies when prices are at their lowest and agreements with customers. Furthermore, the Company has no significant interest-generating activities towards third parties and the revenues and the related cash inflows are, therefore, independent of changes in interest rates. For the operational management of the above risks, please refer to the “Information on financial assets” paragraph.
(e) Climate change risk
With the goal of contributing to the fight against climate change and in keeping with European-level guidelines on reporting, Comer Industries has embarked on a path of gradual approximation and implementation of the Recommendations of the TCFD - Task Force on Climate-related Financial Disclosures, aimed at developing a harmonized climate change risk mitigation plan in the Integrated Management System.
Compared with the qualitative assessment developed in the previous fiscal year, in 2022 the spectrum of analysis was further broadened and evolved, incorporating instances from the new operating locations in light of the acquisition of Walterscheid Powertrain Group, and evolving in the direction of a scenario study and a medium- to long-term quantitative analysis.
The application of the methodology also led to an assessment of strategy resilience based on a representation of risks and opportunities. The design of the climate change risk analysis followed the guidelines of the Carbon Disclosure Project (according to the CDP Technical Note on the TCFD - Disclosing in line with the TCFD's recommendations) and was developed in line with internal procedures and integrated into the Company's existing risk assessment model.
Over the next few years, following the gradual refinement of the methodology and the completion of the mapping of the new consolidated scope, the framework of risks and opportunities will be linked to an assessment of financial impacts based on the models proposed by the relevant guidelines.
(f) Information technology risk
Financial Statements at December 31, 2022 45
The Company believes that the operational continuity of its IT systems is of fundamental importance, and in this regard it has taken risk mitigation measures to guarantee network connectivity, data availability and security, while also guaranteeing the processing of personal data in compliance with the European GDPR and national regulations applicable in the individual EU Member States. To this end, it has implemented and continues to optimize an Information Security Management System (ISMS).
4. CORPORATE INFORMATION AND INDUSTRY-RELATED INFORMATION.
4.1. CORPORATE INFORMATION
At December 31, 2022, Comer Industries S.p.A. did not hold treasury shares and, moreover, the subsidiaries do not hold shares in the Parent Company.
4.2. INDUSTRY-RELATED INFORMATION
For sector information, please refer to the Group’s Consolidated Financial Statements.
Financial Statements at December 31, 2022 46
5. NOTES TO THE FINANCIAL STATEMENTS OF COMER INDUSTRIES S.P.A.
5.1. TANGIBLE FIXED ASSETS
The movements in technical fixed assets and the related accumulated depreciation during 2022 are described in the following tables, which show the values with a separate indication of grants received in the capital account, as a reduction of the investment value:
During the year, Comer Industries S.p.A. invested 9.7 million euros (2.3% of sales) in tangible fixed assets, net of decreases and excluding changes in "Rights of use".
Some of the most significant investments made by the Company during the year include two new Mazak horizontal machining centers dedicated to the flow of cast iron and a gear cutting machining center. Two additional horizontal machining centers for the cast iron flow and a new robotic cell for the gear machining flow were purchased, which will enter operation in 2023.
The value of Rights of use at December 31, 2022, net of accumulated depreciation, amounted to 20,252 thousand euros, of which: (i) 19,258 thousand euros for industrial building rents; (ii) 817 thousand euros for company vehicle leases; and (iii) 177 thousand euros for forklift leases.
5.2. INTANGIBLE FIXED ASSETS
The variations in intangible fixed assets are shown below, indicating values net of government capital grants:
Financial Statements at December 31, 2022 47
Description (thousand euros) Land and buildings Plant and machinery Industrial and commercial equipment Other Assets Tangible fixed assets in progress Rights of use Total January 01, 2021 295 15,672 8,403 1,189 2,180 21,304 49,043 Increases 290 3,729 4,207 809 1,586 5,193 15,814 Impairment 450 450 Decreases (50) (16) (180) (246) Depreciation (65) (3,263) (4,432) (332) (3,652) (11,744) Reclassifications 1,979 (308) 46 (1,717) 0 December 31, 2021 519 18,068 7,855 1,532 2,048 23,296 53,317 Increases 3,487 4,513 1,099 704 532 10,335 Decreases (24) (34) 0 (94) (152) Depreciation (71) (3,698) (4,154) (358) (3,482) (11,763) Reclassifications 300 229 3 (532) 0 December 31, 2022 448 18,133 8,409 2,276 2,220 20,252 51,738
Description (thousand euros) Development and approval costs Trademarks and know-how Concessions, licenses and patents Other intangible fixed assets Intangible fixed assets in progress Total January 01, 2021 662 44 2,040 1 615 3,361 Increases 0 1,101 403 1,504 Decreases (21) (21) Amortization (362) (13) (1,009) (0) (1,383) Reclassifications 122 116 (238) 0 January 01, 2022 422 31 2,249 0 759 3,461 Increases 0 1,271 564 1,835 Decreases (14) (14) Amortization (232) (13) (968) (0) (1,213) Reclassifications 54 0 (54) 0 December 31, 2022 244 18 2,551 - 0 1,256 4,069
Intangible fixed assets are broken down as follows:
(i) Development and approval costs and intangible fixed assets in progress
These capitalizations are mainly related to internal orders associated with the development of new products. During the period development costs of 275 thousand euros were capitalized under fixed assets in progress. These projects meet the requirements of paragraph 57 of IAS 38, as the Group analyzed the technical feasibility of the same, as well as the intention to complete the project, to introduce new products on the market and the availability of technical and financial resources, as well as a reliable identification of own costs and their ability to produce future economic benefits. These expenses are amortized on the basis of the probable useful life generally estimated to be 3 to 5 years, depending on the sector they are intended for.
Decreases of 14 thousand euros refer to abandoned projects.
(ii) Concessions, licenses and patents
The increases in the period relate to software licenses and applications for the logistics area and research and development and the capitalization of external costs for the realization of ERP consolidation projects in the Reggiolo industrial center.
5.3. EQUITY INVESTMENTS
Equity investments are shown in detail below:
The changes taking place during the year, amounting to 39.1 million euros, in the item Equity investments in subsidiaries, refer to:
Financial Statements at December 31, 2022 48
Description (thousand euros) December 31, 2022 December 31, 2021 Delta Comer Industries SARL 0 0 0 Comer Industries INC 9,218 9,218 0 Comer GMBH 152 152 0 Comer Industries Components S.r.l. 7,812 7,812 0 Comer Industries (Shaoxing) Co., Ltd. 226 226 0 Comer Industries (Jiaxing) Co., Ltd. 4,000 4,000 0 Comer Industries do Brasil EIRELI 2,016 2,016 0 Comer Industries India Private Limited 1,883 1,883 0 Comer Industries UK Ltd 810 810 0 WPG HoldCo B.V. 0 206,302 (206,302) WPG US HoldCo LLC 100,791 0 100,791 WPG German Holdco GmbH 122,119 0 122,119 WPG UK Holdco Limited 3,494 0 3,494 Walterscheid Monguelfo S.p.A. 19,000 0 19,000 Evoluzione Comer S.r.l. 10 0 10 Equity investments in subsidiaries 271,531 232,419 39,113 Deep Tier S.r.l. 100 100 0 Equity investments in associates 100 100 0 FF Investments S.r.l. 319 319 0 Equity investments in other companies 319 319 0 Total Equity investments 271,950 232,837 39,113
- Increase of 18.5 million euros for the capital payment to the subsidiary WPG HoldCo LLC, subsequently decreased by 206.3 million euros following the merger by incorporation described above;
- Increase of 226.4 million euros due to the merger by incorporation of the subsidiary WPG HoldCo B.V. approved by the Shareholders' Meeting on April 27, 2022, effective as of August 1, 2022. This transaction resulted in the recognition of the WPG US Holdco LLC, WPG German Holdco GmbH and WPG UK Holdco Limited equity investments at the carrying amounts at the merger date recognized by WPG HoldCo LLC, converted into euros, to which the merger deficit of 143.4 million euros was also allocated. The gain was allocated on the basis of the percentage weight of EBITDA of the companies on the consolidated group, for 93.2 million euros to WPG German Holdco Gmbh and 50.2 million euros to WPG US Holdco LLC;
- Increase of 19 million euros following the acquisition of shares representing 100% of the share capital of the company Walterscheid Monguelfo S.p.A.;
- Increase of 10 million euros following the establishment of the company Evoluzione Comer S.r.l., which will close its first financial year on December 31, 2023 and which is not currently operating.
A comparison is provided below between equity drafted in accordance with IAS of the subsidiaries and the relative carrying amount.
Investments in subsidiaries are valued according to the cost method, which requires it to be reduced in the event of impairment losses, if the decrease in value suffered by the investee cannot be absorbed within a reasonable period of time. A loss should be considered impairment when, fundamentally, it is not expected that the reasons causing it can be eliminated within a brief period of time, that is within a short enough period of time to make it possible to formulate reliable forecast based on objective and reasonably identifiable facts.
The WPG US Holdco LLC, WPG German Holdco GmbH and WPG UK Holdco Limited equity investments were tested for impairment by the management, considering the value of goodwill inherent in them.
Financial Statements at December 31, 2022 49
Entity name Share capital (€k) Equity (€k) Net profit for the year (€k) % control 2018 Share (€k) Value of equity investment (€k) Difference (€k) Comer GmbH 205 334 - 22 100% 334 152 182 Comer Industries Inc. 12,452 26,304 5,036 100% 26,304 9,218 17,086 Comer Industries U.K. Ltd. 299 978 402 100% 978 810 168 Comer Industries Components Srl 7,125 16,353 2,070 100% 16,353 7,812 8,541 Comer Industries (Shaoxing) Co. Ltd 6,720 5,170 739 100% 5,170 226 4,943 Comer Industries do Brasil EIRELI 1,084 8,234 3,370 100% 8,234 2,016 6,218 Comer Industries India Pvt Ltd 1,646 8,497 1,478 95% 8,072 1,883 6,189 Comer Industries (Jiaxing) Co. Ltd 11,700 70,286 24,330 34.20% 24,038 4,000 20,038 Walterscheid Monguelfo S.p.A. 2,580 20,798 3,589 100% 20,798 19,000 1,798 Evoluzione Comer S.r.l. 10 10 - 100% 10 10 0 WPG German Holdco GmbH 10,495 124 112 100% 124 122,119 (121,995) WPG UK Holdco Limited 3,890 3,388 23 100% 3,388 3,494 (106) WPG US HoldCo LLC 48.234 14,866 - 3,165 100% 14,866 100,791 (85,925) Deep Tier S.r.l. 90 500 - 371 33.33% 167 100 67 FF Investments S.r.l. 87 3,064 N/A 10.40% 319 319 (0)
The impairment test results were approved by the Board of Directors on March 21, 2023. It was carried out using the Discounted Cash Flow (DCF) method net of tax. The expected cash flows used in the calculation of the DCF were determined on the basis of a 3-year business plan. The business plan takes account of various reference scenarios and expectations for development in the various market, on the basis of information available at the end of 2022.
These flows were discounted at a discount rate calculated using the Weighted Average Cost of Capital ("WACC"), i.e., by weighting the expected rate of return on invested capital net of the costs of hedging for a sample of companies in the same industry. The average cost of capital (WACC) was calculated as 8 60% and the estimated g rate was conservatively set at a value lower than the expected long-term inflation rate. The performance of the impairment test did not indicate the need to recognize any impairment on the value of the equity investments as of December 31, 2022.
In confirmation of this, the sensitivity analysis – carried out by increasing the cost of capital used to discount expected cash flows by 100 basis points – did not reveal any need to write down the item, nor a variation of ±10% in expected cash flows.
With respect to the other equity investments in subsidiaries, the Company’s Directors do not believe that there are currently indicators of impairment and, as a result, it was not necessary to perform any impairment testing.
Equity investments in associates are valued according to the equity method, which requires initial recognition at acquisition cost and the subsequent write-down or revaluation of the carrying amount to recognize the share pertaining to the investor of the investee’s profits or losses after the acquisition date. With respect to the subsidiary Deep Tier, although it is recognized at a value lower than the share of equity, no revaluation was recognized as it recorded a loss in the last year.
Lastly, equity investments in other companies include the company FF Investments S.r.l., a start-up established at the end of 2021, which at the date of approval of these financial statements had not yet presented its closing data for its first financial year. The carrying amount of this equity investment, represented by acquisition cost, approximates its fair value.
With regard to the summary of economic-asset/liability relations with related parties of the Group, reference should be made to the details in the Directors’ Report.
Financial Statements at December 31, 2022 50
5.4. CURRENT AND DEFERRED TAX ASSETS
The details of deferred tax assets are as follows:
The balance of deferred tax assets increased by 3,251 thousand euros, primarily following higher provisions for product warranties and provisions for benefit plans in favor of directors and employees. For the detailed breakdown of this item please refer to the table below:
Changes in current tax assets are shown below:
The VAT credit balance at December 31, 2022 reflects the increase in turnover. The balance of current tax receivables amounting to 1,491 thousand euros represents for 710 thousand euros the current share of tax credits for investments in new operating assets, of which 627 for Industry 4.0; for 560 thousand euros the estimate of the energy and gas tax credit relating to the fourth quarter of 2022; for 195 thousand euros the share of the research and development credit.
5.5. SHORT AND LONG-TERM FINANCIAL RECEIVABLES
The item includes financial receivables for a total of 159,206 thousand euros, of which 61,515 thousand euros within the year, connected primarily to the intra-group loan agreement entered into by Comer Industries
Financial Statements at December 31, 2022 51
Description (thousand euros) December 31, 2022 December 31, 2021 Deferred tax assets 8,810 5,559 Deferred tax assets 8,810 5,559
Deferred tax assets (thousand euros) December 31, 2022 December 31, 2021 2022 Total Taxes Tot. Taxes (used) Description Deferred Deferred recognized Inventory write-down provision 1,115 1,187 (72) Provision for warranty and/or contractual risks 2,600 2,138 462 Comer Industries brand 482 559 (77) Agents Provision 42 92 (50) Adjustment of items in foreign currency 580 216 363 Taxed provision for receivables 252 207 45 Deferred emp. and dir. variable wages 3,367 868 2,498 Provisions for risks 160 74 86 Impacts of IAS/IFRS 205 204 1 Other impacts 8 13 (5) Total prepaid taxes company 8,810 5,559 3,251
Description (thousand euros) December 31, 2021 Net change December 31, 2022 VAT credit 3,801 4,206 8,007 Current tax receivables 1,100 391 1,491 Refund of export duty and other minor items 8 (0) 8 Current tax assets 4,909 4,017 9,506
S.p.A. and the two WPG Group companies WPG US Holdco and WPG German Holdco, aiming to refinance and restructure existing debt within the acquired group. This Loan agreement is broken down as follows:
1. Credit line amounting to 105.085 million US dollars, maturing on September 30, 2029, bearing interest at the rate of 2.5% on the 6-month Libor, entered into with the counterparty WPG US Holdco;
2. Credit line amounting to 82.196 million euros, maturing on March 31, 2027, bearing interest at the rate of 2.5% on the 6-month Euribor, entered into with the counterparty WPG German Holdco;
3. Revolving line for a maximum amount of 15 million euros, for current cash requirements, not used at December 31, 2022.
The remainder of financial receivables consist of:
- Loan to WPG UK Holdco Ltd deriving from the obligations assumed following the merger by incorporation of WPG Holdco BV. The carrying amount at December 31, 2022 is 19.3 million euros, of which 1 million euros for interest;
- Interest-bearing loan to Comer Industries Components S.r.l. for 6.1 million euros, maturing on December 31, 2023.
The changes and accounting figures at December 31, 2022 are set forth below. Please note that the value of receivables in USD is inclusive of year-end exchange adjustments.
5.6. OTHER LONG-TERM RECEIVABLES
Other long-term debtors refer to guarantee deposits primarily for real estate in rental agreements and consumption.
Financial Statements at December 31, 2022 52
Description (thousand euros) Currency Carrying amount December 31, 2021 Change Carrying amount December 31, 2022 Nom. val. December 31, 2022 (LC) WPG US HoldCo LLC financial receivables USD 4,888 9,828 14,716 15,696 WPG German HoldCo GmbH financial receivables EUR 12,855 3,675 16,530 16,530 Comer Industries Components Srl financial receivables EUR - 6,100 6,100 6,100 WPG UK Holdco Ltd financial receivables EUR - 19,270 19,270 19,270 Total current financial receivables 17,743 38,873 56,616 WPG US HoldCo LLC financial receivables USD 86,165 (7,410) 78,755 84,000 WPG German HoldCo GmbH financial receivables EUR 68,000 (44,165) 23,835 23,835 Total non-current financial receivables 154,165 (51,575) 102,590 Total financial receivables 171,908 (12,702) 159,206
Description (thousand euros) December 31, 2022 December 31, 2021 Other minor items including security deposits Italy 279 24 Tax receivables 565 581 Other long-term receivables 844 605
Tax receivables relate to the long-term portion of tax credits for investments in new operating assets and the research and development credit.
5.7. INVENTORIES
The changes are as follows:
The value of inventories at December 31, 2022 is aligned with the value of the previous year.
Inventories are shown net of a provision for obsolescence for a total amount of 3,891 thousand euros. During the period this amount increased by 417 thousand euros for provisions and decreased by 669 thousand euros further to use for scrapping.
5.8. TRADE RECEIVABLES AND OTHER SHORT-TERM RECEIVABLES
The changes are as follows:
The balance of trade receivables is influenced by cyclical variability especially regarding the trend in turnover in the final months of the year. The change in the period was influenced by the increase in sales volumes in the last quarter of the year, which generated 25% of annual volumes. The average collection period improved slightly; indeed, the latter amounted to 86 days at December 31, 2022, down by 2 days compared with the previous year.
The increase in the allowance for doubtful accounts of 115 thousand euros consists of specific write-downs for 23 thousand euros and a generic write-down for 92 thousand euros calculated in accordance with IFRS 9. During the year, Comer Industries S.p.A. did not record any significant losses on receivables or release provisions set aside in previous years.
Financial Statements at December 31, 2022 53
Description (thousand euros) December 31, 2021 Net change / Increases December 31, 2022 Raw materials and packaging 24,887 (1,861) 23,026 Raw and ancillary materials and packaging 24,887 (1,861) 23,026 Semi-finished products purchased and produced 42,026 (80) 41,946 Provision for write-down of semi-finished products purchased and produced (2,259) 90 (2,168) Work in progress 39,767 11 39,778 Finished products and goods 8,454 1,747 10,201 Provision for write-down of finished products (1,885) 162 (1,723) Finished products 6,570 1,909 8,479 Inventories 71,224 59 71,283
Description (thousand euros) December 31, 2021 Net change December 31, 2022 Trade receivables 68,493 8,519 77,010 Receivables from group companies 20,378 7,157 27,535 Allowance for doubtful accounts (2,319) (115) (2,434) Trade receivables 86,552 15,560 102,111 Advances to suppliers 19 54 73 Receivables from Social Security Inst. 32 27 59 Accrued income and prepaid expenses 456 645 1,101 Credit notes to be received 925 (30) 895 Other short-term receivables 259 (20) 241 Other short-term receivables 1,691 677 2,369
Note that there are no trade receivables due after the year.
5.9. FINANCIAL ASSETS AND LIABILITIES, GUARANTEES
The net financial position recorded at December 31, 2022 (calculated according to the provisions set forth in Consob Communication 5/21" of April 29, 2021 and ESMA recommendations 32-382-1138 of March 4, 2021) amounted to 178.5 million euros, an improvement of 15.0 million euros compared to December 31, 2021.The increase is due primarily to the loan agreement entered into with Crédit Agricole Italia in December 2022 for a total of 50 million euros, maturing on December 16, 2027. This loan will provide the funding for the acquisition of e-comer, which was finalized in January 2023.
The value of prepayments deriving from accounting for up-front expenses according to amortized cost amounts to 2.0 million euros. The value of other financial liabilities attributable to the accounting treatment of leasing contracts according to IFRS 16 at December 31, 2022 amounts to 20.8 million euros, a decrease compared to December 31, 2021 (23.8 million euros).
The breakdown and movements compared to the previous year are shown below:
Financial assets and liabilities, broken down on the basis of the categories identified by IFRS 9, can be summarized in the following table:
Financial Statements at December 31, 2022 54
Description (thousand euros) December 31, 2021 Increases Decreases December 31, 2022 Other short-term financial receivables (17,743) (38,873) 0 (56,616) Cash and cash equivalents (20,201) (53,188) 2 (73,387) Short-term loans 30,601 97,557 (30,386) 97,772 Medium/long-term loans 179,602 40,000 (27,632) 191,970 Total net current financial debt to banks 172,259 45,496 (58,017) 159,738 Assets for short-term derivative financial instruments MTM 0 0 0 0 Liabilities for short-term derivative financial instruments MTM 114 0 (114) 0 Total net current financial debt including financial instruments 172,373 45,496 (58,130) 159,738 Up-front commissions for structured loans (current portion) (764) (691) 764 (691) Up-front commissions for structured loans (M/LT portion) (1,859) (1,302) 1,859 (1,302) Other short-term financial payables IFRS 16 3,385 29 0 3,414 Other long-term financial payables IFRS 16 20,412 0 (3,026) 17,386 Total net financial position 193,548 43,532 (58,534) 178,545
Description (thousand euros) At amortized cost Fair value Total carrying amount Assets: Trade receivables 102,111 102,111 Other short-term receivables 2,369 2,369 Current tax assets 9,506 9,506 Other short-term financial receivables 56,616 56,616 Cash and cash equivalents 73,387 73,387 Total assets 161,096 82,894 243,990 Liabilities: Long-term loans (190,668) (190,668) Trade payables (95,984) (95,984) Other short-term payables (10,579) (10,579) Current tax liabilities (8,146) (8,146) Short-term loans (97,041) (97,041) Other short-term financial payables (3,454) (3,454) Other long-term financial payables (17,386) (17,386) Total liabilities (415,112) (8,146) (423,258) Total (254,016) 74,748 (179,268)
5.9.1. SHORT-TERM DERIVATIVE FINANCIAL INSTRUMENTS
At December 31, 2022 there were no derivative financial instruments.
5.9.2. CASH AND CASH EQUIVALENTS
The value was 73,387 thousand euros at December 31, 2022 (20,201 thousand euros at December 31, 2021). This increase relates, for 50 million euros, to the medium/long-term loan taken out from Crédit Agricole
Italia for the acquisition of e-comer S.r.l. in January 2023 (see section relating to subsequent events).
Further information can be found in the cash flow statement and in the table below.
5.9.3. SHORT-TERM LOANS AND CURRENT PORTION OF MEDIUM/LONG TERM LOANS
The breakdown of current financial payables is provided below:
The item includes interest-bearing bank loans. The value of 97,041 thousand euros is made up of 41,890 thousand euros in short-term bank loans, shown gross of the short-term portion of transaction costs (equal to 691 thousand euros) treated according to the amortized cost method. The increase compared to the previous year of 27.0 million euros is attributable primarily to the short-term portion of a new loan taken out in the first half of 2022 from Unicredit, for a total of 19 million euros, and the short-term portion relating to a medium/long-term loan taken out from Crédit Agricole Italia for the acquisition of e-comer S.r.l. in January 2023 (see section relating to subsequent events) for 50 million euros.
Financial Statements at December 31, 2022 55
Description (thousand euros) Currency Carrying amount December 31, 2021 Change Carrying amount December 31, 2022 Nom. val. December 31, 2022 (LC) Cash and cash equivalents USD 4,600 12,069 16,668 17,778 Cash and cash equivalents EUR 15,599 41,119 56,719 56,719 Cash and cash equivalents GBP 2 (2) 1 1 Total cash and cash equivalents 20,201 53,186 73,387
Description (thousand euros) Currency Carrying amount December 31, 2021 Change Carrying amount December 31, 2022 Nom. val. December 31, 2022 (LC) Loan Crédit Agricole M/L current portion EUR 0 15,469 15,469 15,469 Loan Crédit Agricole M/L current portion USD 4,400 2,445 6,845 7,301 Loan CAI current portion EUR 0 10,076 10,076 10,076 Loan Unicredit EUR 10,500 (10,500) 0 0 Loan Unicredit EUR 0 9,500 9,500 9,500 Total short-term bank loans 14,900 26,990 41,890 Up-front commissions for short-term structured loans EUR (764) 72 (691) (691) Bank accounts payable and advances Comer Ind S.p.A. EUR 7,594 (2,020) 5,574 5,574 Financial payables to subsidiaries EUR 8,105 42,164 50,269 50,269 Total short-term loans 29,835 67,206 97,041
The remainder of current bank financial payables of 5.6 million euros consists: for 4.6 million euros of the cash in transit balance linked to the payment of bills payable and direct remittances at December 31, and for the remainder of the balance of advance accounts with short-term maturities.
The Company has intra-group financial payables outstanding for a total of 50.3 million euros, of which 8.2 million euros to the Chinese subsidiary Comer Industries Jiaxing, 10.9 million euros to WPG German Holdco GmbH and 18 million euros to Powertrain Services Uk.
5.9.4. LONG-TERM LOANS.
This item includes the long-term portions of the following loans:
1. Loan agreement taken out from Crédit Agricole in December 2021 and broken down as follows:
• Medium-term loan for a maximum principal amount of 170 million euros, broken down into 3 lines as follows:
- 140 million euros used for cash maturing on March 31, 2027;
- 30 million euros, usable in cash and intended to support general revolving financial requirements, to be repaid in a lump-sum at the end of the relative interest period as set forth in the utilization request, with a maximum duration of 5 years;
• Medium/long-term loan with a maximum principal amount of 50 million US dollars, maturing on March 31, 2027.
2. Loan agreement entered into with Unicredit in the first half of 2022 for a total of 19 million euros, maturing on December 31, 2023.
3. Loan agreement entered into with Crédit Agricole Italia in December 2022 for a total of 50 million euros, maturing on December 16, 2027. This loan will provide the funding for the acquisition of e-comer, which will be finalized in January 2023.
In the course of 2022, part (13.2 million euros) of the loan from Crédit Agricole, for an original amount of 50 million dollars, was repaid in advance. Furthermore, the Unicredit loan for 10.5 million euros, which had reached maturity, and 9.5 million euros of the Unicredit loan taken out in 2022 were repaid.
Reported below is the breakdown of bank loans by nature, short and medium/long-term existing as at December 31, 2022:
Financial Statements at December 31, 2022 56
Description (thousand euros) Currency Carrying amount December 31, 2021 Change Carrying amount December 31, 2022 Nom. val. December 31, 2022 (LC) Loan Crédit Agricole M/L long-term portion EUR 140,000 (14,000) 126,000 126,000 Loan Crédit Agricole M/L long-term portion USD 39,602 (13,632) 25,970 27,699 Loan CAI M/L portion EUR 0 40,000 40,000 40,000 Up-front commissions for M/LT structured loans EUR (1,859) 557 (1,302) (1,302) Total long-term borrowings 177,743 12,924 190,668
5.9.5. OTHER SHORT AND MEDIUM-TERM FINANCIAL PAYABLES
The heading refers primarily to payables deriving from the application of the new international accounting standard IFRS 16 and also to payables to shareholders for coupons not collected (40 thousand euros).
The detail for the breakdown of the item payables on December 31, 2022 and its changes are provided below:
5.9.6. COMMITMENTS AND GUARANTEES
Guarantees given amount to 23.1 million euros (29.8 million euros in 2021) and consist of commitments relating to the granting of local credit facilities in favor of subsidiaries: roughly 20.2 million euros in favor of Comer Industries Jiaxing, 1.4 million euros to Comer Industries India and 1.5 million euros to Comer Industries Brazil.
The following are complete details of the system of commitments and risks for Comer Industries S.p.A.:
57 Description (thousand euros) Balance as at 31 December, 2021 New disbursement Repayments Balance as at 31 December, 2022 < 1 year > 1 year of which > 5 years Expiry Loan Unicredit 10,500 - (10,500) - - -July 31, 2022 Loan Unicredit - 19,000 (9,500) 9,500 9,500 -December 31, 2023 CA-CIB Line A1 20,000 - - 20,000 2,000 18,000March 31, 2027 CA-CIB Line A2 120.000 - - 120,000 12,000 108,000March 31, 2027 CA-CIB Line A3 $ 44,002 - (13,200) 30,802 6,845 23,957March 31, 2027 CAI - 50,000 - 50,000 10,000 40,000December 16, 2027 Total 194,502 69,000 (33,200) 230,302 40,345 189,957 0
Financial Statements at December 31, 2022
Description (thousand euros) December 31, 2021 Increases Decreases Reclassifications December 31, 2022 Other short-term financial payables IFRS 16 3,385 - (3,385) 3,414 3,414 Shareholders for dividends 2 14,339 (14,301) - 40 Total Other short-term financial payables 3,387 14,339 (17,687) 3,414 3,454 Other long-term financial payables IFRS 16 20,412 4,095 (3,707) (3,414) 17,386 Total Other long-term financial payables 20,412 4,095 (3,707) (3,414) 17,386 Total Other financial payables 23,799 18,435 (21,394) 0 20,840
December
December
Guarantees to third parties (thousand euros) Expiry Amount Amount Guarantees given by Comer Industries S.p.A. Banco BPM for Comer Industries Components S.r.l. credit line non-revolving 0 2,500 Credem for Comer Industries Components S.r.l. credit line non-revolving 0 4,000 Banca Nazionale del Lavoro for Comer India credit line non-revolving 1,438 1,496 Banca Nazionale del Lavoro for Comer do Brazil credit line non-revolving 936 837 Banca Nazionale del Lavoro for Comer Ind (Jiaxing) Co Ltd. credit line non-revolving 8,800 8,800 Crédit Agricole for Comer do Brazil credit line November 30, 2023 532 475 Crédit Agricole for Comer Ind (Jiaxing) Co Ltd. credit line non-revolving 11,443 11,703 Total guarantees to third parties 23,149 29,811 Total guarantees received from third parties 197 56
31, 2022
31, 2021
Comer Industries S.p.A. has no commitments to finance leasing companies.
5.10. CAPITAL AND RESERVES
The share capital of Comer Industries S.p.A. as at December 31, 2022 consisted of 28,678,090 shares without nominal value and is entirely subscribed and paid-up for 18,487,338.60 euros.
The increase in the legal reserve relates to the allocation of the profit for 2021, as does the increase in the extraordinary reserve, net of the distribution of dividends settled on May 3, 2022 at 0.5 euros per share, for a total of 14.3 million euros.
The item Others refers to actuarial gains and losses from the recalculation of the provision for employee severance indemnity, as required by the revision of IAS 19.93A. The change in 2022 amounted to 726 thousand euros (gross of the fiscal impact).
The classification of reserves according to their origin, as well as changes in the course of previous years, is illustrated in the table as well as in the following notes.
The classification of equity based on the possibility of use is shown in the table below:
Financial Statements at December 31, 2022 58
Other reserves (thousand euros) December 31, 2022 December 31, 2021 Legal reserve 3,416 2,622 Extraordinary reserves available 44,571 43,821 Stock grant reserve 8,181 8,181 FTA reserve (IAS/IFRS first time adoption) 336 336 Others 427 (298) Total other reserves 56,931 54,661
Description Summary of uses in the previous three years (thousand euros) Amount Possibility of use (1) Amount available to cover losses for other reasons Share capital 18,487 0 Share Premium Reserve 187,881 A, B 187,881 Stock grant reserve 8,181 A, B 8,181 Legal reserve 3,416 B 3,416 Extraordinary reserve 44,571 A, B, C 44,323 29,558 F.T.A. reserve 336 B 336 Others 427 B 427 Profit (loss) for the year 38,044 Total 244,564 of which not distributable 200,242 of which distributable 44,323 (1) A: for capital increase B: for loss coverage C: for distribution to shareholders
5.11. DEFERRED TAX LIABILITIES
are related to the tax effect of timing differences between the profit and loss for the year for statutory purposes and taxable income. The amounts so defined are detailed in the following table:
5.12. POST-EMPLOYMENT BENEFITS
Variations in the provision were as follows:
The economic and equity effects of the period, compared with the previous year, are summarized below:
The employee severance indemnity refers to employee benefits governed by the rules and regulations in force in Italy and recorded in the financial statements of the Company.
Comer Industries S.p.A, on the basis of actuarial valuations and interpretations available on the closing date of accounts, adopted the following distinctions:
- Employee severance indemnity installments accruing as from January 1, 2007: considered a "defined contribution plan" in the case of both the option for complementary social security schemes
Financial Statements at December 31, 2022 59
Deferred tax liabilities (thousand euros) December 31, 2022 December 31, 2021 Deferred tax provision 1,615 168 Deferred tax liabilities 1,615 168 Deferred
liabilities
Company deferred tax liabilities (thousand euros) December 31,
December
Total Taxes Tot. Taxes (used) Description deferred deferred recognized Difference full rate - pro rata new assets acquired and entered into operation 2008 C S.p.A. 28 58 (30) Adjust. Items in foreign currency 1,587 110 1,477 Total deferred taxes 1,615 168 1,448
tax
2022
31, 2021 2022
Changes (thousand euros) December 31, 2022 December 31, 2021 Opening balance 5,718 6,126 Use for discharges and advances (332) (553) Settlements of complementary pensions and treasury funds (1,883) (1,916) Allocation for the year 2,296 2,023 Effects of IAS 19 recalculation period (gross of taxes) (1,037) 39 Closing balance 4,762 5,718
Description: (thousand euros) December 31, 2022 December 31, 2021 Current service cost (413) (186) Actuarial losses/(gains) (726) 126 Financial expenses 101 20 Tax effect on income statement 89 47 Equity tax effect 208 (36) Overall effect (740) (28)
as well as the option for the treasury fund of the National Security Institution (INPS). The accounting treatment is therefore the same as that in place for other types of contribution payments.
- Employee severance indemnity provision as at December 31, 2006: remains a "defined benefit plan" for which actuarial calculations must be made, although, compared to the calculations made to date (and reflected in the financial statements for the year ending December 31, 2006), excludes the component relating to future salary increases.
Liabilities for defined benefit plans have been determined on the basis of the following actuarial assumptions with value scales from 2020 to 2023:
In accordance with new regulations of IAS 19, the values of the employee severance indemnity provision that would have been obtained by changing the above actuarial assumptions are as follows:
The positive effect of the period amounting to 726 thousand euros, gross of the fiscal impact, is reflected in the actuarial gain accrued in part as a result of the increase in the discount rate, from 0.73% to 4.11%, and in part the substantial changes in the group subject to assessment in terms of new hires, resignations, retirement and requests for advances.
The composition of personnel by category, based on average data, is as follows:
At December 31, 2022, Comer Industries S.p.A. had 947 resources (877 at December 31, 2021) and the average number of resources went from 877 in 2021 to 955 in 2022.
Financial Statements at December 31, 2022 60
Italian actuarial assumptions Measuring unit December 31, 2022 December 31, 2021 Discount rate % 4.11 0.73 Expected rate of wage growth % 0.50 0.50 Expected % of employees who will resign before pension (turnover) % 5.0 5.0 Annual cost of living increase rate % 2.3 1.8 Annual rate of TFR increase % 3.2 2.8
Changes (thousand euros) Discounted severance indemnity provision Turnover rate +1.0% 4,785 Turnover rate -1.0% 4,738 Annual cost of living increase rate +0.25% 4,807 Annual cost of living increase rate -0.25% 4,717 Discount rate + 0.25% 4,692 Discount rate -0.25% 4,833
Number Number Number Number Contract category December 31, 2022 December 31, 2021 average 2022 average 2021 Senior executives 29 27 29 27 White Collar and Managers 267 263 267 265 Blue Collar and Outsourced workers 651 587 659 585 Total 947 877 955 877
5.13. SHORT AND LONG-TERM PROVISIONS
The provisions include:
The provision for product warranty risks includes the estimation of specific risks reported before the preparation of the financial statements and relating to past productions. It also refers to coverage of general risks (the result of a calculation based on historical data) for repairs or replacement of products that did not conform to expectations. The balance at the end of the year is due to the best estimate of these risks in relation to open claims, not yet settled at year end.
The Supplementary Agents Indemnity Fund includes provisions for reimbursements recognized in the event of termination of the agency relationship, quantified according to the methods indicated in the collective economic agreement of March 20, 2002 for the regulation of agency relations and commercial representation in the industrial sectors and cooperation.
The provision for contingent liabilities and legal expenses represents the reasonable risk calculated in relation to litigation or potential liabilities still pending in court regarding dismissed workers or providers of services.
5.14. TRADE PAYABLES AND OTHER LONG AND SHORT-TERM PAYABLES
The changes are as follows:
Financial Statements at December 31, 2022 61
Provisions for risks and charges (thousand euros) December 31, 2022 December 31, 2021 Provision for product warranty risks 7,146 5,821 Other provisions for risks 0 157 Short-term provisions 7,146 5,977 Agents provision 247 421 Other provisions for risks and legal charges 557 100 Provision for long-term product warranties 1,929 1,642 Other provisions for risks 8 8 Long-term provisions 2,740 2,171
Description (thousand euros) December 31, 2021 Net change December 31, 2022 Third-party trade payables (79,630) 8,286 (71,343) Subsidiary trade payables (31,683) 7,042 (24,641) Trade payables (111,312) 15,328 (95,984) Short-term payables to personnel (5,469) (897) (6,365) Payables to social security institutions (1,972) (168) (2,141) Other payables (535) (146) (681) Short-term accrued liabilities and deferred income (1,249) (143) (1,392) Other short-term payables (9,226) (1,354) (10,579) Long-term payables to personnel (3,244) (9,630) (12,874) Long-term accrued liabilities and deferred income (1,308) (226) (1,534) Other long-term payables (4,553) (9,856) (14,408)
(i) Trade payables
The balance of 95,984 thousand euros, which includes advances from customers, decreased by roughly 15 million euros compared to the previous year, primarily due to the reduction in average payment days, which went from 137 at December 31, 2021 to 104 at December 31, 2022. There are no payables expiring after more than one year or expired for more than 12 months.
(ii) Other long and short-term payables
The short-term balance amounting to 10,579 thousand euros primarily includes amounts due to employees (amounting to 6,365 thousand euros) for services accrued and not paid as at year-end close and payables to pension and social security institutions (2,141 thousand euros). The long-term balance, of 14,408 thousand euros, includes for 12,874 thousand euros payables to directors and top managers with strategic responsibilities, relating to long-term loyalty plans correlated with business performance.
The balance of short- and long-term accrued liabilities and deferred income mainly represents the suspended share of income linked to operating asset tax credits, which follow the amortization plan of operating assets subject to tax relief.
5.15. CURRENT TAX LIABILITIES
The details are as follows:
At the end of the year there were liabilities with tax authorities for current taxes calculated on income for the period.
The amount owed to the tax authorities for IRPEF (personal income tax) is in line with the previous year.
5.16. INFORMATION ON FINANCIAL ASSETS AND LIABILITIES
5.16.1. MANAGEMENT OF LIQUIDITY RISK
Liquidity risk is related to the difficulty in raising funds to meet commitments.
The control and implementation of appropriate policies for the management of liquidity risk in the presence of contingency guarantee the Company's survival and minimize the cost of funding. This particular risk, unlike the others, manifests its effects in a very short time, with devastating consequences for companies.
It can result from insufficient resources available to meet financial obligations under the terms and deadlines set in the case of sudden revocation of uncommitted credit lines or of the possibility that the Company must honor its financial liabilities before their natural expiry.
As previously commented, the treasury activities of the Group are substantially centralized at Comer Industries S.p.A.
In the course of 2022, the Group developed a cash pooling project with leading financial institutions to optimize the cash flows of companies resident in foreign countries. This project is expected to be concluded in 2023. The management of liquidity risk implies:
Financial Statements at December 31, 2022 62
Description (thousand euros) December 31, 2022 December 31, 2021 Tax authority balance for current taxes 6,668 3,227 Tax authority for IRPEF withholdings 1,478 1,508 Current tax liabilities 8,146 4,735
• Maintaining credit lines defined as primary risk within a total of more than 80% of total credit lines and a substantial balance between the short and medium/long-term lines. This is necessary in order to avoid liquidity strains in the case of requests for reimbursement by the relevant financial partners.
• Maintaining the average financial exposure for the year within an amount substantially equivalent to 80% of the total amount committed by the banking system.
• Maintaining adequate liquidity derived from the cash flow generated by economic, characteristic and current operations.
It should be added that in managing this type of risk, the Company always tries to finance its investments with medium- to long-term unsecured loans (in addition to equity) in the breakdown of net debt, while covering current expenses using the short-term credit lines above.
5.16.2. MANAGEMENT OF INTEREST RATE RISK
The company is exposed to the risk of changes in interest rates associated with outstanding financial assets and liabilities. The objective of interest rate risk management is to limit and stabilize the negative effects on cash flows subject to changes in interest rates. At December 31, 2022, the company has no interest rate risk hedging instruments, given its limited financial debt.
The risk is related to financial instruments on which interest accrues that are at a variable rate and which are not hedged through other financial instruments.
For the latter, a sensitivity analysis was performed in which the effects of a change in interest rates of ±50 basis points with respect to the spot interest rates at December 31, 2022 were considered, all other variables remaining constant.
Potential impacts were calculated on floating rate financial liabilities as of December 31, 2022. The aforementioned change in interest rates would result in a higher (or lower) net pre-tax charge, as discussed below:
5.16.3. MANAGEMENT OF CREDIT RISK
Comer Industries S.p.A.'s policy is to sell to customers after an evaluation of their credit capacity and therefore within pre-set credit limits. Historically, the Company has not suffered significant losses on receivables. The maximum theoretical exposure to credit risk for Comer Industries S.p.A. as at December 31, 2022 is represented by the book value of financial assets in the financial statements.
Financial Statements at December 31, 2022 63
Change ±50 bps min val (-50bps) max val (+50 bps) Index Spread Rate Capital Interest Rate Economic effect Rate Economic effect Loan Unicredit Euribor 3 months 2.132% 0.50% 2.63% € 9,500 € 250 2.132% € -48 3.132% € 48 Cacib Line A1 Euribor 6 months 2.693% 1.00% 3.69% € 120,000 € 4,432 3.193% € -600 4.193% € 600 Cacib Line A2 Euribor 6 months 2.693% 1.00% 3.69% € 20,000 € 739 3.193% € -100 4.193% € 100 CAI Euribor 6 months 2.693% 1.150% 3.84% € 50,000 € 1,922 3.343% € -250 4.343% € 250 Cacib Line A3 $ Libor 6 months 4.170% 1.15% 5.32% $ 35,000 € 1,757 4.820% € -165 5.820% € 165 Total € 9,098 € -1,163 € 1,163
With reference to the changed economic conditions that marked the year 2022, it is believed that the risk connected to the reference value is higher. Consequently, the Company has strengthened its procedures for the selection of customers, monitoring of recoveries of credit and has set up a specific insurance coverage for 95% of receivables generated (with the exception of several historical customers with a grade of highly reliable), in respect of the credit lines assigned. The risk of insolvency has been adequately reflected in the accounts by the allocation of the specific allowance for doubtful accounts.
As at December 31, 2022, the representation by ranges of expired trade receivables (net of the allowance for doubtful accounts) is represented by the following table.
5.16.4. MANAGEMENT OF PRICE RISK
Comer Industries S.p.A. is subject to the risk of fluctuations in the price of raw materials, particularly that of: aluminum, cast iron, copper and steel. Comer Industries S.p.A. reviews the sales prices of the products annually, transferring to customers increases in purchase costs in percentage terms compared to forecast indexes, on the basis of specific trade indexing agreements.
5.17. REVENUES FROM CONTRACTS WITH CUSTOMERS
The breakdown of revenues by geographic region is as follows:
The Company closed the year 2022 with an increase in revenues of 20.4%, reaching 427.5 million euros, with respect to 354.9 in the previous year, driven primarily by agricultural sector growth. Export turnover represents 81% of the total, in line with 2021. At geographical level, there was a reduction of the market in Asia and growth in the North American and European markets.
Financial Statements at December 31, 2022 64
Description (thousand euros) December 31, 2022 December 31, 2021 Not overdue 98,291 81,026 30 - 60 days past due 2,191 3,363 60 - 90 days past due 911 1,678 More than 90 days past due 3,152 2,804 Allowance for doubtful accounts (2,434) (2,319) Trade receivables 102,111 86,552
Description (thousand euros) December 31, 2022 December 31, 2021 ASIA PACIFIC 11,643 12,730 EMEA 303,396 239,184 LATIN AMERICA 13,034 23,280 NORTH AMERICA 99,391 79,742 Total revenue by geographical area 427,464 354,936
5.18. OTHER OPERATING REVENUES
The breakdown of other operating revenues is as follows:
The recovery of production, repairs, services and transport costs heading includes, among other things, bonuses and volume awards on supplies, charges for design and endurance test expenses, and the recovery of logistical and repair costs. The figure is on the whole aligned with the previous year. The item scrap sales, of 475 thousand euros, is aligned with 2021.
Costs capitalized during the year for industrial product development projects amount to 275 thousand euros, net of decreases for abandoned projects of 14 thousand euros.
The item Other income and revenues includes royalties received from subsidiaries of 6,934 thousand euros (7,457 thousand euros in 2021); the share for the year of tax receivables on operating assets of 650 thousand euros; and other revenues for 4.7 million euros deriving from the application of the adjustment of the intragroup margin as defined by the TP policy.
5.19. PERSONNEL COSTS
Personnel costs increased by 17.0% compared with the previous year. This increase reflects the combined effect of the higher number of employees employed during the year following the increase in volumes, and the increased use of temporary personnel.
This item also includes the provision recognized for variable salary and the annual production bonus, as well as a long-term loyalty plan linked to the achievement of pre-determined and measurable consolidated performance targets for the CEO and several top figures with strategic responsibilities.
5.20. REMUNERATION OF DIRECTORS AND STATUTORY AUDITORS
The fees of the Directors and Statutory Auditors of Comer Industries S.p.A. are as follows:
The amounts include fees payable for the period resolved by the Shareholders’ Meeting, the remuneration established by the Board of Directors for directors attributed particular responsibilities, including bonuses, and the share of long-term incentive schemes that has become certain during the year. The values do not include social security and insurance contributions.
The Company has no stock grant and/or stock option plans in place as of today.
Financial Statements at December 31, 2022 65
Description (thousand euros) December 31, 2022 December 31, 2021 Recovery of manufacturing, repair, service and transportation expenses 2,130 1,692 Scrap sales 475 489 Photovoltaic refund 39 33 Capitalized costs net of disposal costs 261 382 Other revenues and income 13,295 9,336 Total other revenues and income 16,200 11,931
Description (thousand euros) December 31, 2022 December 31, 2021 Directors 2,299 1,211 Chief Executive Officer (service cost value share-based payment stock grant plan) - 2,194 Statutory Auditors 50 50 Total compensation 2,349 3,455
5.21. OTHER OPERATING COSTS AND WRITE-DOWNS
Other operating costs break down as follows:
The item other operating costs includes indirect charges associated with turnover, production and the corporate organizational structure such as rentals, utilities, leases and maintenance, insurance expenses, sales commissions and expenses related to product quality.
The change in the item Agency and brokerage commissions reflects the combined effect of the decline in foreign commissions, following foreign turnover trends, and the increased efficiency of the European sales organization. The item other operating costs includes, inter alia, provisions recognized as described in more detail in paragraph 5.13 Short and long-term provisions.
As required by Article 149-duodecies of the Issuer Regulation amended by Consob Resolution no. 15915 of May 3, 2007 published in Official Gazette no. 111 of May 15, 2007 (SO 115), the remuneration for the year 2022 for services provided by the independent auditors Deloitte & Touche S.p.A. relating to the certification of the 2021 financial statements is as follows:
o annual and interim auditing engagements for 79.5 thousand euros;
o certification of compliance certificate on financial loans and asseveration of R&S credit calculation schedules R&D LD145/2013 and L. 145/2018 for 5 thousand euros; All the above-described fees are included in the “other operating costs” heading.
5.22. OPERATING RESULT
The operating result achieved, in absolute terms, is equivalent to 35,779 thousand euros, corresponding to 8.1% of turnover (5.3% in the previous year). A better representation of the Company’s operating performance is provided by the EBITDA commented on previously in the Directors' Report.
Financial Statements at December 31, 2022 66
Description (thousand euros) December 31, 2022 December 31, 2021 Rents 465 87 Insurance 907 1,862 Agency and brokerage fees 799 901 Consulting 2,471 2,313 Membership fees 24 24 IMU tax 15 17 Maintenance 2,798 2,576 Communication, Marketing and Trade Shows 797 522 Transportation 14,691 15,628 Utilities 5,108 2,641 Travel and trips 706 194 Other operating costs 5,402 5,412 Total other operating costs 34,184 32,177
5.23. NET FINANCIAL INCOME / (CHARGES)
The details are as follows:
(i) Exchange gains and losses
This item includes both realized differences between the historical exchange rates of the relevant transactions and the reference exchange rates of receipts and payments in foreign currency, and unrealized differences due to the translation of monetary items at the spot exchange rate at the end of the financial year. The profit is mainly attributable to the latter case, and in particular to the revaluation of the dollar against the euro.
(ii) Interest and other net financial charges
The interest charge on mortgages and loans, both long and short-term, has inevitably increased due the medium/long-term loan agreements entered into in 2021 and 2022. The negative effect of financial interest expense is offset by a more than proportional increase in interest income deriving from financial agreements in place with several subsidiaries.
(iii) Dividends from subsidiaries
In the course of 2022, the Company accounted for dividends from subsidiaries for a total of 12,469 thousand euros, of which 3,358 thousand euros from Comer Industries Inc., 295 thousand euros from Comer Industries Uk, 1,900 thousand euros from the Italian subsidiary Comer Industries Components Srl and 6,916 thousand euros from Comer Industries Shaoxing. In 2021, it accounted for dividends for a total of 2,748 thousand euros.
Financial Statements at December 31, 2022 67
Description (thousand euros) December 31, 2022 December 31, 2021 Exchange gain (loss) 764 (335) Exchange gains and losses 764 (335) Bank interest receivable 0 3 Interest income from group companies and parent company 6,711 387 Other interest income 54 51 Total financial income from cash management 6,765 440 Interest expense to group companies and parent company (248) (105) Interest on advances, loans and other short-term bank borrowings (71) (4) Interest on medium/long-term loans (4,434) (459) Interest on loans amortized cost (779) (486) Interest expense on discounted employee severance indemnities (101) (20) Losses on disposal of equity investments - (196) Economic result of interest rate hedging transactions fair value as at 31 December 137 141 Total financial costs from cash management (5,497) (1,128) Interest resulting from the application of IFRS 16 (272) (273) Interest resulting from the application of IFRS 16 (272) (273) Interest and other net financial charges 1,760 (1,296) Dividends from subsidiaries 12,469 2,748
5.24. INCOME TAXES
The total tax charge of 11,964 thousand euros primarily includes current income taxes of 12.6 million euros (6.1 million euros in 2021), net revenue from the recalculation of deferred tax liabilities of 1.8 million euros, withholdings for dividends equal to 816 thousand euros and contingent liabilities for taxes from previous years of 327 thousand euros.
The tax charge net of taxes on dividends from subsidiaries and taxes from previous years, calculated on the item Pre-tax profit excluding dividends from subsidiaries, stands at around 28.4% at December 31, 2022 (28.1% in 2021). Please note that Comer Industries S.p.A. is categorized as a non-financial holding company subject to the regulations laid out in art. 162-bis of the Consolidated Income Tax Act, Italian Presidential Decree 917/86, where inter alia it is subject to an increased IRAP rate of 4.65%.
In order to better understand the reconciliation between the tax burden recognized in the financial statements and the theoretical tax burden, the following explanatory table is provided wherein the IRAP is not considered as this, being a tax with a tax base different from income before taxes, would generate distortions between one year and another. The reconciliation was therefore determined with reference to the only IRES tax rate in force in Italy, equal to 24% applied to the pre-tax profit already as of 2017.
5.25. EARNINGS PER SHARE
At the bottom of the income statement, the earnings/(loss) per share is reported, determined according to that manner provided in IAS 33, as summarized below.
Financial Statements at December 31, 2022 68
Description (thousand euros) December 31, 2022 December 31, 2021 Profit before Tax 50,008 20,796 Parent Company theoretical tax rate 24% 24% Theoretical income taxes 12,002 4,991 Tax effect permanent differences (50) (257) Tax effect dividends received from subsidiaries (2,176) (566) Bonus tax credit Legislative Decree 91/2014 (25) (25) ACE tax effect (89) (84) Tax effect R&D credit Law 190/2014 art.1, para. 35 (395) (191) Tax effect super-amort/depr (Law 208/2015) and hyper-amort/depr (Law 232/2016) (397) (525) Energy tax credit tax effect (228) 0 Prior-year taxes and provisions 327 (60) Tax effect of actuarial gain (loss) IAS 19 174 (30) Other minor items including impact of IRAP on deferred items 122 125 Income taxes recorded in the financial statements, excluding IRAP 9,265 3,378 Current IRAP 2,699 1,534 Income taxes posted to the financial statements (current and deferred) 11,964 4,912
Description (thousand euros) December 31, 2022 December 31, 2021 Net income for the period attributable to Parent Company shareholders 38,044,344 15,883,789 Average number of shares in circulation 28,678,090 28,678,090 Basic earnings per share for the year in euros 1.33 0.55 Number of ordinary shares outstanding at the date of approval of the financial statements 28,678,090 28,678,090 Basic earnings per share on the number of shares outstanding at the date of approval of the financial statements 1.33 0.55
The means of calculation of diluted earnings (loss) per share are defined by IAS 33 – Earnings per share. The basic earnings (loss) per share is defined as the ratio between the economic result or the results of continuing operations of Comer Industries S.p.A. attributable to the holders of ordinary shares and the number of ordinary outstanding at the end of the fiscal year (28,678,090).
Financial Statements at December 31, 2022 69
5.26. ECONOMIC AND BALANCE SHEET DATA OF THE COMPANY EXERCISING DIRECTION AND COORDINATION OF THE COMPANY
In compliance with the provisions of art. 2497 bis of the Italian Civil Code, Comer Industries S.p.A. presents in this section the schedule of the essential data of the parent company Eagles Oak S.r.l.
As mentioned in the introduction, this company has exercised management and coordination activities over the parent company, Comer Industries S.p.A.
The last approved financial statements of Eagles OAK S.r.l. date back to December 31, 2021, already set out in the previous financial statements.
EAGLES OAK S.R.L.
Tax number and VAT code 03699500363
VIALE DEL SAGITTARIO 5 - 41126 MODENA MO Economic and Administrative Index (R.E.A) 410236 MODENA Business Register no. 03699500363
Share Capital 2,000,000.00 euros, entirely paid-up
Balance sheet
Financial Statements at December 31, 2022 70
Balance sheet December 31,
December 31, 2020 Assets B) Fixed assets III – Financial assets 31,916,782 31,916,782 Total fixed assets (B) 31,916,782 31,916,782 C) Current assets II – Receivables due within the next year 76,530 81,382 Total receivables 76,530 81,382 IV – Cash and cash equivalents 935,190 638,470 Total current assets (C) 1,011,720 719,852 Total assets 32,928,502 32,636,634 Liabilities A) Equity I – Capital 2,000,000 2,000,000 III – Revaluation reserves 72,462 72,462 IV – Legal reserve 400,000 400,000 VI – Other reserves 11,885,514 18,732,125 IX – Profit/(loss) for the year 7,016,401 1,653,389 Total equity 21,374,377 22,857,976 D) Payables due within the next year 6,114,125 3,838,658 due after the next year 5,440,000 5,940,000 Total payables 11,554,125 9,778,658 Total liabilities 32,928,502 32,636,634
2021
Income statement
These financial statements give a true and fair view and correspond to the accounting records.
Reggiolo, March 21, 2023
For the Board of Directors
Matteo Storchi (President & CEO)
Financial Statements at December 31, 2022 71
Income statement December 31, 2021 December 31, 2020 B) Costs of production 7) for services 47,318 44,188 10) depreciation, amortization and write-downs a), b), c) depreciation and amortization of tangible and intangible assets, other write-downs of fixed assets - 1,188 a) amortization of intangible assets - 1,188 Total depreciation, amortization and write-downs - 1,188 14) other operating costs 15,012 15,144 Total costs of production 62,330 60,520 Difference between value and costs of production (A - B) (62,330) (60,520) C) Financial income and expenses 15) income from investments from subsidiaries 7,320,045 5,124,031 Total income from investments 7,320,045 5,124,031 16) other financial income d) income other than the above others 334 204 Total income other than the above 334 204 Total other financial income 334 204 17) interest and other borrowing costs to subsidiaries - 3,147,775 others 241,648 262,651 Total interest and other borrowing costs 241,648 3,410,426 Total financial income and expenses (15 + 16 - 17 + - 17-bis) 7,078,731 1,713,809 Pre-tax result (A - B + - C + - D) 7,016,401 1,653,289 20) Income taxes for the year, current and deferred taxes taxes relating to previous years - (100) Total income taxes for the year, current and deferred taxes - (100) 21) Profit/(loss) for the year 7,016,401 1,653,389
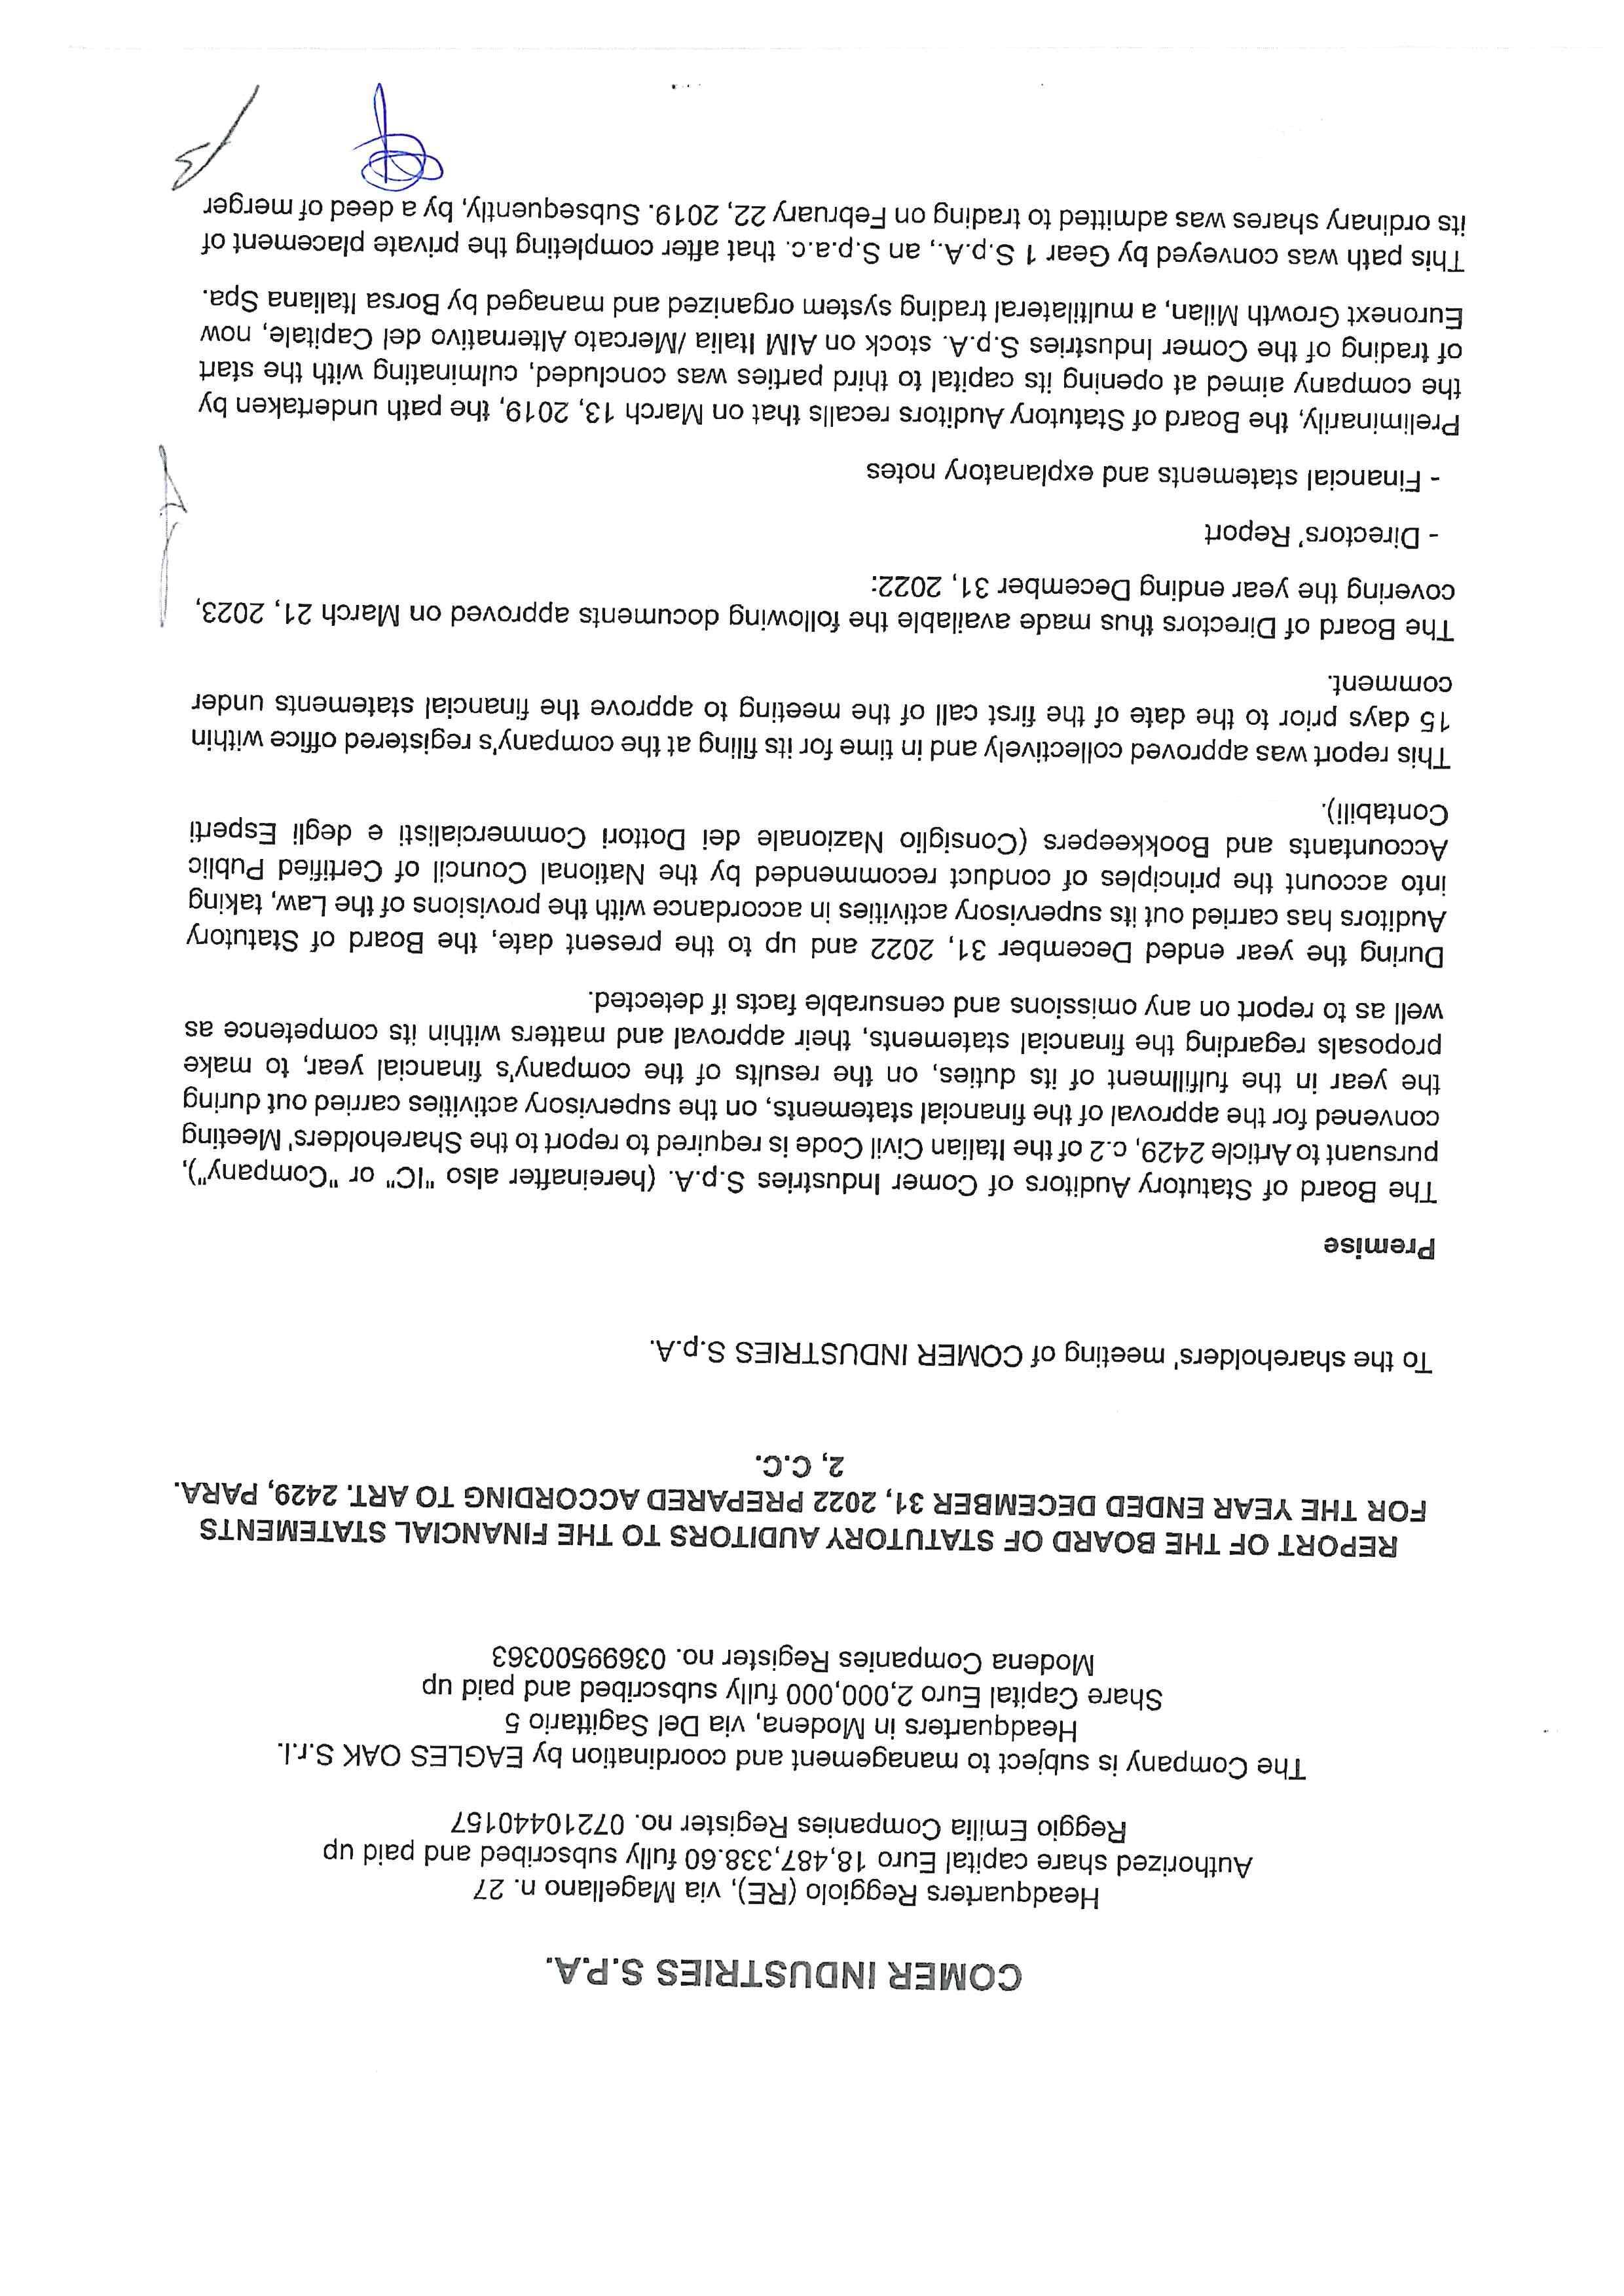
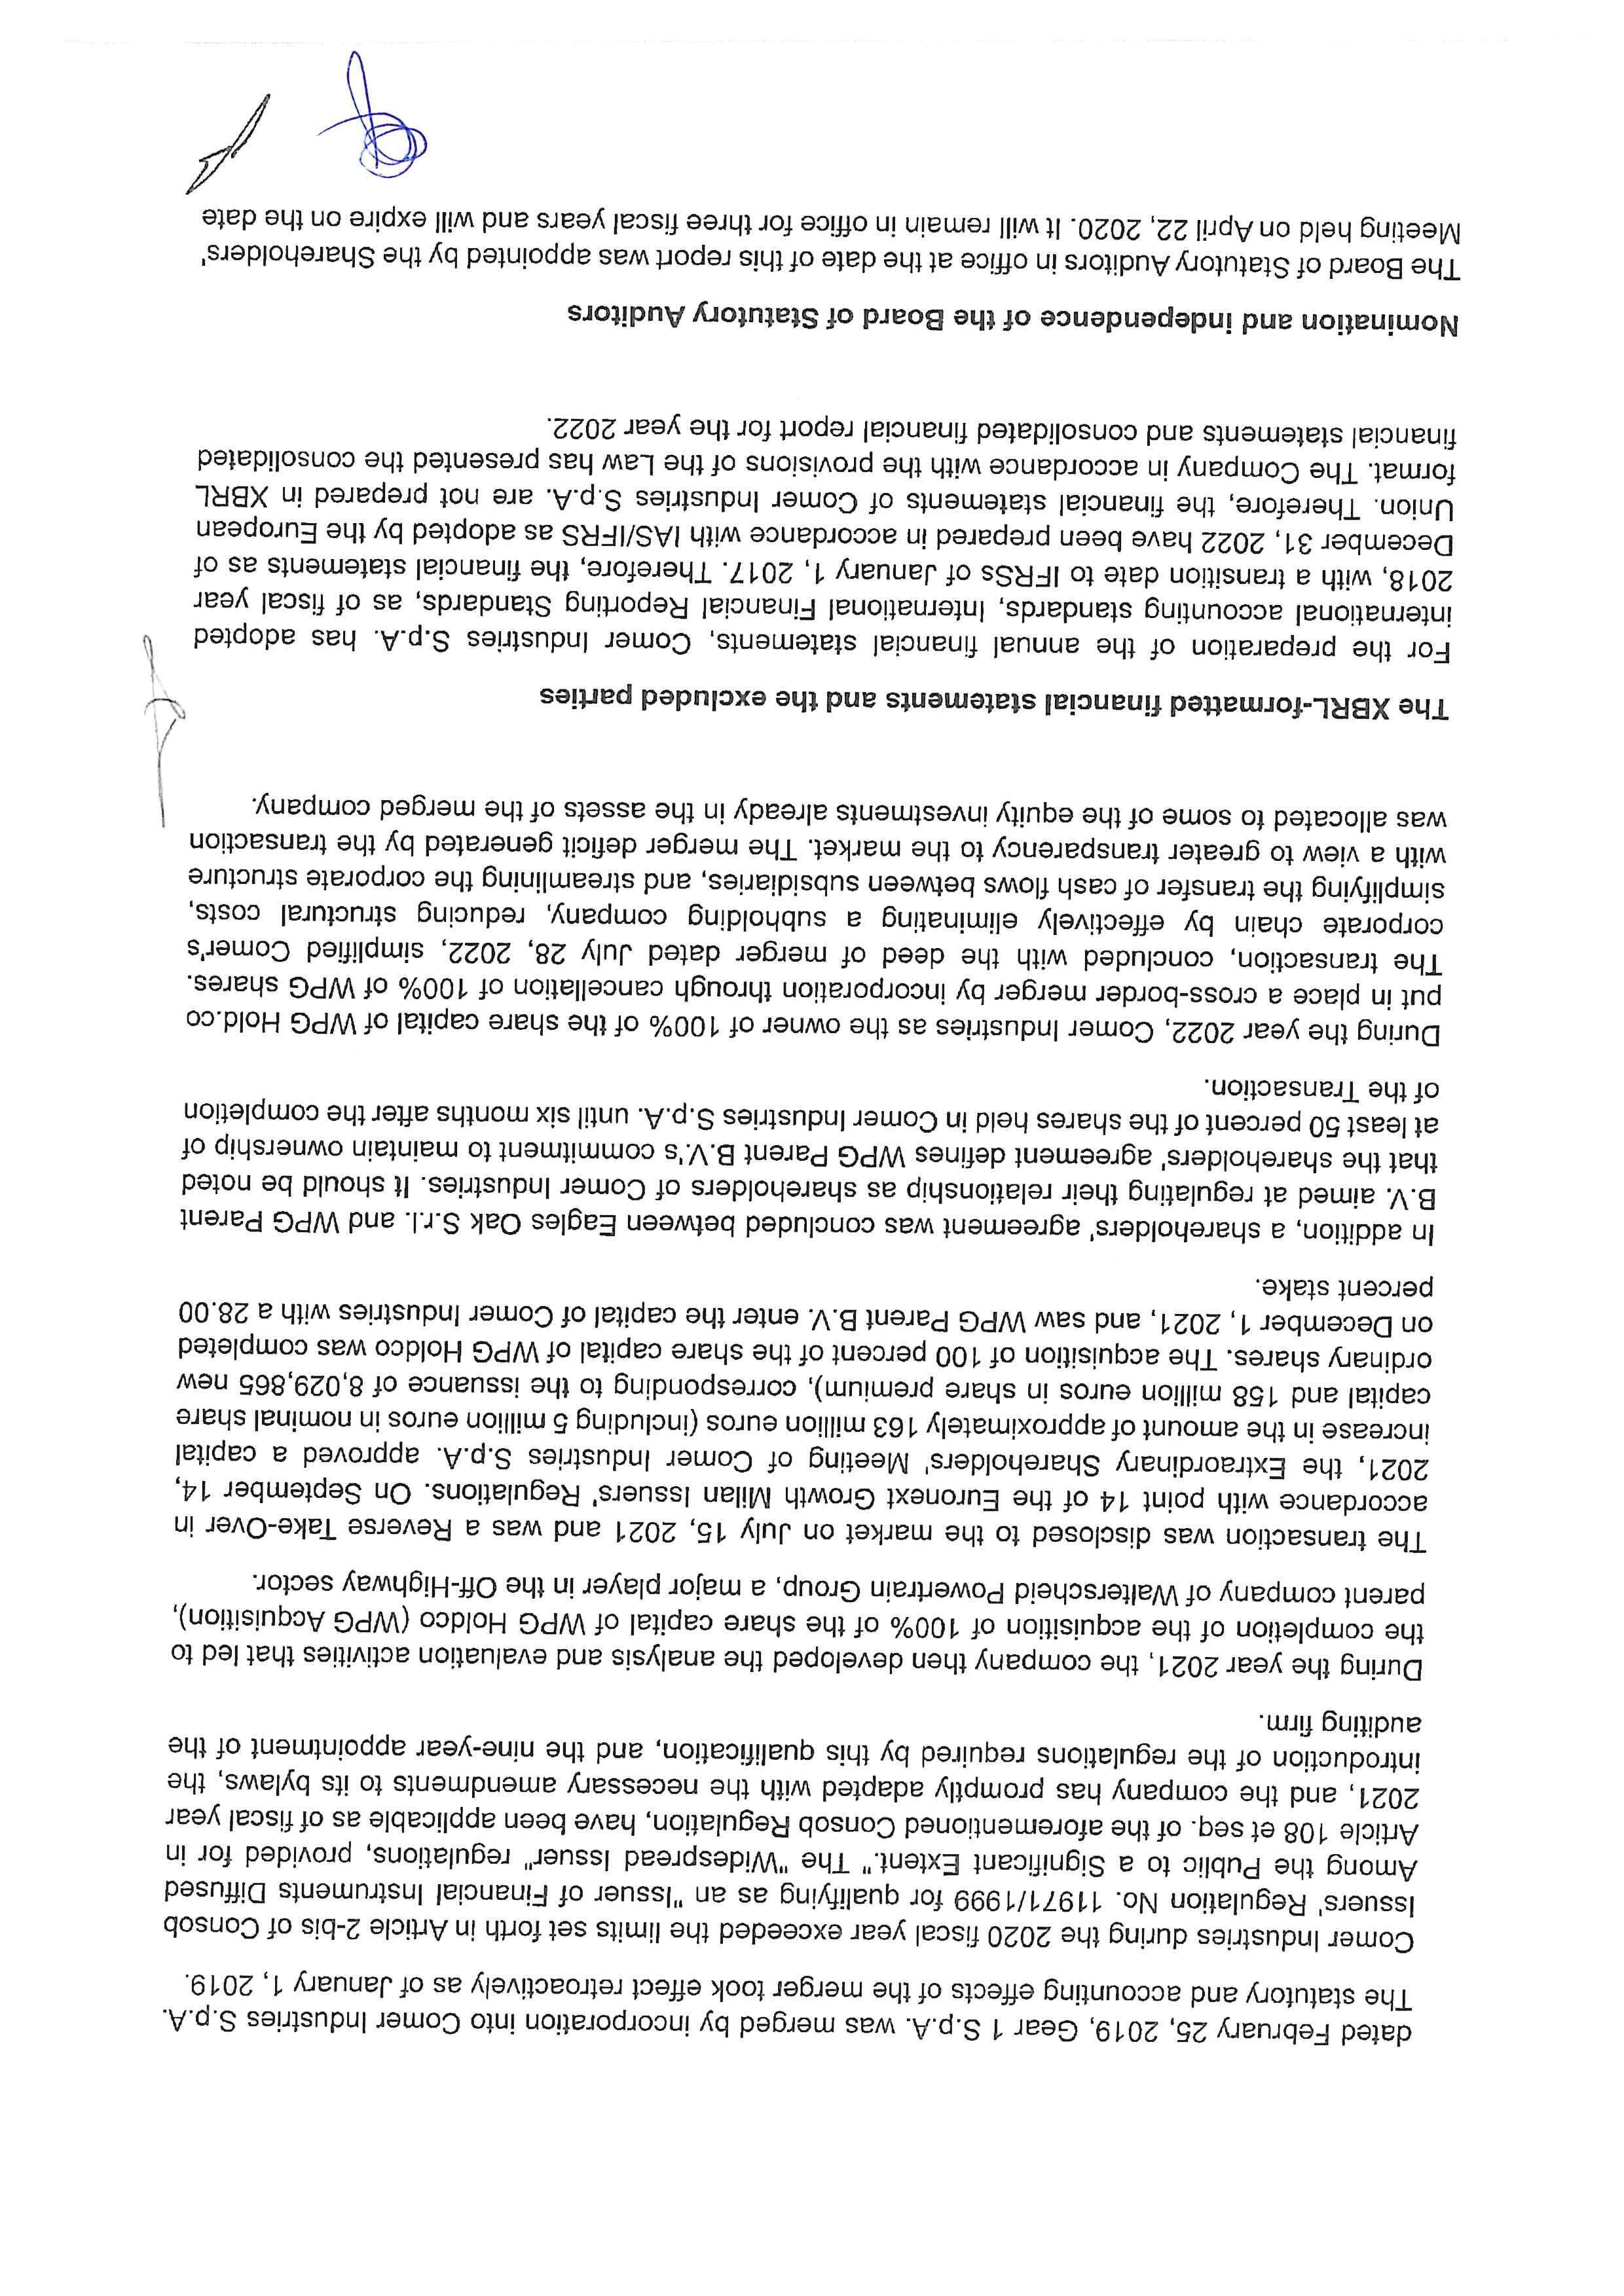
Tel: +39 051 65811
Fax: +39 051 230874 www.deloitte.it
INDEPENDENT AUDITOR’S REPORT
PURSUANT TO ARTICLE 14 AND 19-BIS OF LEGISLATIVE DECREE No. 39 OF JANUARY 27, 2010
To the Shareholders of Comer Industries S.p.A.
REPORT ON THE AUDIT OF THE FINANCIAL STATEMENTS Opinion
We have audited the financial statements of Comer Industries S.p.A. (the “Company”), which comprise the statement of financial position as at December 31, 2022, and the comprehensive income statement, statement of changes in equity and cash flows statement for the year then ended, and notes to the financial statements, including a summary of significant accounting policies.
In our opinion, the accompanying financial statements give a true and fair view of the financial position of the Company as at December 31, 2022, and of its financial performance and its cash flows for the year then ended in accordance with International Financial Reporting Standards as adopted by the European Union.
Basis for Opinion
We conducted our audit in accordance with International Standards on Auditing (ISA Italia). Our responsibilities under those standards are further described in the Auditor’s Responsibilities for the Audit of the Financial Statements section of our report. We are independent of the Company in accordance with the ethical requirements applicable under Italian law to the audit of the financial statements. We believe that the audit evidence we have obtained is sufficient and appropriate to provide a basis for our opinion.
Responsibilities of the Directors and the Board of Statutory Auditors for the Financial Statements
The Directors are responsible for the preparation of financial statements that give a true and fair view in accordance with International Financial Reporting Standards as adopted by the European Union and, within the terms established by law, for such internal control as the Directors determine is necessary to enable the preparation of financial statements that are free from material misstatement, whether due to fraud or error.
In preparing the financial statements, the Directors are responsible for assessing the Company’s ability to continue as a going concern, disclosing, as applicable, matters related to going concern and using the going concern basis of accounting unless they have identified the existence of the conditions for the liquidation of the Company or the termination of the business or have no realistic alternatives to such choices.
AnconaBari BergamoBolognaBresciaCagliariFirenzeGenovaMilanoNapoli Padova ParmaRomaTorinoTreviso UdineVerona
Sede Legale:Via Tortona, 25- 20144Milano| CapitaleSociale:Euro 10.328.220,00i.v.
Codice Fiscale/Registro delle Imprese diMilanoMonzaBrianzaLodin. 03049560166- R.E.A. n.MI-1720239 |PartitaIVA: IT03049560166
Il nome Deloitte siriferiscea una opiù delle seguenti entità:DeloitteTouche TohmatsuLimited,unasocietàinglese aresponsabilitàlimitata(“DTTL”),le member firm aderenti alsuo networke leentità aesse correlate.DTTL e ciascuna delle sue member firm sonoentitàgiuridicamente separate e indipendentitraloro. DTTL (denominataanche “Deloitte Global”) nonfornisceservizi ai clienti. Siinvita aleggerel’informativacompletarelativa alladescrizione dellastruttura legaledi Deloitte Touche TohmatsuLimitede delle sue member firm all’indirizzo www.deloitte.com/about.
 ©Deloitte& Touche S.p.A.
Deloitte & Touche S.p.A. Piazza Malpighi, 4/2 40123 Bologna Italia
The Board of Statutory Auditors is responsible for overseeing, within the terms established by law, the Company’s financial reporting process.
Auditor’s Responsibilities for the Audit of the Financial Statements
Our objectives are to obtain reasonable assurance about whether the financial statements as a whole are free from material misstatement, whether due to fraud or error, and to issue an auditor’s report that includes our opinion. Reasonable assurance is a high level of assurance, but is not a guarantee that an audit conducted in accordance with International Standards on Auditing (ISA Italia) will always detect a material misstatement when it exists. Misstatements can arise from fraud or error and are considered material if, individually or in the aggregate, they could reasonably be expected to influence the economic decisions of users taken on the basis of these financial statements.
As part of an audit in accordance with International Standards on Auditing (ISA Italia), we exercise professional judgment and maintain professional skepticism throughout the audit. We also:
• Identify and assess the risks of material misstatement of the financial statements, whether due to fraud or error, design and perform audit procedures responsive to those risks, and obtain audit evidence that is sufficient and appropriate to provide a basis for our opinion. The risk of not detecting a material misstatement resulting from fraud is higher than for one resulting from error, as fraud may involve collusion, forgery, intentional omissions, misrepresentations, or the override of internal control.
• Obtain an understanding of internal control relevant to the audit in order to design audit procedures that are appropriate in the circumstances, but not for the purpose of expressing an opinion on the effectiveness of the Company's internal control.
• Evaluate the appropriateness of accounting policies used and the reasonableness of accounting estimates and related disclosures made by the Directors.
• Conclude on the appropriateness of management’s use of the going concern basis of accounting and, based on the audit evidence obtained, whether a material uncertainty exists related to events or conditions that may cast significant doubt on the Company’s ability to continue as a going concern. If we conclude that a material uncertainty exists, we are required to draw attention in our auditor’s report to the related disclosures in the financial statements or, if such disclosures are inadequate, to modify our opinion. Our conclusions are based on the audit evidence obtained up to the date of our auditor’s report. However, future events or conditions may cause the Company to cease to continue as a going concern.
• Evaluate the overall presentation, structure and content of the financial statements, including the disclosures, and whether the financial statements represent the underlying transactions and events in a manner that achieves fair presentation.
We communicated with those charged with governance, identified at an appropriate level as required by ISA Italia, regarding, among other matters, the planned scope and timing of the audit and significant audit findings, including any significant deficiencies in internal control that we identify during our audit.
2
REPORT ON OTHER LEGAL AND REGULATORY REQUIREMENTS
Opinion pursuant to art. 14, paragraph 2 (e) of Legislative Decree 39/10
The Directors of Comer Industries S.p.A. are responsible for the preparation of the Directors’ Report of the Company as at December 31, 2022, including its consistency with the related financial statements and its compliance with the law.
We have carried out the procedures set forth in the Auditing Standard (SA Italia) n. 720B in order to express an opinion on the consistency of the Directors’ Report with the financial statements of the Company as at December 31, 2022 and on its compliance with the law, as well as to make a statement about any material misstatement.
In our opinion, the Directors’ Report is consistent with the financial statements of Comer Industries S.p.A. as at December 31, 2022 and is prepared in accordance with the law.
With reference to the statement referred to in art. 14, paragraph 2 (e), of Legislative Decree 39/10, made on the basis of the knowledge and understanding of the entity and of the related context acquired during the audit, we have nothing to report.
DELOITTE & TOUCHE S.p.A.
Signed by Stefano Montanari Partner
Bologna, Italy
March 24, 2023
This report has been translated into the English language solely for the convenience of international readers. Accordingly, only the original text in Italian language is authoritative.
3