Chapter 1 . Topic 1
Population dynamics Learning objectives: • • • • •
Describe and give reasons for the rapid increase in the world’s population. Show an understanding of over-population and under-population. Understand the main causes of a change in population size. Give reasons for contrasting rates of natural population change. Describe and evaluate population policies.
Why are some families larger than others? Population growth
Skills link
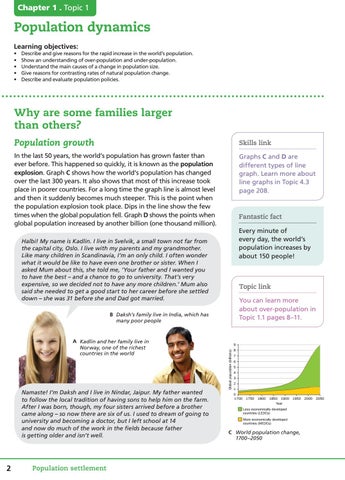
In the last 50 years, the world’s population has grown faster than ever before. This happened so quickly, it is known as the population explosion. Graph C shows how the world’s population has changed over the last 300 years. It also shows that most of this increase took place in poorer countries. For a long time the graph line is almost level and then it suddenly becomes much steeper. This is the point when the population explosion took place. Dips in the line show the few times when the global population fell. Graph D shows the points when global population increased by another billion (one thousand million).
Graphs C and D are different types of line graph. Learn more about line graphs in Topic 4.3 page 208.
Fantastic fact Every minute of every day, the world’s population increases by about 150 people!
Halbi! My name is Kadlin. I live in Svelvik, a small town not far from the capital city, Oslo. I live with my parents and my grandmother. Like many children in Scandinavia, I’m an only child. I often wonder what it would be like to have even one brother or sister. When I asked Mum about this, she told me, ‘Your father and I wanted you to have the best – and a chance to go to university. That’s very expensive, so we decided not to have any more children.’ Mum also said she needed to get a good start to her career before she settled down – she was 31 before she and Dad got married.
Topic link You can learn more about over-population in Topic 1.1 pages 8–11.
B Daksh’s family live in India, which has many poor people
Namaste! I’m Daksh and I live in Nindar, Jaipur. My father wanted to follow the local tradition of having sons to help him on the farm. After I was born, though, my four sisters arrived before a brother came along – so now there are six of us. I used to dream of going to university and becoming a doctor, but I left school at 14 and now do much of the work in the fields because father is getting older and isn’t well.
2
9 Global population (billions)
A Kadlin and her family live in Norway, one of the richest countries in the world
8 7 6 5 4 3 2 1 0 1700 1750 1800 1850 1900 1950 2000 2050 Year Less economically developed countries (LEDCs) More economically developed countries (MEDCs) Actual population
C World population change, Predicted population 1700–2050
Population settlement
233319_CIE_Geography_Sample.indd 2
10/27/16 1:45 PM
1.1 Effects of population growth on people
7
An increasing population can also have economic benefits: • There are more customers to buy locally made goods. This creates jobs close to where people live. • Manufacturing large quantities means goods can be made more cheaply, so more people can afford to buy them. • Cheaper goods means they are easier to sell abroad, which earns extra money for the country. • More jobs means less unemployment, which enables parents to provide their children with a better standard of living. More people
more workers
increased output
1999
6
1987
5 Global population (billions)
Population increase affects people and places in different ways. A population can grow so rapidly that there are no longer enough essential resources such as food and water. This is called overpopulation.
31 October 2011
4
1974
3
1959
2
1
1927
1804
0 1800
1850
1900
1950
2000
2050
Year
D World population 1800–2011: the ‘billion-person points’
more to sell
greater wealth
Now Investigate 1 What are some factors that influence family size? How many people are there in your own family? 2 The world’s population increases by 150 people every minute. Use a calculator to work out how many million extra people there are in a year. 3 a) Copy and complete the following table, using information on graph D.
b) What does your table tell you about how quickly the world’s population increased after the year 1900?
4 Referring to graph C, select the correct number from those shown in brackets.
b) The world’s population in 2000 was about (6/7/8/9) billion people.
c) In 2000, most people lived in (developed/developing) countries.
d) The population explosion began (before/after) 1750.
e) The rate of world population growth is (slowing down/speeding up/staying about the same).
f) The global population in 2050 is predicted to be about (7/8/9/10) billion people.
a) The world’s population in 1700 was about (50/100/250/750) million people.
Billion-people points First
Second
Second
Third
Third
Fourth
Fourth
Fifth
Fifth
Sixth
Sixth
Seventh
Number of years between these two points
Chapter 1.1: Population dynamics
233319_CIE_Geography_Sample.indd 3
3
10/27/16 1:45 PM
Why did the population explosion happen?
1600
The population explosion took place in two stages. The first was in the earliest industrialised countries like the UK. The second was much later, in poorer, mainly agricultural countries (map/graphs A). This later stage is continuing in some parts of the world.
1200
• Life expectancy People are now living longer because of improved medical knowledge and treatment. Better farming methods
4
Population (millions)
0
2
7
200
Population (millions)
1000
947
800 635 600 436
408 400 203
200
125
0
0
1700 1800 1900 2000
1700 1800 1900 2000
1700 1800 1900 2000
Year
Year
Year
ASIA EUROPE
AFRICA SOUTH AMERICA
167
200
0
10
24
74
OCEANIA
400 221 200
106 107
133
0
Population (millions)
• Infant mortality Parents want to make sure that at least some of their children will survive and become adults. In poor societies, where medical facilities are limited, there is a high infant mortality rate. Having a large family provides security against the problems of old age.
82
Population (millions)
• Care of the elderly Older children can support the family by looking after elderly parents, or parents whose working lives are cut short by illness and accidents. The children may be the only support in countries that don’t provide pensions or care facilities for the sick and elderly.
172
200
547
400
NORTH AMERICA
Population (millions)
• Economic Children can be an important source of income. In the poorest communities, every contribution, however small, is vital to the family budget. A child’s income can mean the difference between starvation and survival for a family (photo B).
Population (millions)
600
There were four main reasons for the population explosion:
1402
1400
200
0
3
6
2
13
1700 1800 1900 2000
1700 1800 1900 2000
1700 1800 1900 2000
Year
Year
Year
A The population explosion happened in different places at different times
B Children at work
C Modern machinery helped to increase global cereal production by over 250% in the late 20th century
Population settlement
233319_CIE_Geography_Sample.indd 4
10/27/16 1:45 PM
1.1 have increased crop yields so there is more food and a more nutritious diet (photo C). At school, children learn how to stay healthy for longer. The average life expectancy of the world’s population is now 67 years, compared with only 40 years 200 years ago.
Fantastic fact In the UK, it can cost over US$150 000 just to bring up one child.
Stages of the population explosion
• Stage one In the 18th and 19th centuries, the development Birth control – allows people to choose how many of industry led to rapid population growth, especially in children they will have Europe. The new factories needed large numbers of workers. Many people moved into the towns from National population surrounding rural areas. More children survived Lower fertility rate – control policies – lead to parents know that most of infancy, so the fertility rate increased. a lower birth rate, • Stage two In the 20th century, improved medical facilities worldwide increased the life expectancy of ordinary working people. There was now a much greater difference between the death rate and the birth rate. Diagram D explains why the rate of population growth has slowed down in recent years. In fact the world’s fertility rate is now 2.6 children, half what it was in 1950.
their children will survive
e.g. in China
Why has the population explosion slowed down? Higher cost of living – so families in the richest countries tend to be smaller
Career decisions – more women take up a career rather than having several children
D Declining rate of population growth
Now Investigate 1 a) One way of remembering facts is to use letters that stand for key words. These words can then be joined to make a simple phrase that is easier to remember. Try doing this with the four reasons for the population explosion (E C I L). You can put them in a different order, if this helps!
b) Now think of another way to remember facts, and use this to help you remember the information in diagram D.
2
3
Match each of the following key terms with the correct definition: Key term
Definition
1 Birth rate
a the average number of children women have in their lifetime
2 Death rate
b the average number of deaths in a year (for every 1000 people)
3 Fertility rate
c the average number of live births in a year (for every 1000 people)
4 Growth rate
d the average number of years people can expect to live
5 Infant mortality rate
e the difference between the birth rate and the death rate
6 Life expectancy
f the proportion of children dying at birth or before their first birthday
Refer to map A.
a) Name the continent that was most affected by the first stage of the population explosion.
b) Name three continents that experienced the second stage of the population explosion.
c) Write a few sentences about how quickly population has increased in the countries you have named.
Chapter 1.1: Population dynamics
233319_CIE_Geography_Sample.indd 5
5
10/27/16 1:45 PM
Why do populations grow at different rates? As in any country, the rate of population growth in your country is due to changes in three variables: • birth rate • death rate (including the infant mortality rate) • international migration. Topic link
The infant mortality rate is usually the most important of these. Parents may be aware that some of their children are likely to die before they reach adulthood, because of a lack of a good diet or poor healthcare, and they may have this in mind when deciding how big their family should be. This topic explains why children’s survival is so important to the future of many families in less economically developed countries. Apart from old age, the main causes of death are:
• Look back at Topic 1.1 pages 2–5 to remind yourself about population growth. • You will learn more about international migration in Topic 1.2 pages 20–21.
• diseases and infections such as cholera and typhoid • natural hazards, especially earthquakes and floods • human conflict. Human conflicts and natural hazards can have a serious impact on a country’s population (map A and graph B). However, there can be significant differences in their long-term effects on population change.
Fantastic fact Locusts can make famines much worse. A swarm of 80 million locusts can eat 160 tonnes of cereal and fresh fruit every day !
For example, a natural hazard such as a tsunami or powerful earthquake may sweep away almost everything and everybody in the area (photo C). That place may be abandoned, or be re-populated. The main impact of such events is on the total population – there is no selection of individual age and gender groups.
Tropic of Cancer
9 8 MYANMAR 2008 138 000
HAITI 2010 223 000 ITALY 1908 123 000
Equator INDIA 1901–02 19 million 1943 2 million
Tropic of Capricorn
BANGLADESH 1970 500 000 1991 138 000
Cyclone/Hurricane
Earthquake
Tsunami
Drought
Flood
River flood
Famine
JAPAN 1923 142 000 2011 18 000 VIETNAM 1945 2 million 1971 100 000 INDONESIA 2004 230 000
7 6 5 4
11
3 2
5
1
1 Africa
Year Fatalities 2010 223 000
A Natural hazard events since 1900 that killed over 100 000 people
6
Millions of fatalities
CHINA 1907 24 million 1911 100 000 1923 234 000 1928–30 3 million 1931 1 million 1935 145 000 1936 5 million 1941 3 million 1976 300 000
Asia
Europe
The number on each column represents the number of events involved.
B Conflict events since 1960
Population settlement
233319_CIE_Geography_Sample.indd 6
10/27/16 1:45 PM
1.1 Topic link You can learn more about famines – a widespread shortage of food – in Topic 3.2 pages 138–43.
C The Japanese tsunami, 2011, which devastated the nuclear plant at Fukushima
Human conflict has a similar effect. It can involve the death and injury of hundreds and even thousands of people, as for example in BosniaHerzegovina in Europe (1992–95) and in Darfur in Sudan (2003–06). Armed fighters in the 20–45 year age range are most likely to die in such conflicts. However, modern warfare can affect people of any age, and can have long-lasting effect on a country’s total population (photo D).
Topic link To learn more about the 2011 Japanese earthquake, look at Topic 2.1 on pages 66–67.
Topic link Look at Topic 2.5 pages 110–15 to learn more about how people are affected by natural hazards.
Further research
D When there is conflict in a country, people often lose their homes and their land
Find out what events may have influenced the death rate in your own country or continent in recent times.
Now Investigate 1 a) Describe the global distribution of each type of natural hazard shown on map A.
b) Try to identify any world regions where there appear to be ‘clusters’ of similar events.
2 a) Draw a line graph to plot the numbers of fatalities in the six famines shown on map A.
c) Suggest possible reasons for the trend.
3
b) What trend in the number of famine casualties does your line graph show? Study graph B.
a) Which continent has been most affected by human conflict over the last 50 years, in terms of:
ii) the total number of fatalities?
b) Using your answers to question (a), suggest the long-term effects of conflict on the populations of continents.
i) the number of events
Chapter 1.1: Population dynamics
233319_CIE_Geography_Sample.indd 7
7
10/27/16 1:45 PM
How are population growth and resources linked? Over-population If the number of people living in an area cannot be supported by the resources in that area and enjoy a reasonable standard of living, it is over-populated. Regions like the African desert may be over-populated, even though very few people live there (they are sparsely populated), because the land cannot support the number of people who live there. However, just because many people live in an area (that is, it is densely populated), that does not always mean a place is overpopulated. Some of the most densely populated places on Earth are well resourced. For example, Japan is not over-populated, because it has many profitable industries which provide jobs and income through the country’s exports. Those items that cannot be produced in their own country can be bought from abroad using money from these exports.
Under-population If the number of people living in an area is fewer than the number that can be supported by the resources in that area, then it is under-populated. For example, Canada has many resources which are not all being used. Many more people could live there and enjoy a high standard of living.
Fantastic fact Just 29% of the world’s surface is land, but only about 40% of this is suitable for food production.
Resources and population There are two questions to ask when deciding whether a country is over-populated or under-populated: • Do people have what they need in order to stay alive and to provide for their families (diagram C)? • Are the country’s resources sufficient to support its population?
8
Population settlement
233319_CIE_Geography_Sample.indd 8
10/27/16 1:45 PM
1.1 Liberia – a country with Case study a high rate of natural population growth Table A shows that Africa is predicted to have the greatest natural population growth (NPG) of all the continents in the foreseeable future. Liberia is one of Africa’s smallest countries, with only 4 million people, and it has recently experienced that continent’s highest NPG rate – over 4.5% – according to the World Bank. It is now one of the world’s poorest countries, due mainly to 14 years of civil war which killed over 250,000 people and ruined its economy. Unemployment remains very high (85%) and almost threequarters of its workers depend on agriculture for a living. Diagram B provides more information about this country, including some reasons why its birth rate is so high.
Liberia
The infant mortality rate is one of the world’s 10 highest Contraceptives are used by only 11% of women
Life expectancy is 57.8 years
61% of all Liberians are below 25 years of age
FACTS ABOUT LIBERIA’S PEOPLE
The literacy rate is 60.8%
The birth rate is 36 per 1000 people
80% of Liberians live in poverty
The fertility rate is the world’s fifth highest
B Facts about Liberia’s people
Africa
The Americas
Asia
Europe
Oceania
World
1950–2000 (Actual)
253
148
137
33
139
143
2000–2050 (Prediction)
196
46
39
−3
84
56
2050–2100 (Prediction)
75
2
−9
−10
23
14
Years
A Global percentage population changes, 1950–2100
Too many people, too few resources There are a number of reasons why a place may not be able to support a large number of people – that is, why it may be overpopulated. For example: • A lack of clean water may force people to use polluted sources and possibly fall ill with diseases many of which are lifethreatening, especially for the very young and old. • Droughts are becoming more frequent and severe due to climate change. They increase the risk of starvation in already over-populated countries.
Chapter 1.1: Population dynamics
233319_CIE_Geography_Sample.indd 9
9
10/27/16 1:45 PM
• Loss of jobs – when valuable natural resources become exhausted, workers are no longer needed and will not be able to support their families. • Population growth – when there is rapid population growth, or an increase in immigrants, a country may be less able to provide for its people. • Clearing of forested areas can result in families not having the fuel they need for cooking, heating and washing. • Natural disasters such as earthquakes and floods often deprive local communities of the resources they need, for example water, food and shelter.
SHELTER WATER
Protects people from elements of weather and climate
Most important of all – without it, people die after 3–4 days
CLOTHING FOOD
Protects the body against extreme temperatures
Most people need 1500–3000 calories every day. A balanced, healthy diet includes: • fats, e.g. from meat, cheese, milk, fish – provide energy to fuel the body’s activities • carbohydrates, e.g. from rice, potatoes – provide warmth and aid body tissue growth and repair • protein, e.g. from meat, fish – provide immunity to disease and infection • minerals, e.g. iron from red meat helps blood to circulate oxygen to all parts of the body • vitamins, from fruit, vegetables, nuts, cereals, fish – keep body in good working order
C People’s basic needs
Now Investigate 1 Do you think your country is sparsely populated or densely populated?
Is it over-populated or under-populated?
2
• Use Table A to compare Africa’s natural population growth (NPG) trends with those of the other continents and the world as a whole.
• Suggest reasons why Europe’s NPG rate is predicted to decline – and at an increasing rate.
3 Write all the information in Diagram B, and the data in the paragraph about Liberia in a table. Use the headings: Information about Liberia’s population change rates; Reasons for these rates of population change; Other information about Liberia
10
Lowlands Lowlands Lowlands Deserts Deserts Dense coniferous forest Dense coniferous forest Deserts Polar regions (tundra) Polar regions (tundra) Dense Mountains coniferous Mountains
forest
Polar regions (tundra) Mountains
D Environments of the world’s land areas
Population settlement
233319_CIE_Geography_Sample.indd 10
10/27/16 1:45 PM
1.1 Over-population and under-population Both large and small countries can be under-populated and overpopulated. On these pages we look at one very large country in terms of area, which has a relatively small population and another which has one of the largest and fastest growing populations in Africa. Canada is under-populated because it has an advanced industrialised economy and so many valuable natural resources that it could easily provide extra people with a high standard of living. Tanzania is an over-populated country, the information on these two pages will allow you to understand why and how Tanzania differs from Canada.
Canada – an under-populated country and Case study Tanzania – an over-populated county Canada is a huge country – the second largest in the world after Russia. Vast stretches of the nation are almost totally uninhabited (photo C). Significantly, though, GDP per capita for the country is high.
CANADA
Table A summarises information about the population of Canada and Tanzania. Figure B looks at Canada’s resources of which its greatest natural assets are its mineral resources such as oil and gas. Many of these are found in remote, wilderness areas. Fact
Canada
Tanzania
9 984 670 (2)
947 300 (31)
Population (millions)
34.4 (37)
48.3 (28)
Average population density (people per km2)
3.4 (229)
46.0 (158)
Annual population growth rate (%)
0.8 (136)
2.8 (18)
Net Migration (per 1000 inhabitants)
5.7 (22)
−0.6 (138)
Infant mortality rate (per 1000 live births)
4.9 (183)
45.1 (49)
Fertility rate (average number of children per woman)
1.6 (178)
5.0 (18)
Life expectancy (years)
81.4 (12)
60.8 (190)
99 (25)
69.4 (164)
39 057 (22)
1600 (199)
Area (km2)
Literacy (% of population) GDP per capita ($)
Tanzania
Fantastic fact Canada has a land area 14 325 times larger than Singapore, one of the smallest countries in the world, but its population is only 7.3 times bigger!
Topic link Topic 3.1, pages 116–19 explain how GDP, the Quality of Life Index and the Human Development Index are calculated.
Chapter 1.1: Population dynamics
233319_CIE_Geography_Sample.indd 11
11
10/27/16 1:45 PM
Fact
Canada
Tanzania
GDP per capita annual growth rate (%)
3.0 (127)
6.9 (32)
Access to safe drinking water (%)
99.8 (40)
58.2 (185)
Quality of Life Index
7.6 (14)
4.5 (109)
Human Development Index
0.91 (11)
0.5 (152)
Population living in poverty (%)
9.4 (140)
80.0 (1=)
Value of exports ($ billion)
407 (10)
5.9 (109)
Value of imports ($ billion)
406 (12)
10.3 (98)
Topic link This topic has links with Topic 3.2 pages 138–39
A Factfile for Canada and Tanzania – the figures in brackets indicate the world rankings of both countries Natural resources • Longest coastline in the world – so fish are plentiful • Huge coniferous forests in the north, producing large amounts of timber • World’s largest producer of zinc and uranium • Major producer of gold, nickel, lead, aluminium
C Canada occupies most of the North American continent above latitude 41°North
The figures in factfile A and photograph C clearly show that Canada is under-populated: • The infant mortality rate is very low and life expectancy is high – this suggests that there is adequate medical care.
Farm produce • Huge country, so has a range of climate types, which allows production of many different crops • Major global exporter of wheat Water resources • More lakes than any other country, holding much of the world’s fresh water reserves Main industries • Aircraft and car manufacturing • Timber industries • Oil refining • Aluminium smelting
• Literacy rates are high – this shows that education facilities are well funded and effective. Support services • Healthcare is paid for by the state
• Unemployment rates are very low – which means that most people are able to find suitable paid work. • The Quality of Life Index rating is high by global standards, showing that most people in Canada are generally content with their standard of living. In many ways, Tanzania is similar to several other African countries. It has high youth unemployment and most of its families depend on agriculture for their survival;
12
Energy resources • Huge deposits of oil and natural gas • A net exporter of energy International migration • Encourages 250 000 new residents every year – to increase the workforce • Also welcomes 10% of the world’s refugees Trade • One of the world’s top ten trading nations – most of trade is with USA, UK and Japan • The St Lawrence Seaway is a vital inland shipping route • Major ports on both Atlantic and Pacific Ocean coasts
B Canada’s resources
Population settlement
233319_CIE_Geography_Sample.indd 12
10/27/16 1:45 PM
1.1 also, AIDS and under-nourishment mean that few people live beyond 65 years of age. Tanzania is certainly a country with great potential, but rapid population growth makes it very difficult to improve its people’s standard of living.
Now Investigate 1
a) What evidence in table A and figure B proves that Canada is under-populated? b) Give reasons for your answer to (a).
2
a) Write full sentences to discuss the significance of at least six of the data comparisons in Table A.
b) Use the information in Table A to explain why Tanzania is over-populated. You could discuss this information under sub-headings such as Access to safe drinking water, Education and The economy.
Further research Use the internet to create table A and figure B for your country. (If you live in Canada, investigate another country.) Use the information to decide whether your country is over-populated or under-populated.
3 Suggest reasons why rapid population growth makes it difficult to improve people’s standard of living.
Diseases are deadly!
Further research
Death rates across the world have decreased significantly over the last 50 years, largely due to improvements in healthcare, although the cause of death is noticeably different in different parts of the world (graphs A). Reasons for this decline include: • increased medical knowledge • more effective medicines and healthcare • education about the importance of a balanced, nutritious diet. However, many diseases are still major killers. For example, malaria kills at least 1 million people every year. Most deaths from malaria occur in tropical countries, where breeding conditions for mosquitoes are ideal. Even now, one in every five childhood deaths in Africa is due to this disease. Diagram B explains how people are infected with malaria. A pandemic is an outbreak of an infectious disease so widespread that it kills millions of people in a very short time. There have been several pandemics in the past, for example: • The so-called ‘Black Death’ of the mid-14th century, which we now know was spread by rat-born fleas, killed over 75 million people in Europe. It had a significant impact on the global population at that time.
Use information from the internet to create a factfile on a widespread disease like cholera or typhoid. Include details about: • what causes it, and how its spreads • what medicines are available to treat it • those parts of the world where it still a common cause of death • especially serious outbreaks: when and where they took place, and how many people died.
• The ‘Spanish Flu’ pandemic of 1918–20 killed a similar number of people. It was probably particularly deadly because many people had been weakened by the effects of the First World War (1914–18). Chapter 1.1: Population dynamics
233319_CIE_Geography_Sample.indd 13
13
10/27/16 1:45 PM
Less economically developed countries (LEDC)
HIV/AIDS Bronchitis & other breathing problems
More economically developed countries (MEDC)
Heart attacks, incl. stress-induced attacks
Heart attacks
Lung cancer, bronchitis & other breathing problems
‘Childhood diseases’, e.g. chickenpox, measles, scarlet fever, whooping cough
Strokes
Cholera and dysentery Strokes Malaria Tuberculosis
Road traffic accidents Stomach cancer Tuberculosis Suicide & other non-medical causes
A The main causes of early death (that is, not due to old age) in LEDCs and MEDCs
HIV/AIDS is the most recent pandemic. It is particularly widespread among people under 60 years of age. Since it was first identified in 1981 it has caused an estimated 36 million deaths – equivalent to the population of Canada or Morocco or Uganda. HIV and AIDS are very closely linked, but are not the same. HIV (human immunodeficiency virus) is a virus infection, transmitted by the exchange of bodily fluids, usually through sexual activity. It reduces the body’s resistance to illness and other infections and, so far, has no known cure. AIDS (acquired immune deficiency syndrome) is the medical condition of a person in the later stages of HIV, 6 when victims become weak, lose weight and develop flu-like symptoms which can prove fatal. The number of people living with HIV continues to rise, in spite of advances in medical knowledge. Sub-Saharan Africa is the most affected region, but Botswana, Lesotho and Swaziland have the highest rates with around 24% of their total populations being infected (table C). Many African countries now use the ‘ABC’ slogan to advise people on how to avoid HIV/AIDS: • A stands for abstinence (from sexual activity) • B means be monogamous (have only one sexual partner)
7
3, 4, 5
1 Infected mosquito bites the skin
2 Mosquito parasite reaches the liver where it starts to reproduce 3 Many parasites enter the bloodstream and infect red blood cells 4 Infected blood cells burst, infecting other cells
2
5 Blood cells no longer able to supply enough oxygen to the body 6 Victim suffers fever and lacks energy
1
7 Uninfected mosquito bites skin and becomes infected – it will infect the next person it bites
B How malaria spreads
• C stands for contraception.
14
Population settlement
233319_CIE_Geography_Sample.indd 14
10/27/16 1:45 PM
1.1 This advice has helped African countries like Kenya and Uganda to reduce their HIV infection rates (photo D). Scatter graph E presents a possible link between population infection percentages and GDP. Botswana
World
Life expectancy (years)
60.1
67.1
Adults as % of total population
57.9
65.9
Average age
21.7
28.4
300 000
30.8 million
23.9
0.8
Approx. 100 000
Approx. 15 million
People living with AIDS % of total population infected with AIDS Children orphaned as a result of HIV/AIDS
Skills link You can learn more about scatter graphs in Section 4.3 page 210.
D A new AIDS hospital in Lusaka, Zambia
Note: all figures are estimates C Botswana: some of the effects of HIV/AIDS
Now Investigate 1
a) What is the most noticeable difference in the causes of early death shown for LEDCs and MEDCs in graphs A?
b) Suggest some reasons for these differences.
2
Look carefully at diagram B.
a) How can the spread of malaria be reduced?
b) Suggest how people can help to do this.
3
Study graph E.
a) Place a rule or the edge of a piece of paper along the position of the best-fit line.
b) According to this line, what appears to be the general link between the fertility rate and HIV/AIDS infection rates?
c) How might the fertility rates be linked with the number of 15–49 year olds who are infected by HIV/AIDS? Fertility rate (average number of children born per woman)
9 8 7
Uganda
6
Malawi
5 Tanzania
4
Zambia Mozambique
Kenya Zimbabwe
3
Botswana
2 1 0
0
5 10 15 20 % of population infected with HIV/AIDS
25
E Relationship between HIV/AIDS and fertility rates in eight East African countries
Chapter 1.1: Population dynamics
233319_CIE_Geography_Sample.indd 15
15
10/27/16 1:45 PM
Anti-natalist population policies The governments of several countries have imposed direct laws, or policies, to control their population growth rate. This includes China, which has the largest population in the world.
China – a country with a low rate of natural Case study population growth A country like China needs to keep its population growth under control. The policies it has put in place in order to do this are described as anti-natalist policies: • anti means to be against (or in disagreement with) • natalist is anything to do with childbirth. This term describes any policy that aims to control or limit a country’s birth rate rather than stimulate it. China’s strategy is the ‘one-child policy’, which was introduced in 1979.
Before 1979 After 1949, China experienced a population explosion, or ‘baby boom’. The government decided to restrict family size and recommend that people married later in life. But between 1958 and 1961, droughts and floods caused the deaths of 2 million Chinese. Then the harvests returned to normal and the Chinese leader encouraged people to have as many children as possible, creating a second ‘baby boom’. China’s birth rate soared to 5.8 children per couple – well above the 2.1 needed to keep the population stable. This is known as the ‘replacement level’. In the 1970s, the Chinese government again wanted families to have fewer children. In 1979, it introduced its ‘one-child policy’.
Did the policy work? Family planning advice and contraceptives were made freely available, and a ‘One-child Certificate’ was awarded to families who had followed the policy. They were also entitled to extra benefits (diagram A), while those who had additional children were penalised (diagram B). Baby girls and second children were often abandoned, or secretly adopted by childless families. The policy was generally more successful in the cities than in rural areas. In country areas farming families needed a son to help work the land, so these families were usually allowed a second child if the first was a girl.
16
Fantastic fact One in every five people in the world today lives in China!
Topic link Look back at Topic 1.1 pages 2–5 for more on the population explosion.
Topic link For more details of China’s current and predicted population structure look at Topic 4.3 on page 217.
Better housing
Better childcare
STATE BENEFITS AWARDED Better chances of promotion for government employees
Cash bonuses Longer maternity leave
A Benefits of being a one-child family
Population settlement
233319_CIE_Geography_Sample.indd 16
10/27/16 1:45 PM
1.1 Since 1979 In 1992, China relaxed the rules and adoption was legalised. In 2004, the city of Shanghai introduced a local law allowing divorcees who re-marry to have a second child without incurring the usual penalties. In 2008, the National Population and Family Commission stated that the one-child policy would continue for at least another 10 years. However, in March 2011 the Chinese government announced a review – in future it may allow all parents to have a second child. 10-year period between population census years
% population change in China
% population change in Asia
% population change in the World
1970–1980
20.0
23.7
20.5
1980–1990
14.8
22.0
19.6
1990–2000
10.8
15.7
15.2
2000–2010
5.8
12.1
12.9
D Population trends in China, Asia and the World, 1970–2010
China
World
2010
2010
2050
164 262
454
921
500
247
1750
4400
750
2050 1636
1615
4500
16–59 years
Basic rice allowance withdrawn for all extra children
Government employees’ retirement pensions cancelled
STATE PENALTIES IMPOSED Extra children denied the same quality of education and healthcare as the first child
Fines imposed (could be up to four times a family’s income)
Farmers who couldn’t pay fines in cash had cattle taken from them
B Penalties for not following the onechild policy
• China had already achieved success in reducing its fertility rate in the 1970s – that is even before the introduction of its one-child policy! It had dropped from 5.8 children/woman in 1970, to only 2.7 in 1978. • China’s adult workforce is predicted to decrease by almost 10 million a year after 2025. • Parents of only children who’ve died young have been demonstrating outside public buildings. They want compensation for financial hardship in their old age because no-one can look after them.
Figures in millions 0–15 years
Government employees sacked
60+ years
E Age dependency in China and the world
Problems of age dependency China now has a very ‘unbalanced’ population structure, with more men than women – 117 men to every 100 women. Another concern is age dependency (graphs E), which means that the elderly population becomes dependent on the younger generations. It is described as China’s ‘4-2-1 problem’, because many single children (1) will become responsible for caring for their parents (2) and their four grandparents (4). China’s fertility rate is now about 1.5, which is still above its official target. However, the one-child policy does seem to have avoided the financial burden of 400 million extra births, which has enabled China’s development as a global economic super-power.
The Communist leadership in Beijing have made this announcement: The one-child policy is to be adjusted and improved, step-by-step, to help create a more balanced population structure. In future, families will be allowed to have two children - if one of the parents is an only child. C Recent media statements about challenges and changes in china.
Chapter 1.1: Population dynamics
233319_CIE_Geography_Sample.indd 17
17
10/27/16 1:45 PM
Now Investigate 1 Draw a timeline for population events in China between 1945 and 2020. Add labels for the following years, giving details of what happened:
1949, 1958–61, 1970, 1979, 1992, 2004, 2008, 2012.
2 a) Search the Internet to find more media statements about China, similar to those in C.
18
b) Using these pages and your own searches, evaluate the long-term effects of China’s population control policies. Using Table D and other information on these two pages, assess the effectiveness of China’s anti-natalist policies.
Population settlement
233319_CIE_Geography_Sample.indd 18
10/27/16 1:45 PM
1.1 Pro-natalist population policies Other governments have created policies to encourage people to have more children in order to boost their population growth rate. These are known as pro-natalist policies (pro means ‘for’). In Western Europe, for example, between 1980 and 2011 only one country had a fertility rate above the critical 2.1 population replacement level (table A). In fact, 47% of all the world’s countries now have a fertility rate below 2.1. One reason for this is that, as countries become richer, women marry later in life and delay starting a family. Country
Fertility rate, 1980
Change in fertility rate, 1980–2011
Fertility rate, 2011
Austria
1.62
– 0.22
1.40
Belgium
1.68
– 0.03
1.65
Denmark
1.55
+ 0.19
1.74
France
1.95
+ 0.01
1.96
Germany
1.56
– 0.15
1.41
Ireland
3.25
– 1.23
2.02
Italy
1.64
– 0.25
1.39
Luxembourg
1.49
+ 0.28
1.77
Netherlands
1.60
+ 0.06
1.66
Norway
2.10
–0.33
1.77
Portugal
2.18
– 0.68
1.50
Spain
2.20
– 0.53
1.47
Sweden
1.68
– 0.01
1.67
Switzerland
1.80
–0.34
1.46
UK
1.90
+ 0.01
1.91
Western Europe
1.88
–0.23
1.65
Skills link See page 14 for an explanation of ‘replacement level’.
Fantastic fact The world’s average fertility rate is 2.46. In Western Europe it used to be 2.7, but is now only 1.65.
Topic link Look back at Topic 1.1 page 5 for more about how fertility rates affect population growth.
= fertility rate above 2.1 – an increase in the fertility rate = fertility rate below 2.1 – reduction in the fertility rate A Most fertility rates in Western Europe have stayed below 2.1 since 1980
Germany has the largest population in Europe, but it is still concerned about its declining fertility rate. New measures to increase the birth rate include subsidising childcare and contributing to parents’ income while they are caring for infants.
France: population strategies France has some of the most extensive state-funded childcare facilities in Europe. Diagram B shows some of the ways France is encouraging people to have more children in order to maintain
Chapter 1.1: Population dynamics
233319_CIE_Geography_Sample.indd 19
19
10/27/16 1:45 PM
its fertility rate. Immigration from southern Europe and former French colonies in North Africa has contributed one quarter of all population growth in recent years, but the growth is due mainly to immigration, and not to a rise in the fertility rate. France’s pro-natalist policy has clearly been successful in stabilising its fertility rate (table A). One of the country’s most popular strategies has been the Carte Familles Nombreuses (‘Large Family Card’). This gives families with three or more children reductions on the national train network and half-price fares on the Paris Metro underground system. Families living in Paris, the French capital, also have a Carte Paris-Famille (‘Paris Family Card’), which gives children free entrance to all swimming pools and subsidised entry to other sports facilities provided by the city.
Skills link See Section 4.3 pages 208–09 to learn more about drawing bar graphs.
Up to 16 weeks’ paid maternity leave for first child, rising to 26 weeks for third child Graded income tax system – the bigger the family, the less tax to be paid Loss of earnings payments for parents of a third child
All childcare facilities subsidised by the government
PRO-NATALIST MEASURES
Free pre-school facilities for children aged 2 and 3
Subsidised state nursery schools for children aged 3 or over
System of crèches for toddlers
Up to 26 months’ entitlement to time off work, to be shared by both parents Tax deductions towards home-help costs for working mothers
B Pro-natalist measures taken by the French government
Now Investigate 1
a) What do you think of the French ‘Family Card’ schemes?
b) Would your family, or any family that you know, qualify for this card if it was available in your country?
2
a) Use the data in table A to create a bar graph showing the fertility rates for each country, for 1980 and 2011, and the change in fertility rate between 1980 and 2011. Shade the three bars for each country in three different colours.
b) Draw a line across your graph at 2.1; annotate this line to explain its significance.
c) Comment on the success (or failure) of these countries in maintaining their fertility rate since 1980.
20
Population settlement
233319_CIE_Geography_Sample.indd 20
10/27/16 1:45 PM
1.1 3
a) Make a copy of the following table. Complete your table with reference to diagram B and the text, putting ticks where appropriate in the last three columns.
b) From the results shown in your table, what kinds of benefit are most likely to persuade French parents to have a larger family?
Type of benefit
Economic
Educational
Recreational
Childcare facilities Crèches for toddlers Entitlement to time off work Graded income tax system Large Family Card Loss of earnings payments Maternity leave Nursery schools Paris Family Card Pre-school facilities State nursery schools Working mothers’ tax deductions Total (ticks)
Chapter 1.1: Population dynamics
233319_CIE_Geography_Sample.indd 21
21
10/27/16 1:45 PM