SAN FRANCISCO
YEAR-END REVIEW & JANUARY 2023 MARKET UPDATE

A Note From Colleen...

Dear Clients, Colleagues, and Friends,
I hope you are having a wonderful start to the new year! I come to you from a place of relentless optimism and renewed enthusiasm. In many ways, 2022 felt like a roller coaster, and 2023 will be a year where we see what happens as the market pivots and moves ahead.
With the holidays now behind us, we look ahead to the Spring selling season - historically the busiest time of year for real estate. While we do anticipate an influx of new and refreshed listings to replenish the market’s offerings, it is hard to know if we will see as much of a push as we have in years past…

When comparing the data year-over-year and the long-term numbers, it is so important to look at the longevity of the San Francisco market. While 2022 started off strong, we began to feel a shift in the second half of the year.
You’ll notice that year-over-year there has been a 0.9% decrease in the median sales price for single-family homes and a 2% drop for condominiums. That being said, transaction volume is also down significantly, which impacts this data. The economy and housing market remain in a period of adjustment, causing many to be more cautious as they wait to see how things go. Meanwhile, others are diving into opportunities we haven’t seen in years.
We are always here to help decode what’s really going on, and to share what we are seeing in real time!
Warmly,
TOP PRODUCER, 2009-2022 Ranked in the top 1% of real estate agents in San Francisco c 415.706.1781 f 415.321.7235 e colleen@colleencottersf.com 1801 Fillmore Street San Francisco, CA 94115 DRE 01703078
The Cotter Group’s Thoughts On The Current Market
OPPORTUNITY
There is incredible opportunity for Buyers right now. As the December ratifications close this month, we are seeing some of those deals.
INVENTORY LEVELS
Inventory is still very low…and though it is clear that demand is reduced from the ravenous pace of 2021 & early 2022, we are still seeing a low volume of homes.
THE PERFECT HOMES ARE MOVING
Homes that check ALL the boxes are still moving quickly & sometimes for over asking price...but the less-thanperfect homes, or ones that do not check all the boxes, are lingering and buyers are coming in with lower offers.
CPI DATA & INFLATION
The Consumer Price Index (CPI) figures released on 1/12 were in line with expectations, and markets generally reacted favorably to the news. Month-over-month inflation hit the forecast number of 0.3%, and year-over-year core inflation continued heading in the right direction, coming in at the forecasted 5.7%.
INFLATION INSIGHT
Overall, we are seeing the FED rate actions working against inflation. While it is still higher than the FED target of 2.5%, it is significantly lower than the 9% number that we saw in Summer 2022.
RATES
Rates are down about 1.5% from their October highs. Conforming rates are hovering around 6%, and some jumbo rates are available lower than that, depending on the specific scenario.
AFFORDABILITY
Affordability will continue to be a major challenge.
2023 INVESTMENT OPPORTUNITIES
There is a move toward real estate investment & portfolio diversification as Buyers recognize they can invest in real estate in addition to their stock portfolios. Buyers see value in the ability to more closely control and manage real estate.
EMPLOYMENT
Employers will have more leverage than in past years, and commuting will become part of the conversation again.
VOLUME OF CLOSED TRANSACTIONS
The number of closed transactions is down 21% for single-family homes & 30% for condos year-over-year. Keep in mind this is based on year-over-year data; when looking at November & December data, these numbers are higher.
Pacific Heights Market Snapshot
PENDING
SOLD
JAN-DEC ‘22 JAN-DEC ‘21 % CHANGE
NEW LISTINGS
SALES
LISTINGS
SALES PRICE*
SALES PRICE* DAYS ON MARKET % OF PROPERTIES SOLD OVER LIST PERCENT OF LIST PRICE RECEIVED* 90 57 57 $6,500,000 $7,401,665 29 31.6% 98.7% 72 40 39 $5,850,000 $6,622,026 47 53.8% 101.4% -20.0% -29.8% -31.6% -10.0% -10.5% +62.1% +70.3% +2.7% SINGLE FAMILY HOMES JAN-DEC ‘22
SALES
LISTINGS
SALES PRICE* AVERAGE SALES PRICE* DAYS ON MARKET % OF PROPERTIES SOLD OVER LIST PERCENT OF LIST PRICE RECEIVED* 305 284 281 $1,575,000 $2,058,348 42 47.6% 101.8% 270 185 187 $1,525,000 $1,999,622 42 47.6% 101.8% -11.5% -34.9% -33.5% -3.2% -2.9% 0.0% +0.6% -0.8% CONDOMINIUMS/TIC/COOP JAN-DEC ‘21 % CHANGE Current as of January 11, 2023. All data from the San Francisco Association of REALTORS® MLS. Report © 2022 ShowingTime. *Does not account for sale concessions and/or downpayment assistance. | Percent changes are calculated using rounded figures and can sometimes look extreme due to small sample size.
MEDIAN
AVERAGE
NEW LISTINGS PENDING
SOLD
MEDIAN
North Side

Market Update

D7 Market Snapshot
PENDING
SOLD
JAN-DEC ‘22 JAN-DEC ‘21 % CHANGE
NEW LISTINGS
SALES
LISTINGS
SALES PRICE*
SALES PRICE* DAYS ON MARKET % OF PROPERTIES SOLD OVER LIST PERCENT OF LIST PRICE RECEIVED* 210 160 160 $5,287,500 $6,486,063 39 56.3% 106.1% 161 95 96 $4,862,500 $5,844,504 38 56.3% 103.8% -23.3% -40.6% -40.0% -8.0% -9.9% +15.2% +18.5% +0.6% SINGLE FAMILY HOMES JAN-DEC ‘22
MEDIAN
AVERAGE
NEW LISTINGS
PRICE*
SALES PRICE* DAYS ON MARKET % OF PROPERTIES SOLD OVER LIST PERCENT OF LIST PRICE RECEIVED* 563 500 498 $1,600,000 $1,953,240 40 46.8% 102.8% 460 318 320 $1,610,000 $1,963,458 38 50.0% 102.7% -18.3% -36.4% -35.7% +0.6% +0.5% -5.0% +6.8% -0.1% CONDOMINIUMS/TIC/COOP JAN-DEC ‘21 % CHANGE Current as of January 11, 2023. All data from the San Francisco Association of REALTORS® MLS. Report © 2022 ShowingTime. *Does not account for sale concessions and/or downpayment assistance. | Percent changes are calculated using rounded figures and can sometimes look extreme due to small sample size.
PENDING SALES SOLD LISTINGS MEDIAN SALES
AVERAGE
Single Family Market
SAN FRANCISCO CITY WIDE
Year-Over-Year Comparison
DEC 2022 DEC 2021 % CHANGE
MEDIAN SALES PRICE DAYS ON MARKET $ PER SQUARE FOOT END OF YEAR INVENTORY WENT INTO CONTRACT PROPERTIES SOLD $1,784,250 13 $1,067 132 2,049 2,411
Year-End 2022
WENT INTO CONTRACT PROPERTIES SOLD END OF YEAR INVENTORY # OF PROPERTIES SOLD OVER LIST AVERAGE % OF LIST PRICE RECEIVED 2,049 2,411 132 76.9% 114.3% 2,668 3,050 259 78.9% 114.7% -23.2% -21.0% -49.0% -2.5% -0.3% Sources: SFAR MLS & BrokerMetrics; Property types covered: Single-family. Only property data posted on the MLS is covered. All information is deemed reliable, but not guaranteed for accuracy. All data is subject to errors, omissions, revisions, and is not warranted. ©2022 Vanguard Properties. All rights reserved. Equal Housing Opportunity. DRE No. 01486075
50
2022
Top Five Single-Family Home Sales / San Francisco 2950 Pacific Avenue PACIFIC HEIGHTS / $17,000,000 2518 Jackson Street PRESIDIO HEIGHTS / $16,500,000 3747 Jackson Street PRESIDIO HEIGHTS / $4,700,000 2505 Pacific Avenue PACIFIC HEIGHTS / $15,000,000
Arguello Boulevard PRESIDIO HEIGHTS / $15,500,000
#1
#2 #3
#4
Sources: SFAR MLS & BrokerMetrics; Property types covered: Single-family. Only property data posted on the MLS is covered. All information is deemed reliable, but not guaranteed for accuracy. All data is subject to errors, omissions, revisions, and is not warranted. ©2022 Vanguard Properties. All rights reserved. Equal Housing Opportunity. DRE No. 01486075
#5
Median Neighborhood Values / YE 2022
*Denotes small sample size - use caution when interpreting statistics. Sources: SFAR MLS & BrokerMetrics; Property types covered: Single-family. Only property data posted on the MLS is covered. All information is deemed reliable, but not guaranteed for accuracy. All data is subject to errors, omissions, revisions, and is not warranted. ©2022 Vanguard Properties. All rights reserved. Equal Housing Opportunity. DRE No. 01486075
Pacific/Presidio Heights Alamo Square/NOPA Marina/Cow Hollow Russian Hill Cole Valley/Haight Lower Pac/Laurel Heights Noe Valley Buena Vista/Corona Heights Castro/Duboce Triangle Hayes Valley Diamond Heights Ingleside Terrace/Lakeside Richmond/Lake Street Missino Bernal Heights/Glen Park Potrero Hill Sunset Westwood Park/Sunnyside Excelsior/Portola Bayview/Hunters Point AVG SOLD PRICE $5,887,500 $4,310,000 $3,938,000 $3,663,751 $3,497,500 $3,486,500 $2,837,500 $2,750,000 $2,650,000 $2,592,250 $2,425,000 $2,324,000 $2,262,500 $2,200,000 $1,850,750 $1,805,000 $1,731,500 $1,637,500 $1,250,000 $1,100,000 $ / SQ. FT. $1,634 $1,241 $1,474 $1,350 $1,206 $1,178 $1,337 $1,226 $1,321 $1,118 $1,159 $1,000 $1,069 $1,033 $1,096 $1,059 $1,089 $1,086 $888 $708 AVG % OF LIST PRICE RECV’D 101.5% 106.6% 106.2% 102.5% 110.7% 107.0% 114.6% 110.3% 111.1% 109.8% 105.1% 115.1% 115.6% 105.2% 116.1% 112.4% 122.4% 114.9% 114.5% 111.2% HOMES SOLD 50 8* 46* 16* 26* 30* 126 37* 59 8* 16* 30* 180 26* 242 53 228 88 167 79
NEIGHBORHOOD
Condominium Market SAN FRANCISCO CITY WIDE
Year-Over-Year Comparison
DEC 2022 DEC 2021 % CHANGE
MEDIAN SALES PRICE DAYS ON MARKET $ PER SQUARE FOOT END OF YEAR INVENTORY WENT INTO CONTRACT PROPERTIES SOLD $1,200,000 24 $1,082 400 2,866 3,067
Year-End 2022
WENT INTO CONTRACT PROPERTIES SOLD END OF YEAR INVENTORY # OF PROPERTIES SOLD OVER LIST AVERAGE % OF LIST PRICE RECEIVED 2,866 3,067 400 48.2% 103.6% 4,160 4,404 697 50.0% 103.9% -31.1% -30.4% -42.6% -3.6% -0.3% Sources: SFAR MLS & BrokerMetrics; Property types covered: Single-family. Only property data posted on the MLS is covered. All information is deemed reliable, but not guaranteed for accuracy. All data is subject to errors, omissions, revisions, and is not warranted. ©2022 Vanguard Properties. All rights reserved. Equal Housing Opportunity. DRE No. 01486075
 2022 Top Five Condominium Sales / San Francisco
2006 Washington St. #2 PACIFIC HEIGHTS / $19,000,000
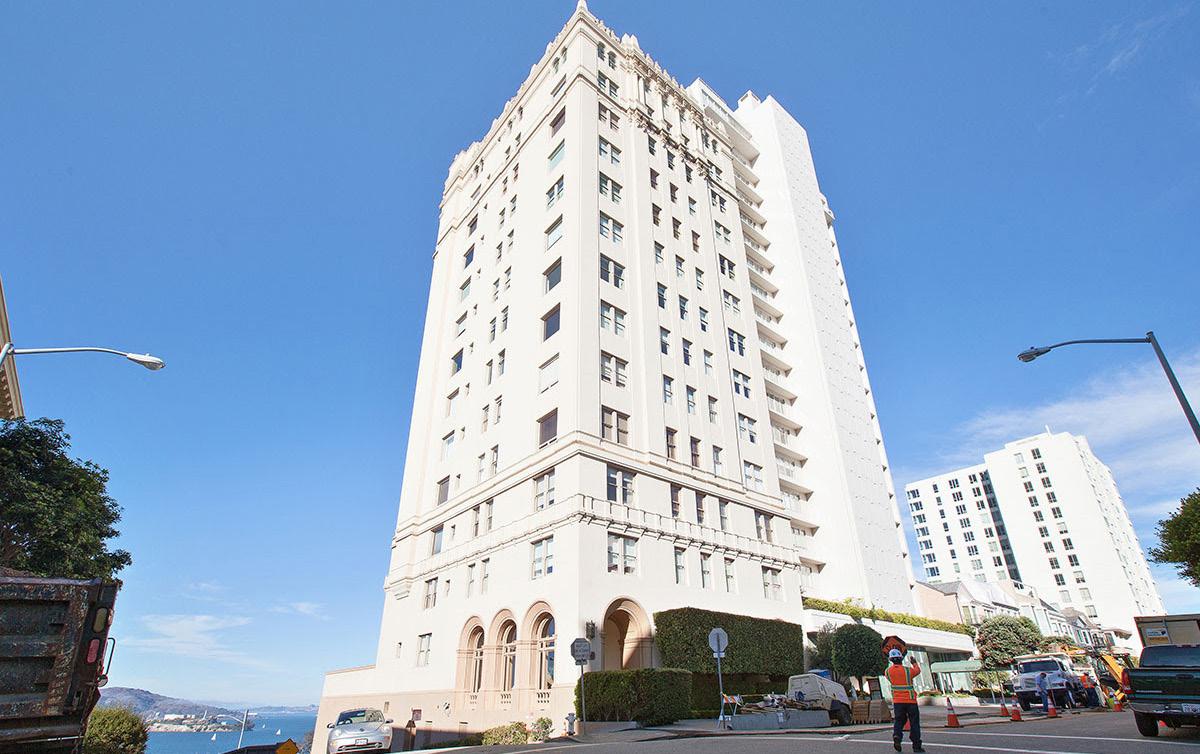
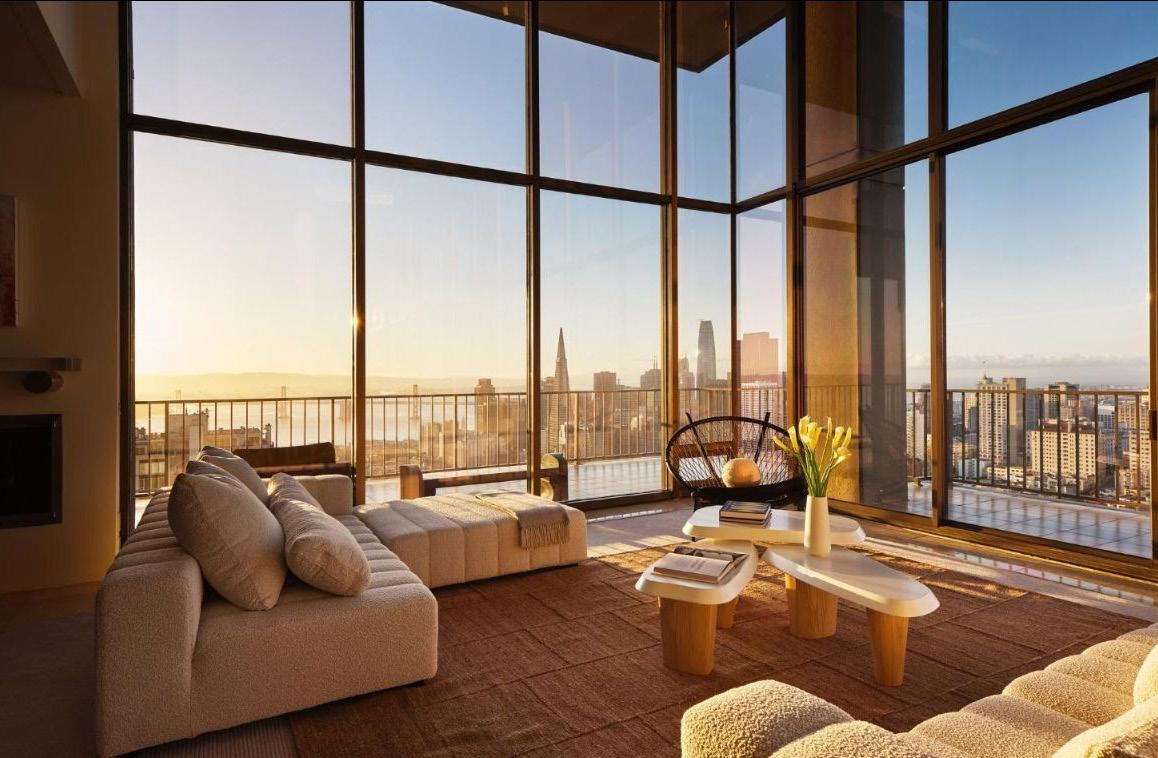
999 Green St. #3201 RUSSIAN HILL / $17,000,000
999 Green St. #3202 RUSSIAN HILL / $12,000,000
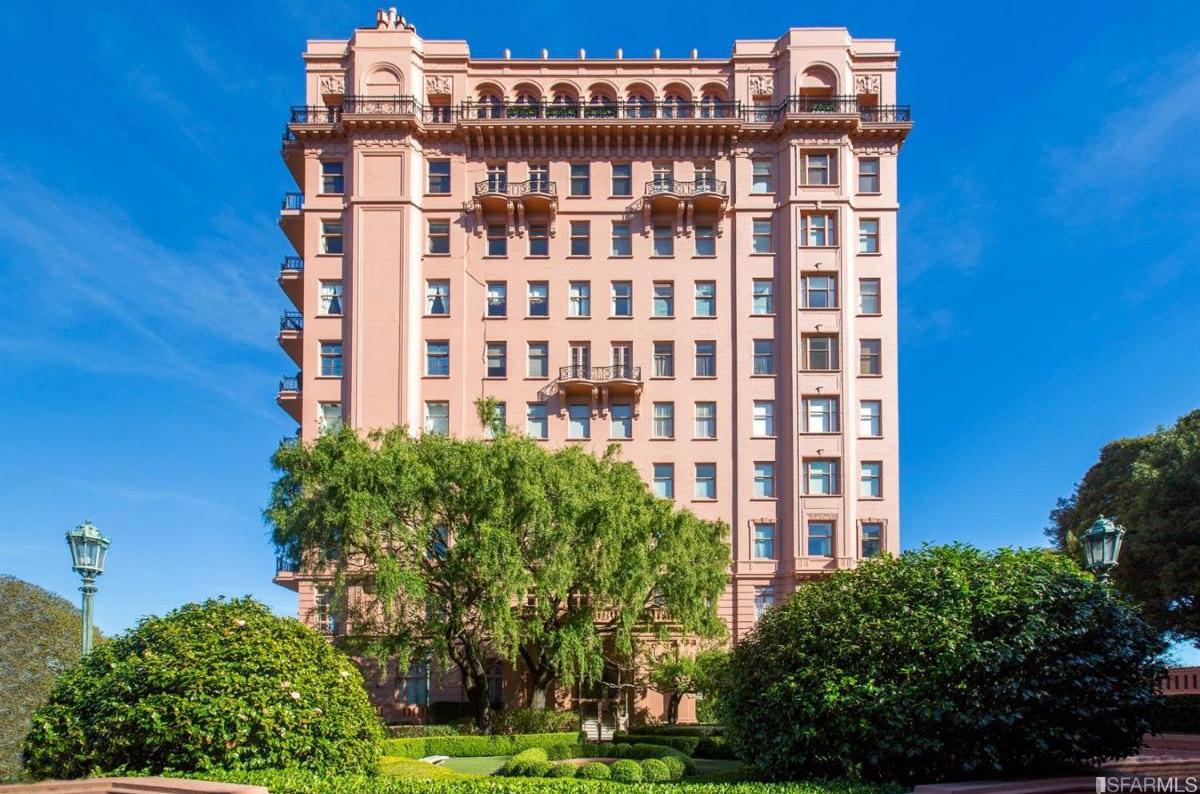
1090 Chestnut St. #3 RUSSIAN HILL / $9,809,524
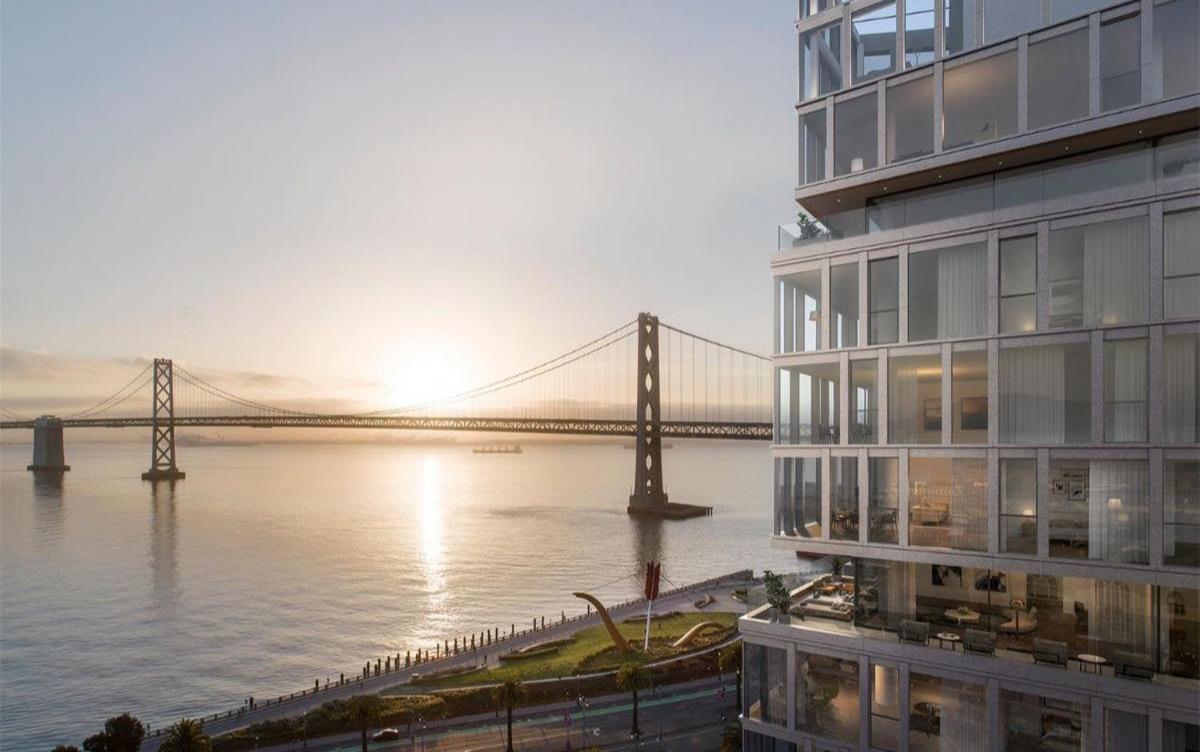
1 Steuart Ln #2001 SOUTH BEACH / $10,500,000
#1 #2 #3
#4
2022 Top Five Condominium Sales / San Francisco
2006 Washington St. #2 PACIFIC HEIGHTS / $19,000,000
999 Green St. #3201 RUSSIAN HILL / $17,000,000
999 Green St. #3202 RUSSIAN HILL / $12,000,000
1090 Chestnut St. #3 RUSSIAN HILL / $9,809,524
1 Steuart Ln #2001 SOUTH BEACH / $10,500,000
#1 #2 #3
#4
Sources: SFAR MLS & BrokerMetrics; Property types covered: Condominium. Only property data posted on the MLS is covered. All information is deemed reliable, but not guaranteed for accuracy. All data is subject to errors, omissions, revisions, and is not warranted. ©2022 Vanguard Properties. All rights reserved. Equal Housing Opportunity. DRE No. 01486075
#5
Median Neighborhood Values / YE 2022
*Small sample size; use caution when interpreting statistics. Sources: SFAR MLS & BrokerMetrics; Property types covered: condominium/TIC/ Stock COOP. Only property data posted on the MLS is covered. All information is deemed reliable, but not guaranteed for accuracy. All data is subject to errors, omissions, revisions, and is not warranted. ©2022 Vanguard Properties. All rights reserved. Equal Housing Opportunity. DRE No. 01486075
Pacific/Presidio Heights Cole Valley/Haight Marina/Cow Hollow Noe Valley Buena Vista/Corona Heights Castro/Duboce Triangle Alamo Square/NOPA Russian Hill Lower Pacific/Laurel Heights Richmond/Lake St Sunset Mission Dolores South Beach/Yerba Buena Mission North Beach/Fisherman’s Wharf Hayes Valley Telegraph Hill Dogpatch Bernal Heights/Glen Park Nob Hill* Mission Bay Potrero Hill SOMA Diamond Heights Bayview/Hunters Point AVG SOLD PRICE $1,634,000 $1,620,000 $1,587,500 $1,500,000 $1,480,000 $1,476,200 $1,462,500 $1,402,500 $1,385,000 $1,345,000 $1,330,000 $1,299,000 $1,249,500 $1,173,750 $1,157,500 $1,150,000 $1,116,500 $1,107,500 $1,100,000 $1,100,000 $1,095,000 $1,085,000 $888,000 $800,000 $732,500 $ / SQ. FT. $1,160 $1,128 $1,302 $1,079 $1,148 $1,137 $1,058 $1,186 $1,098 $999 $990 $1,075 $1,129 $965 $1,015 $1,102 $1,097 $954 $1,037 $1,057 $1,100 $1,075 $884 $950 $710 AVG % OF LIST PRICE RECV’D 102.0% 110.4% 104.0% 107.7% 109.2% 108.4% 110.3% 104.7% 104.9% 108.9% 106.7% 106.9% 98.6% 103.3% 101.6% 104.2% 102.9% 101.4% 107.6% 100.0% 99.2% 101.2% 100.0% 104.3% 100.9% HOMES SOLD 206 81 112 150 63 122 106 122 87 140 26* 78 326 196 50 103 34* 48* 55 116 115 84 150 40* 38*
NEIGHBORHOOD
Current Listings, In-Contract & Recently Sold Properties
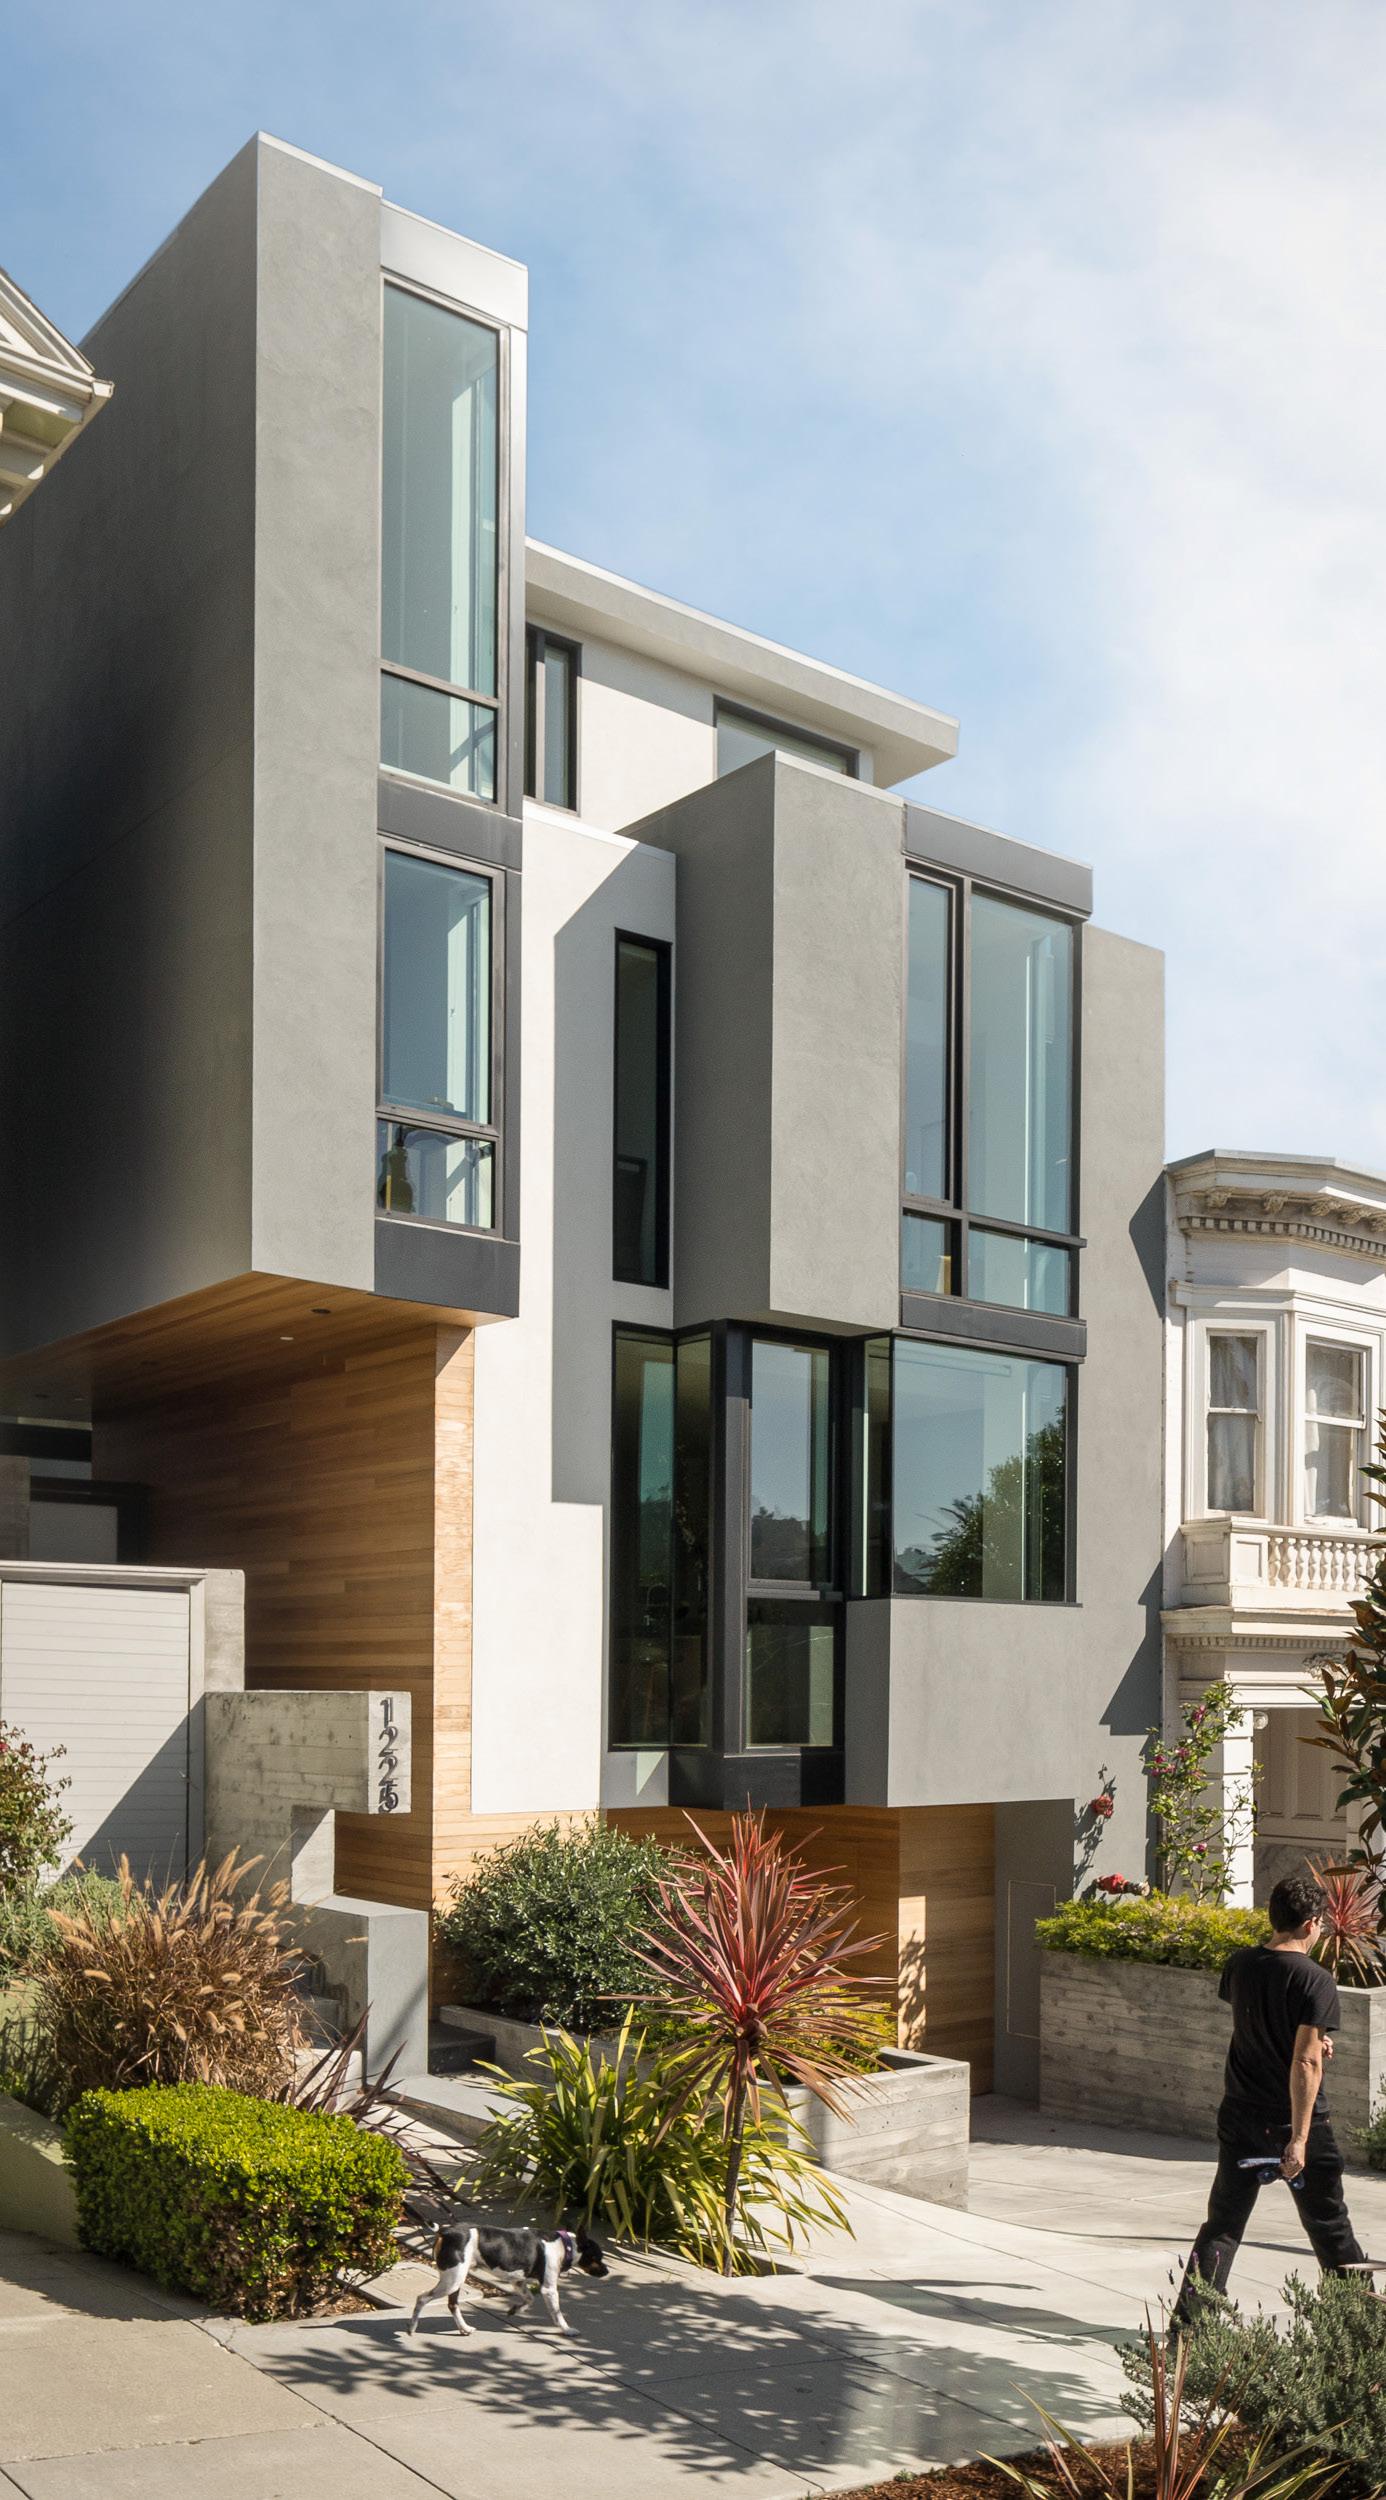
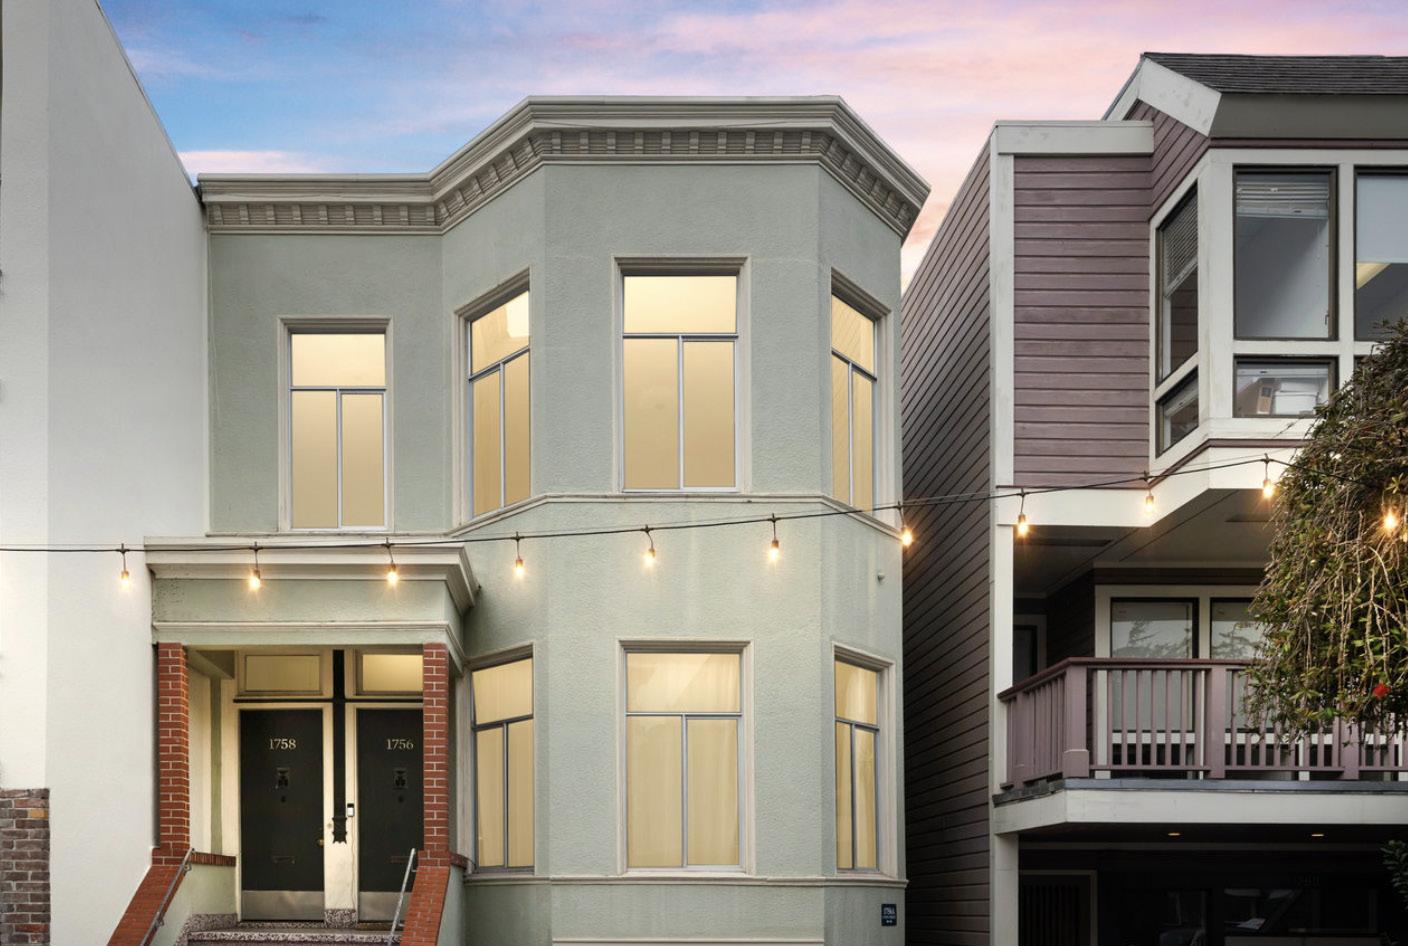
1756-1758 Union Street / Seller Represented SAN FRANCISCO / $2,595,000 • 3 Unit Building With 2 Vacant Units • 2 Full Floor Flats • 1-Bedroom Garden Unit • Top Floor Flat & Garden Unit Are Vacant NEW LISTING 1756Union.com
1587 15th Street, Unit 501 / Seller Represented MISSION / $995,000 • 2 Bedrooms • 1 Bathroom • Top Floor of an Elevator Building • 1-Car Parking • Centrally Located In The Mission Neighhorhood COMING SOON 15thstreet501.com
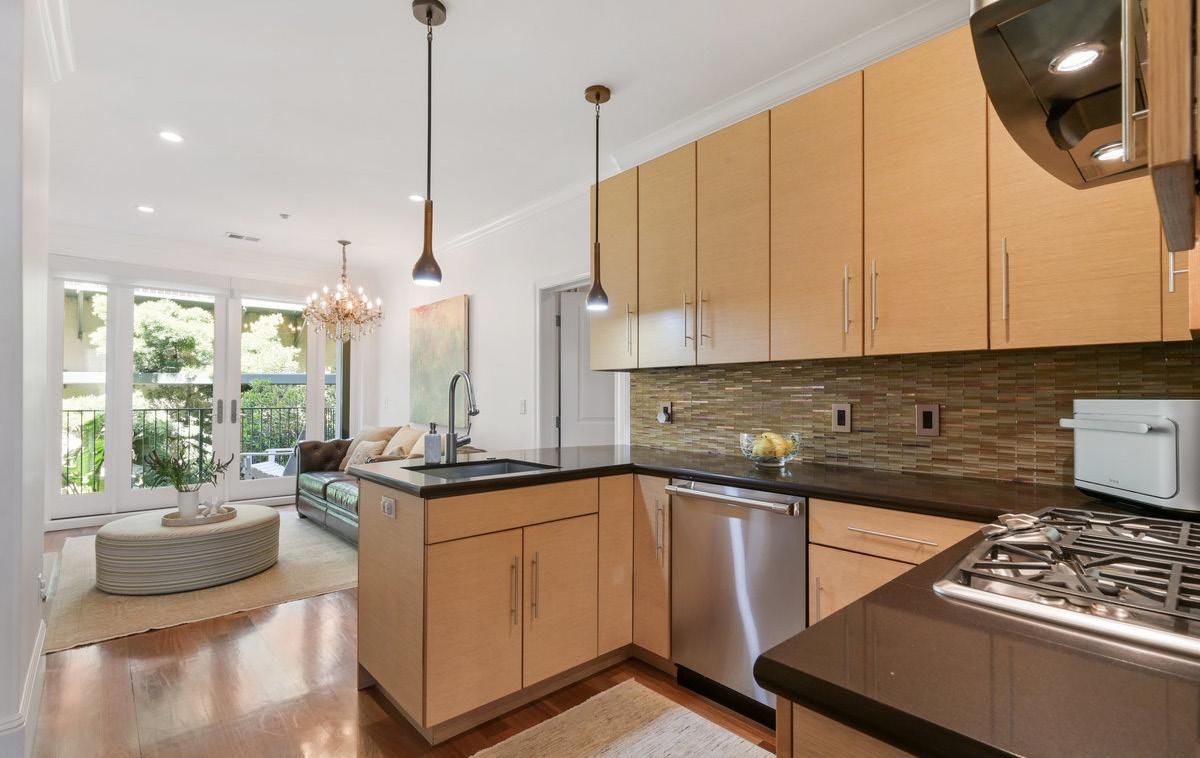
950 Corbett Avenue, Unit 2 / Seller Represented 950CorbettUnit2.com SAN FRANCISCO / $1,650,000 • 3 Bedrooms + Den • 2 Bathrooms • 3 Fireplaces / Juliet Balconies / Brazillian Teak Hardwood Floors • 1-Car Parking Equipped With EV Charging • Boutique Elevator Building With Direct Unit Access COMING SOON
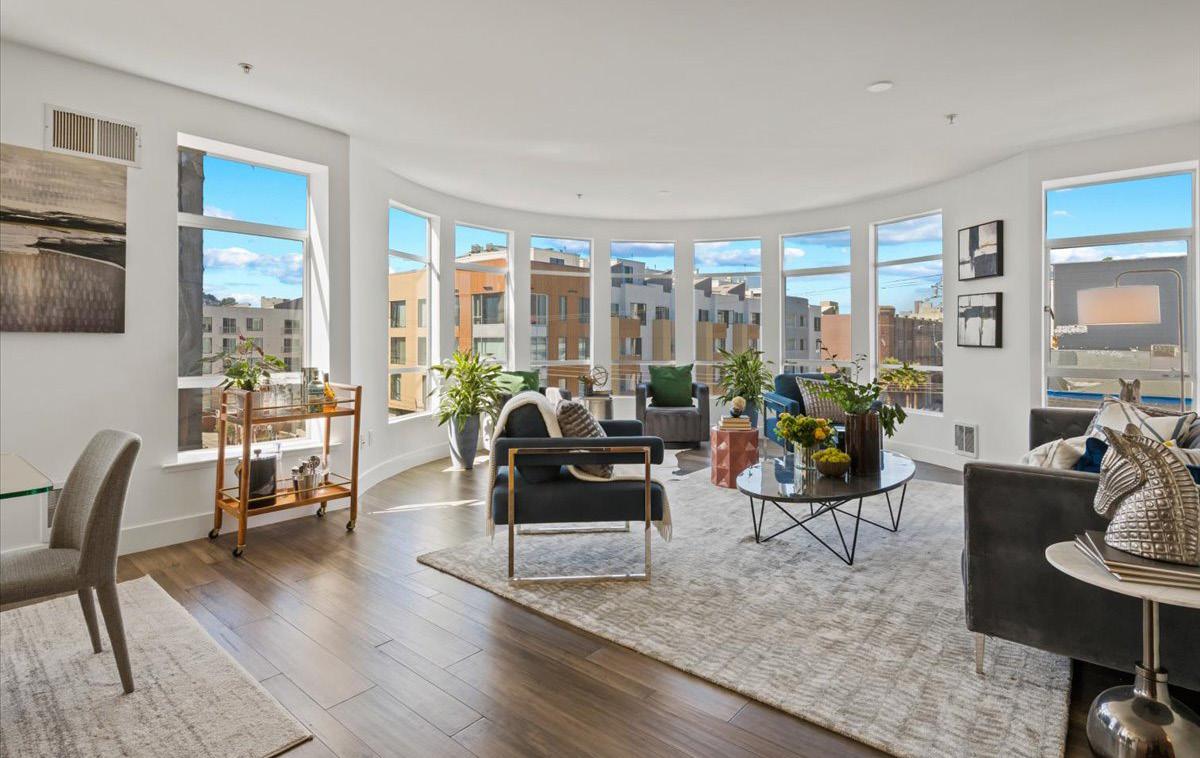
/ $1,650,000 / $1,350 PER SQUARE
• 2 Bedrooms
• 2 Bathrooms
• 1,185 Square Feet
• 1 Parking Space
• Stunning Wall of Windows and Spacious Patio
 2295 Vallejo St. #310 / Seller Represented SAN FRANCISCO
FOOT
2295 Vallejo St. #310 / Seller Represented SAN FRANCISCO
FOOT
IN CONTRACT
884-886 Arlington Avenue / Buyer Represented
OAKLAND / $1,350,000
• 3 Bedrooms / 2 Bathrooms (Upstairs Unit)
• 2 Bedrooms / 2 Bathrooms (Downstairs Unit)
• Built in 1911 / Fully Renovated Duplex
• 2,450 SF Lot
• Detached Garage + Bonus Space
Listed by Annie Tegner / Compass
IN CONTRACT


COLLEEN COTTER 415.706.1781 colleen@colleencottersf.com BRE Lic. #01703078 ZOE FRANKEL 415.235.9422 zoefrankel@vanguardsf.com DRE Lic. #02134477 MARGARET O’DRISCOLL 415.846.3062 margaret@vanguardsf.com BRE Lic. #01131561 Contact colleencottersf.com 1801 Filmore Street | San Francisco, CA 94115
