NOE VALLEY &

SAN FRANCISCO
MAY 2023 MARKET DATA
A Note From Colleen & Zoe


Dear Clients, Colleagues, and Friends,
Hard to believe we are already half way through the year, and what an interesting year it has been! When it comes to real estate, this year has been unlike any other in recent memory!

We are seeing a very nuanced market, that varies widely from property to property. While some properties are moving quickly (with many over asking), other properties, that may not check all the boxes upon first glance, are lingering and providing an interesting opportunity for Buyers in the marketplace. Buyers are beginning to come to terms with the new normals of rates, but overall activity is still not quite where it was in 2022....
We have also seen reduced inventory levels from recently established norms...this can largely be attributed to homeowners with exceptionally low, long-term, fixed rate mortgages who are a bit more hesitant to sell and move to a replacement property at a higher rate.
This effect on supply and demand has further intensified the pressure on prices even in an environment of reduced overall activity. That being said, we are also optimizing this market for our buyers, a few recent Buyer wins below:
• Secured an off-market opportunity for our Buyers that ended up appraising $200k over purchase price!
• Just closed on a property for Buyers $800k under asking price
• Helped our first time Buyer put together a winning offer in a highly competitive multiple offer situation!
We have been able to secure some pretty fantastic deals for both our Buyers & Sellers in the recent months….and anticipate quite a few more in the coming months! Please feel free to reach out for more info! We’d love to connect!
COLLEEN COTTER TOP PRODUCER, 2009-2022 Ranked in the top 1.5% of real estate agents in San Francisco c 415.706.1781 f 415.321.7235 e colleen@colleencottersf.com 1801 Fillmore Street San Francisco, CA 94115 DRE 01703078
The Cotter Group’s Thoughts On The Current Market
BUYER DEMAND
Buyer demand has been steadily recovering from its lowest point in late 2022. Although mortgage applications still lag significantly behind the previous year’s figures, many prospective buyers have come to terms with higher interest rates as the new normal and have decided to proceed with their purchasing plans.
Inventory Levels
The number of new listings hitting the market has dropped from recently established norms. This can largely be attributed to homeowners with exceptionally low, long-term, fixed-rate mortgages being hesitant to sell their properties and subsequently purchase new ones at significantly higher prevailing interest rates. This decline in new listings has weighty implications for the dynamics of supply and demand, further intensifying the pressure on prices even in an environment of reduced overall activity.
RATES
Though rates are higher than they have been in some time, Buyers are accepting these higher rates as the new normal & the initial “sticker shock” has largely subsided.
Noe Valley Market Update


Noe Valley Market Snapshot
NEW LISTINGS
PENDING SALES SOLD LISTINGS
NEW LISTINGS
PENDING SALES SOLD LISTINGS
YTD MAY ‘23 YTD MAY ‘22 % CHANGE
MARKET % OF PROPERTIES
LIST PERCENT OF LIST PRICE RECEIVED* 80 63 60 $2,850,000 $3,495,603 20 85.0% 120.0% 56 38 37 $2,350,000 $2,696,601 31 54.1% 106.8% -30.0% -39.7% -38.3% -17.5% -22.9% +55.0% -36.4% -11.0% SINGLE FAMILY HOMES YTD MAY ‘23
MEDIAN SALES PRICE* AVERAGE SALES PRICE* DAYS ON
SOLD OVER
DAYS ON MARKET % OF PROPERTIES SOLD OVER LIST PERCENT OF LIST PRICE RECEIVED* 99 77 64 $1,500,000 $1,590,080 26 85.9% 112.4% 62 42 38 $1,400,000 $1,560,671 41 57.9% 101.9% -37.4% -45.5% -40.6% -6.7% -1.8% +57.7% -32.6% -9.3% CONDOMINIUMS/TIC/COOP YTD MAY ‘22 % CHANGE Current as of June 22, 2023. All data from the San Francisco Association of REALTORS® MLS. Report © 2023 ShowingTime. *Does not account for sale concessions and/or downpayment assistance. | Percent changes are calculated using rounded figures and can sometimes look extreme due to small sample size.
MEDIAN SALES PRICE* AVERAGE SALES PRICE*
Single Family Market SAN
FRANCISCO CITY WIDE
Year-Over-Year Comparison
MAY 2023 MAY 2022 % CHANGE
MEDIAN SALES PRICE DAYS ON MARKET $ PER SQUARE FOOT END OF MONTH INVENTORY WENT INTO CONTRACT PROPERTIES SOLD $1,650,000 14 $1,008 299 195 187
May 2023
WENT INTO CONTRACT PROPERTIES SOLD END OF MONTH INVENTORY # OF PROPERTIES SOLD OVER LIST AVERAGE % OF LIST PRICE RECEIVED 195 187 299 64.2% 108.3% 220 282 493 88.3% 119.2% -11.4% -33.7% -39.4% -27.3% -9.1% Sources: SFAR MLS & BrokerMetrics; Property types covered: Single-family. Only property data posted on the MLS is covered. All information is deemed reliable, but not guaranteed for accuracy. All data is subject to errors, omissions, revisions, and is not warranted. ©2023 Vanguard Properties. All rights reserved. Equal Housing Opportunity. DRE No. 01486075
May 2023 / Top 5 Single-Family Home Sales / San Francisco 3410
HEIGHTS
2430 Pacific
2555 Union Street
15 Buena Vista Terrace
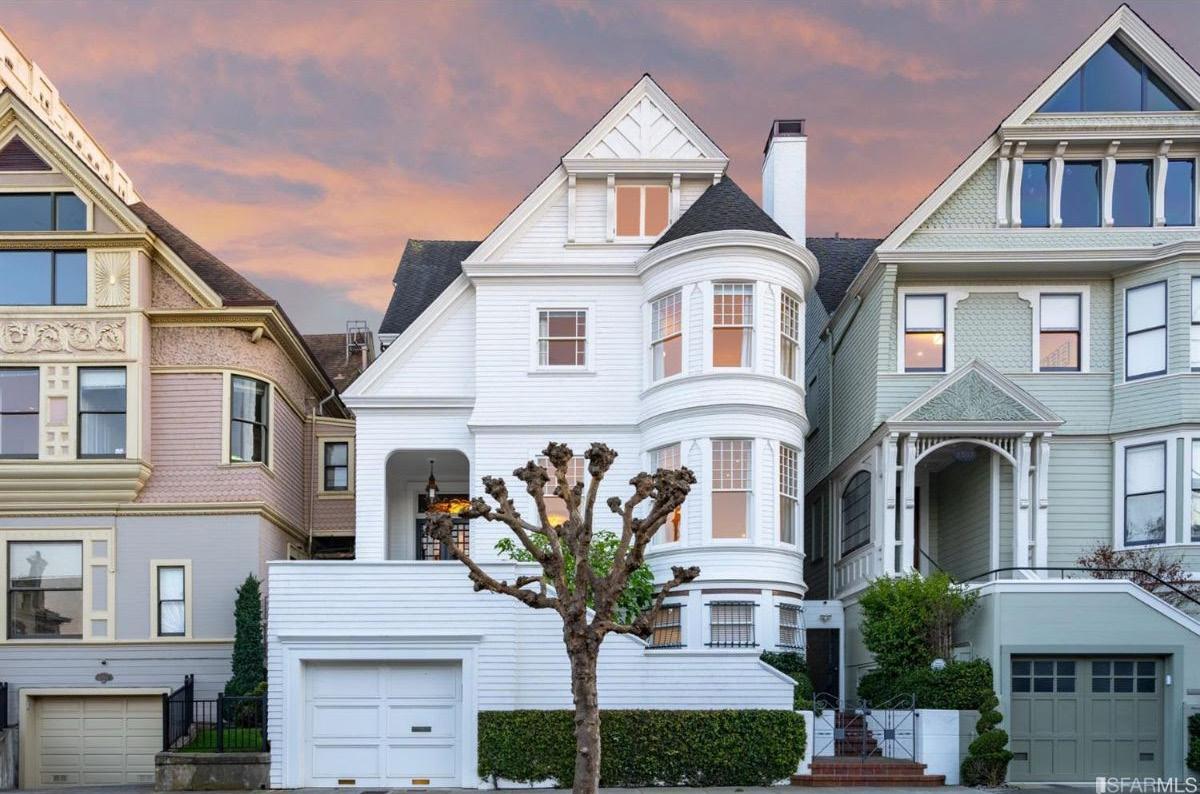
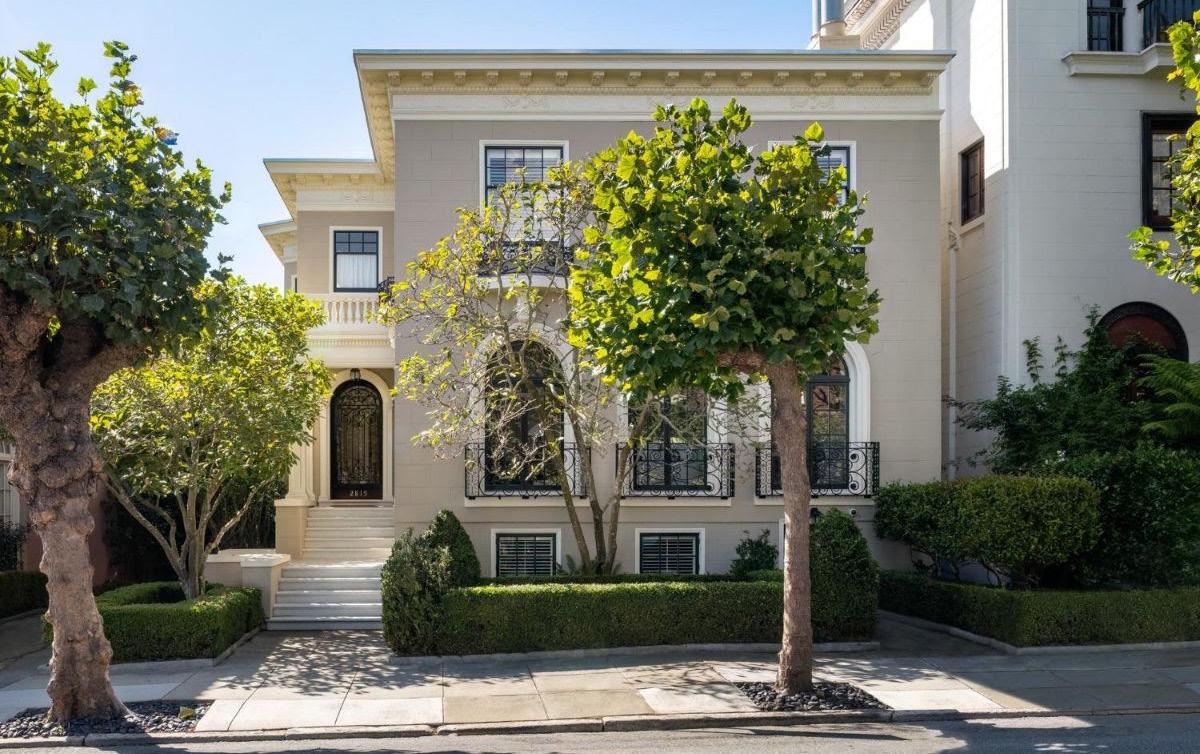
2815 Pacific Avenue
HEIGHTS
Jackson Street PRESIDIO
/ $18,500,000
Avenue PACIFIC HEIGHTS / $9,999,900
COW HOLLOW / $9,266,000
BUENA VISTA / $7,500,000
PACIFIC
/ $8,500,000
#1
#2 #3
Sources: SFAR MLS & BrokerMetrics; Property types covered: Single-family. Only property data posted on the MLS is covered. All information is deemed reliable, but not guaranteed for accuracy. All data is subject to errors, omissions, revisions, and is not warranted. ©2023 Vanguard Properties. All rights reserved. Equal Housing Opportunity. DRE No. 01486075
#4 #5
Median Neighborhood Values / Q1 2023
*Denotes small sample size - use caution when interpreting statistics. Sources: SFAR MLS & BrokerMetrics; Property types covered: Single-family. Only property data posted on the MLS is covered. All information is deemed reliable, but not guaranteed for accuracy. All data is subject to errors, omissions, revisions, and is not warranted. ©2023 Vanguard Properties. All rights reserved. Equal Housing Opportunity. DRE No. 01486075
Marina/Cow Hollow Russian Hill Pacific/Presidio Heights Lower Pacific/Laurel Heights Cole Valley/Haight Buena Vista/Corona Heights Castro/Duboce Triangle Richmond/Lake Street Noe Valley Ingleside Terrace/Lakeside Diamond Heights Sunset Potrero Hill Bernal Heights/Glen Park Westwood Park/Sunnyside Mission Excelsior/Portola Bayview/Hunters Point Alamo Square/NoPa Hayes Valley AVG SOLD PRICE $6,197,500 $6,025,000 $5,075,000 $4,500,000 $3,450,000 $3,250,000 $3,067,861 $2,409,000 $2,075,000 $2,035,000 $1,987,500 $1,652,500 $1,650,000 $1,590,000 $1,375,000 $1,360,000 $1,175,000 $908,000$ / SQ. FT. $1,721 $1,646 $1,615 $1,571 $1,184 $1,083 $1,220 $959 $1,326 $821 $796 $991 $853 $1,035 $930 $936 $814 $635AVG % OF LIST PRICE RECV’D 94.4% 96.6% 97.6% 95.7% 98.6% 102.0% 104.2% 105.0% 107.3% 135.5% 92.3% 106.3% 99.3% 108.1% 101.9% 102.0% 105.3% 105.7%HOMES SOLD 2* 2* 8* 3* 1* 5* 8* 26* 18* 4* 2* 22* 7* 42* 14* 5* 15* 14* 0 0
NEIGHBORHOOD

Condominium Market SAN FRANCISCO CITY WIDE
MAY 2023 MAY 2022 % CHANGE
MEDIAN SALES PRICE DAYS ON MARKET $ PER SQUARE FOOT END OF MONTH INVENTORY WENT INTO CONTRACT PROPERTIES SOLD $1,150,000 32 $998 701 196 216
WENT INTO CONTRACT PROPERTIES SOLD END OF MONTH INVENTORY # OF PROPERTIES SOLD OVER LIST AVERAGE % OF LIST PRICE RECEIVED 196 216 701 43.1% 100.1% 297 357 1,225 56.6% 105.8% -34.0% -39.5% -42.8% -23.9% -5.4% Sources: SFAR MLS & BrokerMetrics; Property types covered: Condos/TIC/Co-Ops. Only property data posted on the MLS is covered. All information is deemed reliable, but not guaranteed for accuracy. All data is subject to errors, omissions, revisions, and is not warranted. ©2023 Vanguard Properties. All rights reserved. Equal Housing Opportunity. DRE No. 01486075
May 2023
Year-Over-Year Comparison
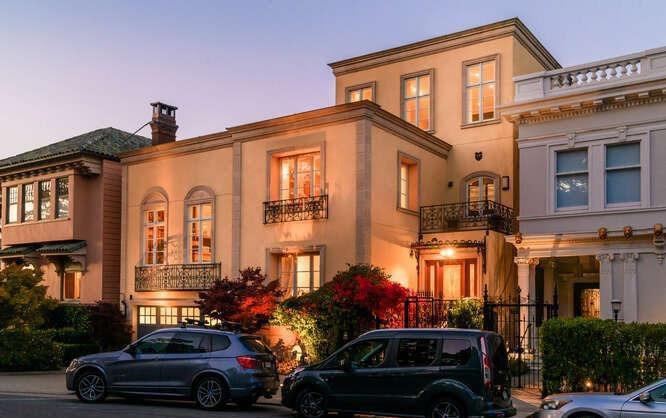
May 2023 / Top 5 Condominium Sales / San Francisco 1099 Dolores St. NOE VALLEY / $4,350,000 2151 Laguna St., #3 PACIFIC HEIGHTS / $3,850,000 2127 Broadway St., #1 PACIFIC HEIGHTS
3937 Sacramento St. PRESIDIO HEIGHTS /
1268 Lombard St.,
RUSSIAN HILL /
#1 #2
#4 #5 Sources: SFAR MLS & BrokerMetrics; Property types covered: Condos/TIC/Co-Ops. Only property data posted on the MLS is covered. All information is deemed reliable, but not guaranteed for accuracy. All data is subject to errors, omissions, revisions, and is not warranted. ©2023 Vanguard Properties. All rights reserved. Equal Housing Opportunity. DRE No. 01486075
/ $3,358,888
$2,750,000
#4
$3,100,000
#3
Median Neighborhood Values / Q1 2023
NEIGHBORHOOD
Marina/Cow Hollow
Alamo Square/NOPA
Castro/Duboce Triangle
Pacific/Presidio Heights
Buena Vista/Corona Heights
Noe Valley
Cole Valley/Haight
Russian Hill
Lower Pacific/Laurel Heights
Hayes Valley
South Beach/Yerba Buena
Richmond/Lake St
North Beach/Fisherman’s Wharf
Mission Bay
Mission Dolores
Mission
Sources: SFAR MLS & BrokerMetrics; Property types covered: Condos/TIC/Co-Ops. Only property data posted on the MLS is covered. All information is deemed reliable, but not guaranteed for accuracy. All data is subject to errors, omissions, revisions, and is not warranted. ©2023 Vanguard Properties. All rights reserved. Equal Housing Opportunity. DRE No. 01486075
Dogpatch
Park
Nob Hill* Bernal Heights/Glen
Potrero Hill Telegraph Hill Diamond Heights Sunset SOMA Bayview/Hunters Point AVG SOLD PRICE $1,925,000 $1,550,000 $1,537,500 $1,500,000 $1,475,000 $1,362,500 $1,350,000 $1,250,000 $1,250,000 $1,210,000 $1,184,000 $1,125,000 $1,088,000 $1,081,000 $1,060,000 $1,035,000 $1,030,000 $947,500 $925,000 $919,500 $916,250 $915,000 $841,500 $747,000 $620,000 $ / SQ. FT. $1,211 $925 $1,133 $1,050 $1,059 $1,148 $952 $1,158 $979 $991 $1,072 $947 $931 $1,028 $970 $1,035 $832 $866 $830 $1,034 $1,184 $795 $1,038 $764 $624 AVG % OF LIST PRICE RECV’D 99.1% 101.0% 101.3% 101.1% 99.5% 102.1% 101.1% 98.9% 105.9% 100.9% 94.9% 100.4% 97.5% 99.0% 99.6% 99.3% 97.2% 102.0% 99.9% 101.6% 100.0% 98.3% 103.5% 97.2% 103.7% HOMES SOLD 13* 23* 16* 32* 9* 18* 12* 18* 13* 15* 51 22* 9* 18* 6* 13* 16* 9* 28* 8* 6* 4* 6* 20* 5*
Current Listings, In-Contract & Recently Sold Properties

219 Brannan St. #18D
SOUTH BEACH / $3,245,000
• Top Floor Penthouse at the Brannan
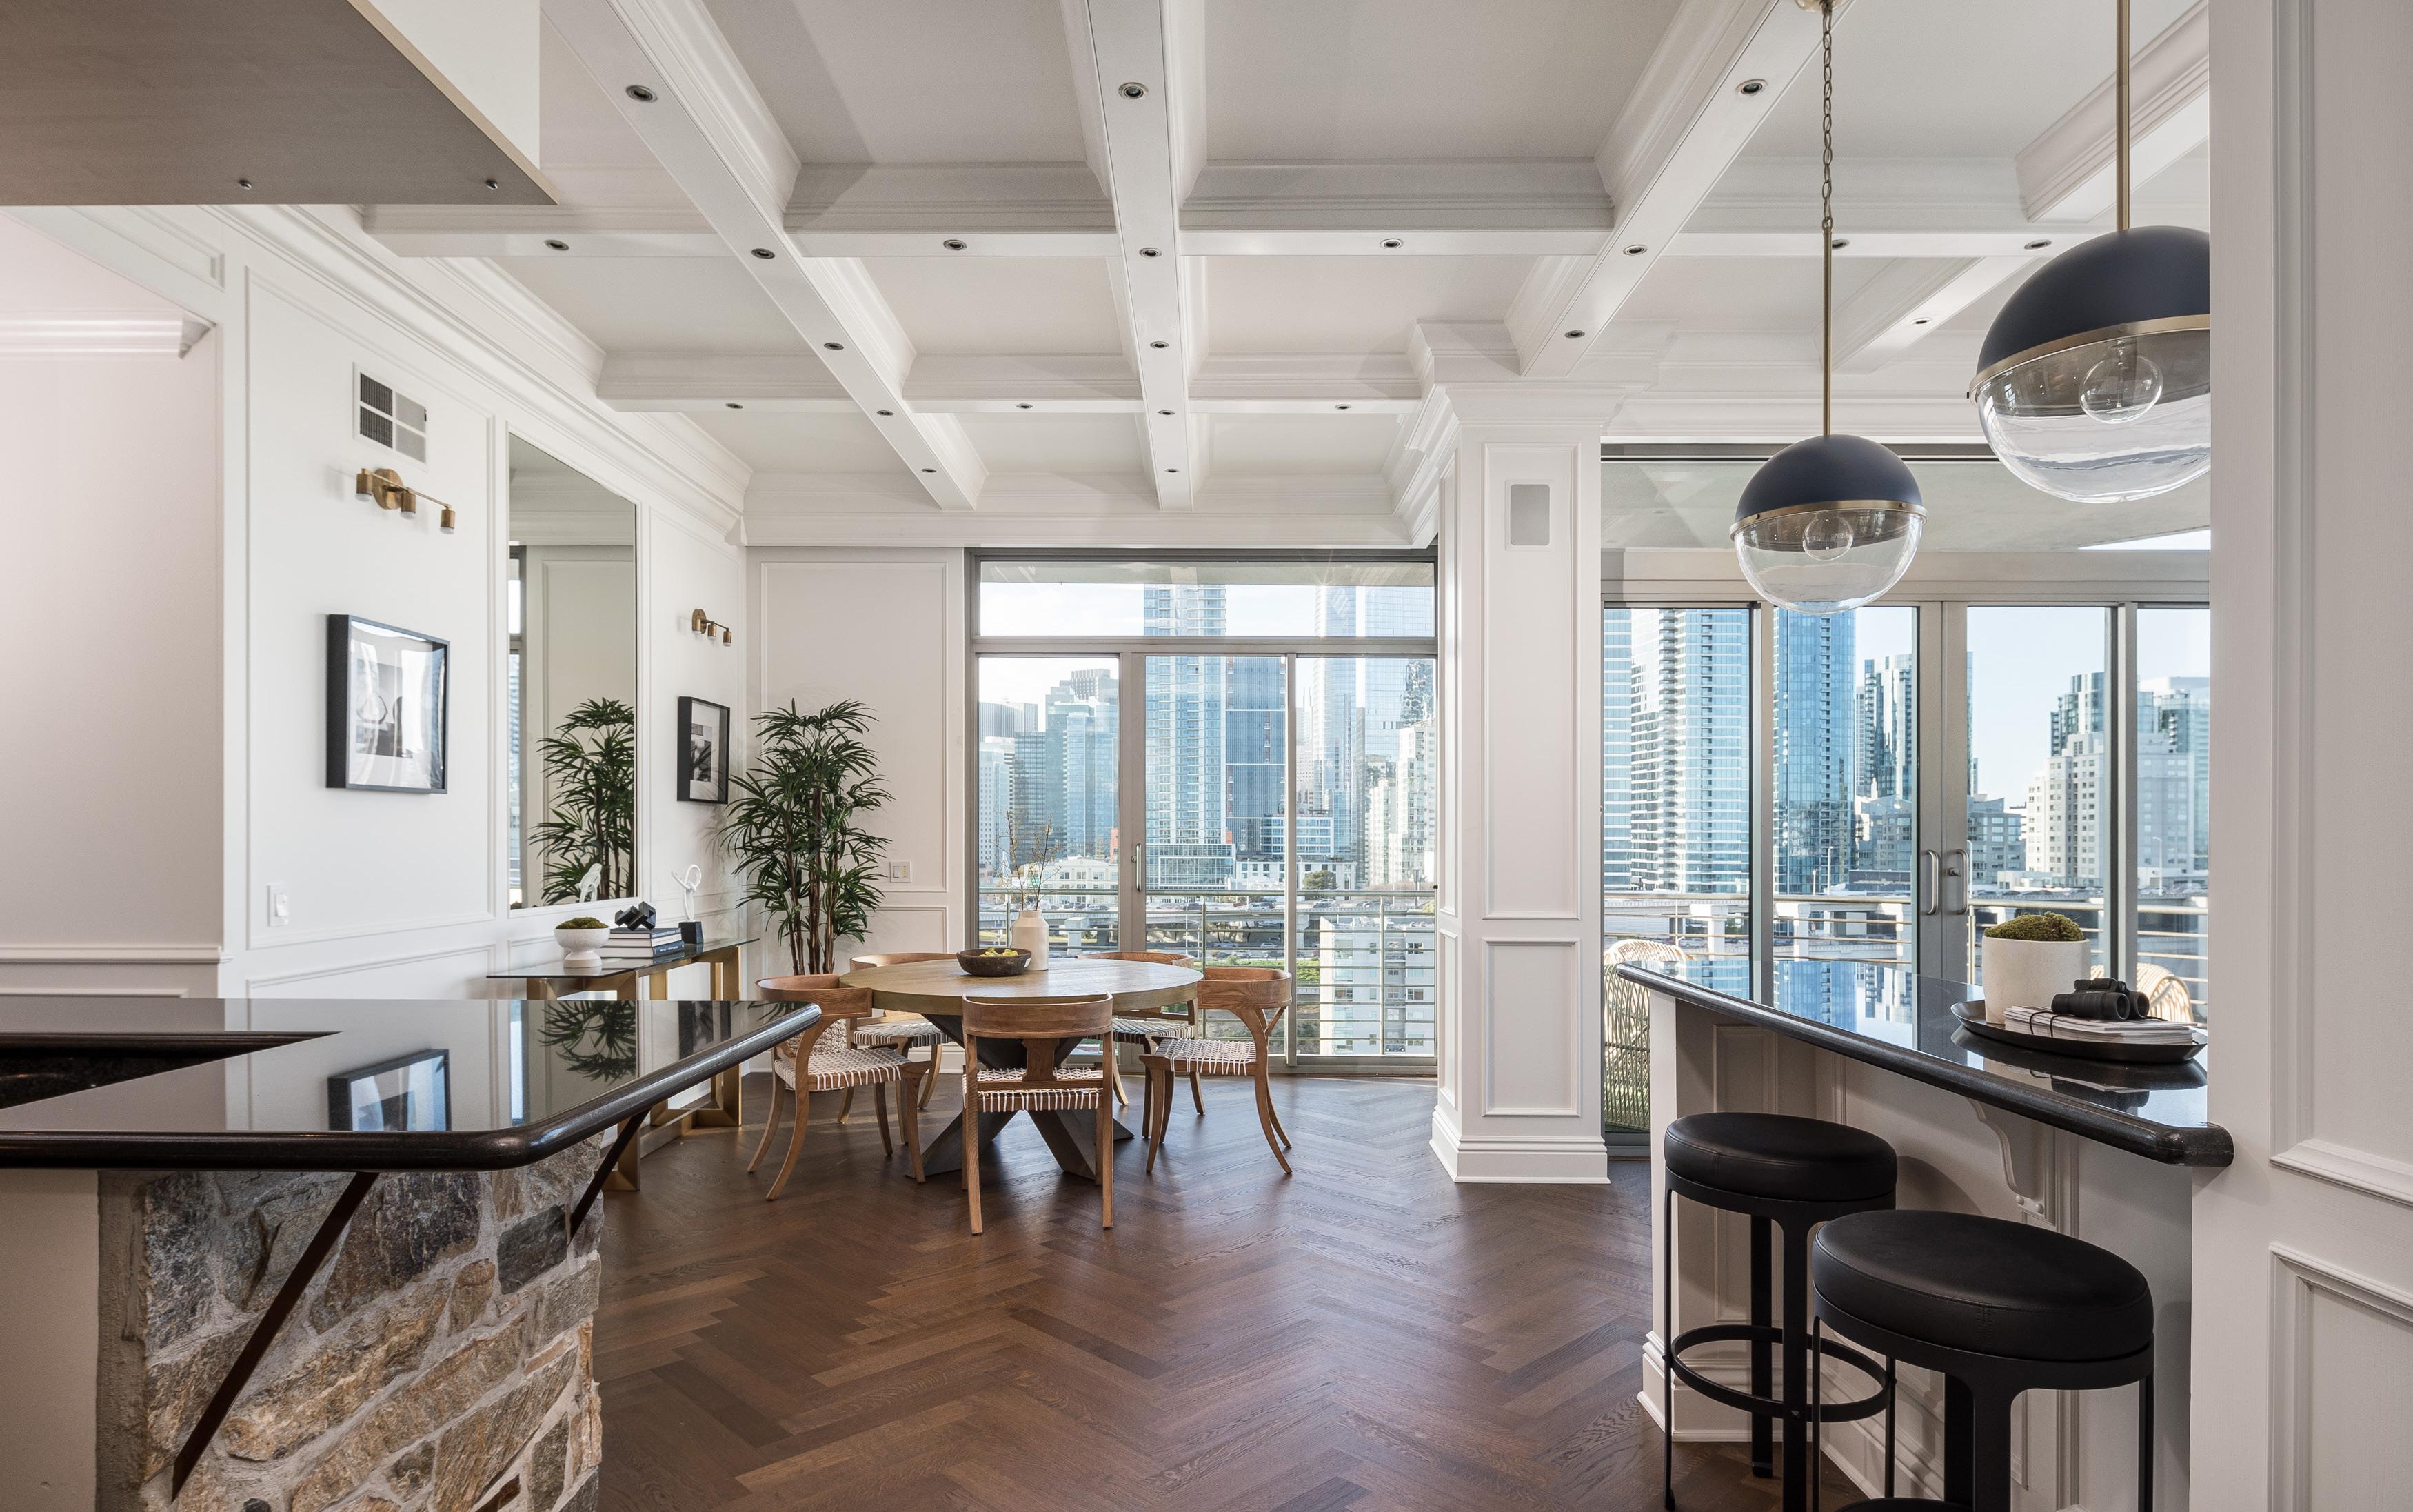
• 3 Bedrooms, 3 Bathrooms
• Floor to Ceiling Windows with Unobstructed Views of the Bay Bridge & CItyscape
• Walk-Out Terrace
• Herringbone Wood Floors Throughout
• 2-Car Parking
FOR SALE BrannanPenthouseLiving.com
99 Rausch Street
SOMA / $585,000
• 1 Bedroom, 1 Bathroom
• Private South Facing Patio
• South Facing Floor to Ceiling Windows Flooded with Natural Light
• Quiet Tree-Lined Street
• Full Amenity Building with a Doorman, Gym, and Rooftop Deck
FOR SALE
99Rausch202.com
1756-1758
COW HOLLOW / $2,595,000
• Vacant 3 Unit Building
• 2 Full Floor Flats
• 1-Bedroom Garden Unit
• Top Floor Flat & Garden Unit Are Vacant
Union Street
FOR SALE
1756Union.com
2762 Union Street COW HOLLOW / $1,075,000
2 Bedroom
1.5 Bathrooms
Condo Overlooks A Luxurious Sunny Garden IN CONTRACT
•
•
•
3053 Pine Street
LOWER PACIFIC HEIGHTS / $2,295,000
• 6-Unit Building
• Well Maintained
• 4 Tenant Occupied Units
• 2 Vacant Units
FOR SALE
1380 Fell Street
NOPA / $3,795,000
• 8-Unit Building
• All 1-Bedroom Units
• 8 Car Garage
• Fantastic Opportunity For Investors Looking To Capitalize On The Strong Rental Market In This Sought-After Location
FOR SALE
SOUTH BEACH / $4,995,000 / BUYER REPRESENTED
• 2 Bedrooms
• 2.5 Bathrooms
• Penthouse at The Lumina

#42AB
201 Folsom Street
IN CONTRACT
JUST
2266 Jackson Street
SOLD $2,725,000 / BUYER REPRESENTED
SOLD
/ BUYER REPRESENTED
SOLD
429 Vermont Street SOLD $650,000
JUST


COLLEEN COTTER 415.706.1781 colleen@colleencottersf.com BRE Lic. #01703078 ZOE FRANKEL 415.235.9422 zoefrankel@vanguardsf.com DRE Lic. #02134477 Contact colleencottersf.com 1801 Filmore Street | San Francisco, CA 94115
