SAN FRANCISCO
DECEMBER 2022 MARKET UPDATE

Dear Friends, Neighbors & Clients,
Happy New Year! I hope you had a wonderful holiday & were able to enjoy the time off with your loved ones! The city feels alive again and full of energy…have you been to Union Square recently? It is gorgeous and it has been such a treat to see San Francisco coming back to the magical city that we all know and love!
What a YEAR! December was a very busy month for our team, starting off the month with six transactions in contract! We closed 3 of our listings before the end of the month and were able to put another in contract! We are also excited to share the latest market update with November data recorded. While demand is certainly reduced, I’m optimistic that we are headed into a market with opportunities for both buyers and sellers. For buyers, we are seeing price negotiation and an ability to structure contingent deals that simply have not existed for the past 5 years!
But it’s not all doom and gloom for sellers. When comparing today’s average sale price to pre-pandemic times, home values have risen dramatically. So while we reflect on a decline from this year’s peak, there are still tremendous gains if you take a longer term perspective, and the lack of inventory presents a great time to sell. San Francisco has always been a great market with historically generous appreciation, and savvy investors are excited for the opportunities in the market today!
As I reflect back on 2022, I’m filled with gratitude & thanking my lucky stars for all that is abundant here in the Bay Area. Thank you to all of YOU who have continued to support me and my fantastic team, and have allowed us to be of service to you!

Wishing you a fantastic start to your 2023 & cannot wait to see what the new year brings!
XOXO,

A Note From Colleen...
TOP PRODUCER, 2009-2021 Ranked in the top 1% of real estate agents in San Francisco c 415.706.1781 f 415.321.7235 e colleen@colleencottersf.com 1801 Fillmore Street San Francisco, CA 94115 DRE 01703078
The Cotter Group’s Thoughts On The Current Market
What an interesting market we are in! There are so many stats to study. You’ll notice that November sales recorded a 20.1% decrease in median sale prices for single-family homes and a 9.1% drop for condominiums, respectively.
That being said, transaction volume is also down significantly which impacts this data. The economy and housing market remain in a period of adjustment, causing many to be more cautious as they wait to see how things go, while others dive into opportunities we haven’t seen infor years.
We are always here to help decode what’s really going on, and to share what we are seeing in real time!
Here are my current thoughts:
• Long Term Appreciation: We took some time to review the long-term numbers. It’s fascinating to look at our appreciation data over the years. Check out the data on page 12!
• Rates: National mortgage rates continued to decrease & we are closely watching them each week…
• Volume of Closed Transactions: The number of closed transactions is down 37.2% for single- family homes & 52.6% for condos year over year
• Activity Levels: We are seeing that activity has picked up over the past few weeks as savvy Buyers recognize this is a great time to buy….
• The Perfect Homes are Moving: Homes that check all the boxes are still moving quickly & sometimes for over asking price...but the less-than-perfect homes, or ones that do not check all the boxes are lingering and Buyers are coming in with lower offers…
• Inventory Levels: Inventory continues to steadily drop as we approach the end of the year, and it is clear that demand is reduced from the ravenous pace of 2021.
• Pricing: Sellers will be rewarded if they price their homes properly, and we are excited to see our buyers winning and making great investments before the end of the year.
• The Holiday Market: We are entering the two-month holiday period which historically sees the year’s lowest levels of activity. However, the market never completely stops and the holidays can be an excellent time for buyers to assertively negotiate prices!
Pacific Heights Market Snapshot
JAN-NOV ‘22 JAN-NOV ‘21 % CHANGE
NEW LISTINGS
PENDING SALES
SOLD LISTINGS
MEDIAN SALES PRICE* AVERAGE SALES PRICE* DAYS ON MARKET
% OF PROPERTIES SOLD OVER LIST PERCENT OF LIST PRICE RECEIVED*
73 39 38 $5,750,000 $6,559,447 46 55.3% 101.7%
90 55 52 $6,625,000 $7,582,594 29 30.8% 98.9%
-18.9% -29.1% -26.9% -13.2% -13.5% +58.6% +79.5% +2.8% SINGLE FAMILY HOMES
JAN-NOV ‘22
CONDOMINIUMS/TIC/COOP
NEW LISTINGS
PENDING SALES SOLD LISTINGS
MEDIAN SALES PRICE* AVERAGE SALES PRICE* DAYS ON MARKET
% OF PROPERTIES SOLD OVER LIST
PERCENT OF LIST PRICE RECEIVED*
262 173 175 $1,510,000 $2,005,661 42 49.7% 102.1%
JAN-NOV ‘21 % CHANGE
301 271 263 $1,575,000 $2,041,052 41 49.0% 102.9%
-13.0% -36.2% -33.5% -4.1% -1.7% +2.4% +1.4% -0.8%
Current as of December 11, 2022. All data from the San Francisco Association of REALTORS® MLS. Report © 2022 ShowingTime. *Does not account for sale concessions and/or downpayment assistance. | Percent changes are calculated using rounded figures and can sometimes look extreme due to small sample size.
Cow Hollow Market Snapshot
JAN-NOV ‘22 JAN-NOV ‘21 % CHANGE
NEW LISTINGS
PENDING SALES
SOLD LISTINGS
MEDIAN SALES PRICE* AVERAGE SALES PRICE* DAYS ON MARKET
% OF PROPERTIES SOLD OVER LIST
PERCENT OF LIST PRICE RECEIVED*
35 19 18 $4,637,500 $5,213,934 51 50.0% 104.3%
39 32 32 $3,918,000 $5,126,633 39 56.3% 106.1%
-10.3% -40.6% -43.8% +18.4% +1.7% +30.8% -11.2% -1.7% SINGLE FAMILY HOMES
JAN-NOV ‘22
NEW LISTINGS
PENDING SALES SOLD LISTINGS
MEDIAN SALES PRICE* AVERAGE SALES PRICE* DAYS ON MARKET
% OF PROPERTIES SOLD OVER LIST
PERCENT OF LIST PRICE RECEIVED*
88 52 51 $1,460,000 $1,599,529 31 43.1% 102.3%
105 83 79 $1,547,500 $1,704,275 31 43.1% 102.3%
-16.2% -37.3% -35.4% -5.7% -6.1% -34.0% +3.1% -0.5% CONDOMINIUMS/TIC/COOP
JAN-NOV ‘21 % CHANGE Current as of December 11, 2022. All data from the San Francisco Association of REALTORS® MLS. Report © 2022 ShowingTime. *Does not account for sale concessions and/or downpayment assistance. | Percent changes are calculated using rounded figures and can sometimes look extreme due to small sample size.
Single Family Market

SAN FRANCISCO CITY WIDE
Comparison
NOV 2022 NOV 2021 % CHANGE November 2022 MEDIAN SALES PRICE DAYS ON MARKET $ PER SQUARE FOOT END OF MONTH INVENTORY WENT INTO CONTRACT PROPERTIES SOLD $1,502,500 20 $923 254 139 184 Year-Over-Year
WENT INTO CONTRACT PROPERTIES SOLD END OF MONTH INVENTORY # OF PROPERTIES SOLD OVER LIST AVERAGE % OF LIST PRICE RECEIVED 139 184 254 58.2% 104.9% 232 293 317 79.5% 114.8% -40.1% -37.2% -19.9% -26.8% -8.6% Sources: SFAR MLS & BrokerMetrics; Property types covered: Single-family. Only property data posted on the MLS is covered. All information is deemed reliable, but not guaranteed for accuracy. All data is subject to errors, omissions, revisions, and is not warranted. ©2022 Vanguard Properties. All rights reserved. Equal Housing Opportunity. DRE No. 01486075
Top Five Single-Family Home Sales / San Francisco 2828 Vallejo PACIFIC HEIGHTS / $13,500,000 1600 Monterey Blvd. ST. FRANCIS WOOD / $4,988,000 10 5th Avenue LAKE STREET / $4,700,000 3666 Baker Street MARINA / $4,666,000 2675 Pacific Avenue PACIFIC HEIGHTS / $4,700,000 #1 #2 #3 #4 #5 Sources: SFAR MLS & BrokerMetrics; Property types covered: Single-family. Only property data posted on the MLS is covered. All information is deemed reliable, but not guaranteed for accuracy. All data is subject to errors, omissions, revisions, and is not warranted. ©2022 Vanguard Properties. All rights reserved. Equal Housing Opportunity. DRE No. 01486075
Median Neighborhood Values / Q3 2022
NEIGHBORHOOD SINGLE FAMILY $ / SQ. FT. AVG % OF LIST PRICE REC’D HOMES SOLD
Pacific/Presidio Heights $3,922,000 $1,403 104.5% 8*
Noe Valley $3,325,000 $1,306 105.3% 22
Lower Pacific/Laurel Heights $3,317,500 $1,358 103.7% 6*
Marina/Cow Hollow $3,300,000 $1,554 104.2% 11
Buena Vista/Corona Heights $3,165,000 $1,205 102.2% 6*
Alamo Square/NoPa $3,000,000 $937 100.2% 1*
Castro/Duboce Triangle $2,641,250 $1,302 103.9% 12
Cole Valley/Haight $2,400,000 $1,102 110.8% 7*
Diamond Heights $2,355,000 $1,003 101.4% 2*
Ingleside Terrace/Lakeside $2,250,000 $986 109.6% 8*
Richmond/Lake Street $2,225,000 $1,011 105.6% 24
Inner Mission $2,205,000 $811 98.7% 6*
Russian Hill $2,150,000 $1,284 92.5% 3*
Bernal Heights/Glen Park $1,667,500 $1,039 109.5% 48
Westwood Park/Sunnyside $1,665,000 $1,079 109.5% 23
Sunset $1,600,000 $1,038 117.4% 53
Hayes Valley $1,597,833 $675 105.8% 2*
Potrero Hill $1,431,000 $1,044 104.9% 12
Excelsior/Portola $1,200,000 $824 110.0% 37
Bayview/Hunters Point $1,050,000 $721 107.1% 17
* Small sample size (n<10); use caution when interpreting statistics. Sources: SFAR MLS & BrokerMetrics; Property types covered: Single-family. Only property data posted on the MLS is covered. All information is deemed reliable, but not guaranteed for accuracy. All data is subject to errors, omissions, revisions, and is not warranted. ©2022 Vanguard Properties. All rights reserved. Equal Housing Opportunity. DRE No. 01486075
Condominium Market
SAN FRANCISCO CITY WIDE
NOV 2022 NOV 2021 % CHANGE November 2022
MEDIAN SALES PRICE DAYS ON MARKET $ PER SQUARE FOOT END OF MONTH INVENTORY WENT INTO CONTRACT PROPERTIES SOLD $1,150,000 37 $1,014 713 136 201 Year-Over-Year Comparison WENT INTO CONTRACT PROPERTIES SOLD END OF MONTH INVENTORY # OF PROPERTIES SOLD OVER LIST AVERAGE % OF LIST PRICE RECEIVED 136 201 713 30.08% 99.2% 337 424 869 55.9% 104.6% -59.6% -52.6% -18.0% -44.9% -5.2%
Sources: SFAR MLS & BrokerMetrics; Property types covered: Single-family. Only property data posted on the MLS is covered. All information is deemed reliable, but not guaranteed for accuracy. All data is subject to errors, omissions, revisions, and is not warranted. ©2022 Vanguard Properties. All rights reserved. Equal Housing Opportunity. DRE No. 01486075
Top Five Condominium Sales / San Francisco 2006 Washington St #2 PACIFIC HEIGHTS / $19,000,000 1001 California St #3 NOB HILL / $7,300,000 2127 Broadway St #5 PACIFIC HEIGHTS / $6,005,000 2040 Broadway St #402 PACIFIC HEIGHTS / $4,400,000 1452 Broadway #PH NOB HILL / $5,850,000 #1 #2 #3 #4 #5 Sources: SFAR MLS & BrokerMetrics; Property types covered: Condominium. Only property data posted on the MLS is covered. All information is deemed reliable, but not guaranteed for accuracy. All data is subject to errors, omissions, revisions, and is not warranted. ©2022 Vanguard Properties. All rights reserved. Equal Housing Opportunity. DRE No. 01486075
Median Neighborhood Values / Q3 2022
NEIGHBORHOOD CONDOMINIUM $ / SQ. FT. AVG % OF LIST PRICE REC’D HOMES SOLD
Cole Valley/Haight $1,495,000 $1,099 101.6% 13
Lower Pacific/Laurel Heights $1,450,000 $1,060 103.3% 17
Noe Valley $1,425,000 $1,069 102.1% 32
Richmond/Lake St $1,420,000 $982 104.5% 27
Buena Vista/Corona Heights $1,380,000 $1,055 108.0% 7*
Castro/Duboce Triangle $1,355,000 $939 101.6% 29
Alamo Square/NOPA $1,350,000 $1,008 108.3% 23
Russian Hill $1,327,500 $1,187 102.6% 40
Pacific/Presidio Heights $1,325,000 $1,101 99.1% 42
South Beach/Yerba Buena $1,312,500 $1,077 97.7% 66
Mission Dolores $1,248,000 $1,029 101.1% 15
Marina/Cow Hollow $1,200,000 $1,232 103.0% 19
Bernal Heights/Glen Park $1,195,000 $1,024 106.9% 10
Mission $1,148,750 $908 101.7% 38
Hayes Valley $1,130,000 $1,055 104.2% 18
North Beach/Fisherman's Wharf $1,087,500 $989 99.4% 12
Mission Bay $1,080,000 $1,100 98.5% 32
Nob Hill* $1,052,000 $1,038 97.1% 24
Sunset $1,027,500 $916 100.1% 96
Telegraph Hill $967,500 $1,033 100.8% 6*
Dogpatch $952,500 $1,006 98.8% 10
SOMA $860,000 $836 98.2% 31
Potrero Hill $838,000 $1,001 98.9% 21
Diamond Heights $800,000 $1,044 104.9% 5*
Bayview/Hunters Point $620,000 $675 99.1% 9*
* Small sample size (n<10); use caution when interpreting statistics. Sources: SFAR MLS & BrokerMetrics; Property types covered: condominium/TIC/ Stock COOP. Only property data posted on the MLS is covered. All information is deemed reliable, but not guaranteed for accuracy. All data is subject to errors, omissions, revisions, and is not warranted. ©2022 Vanguard Properties. All rights reserved. Equal Housing Opportunity. DRE No. 01486075
San Francisco House Price Trends Since 1990
MONTHLY MEDIAN HOUSE SALE PRICES, 3-MONTH ROLLING AVERAGE GRAPH
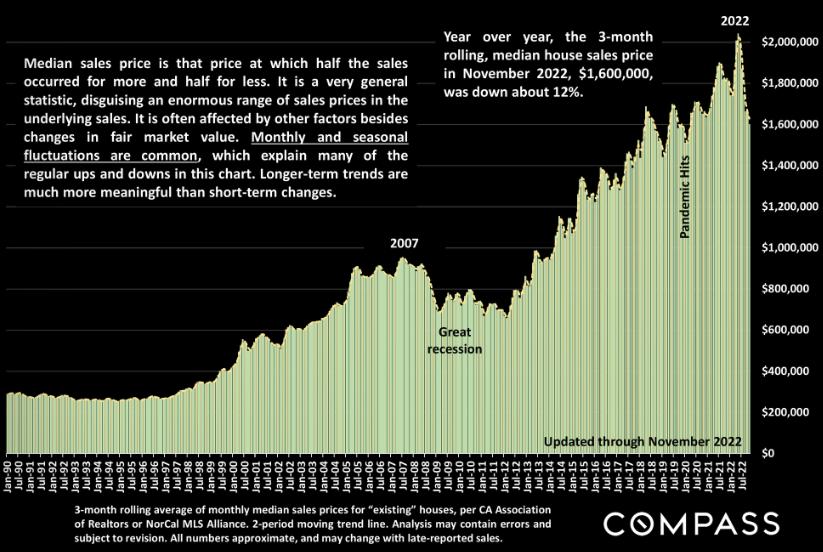
AND DATA COMPILED AND PRESENTED BY COMPASS REAL ESTATE
San
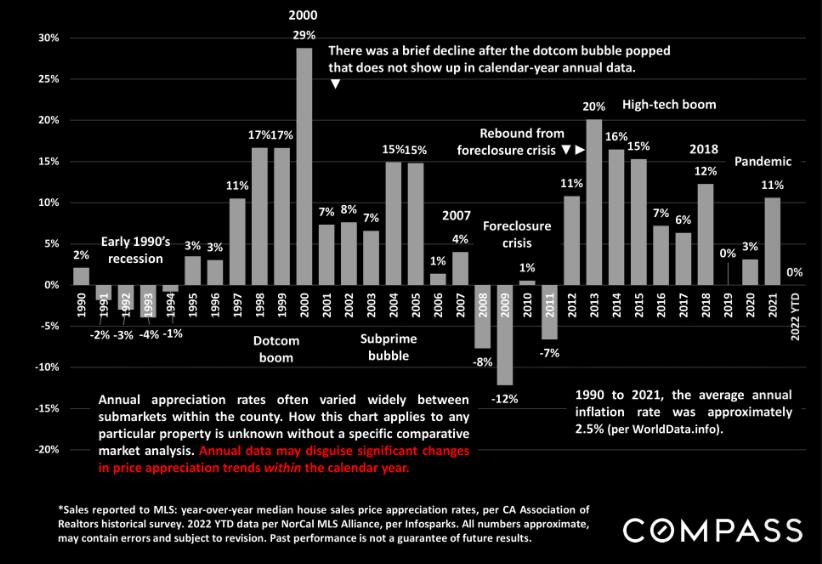
GRAPH AND DATA COMPILED AND PRESENTED BY COMPASS REAL ESTATE
Francisco Year-Over-Year Appreciation Rates Since 1990 YEAR-OVER-YEAR PERCENTAGE CHANGE IN ANNUAL MEDIAN HOUSE SALES PRICES
Current Listings, In-Contract & Recently Sold Properties
688-690 Douglas Street / Seller Represented NoeValleyDouglass.com SAN FRANCISCO / SOLD FOR $3,350,000 • 5 Total Bedrooms • 5 Total Bathrooms • 3,127 Sq. Ft. • San Francisco Bay Views • Free Standing Guest Cottage With Kitchen (1 Bed / 1.5 Baths) JUST SOLD
2737 Union Street / Seller Represented 2737UnionSt.com SAN FRANCISCO / SOLD FOR $2,595,000 / $1,664 PER SQUARE FOOT • 2 Bedrooms + Den • 2 Bathrooms • Direct Access To Beautiful English Garden • 1-Car Parking • Boutique 2-Unit Building With Historic Charm - Built in 1893 JUST SOLD
60 Rausch Street, Unit 403 / Seller Represented SAN FRANCISCO / SOLD FOR $650,000 60RauschStLoft.com • 1 Bedroom • 1 Bathroom • Top Floor Modern Loft • 1-Car Parking • Secure Live/Work Building With Elevator Access JUST SOLD
2295 Vallejo St. #310 / Seller Represented SAN FRANCISCO / $1,650,000 / $1,350 PER SQUARE FOOT • 2 Bedrooms • 2 Bathrooms • 1,185 Square Feet • 1 Parking Space • Stunning Wall of Windows and Spacious Patio IN CONTRACT
884-886 Arlington Avenue / Buyer Represented OAKLAND / $1,350,000 Listed by Annie Tegner / Compass • 3 Bedrooms / 2 Bathrooms (Upstairs Unit) • 2 Bedrooms / 2 Bathrooms (Downstairs Unit) • Built in 1911 / Fully Renovated Duplex • 2,450 SF Lot • Detached Garage + Bonus Space IN CONTRACT
950 Corbett Avenue, Unit 2 / Seller Represented 950CorbettUnit2.com SAN FRANCISCO / $1,650,000 • 3 Bedrooms + Den • 2 Bathrooms • 3 Fireplaces / Juliet Balconies / Brazillian Teak Hardwood Floors • 1-Car Parking Equipped With EV Charging • Boutique Elevator Building With Direct Unit Access
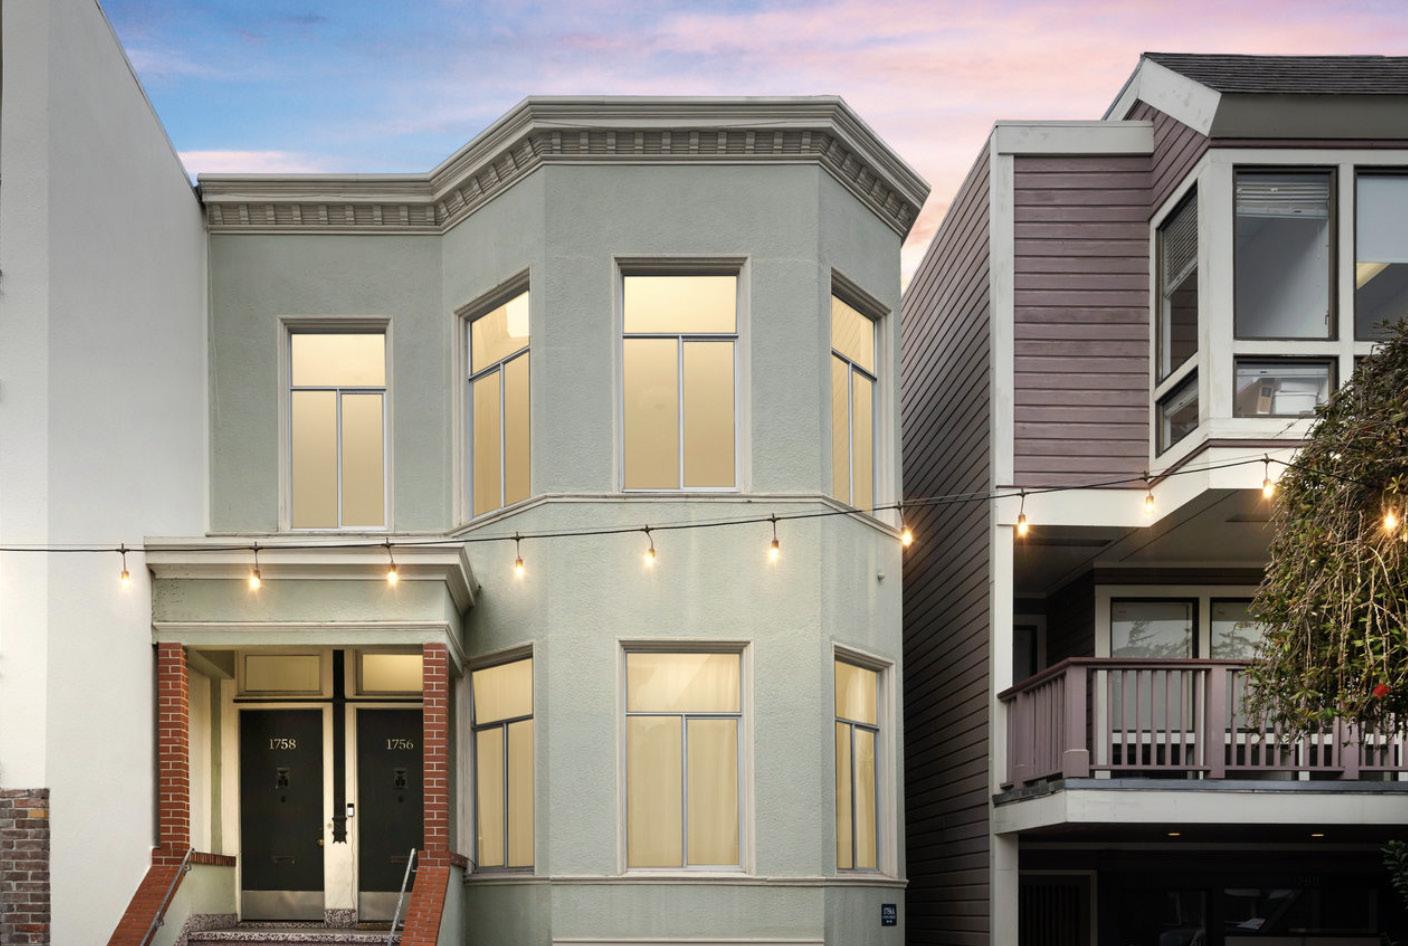
1756-1758 Union Street / Seller Represented SAN FRANCISCO / $2,595,000 • 3 Unit Building With 2 Vacant Units COMING SOON More Information Coming Soon...

415.706.1781 | colleencottersf.com colleen@colleencottersf.com 1801 Filmore Street | San Francisco, CA 94115 DRE# 01703078 Contact
