

Consejo Superior de Enseñanza de Puerto Rico
MARIANO VILLARONCA
EMILIO S. BELAVAL
JOSE PADIN
JOSE N. CANDARA

Presidente
Vicepresidente LINDSAY ROGERS
E. FERNANDEZ VANGA
MANUEL GARCIA CABRERA
PUBLICACIONES PEDAGOGICAS
MCMXLVI I
NUMERO V
Derechos Reservados
Consejo Superior de Enseñanza de Puerto Rico
TRABAJOS DE INVESTIGACION AUSPICIADOS POR EL CONSEJO SUPERIOR DE ENSEÑANZA
bajo la dirección de
ISMAEL RODRIGUEZ BOU
Secretario Permanente
y la colaboración de
CARMEN GOMEZ TEJERA
Facultad de Pedagogía de la Universidad de Puerto Rico
CASANDRA RIVERA
Consejo Superior de Enseñanza de Puerto Rico
JUANA A. MENDEZ
Departamento de Instrucción de Puerto Rico
RAFAELA BEZARES DE POLANCO
Asociación de Maestros de Puerto Rico
DAVID CRUZ LOPEZ
Consejo Superior de Enseñanza de Puerto Rico
ENRIQUE A. LACUERRE
Facultad de Humanidades de la Universidad de Puerto Rico
FRAN CERVONI BRENES
Consejo Superior de Enseñanza de Puerto Rico

UNIVERSIDAD DE PUERTO RICO
RIO PIEDRAS, P. R.
INDICE
LA. PAGINA
Por ciento de analfabetos en Puerto Rico __ 8
Por ciento de analfabetos en los países de América 10
Número de niños matriculados en las escue las públicas de Puerto Rico por cada 10,000 habitantes 12
Analfabetos naturales y funcionales 14
La mortalidad escolar en Puerto Rico (193334 a 1945-46) 16
Matrícula escolar por grado—zonas urbana y rural 18
Distribución de alumnos de acuerdo con la edad cronológica 20
Comparación entre el total de pérdida en nú mero de asientos ocupados por niños fracasa dos y el total de alumnos que ingresaron en el primer grado en las zonas urbana y rural (1944-1945) 22
Por ciento de los ingresos por concepto de contribuciones y arbitrios invertido en ins trucción elemental y secundaria en Puerto Rico desde 1910 a 1944 24
Comparación de la inversión anual por alum no entre algunos estados de la Unión Ame ricana y Puerto Rico (1943-1944) 26
Asignación para libros por alumno matricu lado 28
Por ciento del presupuesto total de instruc ción pública asignado para libros de lectura 30
Por ciento de la matrícula total en cada nivel educativo (1942-43 al 1944-45) 32
Inversión por alumno en los distintos niveles del sistema escolar (1944-1945) 34
Promedio de alumnos por maestro en los dis tintos niveles educativos (1944-1945) 36
Distribución de alumnos por maestro en al gunas escuelas superiores de Puerto Rico (1944-1945) 38

TABLE OF CONTENTS
Per Cent of Illiterate Persons in Puerto Rico 8
Percentage of Illiterates in the Countries of the Americas 10
Number of Children Enrolled in the Public Schools of Puerto Rico per 10,000 Inhabitants 12
Natural and Functional Illiterates 14
The School Mortality in Puerto Rico (193334 to 1945-46) 16
School Enrollment by Grades — Urban and Rural Zones 18
Distribution of Students According to Their Chronological Age 20
Comparison Between the Total Loss in the Number of Seats Occupied by Children Who Failed and the Total Number of Pupils Who Entered the First Grade in the Urban and Rural Zones (1944-1945) 22
Per Cent of the Income from Tax Collections and Revenues Allotted to Elementary and Secondary Education in Puerto Rico from 1910 to 1944 24
Comparison of the Annual Investment per Pupil Between Puerto Rico and Certain States of the Unión 26
Allotment for Books per Pupil Enrolled 28
Per Cent of the Total Budget of Public Education Allotted for Books 30
Per Cent of the Total Enrollment at Each School Level 32
Investment per Pupil at the Different Levels of the School System 34
Per Cent of Pupils per Teacher at the Dif ferent School Levels (1944-1945) 36
Distribution of Pupils per Teacher in Certain High Schools of Puerto Rico (1944-1945)__ 38
FIGURE
GRAFICA PAGINA
XVII.
Distribución de alumnos por maestro en al gunas escuelas intermedias urbanas de Puer to Rico (1944-1945) 40
XVIII.
Distribución de alumnos por maestro en al gunas escuelas intermedias rurales de Puer to Rico (1944-1945) 42
Distribución de alumnos por maestro en al gunas escuelas elementales urbanas de Puer to Rico (1944-1945) 44
Distribución de alumnos por maestro en al gunas escuelas elementales rurales de Puerto Rico (1944-1945) 46
Promedio de libros de lectura por alumno de primer grado (1944-1945) 48
Cantidad de lectura recomendable en la es cuela elemental 50
XXIII.
Edad mediana de los niños de primero y ter cer grados en Puerto Rico y en Estados Unidos 52
'XXIV.
Relación entre matrícula y presupuesto es colar en los distintos niveles educativos en Puerto Rico (1945-1946) 54
XXV.
Relación entre matrícula y presupuesto es colar en los distintos grados de la escuela elemental en Puerto Rico (1945-1946) 56

Distribution of Pupils per Teacher in Certain Urban Júnior High Schools of Puerto Rico (1944-1945) 40
Distribution of Pupils per Teacher in Certain Rural Júnior High Schools of Puerto Rico (1944-1945) 42
Distribution of Pupils per Teacher in Certain Elementary Urban Schools of Puerto Rico (1944-1945) 44
Distribution of Pupils per Teacher in Certain Elementary Rural Schools of Puerto Rico (1944-1945) 46
Average Number of Readers per First Grade Pupil 48
Number of Readers Recommended for the Elementary School 50
Median Age of the Children of the First and Third Grades in Puerto Rico and in the United States 52
Comparison Between the Enrollment and the School Budget at the Difíerent School Le véis in Puerto Rico (1945-1946) 54
Comparison Between the Enrollment and the School Budget in the Different Grades of the Elementary School in Puerto Rico (19451946) 56
FIGURE
Los informes de los Comisionados de Ins trucción Pública en Puerto Rico nos han pre sentado anualmente, por medio de estadísticas, los logros y las fallas de nuestro sistema escolar. Estos informes no nos habían revelado la inten sidad de varios de los problemas educativos por falta de análisis comparativo o global.
Con esta colección de gráficas nos propo nemos analizar los efectos acumulativos de nues tro quehacer didáctico y presentarlos de mane ra que se facilite su comprensión.
Se imponen algunas rectificaciones en el sis tema escolar a los fines de obtener mayor rendi miento de las generosas asignaciones que para instrucción pública hace el gobierno.
Un ptieblo pobre como el miestro debe eva luar sistemáticamente los rendimientos que ob tiene de sus inversiones. Los gobiernos ricos po drían despreoctiparse de las pérdidas que se pro ducen en sus servicios mal administrados. Los gobiernos pobres tienen que aprender la econo mía de la buena inversión, de la sencillez en el funcionamiento, de la producción a bajos cos tos.
Desde 1898 para acá hemos logrado más y mejores escuelas públicas, más facilidades edu cativas, más alfabetización, más educación hi

giénica, mayor atención a la preparación de maestros, mayor variedad de actividades recrea tivas. Debe continuarse en este camino de me joramiento, pero urge corregir aquellas defi ciencias que aún no han podido subsanarse.
La responsabilidad que el conocimiento de estos problemas conlleva, constituye un reto a los que se interesan en el levantamiento social colectivo. Para facilitar la comprensión de es tos problemas haciéndolos resaltar en toda su magnitud, hemos preparado la serie de gráficas que exponemos a continuación.
El crédito mayor en la recopilación de esta dísticas corresponde a las Srtas. Juana A. Mén dez,Casandra Rivera y a la Sra. Rafaela Rezares de Polatico. El artista Eran Cervoni Brenes ha hecho posible la presentación gráfica de este trabajo. Su alto sentido de responsabilidad ha facilitado la pronta terminación del proyecto. Sti gusto artístico ha contribuido de manera no table en la exposición sencilla y atractiva de las estadísticas escolares que aquí presentamos.
La señora Alice Warren de Colón tradujo al inglés las explicaciones de las gráficas y los se ñores Wilbert S. Warren y Letvis C. Richardson revisaron la traducción. Por esta labor expre samos nuestro reconocimiento.
GRAFICA I
Por ciento de analfabetos en Puerto Rico
En el 1890 el por ciento de analfabetos en Puerto Rico ascendía a 79.6, cifra que se re dujo solamente en 1.2% en los siguientes diez años; es decir, que para 1900 aún teníamos 78.4% de analfabetos. De ahí en adelante se ha reducido consistentemente en más del 11% en cada período de diez años. Si el presupues to para gastos de instrucción aumentara en la misma proporción que el aumento poblacional, en el año 1950 tendríamos no más de 20% de analfabetos.
La mayoría de las personas adultas analfa betas en Puerto Rico pasan de los 5 5 años. Son estas personas las que van desapareciendo y por consiguiente hacen disminuir el por ciento de analfabetismo.
Los beneficios educativos alcanzan hoy a una mejor representación de los habitantes de la Isla. El hecho indeseable, en sí, de que un gran número de alumnos abandonan las aulas antes de terminar el tercer grado, da oportu nidad a que un número igual al que se va in grese en la escuela disminuyendo el número de analfabetos naturales.
Según el censo de 1940, el número de anal fabetos de diez años en adelante, en Puerto Ri co, alcanzaba a 421,136. El Informe de la Co misión Legislativa para estudiar el problema de los niños sin escuela, publicado el 18 de marzo de 1943, presenta 93,404 niños de 5 a 9 años. Es decir, hay un total de 514,540 analfabetos, de 5 años en adelante.
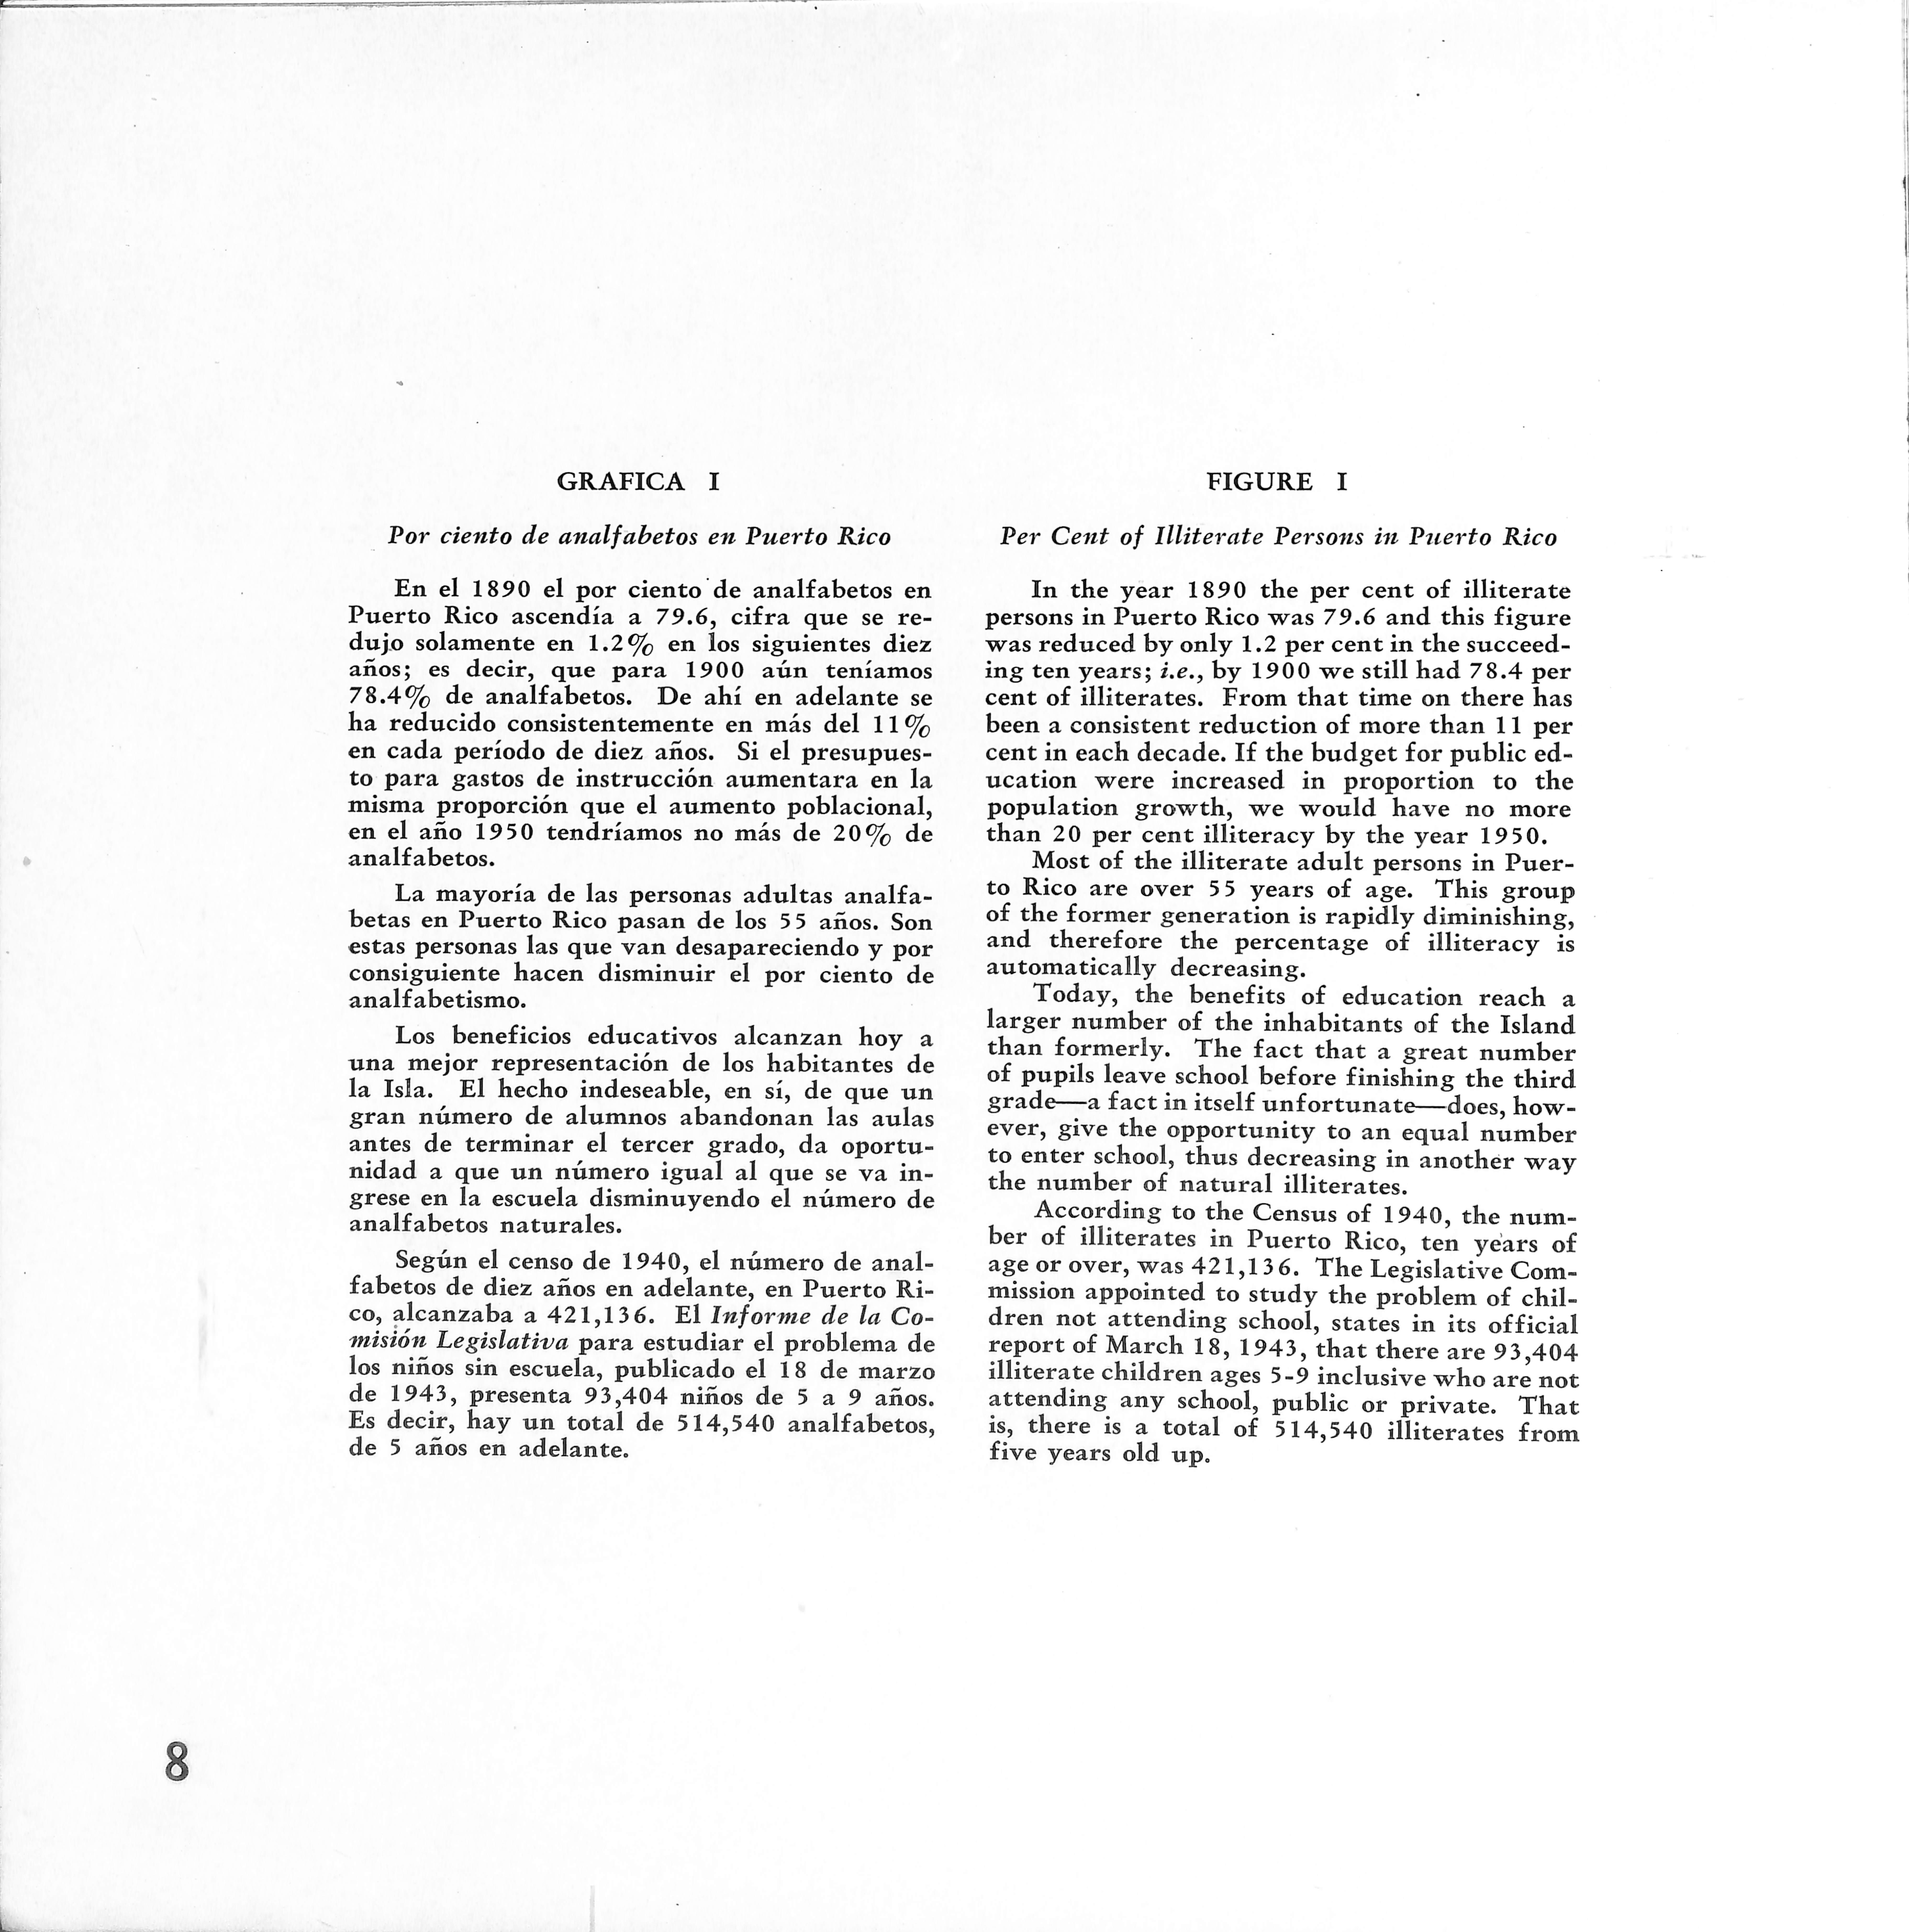
FIGURE I
Per Cent of llliterate Persons in Puerto Rico
In the year 1890 the per cent of illiterate persons in Puerto Rico was 79.6 and this figure was reduced by only 1.2 per cent in the succeeding ten years; i.e., by 1900 we still had 78.4 per cent of illiterates. From that time on there has been a consistent reduction of more than 11 per cent in each decade. If the budget for public education were increased in proportion to the population growth, we would have no more than 20 per cent illiteracy by the year 1950.
Most of the illiterate adult persons in Puer to Rico are over 55 years of age. This group of the former generation is rapidly diminishing, and therefore the percentage of illiteracy is automatically decreasing.
Today, the benefits of education reach a larger number of the inhabitants of the Island than formerly. The fact that a great number of pupils leave school before finishing the third grade—a fact in itself unfortunate—does,however, give the opportunity to an equal number to enter school, thus decreasing in another way the number of natural illiterates.
According to the Census of 1940, the num ber of illiterates in Puerto Rico, ten years of age or over, was 421,136. The Legislative Commission appointed to study the problem of children not attending school, states in its official report of March 18, 1943,that there are 93,404 illiterate children ages 5-9 inclusive who are not attending any school, public or prívate. That is, there is a total of 514,540 illiterates from five years oíd up.

GRAFICA I
POR CIENTO DE ANALFABETOS EN PUERTO RICO 1890-1950
POR CIENTO
GRAFICA II
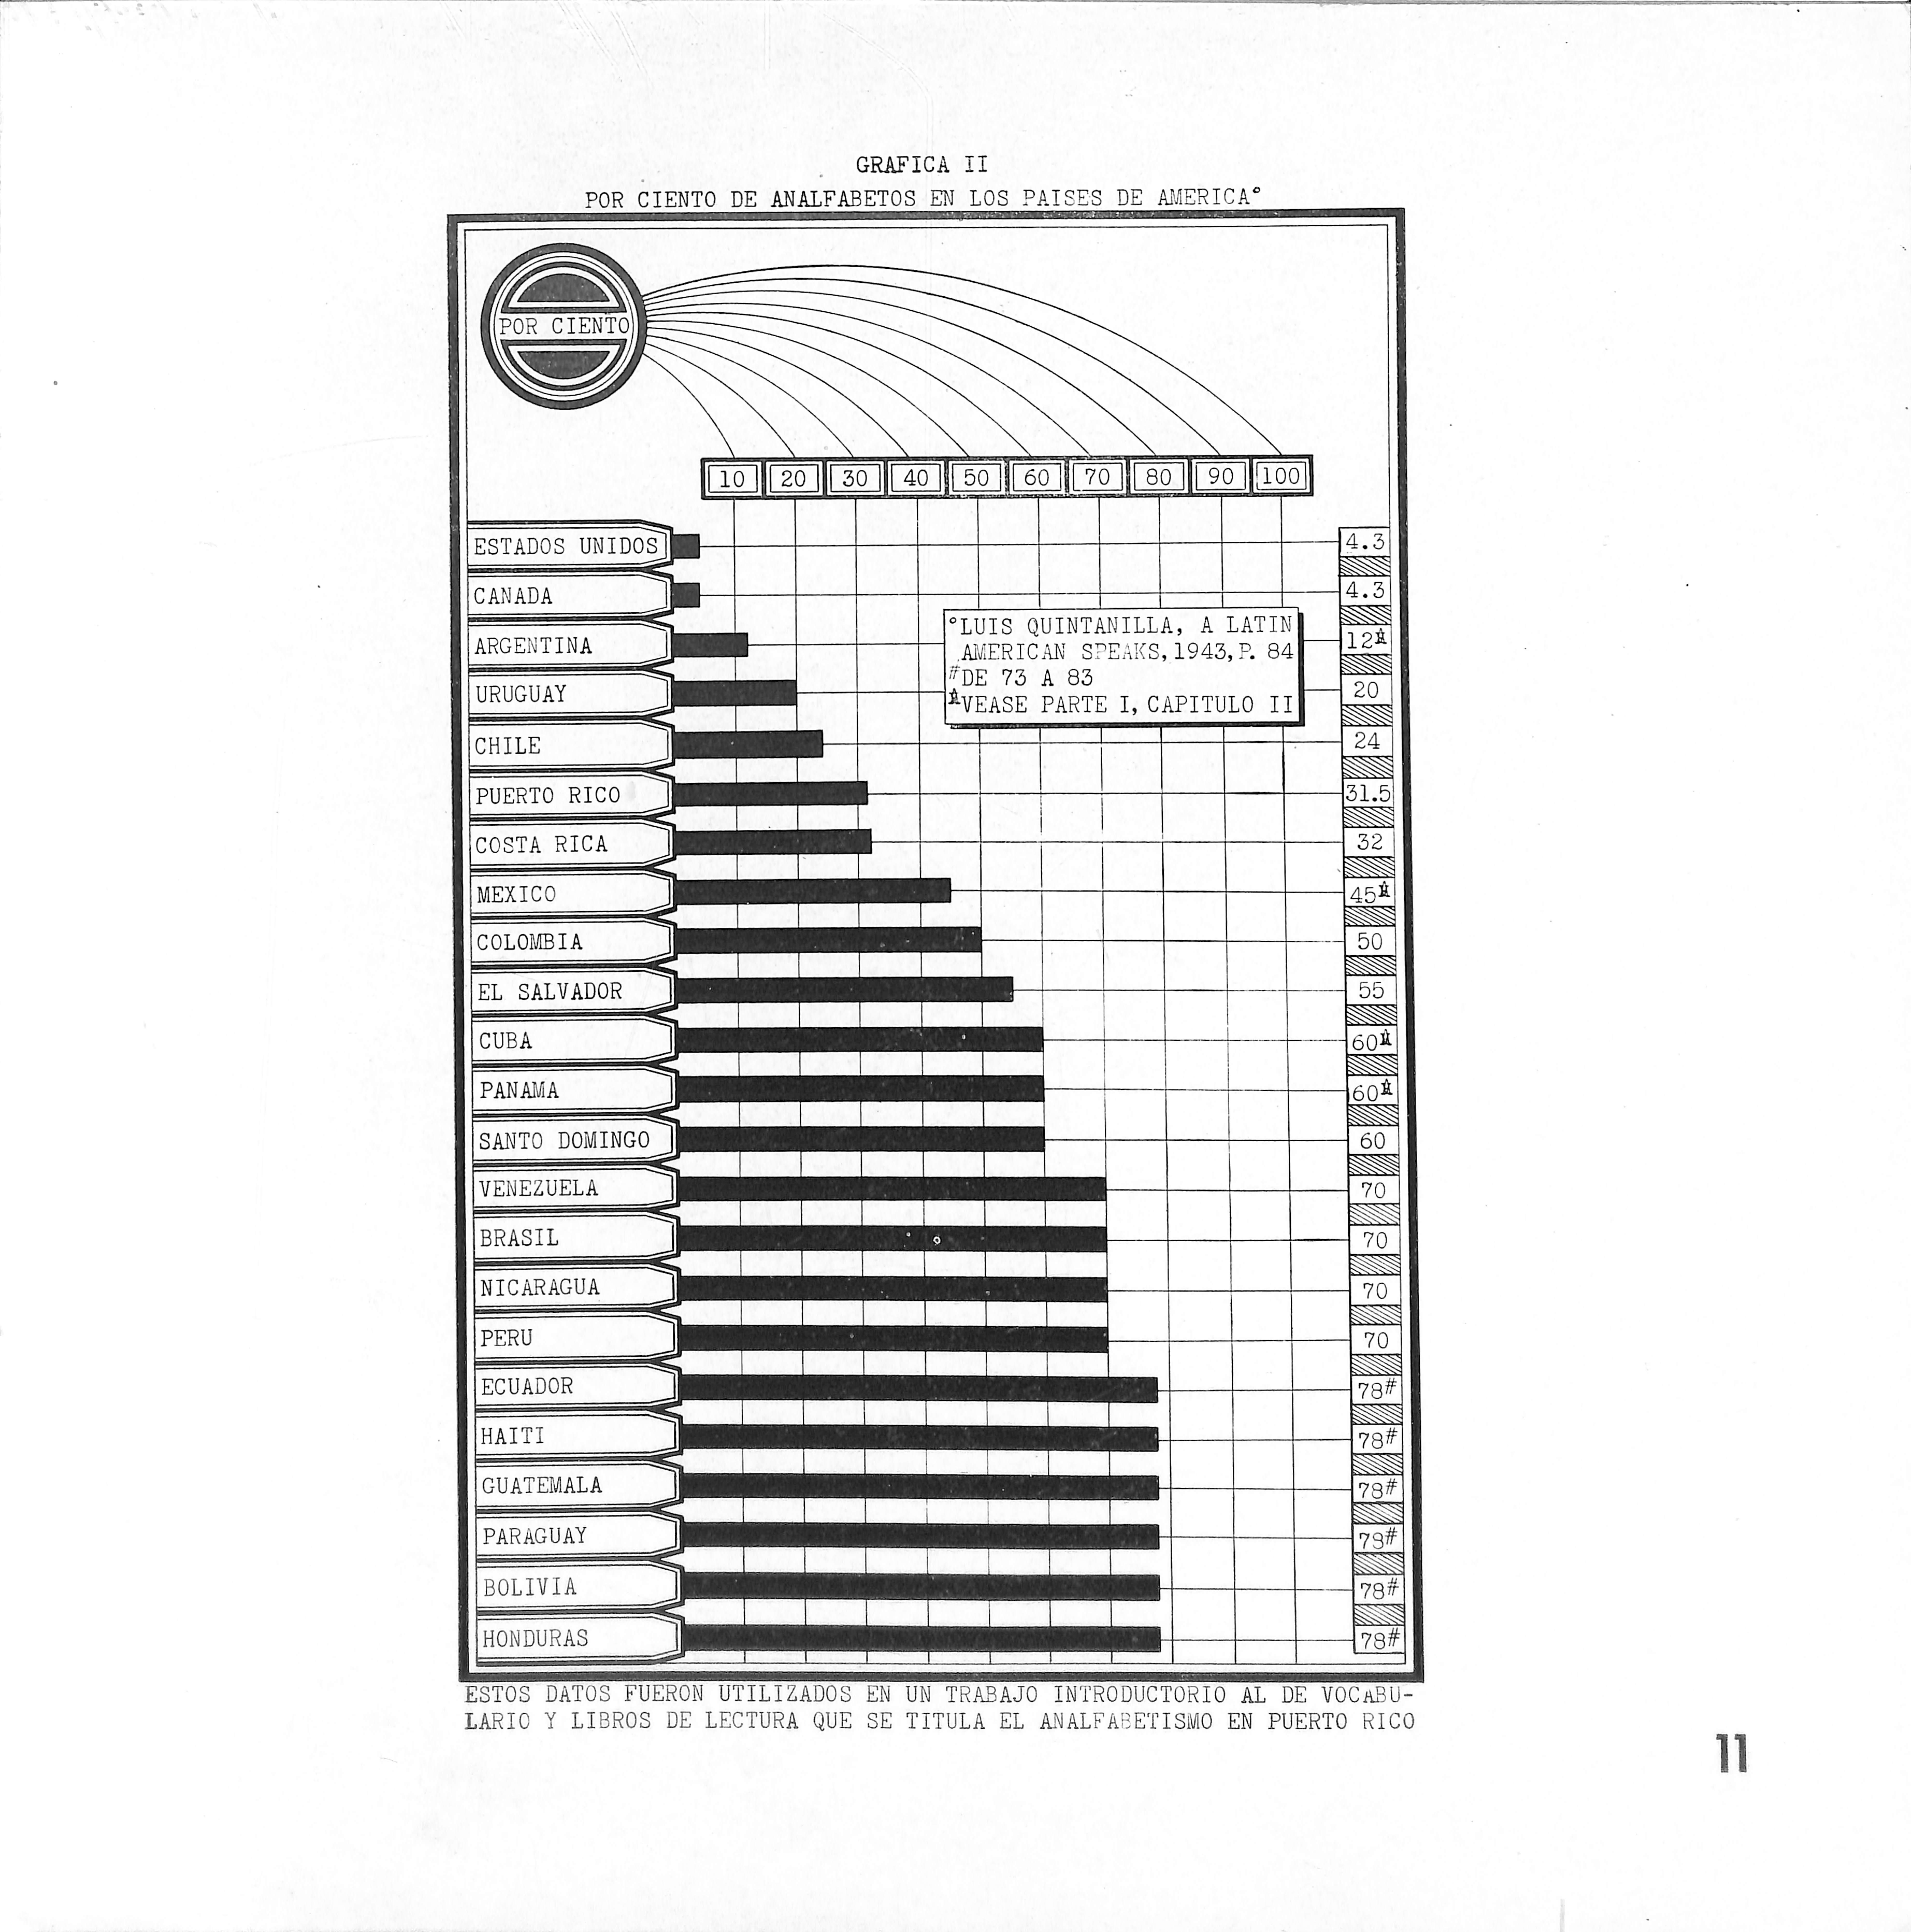
Por ciento de analfabetos en los países de América
Puerto Rico ocupa el sexto lugar en orden ascendente en cuanto a porcentaje de analfabe tismo, según los datos del señor Luis Quintani11a en su libro A Latin American Speaks.(') He mos hecho una revisión de muchos de estos da tos y encontramos que Argentina debe tener más del 16.6% de analfabetos de diez años en adelante, y México debe tener entre el 45% y 55% de analfabetos. Aunque el censo de Cuba de 1943 indica que el 22.08% de su población es analfabeta, los procedimientos utilizados en la recopilación de datos nos llevan a preferir los datos indicados en la gráfica. Panamá aparece con un 33.3% según el censo de 1940, pero pre ferimos utilizar los datos que aparecen en la gráfica por discrepancias que se desprenden de la explicación del propio censo de Panamá. Igual sucede con los datos de Venezuela, Honduras, Ecuador y otros países. La deficiencia en el pro cedimiento empleado al efectuar los censos poblacionales y escolares en muchos de los países aquí mencionados nos hace aceptar las cifras del Sr. Quintanilla con cierta reserva hasta tan to pueda hacerse una revisión de las estadísticas por él presentadas a la luz de datos más confia bles.

FIGURE II
Percentage of Illiterates in the Countries of the Americas
Puerto Rico occupies the sixth place in ascending order in regard to the percentage of illiteracy, according to the data presented by Mr. Luis Quintanilla in his book, A Latin Amer ican Speaks. (^) We have examined many of these data and we find that Argentina must have more than 16.6 per cent of illiterates of ten years of age and over, and that México must have between 45 per cent and 5 5 per cent of illiterates. Although the Census of Cuba for 1943 shows that 22.08 per cent of her population is illiterate, the procedures used to com pute these statistics lead us to prefer the data indicated in the graph. Panama appears to have 33.3 per cent according to the Census of 1940, but here again we prefer the information which appears in the graph because of discrepancies in the explanations given by the census itself. This same thing happens with the information in regard to Venezuela, Honduras, Ecuador, and other countries.
The deficiencies in the methods used to make the population and school census in many of the countries mentioned, compel us to accept the figures of Mr. Quintanilla with some reserve until a revisión of these statistics can be made on the basis of more reliable data.
(1) Luis Quintanilla, A Latin American Speaks, The Macmillan Company, p. 84.
GRAFICA II
POR CIENTO DE ANALFABETOS EN LOS PAISES DE ANIERICA'
POR CIENTO
BOlll 9^1!lOÓ
°LUIS QUINTANILLA, A LATIN
.AíJiERICM SPEaKS,1943,R 84
'^DE 73 A 83
%EASE PARTE I, CAPITULO II
ESTOS
GRAFICA III
Número de niños matriculados en las escuelas públicas de Puerto Rico por cada 10,000 habitantes
■ Según un estudio del Dr. Teobaldo Casanova:
La matrícula escolar tiende ahora a aumentar ,38 alumnos por cada 10,000 habitantes de la población total, o sea, de 76 alumnos en el año escolar 1944-45, lo cual representa un aumento insignificante sobre una matricula de unos 300,000 alumnos. Pero lo peor del caso es que dicho aumento es tan inseguro como insignificante. Esto quiere decir que las probabili dades de que haya una disminución son casi tan gran des, aunque no tan grandes, como las de que haya un aumento nuestra matricula escolar por cada 10,000 habitantes ha estado prácticamente estancada durante los últimos 30 años.
De no proporcionarse mayores facilidades educativas para atender a nuestra población analfabeta —preferentemente a los niños— en vez de reducirse el analfabetismo a 20% en 1950 (como se predice en la Gráfica I a base de los censos oficiales de los años 1890 al 1940) probablemente sobrepase la cifra de 31.5 que es el por ciento del censo de 1940. La discrepancia que se nota entre esta gráfica y la Gráfica I puede explicarse, entre otras razones, por el hecho de que los datos de la población escolar de la Gráfica III fueron tomados de las estadís ticas escolares, siempre más confiables que la in formación de los censos, en la cual intervienen muchos factores subjetivos.

III
Ntimber of Children Enrolled in the Public Schools of Puerto Rico per 10,000 Inhabitants
According to a study made by Dr. Teobal do Casanova:
The schooi enrollment has now a tendency to increase yearly by .38 pupils for every 10,000 persons of the total population (two million inhabitants) i.e., by 76 students in the schooi year 1944-45, which represents an insignificant increase in an enrollment of approxLmately 300,000 pupils. But the worst thing about the situation is that this increase is as uncertain as it is insignificant. This means that the probabilities of a decrease are nearly, though not quite, as great as of an increase... our schooi enroll ment for every 10,000 persons has been practically 'marking time' during the last 30 years.
If we do not provide greater educational facilities to care for our illiterate population —especially the children— instead of reducing illiteracy to 20 per cent by 1950 (as is predicted in Figure I on the basis of the official census from the years 1890 to 1940),we shall probably have a higher percentage than 31.5 which is the per cent given in the census of 1940. The discrepancy between this graph and Figure I may be explained in part by the fact that the data of the schooi population of Figure III were taken from the schooi statistics, which are always more reliable than information from the census, which is affected by many subjective factors.
FIGURE

GRAFICA III

Analfabetos naturales y funcionales
En el año 1944-45, el 46.69% de nuestros niños de edad escolar quedaron fuera de la es cuela. Es decir, de cada 200 niños de edad esco lar, 100 pudieron ingresar en la escuela y apro ximadamente 100 se quedaron fuera de ella. Hay que aclarar que algunos de los 100 niños fuera de la escuela, habían estado matricula dos anteriormente, pero la habían abandonado cuando aún estaban en edad escolar.
El 52% de nuestros niños abandonan la es cuela del primero al tercer grado. De cada 100 niños, 52 han tenido alrededor de año y medio de instrucción.
Podemos afirmar que de cada 100 personas, de diez años en adelante, 32 no saben leer ni es cribir —analfabetos naturales— 32 tienen ins trucción equivalente al tercer grado de nuestra escuela elemental; es decir, 32 tienen el equiva lente a año y medio de instrucción si se toman en cuenta la doble matrícula y el "interlocking". Por consiguinte, 64 pueden clasificarse como analfabetos naturales o funcionales, y los otros 36 tienen preparación de cuarto grado en ade lante.
Natural and Functional Illiterates
In the year 1944-45, 46.69 per cent of our children of school age were not attending school. That is, in each group of 200 children of school age, 100 were able to enroll in school, and approximately 100 were out of school. We must explain that some of the 100 children not at tending school had been enrolled in previous years, but they had left school while still of school age.
52 per cent of our children leave school between the first and the third grade. In each group of 100 children, 52 have had about a year and a half of schooling.
We can affirm that of each group of 100 persons ten years of age and over, 32 do not know how to read or write —they are natural illiterates; 32 have had a third-grade education (the equivalent of a year and a half of instruction, considering the "double enrollment" and the "interlocking" plans of study). Therefore, 64 may be classified as natural or functional illiterates, and the remaining 36 as having a preparation equivalent to fourth grade or better.
FIGURE IV
GRAFICA IV
ANALFABETOS NATURALES Y FUNCIONALES

(421,136) (31.5%) NUMERO DE ANALFABETOS DE 10 ANOS EN ADELANTE (CENSO POBLACIONAL DE PUERTO RICO DE 1940)
ANALFABETOS FUNCIONALES (32%) Y NATURALES (32%)
(EL 32% DE ANALFABETOS NATURALES NO INCLUYE LA PROPORCION CORRESPONDIENTE A LOS 93,404 ANALFABETOS DE 5 A 9'ANOS informados POR LA COMISION LEGISLATIVA DE PUERTO RICO)
ENTRE LAS EDADES DE 6-18 HAY 341,511 NiNOS EN LA ESCUELA Y 299,117 (46.69%) FUERA DE LA ESCUELA (INFORME DEL COMISIONADO DE INSTRUCCION CORRESPONDIENTE AL ANO 1944-45)
CADA SIMBOLO REPRESENTA
GRAFICA V
La mortalidad escolar en Puerto Rico
(1933-34 a 1945-46)
De cada 200 niños de edad escolar en Puerto Rico, 100 ingresan en la escuela. De este núme ro 76 se matriculan en segundo grado, 67.5 en tercero, 47.8 en cuarto, 3 5 en quinto, 29.5 en sexto, 24.7 en séptimo, 21 en octavo, 9.5 en noveno, 7.9 en décimo, 6.4 en undécimo, y 5 en duodécimo. Nótese que antes de ingresar en el cuarto grado 52.2 han abandonado la escuela y que solamente 2.7 ingresan en la Universidad. De cada cien alumnos que ingresan en el primer grado uno se gradúa de la Universidad.
Los últimos datos que hemos podido conse guir relativos a la situación en Estados Unidos demuestran que la mortalidad escolar desde 1927 a 1938, a base de cada 100 niños que in gresan en el primer grado, es como sigue: De ca da 100 niños entran 69 en segundo, 66 en terce ro, 64 en cuarto, 59 en quinto, 56 en sexto, 52 en séptimo, 42 en octavo, 47 en noveno, 40 en décimo, 32 en undécimo, 28 en duodécimo y 9 en primer año de colegio.

V
The School Mortality in Puerto Rico
(1933-34 to 1945-46)
In each group of 200 children of school age in Puerto Rico, 100 enter school. Of this number 76 enroll in the second grade, 67.5 in the third grade, 47.8 in the fourth grade, 35 in the fifth grade, 29.5 in the sixth grade, 24.7 in the seventh grade, 21 in the eighth grade, 9.5 in the ninth grade, 7.9 in the tenth grade, 6.4 in the eleventh grade, and 5 in the twelfth grade. It should be noted that 52.2 have left school before entering the fourth grade and that only 2.7 enter the University. Of each group of one hundred students who enter the first grade, one graduates from the University.
The last data we have been able to find regarding the situation in the United States show that the school mortality from 1927 to 1938,on the basis of each group of 100 children who enter the first grade, is as follows: 69 enters the second grade, 66 the third grade, 64 the fourth grade, 59 the fifth grade, 56 the sixth grade, 52 the seventh grade, 42 the eighth grade, 47 the ninth grade, 40 the tenth grade, 32 the eleventh grade, 28 the twelfth grade, and 9 the first year of college.
FIGURE

GRAFICA ?
LA MORTALIDAD ESCOLAR EN PUERTO RICO (1933-34 AL 1945-46)
POR CIENTO
iliM
GRADO
GRAFICA VI
Matrícula escolar por grado - zonas urbana y rural
La matrícula escolar en la zona rural em pieza en el 1933-34 con dos veces y medio el número de alumnos de la zona urbana, y en el cuarto grado ya ambas zonas están equilibra das en cuanto al número de alumnos que retie nen. A partir del quinto grado la zona rural cuenta con menos alumnos que la zona urbana no obstante haber empezado, sólo cuatro años antes, con más de dos veces el número de alum nos. En el año 1922-23 la situación es aún más grave. La zona rural empieza con casi seis ve ces el número de alumnos de la zona urbana, y cuatro años más tarde queda aproximadamen te igual número de alumnos en ambas zonas.
School Enrollment hy Grades TJrhan and Rural Zones
The school enrollment in the rural zone begins (in 1933-34) with two and a half times the number of students in the urban zone, and by the time the fourth grade is reached, both zones are balanced in the number of students they retain. From the fifth grade on the rural zone has fewer students than the urban zone notwithstanding having begun, only four years before, with more than twice the number of students. In the year 1922-23 the situation is still more serious. The rural zone begins with almost six times the number of students in the urban zone, and four years later the number of students in both zones is approximately the
FIGURE VI

1922-23 19-30-31 1 1922-23 1933-34
GRAFICA VI
MATRICULA ESCOLAR POR GRADOS - ZONAS URBANA Y RURAL
NIKOS
LEYENDA
ZONA RURAL
ZONA URBANA
GRADO
GRAFICA
VII
Tiistribtición de alumnos de acuerdo con la edad cronológica
En el año 1944-45 de cada 100 alumnos que ingresaron en la escuela elemental urbana, 4 tenían menos edad de la normal para el grado, 45 tenían la edad normal, y 51 sobrepasaban el nivel de edad estipulado para el grado. En la zona rural la discrepancia entre edad y grado era mucho más notoria; de cada 100, 1 tenía me nos edad de la normal para el grado, 40 tenían la edad normal y 59 sobrepasaban la edad nor mal.

FIGURE VII
Distribution of Students According to Their Chronological Age
In the year 1944-45, in each group of 100 students who entered the elementary urban school, 4 were below the standard age for the grade,45 were of the standard age, and 51 were above the age level for the grade. In the rural zone the discrepancy between age and grade was much greater: in each group of 100 stu dents, one was under age for the grade,40 were of normal age and 59 were over age.

GRAFICA VII
DISTRIBUCION DE ALUMNOS DE ACUERDO CON LA EDAD CRONOLOGICA (1944-45)
POR CIENTO
ZONA URBANA
ZONA RURAL
POR CIENTO DE ALUMNOS BAJO LA EDAD NORMAL PARA EL GRADO, DENTRO DE LA EDAD NORMAL -Y SOBRE LA EDAD NORMAL
VIII
Comparación entre el total de pérdida en nú mero de asientos ocupados por niños fracasados y el total de alumnos que ingresaron en el pri mer grado en las zonas urbana y rural (1944-1945)
El número total de alumnos fracasados de primero a sexto grados está ocupando alrededor de 78,000 asientos que probablemente serían utilizados con mayor provecho por alumnos que se quedan fuera de la escuela. Es cierto que pro bablemente puede esperarse de 3 a 7 por ciento de fracasos en un sistema de grados como el nuestro, pero la repetición de grados en tan gran proporción es una práctica indeseable. El total de pérdida en número de asientos, por estar ocu pados por alumnos fracasados del primero al sexto grados, es mayor que el número total de alumnos que ingresan en la escuela en primer grado (23,808 zona urbana y 48,072 zona ru ral—71,880 durante el año 1944-45); es más de tres veces el número total de alumnos que se matriculan en el primer grado en la zona urba na y más de vez y media el número total de alumnos de primer grado de la zona rural.

VIII
Comparison Between the Total Loss in the Number of Seats Occupied by Children Who Failed and the Total Number of Pupils Who Entered the First Grade in the Urban and Rural Xones
(1944-1945)
The total number of pupils who failed be tween the first and the sixth grades are occupying about 78,000 seats, which probably could be used more profitably by pupils who are now out of school. It is true that from 3 to 7 per cent of failures may be expected in a graded system such as ours, but the repetition of grades in such a proportion is an undesirable practice. The total loss in the number of seats now oc cupied by students who fail between the first and the sixth grades, is larger than the total number of pupils who enter the first grade of school (23,808 in the urban zone and 48,072 in the rural zone —71,880 during the year 1944-45); it is more than three times the total number of pupils who enroll in the first grade in the urban zone and more than one and a half times the total number of first-grade pupils in the rural zone.
FIGURE
GRAFICA VIII
COMPARACION ENTRE EL TOTAL DE PERDIDA EN NUMERO DE ASIENTOS OCUPADOS POR NINCS FRACASADOS Y EL TOTAL DE ALUMNOS QUE INGRESARON EN PRIMER GRADO EN LAS ZONAS URBANA Y RURAL (1944-45)

NIÑOS MATRICULADOS EN PRIMER GRADO
ASIENTOS OCUPADOS POR NIÑOS FRACASADOS ZONA URBANA - 23,808
DE 1° A 6° GRADO
GRAFICA IX
Porcentaje de los ingresos por concepto de con tribuciones y arbitrios invertido en instrucción elemental y secundaria en Puerto Rico desde 1910 a 1944
Según el Informe del Comisionado de Ins trucción para el año 1943-44, el Gobierno de Puerto Rico ha asignado para instrucción pú blica, desde 1910 a 1940, de 25 a 30 por ciento de sus ingresos por contribuciones y arbitrios. Del 1940 al 1944 sólo se asignó a instrucción el 9.75 por ciento de dichos ingresos.
Al comparar la inversión en instrucción pú blica y la que se hace en otros servicios que presta el Gobierno Insular, encontramos que aunque el Gobierno de Puerto Rico ha sido siem pre generoso en sus erogaciones para fines edu cativos, durante los últimos años no ha habido consistencia en el porcentaje de los ingresos por concepto de contribuciones y arbitrios asigna dos a instrucción. La proporción de aumento en el presupuesto de instrucción no ha guarda do relación con el aumento habido en el presu puesto general del Gobierno Insular. Es cierto, no obstante, que no todas las actividades edu cativas de nuestro gobierno están concentradas en el Departamento de Instrucción. Muchas agencias gubernamentales mantienen valiosos programas educativos de diversa índole.

Per Cent of the Income from Tax Collections and Revenues Allotted to Elementary and Secondary Education in Puerto Rico from 1910 to 1944
According to the Report of the Commissioner of Education for the year 1943-44, the Government of Puerto Rico, between the years 1910 and 1940, allotted for public education from 25 to 3O per cent of its income derived from tax collections and revenues. From 1940 to 1944 only 9.75 per cent of this income was allotted for public education.
When we compare the investment made for public education and that made for other services rendered by the Insular Government, we find that although the Government of Puerto Rico has always been generous in its appropriations for education, during recent years the per cent of income from tax collections and rev enues allotted for education has not been consistent. The proportion of increase in the edu cation budget has not corresponded to the in crease in the general budget of the Insular Gov ernment. It is true, however, that not all the e^ducational activities of our government are centered in the Department of Education. Many government agencies provide for valuable educational programs of different kinds.
FIGURE IX
POR CIENTO DE LOS INGRESOS POR CONCEPTO DE CONTRIBUCIONES Y ARBITRIOS INVERTIDO EN INSTRUCCION ELEMENTAL Y SECUNDARIA EN PUERTO RICO DESDE 1910 A 1944(1)

(^^DEPARTAMENTO DE INSTRUCCION, INFORME DEL COMISIONADO, 1943-44, TABLA NUM. 4, P. 82
GRAFICA IX
X
Comparación de la inversión anual por alumno entre algunos estados de la Unión Americana y Puerto Rico
Esta gráfica demuestra la inversión anual por alumno durante el año 1943-44, último año en que fué posible obtener estadísticas compa rativas entre Puerto Rico y cinco de los estados más pobres de Estados Unidos, cinco de recur sos moderados y cinco de los más ricos. Puerto Rico invirtió $40.58 por alumno, mientras que el promedio general de inversión en los Estados Unidos era de $117.36; algunos estados ricos, como Nueva York y Nueva Jersey, invertían $200.00 per cápita, aproximadamente. Puerto Rico invierte menos en instrucción por alumno que los estados más pobres de Estados Unidos, a pesar de que invertimos generosamente en ins trucción pública, como lo revela la Gráfica IX.

X
Comparison of the Annual Invesiment per Pupil Between Puerto Rico and Certain States of the Unión
This graph shows the annual investment per pupil during the year 1943-44, which was the last year for which we could find comparativa data for Puerto Rico and five of the poorest states of the Unión, five states of modérate resources, and five of the richest. Puerto Rico invested $40.58 per pupil, whereas the general average for the United States was $117.36; and some wealthy states such as New York and New Jersey, invested approximately $200.00 per pupil. Puerto Rico invests less in instruction per pupil than the poorest states of the Unión, although we invest generously in public instruc tion as Figure IX indicates.
GRAFICA
FIGURE
GRAFICA X ,
COMPARACION DE LA INVERSION ANUAL POR ALUMNO ENTRE ALGUNOS ESTADOS DE LA
PUERTO RICO

UNION AMERICANA Y PUERTO RICO 1943-44(a)
(a) BASADO EN EL PROMEDIO DE ASISTENCIA DIARIA
(p) CIFRAS DE 1942-43
Asignación para libros por alumno matriculado
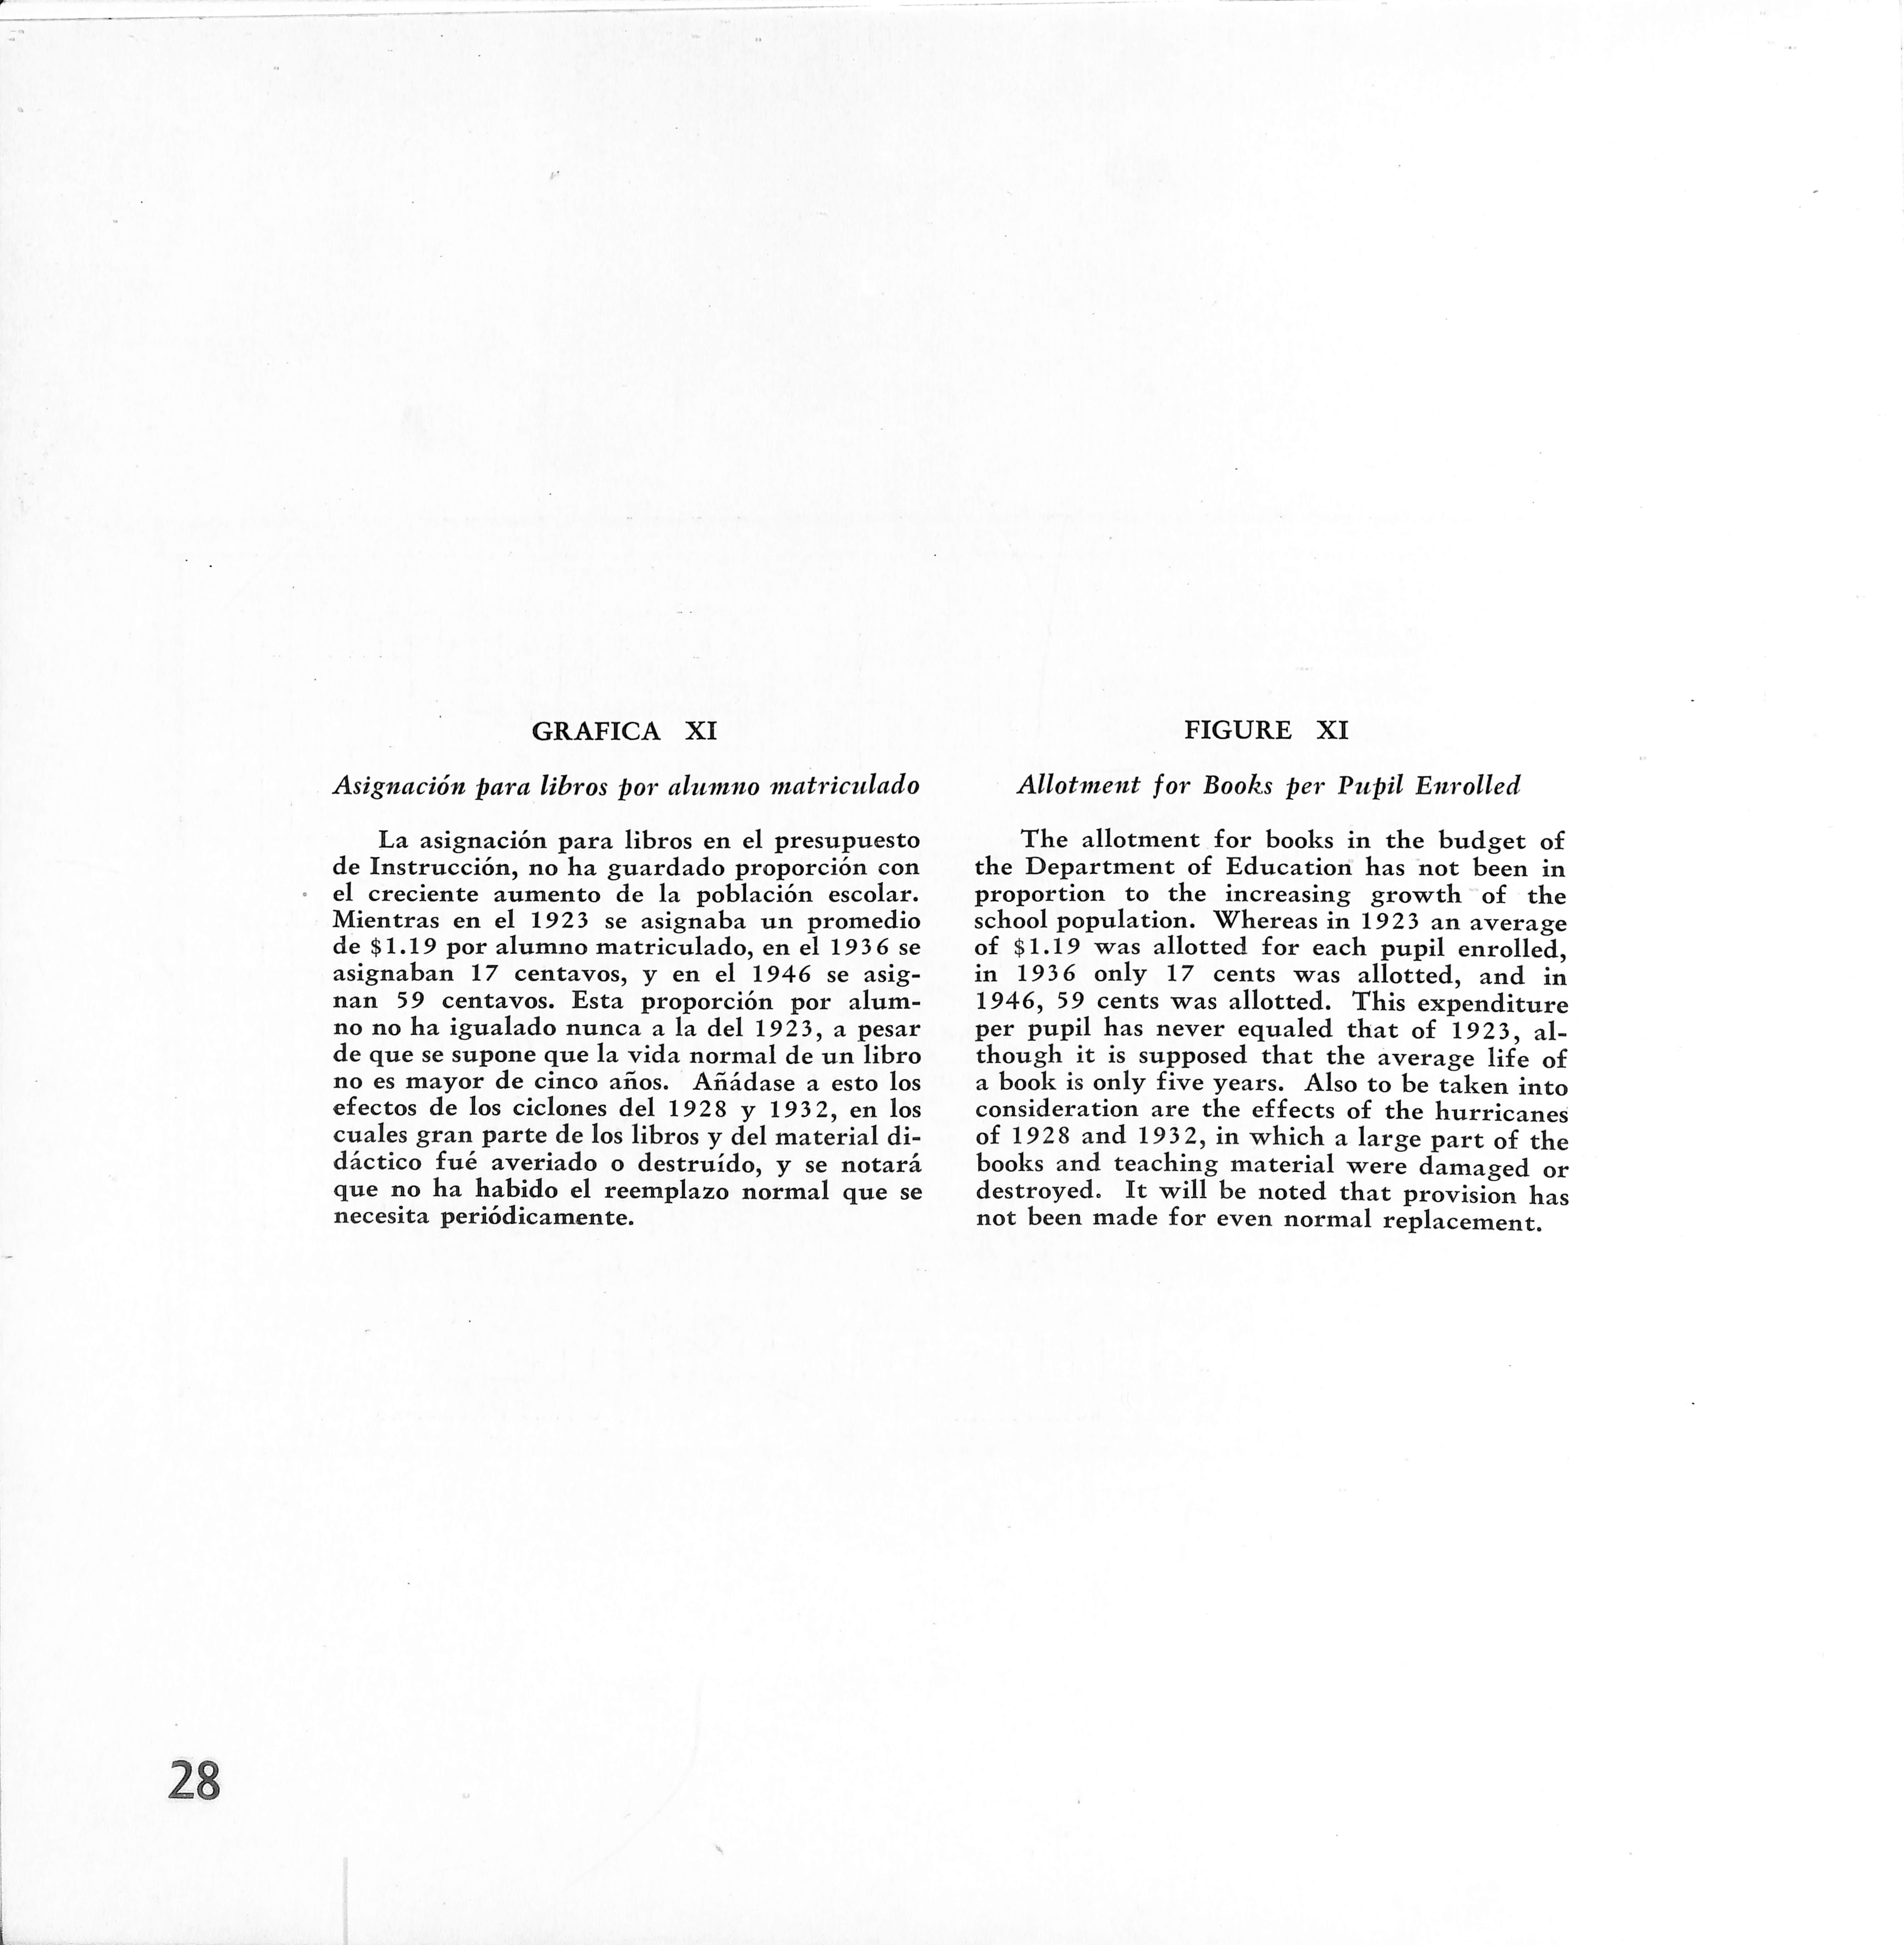
La asignación para libros en el presupuesto de Instrucción, no ha guardado proporción con el creciente aumento de la población escolar. Mientras en el 1923 se asignaba un promedio de $1.19 por alumno matriculado, en el 1936 se asignaban 17 centavos, y en el 1946 se asig nan 59 centavos. Esta proporción por alum no no ha igualado nunca a la del 1923, a pesar de que se supone que la vida normal de un libro no es mayor de cinco años. Añádase a esto los efectos de los ciclones del 1928 y 1932, en los cuales gran parte de los libros y del material di dáctico fué averiado o destruido, y se notará que no ha habido el reemplazo normal que se necesita periódicamente.
Allotment for Books per Pupil Enrolled
The allotment for books in the budget of the Department of Education has not been in proportion to the increasing growth of the school population. Whereas in 1923 an average of $1.19 was allotted for each pupil enrolled, in 1936 only 17 cents was allotted, and in 1946, 59 cents was allotted. This expenditure per pupil has never equaled that of 1923, although it is supposed that the average life of a book is only five years. Also to be taken into consideration are the effects of the hurricanes of 1928 and 1932, in which a large part of the books and teaching material were damaged or destroyed. It will be noted that provisión has not been made for even normal replacement.
GRAFICA XI
FIGURE XI

$0.25
ASIGNACION PARA LIBROS POR ALUMNO MATRICULADO
GRAFICA Xn
Porcentaje del presupuesto total de instrucción pública asignado para libros de lectura
La Gráfica XII está íntimamente relaciona da con la Gráfica XI y deben estudiarse juntas para mayor claridad. Para el año 1923 el pre supuesto para instrucción era de menos de 4 mi llones de dólares, mientras que en los últimos años casi se ha cuadruplicado hasta alcanzar la suma de aproximadamente 16 millones. Sin em bargo, la proporción de dinero empleado en li bros no guarda relación con el aumento en los presupuestos. En 1923, la partida para libros era de 6.15% del total, mientras que en 1945, con un presupuesto de más de 13 millones, la partida para libros era de .58% del presupues to general de instrucción. Tanto la Gráfica XI como la XII demuestran falta de un plan siste mático de asignación para Jibros que garantice la compra adecuada y la stistitución del mate rial de lectura según se vaya deteriorando.

Per Cent of the Total Budget of Public Education Allotted for Books
Figures XI and XII are intimately related to one another and should be studied together for better understanding. In 1923 the budget for education was less than four million dollars, whereas during recent years it has been practically quadrupled until it has reached the amount of approximately sixteen million dol lars. Nevertheless, the money spent on books is not in proportion to the increase in the budgets. In 1923 the appropriation for books was 6.15 per cent of the total, while in 1945, with an educational budget of more than 13 million dollars, the appropriation for books was only .58 per cent of the total. Both Figures XI and XII show a lack of systematic planning in regard to the allotment for books which would guarantee an adequate program of new purchases and replacements.
FIGURE XII

GRAFICA Xlir
P" orcentaje de la matrícula total en cada nivel educativo
Esta gráfica presenta el número y los por cientos de estudiantes matriculados en los dis tintos niveles del sistema escolar de Puerto Rico desde el año 1942-43 hasta el 1944-45. Estos datos demuestran que desde la insta lación del plan 6-3-3 hasta el presente, ha ve nido aumentando la matrícula en la escuela in termedia y superior. Especialmente la escuela intermedia marca un aumento desde 8.9% a 15.2% en el término comprendido entre 194243 a 1944-45. En la escuela superior, aunque hay aumento desde 4.7% a 5.1% en estos mis mos años, se nota un descenso mínimo en el año 1943-44. Nótese que en el 1942-43 la matrícu la elemental (rural y urbana) constituía el 86% de la matrícula escolar total. En el 194344 ya es sólo 81%, y en el 1944-45, se reduce a 79.5%. Es nuestro criterio que aunque es de seable que un mayor número de alumnos con tinúe educándose en grados superiores, es más importante estimular el aumento en matrícula en las escuelas elementales, para dar cabida en lo posible al 46% de nuestros niños que no se matriculan en la escuela elemental por falta de escuelas y maestros.

Per Cent of the Total Enrollment at Each School
Level
This figure shows the number and the per cent of students enrolled at the several levels of the school system of Puerto Rico from the year 1942-43 to the year 1944-45.
These data show that since inauguration of the 6-3-3 plan, the enrollment in the júnior and sénior high schools has been increasing. The júnior high school especíally, shows an increase from 8.9 per cent to 15.2 per cent between 1942-43 and 1944-45. Although there is an increase from 4.7 per cent to 5.1 per cent in these same years in the sénior high school, a minor decrease is noted in the year 1943-44. It is to be noted that in 1942-43, the elementary school enrollment (urban and rural) constituted 86 per cent of the total school enrollment. In 1943-44, it was only 81 per cent, and in 1944-45, it was reduced to 79.5 per cent. We believe that although it is desirable that a greater number of students continué into the higher grades, it is more important to stimulate the increase in the elementary school enrollment in order to give as much room as possible to the 46 per cent of our children who are not enrolled in the elementary school on account of the lack of schools and teachers.
FIGURE XIII
GRAFICA XIII
POR CIENTO DE LA MATRICULA TOTAL EN CADA NIVEL EDUCATIVO (1942-43 AL 1944-45)

POR CIENTO
1942-43 1943-44I I1944-45
LEYENDA
ESCUELAS
GRAFICA XIV
Inversión por alumno en los distintos niveles del sistema escolar
Durante el año 1944-45, educar un niño en la escuela elemental costó al gobierno de Puerto Rico $29.39 en la zona urbana y $21.56 en la zona rural. En cambio, educar un niño durante el mismo año en la escuela intermedia de la zo na urbana costó $61.74, mientras que en la zo na rural costó $100.19. Cuando educar a un niño en la escuela elemental rural costó $21.56, en la escuela intermedia rural costó $100.19. En gráficas anteriores hemos demostrado que un al to porcentaje de la población escolar queda fue ra de la escuela, especialmente en la zona rural. Como la escuela intermedia rural es tan costo sa, ¿no sería preferible abrir un mayor número de escuelas primarias con el dinero que actual mente se dedica a las escuelas intermedias de la zona rural?

FIGURE XIV
Investment per Pupil at the Different Levels of the School System
During the year 1944-45, it cost the Govvernment of Puerto Rico $29.39 to edúcate a child in the elementary school in the urban zone and $21.56 in the rural zone. On the other hand, to edúcate a child during the same year in the júnior high school in the urban zone cost $61.74, while in the rural zone it cost $100.19. At the same time that it cost $21.56 to edú cate a child in the rural elementary school it cost $100.19 in the rural júnior high school.'In former figures we have shown that a high per cent of the school population stays out of school especially in the rural zone. As the rural júnior high school is so expensive, wouldn't it be wiser to open a greater number of elementary schools with the money that is now allotted to the júnior high schools of the rural zone?

INVERSION POR ALUMNO EN LOS DISTINTOS NIVELES DEL SISTEMA ESCOLAR 1944-45
XV
Promedio de alumnos por maestro en los distintos niveles educativos (1944-1945)
Mientras el promedio de alumnos por maes tro en la escuela superior es de 27.51, en la intermedia urbana es 25.70; en la intermedia rural 15.49; en la elemental urbana, 54.90, y en la elemental rural, 58.60. Nótese que el promedio de alumnos asignados por maestro en la escuela intermedia rural es 15.49 mien tras que en la misma zona en la escuela elemen tal, el promedio es 58.60.

XV
Per Cent of Pupils per Teacher at the Different School Levels (1944-1945)
Whereas the average group of pupils per teacher in the urban sénior high school is 27.51; in the urban júnior high school it is 25.70; in the rural júnior high school, 15.49; in the elementary urban school, 54.90; and in the elementary rural school, 58.60. It should be noted that the average group of pupils per teacher in the rural júnior high school is 15.49, whereas in the same zone in the elementary school, the average is 58.60.
GRAFICA
FIGURE

GRAFICA XV
ESCUELAS
Distribución de alumnos por maestro en algu nas escuelas superiores de Puerto Rico (1944-1945)
La distribución de alumnos por maestro en algunas escuelas superiores de Puerto Rico pre senta un aspecto interesante de administración escolar. Nótese que hay pueblos como Cabo Ro jo con una matrícula de 273 alumnos atendidos por 12 maestros; Yauco con 297 alumnos y 14 maestros, e Isabela con 260 alumnos y 13 maes tros. En cambio, San Sebastián con 291 alum nos —mayor número que Isabela y Cabo Rojo, e igual que Yauco— cuenta con 6 maestros. Igual cuadro presenta Carolina con 334 alum nos y 15 maestros mientras que Vega Baja tie ne 321 alumnos y sólo 7 maestros.

Distribution of Pupils per Teacher in Certain High Schools of Puerto Rico (1944-1945)
The distribution of pupils per teacher in certam high schools of Puerto Rico presents an interesting aspect of school administration. It is to be noted that there are towns such as Ca bo Rojo with an enrollment of 273 pupils taken care of by 12 teachers; Yauco with 297 pupils and 14 teachers, and Isabela with 260 pupils and 13 teachers. On the other hand, San Sebas tián with 291 pupils —a number larger than that of Isabela or Cabo Rojo, and equal to that of Yauco —has six teachers. The same picture is presented by Carolina, with 15 teachers for 334 pupils whereas Vega Baja has 7 teachers for 321 pupils.
GRAFICA XVI
FIGURE XVI

GRAFICA XVI
DISTRIBUCION DE ALUMNOS POR MAESTRO EN ALGUNAS ESCUELAS SUPERIORES DE PUERTO RICO 1944-45
RIO piedras! IaGUADILLAI ¡CAROLINA
CABO ROJO LARES COMERLO
ALUMNOS ARECIBO I I fajardo! I VEGA BAJA||SAN SEBASTIAN!|ISABELA MAESTROS JUNCOS VIEQUES
GRAFICA XVII
Distribución de alumnos por maestro en algu nas escuelas intermedias urbanas de Puerto Rico
(1944-1945)
La gráfica puede explicarse claramente al se ñalar que Adjuntas con 268 alumnos cuenta con 6 maestros; en cambio Toa Baja con 143 alumnos tiene 9 maestros; Maricao con 125 alumnos tie ne 10 maestros; Guaynabo con 188 alumnos tie ne 11 maestros; Corozal con 234 alumnos tiene 12 maestros; Arroyo con 282 alumnos tiene 13 maestros; Salinas con 294 alumnos —solamente 25 alumnos más que Adjuntas— tiene 1 5 maes tros. Nótese que Santa Isabel con 335 alumnos tiene 8 maestros y Lares con sólo 336 alumnos tiene 17 maestros; es decir, dos veces más maes tros que Santa Isabel para atender al mismo nú mero de alumnos.

XVII
Distribution of Ptipils per Teacher in Certain Urban Júnior High Schools of Puerto Rico
(1944-1945)
This graph is clearly explained by the statement that Adjuntas has 6 teachers for 268 pupils, whereas Toa Baja with 143 pupils has 9 teachers; Maricao with 125 pupils has 10 teachers; Guaynabo with 188 pupils has 11 teachers; Corozal with 234 pupils has 12 teachers; Arroyo with 282 pupils has 13 teach ers; Salinas with 294 pupils —only 26 more than Adjuntas— has 1 5 teachers. It is to be observed that Santa Isabel with 335 pupils has 8 teachers and Lares with only 336 pupils has 17 teachers; i,e,, tw^ice as many teachers as San ta Isabel, to take care of the same number of pupils.
FIGURE

DISTRIBUCION DE ALUMNOS POR MAESTRO EN ALGUNAS ESCUELAS INTERMEDIAS URBANAS DE PUERTO RICO 1944-45
GRAFICA XVII
ARROYO I OROCOVIS 11 I COROZALI I I TOA BAJA
LARES I JUANA DIAZI iANASCO
ISABELAII SANTA ISABELJ[nAGUA^|SALINAS||ADJUNTAS|| VEGA ALTa| j GUAYNABO||MARICAO MAESTROS ALUMNOS
Distribución de altimnos por maestro en algu nas escuelas intermedias rtirales de Puerto Rico
(1944-1945)
Esta gráfica presenta la asignación de maes tros en relación con la matrícula escolar en la escuela intermedia rural. En ella vemos que Las Marías con 92 alumnos tiene 5 maestros, y Arro yo con 98 alumnos tiene 12 maestros. Adjuntas con 137 alumnos tiene 6 maestros y Cidra con 132 alumnos tiene 11 maestros; y Jayuya con 141 alumnos cuenta con 13 maestros; es decir, con solamente 4 alumnos más que Adjuntas, tie ne en cambio 7 maestros más. Yabucoa con 276 alumnos tiene 11 maestros, mientras que San Germán con 291 alumnos —15 alumnos más que Yabucoa— tiene 23 maestros, 12 maes tros más que Yabucoa con una mínima diferen cia de 15 alumnos; y Lares con 355 alumnos cuenta con 31 maestros. Con solo una diferen cia de 79 alumnos entre Yabucoa y Lares, hay 20 maestros más en un pueblo que en otro.

Distrihution of Ptipils per Teacher in Certain Rural Júnior High Schools of Puerto Rico (1944-1945)
This figure shows the allotment of teachers in proportion to the school enrollment in the rural júnior high schools. We see that Las Ma rías with 92 pupils has 5 teachers, and Arroyo with 98 pupils has 12 teachers. Adjuntas with 137 pupils has 6 teachers and Cidra with 132 pupils has 11 teachers; and Jayuya with 141 pupils has 13 teachers; i.e., although it has only 4 more pupils than Adjuntas, it has 7 more teachers. Yabucoa with 276 pupils has 11 teach ers, whereas San Germán with 291 pupils 15 pupils more than Yabucoa —has 23 teachers 12 teachers more than Yabucoa to take care of the insignificant difference of 15 pupils* and Lares with 355 pupils has 31 teachers. Although there is a difference of only 79 pupils between Yabucoa and Lares, there are 20 more teachers in one town than in the other.
GRAFICA XVIII
FIGURE XVIII

GRAFICA'XVIII
DISTRIBUCION DE ALUMNOS POR MAESTRO EN ALGUNAS ESCUELAS INTERMEDIAS RURALES DE PUERTO RICO 1944-45
CAROLINA LARES YABUCOA HATILLO ARROYO
ALUMNOS ARECIBO CAGUAS I I SAN GERMAN I I SALINAS JAYUYA MAESTROS CIDRA LAS MARIAS
GRAFICA XIX
Distribución de ahimnos por maestro en algu nas escuelas elementales urbanas de Puerto Rico (1944-1945)
La situación en la escuela elemental urbana es similar a la de la escuela rural en cuanto a distribución de alumnos por maestro. Hay pue blos como Toa Baja con 397 alumnos y 11 maes tros y Las Piedras con 701 alumnos y 11 maes tros; en cambio, Adjuntas con 571 alumnos tie ne 16 maestros.

Distribution of Pupils per Teacher in Certain Elementary Urban Schools of Puerto Rico (1944-1945)
The situation in the elementary urban schools is similar to that of the rural schools in regard to the distribution of pupils per teacher. There are towns such as Toa Baja with 397 pupils and 11 teachers and Las Piedras with 701 pupils and 11 teachers, whereas Adjuntas with 751 pupils has 16 teachers.
FIGURE XIX
GRAFICA XIX
DISTRIBUCION DE ALUMNOS POR MAESTRO EN ALGUNAS ESCUELAS ELEMENTALES URBANAS DE PUERTO RICO 1944-45

ARECIB0| I
I |LOIZA||aIBONITO| |ADJUNTAS11LAS PIEDRAS I IJAYUYA I ItOABAJA
GUANICAl ISAM GERMANI I CIDRA LARES AÑASCO I Iaguas buenas! i CAMUY
VEGA BAJA
Distribución de alumnos por maestro en algtinas escuelas elementales rurales de Ptcerto Rico (1944-1945)
Esta gráfica sigue presentando el cuadro discutido desde la Gráfica XVI en adelante. En la escuela elemental rural encontramos ejemplos como el de Santa Isabel con 888 alumnos y 12 maestros y Las Marías con 1,050 alumnos —162 más que Santa Isabel— y 21 maestros.
La asignación de maestros para los distin tos distritos escolares obviamente demanda re examen de manera que, en lo posible, se ofrez can iguales oportunidades educativas a todos los niños.

Distrihution of Pupils per Teacher in Certain Elementary Rtiral Schools of Puerto Rico (1944-1945)
This graph continúes the presentation of the same problem discussed from Figure XVI on. In the elementary rural schools we find examples such as that of Santa Isabel with 888 pupils and 12 teachers, and Las Marías with 1,050 pupils —162 more than Santa Isabel and 21 teachers.
The allotment of teachers for the different school districts obviously demands readjustment in order that insofar as is possible, equal educational opportunities be offered to all children.
GRAFICA XX
FIGURE XX

GRAFICA XX
DISTRIBUCION DE ALUMNOS POR MAESTRO EN ALGUNAS ESCUELAS ELEMENTALES RURALES DE PUERTO RICO 1944-45
CAROLINA AGUADILLA I I LAS PIEDRAS I I LAS MARIAS I I SANTA ISABEL I I MARICAO
ALUMNOS RIO PIEDRAS CIALES 00AMO PENUELAS MAESTROS RINCON
Vromedio de libros de lectura por alumno de primer grado
Como resultado de un detenido estudio cuantitativo del problema de los libros de lec tura en nuestra escuela elemental, averiguamos que un alumno de primer grado en el 1944-45 tuvo la oportunidad de leer 2.58 libros. Este es un promedio para toda la Isla. Si consideramos que se sugiere que un alumno del primer grado lea por lo menos 12 libros bajo supervisión y 10 más en el hogar o en la biblioteca, veremos cuan limitada es la oportunidad de lectura de los alumnos de nuestras escuelas.

Average ^umber of Readers per First-Grade Pupil
As a result of a careful quantitative study of the problem of readers in our elementary school, we found out that the average first-grade pupil in 1944-45 had the opportunity to read 2.58 books. If we consider that it is recommended that a first-grade pupil read at least 12 books under supervisión, and 10 more at home or in the library, we can see how limited are the opportunities that our school children have for reading.
GRAFICA XXI
FIGURE XXI

PROMEDIO DE LIBROS POR ALUMNO DE PRIMER GRADO 1944-45
Cantidad de lectura recomendable en la escuela elemental
Aquí se presenta una comparación entre el promedio de libros de lectura de que disponen nuestros alumnos y el promedio que se espera que lean los niños desde el primero al sexto gra do en Estados Unidos según los estudios realiza dos por la División de Investigaciones de la Aso ciación Educativa Nacional. Aunque según es ta investigación la cantidad de libros leídos por alumnos de distintos sistemas varia, según in forman los propios maestros, el promedio au menta desde 8.6 libros en el primer grado hasta 17.8 en el sexto grado. En Puerto Rico, según ascienden de gfado los alumnos, disponen de menos libros de lectura: 2.58 en promedio, en primer grado; 2.15 en segundo; 1.84 en terce ro; 1.17 en cuarto; 1.70 en quinto y 1.12 en sexto. El promedio de libros disponibles de pri mero a sexto grado para toda la Isla es de 1.92.

Ntimber of Readers Recommended for the Elementary School
A comparison is presented here between the average number of readers to which our pupils have access and the average which the children are expected to read from the first to the sixth grade in the United States, according to the studies made by the Research Bureau of the National Education Association. Although ac cording to this study, the number of books read by pupils of different systems varies, as the teachers themselves report, the average ranges from 8.6 books in the first grade to 17.8 in the sixth. In Puerto Rico, the higher the grade the fewer the readers to which the pupils have ac cess: 2.58 is the average in the first grade; 2.15 in the second; 1.84 in the third; 1.17 in the fourth; 1.70 in the fifth; and 1.12 in the sixth. The average number of books available from the first to the sixth grade for the entire Island is 1.92.
XXII
FIGURE XXII
GRAFICA XXII
CANTIDAD DE LECTURA RECOMENDABLE EN LA ESCUELA ELEMENTAL
PROMEDIO DE LIBROS DE LECTURA DE QUE DISPONEN LOS ALUMNOS DE LA ESCUELA ELEMENTAL
PROMEDIO DE LIBROS DE LECTURA QUE PODRIAN LEER LOS ALUMNOS DE LA ESCUELA ELEMENTAL^

*RESEARCH DIVISION OF THE NATIONAL EDUCATION ASSOCIATION BETTER READING INSTRUCTION. VOL. XIII, NO. 5, P. 317.
GRADO
XXIII
Edad mediana de los niños de primero y tercer grados en Puerto Rico y en Estados Unidos
Esta gráfica señala un hecho significativo relacionado con la enseñanza de inglés en Puer to Rico. Es a los alumnos del tercer grado en la Isla a quienes se les asignan los libros escritos para alumnos de primer grado en Estados Uni dos.
La edad de los alumnos del primer grado en el año 1944-45 fluctuaba entre 5 y 21 años, con un promedio de 8.22. La oscilación en el tercer grado variaba entre 6 y 22 años y el pro medio era de 10.43. Los libros en inglés escritos presuntamente para alumnos de 6 a 7 años en Estados Unidos son los que se utilizan en el ter cer grado en las escuelas de Puerto Rico, donde encontramos que 61 de cada 100 alumnos tie nen diez años o más de edad. Por consiguiente, ni el vocabulario, ni los intereses, ni las expe riencias que contienen esos libros preparados pa ra primer grado pueden servir de estímulo ade cuado para el desarrollo de interés por la lec tura en nuestros niños de tercer grado.

Median Age of the Children of the First and Third Grades in Ptierto Rico and in the United States
This figure shows a significant fact related to the teaching of English in Puerto Rico. The books written for pupils of the first grade in the United States are assigned to pupils of the third grade in the Island.
The age of the pupils of first grade in the year 1944-45 fluctuated between 5 and 21 years, with an average of 8.22. The fluctuation in the third grade varied between 6 and 22 years and the average was 10.43. The books in English written presumably for pupils 6 to 7 years oíd in the United States are those which are used in the third grade in the schools of Puer to Rico, where we find that 61 of every group of 100 pupils are ten years of age or over. Consequently, neither the vocabulary, ñor the interests, ñor the experiences which these firstgrade books contain, can serve as adecúate stimulus for the development of reading interest in our children of the third grade.
FIGURE XXIII
GRAFICA XXIII
EDAD MEDIANA DE LOS NlSOS DE PRIMER Y TERCER GRADOS
ESTADOS UNIDOS
TERCER GRADO
PRIMER GRADO

PUERTO RICO
PRIMER GRADO
TERCER GRADO
GRAFICA XXIV
Relación entre matrícula y presupuesto escolar en los distintos niveles educativos en Puerto Rico
(1945-1946)
La Gráfica XXIV presenta el porcentaje de la matrícula escolar total en cada nivel educati vo y el porcentaje del presupuesto para instruc ción pública en Puerto Rico que es invertido en atender la población escolar de cada uno de esos niveles. Nótese que para atender la población elemental rural, que constituye el 44.46% del total de nuestra población escolar, se invierte el 26.92% del presupuesto de instrucción, mien tras que se invierte el 10.79% del mismo pre supuesto en la escuela intermedia rural que atiende al 4.11% de la población escolar total. Es decir, se invierte en atender el 4.11% de nuestra población escolar total aproximadamen te la mitad de lo que se invierte en atender el 44.46% de esa misma población. La escuela elemental urbana —33.77% de la población es colar— consume el 28.85% del presupuesto; la escuela intermedia urbana —11.78% de la po blación escolar— el 21.01%. Nótese que para atender el 11.78% de los ninos (la escuela inter media urbana) se utiliza casi igual porcentaje del presupuesto que para atender el 33.77% (la escuela elemental urbana). Obviamente la es cuela intermedia es muy costosa y la población rural no está recibiendo atención equivalente a la que recibe la población escolar urbana.

XXIV
Comparison Bettveen the Enrollment and the School Budget at the Different School Levels in Puerto Rico
(1945-1946)
Figure XXIV presents the per cent of the total school enrollment at each school level in Puerto Rico and the per cent of the public school budget that is allotted to each of these levels. It is to be noted that to take care of the rural elementary population, consisting of 44.46 per cent of the total school population, 26.92 per cent of the education budget is allotted, whereas 10.79 per cent of the same budget is allotted to the rural júnior high school which takes care of 4.11 per cent of the total school population. That is, in taking care of 4.11 per cent of our total school population we allot approximately half of what is allotted to take care of 44.46 per cent of that same population. The elemen tary urban school —33.77 per cent of the school population— consumes 28.85 per cent of the budget; the urban júnior high school— 11.78 per cent of the school population— receives 21.01 per cent. Thus, to take care of 11.78 per cent of the children (those in the urban júnior high school) almost the same per cent of the budget is used as to take care of the 33.77 per cent (those in the urban elementary school). It is obvious that the júnior high school is very expensive and that the rural school population is not receiving the same attention as the urban school population.
FIGURE
RELACION ENTRE MATRICULA Y PRESUPUESTO ESCOLAR EN LOS DISTINTOS NIVELES EDUCATIVOS EN PUERTO RICO 1945-46
PORCENTAJE DE LA MATRICULA TOTAL

PORCENTAJE DEL PRESUPUESTO TOTAL DE INSTRUCCION
ELEMENTAL I ELEMENTAL lINTERMEDIAlINTERMEDIA RURAL I URBANA I RURAL I URBANA SUPERIOR
GRAFICA XXIV
ESCUELAS
GRAFICA XXV
^.elación entre matrícula y presupuesto escolar en los distintos grados de la escuela elemental en Puerto Rico
(1945-1946)
La Gráfica XXV presenta el porcentaje del presupuesto de instrucción que se invierte en cada uno de los grados de la escuela elemental —rural y urbana— y el porcentaje de la ma trícula total en cada uno de esos grados. Nóte se, especialmente, que en la zona urbana para educar al 33.77% de nuestra población escolar total en esos grados se invierte el 28.85% del presupuesto, mientras que para educar en la zo na rural el 44.46% de la población escolar total se invierte solamente el 26.92% del presupuesto de instrucción.

Comparison Bettveen the Enrollment and the School Budget in the Different Grades of the Elementary School in Ptierto Rico
(1945-1946)
Figure XXV presents the per cent of the budget of education which is invested in each grade of the elementary school —rural and urban— and the per cent of the total enroll ment in each one of these grades. It should be observed especially, that to edúcate 33.77 per cent of our total school population in the ele mentary grades of the urban zone, 28.85 per cent of the budget is allotted, whereas to edú cate 44.46 per cent of the total population in the rural zone, only 26.92 per cent of the budget of education is allotted.
FIGURE XXV
GRAFICA XXV
RELACION ENTRE MATRICULA Y PRESUPUESTO ESCOLAR EN LOS DISTINTOS GRADOS DE LA ESCUELA ELEMENTAL ENi PUERTO RICO 1945-46
PORCENTAJE DE LA MATRICULA TOTAL

PORCENTAJE DEL PRESUPUESTO TOTAL DE INSTRUCCION
GRADO
GRADO
ZONA URBANA
ZONA RURAL

Se terminó la impresión de "PARA VER, PENSAR Y ACTUAR . el día 21 de julio de 1947 en los talleres tipográficos de la
IMPRENTA VENEZUELA
San Juan de Puerto Rico