


Co
Co Contents Qualifications 4 Project Approach 6 Design Portfolio 7 Project Spotlight 1 12 Project Spotlight 2 17 Benefits 24
Mimi is the sole proprietor behind Co-indie. Armed with both bachelor’s and master’s degrees in urban planning, Mimi cultivated expertise in Adobe Illustrator and InDesign while creating site plans, maps, outreach materials, and other planning documents during her education. Since then, Mimi has effectively communicated intricate architectural and legal information for various stakeholders, including local governments, non-profits, metropolitan planning organizations, and universities.
Co-indie is committed to delivering visually compelling and informative work. The following page will showcase the work experience, skills, memberships, and additional qualifications that make Co-indie a comprehensive design and research firm.


Co-indie brings a fresh and innovative approach to art direction and concept design. Co-indie aligns all designs with the client’s vision to ensure cohesive, visually appealing layouts. Co-indie communicates with clients to identify overarching design goals as well as preferred color palettes, fonts, and shapes. The ‘Design Portfolio’ section of this document showcases Co-indie’s design aesthetic, technical skills, and experience with similar projects for evaluation by potential clients.
Co-indie is proficient in industry-standard software including Adobe Illustrator and InDesign, ensuring high-quality designs InDesign format. This enables clients to make future edits and updates seamlessly.
All design elements, materials, and concepts in Co-indie’s final work products will be ready for printing and/or web if requested, adhering to the highest quality standards.
Upon final submission of design work, clients shall retain all intellectual property rights to the finished products. Co-indie respects clients’ ownership of final designs and is committed to a transparent and collaborative partnership.
Co-indie is open to incorporating any additional deliverables deemed necessary by clients as design projects progress.
This section lays the foundation for the transformative potential that Co-indie can bring to design projects. The following pages display a curated selection of past design work that showcases Co-indie’s versatility and commitment to tailored solutions.
From outreach banners to gig promo posters to brochures and planning documents, this portfolio reflects the meticulous incorporation of techniques and features that align with the unique needs of each project. Each page begins with a few words that describe the design style of the corresponding project.

The vibrant and dynamic design elements showcased in this sample project offer a vision for how Co-indie can infuse bold, playful, and fresh aesthetics into client projects The poster’s detailed imagery — inspired by the act of writing letters to friends — aligns seamlessly with the communicative nature of the planning process. The bold color palette, featuring deep purples, greens, and blues, punctuated by energetic pops of orange and red, not only captures attention but also adds a contemporary flair. Importantly, the intentional coordination of these colors with the organization’s logo ensures a cohesive visual identity. Co-indie is excited to strategically incorporate these vibrant and engaging design elements to enhance the modernity and visual appeal of various projects, creating an approachable and captivating document that resonates with the client’s vision.
With a keen eye for design cohesion, Co-indie excels in crafting harmonious color palettes that enhance a project’s overall aesthetic and contribute to a modern and cohesive visual identity. Co-indie’s commitment to innovation means it is well-equipped to infuse each client’s project with creative and forward-thinking design elements, ensuring that the work product not only meets its functional objectives but also becomes a visually compelling and impactful tool for community involvement.
Find more work examples at co-indie.net/graphic-design
Design elements:
Detailed illustration
Logo-aware color palette
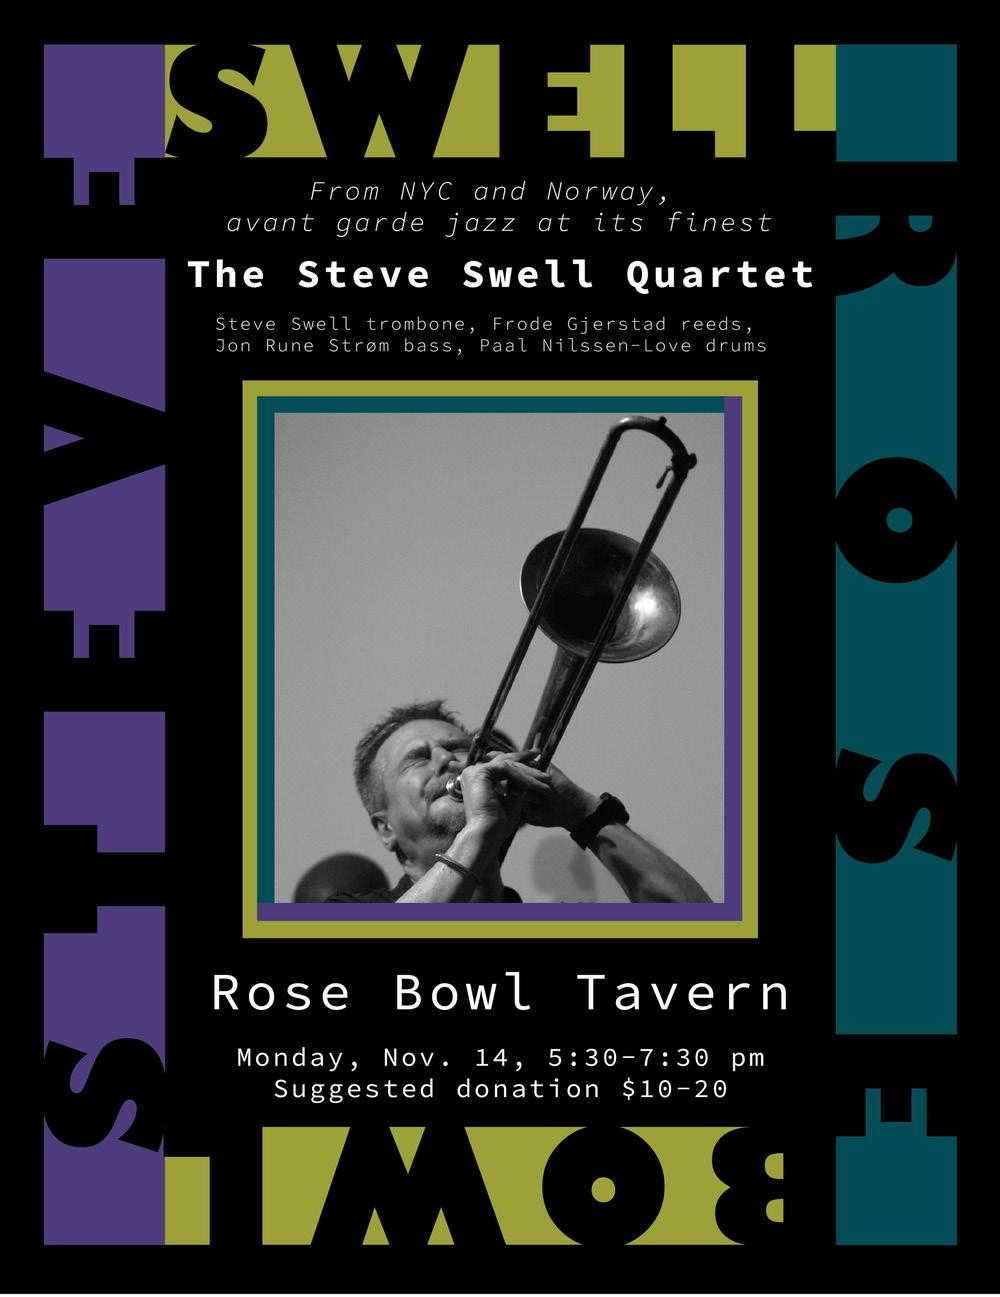
The muted colors and retro fonts featured in this sample project demonstrate Co-indie’s versatility and evoke the dim and intimate atmosphere of a jazz venue. This project underscores Co-indie’s commitment to understanding clients’ unique needs and translating their vision into captivating designs.
Like the process of crafting a visual companion to a musician’s gig, Co-indie recognizes the importance of active listening and learning about the distinct requirements and preferences of each client. By engaging in open communication and by understanding the client’s aspirations, Co-indie will infuse all work products with design elements that are functional and representative of the community, creating visually appealing and accessible assets that stand the test of time.
Co-indie eagerly anticipates the collaborative process of working with clients to identify and prioritize their design goals. Each project is unique, and Coindie’s approach involves a keen focus on capturing the essence of a client’s vision. In particular, Co-indie places great importance on factors such as city or organizational logos, colors, landmarks, and natural features, as these elements contribute to the distinctive identity of a community. By fostering open communication and understanding clients’ preferences, Co-indie aims to deliver tailored design solutions that meet functional objectives and also resonate with the community they serve.
Find more work examples at co-indie.net/graphic-design
Design elements:
This sample project showcases Co-indie’s seamless approach to map design and text integration, displaying locations and descriptions of a week’s worth of active aging events. The design emphasizes simplicity and accessibility, leading to a straightforward aesthetic featuring sans-serif fonts, large or bolded text for critical information, and a transparent background for easy web integration. Pinpoint icons on the map correspond with large-print numbers on the right-hand side, detailing event titles, descriptions, times, addresses, and dates. The design prioritizes friendliness and accessibility for older adults and individuals with disabilities.
Find more work examples at co-indie.net/graphic-design
Design elements:
Simple map elements
Monday, October 3rd, 10:00-11:30
Wednesday, October 5th,
Please join staff from the College of Applied Health Sciences for a tour of the McKechnie Family Living in Interactive Future Environments (LIFE) Home. The LIFE Home is a cutting-edge research center focused on innovations in home environments with the mission to provide the infrastructure to support interdisciplinary research, industry collaborations, community partnerships, and educational opportunities that will advance the science, engineering, and translation of innovations to support independent living, healthcare needs, social interaction, and everyday activities in the home. Older adults, aging services professionals and community members are all welcome to join for a tour and coffee.
Thursday, October 6th, 9:00 AM
Hally Health Medicare Strength Class Health Alliance 3301 Fields South Dr Suite 105, Champaign
Friday, October 7th, 9:00 AM
Finding Your Get Up and Go University of Illinois Extension 801 N Country Fair Dr Suite
motivation in life and how to respond can help individuals be more productive. This session is for those times when it just seems hard to “get going” and will help you learn how to give your enthusiasm a boost.
Friday, October 7th, 12:00-4:00 PM
atHome with Clark Lindsey invites you to stop in for a swim in ClarkLindseyʼs indoor heated pool or work up a sweat in the state-of-the-art Fitness Center. Enjoy refreshments and giveaways compliments of the atHome team!
Sans serif font
The quick brown fox jumps over the lazy dog.


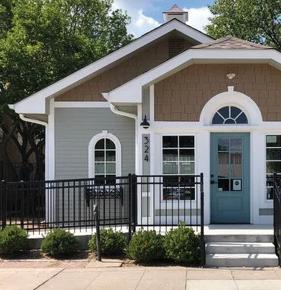
Another sample project features a two-page guide that explains the characteristics of a city’s proposed transitional zoning district. This visually dynamic document smoothly integrates captivating images with informative text. It utilizes a readable sans-serif font with strategically bolded key phrases to boost understanding and make skimming easier. Co-Indie’s adeptness at merging images, pops of color, and text with clarity is especially evident in this project.
Find more work examples at co-indie.net/graphic-design
Design elements:
Integration of text and images
Bright gradient background
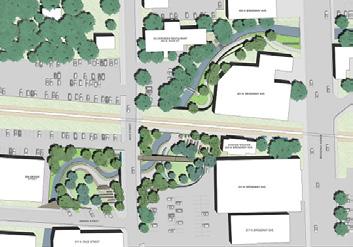
This sample graphic design project delves into the intricacies of natural systems on a regional scale, crafting a visually compelling and informative planning document. Co-indie’s approach involved a nuanced use of four theme colors, each corresponding to a distinct natural system—soil, water, topology, and green infrastructure. This color scheme helped distinguish sections while fostering visual cohesion throughout the document. Custom maps, image blocks, and specialized formatting were employed to present complex information with clarity and aesthetic appeal. The result is a harmonious blend of data and design that exemplifies Co-indie’s commitment to creating impactful graphic solutions.
Find more work examples at co-indie.net/graphic-design
2
This study outlines an analysis of the landscape features of Champaign County, Illinois in terms of their suitability for development. Slope, water bodies, slope, green infrastructure and soil type impact the overall ability of a landscape to support human development. By highlighting the suitability of various landscape features in Champaign County, future development plans can benefit from the knowledge of environmental factors that will likely affect construction and maintenance efforts.
Current and past ecological and physical challenges in Champaign County have included flooding, surface water runoff and minimal slope. These features have impacted residential, commercial and infrastructure development throughout the county
Overall, Champaign County is flat, with few bodies of water, several modes of existing green infrastructure and opportunities for expansion, and fertile soil
suitable for farming. The county has several opportunities for future development, mostly in spaces surrounding and linking alreadyestablished cities.
Champaign County is situated in Central Illinois, about two 130 miles south of Chicago and 120 miles west of Indianapolis. The primary land use in the county is agriculture due to its fertile soil and appropriate annual precipitation, temperatures and sunlight.
The county is part of the Champaign-Urbana Metropolitan Statistical Area which spans three total central Illinois counties. Champaign-Urbana is home to dedicated green infrastructure projects, including recreational detention ponds, greenways and large parks with restored prairie land. It provides several opportunities for expansion outward towards nearby cities.
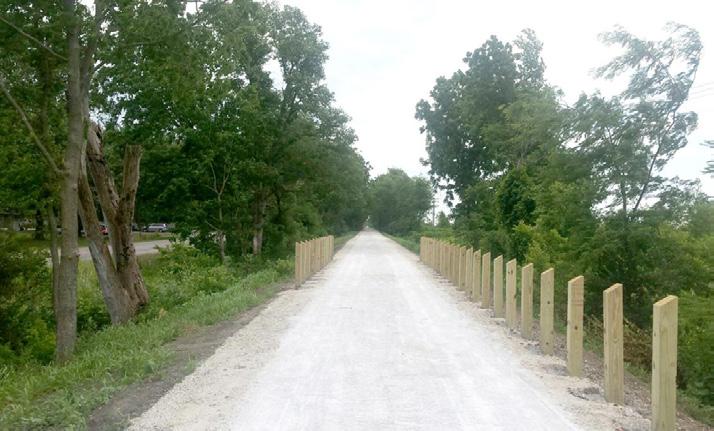
One such project, the Kickapoo Rail Trail (Figure 2), is already underway. Rantoul and Mahomet, located
north and west of ChampaignUrbana, respectively, contain ample green infrastructure and opportunities for expansion inward.
Before environmentally-impactful human intervention, the county was covered by prairie and marshland. The proliferation of agriculture in the area has led to the creaation of intricate drainage systems that are currently in a period of collective decay and need maintenance.3 Needless to say, environmental features in Champaign County deserve revision. The importance of viable and efficient infrastructure
systems that work in tandem with the environment increases as the county’s population grows and the planet’s climate changes. The region has seen significant growth and development in recent decades, and environmental changes often mirror human development.
Assessing existing soil, water, topology, and infrastructure is paramount in environmental planning as it forms the foundation for informed decision-making and sustainable development.


Executive Summary 2
Slope Suitability Analysis 4
Green Infrastructure Suitability Analysis 5
Soil Analysis 7
Water Analysis 8
Composite Projections 9
References 10
The slope of a terrain is known as its rise over its run, or the degree of incline of the underlying land. It affects where and how developments can occur. Most developments require a slope of at least 2%, otherwise the risk of flooding is greatly increased.
In Champaign County, the slope is relatively even and low throughout, never reaching above 5%. This makes development easier than more mountainous regions, but also increases the area’s risk of flooding and related damage.
In the neighboring map, areas designated as ‘low’ have a slope less than 0.5% and are not suitable for development because they don’t adequately facilitate drainage. Areas designated as ‘medium’ have a slope of 0.5% to 1% and are developable.

Areas designated as ‘high’ have a slope of 1% and above and are suitable for development because they adequately facilitate drainage. Nowhere in the county does the landscape’s natural slope exceed 5%.
Only a few swaths of land in Champaign County qualify as being suitable for development based solely on slope. Such swaths are long and narrow and pass through existing towns and cities, such as Mahomet, Rantoul and Tuscola.
In Champaign, the need to invest in drainage facilitation and water management has been expressed through decades of severe flooding in the Campustown neighborhood. The most intense flood occurred in 1989 and resulted in millions of dollars in damages and insurance claims.
Recently, the City of Champaign landscaped a detention pond (Figure 3) to enhance its ecosystem services. It is now a popular recreational space complete with walking paths, fountains and picnic tables. Several animal species call the pond home, including geese, turtles, frogs, pigeons and fish.
to Mahomet, another one of the only four cities in the county with CUUATS-designated greenways (the others are Rantoul, Champaign and Urbana). Figure 6 also takes into account a lack of green infrastructure and connectivity stemming from Champaign’s north end to other parts of the county. A historically disenfranchised neighborhood, Champaign’s north end deserves investment and avenues for connection.
Since Rantoul is relatively nearby and already has ample green infrastructure in place (compared to most towns surrounding Champaign-Urbana), a corridor could be established between the north end of Champaign and the southern end of Rantoul, much like the existing Kickapoo Rail Trail (Figure 2) that extends from east Urbana to west St. Joseph.
Overall, Champaign-Urbana has the highest intensity of green infrastructure in the county, likely due to investments by the University and higher population density. Luckily, Champaign-
Urbana is located in the center of the county and is linked to key transportation networks (rail and interstate), so using the city as a platform for extension of green infrastructure should be relatively straightforward.
Investment in green infrastructure provides cultural, ecologicas and even economic benefits. According to the EPA, the value of the United States’ sewer overflow infrastructure needs totaled $63.6 billion in 2008. In the same year, the value of needed stormwater management infrastructure nationally was $42.3 billion. 6


8
The dominant soil types in Champaign County are excellent for agriculture, but very moist and clay-heavy, which doesn’t bode well for any type of structural development. Soils rich with clay have poor internal drainage, only allowing water to drain away slowly over the course of several days. Clay-heavy soil contains the smallest particle sizes of any soil type. Small soil particle size means that particles sit close together with little room in between for movement of liquids. This soil type is also relatively averse to erosion. More stable soil types should be supplemented with that naturally-occurring dominant soil type when building greenfield developments in Champaign County.

Champaign County is relatively flat, yet receives substantial rainfall and precipitation yearly. Additionally, the County has few large bodies of water but is home to several rivers and streams.
Figure 9 shows a high potential for flooding in pockets of the far western, far eastern and far southern regions of the county, with low flooding potential in the middle and northern regions. Not coincidentally, all of the major cities within the county are located outside of flood zones. Human settlements are indicative of large clusters of residential development, which must remain away from highpotential flood zones in order to avoid property damage, molds and risk of injury. Flood insurance prices are higher near potential flood zones.
Areas designated as ‘high’ are located at least 5 miles from major flood zones. These areas are highly suitable for further development. Conveniently, they are adjacent to existing cities in the county. Areas
marked as ‘medium’ are within 5 miles of major flood zones and, for this reason, are moderately suitable for development but it is not recommended. Areas designated as ‘low’ are located right along major flood zones and waterways and are not suitable for development.
Risks related to water movement patterns are currently relatively low in Champaign County, since most existing settlements are already located away from flood zones. Additionally, it is known that cities within the county have taken measures to ensure safety from water-related damages by constructing detention and retention basins that sometimes double as recreational areas (Figures 3 and 6). Most existing residential developments in the county are safe from severe flooding and associated risks, but the county should work to continue development of flood mitigation infrastructure to compensate for increased residential development in the Champaign-Urbana region.
The soil classification in Champaign County most suitable for development (marked with ‘high’ suitabiity) is the Miami-StrawnHennepin soil series. This soil is known to easily facilitate drainage due to the relatively large particle sizes it contains. One drawback of this soil series is that surface
runoff is rapid on less-steep slopes and very rapid on steeper slopes. However, since Champaign County doesn’t have steep slopes, this soil facilitates water movement to plant roots. The permeability of this soil is described as moderate or moderately slow.


The composite map created using the McHarg method revealed that it is possible to make projections and recommendations for future developments in Champaign County. As the composite map shows, development can continue in Mahomet and Rantoul without major flood risks. Because of inferences derived from slope, green infrastructure, soil and water data combined, it is visible that these cities have a natural systems capacity for future development. Champaign-Urbana also exhibits the same capacity based on inferences from collective slope, green infrastructure, soil and water data. Development, both infill and greenfield, is already taking place rapidly in Champaign-Urbana, especially at the cities’ peripheries.
Based on these inferences, it can be projected that development in Champaign-Urbana can continue safely and can even bleed into Mahomet and Rantoul. Links made from green infrastructure can be built to connect these areas and promote public health.
Figure 11 outlines Champaign County’s areas of greatest capacity for development using a dashed line. It shows a largely undeveloped swath southeast of ChampaignUrbana that is suitable for development. However, this area exhibits little transit connectivity via interstate and rail.
According to the United States Census Bureau, the population in Champaign County is growing faster than the national rate, and it is increasingly home to young people. Because of the county’s high concentration of young people and other factors, only just over 50% of housing units are owner-occupied. However, the county’s vacancy rate is reported to be 10%, which is just under ten times the national average.11 These statistics point to a future of growth, which the county’s natural systems are ready for.

1 Champaign’s Boneyard Basin Redevelopment. West Branch Watershed Workshop. (n.d.). Retrieved October 17, 2019, from https://www.scarce. org/event/west-branch-watershed-workshop/.
2 Kickapoo Rail Trail. tkacich@news-gazette.com, T. K. (2017, August 10). First phase of Kickapoo Rail Trail set to open Aug. 25. Retrieved from https://www.news-gazette.com/news/first-phase-of-kickapoo-rail-trailset-to-open-aug/article9b1ac9b4-3687-5e32-86a1-1a453e2b99b4.html.
3 Tile Maintenance. Tile Drain. (n.d.). Retrieved October 17, 2019, from https://www.sciencedirect.com/topics/earth-and-planetary-sciences/tiledrain.
4 Miami-Strawn-Hennepin Series. HENNEPIN SERIES. (n.d.). Retrieved October 17, 2019, from https://soilseries.sc.egov.usda.gov/OSDDocs/H/ HENNEPIN.html.
5 Urbana’s Boneyard Basin Redevelopment. Boneyard Creek Plans and Studies. (n.d.). Retrieved October 17, 2019, from https://www. urbanaillinois.us/departments/public-works/about-public-works/ engineering/boneyard-creek-master-plan.
6 Value of Needed Green Infrastructure. Benefits of Green Infrastructure. (2018, December 5). Retrieved October 17, 2019, from https://www.epa. gov/green-infrastructure/benefits-green-infrastructure.
9 Ian L. McHarg. (n.d.). Retrieved October 17, 2019, from https://mcharg. upenn.edu/ian-l-mcharg.
10 Fehler, D. P. (n.d.). Retrieved October 17, 2019, from https://www.ou.edu/ class/webstudy/fehler/E3/go/introduction.html.
11 Census profile: Champaign County, IL. (n.d.). Retrieved from https:// censusreporter.org/profiles/05000US17019-champaign-county-il/.

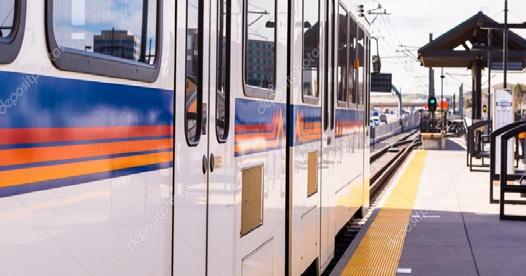
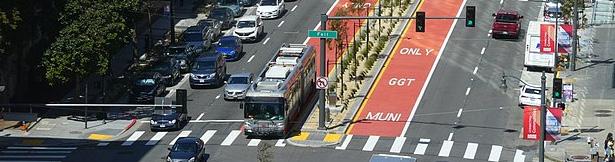
This sample project exemplifies Coindie’s ability to craft fresh, engaging, and clear long-form text documents. In this project, Co-indie undertook the creation of a comprehensive report on transit ridership decline and its causes, integrating text with images provided by Adobe Stock. The intentional approach to visual storytelling shines through with the skillful incorporation of custom graphics and maps derived from SVG files and GIS data. The document showcases a commitment to clarity and aesthetics, with colors and designs thoughtfully chosen to enhance visual appeal without overshadowing the importance of the content.
Find more work examples at coindie.net/graphic-design

During the past decade, transit ridership in the United States has peaked and troughed. These trends have been the subject of much academic, market, and agency-level research aimed at pinpointing the reasons for decline in a country where economic growth—which was tied to transit ridership levels prior to 2014—has accelerated considerably (Diffee, 2018). The current downward trend in ridership generally began after 2014, when most transit agencies recorded a peak in ridership (Grisby et al., 2018). The purpose of this literature review is to provide a broader context in which to situate our own research on transit ridership trends in downstate Illinois. Understanding trends in other places will help guide our efforts to explore the extent of, reasons for, and solutions to decreasing transit ridership in Illinois regions.
In this chapter, we review the body of literature that analyzes the main factors behind transit ridership trends in the U.S. We begin by evaluating overarching trends in ridership over recent decades and exploring the various methods that researchers have used to analyze ridership data. The existing literature on transit ridership points to several possible reasons for decline in public transit demand, which we discuss in the following section. To provide a more granular and place-specific perspective on ridership decline and its implications, we summarize two recent reports on transit trends in California regions. Finally, we discuss some possible ramifications of the COVID-19 pandemic on transit ridership in the short- and long-term future.
The literature reviewed for this effort includes a mix of peer-reviewed journal articles, reports from public agencies, books, and technical reports. To fully contextualize the story of transit ridership in downstate Illinois, we examined existing studies in various locations across the U.S., and with diverse units and levels of analysis ranging from agencies, to regions, to the nation as a whole.
Table display
Bold headers
than 1 million residents. In cities with legacy transit systems (New York, Chicago, Philadelphia, Washington DC, Boston, and San Francisco), ridership dropped by 5.4% between 2014 and 2018 (National Transit Database 2018). Defying these national trends, ridership is increasing in a few U.S. cities: between 2016 and 2017, ridership increased in the Seattle MSA by 3%, in the Phoenix MSA by 2.7%, and in the New Orleans and Salt Lake City MSAs by less than 1% (National
Declining ridership has impacts on transit agencies, communities, riders, and people who are transit-dependent. Instead of starting conversations about how to make public transit more competitive with other modes, ridership decline is often the
Readable font and color contrast
Custom chart display
transit ridership research, we will now discuss some of the methods for studying ridership trends, including potential data sources, collection methods, and statistical analysis tools.
Data facilitates understanding of ridership demand across time and space, but the ways it is used can also cause discrepancies in findings. Most nationallevel figures are sourced from the same handful of databases. The bulk of the data used in the research that we summarized was derived from the Federal Transit Administration (FTA)’s National Transit Database (NTD), which was established by the U.S. Congress to be the country’s primary source for data, information, and statistics on transit systems nationwide. NTD data are used to allocate federal funds to individual transit agencies, and all transit agencies receiving federal funding must report their annual data to the NTD (Florida

Data
transit riders to learn about ways that agencies can improve.
Department of Transportation, 2014). APTA releases annual reports based on NTD data that summarize ridership across the U.S. by mode for member agencies.
The Census Bureau’s Longitudinal Employer Household Dynamics (LEHD) data, as well as third-party websites
TransitFeeds and General Transit Feed Specification (GTFS) Data Exchange, also provide valuable data that informs the literature.
Various types of statistical analysis have been employed in investigations of ridership data. Most national studies use regression models that attempt to associate transit ridership or its change over time with various internal and external factors across metropolitan statistical areas (MSAs) or transportation agencies. Alam et al. (2018) used a log-log regression approach to analyze a sample of 358 MSAs across the U.S. in order to identify common factors that are relevant to the national trend. Using a compilation of data from 25 transit authorities across the U.S. and Canada, Boisjoly et al. (2018) selected a longitudinal multilevel mixed-effects regression method. The researchers used ridership as their dependent variable in order to study possible determinants of downward trends in transit demand. For comparing ridership data across unique geographies, a fixed-effects model can be used. Berrebi et al. (2019) also used a fixedeffects model but at the route-segment level (a cluster
of seven adjacent stops) to explain the relative change in transit ridership for transit agencies in Portland (OR), Miami, and Minneapolis-St Paul. A fixed-effects model mitigates irregularities and variations to focus only on the relationship between ridership change and changes in explanatory factors. Berrebi and Watkins (2020) utilized a Poisson fixed-effects model to evaluate the relationship between neighborhood sociodemographic characteristics and ridership change over time, while controlling for changes in service frequency, population, and job availability. Because of their ability to isolate key features of datasets and mitigate unnecessary error or “noise,” statistical tools play a large role in comparing ridership trends across compilations of cities, agencies, or regions.
Studies focusing on a single metropolitan area, such as the ones reviewed in section 5 (Manville et al., 2018, Wasserman et al., 2020), tend to employ a more descriptive statistical analysis for various sub-locations
and population groups. However, most existing studies mainly rely on a quantitative analysis to test possible reasons for transit ridership decline. The research team was able to identify few research efforts to shed light on how these macro factors are reshaping individual travel decisions using qualitative data such as surveys and interviews of lapsed transit riders and non-riders.
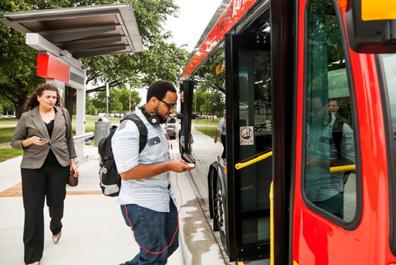
Declining ridership has impacts on transit agencies, communities, riders, and people who are transitdependent. Instead of starting conversations about how to make public transit more competitive with other modes, ridership decline is often the impetus for discussions about service cuts. For riders, and especially transit-dependent ones, reduced service can lead to job, housing, and food insecurity. Exploring the extent of and reasons for ridership decline can help agencies respond to trends without putting riders at risk of reduced mobility.
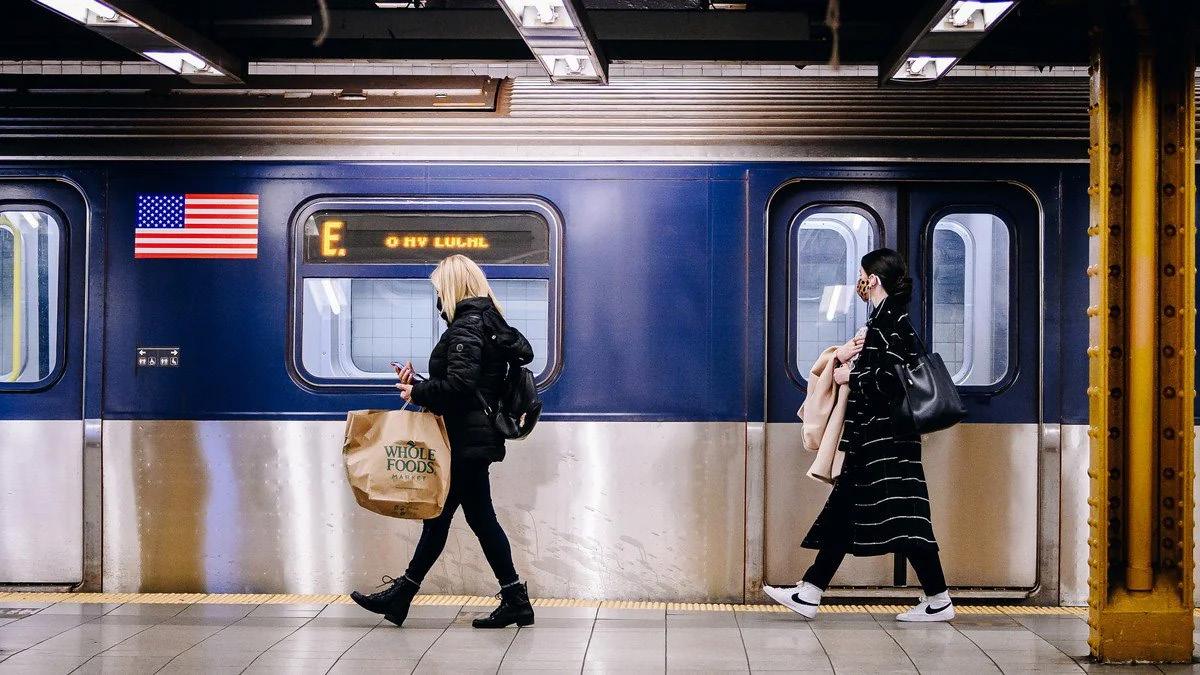
Photo caption
Double-column text layout
Seamless text-photo integration
Half-page photo layout
•
•
refer to aspects of service over which transit system managers have control (e.g., transit supply, route coverage). Alam et al. (2018), in an analysis of hundreds of American MSAs compiled to be generalizable to the country as a whole, refute literature stating that
socioeconomic factors, or external factors, contribute to transit demand. Of several factors known to affect transit demand, their research found that transit supply has the highest impact on travel demand. For bus transit in particular, a 10% increase in transit supply was found to be associated with a 5.75% increase in ridership. Also, for bus transit, a 10% increase in bus route coverage was associated with a 3.19% increase in ridership. Their study concludes that the job of building transit ridership belongs to policymakers and planners. Another study (Berrebi et al., 2019) in Portland, OR, Miami, FL, and Minneapolis-St Paul, MN found in all three cities that ridership depends on frequency of service and that chronically busy routes tend to experience declines in ridership over time. Bolstering these findings, a study of 25 transit agencies across the U.S. and Canada found that reductions in vehicle revenue miles (VRM) were a major contributor to bus and rail ridership declines (Boisjoly et al., 2018). Their analysis showed that a 10% reduction in VMR is associated with an 8.27% decrease in bus and rail ridership. An analysis across different types of metropolitan areas (Watkins et al., 2019) shows that the association between transit service cuts and transit ridership reduction is particularly strong in mid-sized, automobile-oriented metropolitan areas and sprawling small towns.
Though not formal service reductions, operational deficiencies and safety issues in transit systems also lead to similar negative outcomes. These “informal” service reductions led to service disruptions and declined ridership in Washington, DC and New York City in recent years, according to data from the NTD (Malalgoda and Lim, 2019). The same research found that enhanced ontime performance, improved service and reliability, and better service quality and safety are important to riders and that the influence of these factors exceeded that of competition from transportation network companies (TNCs). An analysis of informal service reduction based on a survey of transit ridersin San Francisco, CA, showed that the most significant negative experiences that drove a reduction in transit use were delays perceived to be the fault of the transit agency, long waits at transfer points, and being prevented from boarding due to crowded platforms stops (Carrel et al., 2013).


Like
to lengthy and often uncertain disbursement schedules by the Federal Transit Administration (Streetsblog, 2018). Since 1997, the top capital funding source for transit agencies in the U.S. has shifted from federal to local.
Local funding, which comes from sources such as passenger fare revenues,sales tax revenues, parking revenues, advertising revenues, and municipal bonds, is increasing to compensate for decreased federal funding. Of these local sources, the sales tax was by far the most popular voter-approved avenue for transportation funding in 2018, according to a report from the Eno Center for Transportation. The same report showed that less than 10% of funding was approved by statewide measures; the rest was approved by regional, county, or municipal governing bodies (Transportation at the Ballot Box, accessed September 20, 2020). In 2017, 36% of transit agency revenue was derived from passenger fare revenues.
Decreasing ridership, which resulted in a 1.8% drop in passenger fare revenues from 2016 to 2017, places financial strains on transit agencies, which already struggle to turn a profit.
Increasing fares, however, only worsens the problem: in a longitudinal analysis of public transit ridership in 25 North American cities from 20022015, Boisjoly et al. 2018 found that a 10% increase in fares is linked with a 2.19% decrease in ridership. Mallett (2018) pointed out that average fares have risen faster than inflation in recent years, potentially discouraging transit rides. In short, ridership is positively correlated with VRM and negatively correlated with fare increases (Graehler et al., 2019). This dynamic will continue to present significant challenges for public transit in the U.S. if federal funding continues to decrease.

Shared mobility and TNCs
Shared mobility includes all transit modes that are shared among users, either concurrently or one after another.
Under the Shared-Use Mobility Center’s definition, public transit counts as shared mobility (Shared-Use Mobility Center, accessed May 13, 2020). Transportation network companies (TNCs) facilitate transportation services that are accessible to users on an as-needed basis.
Examples of transportation services facilitated by shared mobility providers include bikeshare, scooter share, and ride-hailing. Access to such services is increasingly facilitated by technology, namely smartphones. Use of transportation services facilitated by TNCs is most common late at night and for social trips, and it is less common—but not uncommon—as a typical commute mode (Feigon and Murphy, 2016). Ride-hailing is undoubtedly the most popular service facilitated by TNCs, as it more than doubled the size of the overall forhire services sector between 2012 and 2017 (Berrebi and Watkins, 2020).
In its exploration of the impacts of ride-hailing TNCs on public transit demand, the literature is inconsistent.
Graehler et al. (2019) finds that the introduction of TNCs in an area results in significant decreases in rail and bus ridership that compounds over time, but that these external factors are not suitable explanations for the entirety of ridership decline. A research report from Clewlow and Mishra (2017) that details the results of a survey deployed in seven U.S. cities came to the specific conclusion that TNCs are associated with a 6% decrease in bus trips and a 3% decrease in light rail trips. However, the same report suggested that ride-hailing is also adding passenger miles to public transit in large cities. In other words, TNCs have been associated with a decline in demand of some transit modes but are not thought to be the sole cause, and in some cases, the presence of ride-hailing TNCs is likely supplementing public transit ridership.
Other literature points to a conflicting narrative around TNCs. This literature suggests that instead of taking riders away from public transit, TNCs can actually supplement and complement public transit. This research characterizes shared mobility as part of a
transit-dependent lifestyle embodied by people who are likely to be younger, non-white, and residents of more urbanized areas. An online survey distributed to residents of Austin, Boston, Chicago, Los Angeles, San Francisco, Seattle, and Washington DC, found that shared mobility users rely on public transit more and own fewer cars compared to national averages (Feigon and Murphy, 2016). The survey results also revealed that shared mobility users ride public buses and trains more frequently than people who don’t regularly use shared mobility modes. Another investigation into the effects of TNCs, which used national data from the U.S. Department of Transportation and the National Transit Database, revealed that higher-than-average TNC use was correlated with higher-than-average rail ridership on an agency-level basis. In relation to bus ridership, however, the same research found that TNCs neither complemented nor replaced it (Malalgoda and Lim, 2019).
Graehler et al. (2019) suggest that bike share could potentially complement transit by providing first and last-mile connectivity. Interestingly, bikeshare is associated with increases in heavy rail and light rail ridership, but with a decrease in bus ridership. Similar to the literature on TNCs and ridership, however, this finding about the potential influence of bikeshare on public transit ridership is also inconclusive. Under some circumstances, TNCs are associated with lower heavy rail and bus ridership and this association increases each year after TNCs enter a market. Findings from a recent report by Schaller (2018) suggested that if TNC services were not available, the majority of TNC customers would have used public transit or active transportation or would not made the trip at all. Further efforts to measure the relationship between TNCs of all types and public transit demand are needed.

Full-bleed header photo
Subheader
The
Most transportation infrastructure in the U.S. was built to accommodate private vehicles, which has made driving an automobile the most popular mode of transportation. The single largest predictor of whether an individual uses public transit is whether they have access to a private vehicle (Manville et al., 2018). Consequently, those unable to drive are much more likely than the general population to use public transit. While access to a motor vehicle is among the strongest reasons that transit ridership has been low in the U.S. compared to other countries, it is also thought to be part of the reason ridership is decreasing in recent years. Accessing motor vehicles, either to drive or be driven in, is becoming easier in the U.S. In a study of declining transit ridership in Southern California, Manville et al. (2018) found that the number of households with no vehicles decreased by 30% over a 15-year span. Notably, the same study found that among foreign-born residents, zero-vehicle households were down by 42%. The literature notes that living in a household with a vehicle may be the most compelling predictor of transit use, and that the sharp decrease in the number of these households in Southern California accounts for a large share of missing transit riders in recent years. Data from the National Household Travel Survey indicates that between 1969 and 2009, the share of households without a vehicle dropped from about 21% to about 9% and the average number of vehicles available per household increased from 1.16 to 1.86. A more recent report on U.S. household travel data from Sivak (2018) listed peak vehicles per household at 2.050 in 2006. Since then until 2016, the most recent year included in the report, the measure hasn’t decreased past 1.9.
Trends in gas prices and car payments, two long-term financial obligations associated with owning a private vehicle, have facilitated access to driving as a primary transportation mode. Between 2014 and 2016, the price of gasoline fell from an annual average of $3.46 per gallon to $2.20 per gallon in 2016 inflation-adjusted dollars (Mallett, 2018). Between 2012 and 2016, average gas prices in the U.S. declined every year and new car loan interest rates never rose above 5%. Meanwhile, real median income increased by 10.8% for African American households and by 20.5% for Hispanic households (Berrebi and Watkins, 2020).
9
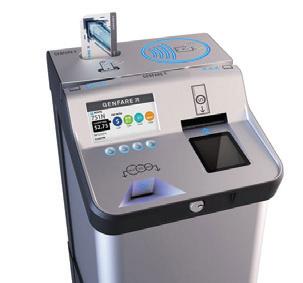
Photo caption
the work of exploring transit trends yields unique results based on a number of place-specific characteristics and the choice of statistical tools. Findings regarding the extent of the decline vary widely, depending on the ridership statistics of specific geographies, the timeframe in question, and the characteristics of the riders.
The reason for decline varies from study to study and often involves several factors, from the implementation of bikeshare infrastructure to gentri cation around transit stops. Impacts of transit ridership decline also tend to be place-specific but generally include reduced service. Internal factors causing transit ridership decline include transit service cuts, decreasing transit funding, and rising transit fares. The literature also identifies external factors beyond the control of transit agencies, including emerging shared mobility and TNCs, rising vehicle ownership and declining gasoline prices, demographic shifts and intra-metropolitan migration away from transit cities, telecommuting and online shopping, and gentrification and displacement. Studies show that the association between transit service cuts and transit ridership reduction is particularly strong in mid-sized, automobile-oriented metropolitan areas and sprawling small towns. Case studies of large metropolitan areas tend to focus on the changing location and travel choices of transit-dependent populations, such as zero-vehicle households, lowincome groups, and immigrants.
Despite inevitable inconsistencies in research conclusions, there are several solvable gaps in the literature on ridership decline. In particular, analyses of bikeshare and overall TNC impactsstill yield consistently inconclusive results. Evidence of poor service and funding reductions, however, almost invariably results in decreased ridership. Transit agencies and municipalities seeking to rebuild ridership should consider improving their service and curtailing fare increases. The impact of COVID-19 on transit ridership has been
dramatic, widespread, and fairly consistent across agencies. The characteristics of past intersections between public health and transit are markedly different from those of COVID-19 and transit in 2020. Because COVID-19 is global and highly communicable, researchers and transit agencies are navigating this crisis with very little prior experience, which makes the future of transit ridership uncertain. While nearly all transit agencies are experiencing dramatically reduced transit ridership and fare revenues, safe transit operation during the pandemic adds huge additional costs. To overcome the financial strain, most agencies are shifting some funds from capital to operating expenses, which might affect agencies’ capacity to provide appropriate levels of transit service in the future.
Because Co-indie is run by an adaptable solo practitioner, clients enjoy a high degree of flexibility in response to changing project requirements, timetables, and deadlines. Additionally, Co-indie is wellpositioned to make quick decisions and pivots to accommodate clients’ needs.
Co-indie maintains a consistent work style and approach because of rich experience creating design solutions for local governments, metropolitan planning organizations, non-profits and universities. As an AICP-certified urban planner, Mimi is familiar with the process of creating comprehensive plans and other planning documents. This expertise, combined with her graphic design skills, ensures that work processes and deliverables will adhere to industry standards and best practices.