

July 2023 Achieving Carbon Neutrality in the California Cement Industry Key Barriers & Policy Solutions Second Edition
About the California Nevada Cement Association
CNCA is committed to developing sustainable and economical construction solutions for California and Nevada with an emphasis on the use of cement and concrete. We serve these states as a nonprofit trade association that provides expert technical leadership, design assistance, research, and educational opportunities designed to responsibly transform our built environment and improve the lives of the people throughout the region. The member companies of the CNCA are cement producers and shippers that manufacture cement products.

Table of Contents Forward ..................................................................................................................i Introduction............................................................................................................1 The California Cement Industry: A Brief Primer ......................................................3 GHG Reduction Pathways & Levers.........................................................................5 Pathway 1: Reducing Process Emissions...............................................................5 Pathway 2: Reducing Combustion Emissions......................................................14 Pathway 3: Reducing Electricity-Related Emissions ............................................22 Conclusion ............................................................................................................25 Appendix...............................................................................................................26 Endnotes...............................................................................................................31
Acronyms
GHGs = Greenhouse Gases
OPC = Ordinary Portland Cement
CCUS = Carbon Capture, Utilization, and Storage
MT = Metric Tons
PLC = Portland Limestone Cement
EU = European Union
CCS = Carbon Capture and Storage
LCFS = Low Carbon Fuel Standard
CARB = California Air Resources Board
CEQA = California Environmental Quality Act
NEPA = National Environmental Policy Act
SCM = Supplementary Cementitious Material
RD&D = Research, Development, Demonstration
FEED = Front End Engineering Design
EMSW = Engineered Municipal Solid Waste
EIR = Environmental Impact Report
NSR = New Source Review
RCRA = Resource Conservation and Recovery Act
NESHAP = National Emission Standards for Hazardous Air Pollutants
WHR = Waste Heat Recovery
MW = Megawatt
MWh = Megawatt-hour
DER = Distributed Energy Resource
FORWARD TO THE SECOND EDITION
Tom Tietz Executive Director, CNCA
In March 2021, CNCA released the first edition of ‘Achieving Carbon Neutrality in the California Cement Industry’. The first edition was a groundbreaking document that underscored the industry’s commitment to reach net carbon neutrality by 2045 and articulated a clear, actionable roadmap for achieving that goal. It also outlined the various pathways for reducing the industry’s carbon footprint, the real-world barriers that must be removed to unlock those pathways, and the specific actions needed to provide local cement producers with options for reducing their GHG emissions in the short, medium, and long term.
The first edition helped frame the conversation and set the stage for collaboration between the California cement industry, policymakers, regulators, and other key stakeholders across the political spectrum. The results speak for themselves. In September 2021, California adopted Senate Bill 596 (SB 596), which directs the California Air Resources Board (CARB) to create a strategy for removing barriers to decarbonization and achieving net carbon neutrality in the California cement industry by 2045. Reflecting the vision outlined in the first edition of this report, SB 596 was the result of a collaborative process between policymakers, the California cement industry, environmental advocacy groups, and other stakeholders. As noted by Senator Josh Becker, the legislation’s author,
“This legislation becomes law thanks to the help of the climate and environmental action advocates at the NRDC, which partnered with me on the bill, and with support from the California Nevada Cement Association, which shared key input on the industry’s efforts to reduce carbon emissions from cement and was a willing partner in helping to craft SB 596 as it advanced in the Legislature.”i
The first edition emphasized the potential for portland limestone cement (PLC) to significantly reduce the cement industry’s GHG emissions in the near term. We are pleased to report that, in the two years since the report’s release, Caltrans approved the use of PLC in California, the cement industry made investments to retrofit plants to produce PLC, and local demand grew for PLC Unlocking PLC represents a tangible step toward net carbon neutrality and an example of the collaborative, multi-stakeholder approach that will be needed to unlock other decarbonization pathways.
Unfortunately, the pace of progress on other decarbonization pathways over the past two years has been less impressive. We are encouraged, however, by the constructive conversations we have had with policymakers, regulators, academics, and environmental advocacy groups. We are encouraged by the shared interests in achieving net neutrality in the California cement industry; the broad-based belief that a vibrant local cement industry is good for the state economy and global climate change; and the commitment to engage in good-faith conversations about the industry’s circumstances, challenges, and opportunities. As a result, we continue to believe that achieving net carbon neutrality in the California cement industry by 2045 remains within our reach.
We are also encouraged by the relatively rapid pace of innovation in GHG reduction technologies, processes, and products with cement industry applications in recent years. This surge in innovation is a reminder that the path to carbon neutrality is a winding road as the technical feasibility, cost-effectiveness, and risk-return profile of various investments to reduce GHG emissions evolve over time. This same surge is also a reason for optimism, as innovation is essential to expanding the portfolio of options for driving
i
i Office of Senator Josh Becker. “CA Governor Signs State Senator Josh Becker’s Landmark Bill to Decarbonize Cement”. Press Release, September 23, 2021.
down GHG emissions and increasing the odds of reaching net carbon neutrality, while also advancing the state’s job creation, affordable housing, infrastructure, and resiliency goals.
Refreshing the Roadmap: Recent Developments & Emerging Opportunities
The second edition of this report includes new content that provides an updated outlook on the challenges and opportunities associated with achieving net carbon neutrality. Specific decarbonization levers that receive a new, expanded, or significantly revised treatment include:
• Blended Cements. With the barriers to PLC removed, expanding the use of a broader portfolio of blended cements is the next logical step in reducing the industry’s GHG emissions in the near term. The industry is actively developing local sources of supplementary cementitious materials (SCMs) that can be blended with cement clinker to reduce GHG emissions while maintaining or even improving product performance. There are significant opportunities for policymakers and regulators to accelerate and amplify the industry’s efforts.
• Carbon Capture, Utilization, and Storage (CCUS). Globally, the development and demonstration of CCUS technology in industrial applications has accelerated in recent years due, in part, to a significant increase in public investments, incentives, and other supportive policies. Although the deployment of CCUS technology in the California cement industry is still many years away, policymakers and regulators can take action today to increase the odds that CCUS emerges as a viable option for achieving deep decarbonization in the cement industry in the long term.
• Alternative Fuels. The industry continues to face significant barriers in expanding the use of biomassderived fuels such as agricultural waste, refuse-derived fuels such as engineered municipal solid waste, and other more sustainable alternatives to fossil fuels such as renewable natural gas (RNG). Expanding the use of alternative fuels will be critical to driving down the industry’s combustion emissions over the next decade while potentially transformative technologies (e.g., clean hydrogen and kiln electrification) continue to develop in the long term.
• Onsite Electricity Generation. Rapidly rising electricity rates in California have positively affected the economic feasibility of cement industry investments in waste heat recovery (WHR) and onsite renewable energy generation. Although the GHG reduction potential of this lever is small relative to others, the combined effects of elevated electricity prices and new federal incentives for onsite electricity generation have created a “low-hanging fruit” opportunity for the industry to reduce GHG emissions while also supporting local jobs and relieving stress from the state’s electricity grid.
Notwithstanding these enhancements, the primary message of the second edition remains the same: the California cement industry cannot achieve carbon neutrality on its own, and we invite all interested stakeholders to join us in our renewed commitment and constructive dialogue about how we can reach net zero as quickly as possible and no later than 2045. By updating this report to reflect recent developments, we hope that it will continue to serve as a useful framework for understanding the California cement industry, its opportunities to reduce GHG emissions, and its challenges in achieving net carbon neutrality. We also hope that it will continue to serve as a foundation for productive engagement between the industry, policymakers, regulators, academics, environmental advocacy groups, and other interested stakeholders about how to accelerate progress, maximize the odds of success, and position California as a frontrunner in the global race to help “difficult-to-decarbonize” industries reach net zero.
ii
INTRODUCTION
The policy debate on climate change has converged around the goal of achieving “carbon neutrality” that is, ensuring that the amount of GHGs generated by society is equal to or less than the amount of GHGs that are stored through natural and man-made sinks. This vision is consistent with the assessment of the Intergovernmental Panel on Climate Change, which found that society must achieve carbon neutrality by the middle of this century to limit the increase in global temperature to 1.5 degrees Celsius.1 It is also consistent with California’s climate change policy objectives, which include achieving carbon neutrality by 2045.2 These goals are underpinned by a daunting fact we all must take bold steps now in order to avoid the worst effects of global climate change.
The California cement industry supports the state’s GHG reduction goal and is committed to achieving carbon neutrality by 2045. The purpose of this report is to outline the steps needed to achieve that goal, including key barriers that must be addressed and recommendations to overcome them. It is based on a combination of extensive research and in-depth interviews with CNCA members, including all five cement manufacturers operating in California. The report reflects the practical experiences of the industry and offers an on-the-ground assessment of the challenges and opportunities that it faces with respect to unlocking a path toward carbon neutrality.
Preserving and extending the state’s existing cap-and-trade program is essential to achieving this goal. The cap-and-trade program establishes a clear, escalating price signal that provides a critical incentive and relatively predictable environment for the cement industry as it plans and deploys high-cost, long-term investments in GHG abatement. In addition, the cap-and-trade program’s allowance allocation system has been instrumental in reducing the risk of carbon leakage in the cement industry that is, the displacement of locally produced cement by imported product, which is often produced in jurisdictions with less stringent environmental regulations and requires transportation over long distances, leading to additional GHG emissions. The recommendations in this report assume that the existing cap-and-trade program remains in place and therefore focus on overcoming the many non-price barriers that continue to hinder the cement industry’s ability to substantially reduce its GHG footprint.
This report focuses on decarbonization opportunities within the cement manufacturing process itself. Cement manufacturing accounts for the vast majority of GHG emissions associated with the production and placement of concrete. As a result, this report focuses exclusively on the barriers and opportunities to manufacturing carbon neutral cement at California plants. That said, decarbonization efforts throughout the supply chain will be essential to minimizing the GHG emissions associated with cement and concrete in California’s built environment in the long term.3
This report focuses on decarbonization levers that require meaningful operational changes, supportive market conditions, dedicated investment, public-private partnerships, and/or legislative support. It is not meant to imply that the industry’s GHG-reducing actions and investments are limited to this set indeed, the industry is actively pursuing and capitalizing on GHG savings across all areas of operations, including incremental levers that are not the focus of this report.
This report recognizes the fact that there are no shortcuts or silver bullets to achieving deep decarbonization within the California cement industry. Rather, there is only the hard work associated with longterm planning, purposeful policies, and decades of sustained capital investments from both the public and private sectors. Achieving carbon neutrality in the California cement industry will require a compilation of strategies, including but not limited to:
1
• A commitment to an “all-of-the-above” approach that unlocks a portfolio of pathways such that each plant can chart a course that aligns with its unique needs and circumstances.
• Close coordination among stakeholders throughout the supply chain, including cement manufacturers, cement importers, concrete plants, project owners, developers, engineers, and architects.
• Constructive engagement among stakeholders throughout the public policy community, including legislators, regulators, non-governmental organizations, and other interested parties.
In short, the California cement industry cannot achieve carbon neutrality on its own. This report serves as both an invitation for collaboration and a call to action for all stakeholders who are interested in helping the industry achieve that goal The path to carbon neutrality begins with an inclusive, constructive, and fact-based conversation about the full range of opportunities and challenges associated with driving GHG reduction in a “difficult-to-decarbonize” industry such as cement. This report is designed to jump-start that conversation.
2
THE CALIFORNIA CEMENT INDUSTRY: A BRIEF PRIMER
Cement is a dry powder mixed with coarse aggregates (typically rocks), fine aggregates (typically sand), and water which, once the mixture hardens, produces concrete. Cement plants manufacture clinker the main ingredient in cement that binds the ingredients of concrete together. Clinker is produced by heating limestone and clay in a rotating kiln at ~1,500 degrees Celsius, which is then ground and mixed with limestone and small amounts of gypsum to produce ordinary portland cement (OPC). Finished OPC is then sold to concrete producers, where it is mixed with other materials and delivered to customers.
Cement is a strategic commodity that modern economies use to build homes, office buildings, and core elements of transportation, water, and other critical infrastructure in a resilient and eco-efficient fashion. Cement is essential to the construction of buildings that provide maximum protection against fires, floods, and other consequences of a changing climate, while also delivering phased emissions savings, relative to other construction materials, over a full lifetime. A strong and vibrant local cement industry is essential to increasing the resiliency of infrastructure in the most environmentally responsible manner possible, as it avoids the GHG emissions associated from both producing cement in countries with less stringent regulations and transporting it long distances. As a result, the California cement industry is a leader when it comes to producing environmentally responsible cement, comprising roughly 2% of the state’s total emissions. Charting a path toward carbon neutrality builds on that leadership and will set a positive example for others to follow.
The California cement industry faces an extreme challenge when it comes to addressing the process emissions footprint of cement production Manufacturing clinker accounts for the majority of the cement industry’s GHG footprint due to process emissions unavoidable emissions from the chemical reaction that happens when limestone is calcined at high temperatures. The remainder of industry emissions stem from direct fuel combustion and indirect sources such as electricity consumption This dynamic results in a process emissions “wall” beyond which the industry’s ability to substantially reduce its GHG footprint depends on emerging technologies that directly address process emissions notably, CCUS.
Cement Industry Emissions, by Source
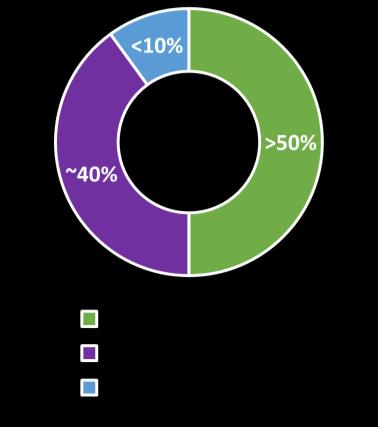
Source: Lehne, J., & Preston, F. (2018). Making concrete change: Innovation in low-carbon cement and concrete. Chatham House Report: London, UK. Figure 4 Link
Cement is also unusual in that it is both a source and a sink of GHG emissions. A substantial portion of GHG emissions are effectively reabsorbed or sequestered by the cement in concrete over time. This process, called “recarbonation,” occurs when hydrated cement within concrete reacts with the CO2 in ambient air to sequester carbon in concrete. This functionally reduces embodied GHG emissions over the full lifecycle of cement.4 As a result, achieving net neutrality in the cement industry does not necessarily equate to eliminating all GHG emissions (see box below).
3
Defining Net Carbon Neutrality in the Cement Industry: The Role of Recarbonation
A portion of GHG emissions from cement production are reabsorbed over time through naturally occurring carbon uptake known as “recarbonation.” Although the estimated impact of recarbonation varies, research suggests that recarbonation has offset a significant share of the cement industry’s emissions. For instance, a 2016 peer-reviewed study published in the journal Nature estimated that 43% of global cement industry process-related emissions from 1930 to 2013 have ultimately been absorbed through recarbonation 5,6 The United Nations Intergovernmental Panel on Climate Change estimates a similar impact, stating in their 2021 assessment that “the uptake of CO2 in cement infrastructure ([re]carbonation) offsets about one half of the carbonate emissions from current cement production.”7 In contrast, a recent study conducted by MIT’s Concrete Sustainability Hub found that just 5.5% of the total carbon emitted by cement production used for streets and highways is eventually reabsorbed and sequestered, and that reabsorption is heavily dependent on end-use best practices to maximize carbon uptake.8
Although additional research is needed to more precisely quantify the amount of carbon absorbed through the recarbonation process, the policy implications are clear: efforts to achieve net carbon neutrality in the cement industry should expressly acknowledge and account for the fact that a meaningful portion of the industry’s emissions are naturally reabsorbed and sequestered over time.
Under current policy, California cement producers do not compete on a level playing field with imported cement. Imported cement is not subject to the same regulatory costs as cement produced within the state. This provides cement importers with a distinct competitive advantage given that: (1) cement is a fungible commodity that is primarily sold on the basis of price and (2) California is easily accessible to imports from distant markets, particularly Asia. This dynamic has at least three critical implications. First, California producers cannot fully pass through the costs of GHG policies to customers without losing market share to imports (i.e., economic and emissions leakage), which are not subjected to a market-based carbon price and/or do not have to absorb the costs associated with GHG abatement. Second, it incentivizes the consumption of imported cement, which is often produced in markets with less stringent environmental regulations and results in additional transportation emissions. Third, California producers cannot confidently make investments in capital-intensive, transformational technologies to reduce GHG emissions (e.g., CCUS) without fear that those investments will eventually be undermined by less regulated imports
To ensure that GHG emission reductions are due to decarbonization and not displacement, California should create a supportive environment for transformational investments in the cement industry. Specifically, California should implement policies that equalize the regulatory costs between domestically produced and imported products (e.g., establishing a border carbon adjustment or similar mechanism). By applying similar carbon costs to all cement products consumed in California, regardless of where they are produced, policymakers can help the industry embed the price of carbon into its products while remaining competitive with imports. Equally as important, such policies will give cement producers the assurances and predictability needed to confidently make investments in transformational GHG reduction technologies in the California market without worrying that those investments will be easily undermined or quickly devalued by imports that are not held to the same standard. By leveling the carbon playing field, California policymakers can not only prevent near-term economic and environmental leakage in the cement industry, but also create the conditions necessary to support long-term investment in transformational decarbonization technologies.
4
GHG REDUCTION PATHWAYS & LEVERS
There are three primary pathways to reducing GHG emissions in the cement industry: (1) reducing process emissions; (2) reducing combustion emissions; and (3) reducing electricity-related emissions. Each pathway offers a mix of nearterm, mid-term, and long-term opportunities, as well as a range of GHG reduction benefits. California must press forward on all fronts simultaneously to unlock a portfolio of options that each cement plant can use to chart its path toward carbon neutrality given its circumstances.
The following sections provide context on each pathway, outline the levers that will be necessary to achieve emissions reductions, describe the potential benefits and the outstanding challenges faced by each lever, and present policy recommendations to unlock these opportunities.
PATHWAY 1. REDUCING PROCESS EMISSIONS
The most significant constraint on the cement industry’s ability to realize net carbon neutrality is the presence of significant process emissions The chemical conversion process of limestone calcination releases CO2 as a byproduct during the production of clinker. This chemical process results in roughly 0.51MT of GHG emissions for every MT of clinker produced and accounts for almost two-thirds of the California cement industry’s GHG footprint. 9,10 While emissions stemming from fuel or energy use can be mitigated through a broad suite of options and substitutions, the presence of process emissions effectively creates an emissions reduction “wall” in which more than half of the industry’s GHG footprint cannot be reduced by investments in conventional GHG abatement measures, such as improving energy efficiency or significantly increasing the use of lower-carbon fuels.
This section describes options for reducing process emissions in the California cement industry, including measures to: (1) decrease the clinker content in cement while maintaining product performance; (2) capture GHG emissions at cement plants; and (3) develop lower-carbon cement alternatives that, if proven and tested, have the potential to displace a portion of conventional cement production at scale.11
All three options have the potential to significantly contribute to a net-zero future in the California cement industry. However, each also offers a different value proposition in terms of timing, cost, and risk, as outlined below. Although all three options should be simultaneously and aggressively pursued, it is difficult to imagine achieving net carbon neutrality in the California cement industry by 2045 without carbon capture, given the industry's emissions profile and the current state of technology. In short, carbon neutrality
5
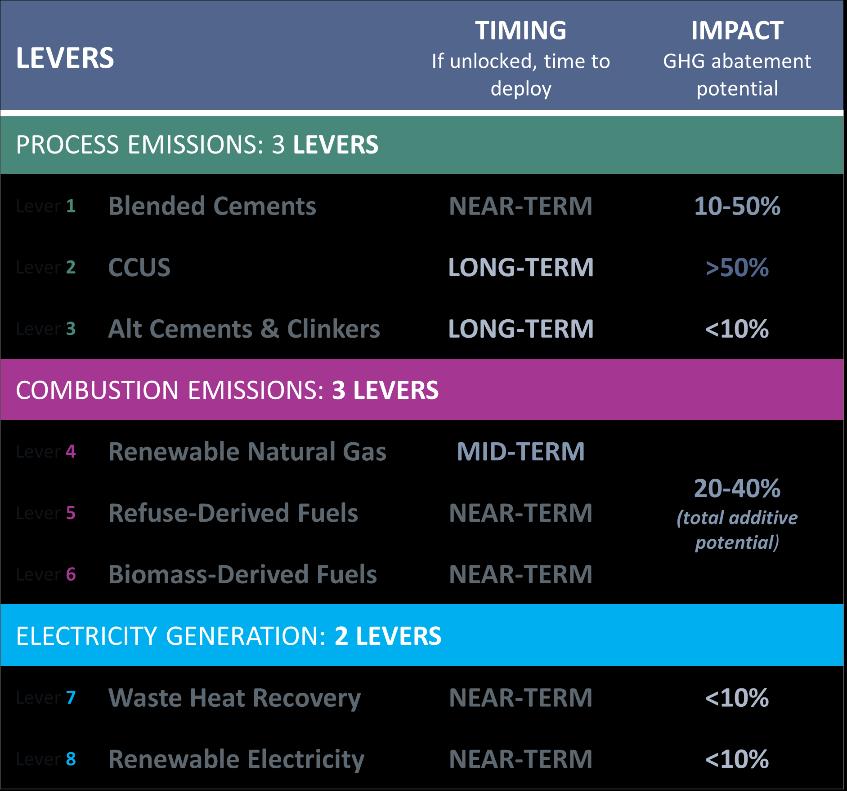
Timing and Impact* of Decarbonization Levers on GHG Intensity of Cement Production by 2045
* “Impact” refers to a lever’s potential to reduce the industry’s total GHG footprint, including process, combustion, and electricity-related emissions.
is likely to be out of reach for the cement industry in the absence of policy measures that enable and promote the rapid deployment of carbon capture, utilization, and sequestration (CCUS) technologies and related infrastructure within the state.
Lever 1.A Blended Cements
● Timing: Near-Term | ● Total Emissions Impact: 10-50%
The Opportunity. Blended cement is composed of portland cement clinker, gypsum, and one or more cementitious components also known as supplementary cementitious materials (SCMs). Blended cements reduce the GHG intensity of the product by reducing the amount of clinker (the most GHG intensive component) while still achieving a particular performance standard. Unlike many other key decarbonization pathways (i.e., CCUS), the increased use of blended cements has the potential to significantly decrease the industry’s GHG emissions intensity in the near future
There is a wide range of SCMs that can be used to produce a blended cement product, which generally fall into one of three categories.
Industrial Byproducts
• Coal Ash: Coal Ash – also known as fly ash – is fine ash captured during combustion at coal-fired power plants. Coal ash is a commonly used SCM in California and can replace roughly 40% of clinker in cement.12 However, the trend away from coal-fired electricity generation will likely significantly constrain the availability of coal ash in future years.
• Slag Cement: Slag is a byproduct of steel manufacturing created in a basic oxygen furnace (as opposed to an electric arc furnace) by quenching molten blast furnace slag with water or steam. It is currently a widely used and accepted SCM that can replace up to 50 to 70% of clinker in cement.13 However, as with coal ash, the future availability of slag cement use in California is likely to be constrained due to a combination of increased global demand and decreased global supply.
• Silica Fume: Silica fume is a fine powder byproduct of silicon and ferrosilicon alloy manufacturing that is used to create a higher strength, lower porosity concrete.14 While silica fume use is increasing, it is most often added to concrete to achieve specific concrete performance features. Silica fume can theoretically replace up to 25% of cement in concrete, but due to issues with curing time and strength development, no more than approximately 10% of cement can be replaced without negatively impacting the quality of the concrete.15
Naturally Occurring Mineral SCMs
• Natural Pozzolans: Natural pozzolans are volcanic ash deposits that can be mined and ground to create an SCM. While currently in the developmental stage, natural pozzolans have a high potential for future widespread deployment and, by extension, GHG impact.16 Known deposits of natural pozzolans throughout California make it a particularly promising and more sustainable alternative SCM over the long term.
• Calcined Clays: Naturally occurring clays can be heated to high temperatures (calcined) and ground for use as an SCM. Most calcined clays used by the industry are derived from kaolin clays, which have the potential to replace 20-30% of clinker in cement. Calcined clays also have favorable strength and durability characteristics.17,18 In particular, limestone calcined clay cements produced with a high
6
share of inter-ground limestone (up to 15%) and calcined clays (up to 30%) are generating substantial market and policymaker interest and are viewed by some as a promising approach to low carbon cement manufacturing.19
Other Potential SCMs
• Ground Glass Pozzolans (GGP): Ground Glass Pozzolans are post-consumer recycled ground glass (e.g., containers, plate glass, e-glass), which have the potential to both: (1) replace up to 40% of the clinker in a cement or concrete mix and (2) divert a readily available waste material that is often landfilled.20,21 GGP is a relatively new material to the cement and concrete value chain and is not yet available in the quantities required to make large impacts in the marketplace, but nonetheless represents a promising SCM source for the future.22
• Novel Manmade SCMs: Innovative processes that produce SCMs by capturing and mineralizing the CO2 released during the calcination phase of cement production are being developed and pilot tested for eventual commercial-scale deployment. These novel, manmade SCMs have the potential to yield “double” emissions benefits, as they would reduce the front-end process emissions associated with cement production and replace a portion of cement in concrete mixes without sacrificing product performance. Some experts estimate that manufactured SCMs using mineralized CO2 could displace up to a third of the OPC in ready-mix concrete blends.23
Historically, the vast majority of SCM use has occurred across hundreds of concrete batch plants throughout the state and on a project-by-project basis. By incentivizing SCM blending “upstream” at the cement plant level, California has an opportunity to expand the use of lower carbon cements more rapidly, on a broader scale, and on a more regular basis.
In addition to increasing the use of individual SCMs, the California cement industry is evaluating and pursuing opportunities to use multiple SCMs in combination. For instance, “ternary” cement blends (i.e., blending two different SCMs with clinker at a cement plant) are gaining additional attention in the California market given their potential to replace up to 50% of clinker while maintaining, and even improving, product performance.24 There is also increasing interest in producing “quaternary” blends (i.e., blending three different SCMs). By incentivizing the increased use of SCMs in general and enabling the increased use of multiple SCMs in particular, California can provide each cement plant with the flexibility required to meet customer needs using the portfolio of SCMs available to them given their unique circumstances (e.g., location, plant configuration, supply chains).
Now that the barriers to expanding the use of Portland limestone cement have largely been removed, incentivizing the production and consumption of more advanced blended cements represents the most practical, cost effective, and high-impact option for substantially reducing GHG emissions in the California cement industry in the near term
The Barriers. A number of constraints limit the ability of the California cement industry to use blended cements to reduce its GHG emissions footprint. Chief among these barriers is the availability of raw materials. The global supply of the most commonly used SCMs (i.e., coal ash and slag) has declined in recent years and is expected to drop an additional 16% by 2050 25
To navigate near-term supply challenges and continue to support some level of SCM blending, California imports coal ash and slag from developing markets, particularly Asia,26 and is exploring investments to
7
recover and process coal ash from other sources – for example, recovering impounded coal ash from ash ponds. The California cement industry has made substantial investments in identifying and testing viable, locally abundant alternatives, such as natural pozzolan deposits. While pozzolan deposits are abundant, finding materials with desirable performance characteristics can be challenging and require investments in sourcing, mining, and RD&D activity. Deposits are also often located in remote areas that would need expanded rail or highway access to make production and transportation viable at scale. The process of exploring ways to increase natural pozzolan production and use is ongoing, and regulators should take proactive steps to support a shift to locally available natural pozzolans, as well as calcined clays.
In addition to supply-related challenges, California’s regulatory framework does not encourage the production of blended cements. For instance, under the current cap-and-trade system, a cement plant’s output (which determines the amount of allowances it receives) is based on the amount of clinker, limestone, and gypsum that is used to produce cement, but it excludes the use of SCMs. As a result, there is not a clear incentive for the industry to make the investment and effort necessary to expand the use of SCMs and the production of blended cements. By revising the definition of cement under the cap-and-trade program, California has the opportunity to recognize, incentivize, and accelerate the production of blended cement and the cement industry’s path to net carbon neutrality.
Challenges of Apples-to-Apples Clinker Ratio Comparisons
SCMs can either be blended at the cement plant or incorporated at the ready-mix concrete facility In California, most alternative materials are added at the ready-mix concrete plant, which is not the case in most cement industries outside of the U.S. This relationship can make it difficult to evaluate clinker substitution on an apples-to-apples basis when comparing U.S. markets with their global peers. Looking ahead, it is critical that policymakers understand and appreciate this measurement challenge and promote and reward the benefits of SCM usage, regardless of where they are introduced in the cement-concrete value chain.
Lever 1.B Carbon Capture, Utilization, & Storage (CCUS)
● Timing: Long-Term|
● Total Emissions Impact: >50%
The Opportunity. CCUS refers to a suite of technologies and infrastructure components that capture, store, and use CO2 emissions. While CCUS technology mitigates both the combustion and process emissions from cement manufacturing, the primary benefit of carbon capture is to reduce process emissions that cannot be reduced through other conventional decarbonization levers. With a capture rate upwards of 90%, CCUS is the only technologically proven lever capable of eliminating the cement industry’s process emissions “wall” and driving the scale of GHG abatement necessary to achieve deep decarbonization.27,28 Given the otherwise limited set of options for abating process emissions, carbon neutrality will be out of reach for the California cement industry unless and until cost-effective CCUS technology is commercially available and widely deployed.29
Over the last several years, the pace of innovation has accelerated across a range of carbon capture technologies with potential application to the cement industry. Each approach has its own distinct advantages depending on plant-specific contexts and economic considerations, and several methods are approaching commercial feasibility as demonstration projects come online.30 The uncertainty associated with the
8
evolution of various CCUS technologies heightens the importance of policies that allow cement producers to deploy the most cost-effective option given the unique operating context of each plant.

California has a distinct advantage when it comes to supporting widespread adoption of CCUS due to its geologic options for sequestering carbon. California has the capacity to safely store 60MMT of CO2 annually for the next 1,000 years.31 This provides CCUS adopters in California with a significant potential benefit, provided that policymakers capitalize on this opportunity by investing in and supporting sequestration projects. In addition, options for utilizing captured carbon are expanding into novel applications that have the potential to provide ancillary GHG reduction benefits, including using captured carbon to produce construction materials, fuels, plastics, chemicals, animal feed, and fertilizers.32,33
Continued technological advancement across the CCUS value chain, spurred on by federal investment and supportive incentives, are expected to speed the arrival of commercially viable CCUS for the California cement industry. However, regulatory and policy stakeholders must align the market, policy, and regulatory conditions in the state to support the substantial capital investments needed to fully deploy CCUS in the cement industry. Time is of the essence experience suggests that California will need at least ten years to make carbon capture at cement facilities a reality, and potentially even more time to build out the supporting transportation and storage infrastructure.
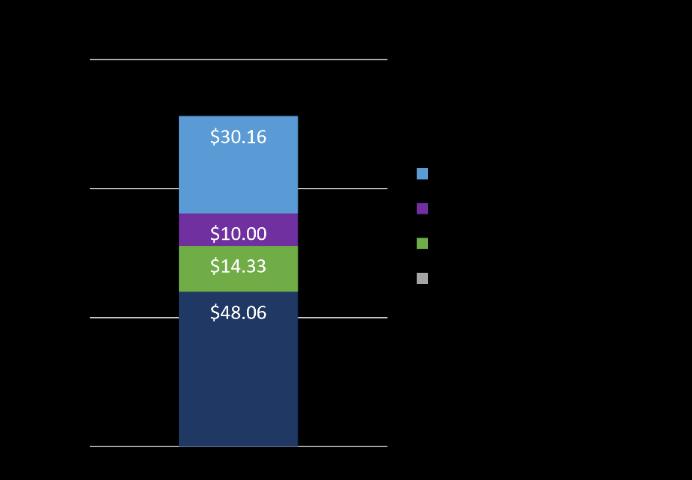
The Barriers. The barriers to deploying CCUS technology in the California cement industry are primarily economic in nature. Retrofitting an existing plant with CCUS technology is an exceptionally expensive and high-stakes endeavor. For instance, a recent study by the U.S. Department of Energy suggests that the “total overnight costs” (i.e., the base cost of construction) for capturing carbon is roughly $100 per MT of CO2 captured, which corresponds to roughly $600 - $800 million for an average-size cement plant in California.34,35 The actual “all-in” costs are likely to be substantially higher due to variety of additional factors, including escalation and interest costs during construction; ongoing operating costs; the cost of transporting and storing the carbon; the higher costs associated with labor and energy in California; and any costs associated with project delays due to the permitting or litigation. As a result, the actual costs of successfully installing and operating CCUS at a single California cement plant, especially a larger facility, could easily exceed $1 billion.36
Achieving carbon neutral cement in California by 2045 implies a total capital investment devoted to CCUS in the several billions of dollars especially given the comparatively higher costs, like labor and energy, that cement companies face in California relative to other states. Given the California cement industry’s typical payback period for large capital investments, widespread CCUS investment is a difficult prospect without public investment support and policy measures to ensure that cement produced in California is not at a significant cost disadvantage compared to cement imported from other jurisdictions.
The 2021 Infrastructure Investment and Jobs Act increased federal dollars flowing into CCUS demonstration and deployment, particularly in the context of hard-to-decarbonize sectors like cement. Additionally, in 2022, the Inflation Reduction Act expanded the 45Q tax credit to $85 for every MT CO2 sequestered in
9
Estimated Cost per Metric Ton of CO Captured
Source: Cvetic, P., Hughes, S. (2023) Analysis of Carbon Capture Retrofits for Cement Plants. United Department of Energy National Energy Technology Laboratory. 38-42 Scenario CM95-B. Link
geological formations and eased the requirements for accessing Department of Energy financing and grant funding for demonstration projects.37 Though significant, these federal investments are unlikely to be sufficient in amount and duration (for example, 45Q tax credits phase out after only 12 years of operation) to jump-start CCUS deployment in the California cement industry.38 Enhanced state support is crucial for both mitigating project risk and also complementing and catalyzing private sector investment.
Public Investment: A Key Ingredient for the Capture-Storage Value Chain
Under the broader Project Longship, efforts to retrofit the Heidelberg Materials cement plant in Brevik, Norway with industrial scale carbon capture equipment offer an illustrative example of the importance of public sector CCUS investment. Slated to be the first operational cement plant carbon capture retrofit of similar size and scale to the cement plants in California, public funding comprised roughly $2B of the total $2.7B cost of Project Longship.39 Once up and running, the project will capture and geologically store 0.4 million MT of the cement plant’s CO2 emissions per year and is the first step in establishing broader a nationwide capture and storage network that covers several emitting facilities by 2030.40 Widespread deployment of CCUS in the California cement industry would be the equivalent of eight Project Longship-scale projects over the next 20 years.
The scale of investment and lengthy payback period the cement industry must take on to deploy CCUS will require decisive policy and regulatory action to de-risk and incentivize private sector investment. For instance, the California cap-and-trade program does not include a protocol that exempts captured and sequestered or utilized carbon from compliance allocations. At a minimum, California cement producers deploying CCUS should receive a financial incentive for CO2 capture and utilization equal in value to the carbon price set by the state’s cap-and-trade market. To address the lack of financial incentives for CCUS in cap-and-trade, various stakeholders have recommended that the CARB adopt the LCFS CCS protocol (which provides a strong financial incentive for CCS deployment) for the cap-and-trade program.41 Additionally, a policy mechanism such as a border carbon adjustment will be required to ensure that California cement producers that make impactful, capital intensive CCUS investments are not at a financial disadvantage to imported cement due to their inability to pass through the cost of CCUS deployment to customers
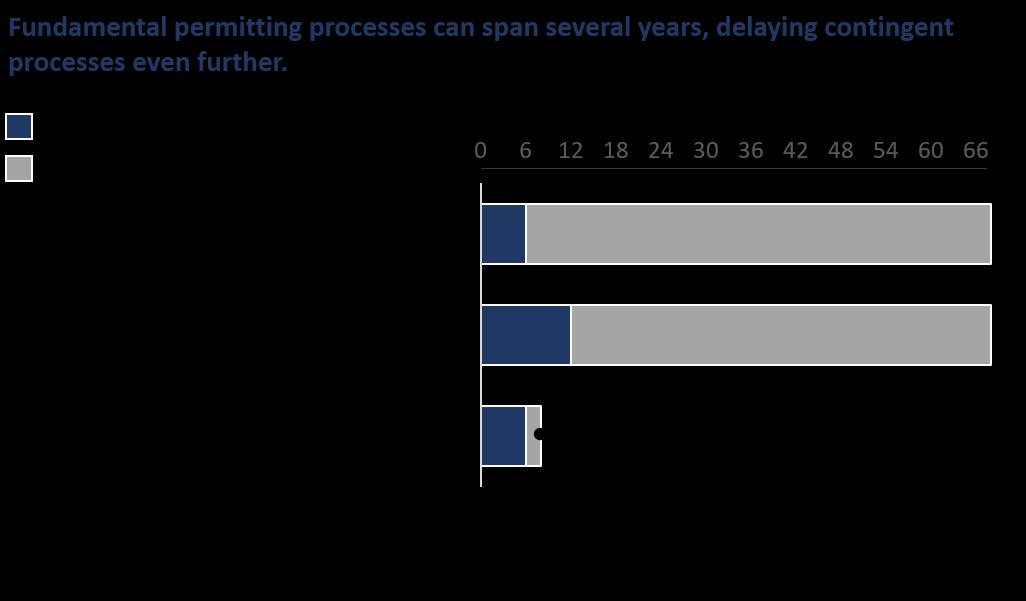
Major capital projects like CCUS are further complicated by the cost and uncertainty associated with navigating the regulatory and permitting regime A number of overlapping, time-intensive permitting requirements — including the CEQA and NEPA environmental impact review processes can span many years and cause cascading delays when one step in the process is held up or challenged 42 Specifically, state and federal reviews can take six or more years to complete and are particularly complex and unpredictable for CCUS projects, as the capture and storage of carbon may be subject to separate permitting and review processes.
Permitting Timelines for CCS Projects
10
Source: Adapted from Energy Futures Initiative. (2020). An Action Plan for Carbon Capture and Storage in California: Opportunities, Challenges, and Solutions (pp. S-9). Link
Another significant non-financial barrier to widespread CCUS deployment in the California cement industry is the ease with which project opponents can co-opt the permitting process to initiate litigation. The CEQA and NEPA review processes were designed to identify and halt projects that would do legitimate environmental harm, but they are increasingly being exploited by a variety of interest groups to halt any investment in California’s heavy industry in general.43 These legal challenges can further stretch “standard” permitting timelines and dramatically increase the uncertainty associated with construction timelines and payback periods.
Finally, successfully unlocking California’s carbon storage potential and catalyzing new markets for carbon utilization will be critical to deploying CCUS. Tapping into the state’s abundant storage capacity is a matter of investing strategically and aggressively in the necessary transportation and injection infrastructure in a way that benefits CCUS applications economy-wide. This will require achieving new levels of coordination, infrastructure investment, and carbon management planning across state agencies and stakeholders. The emergence of novel utilization pathways also offers attractive options for using captured carbon, though they too will likely require government support and incentives to succeed.
Creating a Level Playing Field & Minimizing Leakage Risk
For widespread CCUS deployment to be economically viable for the California cement industry, cement producers will need to pass a portion of the costs associated with CCUS investment through to customers to generate a reasonable and timely return on their investment. A cost increase of sufficient magnitude to support CCUS deployment will inevitably place California producers at a disadvantage relative to imported cement, even before factoring in increasing compliance costs via the declining cap adjustment factor.
In other words, CCUS deployment is virtually certain to increase leakage in the industry in the absence of actions to ensure that all cement and other cementitious materials consumed in California are subject to the same carbon costs, including cements that are produced outside and sold into the state. Establishing a market-based policy or regulation to achieve this aim (e.g., implementing a BCA or similar mechanism) would create a more level playing field with imported cement and the conditions necessary to support the long-term future of the cement industry in the state. Absent such measures, it will be difficult for the industry to “double down” on its future in California by making large, longlived capital investments in CCUS.
Steps taken now to support widespread CCUS deployment in the California cement industry will not only set the industry on the path to net neutrality by 2045 but will also position the state as a global leader in an important emerging technology and the novel policy approaches necessary to support it. In contrast, carbon neutrality will remain out of reach unless and until cost-effective CCUS technology is commercially available and economically feasible, given the otherwise limited set of options for fully addressing the industry’s process emissions.44 This raises the stakes for policymakers, regulators, industry, and other interested stakeholders to work together to problem-solve around the significant barriers that remain to widespread CCUS deployment.
11
Lever 1.C Alternative Cements & Clinkers
● Timing: Long-Term | ● Total Emissions Impact: <10%
The Opportunity. Several types of alternative cements and clinkers using novel production processes and materials are in development worldwide. The goal of these alternatives is to lower the emissions footprint of cement production by reducing clinker content with alternative binders. While the development of novel low-GHG cements and clinker alternatives is an exciting prospect, their practical long-term GHG reduction potential and performance characteristics have yet to be proven and are still in the very early stages of testing, with limited data collection to-date.
As these products and the market for them mature, their claimed GHG reduction potential will need to be rigorously verified to ensure that their theoretical GHG benefits translate into durable, net reductions in an applied context. Moreover, the achievable substitution potential of these new products remains unclear, in large part due to the lack of available raw materials to produce them at scale 45 As a result, the potential for alternative cements and clinkers to contribute to achieving net carbon neutrality by 2045 is likely to be limited. Even in its most ambitious scenario, Cembureau (an association of European cement manufacturers) projects that alternative cements and clinkers will play a very minor role in achieving deep decarbonization of cement production.46,47 Other industry stakeholders and decarbonization roadmaps are even less optimistic, predicting that alternatives will account for just 1% and 5% of global cement production in 2030 and 2050 respectively, and drive a mere 0.5% reduction in overall industry CO2 emissions.48
The Barriers. The primary obstacle to unlocking dramatic emissions reductions using this decarbonization lever will be the ability to unlock production at scale. Alternative cements are produced mostly by smaller, startup companies using innovative techniques, materials, and processes outside the bounds of the traditional portland cement supply chain. For example, alternative cements that are currently on the market require a specialized production environment that cannot be replicated by traditional cement plants, and raw materials that can be significantly less naturally abundant and easily accessible than limestone and gypsum.49,50 These factors combine to create immense financial and operational barriers to deploying alternative cements at a sufficient scale to meaningfully mitigate the cement industry’s emissions
Unlocking large scale production also requires developing customer trust in the safety and performance characteristics of alternative cements. Demonstrating safety and performance characteristics for largescale projects will require not only significant testing, but likely also further development of the current menu of alternative cement products. Many alternative cement products in development today primarily serve precast concrete or more niche, non-structural needs limiting their practical potential to serve as a true substitute for conventional cement. Moreover, products geared toward use in structural projects must undergo a rigorous testing regimen and gradually build a real-world track record that convinces stakeholders throughout the construction supply chain that long-term safety and performance will not suffer.
Alternative cements and clinkers may have a role to play in decarbonizing the California cement industry, but the extent and timing of that role remains highly uncertain. In the very long term, the production and development of alternative cements and clinkers will continue to broaden the industry’s options to produce low-GHG clinkers and cements. However, on the timeline needed to reach net zero by 2045, the use of these materials will likely remain limited to non-structural niche applications.51
12
Process Emissions Policy Recommendations
• Establish public-private RD&D partnerships to incentivize industry investment in capital intensive processing infrastructure for emerging SCMs particularly, natural pozzolans and calcined clays and accelerate the deployment of blended cements that use these materials.
• Invest in research and incentives for the recovery and reuse of previously landfilled materials as SCMs, such as research into the potential of ash pond mitigation efforts and beneficial use opportunities from Coal Combustion Residual landfills.
• Support efforts to move toward blended cement specifications that provide manufacturers the flexibility to produce cements that meet performance characteristics through the lowest GHG option best suited for specific plants.,
• Provide substantial financial support and incentives for CCUS RD&D (e.g., favorable financing options, targeted RD&D grants for pilots and demonstrations, funding for FEED studies to evaluate projects, tax credits or other incentives) to address the financial challenge of CCUS investment and accelerate industry deployment of CCUS technology.
• Incorporate a carbon capture protocol into the state’s cap-and-trade program to ensure that the carbon price signal helps support and incentivize CCUS deployment among covered entities.
• Convene relevant state agencies to direct aggressive investment into economy-wide carbon transportation and storage to develop a carbon management infrastructure that helps foster economies of scale for carbon storage in the region.
• Streamline, accelerate, and de-risk the permitting process for projects with clear GHG benefits (particularly CCUS) to avoid inefficiencies, minimize the possibility of long delays based on litigation or regulatory contingencies, and facilitate rapid deployment of industry levers consistent with 2045 decarbonization deadlines.
• Coordinate oversight of the cement industry among relevant state agencies to ensure that misalignment between varied regulatory stakeholders does not result in uncertainty, conflicting guidance, or project delays.
See Appendix - Exhibit 2 for a comprehensive list of recommendations by relevant actor.
13
PATHWAY 2. REDUCING COMBUSTION EMISSIONS
Combustion emissions represent roughly onethird of the cement industry’s direct GHG emissions. Combustion emissions are driven by two key factors: (1) the energy efficiency of the cement production process and (2) the GHG emissions intensity of its fuel mix The industry has significantly improved the former by making major capital investments in plant performance and production efficiency and installing the most energy efficient kiln technologies (e.g., preheater/precalciner kilns). As a result, energy efficiency improved by nearly 30% between 2000 and 2018. The GHG intensity of fuels has also improved over the past two decades, albeit at a much slower rate.
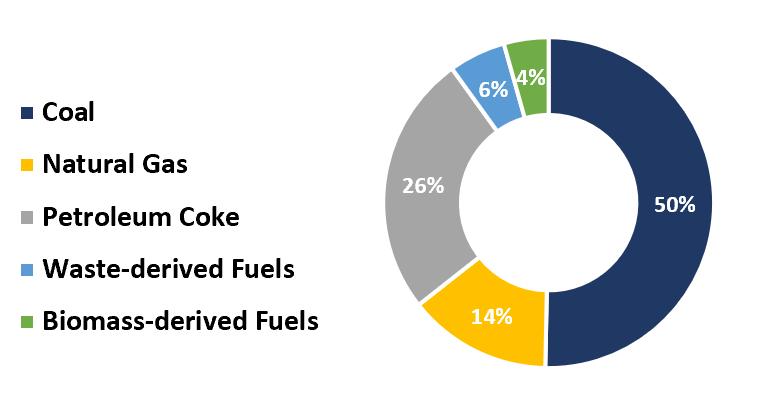
California Cement Industry Energy Content, by Fuel (2020)
The industry’s continued reliance on fossil fuels reflects several factors, including the extremely high process heat needs of the cement production process (kilns must sustain temperatures of 1,800 to 2,000 degrees Celsius), relative fuel prices, and a series of policy, regulatory, and other barriers to using alternative fuels With these considerations in mind, reducing the California cement industry’s combustion emissions footprint is fundamentally a question of how to dramatically and sustainably reduce its reliance on coal and pet coke and switch to renewable natural gas, refuse-derived fuels, biomass-derived fuels, and other lower-carbon alternatives.
A number of transformative technologies on the horizon (e.g., kiln electrification, solar thermal energy, and green hydrogen applications) could also offer long-term promise for meeting the industry’s high process heat requirements and unlocking decarbonization of the industry’s combustion emissions. Across these technologies, a small number of early-stage projects have moved forward, shifting these approaches into the “proof of concept” phase, and revealing potential pathways toward industrial applications over the long term.52 Successful RD&D efforts to address these challenges today could have tremendous implications decades from now. However, given that they remain far from commercial viability and face significant barriers to implementation, they are unlikely to make substantial contributions to achieving net carbon neutrality by 2045. Accordingly, these transformational technologies are not addressed in detail in this report
The following sections examine the opportunities, emissions-reduction potential, and barriers associated with higher rates of alternative fuel use including tire-derived fuel, engineered municipal solid waste (EMSW), and biomass-derived fuels and the introduction and integration of renewable natural gas into the industry’s fuel mix. In sum, these alternative fuel sources are essential to both mitigating combustion emissions from cement manufacturing and increasing the circularity of the California economy by avoiding the harmful environmental impact of landfilling through waste-to-energy conversion.

14
Source: California Air Resources Board (2022). Greenhouse Gas Emission InventoryQuery Tool for years 2000 to 2020 (15th Edition). Link
Alternative Fuel Use in the California Cement Industry
Alternative fuels (e.g., derived from refuse and biomass) have significant untapped potential for achieving GHG reductions in the California cement industry, where alternative fuels accounted for less than 10% of heat content as of 2018.53
Unfortunately, regulatory conditions in California stymy more aggressive alternative fuel use. As a result, California cement plants lag far behind the rest of the world, and even other U.S. states, in terms of switching to a mix of lower carbon alternative fuels. For example, conventional fossil fuels (i.e., coal, pet coke, diesel, and natural gas) accounted for less than one-third of total thermal energy consumption in the German cement industry.54 European markets demonstrate the vast potential of alternative fuels to replace fossil fuels and reduce combustion emissions. In many European markets, alternative fuels account for more than half of average fuel input.55,56
Fuel Mix Composition, United States vs. Select European Markets (2018), % of Thermal Energy
Achieving carbon neutrality in the California cement industry will require fuel substitution with alternate fuels in line with global cement industry peers, which in turn will require addressing significant regulatory and public acceptance barriers.
Lever 2.A Renewable Natural Gas
● Timing: Medium-Term | ● Total Emissions Impact: 20-40% (additive potential with other fuel switching measures)
The Opportunity. Renewable natural gas (RNG) is becoming an increasingly attractive substitute for fossil fuels in the cement industry. Functionally identical to conventional (i.e., fossil-based) natural gas, RNG offers significant GHG benefits without the added difficulty and cost of the on-site processing and equipment upgrades needed to handle many other lower carbon alternatives. Compared to conventional natural gas, RNG likely has a longer and costlier path to full deployment. However, unlike conventional natural gas, RNG unlocks the possibility of producing cement with net zero combustion-related emissions.57
RNG consists of methane captured primarily from landfills, dairies, and treated wastewater that is then processed to meet the performance characteristics of conventional natural gas.58,59 Given that methane is a substantially more potent GHG than CO2 at trapping heat in the atmosphere, the act of capturing methane and repurposing it as a fuel creates significant climate benefits. In fact, depending on the source of methane, RNG can have a negative carbon intensity, as its production and consumption results in fewer GHG emissions than what would otherwise occur.60
Although RNG is likely to remain a relatively niche fuel source, supply is expected to increase significantly over the coming decades. According to some estimates, there will be approximately 197 billion cubic feet (bcf) per year of RNG available to the California market by 2030.61 To put that into perspective, that level of supply would satisfy less than 10% of California’s annual natural gas demand.

15
0% 25% 50% 75% 100% United States Italy Spain United Kingdom France Poland Czech Republic Germany Austria FossilFuel Biomass AlternativeFossil&MixedWastes
Source: WBCSD Getting the Numbers Right Reporting Project. See data series “Thermal energy consumption by fuel category” (25aAGFC). Link
In short, RNG is a versatile fuel with many possible uses and significant climate benefits, but limited ability to scale. This profile heightens the importance of using RNG supplies efficiently and directing them toward difficult-to-decarbonize sectors that have high process heat requirements and limited options for electrification, such as cement. According to the Energy Future’s Initiative, the California cement industry could reduce its combustion emissions by half if it consumed just 8% of the state’s estimated RNG supply.62
The Barriers. The primary barrier to RNG deployment is cost and, under current conditions, the cement industry would require substantial financial incentives in order for switching to RNG to be economically feasible. Prices vary widely by feedstock and producer landfill gas is generally the lowest cost source to upgrade to RNG and dairy digester gas is the highest and it is not yet cost competitive with fossil natural gas. Indeed, the cost of upgrading captured methane to pipeline-quality RNG can sometimes exceed the total cost of conventional gas. A 2017 UC Davis study found that RNG requires $3.90 - $27.00 per bcf in subsidies to be cost competitive with natural gas.63 In contrast, the California natural gas industrial price has averaged $10.20 per bcf over the last three years. Although recent sharp increases in natural gas prices have narrowed the difference, the cost of RNG remains well above economically feasible levels.64
Although the California Low Carbon Fuel Standard (LCFS) directly subsidizes RNG production and reduces customer cost, it only subsidizes RNG used as a transportation fuel. As a result, cement plant managers do not have competitive access to RNG supplies.65 While the cement industry would accrue benefits from RNG usage under the state’s cap-and-trade program, LCFS credits are assigned more than double the value per ton of CO2 of cap-and-trade credits.66 The wide gap in incentives between the LCFS and cap-andtrade effectively disincentivizes cement industry efforts to switch from fossil fuels to RNG.
Although RNG can be used to decarbonize a wide range of industries, the cement industry has a compelling case to be among the highest priority destinations for the state’s limited RNG supply. To use the transportation sector as an example, while RNG is a useful carbon neutral (or negative) fuel source, the transportation sector can also achieve the same results via electrification or hydrogen. The cement industry, on the other hand, cannot yet be electrified or decarbonized through another fuel source offering similar benefits or costs. Policies and regulations that prioritize RNG use within difficult-to-decarbonize industries such as cement and reduce costs for end users are essential to ensure that California maximizes the climate benefits associated with its limited RNG supply.
The California Air Resources Board 2022 Scoping Plan Update recognizes the mismatch between current uses and the most beneficial applications, mentioning, “[RNG] currently displaces fossil fuels in transportation and will largely be needed for hard-to-decarbonize sectors…”.67 Notably, the Scoping Plan prescribes RNG injection directly into pipelines for easy access by industrial customers. By explicitly recognizing RNG as a solution to industrial decarbonization, the Scope Plan underscores the need for relevant stakeholders to craft policy, regulatory, and market support measures to direct economically feasible RNG to the California cement industry and other difficult-to-decarbonize sectors.
Lever 2.B Refuse-Derived Fuels
● Timing: Near-Term | ● Impact: 20-40% (additive potential with other fuel switching measures)
The Opportunity. Two refuse-derived fuels with the highest potential to displace fossil fuel use in the California cement industry are: (1) engineered municipal solid waste (EMSW) and (2) tire-derived fuels While these fuels face intersecting challenges and benefits, each also has unique characteristics and faces a distinct operating reality that defines its potential in terms of fossil fuel displacement.
16
• Engineered Municipal Solid Waste. EMSW is generally comprised of the refuse produced in homes, offices, and commercial buildings, provided that it meets several criteria for processing and post-conversion characteristics that are established by the California Public Resources Code.68,69,70 EMSW is a viable lower-carbon alternative to fossil fuel use in the cement industry with an estimated maximum substitution rate of roughly 30% of a plant’s fuel mix, subject to the preprocessing steps undertaken and the unique characteristics of the specific feedstock.71,72 EMSW produces a “dual benefit” in terms of GHG emissions: (1) it displaces the use of more GHG intensive fossil fuels and (2) it diverts refuse from landfills, where it would otherwise decompose to produce methane. EMSW also has a significant biomass component; in recent years CARB has applied a biogenic fraction of 66%.73 Finally, due to the extreme heat needed for calcination, a cement kiln effectively consumes the entire fuel and results in zero residual material.
• Tire-derived fuel. As with EMSW, tire-derived fuels have the same multi-dimensional benefits in terms of direct emissions mitigation and landfill diversion. Also like EMSW, tire-derived fuel has a non-trivial biomass component, with CARB applying a biogenic fraction of 25% to fuel combustion emissions from tires in 2018.74 The upper threshold of tire-derived fuel substitution is an estimated 20-30% of thermal energy consumption, due to its potential to impact the properties of the cement product and its combustion characteristics.75,76 Using refuse tires for cement manufacturing combustion also provides the unique benefit of capturing the inorganic parts of the material. Indeed, used tires are “often cited as the best example of an alternative fuel for use in the cement industry,” given their relatively high homogeneity, a cement plant’s ability to capture iron oxide in the raw production mix, and the high calorific value associated with tires.77
In combination, EMSW and tire-derived fuel can contribute significant reductions toward the cement industry’s combustion emissions profile. Reaching a reasonable maximum substitution capacity (50% to 60%) for refuse products as fuel feedstocks would displace nearly 1 million MT of coal and pet coke emissions. Such a substantial level would represent a roughly eight-fold increase in current levels of refusederived fuel combustion.
While refuse-derived fuels will play a different role for individual plants as operators “mix and match” solutions to achieve GHG abatements, achieving the maximum degree of emissions abatement will require concerted and aggressive action to address barriers described below.
The Barriers. The primary barriers to ramping up refuse-derived fuel consumption in the California cement industry are regulatory and statutory hurdles. Specifically, the state’s classification of waste products and definition of what qualifies as diversion from landfills presents a formidable barrier to a plant’s ability to convert waste materials for fuel use. Existing California law prefers diversion of solid waste, with a statewide goal of achieving 75% diversion of solid refuse through reduction, recycling, or composting.78 However, EMSW fuel conversion does not qualify as diversion toward this goal.79,80 As a result, refuse diversion for fuel uses is neither expressly supported nor pursued, and most waste flows to landfills despite a demand for refuse-derived feedstocks that far exceeds supply.
The second major barrier to increased use of alternative fuels is the permitting process. The barrier is particularly high for refuse-derived feedstocks, which often face starker public acceptance challenges. While alternative fuel use is among the most promising pathways for achieving near-term emissions reductions in the cement industry, the permitting timeline for reviewing and approving onsite processing facilities, storage capacity, and/or retrofits to existing plant equipment to handle refuse-derived fuels contributes to a significant lag between feasibility of reductions and implementation.
17
The Role of Plastics in Alternative Fuels
It is important to understand the significant role that plastics, which are well-suited to fuel substitution due to high heat contents and represent a “growing segment of MSW” nationwide, play in achieving substitution rates comparable to jurisdictions in the EU and elsewhere.81 For example, the German cement industry’s progress in displacing fossil fuels through alternative fuel substitution has been largely driven by contributions from refuse-derived fuels, including plastics.82 While countries like Germany have safely utilized waste-to-energy activities as an alternative to landfilling wastes with high plastic content, the U.S. faces a growing plastics recycling challenge. In 2018, the U.S. landfilled 27 million tons of plastic, accounting for nearly 20% of all MSW landfilled.83 An estimated 4.5 million tons of plastic were landfilled in California as of 2018 accounting for a growing share of total waste disposal.84
At the state level, the CEQA environmental impact review (EIR) process notoriously drives significant project delays, at times stretching over multiple years.85 The process, which introduces a public review and comment period, is triggered by projects that would pose a significant change from the plant’s last environmental impact analysis. However, the scope of CEQA jurisdiction and the discretion that air districts have when pursuing the EIR process means that reviews can be triggered by a wide range of investments, from large-scale projects such as major kiln upgrades to relatively minor operational improvements such as infrastructure for fuel delivery truck use. The CEQA EIR process typically spans 18 to 24 months, but projects lacking public acceptance can run into significant delays due to the public review and comment period. Significant public opposition can potentially extend the EIR process to upwards of five years. In the context of alternative fuels, CEQA can drive undue delay for improvements that could otherwise be implemented relatively swiftly.
At the federal level, the new source review (NSR) process and associated Title V operating permit revisions can also slow, and ultimately discourage, investments in GHG abatement measures including for the infrastructure needed to support significant alternative fuel switching. Companies report having spent multiple years on permitting related to alternative fuel use under the NSR process a costly source of investment uncertainty — that ultimately delayed, and in some cases deferred, GHG-reduction through fuel switching.
Across the board, permitting processes for fuel-switching often impose requirements that are disconnected from the realities of managing a cement plant. Specifically, plants looking to fuel switch can face steep learning curves associated with a new fuel source that require the ability to adjust and tweak processes in real time. In contrast, permitting processes both the lengthy and unpredictable CEQA EIR and the prescriptive NSR process provide plants with little flexibility or accommodation if they are to receive their permits in a timely manner.
The unpredictability of the permitting process is compounded by other rules that work against what would otherwise be a relatively straightforward and near-term emissions reduction strategy for the cement industry. Rules that limit the ability of plants to store refuse on site can inadvertently constrain fuel-switching by constraining a plant’s ability to manage and optimize its refuse fuel supply chain. And federal criteria for defining refuse effectively constrain the possible universe of refuse that can be used to meet thermal energy needs. Specifically, if proposed refuse-derived feedstocks qualify as a “solid waste” a definition that is applied to wastes that are legally considered “discarded,” according to criteria prescribed by the Non-Hazardous Secondary Material Regulations under Resource Conservation and Recovery Act (RCRA) a plant is no longer subject to the typical set of National Emission Standards for Hazardous Air Pollutants
18
(NESHAP) rules and is instead treated as a Solid Waste Incineration Unit.86 Given that “discarded” feedstocks trigger this significant rule shift, plants opt to utilize non-discarded sources instead, which can introduce significant additional processing requirements to ensure that materials are sufficiently transformed. This rule poses a challenge to expanding use of tires in the combustion process in particular, as the supply landscape for pre-processed tires is quite limited.
In addition to these definitional, classification, and permitting challenges, low landfill tipping fees in California create perverse waste management incentives that support landfilling over other beneficial end uses for waste, and effectively limit cement plants’ EMSW supply.87,88 A 2015 CalRecycles study of rates for disposal tipping fees at California landfills found that landfills were likely the cheapest path for materials to flow down. By comparison, average total tipping costs in the EU were, at the time of the CalRecycles study, roughly twice those in California. Not only do many EU states levy relatively high landfill taxes, they also actively promote waste-to-energy activities. As a result, many have successfully diverted large shares of waste from landfills and successfully moved it “up the waste hierarchy.”89
As of 2018, EU cement plants sourced half of their alternative fuel mix from refuse-derived fuel, accounting for roughly 15% of total heat content.90 By contrast, as a result of the restrictive classifications, rules, and incentives in the California market, diversion of waste for fuel end uses in the cement industry and other industrial applications remains a second-class pathway for achieving emissions and environmental goals, despite the real benefits refuse-derived fuels would unlock in terms of lower GHG emissions, reduced fossil fuel use, and increased diversion from landfills.
Dramatically increasing the use of refuse-derived fuels can require significant capital investments, including investments in processing capacity for handling different waste materials, as well as related handling, loading, transportation, and storage needs. While the capital expenditures and related waste management costs are secondary to the outstanding regulatory challenges, they do represent a final hurdle to boosting alternative fuel use in the industry. For example, one estimate of the capital expenditure required to facilitate use of tire-derived fuel at a cement plant ranges from $1-4 million, depending on capacity and other design considerations.91,92 Estimates of the cost required to enable EMSW is even higher, on the order of $15-30 million.
Lever 2.C Biomass-Derived Fuels
● Timing: Near-Term | ● Total Emissions Impact: 20-40% (additive potential with other fuel switching measures)
The Opportunity. Biomass encompasses a wide range of organic matter (e.g., nut shells, rice husk ash, refuse wood, food refuses) that can be used as alternative fuel feedstocks in the cement manufacturing process. The heat content and other combustion characteristics of biomass fuel sources vary significantly, affecting how each can most efficiently be deployed in the cement production process. The potential substitution rate also varies by geography and season, as different regions have access to different types of feedstocks at different times of the year 93 In California, the biomass feedstocks typically used by the industry include agricultural refuse (e.g., rice husks), forest-derived wood and wood refuse, and wood and wood products.
Biomass feedstocks are plentiful in California. Researchers at Lawrence Livermore National Laboratory estimate that, by 2045, the annual available quantity of agricultural residue and forest biomass in California will be roughly 37M bone dry tons annually — roughly 30 to 40 times the industry’s current yearly thermal energy requirements.94,95
19
Increased use of biomass-derived fuels would drive GHG reductions in the cement industry by displacing fossil fuels without generating emissions that are new to the carbon cycle. Unlike fossil fuels, biomass fuels do not introduce additional carbon to the carbon cycle and can be considered carbon neutral under many scenarios.96,97 Utilization of forest biomass in particular provides the added benefit of supporting the California Carbon Forest Plan by improving forest health and wildfire protection, as well as minimizing the state’s harmful black carbon emissions. 98 While the maximum substitution rate of biomass-derived fuel varies by type, a range of 20-30% is a reasonable threshold.99,100
The Barriers. Given the abundance of biomass across the state and given its GHG-reduction potential, the key challenge remains an absence of a concerted and coordinated effort to accept and encourage expedient and aggressive biomass utilization. Instead, plants report facing permitting challenges, a lack of clarity, and other regulatory pushback to efforts to ramp up biomass use. For example, proposals to use biomass refuse including those that would address fire hazards stemming from infected forest biomass — generally meet a lack of understanding and support from regulators, while ambiguity related to California’s emissions accounting process for newly proposed biomass-derived fuel sources (e.g., biochar) presents a hurdle to utilization. This unfolds as efforts to boost biomass-derived fuel usage also face similar protracted permitting timelines and challenges to those described in the refuse-derived fuels section above. Meanwhile, cement industries across the world with support from local policymakers have identified numerous opportunities to incorporate a diverse array of biomass-derived fuels for combustion in cement manufacturing, far outstripping the California industry.
In addition, the collection and distribution network for biomass feedstocks is not robust enough to facilitate distribution at scale, creating a supply challenge driven by high sourcing costs. For example, Cal Fire has cited the need for larger incentives for collection and transportation of woody biomass as a key challenge facing energy conversion, noting that the current system for utilization in which proximity is the key cost factor does not adequately cover costs.101 Steps to improve collection and transportation of biomass feedstocks (e.g., through investments in advanced harvesting techniques and distribution networks) would boost availability, reduce costs, and in turn improve the economics of biomass utilization.102
Combustion Emissions & Fuel Switching Policy Recommendations
• Create incentives to prioritize RNG for use in the cement industry, consistent with CARB’s Scoping Plan’s recognition of the mismatch between current RNG use in the transportation sector and its most beneficial applications in hard-to-decarbonize sectors.
• Identify opportunities to reduce the permitting burden of key regulatory frameworks. In particular, consider options to more swiftly move forward projects that offer clear, near-term GHG savings.
• Update definitions within the California Public Resource Code to expressly support diversion of municipal solid waste for use as fuel feedstock in the cement industry.
• Increase tipping fees (e.g., landfill taxes) to remove disincentives to a more robust menu of waste diversion opportunities, including fuel conversion.
• Pursue a policy solution to boost the use of tire-derived fuel as a waste-derived fuel feedstock in cement production, for example, by creating a carve-out for tires in the current RCRA framework or subsidizing collection and pre-processing of tires for NESHAP compliance.
20
• Subsidize the development of a biomass collection & distribution network to support utilization of organic matter particularly woody materials and agricultural wastes as fuel feedstocks, including both investments in transportation and technologies to support efficient harvesting.
• Provide financial support and incentives for RD&D (e.g., support for demonstration projects, favorable financing options, targeted RD&D grants) to catalyze and accelerate existing efforts toward renewables applications for meeting process heat needs in a cement kiln.
• Establish an interagency coordinating group to streamline fuel switching efforts and deconflict regulatory issues preventing cost effective substitution of fossil fuels.
See Appendix - Exhibit 2 for a comprehensive list of recommendations by relevant actor.
21
PATHWAY 3. REDUCING ELECTRICITY-RELATED EMISSIONS
The electricity-related portion of the California cement industry’s GHG footprint has benefited from sustained investments in energy efficiency and improvements in plant performance over time, as well as concurrent decarbonization of the state’s energy grid. Electricity is a major cost driver for cement plants, meaning firms are naturally motivated to invest in efficiency measures that lower operating costs while also reducing GHG emissions. Rapidly increasing industrial electricity rates over the past two years, as well as grid instability, have only reinforced this motivation.
The resulting investments in electricity efficiency measures including capital investments in equipment upgrades and retrofits has unlocked incremental improvements in the industry’s GHG profile. This progress has been buttressed by the relatively rapid decarbonization of California’s electric grid. For instance the GHG intensity of electricity consumed in the state nearly halved in the decade leading up to 2018. In combination, these factors have meaningfully improved the industry’s electricity emissions profile. While the electricity-related emissions are a small minority (less than 10%) of the industry’s total GHG emission footprint, the measures described in the following section represent opportunities to build on existing progress and more aggressively achieve emissions reductions. In each case, the abatement lever represents an opportunity for a shift toward more on-site generation capacity by using renewable or recovered thermal heat from the cement manufacturing process that displaces some electricity demand with carbon-free power.
Lever 3.A Waste Heat Recovery & Cogeneration
● Timing: Near-Term | ● Total Emissions Impact: <10%
The Opportunity. Waste heat recovery (WHR) refers to the process by which excess thermal energy captured during clinker production is directed to power gas turbine generators to supply electricity to the cement plant. Removing barriers to WHR for the California cement industry would unlock options to drive down demand for electricity from the grid while reducing indirect GHG emissions. An analysis of the GHG abatement potential of WHR using the most applicable technology for the California cement industry suggests that 20-40% of the cement plant’s power needs could be met by WHR, resulting in energy savings of roughly 40–60 million kWh annually per plant.103,104
Lever 3.B Onsite Renewable Electricity Generation
● Timing: Near-Term | ● Total Emissions Impact: <10%
The Opportunity. Onsite (or “behind-the-meter”) renewable electricity generation enables cement facilities to produce electricity to meet some or all of their electricity needs while driving down their indirect emissions. Onsite generation can be achieved by a wide range of possible technology and source energy configurations including wind turbines, solar photovoltaics, solar hot water heating, geothermal, and fuel cells (relying on green hydrogen) though wind and solar remain the most popular and feasible sources for renewable electricity generation at cement plants.105
For the California cement industry, removing barriers to on-site generation would yield GHG savings in the range of tens of thousands of MT of CO2 annually, as well as related operational benefits such as the ability to operate during public safety shutoffs (e.g., due to wildfire threats). As of 2018, the industry consumed in the range of 1.4 million MWh of electricity, generating roughly 300,000 MT of CO2. 106,107
The Barriers. For the cement industry, the decision to invest in distributed energy production, whether WHR or on-site renewables, is fundamentally driven by economics and substantially impacted by
22
regulations. Specifically, a company’s ability to achieve an adequate return on its investment in distributed generation is limited by California’s regulatory framework in the electricity sector In fact, industry members report that the regulatory landscape is a significant and at times cost-prohibitive barrier to adoption of WHR systems and onsite renewable generation.

California’s existing electricity regulatory regime imposes unavoidable costs via non-bypass-able charges, which make investments in self-generation financially unappealing. Facilities that seek to reduce their direct electricity purchases by engaging in “customer generation” (i.e., WHR and on-site renewables not interconnected via net metering) are subject to a series of unavoidable, non-bypass-able charges from their utility. Notably, California remains one of very few states applying “departing load” charges to customer-generators.108 While these fees are intended to represent costs previously bundled into service bills, in practice, they distort the cost-benefit calculations for investments in new self-generation capacity and make distributed generation less economical. 109 An assessment published by the California Energy Commission found that the departing load fee schedule significantly mutes costs savings from deploying WHR and concluded that removing standby rates and departing load charges would lead to far more capacity additions than a status quo scenario.110 ,111
Additional financial and regulatory barriers further limit the deployment potential of self-generation. In the case of WHR, system installations benefit from economies of scale, but cement plants in California (and in the United States more broadly) are typically smaller than their counterparts in Asia and elsewhere. As a result, the cost per installed kilowatt of power is relatively high, especially compared to costs in markets in Asia, which benefit from the efficiencies of larger systems and a more cost-competitive Chinese industry for WHR technology.112
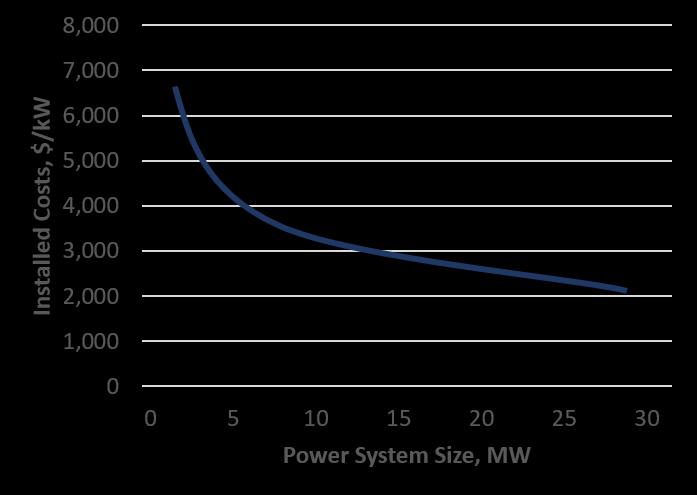
Finally, investments in WHR systems face a significant, outstanding obstacle in the form of a slow and cumbersome permitting process. Investments in WHR capacity require updating plants’ Title V operating permits under the Clean Air Act, a process that typically spans multiple years. WHR additions also exceed the threshold that triggers the CEQA EIR process. Combined with regulatory disincentives and high capital costs, the time horizon associated with permitting means that these projects currently operate with highly uncertain timelines for return on investment.
Despite financial barriers to WHR and renewable energy deployment, electricity rates in California have been on a steep upward trajectory since 2021 and, as a result, the economics of investment for cement industry deployment of distributed energy has improved. With no sign of relief from escalating electricity costs, removing excessive regulatory burdens that disincentive industry investment in onsite generation can create a trifecta of benefits: fewer GHG emissions, less reliance on fossil fuels, and reduced stress on the state’s already congested electric power grid
23
WHR Installed System Cost Curve
Source: Gorbatenko, Y., Hedman, B. A., Shah, J. V., & Sharabaroff, A. (2014). Waste heat recovery for the cement sector: market and supplier analysis (No. 46211, pp. 1-90). The World Bank. Link
Electricity Generation Policy Recommendations
• Phase out departing load charges that would be levied on cement facilities generating a portion of their own electricity using carbon neutral technologies (WHR, on-site renewables).
• Establish financial incentives and expand eligibility for existing programs that support investments in customer generation systems grants, loan guarantees, and/or financing support that would help ensure cost-effective industry deployment (e.g., the California Public Utility Commission’s SelfGeneration Incentive Program, Renewable Energy Credits).
• Reevaluate the regulatory process for new investments in renewable energy generation or WHR systems to help ensure that projects with clear GHG benefits can move forward smoothly and quickly.
• Evaluate opportunities to fund a WHR demonstration project at a California cement plant in order to help overcome the “first mover” barriers and share a playbook for future investments.
• Review existing programs and incentives supporting distributed energy generation with the goal of ensuring that they are inclusive of cement industry applications of WHR.
See Appendix - Exhibit 2 for a comprehensive list of recommendations by relevant actor.
24
CONCLUSION
The California cement industry continues to encounter significant barriers to investing in and deploying emissions reduction levers that would enable it to continue pursuing GHG emissions reductions toward a 2045 goal of carbon neutrality. Many of the technologies, fuels, materials, and processes for drastically reducing the industry’s emissions footprint already exist. However, the barriers outlined in this report including regulatory and permitting hurdles, market acceptance barriers, cost challenges, supply limitations, and technology constraints delay or constrain their deployment and limit their impact.
Charting a feasible course to carbon neutrality will require concerted action that requires a flexible, “allof-the-above” approach to addressing these barriers and unlocking these emissions reduction levers Such an approach is critical, because the ability to achieve industry-wide decarbonization relies on creating a level of flexibility and choice that enables each plant to select and invest in the combination of GHG abatement measures that meets its unique needs and circumstances. Unlocking such a diverse set of measures will require close collaboration between the decision-makers and stakeholders that shape the policy landscape and marketplaces in which the industry operates.
By working together to unlock the pathways toward net neutrality, the California cement industry, policymakers, and other stakeholders can showcase and further advance the state’s role as a leader in ambitious climate policy. In doing so, they have the opportunity to help set a template for cement industry decarbonization that may have ripple effects that extend far beyond state lines. The California cement industry is committed to working with policymakers, regulators, developers, engineers, architects, advocates, and others to display this leadership and advance solutions to the barriers outlined in this report to achieve carbon neutrality by 2045
25
APPENDIX
Exhibit 1: Policy Recommendations, By Section
Process Emissions Policy Recommendations
• Establish public-private RD&D partnerships to incentivize industry investment in capital intensive processing infrastructure for emerging SCMs particularly, natural pozzolans and calcined clays and accelerate the deployment of blended cements that use these materials.
• Invest in research and incentives for the recovery and reuse of previously landfilled materials as SCMs, such as research into the potential of ash pond mitigation efforts and beneficial use opportunities from Coal Combustion Residual landfills.
• Support efforts to move toward performance-based cement specifications that would afford cement producers the flexibility to produce cements that meet performance characteristics through the lowest GHG option, rather than producing to meet prescriptive specifications.
• Provide substantial financial support and incentives for CCUS RD&D (e.g., favorable financing options, targeted RD&D grants for pilots and demonstrations, funding for FEED studies to evaluate projects, tax credits or other incentives) to address the financial challenge of CCUS investment and accelerate industry deployment of CCUS technology.
• Incorporate a carbon capture protocol into the state’s cap-and-trade program to ensure that the carbon price signal helps support and incentivize CCUS deployment among covered entities.
• Convene relevant state agencies to direct aggressive investment into economy-wide carbon transportation and storage to develop a carbon management infrastructure that helps foster economies of scale for carbon storage in the region.
• Streamline, accelerate, and de-risk the permitting process for projects with clear GHG benefits (particularly CCUS) to avoid inefficiencies, minimize the possibility of long delays based on public litigation or regulatory contingencies, and facilitate rapid deployment of industry levers consistent with 2045 decarbonization deadlines.
• Coordinate oversight of the cement industry among relevant state agencies to ensure that incongruities between varied regulatory stakeholders does not result in uncertain or conflicting guidance –or project delays.
Combustion Emissions & Fuel Switching Policy Recommendations
• Create incentives to divert RNG for use in the cement industry, consistent with the Scoping Plan’s recognition of the mismatch between current RNG use in the transportation sector and its most beneficial applications in hard-to-decarbonize sectors.
• Identify opportunities to reduce the permitting burden of key regulatory frameworks. In particular, consider options to more swiftly move forward projects that offer clear, near-term GHG savings.
• Update definitions within the California Public Resource Code to expressly support diversion of municipal solid waste for use as fuel feedstock in the cement industry.
26
• Increase tipping fees (e.g., landfill taxes) to remove disincentives to a more robust menu of waste diversion opportunities, including fuel conversion.
• Pursue a policy solution to boost the use of tires as a waste-derived fuel feedstock in cement production, for example by creating a carve-out for tires in the current RCRA framework or subsidizing collection and pre-processing of tires for NESHAP compliance.
• Subsidize the development of a biomass collection & distribution network to support utilization of organic matter particularly woody materials and agricultural wastes as fuel feedstocks, including both investments in transportation and technologies to support efficient harvesting.
• Provide financial support and incentives for RD&D (e.g., support for demonstration projects, favorable financing options, targeted RD&D grants) to catalyze and accelerate existing efforts toward renewables applications for meeting process heat needs in a cement kiln.
• Establish an interagency coordinating group to streamline fuel switching efforts and deconflict regulatory issues preventing cost effective substitution of fossil fuels.
Electricity Generation Policy Recommendations
• Phase out departing load charges that would be levied on cement facilities generating a portion of their own electricity using carbon neutral technologies (WHR, on-site renewables).
• Establish financial incentives and expand eligibility for existing programs that support investments in customer generation systems grants, loan guarantees, and/or financing support that would help ensure cost-effective industry deployment (e.g., the California Public Utility Commission’s SelfGeneration Incentive Program, Renewable Energy Credits).
• Reevaluate the regulatory process for new investments in renewable energy generation or WHR systems to help ensure that projects with clear GHG benefits can move forward smoothly and quickly.
• Evaluate opportunities to fund a WHR demonstration project at a California cement plant in order to help overcome the “first mover” barriers and share a playbook for future investments.
• Review existing programs and incentives supporting distributed energy generation with the goal of ensuring that they are inclusive of cement industry applications of WHR.
27
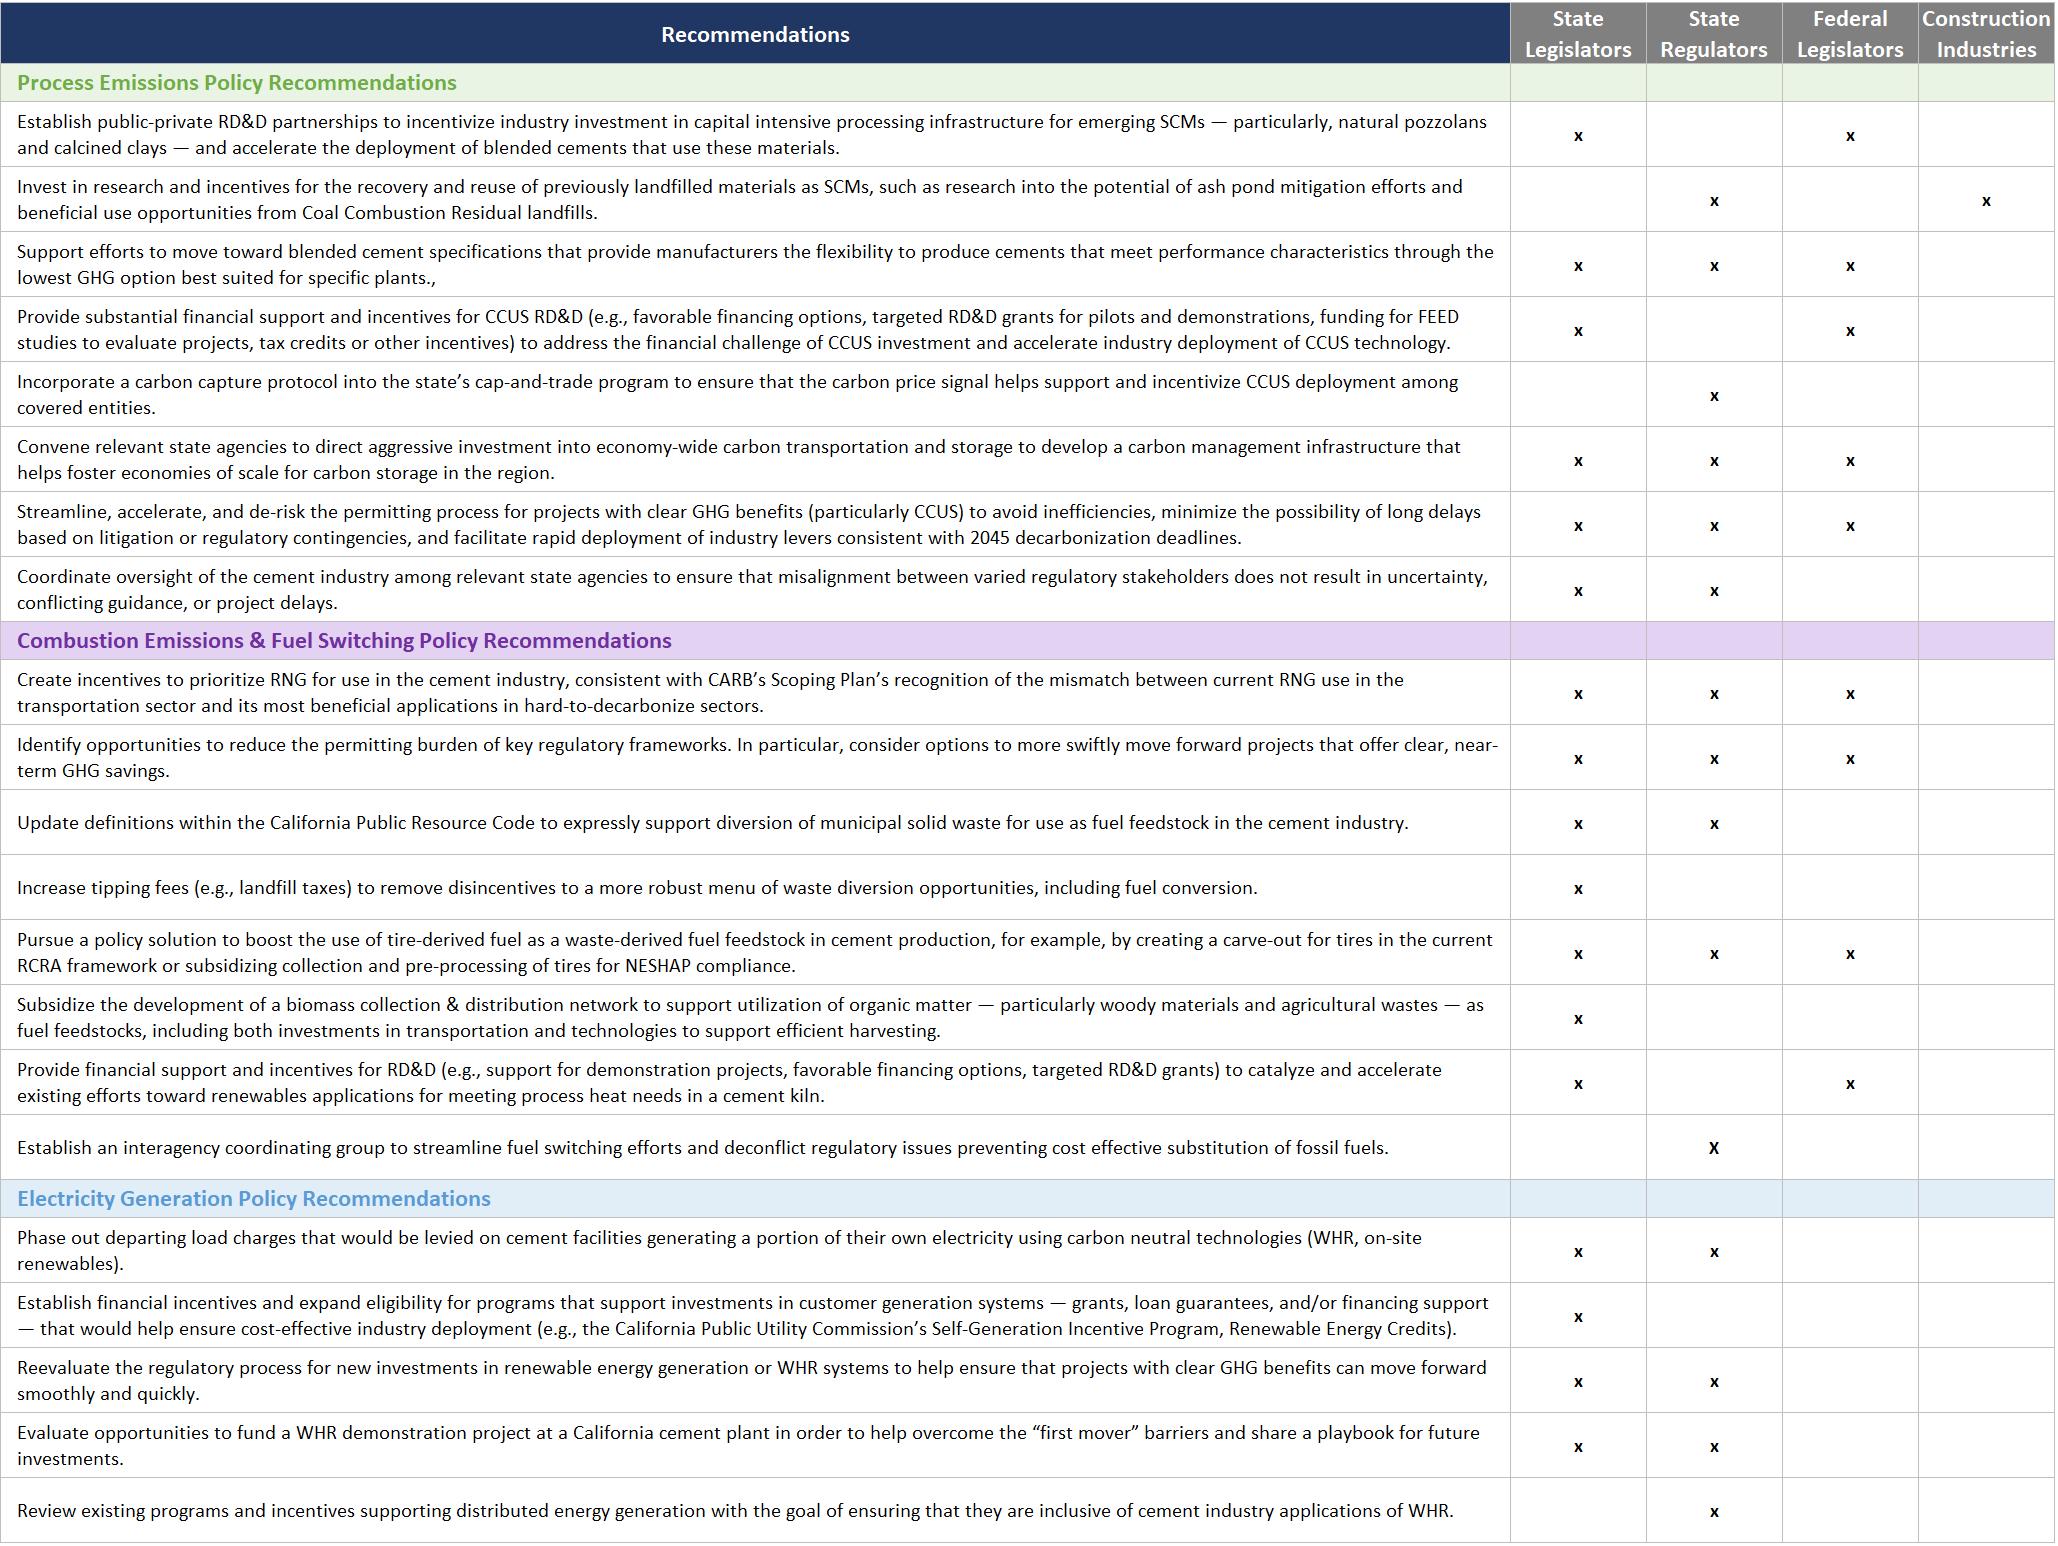
28
Exhibit 2: Policy Recommendations, by Section and Key Actor(s)
Exhibit 3: GHG Abatement Measures, by Type of Barriers Identified
PROCESS EMISSIONS: 3 LEVERS
1
Blended Cements
CCUS Lever 2
3
Alt Cements & Clinkers
COMBUSTION EMISSIONS: 3 LEVERS
4
Renewable Natural Gas
6
5
Refuse-Derived Fuels
Biomass-Derived Fuels
ELECTRICITY GENERATION: 2 LEVERS
7
Waste Heat Recovery
8
Renewable Electricity
29
Supply Limitations RD&D Public Funding Public Acceptance Regulatory Assistance
Assistance
Legislative
Lever
Lever
Lever
Lever
Lever
Lever
Lever
Exhibit 4: Overview of CO2 Capture Technologies Evaluated or Planned in the Cement Sector
Source: Lorea, C., Sanchez, F., Torres Morales, E. (2022). Green Cement Technology Tracker, Version 11/2022, Stockholm, Dataset, https://www.industrytransition.org/green-cement-technology-tracker
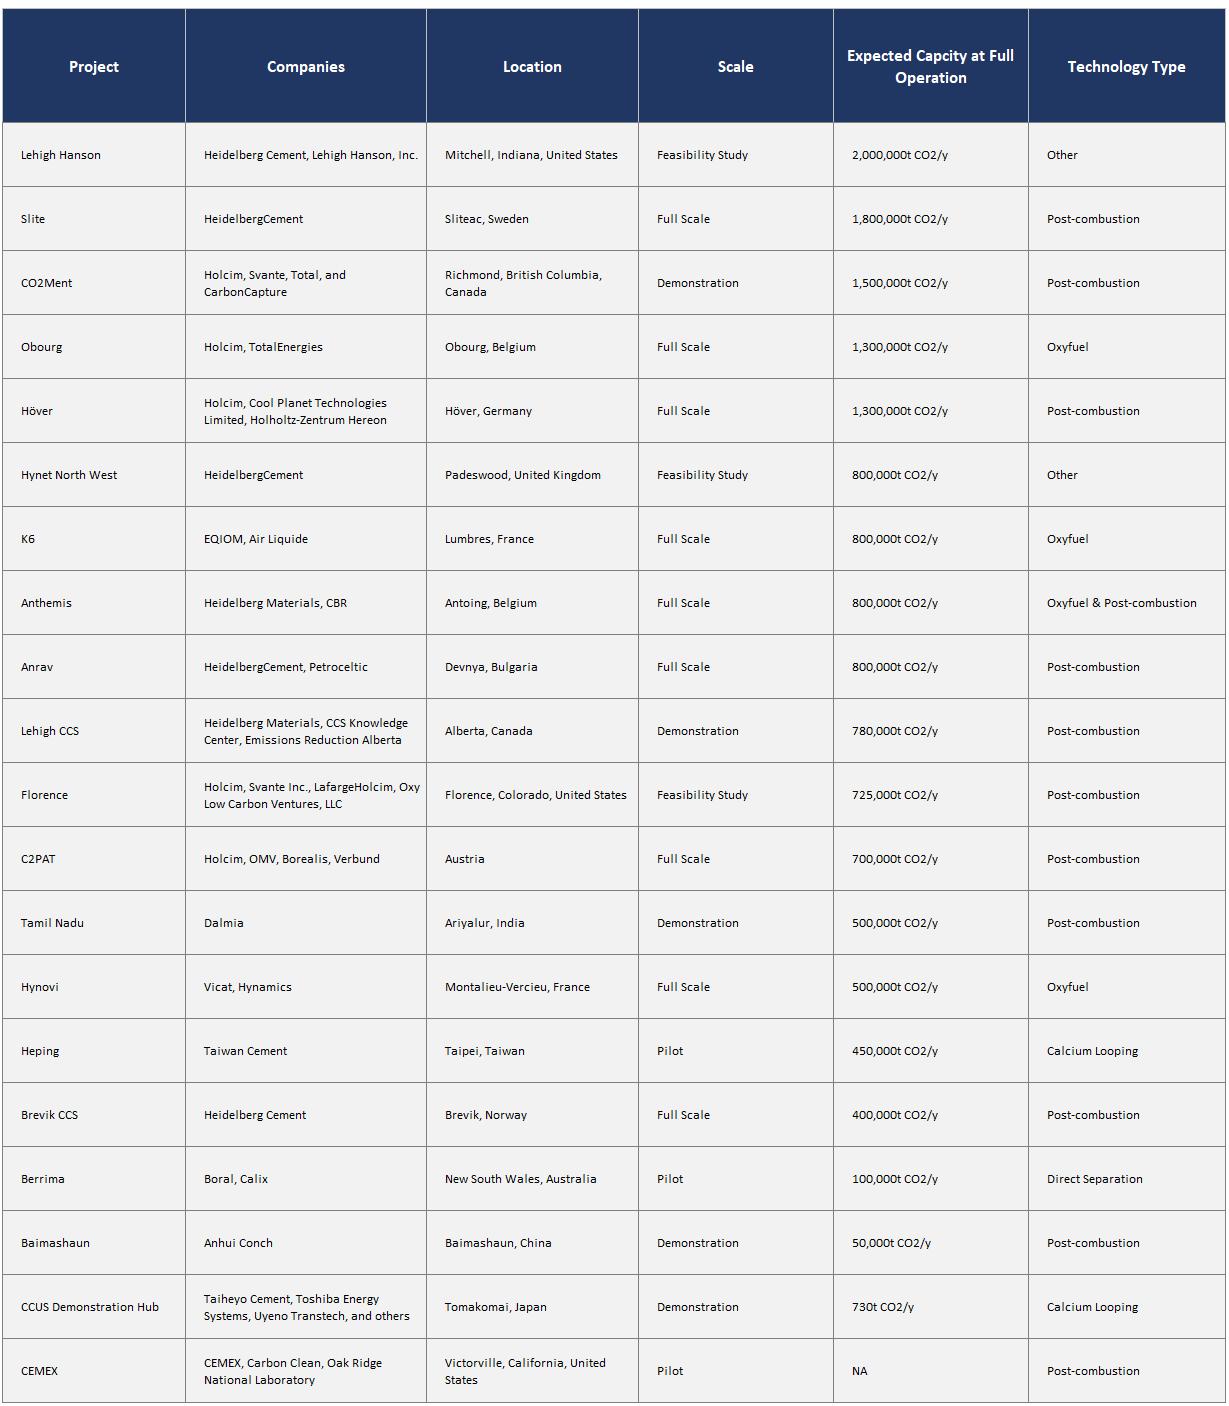
30
ENDNOTES
1 IPCC, 2018: Global Warming of 1.5°C. An IPCC Special Report on the impacts of global warming of 1.5°C above pre-industrial levels and related global greenhouse gas emission pathways, in the context of strengthening the global response to the threat of climate change, sustainable development, and efforts to eradicate poverty [Masson-Delmotte, V., P. Zhai, H.-O. Pörtner, D. Roberts, J. Skea, P.R. Shukla, A. Pirani, W. Moufouma-Okia, C. Péan, R. Pidcock, S. Connors, J.B.R. Matthews, Y. Chen, X. Zhou, M.I. Gomis, E. Lonnoy, T. Maycock, M. Tignor, and T. Waterfield (eds.)]. In Press. https://www.ipcc.ch/sr15/
2 Governor Edmund G. Brown signed Executive Order B-55-18 To Achieve Carbon Neutrality in September 2018. The order sets a goal of achieving economy-wide carbon neutrality in California by 2045.
3 Recent decarbonization “roadmaps” released by the Global Cement and Concrete Association, the Portland Cement Association, and the European Cement Association evaluate the feasibility of achieving carbon neutrality throughout the entire value chain. Specifically, both the Portland Cement Association and the European Cement Association characterize their approach as consisting of “5Cs” – clinker, cement, concrete, construction, and (re)carbonization.
4 The European Cement Association. (n.d) “Recarbonation.” https://lowcarboneconomy.cembureau.eu/5-parallelroutes/downstream/recarbonation/ (accessed August 24, 2020).
5 While there is currently no definitive ‘calculator’ for quantifying recarbonation expectations across various types of cement mixes, the Nature finding is consistent with findings of a paper published in the International Journal of Life Cycle Assessment in 2014. In this case, the researchers found that Portland cement captured 47% of emissions on a lifecycle basis (i.e., ‘cradle-to-grave’). The development of suitable and universal methodology for quantifying cement’s role as a concrete sink is underway and would ultimately enable building decisions to be made based on a fuller and more accurate accounting of lifetime GHG emissions.
6 Xi, F., Davis, S. J., Ciais, P., Crawford-Brown, D., Guan, D., Pade, C., ... & Bing, L. (2016). Substantial global carbon uptake by cement carbonation. Nature Geoscience, 9(12), 880-883. https://www.nature.com/articles/ngeo2840
7 United Nations Intergovernmental Panel on Climate Change (2021). Assessment Report 6 Climate Change 2021: The Physical Science Basis. https://www.un.org/en/climatechange/reports?gclid=Cj0KCQjwu-KiBhCsARIsAPztUF3RGgo8tg0yFq2BJs1s9xNYcj3jJyHdMzujYt7sY4toFDkv4fI5FIsaAt4lEALw_wcB
8 Azari-Jafari, H., Gregory, J., Guo, F., Kirchain, R. (2021). Carbon Uptake of Concrete in the US Pavement Network. Resources Conservation and Recycling, 167, 1-21. https://www.sciencedirect.com/science/article/abs/pii/S0921344921000045?via%3Dihub
9 Environmental Protection Agency, Inventory of U.S. Greenhouse Gas Emissions and Sinks: 1990 – 2017,” Section 4.1 Cement Production (CRF Source Category 2A1), 4-9. https://ww2.arb.ca.gov/applications/greenhouse-gas-emission-inventory-0
10 In 2020, based on data from CARB’s GHG inventory, process emissions comprised roughly 63% of total industry direct emissions (4.722 MMTCO2e attributed to “Clinker Production” out of 7.506 MMTCO2e total industry emissions). "Industrial > Manufacturing > Stone, Glass, Clay, and Cement > Cement” 2020 industry emissions pulled using CARB’s GHG inventory online query tool
11 It is worth noting that these measures reduce multiple types of GHG emissions in cement manufacturing, including combustion and electricity-related emissions. However, they are distinguished by their potential to reduce or eliminate process emissions, which constitute the majority of the industry’s GHG footprint.
12 Thomas, M. (n.d.) “Optimizing the Use of Fly Ash Concrete.” Portland Cement Association. https://www.cement.org/docs/default-source/fc_concrete_technology/is548-optimizing-the-use-of-fly-ash-concrete.pdf
13 Parron-Rubio, M. E., Perez-Garcia, F., Gonzalez-Herrera, A., Oliveira, M. J., & Rubio-Cintas, M. D. (2019). Slag substitution as a cementing material in concrete: Mechanical, physical, and environmental properties. Materials, 12(18), 2845. https://www.mdpi.com/1996-1944/12/18/2845/pdf
14 Bundur, Z.B., Ciuca, I., Gulgun, M.A., Nicoara, A.I., Ow-Yang, C., Rogan, N.S., Sturm, S., Stoica, A.E., Vasile, & B.S., Vrabec, M. (2020). End-of-life materials used as supplementary cementitious materials in the concrete industry. Materials, 13(8), 1954. https://www.mdpi.com/1996-1944/13/8/1954
31
15 Selvapriya, R. (2019). Silica fume as partial replacement for cement in concrete. International Research Journal of Multidisciplinary Technovation. 1(6), 325-333. https://www.researchgate.net/publication/349524741_Silica_fume_as_Partial_Replacement_of_Cement_in_Concrete
16 Lehne, J., & Preston, F. (2018). Making concrete change: Innovation in low-carbon cement and concrete. Chatham House Report, Energy Enivronment and Resources Department: London, UK, 1-66. https://www.chathamhouse.org/sites/default/files/publications/2018-06-13-making-concrete-change-cement-lehne-preston-final.pdf
17 Jaskulski, R., Jozwiak-Niedzwiedzka, D., Yakymechko, Y. (2020). Calcined Clay as a Supplementary Cementitious Material. Materials, 13(4734), 1-36. https://www.mdpi.com/1996-1944/13/21/4734/pdf
18 Ayub, T., Nuruddin, M., Shafiq, N., & Khan, S. (2015). Calcined Kaolin as cement replacing material and its use in high strength concrete. Construction and Building Materials. 2(50). https://www.researchgate.net/publication/273202557_Calcined_Kaolin_as_cement_replacing_material_and_its_use_in_high_strength_concrete
19 Lalit, R., Skinner, B. (2023). “With Concrete, Less is More.” Rocky Mountain Institute. https://rmi.org/with-concrete-lessis-more/
20 Kaminsky, A., Krstic, M., Rangaraju, P., Tagnit-Hamou, A., Thomas, M. (2020). Ground-Glass Pozzolan for Use in Concrete. Concrete International, 42(11) 24-32 https://www.concrete.org/publications/internationalconcreteabstractsportal.aspx?m=details&ID=51729296
21 Only ~1/3 of glass waste is recycled meaning that there is a substantial volume of glass waste that would otherwise sit in landfill. Processing glass waste into GGP offers a means to further reduce the landfilled share of glass waste in addition to traditional recycling efforts.
22 Kaminsky, A., Krstic, M., Rangaraju, P., Tagnit-Hamou, A., Thomas, M. (2020). Ground-Glass Pozzolan for Use in Concrete. Concrete International, 42(11) 24-32 https://www.concrete.org/publications/internationalconcreteabstractsportal.aspx?m=details&ID=51729296
23 Renforth, P., Strunge, T., Mijndert, V. (2022) Towards a business case for CO2 mineralisation in the cement industry. Communications Earth & Environment. 3. https://www.nature.com/articles/s43247-022-00390-0
24 Arora, A., Sant, G., Niethalath, N. (2016). Ternary blends containing slag and interground/blended limestone: Hydration, strength, and pore structure. Construction and Building Materials, 102(1), 113-124. https://www.sciencedirect.com/science/article/abs/pii/S0950061815306000
25 Lehne, J., & Preston, F. (2018). Making concrete change: Innovation in low-carbon cement and concrete. Chatham House Report, Energy Enivronment and Resources Department: London, UK, 1-66. https://www.chathamhouse.org/sites/default/files/publications/2018-06-13-making-concrete-change-cement-lehne-preston-final.pdf
26 Over $18 million of slag was imported to California in 2022 – over 75% of which was imported from China. Data from USA Trade Online, Port-level Data, HS Code 26180000.
27 Hills, T., Leeson, D., Florin, N., Fennell, P. (2016). Carbon capture in the cement industry: technologies, progress, and retrofitting. Environmental science & technology, 50(1), 368-377. https://pubs.acs.org/doi/abs/10.1021/acs.est.5b03508.
28 For example, modeling conducted by Energy Innovations finds that industrial emissions account for most of the gap between emissions outcomes under current policy and carbon neutrality. Bridging this gap entails cement industry GHG abatement that is nearly fully driven by CCUS.
29 Many sources have highlighted the sheer necessity of CCUS applications for deep decarbonization of the cement sector, especially in context of increasingly ambitious climate goals. For instance, the authors of the E3 draft report Achieving Carbon Neutrality in California write that energy-intense sectors “are either reliant on the application of CCS or on heavy process-related innovations” and assume that CCS is used to abate cement industry non-combustion emissions. The need to accelerate CCUS deployment for industrial decarbonization is not unique to California. The International Energy Agency recently highlighted the “imperative” to accelerate RD&D investments in CCUS for cement applications in order to achieve emissions reductions that align the global industry with the Sustainable Development Scenario pathway.
30 Lorea, C., Sanchez, F., Torres Morales, E. (2022). Green Cement Technology Tracker, Version 11/2022, Stockholm, Dataset, https://www.industrytransition.org/green-cement-technology-tracker
32
31 Energy Futures Initiative. (2019). Optionality, Flexibility, & Innovation: Pathways for Deep Decarbonization in California. https://static1.squarespace.com/static/58ec123cb3db2bd94e057628/t/5ced6fc515fcc0b190b60cd2/1559064542876/E FI_CA_Decarbonization_Full.pdf
32 Bobeck, J., Peace. J., Ahmad, F.M., Munson R. (2019). Carbon Utilization – A Vital and Effective Pathway for Decarbonizatoin. Center for Climate and Energy Solutions. https://www.c2es.org/site/assets/uploads/2019/09/carbon-utilization-avital-and-effective-pathway-for-decarbonization.pdf
33 Bobeck, J., Peace. J., Ahmad, F.M., Munson R. (2019). Carbon Utilization – A Vital and Effective Pathway for Decarbonizatoin. Center for Climate and Energy Solutions. https://www.c2es.org/site/assets/uploads/2019/09/carbon-utilization-avital-and-effective-pathway-for-decarbonization.pdf
34 Cvetic, P., Hughes, S. (2023) Analysis of Carbon Capture Retrofits for Cement Plants. United Department of Energy National Energy Technology Laboratory. https://www.netl.doe.gov/energy-analysis/details?id=d4a46524-d343-48b7-946eaf509abcfcb7
35 Price range calculated by applying the per MTCO2 cost of CCS deployment to the size and emissions performance of California cement plants.
36 It should be noted that the estimated cost of CCUS was modeled assuming a generic greenfield site in a Midwestern U.S. state. Given the substantially higher labor, energy, and other costs faced by companies in California, the costs faced by the California cement industry would likely be meaningfully higher than was estimated in the study
37 Clean Air Task Force (2023). Carbon Capture and the Inflation Reduction Act. https://cdn.catf.us/wp-content/uploads/2023/02/16093309/ira-carbon-capture-fact-sheet.pdf
38 Ibid.
39 Norway to Launch $2,7B Carbon Capture and Storage Project 'Longship' (2020). Offshore Engineer Magazine
https://www.oedigital.com/news/481822-norway-to-launch-2-7b-carbon-capture-and-storage-project-longship
40 Bellona Foundation (2020). Norway’s Longship CCS Project. https://network.bellona.org/content/uploads/sites/3/2020/10/Longship-Briefing_Bellona-1.pdf
41 McBride, B. et al (2020). California Decarbonization Partnership letter to CARB on Carbon Capture [Letter to Jason A. Gray]. https://www.c2es.org/press-release/california-decarbonization-partnership-letter-to-carb-on-carbon-capture/
42 CEQA and NEPA are parallel state and federal statutes, respectively, that codify systems for reviewing environmental impacts of projects, though there are several differences between the two, a major example being their different approaches to determining “significant effects.” Both encourage the use of a joint review process for projects that trigger requirements for both state and federal approval, as would be the case for a carbon capture project, hence their grouping.
43 Friedman, D., Hernandez, J. (2015) In the Name of the Environment: Litigation Abuse Under CEQA. Holland & Knight. https://www.hklaw.com/en/insights/publications/2015/08/in-the-name-of-the-environment-litigation-abuse-un
44 Many sources have highlighted the sheer necessity of CCUS applications for deep decarbonization of the cement sector, especially in context of increasingly ambitious climate goals. For instance, the authors of the E3 draft report Achieving Carbon Neutrality in California write that energy-intense sectors “are either reliant on the application of CCS or on heavy process-related innovations” and assume that CCS is used to abate cement industry non-combustion emissions. The need to accelerate CCUS deployment for industrial decarbonization is not unique to California. The International Energy Agency recently highlighted the “imperative” to accelerate RD&D investments in CCUS for cement applications in order to achieve emissions reductions that align the global industry with the Sustainable Development Scenario pathway.
45 Global Cement and Concrete Association (2022). Concrete Future: The GCCA 2050 Cement and Concrete Industry Roadmap for Net Zero Concrete. https://gccassociation.org/concretefuture/wp-content/uploads/2022/10/GCCA-Concrete-Future-Roadmap-Document-AW-2022.pdf
46 Specifically, Cembureau’s 2050 carbon neutrality roadmap assumes that alternative, low carbon clinker will account for roughly 3% of the emissions reduction from clinker and cement manufacturing needed to achieve net zero by 2050 (from 2050 Carbon Neutrality Roadmap (cembureau.eu), 12-13)
33
47 European Cement Association (2018) “Novel Cements.” Pathways to Carbon Neutrality. https://lowcarboneconomy.cembureau.eu/5-parallel-routes/resource-efficiency/novel-cements/
48 Global Cement and Concrete Association (2022). Concrete Future: The GCCA 2050 Cement and Concrete Industry Roadmap for Net Zero Concrete. https://gccassociation.org/concretefuture/wp-content/uploads/2022/10/GCCA-Concrete-Future-Roadmap-Document-AW-2022.pdf
49 European Cement Association (2018) “Novel Cements.” Pathways to Carbon Neutrality. https://lowcarboneconomy.cembureau.eu/5-parallel-routes/resource-efficiency/novel-cements/
50 Naqi, A., & Jang, J. G. (2019). Recent progress in green cement technology utilizing low-carbon emission fuels and raw materials: A review. Sustainability, 11(2), 537. https://www.mdpi.com/2071-1050/11/2/537/pdf
51 European Cement Association (2018) “Novel Cements.” Pathways to Carbon Neutrality. https://lowcarboneconomy.cembureau.eu/5-parallel-routes/resource-efficiency/novel-cements/
52 For example, the startup Heliogen leverages advanced robotics and algorithms to concentrate solar power, achieving higher temperatures than otherwise feasible with solar technologies, with the goal of testing applications for cement manufacturing. This project follows similar efforts to harness solar energy to meet the cement industry’s high process heat demands (most notably, the SOLPART project). In the green hydrogen field, a handful of projects are addressing the potential of hydrogen to meet fuel needs in the cement industry. For example, a UK project is set to examine the potential to use hydrogen as a partial replacement for natural gas in kiln combustion. In the kiln electrification space, the CemZero project completed a feasibility study on the technical potential for cement plant electrification.
53 California Air Resources Board (2020). 2000-2018 GHG inventory (2020 edition). https://ww2.arb.ca.gov/ghg-inventorydata
54 WBCSD Getting the Numbers Right Reporting Project. See data series “Total Energy Consumption” (25aTGW). https://gccassociation.org/gnr/
55 Sharabaroff, A., Folliet, M. H., Rivas Saiz, M., & Shah, J. V. (2017). Improving thermal and electric energy efficiency at cement plants: international best practice (No. 118739, pp. 1-68). The World Bank. https://www.ifc.org/wps/wcm/connect/58ad0376-91e7-44fa-b951-f638ba61dabb/Elect_Enrgy_Effic_Cement_05+23.pdf?MOD=AJPERES&CVID=lOyTvIy
56 Lehne, J., & Preston, F. (2018). Making concrete change: Innovation in low-carbon cement and concrete. Chatham House Report, Energy Enivronment and Resources Department: London, UK, 1-66. https://www.chathamhouse.org/sites/default/files/publications/2018-06-13-making-concrete-change-cement-lehne-preston-final.pdf
57 Replacing a high share of the industry’s fuel mix with carbon neutral or even negative RNG and replacing the remainder of the fuel mix with a combination of very low carbon refuse-derived and biomass-derived fuels could, in theory, replace all industry fossil fuel combustion.
58 Renewable natural gas (RNG), also known as biomethane, is a fuel product derived from biogas. Sources such as landfills and dairy manure emit methane (biogas) as their organic matter decomposes. Methane emissions can be reduced and productively used by diverting biogas into energy consumption. RNG is biogas that has been processed and purified to natural gas standards set by the California Public Utilities Commission. When processed to RNG-level, biogas is a perfect substitute for fossil-based natural gas. For example, it can be injected into pipelines and can be used as a transportation fuel.
59 Alternative Fuels Data Center. (n.d.) “Renewable Natural Gas Production.” United States Department of Energy. https://afdc.energy.gov/fuels/natural_gas_renewable.html
60 LCFS Pathway Certified Carbon Intensities (n.d.) California Air Resources Board. https://ww2.arb.ca.gov/resources/documents/lcfs-pathway-certified-carbon-intensities
61 Energy Futures Initiative. (2019) Optionality, Flexibility, and Innovation: Pathways for Deep Decarbonization in California. 66-67
https://static1.squarespace.com/static/58ec123cb3db2bd94e057628/t/5ced6fc515fcc0b190b60cd2/1559064542876/E FI_CA_Decarbonization_Full.pdf
62Energy Futures Initiative. (2019) Optionality, Flexibility, and Innovation: Pathways for Deep Decarbonization in California. 66-67
34
https://static1.squarespace.com/static/58ec123cb3db2bd94e057628/t/5ced6fc515fcc0b190b60cd2/1559064542876/E FI_CA_Decarbonization_Full.pdf
63 Dominguez-Faus, R., Jaffe, A., Miller, M., Parker, N., Scheitrum, D., Wilcock, J. (2016) The Feasibility of Renewable Natural Gas as a Large-Scale, Low Carbon Substitute. University of California Davis: Institute of Transportation Studies. 58-63 https://steps.ucdavis.edu/wp-content/uploads/2017/05/2016-UCD-ITS-RR-16-20.pdf
64 California Natural Gas Industrial Price (2023) United States Energy Information Agency. https://www.eia.gov/dnav/ng/hist/n3035ca3m.htm
65 Low Carbon Fuel Standard (n.d.) California Air Resources Board. https://ww2.arb.ca.gov/our-work/programs/low-carbon-fuel-standard
66 Weekly LCFS Credit Transfer Activity Report (2023) California Air Resources Board. https://ww2.arb.ca.gov/resources/documents/weekly-lcfs-credit-transfer-activity-reports (as of 4.7.23)
67 2022 Scoping Plan for Achieving Carbon Neutrality (2022) California Air Resources Board. 85, 190 https://ww2.arb.ca.gov/sites/default/files/2022-12/2022-sp.pdf
68 As defined by PRC section 40131.2, “Engineered municipal solid waste” must meet the following requirements: 1) the waste to be converted is beneficial and effective in that it replaces or supplements the use of fossil fuels; 2) The waste to be converted, the resulting ash, and any other products of conversion do not meet the criteria or guidelines for the identification of a hazardous waste adopted by the Department of Toxic Substances Control pursuant to Section 25141 of the Health and Safety Code; (3) The conversion is efficient and maximizes the net calorific value and burn rate of the waste; (4) The waste to be converted contains less than 25 percent moisture and less than 25 percent noncombustible waste; (5) The waste received at the facility for conversion is handled in compliance with the requirements for the handling of solid waste imposed pursuant to this division, and no more than a seven-day supply of that waste, based on the throughput capacity of the operation or facility, is stored at the facility at any one time; (6) No more than 500 tons per day of waste is converted at the facility where the operation takes place; (7) The waste has an energy content equal to, or greater than, 5,000 BTU per pound. (8) The waste to be converted is mechanically processed at a transfer or processing station to reduce the fraction of chlorinated plastics and materials.
69 Sharabaroff, A., Bernard, D., Lemarchand, D., Tetreault, N., Thevenet, C., & de Souance, A. (2017). Increasing the use of alternative fuels at cement plants: International best practice (No. 118737, pp. 1-90). The World Bank. https://www.ifc.org/wps/wcm/connect/33180042-b8c1-4797-ac82-cd5167689d39/Alternative_Fuels_08+04.pdf?MOD=AJPERES&CVID=lT3Bm3Z
70 Public Resources Code, Cal. Stat. §§ 40131.2 (1989 & Supp. 2013). https://leginfo.legislature.ca.gov/faces/codes_displayText.xhtml?division=30.&chapter=2.&part=1.&lawCode=PRC#:~:text=40131.2.,the%20use%20of%20fossil%20fuels
71 Some plants have achieved even higher substitution rates using waste fuel feedstocks. However, this entails large-scale capital investments that transform the kilns operational flexibility (e.g., effectively repurposing kilns at EMSW digesters), with costs typically in the range of $15 to $30 million.
72 Ismail, I., Zieri, W.(2018). Alternative Fuels from Waste Products in Cement Industry. In L. M. T. Martínez et al. (Eds.), Handbook of Ecomaterials (p. 1-24). Online: Springer. https://www.researchgate.net/publication/322697306_Alternative_Fuels_from_Waste_Products_in_Cement_Industry
73 California Air Resources Board (2020). 2000-2018 GHG inventory (2020 edition). https://ww2.arb.ca.gov/ghg-inventorydata
74 California Air Resources Board (2020). Greenhouse Gas Emission Inventory - Query Tool for years 2000 to 2018 (13th Edition). https://www.arb.ca.gov/app/ghg/2000_2018/ghg_sector.php?_ga=2.102483521.1143478236.16099438972006960846.1601386549
75 Global CemFuels (2011). Tyres as an alternative fuel. https://www.cemfuels.com/articles/318-tyres-as-an-alternativefuel
76 Sharabaroff, A., Bernard, D., Lemarchand, D., Tetreault, N., Thevenet, C., & de Souance, A. (2017). Increasing the use of alternative fuels at cement plants: International best practice (No. 118737, pp. 1-90). The World Bank. https://www.ifc.org/wps/wcm/connect/33180042-b8c1-4797-ac82-cd5167689d39/Alternative_Fuels_08+04.pdf?MOD=AJPERES&CVID=lT3Bm3Z
35
77 Sharabaroff, A., Bernard, D., Lemarchand, D., Tetreault, N., Thevenet, C., & de Souance, A. (2017). Increasing the use of alternative fuels at cement plants: International best practice (No. 118737, pp. 1-90). The World Bank. https://www.ifc.org/wps/wcm/connect/33180042-b8c1-4797-ac82-cd5167689d39/Alternative_Fuels_08+04.pdf?MOD=AJPERES&CVID=lT3Bm3Z
78 AB 939 (‘The California Integrated Waste Management Act of 1989 ‘) required diversion of at least 50% of all solid waste by cities, counties, and other relevant parties and AB 341 established a state-wide goal of achieving 75% diversion through reduction, recycling or composting by 2020.
79 A.B. 1126, 2013-2014 Reg. Sess. (Cal. 2013). http://www.leginfo.ca.gov/pub/13-14/bill/asm/ab_11011150/ab_1126_cfa_20130909_220049_asm_floor.html
80 Specifically, the California Public Resources code as modified by AB 1126
81 United States Environmental Protection Agency (n.d). Plastics: Material-Specific Data. https://www.epa.gov/facts-andfigures-about-materials-waste-and-recycling/plastics-material-specific-data
82 WBCSD Getting the Numbers Right Report 2018, Data Indicators 25aAGFC (“Thermal energy consumption - Weighted average excluding drying of fuels - Grey clinker - by fuel category”) and 25aAGF (“Thermal energy consumptionWeighted average excluding drying of fuels - Grey clinker - by fuel”). https://gccassociation.org/gnr/
83 United States Environmental Protection Agency (n.d). Plastics: Material-Specific Data. https://www.epa.gov/facts-andfigures-about-materials-waste-and-recycling/plastics-material-specific-data
84 California Legislative Analyst’s Office (2020). Overview of Plastics in California (pp. 1-6). https://lao.ca.gov/handouts/resources/2020/Overview-of-Plastics-in-California-111620.pdf
85 Notably, CEQA has a long history of criticism that frames it as a permitting tool that has been weaponized to delay or block projects based on opposition unrelated to environmental impacts. For example, one scholar who co-published a study of CEQA lawsuits between the years 2010 and 2012 explains, “We found that too often enforcement of CEQA is aimed at promoting the economic agendas of competitors and labor union leaders, or the discriminatory ‘Not In My Backyard’ (NIMBY) agendas of those seeking to exclude housing, park, and school projects that would diversify communities by serving members of other races and economic classes.” Indeed, CEQA plays a decisive and at times polarizing role in shaping on-the-ground permitting realities in California, and while the resulting landscape is complex and multi-faceted, it is clear that that statute can drive significant delays.
86 Specifically, it is subject to section 129 of the Clean Air Act, governing commercial and solid waste incinerators, rather than section 112.
87 California Department of Resources, Recycling and Recovery (2020). 2018 State of Disposal and Recycling in California (DRRR-2020-1662) (pp. 1-38).
https://www2.calrecycle.ca.gov/Publications/Details/1662
88 Indeed, EPA’s waste management hierarchy ranks “energy recovery” above “treatment and disposal” when it comes to the degree of preference awarded to different waste management strategies. While reduction, recycling and composting rank as more preferable, conversion of waste to usable heat, electricity or fuel offers still offers important benefits (ones not currently being fully realized in California), by generating a renewable energy source, offsetting fossil fuel use, and reducing methane generation from landfills.
89 California Department of Resources, Recycling and Recovery (2015). Landfill Tipping Fees in California (DRRR-2015-1520) (pp. 1-60). https://www2.calrecycle.ca.gov/Publications/Details/1520
90 WBCSD Getting the Numbers Right Report 2018, Data Indicators 25aAGFC (“Thermal energy consumption - Weighted average excluding drying of fuels - Grey clinker - by fuel category”) and 25aAGF (“Thermal energy consumptionWeighted average excluding drying of fuels - Grey clinker - by fuel”). https://gccassociation.org/gnr/
91 Note that costs presented in Euro figures and have been converted to USD and rounded.
92 Sharabaroff, A., Bernard, D., Lemarchand, D., Tetreault, N., Thevenet, C., & de Souance, A. (2017). Increasing the use of alternative fuels at cement plants: International best practice (No. 118737, pp. 1-90). The World Bank. https://www.ifc.org/wps/wcm/connect/33180042-b8c1-4797-ac82-cd5167689d39/Alternative_Fuels_08+04.pdf?MOD=AJPERES&CVID=lT3Bm3Z
93 For example, rice husk is a much more prominent biogenic energy source in rice-producing countries.
36
94 Baker, S. E., Peridas, G., Stolaroff, J. K., Goldstein, H. M., Pang, S. H., Lucci, F. R., ... & Aines, R. D. (2019). Getting to Neutral: Options for Negative Carbon Emissions in California (No. LLNL-TR-796100). Lawrence Livermore National Lab. (LLNL), Livermore, CA (United States). https://www-gs.llnl.gov/content/assets/docs/energy/Getting_to_Neutral.pdf
95 Calculated based on a range of heat values representative of the biomass sources selected (i.e., roughly 6,000 to 8,000 Btu per pound).
96 This carbon accounting of biomass fuels is reflected in the state’s cap-and-trade program, which exempts biogenic portions of fuel combustion from compliance obligations.
97 Bracmort, K. (2016). Is Biopower Carbon Neutral?. Congressional Research Service (pp. 1-15). https://fas.org/sgp/crs/misc/R41603.pdf
98 California Department of Forestry and Fire Protection (n.d.). Biomass and Bioenergy. https://www.fire.ca.gov/programs/resource-management/resource-protection-improvement/environmental-protection-program/biomass-andbioenergy/
99 Chinyama, M.(2011). Alternative Fuels in Cement Manufacturing. In Mananzera, M. (Ed.), Alternative Fuels. Online: IntechOpen. https://www.intechopen.com/books/alternative-fuel/alternative-fuels-in-cement-manufacturing
100 Sharabaroff, A., Bernard, D., Lemarchand, D., Tetreault, N., Thevenet, C., & de Souance, A. (2017). Increasing the use of alternative fuels at cement plants: International best practice (No. 118737, pp. 1-90). The World Bank. https://www.ifc.org/wps/wcm/connect/33180042-b8c1-4797-ac82-cd5167689d39/Alternative_Fuels_08+04.pdf?MOD=AJPERES&CVID=lT3Bm3Z
101 California Department of Forestry and Fire Protection (n.d.). Biomass and Bioenergy. https://www.fire.ca.gov/programs/resource-management/resource-protection-improvement/environmental-protection-program/biomass-andbioenergy/
102 It is useful to note that this challenge is by no means unique to California. Other more broadly scoped studies have also stressed the need for crop waste collection networks in this context, as well as the potential for competition with other end uses, such as energy recovery by power stations.
103 European Cement Research Academy, Ed. (2022). The ECRA Technology Papers 2022 - State of the Art Cement Manufacturing - Current Technologies and their Future Development. https://ecra-online.org/research/technology-papers
104 Based on nominal cement plant electricity demand of 30–40MW and nominal WHR generation of 6-9MW.
105 United States, Environmental Protection Agency. (2014). On-Site Renewable Energy Generation: A Guide to Developing and Implementing Greenhouse Gas Reduction Programs. https://www.epa.gov/sites/production/files/2017-06/documents/onsiterenewables508.pdf
106 The California cement industry’s total electricity consumption was calculated by the author using publicly available data sources. It is not intended to represent a precise assessment of the industry’s electricity purchases, but a reasonable estimate for understanding the scale of its electricity related GHG footprint. It was calculated by applying California’s proportion of total U.S. cement production (~12%) to the industry’s nationwide electricity consumption (11.7 million MWh) as of 2017. Sources: Tables 3 & 8 USGS 2017 Minerals Yearbook
107 The resulting GHG footprint was calculated assuming a GHG intensity of electricity production of 446 lb CO2 / MWh, as reported by EIA for data year 2019 in California. (EIA state electricity profile)
108 Davidson, K., Hite, R., Jones D., Howley A. (2019). A comprehensive assessment of combined heat and power technical and market potential in California. California Energy Commission. https://ww2.energy.ca.gov/2019publications/CEC500-2019-030/CEC-500-2019-030.pdf
109 California, California Public Utilities Commission. (n.d.). Electric Schedule E-DCG: Departing Customer Generation CG. https://www.pge.com/tariffs/assets/pdf/tariffbook/ELEC_SCHEDS_E-DCG.pdf
110 Note, analysis specifically focused on Combined Heat and Power applications in the 250-499 kW size range. They find that “compared to the base case (1.9 GW), an additional 1.2 GW of capacity would be expected to come online during the 20-years, resulting in 3.1 GW of total market adoption” in the scenario studied (i.e., removing standby rates and departing load charges). Given that the financial implications would be more pronounced for larger systems, it is likely that the impacts would be even higher if the reform scenario analysis were performed for these configurations.
37
111 Davidson, K., Hite, R., Jones D., Howley A. (2019). A comprehensive assessment of combined heat and power technical and market potential in California. California Energy Commission. https://ww2.energy.ca.gov/2019publications/CEC500-2019-030/CEC-500-2019-030.pdf
112 Gorbatenko, Y., Hedman, B. A., Shah, J. V., & Sharabaroff, A. (2014). Waste heat recovery for the cement sector: market and supplier analysis. The World Bank. 46211, 1-90 https://documents.worldbank.org/en/publication/documents-reports/documentdetail/594861468327413632/waste-heat-recovery-for-the-cement-sector-market-and-supplier-analysis
38
