Paramedic Code STEMI Activation

Every effort has been made to trace and acknowledge copyright material. Should any infringement have occurred accidentally the authors and publishers tender their apologies.
Copying
Except as permitted under the Act (for example a fair dealing for the purpose of study, research, criticism or review) no part of this book may be reproduced, stored in a retrieval system, or transmitted in any form or by any means without prior written permission. All enquiries should be made to the publisher at the address below.
Chief Executive Officer
SA Ambulance Service
GPO Box 3 Adelaide SA 5001
Published by SA Ambulance Service
Clinical Education


Version: 1.1 Update of 2015 material for upload to SAAS eLearn system
2 Paramedic Code STEMI Activation Reference Material


3 Paramedic Code STEMI Activation Reference Material CONTENTS Prerequisite Knowledge Checklist 4 Introduction 5 The 12-Lead ECG 7 Introduction 8 Single-Lead versus Multi-Lead ECGs 8 The Frontal and Horizontal Planes 10 ECG Leads 11 12-Lead ECG Interpretation 17 Introduction 18 A Systematic Approach to 12-Lead ECG Interpretation 18 Systematic 12-Lead ECG Interpretation and Reporting 37 Consolidation Exercises 38 12-Lead ECG in Paramedic Practice 47 Introduction 48 Acute coronary Syndrome 49 Acute Myocardial Infarction 52 ACS Management by SAAS Paramedics 57 Activating Code STEMI 64 Exercises and Mock Exam 68 Bibliography / Reference List 69 Bibliography 70 Reference List 72 Consolidation Exercise Answers 74
Prerequisite Knowledge CheCKlist
Before commencing this package, ensure you are able to demonstrate the prerequisite knowledge as outlined below:
State the normal speed of the ECG paper
State what both the horizontal and vertical axes of the ECG represent
State the time representation of the following on ECG paper -1 mm box -5 mm box -25 mm box
Demonstrate 2 manual methods of calculating heart rate from ECG
State the intrinsic rates of the atria, nodes and ventricles
State the normal route of electrical activity in the heart
Recognise rhythms requiring defibrillation
Undertake systematic rhythm analysis
Identify the morphology and values associated with normal ECG segments
Recognise ectopic atrial and ventricular complexes
Identify the following rhythms -VF -VT -NSR -Sinus Bradycardia -AF -Atrial Flutter -Asystole -Junctional -Paced ventricular
-1st degree AV Block (Type 1) -2nd degree AV Block (Type 2) -3rd Degree AV Block
Provide rhythm interpretation including rate, pacemaker origin and abnormalities
Demonstrate correct electrode placement for 12-Lead ECG
Demonstrate ECG troubleshooting and skin preparation
Demonstrate 12-Lead ECG acquisition
Discuss heart anatomy and physiology
Discuss pathophysiology of Acute Coronary Syndrome (ACS)
Demonstrate an understanding of Paramedic CPGs.
“Real knowledge is to know the extent of one’s ignorance” -Confucius
4 Paramedic Code STEMI Activation Reference Material
Suggested Revision Resources
Cardiovascular Physiology Concepts
Life In The Fast Lane
ECGpedia ECG Library
Paramedic CPGs (on SAASnet)
introduCtion
This education package has been designed to provide paramedics with the required knowledge to make appropriate referral decisions in-line with the new SAAS STEMI Activation Flow Chart. The key features of this change in practice include:
• Systematic approach to Acute Coronary Syndrome (ACS) management
• Enhanced patient safety
• Greater clinical autonomy for paramedics
• Incorporating 12-Lead ECG interpretation into clinical decision making
• Adding direct admission to a PCI facility as a referral option
It is important to note that this package is not a definitive resource on 12-Lead ECG interpretation or ACS. Instead, its coverage is designed to provide the paramedic with the appropriate depth of knowledge needed to incorporate Code STEMI activation into their clinical practice. While every care has been taken to ensure the accuracy of this educational resource, paramedics must ensure that their understanding of clinical practice guidelines, equipment, and organisational directives remains current.
This package includes the following components:
•Face-to-face session (PDW) or other education workshop
•Self-paced interactive activities)
•Summative assessment on SAAS eLearning


5 Paramedic Code STEMI Activation Reference Material
This page has been intentionally left blank.
6 Paramedic Code STEMI Activation Reference Material
the 12-lead eCg
PurPose
To introduce important 12-Lead ECG theory and concepts.
learning outComes
• State the advantages of the 12-Lead ECG over single lead ECG rhythm strips

• Name the ECG leads belonging to the frontal plane
• Name the ECG leads belonging to the horizontal plane
• Identify the ECG lead groupings of the frontal and horizontal plane on a standard 12-Lead ECG printout
• Explain which anatomical aspects of the heart are ‘viewed’ by each of the respective leads of the standard 12-Lead ECG.
7 Paramedic Code STEMI Activation Reference Material
introduCtion
An electrocardiogram (ECG) is a graphical representation of electrical activity in the heart measured from various electrodes placed on the body. Whilst there are an infinite number of sites on the surface of the body from which electrical currents can be measured, there are several well described and accepted electrode locations and lead configurations. These range from single-lead ‘monitors’ through to more complex multi lead systems that have a number of electrodes right across both sides of the chest and around onto the back. This package will focus on one of the most familiar multi-lead ECG systems, the standard 12Lead ECG.
It is important to understand the various ‘views’ from which the heart’s electrical activity is recorded by the 12-Lead ECG. These various views provide a more complete and accurate picture of the electrical activity of the heart. This allows information to be displayed that is not available in single or three-lead ECG monitoring, and is often essential for diagnostic purposes.
To interpret 12-Lead ECGs, it is important to know which leads ‘view’ which particular aspect of the heart. Generally speaking, the location of the positive electrode for each lead can be likened to the position from which the heart’s electrical activity is viewed.
single lead Versus multi lead eCgs
The simplest and most common form of cardiac monitor measures, displays or prints the ECG as a single ECG tracing. This is often referred to as an ECG ‘rhythm strip’. The electrical activity is measured between two poles known as the positive and negative electrodes. The hypothetical line joining these electrodes is referred to as an ECG lead axis. The term ECG lead refers to the specific ECG waveform obtained from a specific view point. Willem Einthoven is credited with having discovered the ECG. In 1912 he described the three different leads of the ECG that view the electrical activity from three different aspects as leads I, II and III. It is important to differentiate the term lead from the terms electrode and lead wire. An electrode is the physical connection to the skin, and a lead wire is the physical cable that conducts the electrical activity to the ECG machine.
The electrical fluctuations within the heart between the positive and negative poles can be plotted or recorded over time, providing what is known as a ‘rhythm strip’. A rhythm strip displays the timing of the various parts of the heart’s depolarisation and re-polarisation cycles.
A rhythm strip can be obtained by placing two electrodes on the skin, one positive and one negative, anywhere on the torso or limbs, provided the heart’s electrical fluctuations are captured between them. The most common positioning for these two electrodes is to have the negative electrode on the right arm, and the positive electrode on the left leg. This positioning captures a view of the heart known as Lead II. Lead II coincides with the heart’s main electrical conduction pathway, and for this reason, Lead II is the most frequently used lead for routine continuous cardiac monitoring and rhythm identification.
8 Paramedic Code STEMI Activation Reference Material
Figure 1.0: Limb Leads

Lead II views the electrical activity of the heart from the left leg looking towards the right shoulder. An impulse travelling toward the positive electrode provides an upright or positive deflection on the ECG, and an impulse travelling away from the positive electrode produces a downward or negative deflection on the ECG.
Lead II provides one limited view of the heart’s depolarisation and repolarisation. Importantly, many ECG abnormalities are not evident when looking at the heart from only a single lead view. A multi-lead ECG provides a view of the electrical fluctuations of the heart from multiple angles, providing a more complete picture.
9 Paramedic Code STEMI Activation Reference Material
The 12-Lead ECG gives a view of the heart’s electrical activity from 12 key angles and it is considered essential for many diagnostic purposes.
the Frontal and horizontal Planes
A 12-Lead ECG views the heart’s electrical fluctuations from various angles within two distinct planes, the frontal (vertical) plane and the horizontal plane. The diagram below illustrates these two planes. The arrows on the diagram highlight the different angles from which a 12-Lead ECG will record the heart’s electrical fluctuations. Notice the blue arrows indicate the view from points within the frontal (vertical) plane and the red arrows indicate the view from points in the horizontal plane.

Figure 1.1: Frontal and Horizontal Planes
10 Paramedic Code STEMI Activation Reference Material
eCg leads
The standard 12-Lead ECG uses ten wires connected to ten electrodes on the skin to generate 12-Leads (or views) of the electrical activity of the heart. There are six leads that show electrical fluctuations within the frontal plane (leads I, II, III aVR, aVL, and aVF). There are also six chest leads (V1-V6) which show electrical fluctuations within the horizontal plane. Together the ECG tracings from these 12 leads form the standard 12-Lead ECG.

The Limb Leads (I, II, III)
Lead II is one of the six electrical views of the heart within the frontal plane. These additional views are available by electronically manipulating the polarity of the electrodes on the three limbs; the left arm (LA), the right arm (RA) and the left leg (LL). An additional electrode is placed on the right leg (RL) to provide an earth signal. These different electrical views are collectively referred to as the ‘limb leads’ because they are traditionally acquired by placing the electrodes on the limbs.
Leads I, II and Ill (previously referred to as the ‘bipolar’ leads) measure the electrical fluctuations from different angles between two electrical poles placed on or near the limbs; one positive and the other negative.
The location of the positive electrodes for each lead can be likened to the position from which the heart’s electrical activity is viewed.
The Augmented Limb Leads
The same three limb electrodes used to produce limb leads I, II and III, can also provide us with another three views of the heart. These are known as augmented views. Like leads I, II and III, these augmented views are also within the frontal plane. The augmented leads are also termed ‘unipolar’ by the way they are obtained. There is a single positive electrode that is referenced against a combination of the other limb electrodes (Wilson’s Central Terminal). The positive electrodes for these augmented leads are located on the left arm (aVL), the right arm (aVR), and the left leg (aVF). In practice, these are the same electrodes used for leads I, II and III. (The ECG machine does the actual switching and rearranging of the electrode designations.) The three augmented leads, along with the three standard bipolar limb leads, are depicted as shown using the axial reference system.
Figure 1.2 Augmented Leads
11 Paramedic Code STEMI Activation Reference Material
Recall that the location of the positive electrode for each lead can be likened to the position from which the heart’s electrical activity is viewed. An impulse travelling toward a positive electrode provides an upright or positive deflection on the ECG and an impulse travelling away from a positive electrode produces a downward or negative deflection on the ECG.
Figure 1.3: Positive Deflection

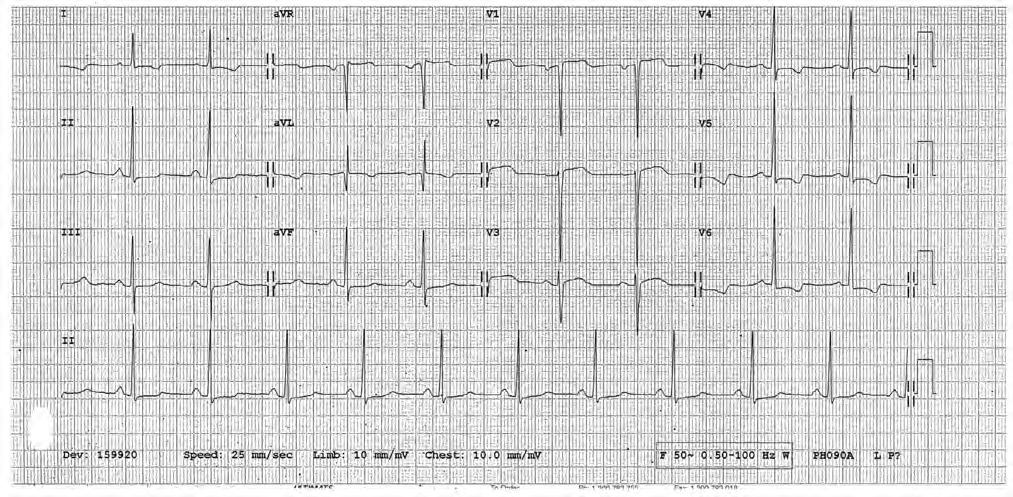
aVR
The normal conduction of a healthy heart is directly away from the positive electrode used for aVR, (located on the right arm) and hence the resulting deflections are predominantly negative. In fact, aVR is almost an inverted image of lead II, as it is sampling the electrical fluctuations from almost the opposite direction to lead II. In aVR the P-wave, QRS complex and T wave are all normally seen as negative deflections. A positive P wave and QRS complex in aVR is likely to indicate incorrect limb lead placement.
Figure 1.4: Normal 12 Lead ECG

The orientation of lead aVR measures the electrical activity of the heart across the relatively small muscle mass of the right atrium, and apart from aiding in cardiac axis determination, or assisting in detecting incorrect limb lead placement (such as the RA electrode being place inadvertently on the left arm etc.), aVR provides no other particularly useful purpose for routine ECG analysis in Paramedic practice. For this reason aVR has been referred to as the ‘orphan’ lead.
12
Code STEMI Activation Reference Material
Paramedic
aVL
Lead aVL (augmented Voltage Left), is created by making the left arm electrode positive and combining the negative electrical signal from both the left leg and right arm electrodes to create the central terminal. Lead aVL measures the electrical activity of the heart across the lateral aspect of the relatively large muscle mass of the left ventricle. The aVL’s view is from the left arm. Notice in Figure 1.1 that aVL views the heart from a direction adjacent to lead I.Together, lead I and aVL provide useful additional information about the electrical activity through the left lateral aspect of the heart.
aVF
Lead aVF (augmented Voltage Foot) uses the combined and then amplified signal from the right arm (RA) electrode and the left arm (LA) electrode as the negative reference point (the central terminal), and the left leg (LL) electrode as the positive electrical pole. Like leads II and III, lead aVF keeps the LL as the positive terminal. Accordingly, each of these three leads has a similar, yet slightly different view of the inferior aspect of the heart.
Limb Lead Summary
Together, the limb leads (I, II, III, aVR, aVL and aVF) provide six views of the electrical activity of the heart, but they are all confined to the frontal (vertical) plane, as represented in Figure 1.1.
The Chest Leads (V1 - V6)
Recall that the limb leads view the electrical fluctuations of the heart from different points within the frontal vertical plane. Because these limb leads are confined to the vertical plane, they can only sense electrical impulses from angles within that plane. The limb leads cannot measure the heart’s electrical activity from the anterior or posterior perspectives, as these angles do not lie in the vertical plane. Therefore a different set of electrodes within the horizontal plane is required. Leads used within this plane are often referred to as the ‘chest leads’, the ‘precordial leads’ or the V-Leads.
Six electrodes placed in particular locations across the chest are used in conjunction with ‘Wilson’s Central Terminal’ to generate six chest or precordial leads called V1, V2, V3, V4, V5 and V6. The ‘V’ stands for voltage, however some references use ‘C’ for chest electrodes or precordial electrodes. The chest leads view the electrical activity in a horizontal plane through the heart to each respective chest electrode.
As the chest leads use Wilson’s Central Terminal as a common reference point, the location of the limb electrodes can affect the accuracy and quality of the ECG tracing. Therefore, correct limb lead placement is of greater importance than what was previously required for 3-Lead ECG monitoring.
13 Paramedic Code STEMI Activation Reference Material
The chest electrodes (V1 - V6) are located at specific anatomical locations around the anterior and left lateral chest wall. Appropriate lead placement for both the limb and chest electrodes is discussed in detail later.

Figure 1.5: The Chest (V) Leads
Recall that the location of the positive electrode for each lead can be likened to the position from which the heart’s electrical activity is viewed. In the Figure 1.5, it is easy to see that the V1 and V2 electrodes ‘view’ electrical activity of the septum, V3 and V4 electrodes will ‘view’ electrical activity from the anterior perspective, while V5 and V6 electrodes would ‘view’ the electrical activity from the left lateral aspect of the heart. Figure 1.6 summarises the lead views, and the location of each of the chest electrodes.
V1: Right 4th IC space V2: Left 4th IC space V3: Halfway between V2 and V4 V4: Left 5th IC space, mid-clavicular line V5: Horizontal to V4, anterior-axillary line V6: Horizontal to V5, mid-axillary line
Figure 1.6: Placement of V-Lead Electrodes

14 Paramedic Code STEMI Activation Reference Material
Lead V1 measures the electrical activity across the horizontal plane from the front of the chest towards the central terminal (Wilson’s Central Terminal). From this perspective most electrical current is moving away from the V1 electrode with normal depolarisation. The deflections seen in V1 are thus predominantly negative, i.e. the P wave QRS complex and T wave are often seen inverted normally in V1.
Figure 1.7: View in the Horizontal Plane
Comparatively, Lead V6 measures the electrical activity across the horizontal plane from the left lateral aspect of the chest towards the central terminal. From this perspective most of the current of normal depolarisation is moving towards the V6 electrode and so the deflections seen on the ECG in V6 are predominantly positive or upright.

These perspectives are illustrated in Figure 1.7. The QRS deflections in V1 are predominantly negative and opposite to those seen in V6 which are predominantly positive. Now look at the R-Waves differences between the V-Leads. Notice that the R-Wave changes progressively from being small in leads viewing from the anterior of the chest to being tall in leads viewing from that lateral side of the chest. This is known as R-Wave progression.
15
Code STEMI Activation Reference Material
Paramedic
Figure 1.8: Standard 12 Lead ECG Layout
The standard 12-Lead ECG (Figure 1.8 above) shows the grouping and order of the leads. Leads in the frontal plane are grouped on the left hand side of the ECG, whereas the leads of the horizontal plane are on the right.
It is useful to be aware that not all ECGs are printed out in this standard format, and in fact the positions of respective leads can be altered by the user. This is, however, the standard accepted layout that should be used by paramedics.

Many hospital acquired 12-Lead ECGs include an additional extended rhythm strip across the bottom of the page. Whilst this strip is usually lead II, this can in fact be set to display any lead of interest. In each case, the respective lead is labelled to aid identification. To avoid ECG interpretation errors, it is essential that the paramedic look at the label beside each ECG strip to ensure that the appropriate lead is being viewed.
Figure 1.9 Lead Grouping by Anatomical Location

16 Paramedic Code STEMI Activation Reference Material
(
12-lead eCg interPretation
PurPose
To introduce a systematic approach to essential aspects of 12-Lead ECG interpretation applicable to paramedic practice. Particular emphasis is placed on the identification of ischaemic changes associated with acute myocardial infarction (AMI) and rapid ST-segment elevation myocardial infarction (STEMI) identification.
learning outComes
• Apply a systematic approach to 12-Lead ECG analysis
• State and identify the ECG changes associated with acute ischaemia, injury or infarction
• Recognise the myocardial regions commonly affected by ischaemia and infarction, and identify the respective groups of ‘facing’ ECG leads
• State the significance of reciprocal ECG changes and identify the groups of ECG leads likely to indicate respective reciprocal changes
• Identify the differentiate Left and Right Bundle Branch Block on a 12-Lead ECG
• Demonstrate the application of a systematic process in reporting the interpretation of a 12-Lead ECG
• List common conditions that may mask or mimic an ST elevation myocardial infarction (STEMI)
• Correctly identify inferior, anterior, lateral and septal STEMI on a diagnostic 12-Lead ECG.
17 Paramedic Code STEMI Activation Reference Material
introduCtion
A correctly acquired and interpreted diagnostic quality 12-Lead ECG can aid in the identification of numerous conditions, including myocardial ischaemia, acute myocardial infarction (AMI), rhythm and conduction disturbances, electrolyte imbalances, hypertrophy (enlargement) , drug toxicity and more. In fact there are an infinite number of ECG variations and it is not necessary for paramedics to become experts in all areas of ECG interpretation.
This chapter introduces a systematic approach to 12-Lead ECG analysis with particular emphasis on the identification of ischaemic changes and how the findings from a 12-Lead ECG should be interpreted and reported. An overview of 12-Lead ECG analysis is provided, followed by a more detailed explanation of each of the steps involved. Exercises have also been provided in this chapter to assist in developing an understanding for each of the steps in ECG analysis.
a systematiC aPProaCh to 12-lead eCg interPretation
A systematic process of analysis is essential to ensure critical characteristics or pieces of information are not overlooked. When analysing ECGs, it is important that a logical sequence of steps is followed. The novice is encouraged to work through each step methodically whilst developing competency. Experienced practitioners often analyse a 12-Lead ECG rapidly, however, a systematic approach is still essential to ensure an accurate interpretation.
The following are recommended steps that should be followed when interpreting an ECG:
18 Paramedic Code STEMI Activation Reference Material
1. Confirm
Ensure
2. Determine
and rate •
• Rate • P wave morphology • PR
• QRS complex width • T wave morphology 3. Determine
injury or infarction
Scan each lead grouping for ST
Scan each lead grouping for ST
T wave
or peaked
4. Determine ischaemia, injury or infarction 5. Systematic approach to
ECG reporting
Rhythm • Rate • Abnormalities
ECG is of diagnostic quality •
all 12-Lead tracings are present, legible and aVR indicates correct limb lead orientation
rhythm
Rhythm
interval
ischaemia,
•
elevation •
depression,
inversion
T waves
12-Lead
•
Confirming Diagnostic Quality
Scan all 12 leads to ensure that the tracings are present and are clearly legible. Loose electrodes, wires or poor connections can result in missing or poor quality ECG tracings. It is essential to have a complete and legible ECG before attempting any interpretation. If any information is missing or illegible, the ECG should be re-acquired. It can also be useful to look at Lead aVR which should show a similar yet inverted tracing to that in Lead II. If this is not the case, the Limb Leads may have been placed incorrectly.
Determining Ischaemia, Injury or Infarction
Poorly perfused myocardial tissue is starved of oxygen, leading to ischaemia. Persistent myocardial ischaemia evolves to injury, which in turn evolves to infarction. Click the icon below to review the Electrophysiological changes seen in myocardial ischaemia.
It is important to remember that the absence of ischaemic changes on the ECG does not imply an absence of ischaemia, injury or infarction. It is common for the ECG be normal in the early stages of infarction. This highlights the importance of serial ECGs. Myocardial ischaemia can also be present without any obvious ECG changes.
Important Note:
• The absence of ischaemic changes on the ECG does not imply absence of ischaemia
• Myocardial infarction can be present without any ECG changes
• It is not uncommon for an ECG to appear normal in the early stages of infarction
19 Paramedic Code STEMI Activation Reference Material
ECG changes associated with ischaemia, injury and infarction
Signs of acute ischaemia, injury and infarction include:
• ST segment elevation
• ST segment depression
• Peaked T waves
• Inverted T waves
• Pathological Q waves
These changes usually occur within seconds to minutes of ischaemia onset and are apparent in the lead grouping overlooking the area of the myocardium that is affected (referred to as the ‘facing’ leads).
ST Segments
Alterations in the position of the ST segment can be indicative of ischaemia. As ST segment elevation is a hallmark of acute myocardial infarction, we will spend some time exploring the identification of ST segment changes and some of the other conditions that can also alter the position of the ST segment.
The ST segment is the portion of the ECG between the end point of the QRS complex (commonly referred to as the J point) and the beginning of the T wave. Unfortunately these two points are not always easily identified. While the ST segment may be horizontal or slope upwards or downwards, it should always be on or near the isoelectric line. The isoelectric line can be identified by placing a line between the TP segments (see figure 2.1 below). In tachycardias where P waves are merged with T waves, the PR segment can be used instead.
Figure 2.1

20 Paramedic Code STEMI Activation Reference Material
The following diagram (figure 2.2) highlights the isoelectric line (A.K.A baseline), the J point and the ST segment. ST elevation or depression is the measurement between the isoelectric baseline and the J point1
Figure 2.2: The J Point and ST Segment
ST segment elevation
ST segment elevation is likely to be indicative of acute myocardial injury when it is greater than or equal to 1 mm in the limb leads and/or greater than or equal to 2 mm in the chest leads (with the exception of V1 which may have 2 mm ST elevation as a normal variant). ST segment depression of 1 mm or greater in any lead may indicate ischaemia.

While ST segment abnormalities are often associated with ischaemia or infarction, they can also be attributed to other non-cardiac causes. These ‘mimics’ will be discussed later.
1 O’Gara, P.T., Kushner, F.G., Ascheim, D.D., Casey, D.E., Chung, M. K., de Lemos, J.A., Zhao, D.X. (2013). 2013 ACCF/ AHA Guideline for the Management of ST-Elevation Myocardial Infarction. A Report of the American College of Cardiology Foundation/ American Heart Association Task Force on Practice Guidelines. Circulation. 2013; 127:e362-e425
21
Code STEMI Activation Reference Material
Paramedic
Figure 2.3 Examples of ST elevation


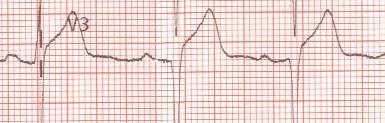
Figure 2.4 Examples of ST depression
22 Paramedic Code STEMI Activation Reference Material
ST segment depression
Causes of ST segment depression include:
• Myocardial ischaemia
• NSTEMI
• Reciprocal changes in STEMI
• Posterior STEMI
• Digoxin effect
• Hypokalaemia
• Supraventricular tachycardia
• Bundle Branch Block
• Ventricular hypertrophy
T waves
T waves that appear as unusually tall, pointed or near the height of the QRS complex are referred to as ‘peaked’ T waves. Inverted T waves are easy to spot as being a clear abnormality on lead views that normally have upright T waves. Remember that an inverted T wave is normal in Lead aVR.
Q waves
Q waves represent the normal left-to-right depolarisation of the septum. Small ‘septal’ Q waves are typically seen in the lateral leads (I, aVL, V5-6). They can also be seen in other leads, however don’t typically appear in V1-V3.
Q waves are deemed ‘pathological’ where one or more of the following are present:1
• > 40 ms (1 mm) wide
• > 2 mm deep
• > 25% depth of QRS complex
• Seen in V1 - V3
While pathological Q waves are often associated with myocardial infarction, they can also be present in the setting of ventricular enlargement, left bundle-branch block, Wolff-Parkinson White pre-excitation, cardiomyopathy and misplacement of ECG electrodes.
When associated with myocardial infarction, Q waves are an indicator of full trans-mural necrosis, and can take hours to days to develop. As all infarctions do not have full transmural involvement, pathological Q waves will not always evolve. Given this variability, the presence of Q waves is an unreliable early sign of acute infarction.
1 Thygesen K., Alpert J.S., White H.D., Jaffe A.S., Apple F.S., Galvani M., Katus H.A., Al-Attar N. Universal definition of myocardial infarction.(2007). Circulation 2007 Nov 27; 116(22) 2634-53
23 Paramedic Code STEMI Activation Reference Material
EXERCISE
Look at the ST segments and T Waves in the following ECG. You should notice:
• ST ↑ of about 1 mm in leads I and aVL
• ST ↑ of in V2 - V4 > 2 mm↑
• T waves are inverted in III, aVF (Note: aVR is normally inverted).
Hint: Take the time to identify the isoelectric line before measuring ST segments.
Click on the image below to open a larger version of the ECG.
24 Paramedic Code STEMI Activation Reference Material
Localisation of ischaemia, injury and infarction
Ischaemia, injury and infarction of the myocardium are usually caused by compromised patency of coronary vessels, often due to arteriosclerosis or a thrombus. The myocardium distal to an occlusion suffers diminished perfusion with concomitant deficiency in oxygen and energy which is required for normal repolarisation. Abnormal repolarisation and electrolyte leakage from the effected myocardial cells results in T wave and ST segment changes on the ECG.
There is often a clear relationship between a particular compromised coronary vessel, the resulting area of affected myocardium, and the ECG leads facing the affected area. For example, the right coronary artery (RCA) commonly perfuses much of the inferior aspect of the heart. Occlusion of this vessel would result in inferior ischaemia or infarction, which would likely manifest as ST elevation in leads II, III and/or aVF.
The following table and diagram correlates major coronary vessels with the region of the heart that the vessels perfuse, and the leads that face that region.

Figure 2.5 Coronary Perfusion Table 2.0 Coronary Perfusion and Related Leads
It is worth noting that coronary distribution can vary between individuals. Table 2.0 is accurate in approximately 89% of the population1.
25 Paramedic Code STEMI Activation Reference Material
1 Halpern, J.E.(2011). Clinical Cardiac CT: Anatomy and Function. Thieme Publishers Series
Contiguous leads
This term refers to ECG leads that look at the same anatomical region of the heart. From a diagnostic perspective, we need to see ST elevation in two or more contiguous leads before considering a diagnosis of STEMI.
Consider the following example. We know that leads II, III and aVF view the inferior aspect of the left ventricle. If we saw an ST elevation in just one lead, say aVF, we would have insufficient evidence to make a determination. We would need ST elevation in a contiguous lead (II and / or III) to provide corroboration.
Table 2.1 Contiguous Leads
There is a slight exception when it comes to chest leads. Any two chest leads next to one another are considered contiguous. For example, while V2 is a septal lead and V3 is an anterior lead, they are considered contiguous because their anatomical locations are next to one another.

26 Paramedic Code STEMI Activation Reference Material
Reciprocal changes
ST elevation associated with trans-mural (full thickness) injury may also be accompanied by ST depression in leads that view the injury site from an opposite point-of-view. This depression is termed ‘reciprocal changes’. The cause of reciprocal changes is believed to be secondary to co-existing ischaemia, infarct extension, or an electrophysiological phenomenon caused by displacement of the injury’s current vector away from the non-infarcted myocardium. Reciprocal change can be identified in about one-third of patients with anterior AMIs and up to 80% of patients with inferior AMI. While the presence of reciprocal change increases the positive predictive value for a diagnosis of AMI to more than 90%1, their absence should not diminish the suspicion of STEMI.
1 Pollehn, T., Brady, W.J., Perron, A.D. & Morris, F. (2002). The Electrocardiographic Differential Diagnosis of ST Segment Depression. Emerg Med J 2002;19:129-135

27 Paramedic Code STEMI Activation Reference Material
STEMI Mimics
There are a number of conditions that cause ST segment elevation other than STEMI. These need to be considered and excluded (where practical) when considering a diagnosis. These mimics include:
• Left Bundle Branch Block
• Wide complex ventricular and paced rhythms
• Pericarditis
• Early repolarisation
• Variant Angina (Prinzmetal’s angina)
• Left ventricular hypertrophy
• Traumatic brain injury
• Ventricular aneurysm
• Other
Left Bundle Branch Block (LBBB)
A LBBB can be either acute or chronic in presentation. When electrical conduction through the left bundle branch is ‘blocked’ it causes abnormal depolarisation and therefore abnormal repolarisation of the ventricles.
LBBB most often occurs in patients with underlying heart disease and may be associated with progressive conduction system disease. However, LBBB can also be seen in asymptomatic patients with a structurally normal heart. The presence of LBBB complicates the diagnosis of myocardial ischaemia / infarction and interferes with the interpretation of exercise testing. In a patient with significant left ventricular (LV) dysfunction, LBBB results in uncoordinated ventricular contraction and may contribute to heart failure.
The presence of a LBBB results in changes to the ST segments and T waves of the ECG and can either mask or mimic acute ischaemia and infarction. Patients with pre-existing LBBB typically exhibit chronic ST elevation. Because of this, ST segment changes are unreliable predictors of STEMI. An alternative method known as ‘Sgarbossa’s Criteria’ can help identify STEMI in the presence of LBBB. While it reputably has specificity of 98%, it is prone to false negatives1.
Anterior infarction can cause an acute LBBB. Anterior AMIs presenting with a new LBBB have a high mortality rate and rapid reperfusion has a greater impact on decreasing mortality in this group of patients.
1 (2013). 2013 STEMI Guideline Data Supplements. American College of Cardiology and the American Heart Association, Inc. Retrieved from http://circ.ahajournals.org/content/suppl/2012/12/12/CIR.0b013e3182742cf6.DC1/Online_Data_Supplement.pdf
28 Paramedic Code STEMI Activation Reference Material
Identifying a LBBB
When confronted with a wide QRS complex, do not automatically associate the morphology with a bundle branch block. Wide QRS durations also manifest in ventricular rhythms that originate outside the conduction pathways. Before attempting to differentiate between a right and left bundle branch block, first ensure that the rhythm is supraventricular
The left and right bundle branches represent major conduction pathways through the myocardial septum to the left and right ventricles respectively. Conduction through these branches normally occurs concurrently with subsequent simultaneous depolarisation of the left and right ventricles. This occurs in less than 0.12 seconds (<3 small boxes) resulting in a narrow QRS complex on the ECG tracing.
When conduction through the left bundle branch is blocked, the conduction of the impulses through to the ventricles and ventricular depolarisation becomes asynchronous, with the left ventricle depolarising later than the right. This abnormal asynchronous depolarisation of the ventricles results in a wide QRS complex and subsequent abnormal repolarisation.
Diagnostic criteria for LBBB includes:
• Supraventricular rhythm (pacemaker site above the ventricles)
• QRS duration > = 0.12 seconds (3 small squares)
• Dominant S wave in V1
• Broad monophasic R waves in lateral leads (I, aVL, V5, V6)
Figure 2.6: Left Bundle Branch 12-Lead ECG

29 Paramedic Code STEMI Activation Reference Material
Identifying a Right Bundle Branch Block (RBBB)


In RBBB, activation of the right ventricle is delayed because depolarisation has to spread across from the left ventricle. The left bundle is activated normally meaning that the early part of the QRS complex is normal. The delay in activating the right ventricle produces a second R’ wave in the right chest leads (V1 - V3) and a wide slurred S wave in the lateral leads. Unlike in LBBB, the ST segment in RBBB isn’t significantly affected. As a result, STEMI can be diagnosed from an ECG in the presence of a RBBB.
Diagnostic criteria for a RBBB include:
• Supraventricular rhythm (pacemaker site above the ventricles)

• QRS duration > = 0.12 seconds (3 small squares)
• RSR’ pattern in V1 - V3 (M-shaped complex)
• Wide slurred S wave in the lateral leads (I, aVL, V5 - V6)
Figure 2.7: Right Bundle Branch 12-Lead ECG
Below is an alternative method for bundle branch recognition and differentiation:
Recognition of BBB
If both the below criteria are met, suspect a BBB:
• Wide QRS (equal or greater than 0.12 seconds or 3 small squares)
• Supraventricular rhythm
Right or Left BBB?
• Look at V1 (this method only works in V1)
• Does the QRS meet the criteria for BBB?
• If it does follow the steps below:
• Find the J point
• Draw a line into the centre of the QRS
• Draw a line back towards complex point
• Shade the area in
• If the arrow points up it is a right BBB, if the arrow points down it is a left BBB
30 Paramedic Code STEMI Activation Reference Material
Wide complex ventricular and paced rhythms
An abnormal wave of depolarisation across the ventricles manifests as a wide QRS complex. As with an LBBB, when there is abnormal depolarisation of the ventricles there follows abnormal repolarisation, effectively creating ST and T wave changes that can mask or mimic STEMI. This is the case with most wide complex rhythms.
Artificially paced ventricular rhythms
A pacemaker will cause abnormal myocardial depolarisation, often indicated by a wide QRS complex and followed by abnormal vectors of repolarisation, manifesting as ST segment and T wave changes. For this reason ventricular paced rhythms make STEMI diagnosis problematic. While Sgarbossa’s Criteria has been proposed to assist diagnosis in the face of single ventricular pacing, biventricular and other pacing lead placement further complicate the issue.
The following ECG illustrates a ventricular paced rhythm in the setting of a suspected STEMI.

Figure 2.8: Ventricular Paced Rhythm
Ventricular escape rhythms and ventricular tachycardia
Whenever impulses are not transmitted from the atria or junction to the ventricles, the ventricles will depolarise at their own intrinsic rate, usually at 15-40 times per minute. This intrinsic depolarisation is triggered by an ectopic focus within the ventricles. This in turn triggers an abnormal wave of depolarisation across the ventricles manifesting as a wide QRS complex, followed by abnormal vectors of repolarisation, manifesting as ST and T wave changes. Similarly, ventricular tachycardias are triggered by an ectopic focus within the ventricles with subsequent abnormal vectors of depolarisation and repolarisation. For this reason ventricular escape rhythms and ventricular tachycardias cannot be used to diagnose STEMI.
31
Code STEMI Activation Reference Material
Paramedic
Common ventricular escape rhythms may include complete heart block and idioventricular rhythms. While they may both be secondary to an AMI, only after reversion of these dysrhythmias and the establishment (or presence) of a narrow complex rhythm, should a 12-Lead ECG be considered for the purpose of identifying STEMI.
Pericarditis
In acute pericarditis, the ECG changes are a direct result of the inflammatory process taking place between the pericardial layers. The ECG is altered because of the extension of the inflammatory process to the sub epicardial myocardium. The two classic ECG findings of acute pericarditis are ST elevation and PR depression.
ST segment elevation is the most sensitive and most consistent finding. Typically the elevation is usually 1.0 - 2.0 mm and may be present in the majority of the standard ECG leads. The exception to this observation may be seen in leads aVR and V1 where the ST segment is typically depressed. The morphology of the ST segment elevation in acute pericarditis is characteristically concave and upward facing.
The ST segment elevations seen in acute pericarditis are often transient and are sometimes followed by diffuse T wave inversion. The T wave inversions are also transient and may resolve completely with time. Some patients with signs and symptoms suggestive of pericarditis have no or non-specific changes on ECG. In the majority of patients however, some ECG abnormality persists for an extended period of time. The PR segment depression is another ECG sign of acute pericarditis. It is a very specific sign and is attributed to sub epicardial atrial injury and is visible in all leads except aVR and V1.
Figure 2.9: Acute Pericarditis

32
Code STEMI Activation Reference Material
Paramedic
Early repolarisation (ER)
Early repolarisation (AKA Benign Early Repolarisation) has long been used to describe a QRS-T variant on the ECG. Most literature defines ER as being present on the ECG when there is J-point elevation of ≥0.1 mV in two adjacent leads with either a slurred or notched morphology. Historically, ER has been considered a sign of good health because it is more prevalent in athletes, younger persons, and at slower heart rates. However, a number of recent reports have suggested an association between ER and an increased risk for arrhythmic death and idiopathic VF.
While some level of increased risk of sudden cardiac death has been reported in people with ER, the relatively high prevalence of the ER pattern in the general population (5 - 13 %) in comparison to the incidence of idiopathic VF (approximately 10 cases per 100,000 population) means that the ER pattern will nearly always be an incidental ECG finding with no clinical implications.1
ECG features of ER
• J-point elevation of >= 0.1 mV (1mm) in two adjacent leads with either of the following two morphologies:

• A sharp well-defined positive deflection or notch immediately following a positive QRS complex at the onset of the ST segment
• The presence of slurring at the terminal part of the QRS complex.

Figure 2.10: ER Notching and Slurring
• Widespread concave ST elevation, predominantly seen in the chest leads but can occur elsewhere
• Large mostly symmetrical T waves concordant with the QRS complex (pointing in the same direction)
• No reciprocal depression to suggest STEMI
• ECG segments remain the same over time.
1 Krahn, A., Link, M.S. & Downey, B.C. (2015). Early Repolarisation. UpToDate. Retrieved from http://www.uptodate.com/ contents/early-repolarization
33
Code STEMI
Reference Material
Paramedic
Activation
Variant Angina (Prinzmetal’s Angina)
Variant angina (VA) also known as Prinzmetal’s or vasospastic angina is characterised by episodes of angina pectoris with associated ST elevation evident on an ECG. It typically occurs in the early hours of the morning at rest, and is triggered by coronary artery vasospasm. Unlike STEMI, it generally occurs without significant coronary artery stenosis. Patients with VA typically present with a chronic pattern of recurrent episodic chest pain. Episodes of chest pain usually last between 5 - 15 minutes.
Typical clinical presentation
• Discomfort more common than pain
• Gradual onset and offset
• Difficulty localising discomfort / pain
• Radiation common
• Increased sympathetic tone + / - palpitations
• Patient often younger exhibiting fewer cardiovascular risk factors
• May be associated with other vasospastic disorders
• History of drug abuse may be common (such as cocaine)
• Hyperventilation can precipitate VA
• Not exercise invoked
ECG features
Patients with VA typically have ST segment elevation on their ECG during an episode of chest discomfort. While these changes resolve on symptom resolution, these patients should be followed up with serial troponin testing to exclude myocardial infarction.
Left ventricular hypertrophy
Left ventricular hypertrophy (LVH) refers to an increase in the size of myocardial fibres in the left ventricle. The hypertrophy is usually the response to chronic volume or pressure load caused by systemic hypertension and aortic stenosis. This leads to valvular incompetence and dilated cardiomyopathy. LVH can also be seen in healthy athletes in response to training and is sometimes referred to as the ‘athletic heart’.
LVH is a chronic condition. It takes weeks to years to evolve, and increases the risk of significant cardiovascular complications such as arrhythmias and congestive heart failure. It is thought that myocardial fibrosis also plays a part in these complications.
The thickened left ventricle leads to a number of ECG changes including abnormalities in the ST segment and T waves. This can complicate STEMI diagnosis and has led to false positives in patients with LVH and chest pain.1
1 Armstrong, E.J., Bhave, P.D., Hoffmayer, K.S., Ganz, P. & McCabe, J.M.(2011). Abstract 9302: Electrographic Criteria do STElevation Myocardial Infarction in Patients with Left Ventricular Hypertrophy. Circulation. 2011;124:A9302
34 Paramedic Code STEMI Activation Reference Material
Traumatic Brain Injury
Cardiovascular complications are common in traumatic brain injury (TBI). Complications include hypertension, hypotension, ECG changes, arrhythmias, release of cardiac injury biomarkers, and left ventricular dysfunction. The abnormalities are linked to TBI induced catecholamine release and neuro-inflammatory response, and often resolve after appropriate treatment.
TBI related ECG abnormalities are particularly common in sub-arachnoid haemorrhage (SAH) where they are reported in 49-100% of cases.1 The most common findings are ST segment changes, T wave abnormalities, prominent U waves, and prolongation of the QTc interval. Clinical studies suggest that these changes are due to myocardial injury secondary to local sympathetic activation.1 Even though it is well accepted that neurogenic ECG changes aren’t related to cardiac hypoperfusion, it can be difficult to differentiate them from an acute ischaemic event.
The following ECG was taken from a previously healthy 18-year old with severe TBI and significantly raised intracranial pressure.2

Figure 2.11: ST Elevation in Patient with TBI and RICP
1 Gregory, T. & Smith, M. (2011). Cardiovascular Complications of Brain Injury. Contin Educ. Crit Care Pain(2011). Retrieved from http://ceaccp.oxfordjournals.org/content/early/2011/12/21/bjaceaccp.mkr058
2 Burns, E.(2015). Raised Intracranial Pressure. Life in the Fast Lane. Retrieved from http://lifeinthefastlane.com/ecg-library/ raised-intracranial-pressure/
35 Paramedic Code STEMI Activation Reference Material
Ventricular Aneurysm
Previous myocardial infarctions, particularly anterior infarctions involving the left ventricular wall can predispose patients to ventricular aneurysms. With the reshaping of the ventricular wall, the cardiac vectors of repolarisation are altered. More than 95% of patients with a ventricular aneurysm exhibit some ECG changes. Of these, ST segment elevation is present in 20 %, and non-specific changes in the remainder.1
The ST elevation is not due to acute repolarisation changes but structural changes in the ventricle and may persist indefinitely after infarction. Differentiating an aneurysm from an acute ischaemic event can be difficult, and relies on other assessment tools such as transoesophageal echocardiography. It is worth noting that the presence of a confirmed ventricular aneurysm does not rule out the possibility of a concomitant acute STEMI.
There are a few factors to consider that may assist in forming a provisional diagnosis of STEMI. Firstly, if the patient has no history of AMI it is unlikely that they have a ventricular aneurysm. Secondly, if reciprocal changes are present, the ST elevation is most likely due to acute injury. Of all the conditions that may mimic STEMI, ventricular aneurysm is likely to be the most difficult for the paramedic to differentiate.
Other
Other STEMI mimics include:
• Brugada Syndrome
• Aortic Dissection
• Myocarditis
1 Shapira, O.M. (2104). Left ventricular aneurysm and pseudoaneurysm following acute myocardial infarction. UpToDate. Retrieved from http://www.uptodate.com/contents/left-ventricular-aneurysm-and-pseudoaneurysm-following-acute-myocardial-infarction
36
Code STEMI Activation Reference Material
Paramedic
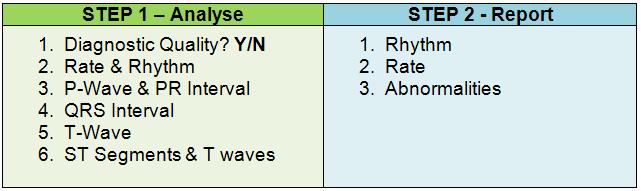
systematiC 12-lead eCg interPretation and rePorting
Analysis of a 12-Lead ECG can yield a large amount of valuable data which can be confusing if reported in a jumbled, illogical manner. As with hospital notification and hand over procedures, a system for reporting data derived from the 12-Lead ECG ensures ease, efficiency and accuracy in information exchange. The system recommended for reporting information from a 12-Lead ECG is consistent with that used for reporting rhythms.
The following information should be stated when reporting the results of a 12-Lead ECG:
1. The rhythm
2. The rate of the rhythm
3. Any abnormality.
The following examples illustrate a systematic approach to ECG reporting. While the first three examples only describe the rhythm and rate, the other examples also include specific 12-Lead findings.
A sinus rhythm at a rate of 80.
A ventricular rhythm at a rate of 30 due to a complete heart block.
A paced ventricular rhythm of 60.
A sinus tachycardia at a rate of 110 with 4mm ST elevation in anterior leads V3 and V4 and reciprocal ST depression in the inferior leads.
A sinus bradycardia at a rate of 44 with a 1st degree AV block and ST elevation in inferior leads II, III and a VF without reciprocal changes
A junctional rhythm at a rate of 106 with a left bundle branch block.
37 Paramedic Code STEMI Activation Reference Material
exerCises
38 Paramedic Code STEMI Activation Reference Material
2.
3.
4. If
5. Systematic
Abnormalities
1. Confirm ECG is of a diagnostic quality All 12 ECG lead tracings are present, legible and aVR indicates correct limb lead orientation.
Determine rhythm and rate • Rhythm • Rate • P wave morphology • PR interval • QRS complex width • T wave morphology
Determine ischaemia, injury or infarction • Scan each lead grouping for ST elevation • Scan each lead grouping for ST depression, T wave inversion or peaked T waves
ST elevation present, consider STEMI mimics
approach to 12-Lead ECG reporting • Rhythm • Rate •
Consolidation
This section is designed to help you to consolidate your learning. Examine the following ECGs using the systematic approach (shown below) and write down your findings. You can review your answer by clicking the answer button after each question.

39 Paramedic Code STEMI Activation Reference Material
Exercise
ECG
1

40 Paramedic Code STEMI Activation Reference Material
Exercise 2
ECG

41 Paramedic Code STEMI Activation Reference Material ECG Exercise 3

42 Paramedic Code STEMI Activation Reference Material
4
ECG Exercise
43 Paramedic Code STEMI Activation Reference Material ECG Exercise 5

44 Paramedic Code STEMI Activation Reference Material ECG Exercise 6

45 Paramedic Code STEMI Activation Reference Material ECG Exercise 7

46 Paramedic Code STEMI Activation Reference Material ECG Exercise 8
PurPose
12-lead eCg in ParamediC
PraCtiCe
To introduce a systematic approach to the management of chest pain consistent with Acute Coronary Syndrome (ACS) that incorporates Code STEMI activation by Paramedics.
learning outComes

• Describe the clinical presentation of myocardial infarction
• Discuss the diagnostic criteria for STEMI
• Discuss atypical STEMI presentation
• Describe the systematic approach to the management of ACS chest pain
• Describe the SA Ambulance Service Code STEMI Activation process
• List the Code STEMI activation criteria
47 Paramedic Code STEMI Activation Reference Material
introduCtion
The introduction of Code STEMI activation for Paramedics complements existing clinical practice. Its introduction alongside a new systematic approach to ACS management is primarily designed to improve patient outcome and safety. It also has the added benefit of allowing paramedics greater clinical autonomy.

This chapter will review the presentation of ACS, and discuss the diagnostic criteria of STEMI. It will also introduce the new systematic approach to ACS management, and explore the patient and ECG criteria that need to be met before Code STEMI activation is considered.
48 Paramedic Code STEMI Activation Reference Material
aCute Coronary syndrome
ACS is a term that describes a spectrum of conditions compatible with acute myocardial ischaemia and/or infarction due to an acute reduction in coronary artery blood flow. These include:
• NSTEACS (Non-ST Elevation ACS). This incorporates unstable angina and Non-ST Elevation Myocardial Infarction (NSTEMI)
• STEACS (ST-Elevation ACS). This term is used interchangeably with ST Elevation Myocardial Infarction (STEMI)
The SNAPSHOT ACS study in 2012 looked at 4,398 patients hospitalised with suspected or confirmed ACS across 286 sites in Australia and New Zealand. The graph below summarises the diagnosed cause of the ACS symptoms.1
Figure 3.2: Cause of ACS Symptoms (SNAPSHOT ACS Study 2012)
Of interest is the finding that while 33% of the patients were diagnosed with acute myocardial infarction (AMI), only a third of these had ST segment changes consistent with STEMI. In other words, two-thirds of the patients with AMI did not have an ECG that met STEMI criteria. While hospital investigations include bio-marker assays to identify NSTEMI, pre-hospital clinicians are typically reliant on patient presentation alone. As such, paramedics need to maintain a high level of suspicion for AMI in the face of on-going ACS symptoms and a non-specific 12-Lead ECG.

NSTEACS
Unstable Angina
Unstable angina is considered to be an ACS in which there is no discernible release of enzymes or biomarkers indicative of myocardial infarction. Where it differs from stable angina is that the pain is often more intense, is more easily provoked, and ST segment depression or elevation may be present on ECG.
The symptoms of unstable angina can be similar to myocardial infarction making it difficult to distinguish between the two without serial ECGs and biomarker assays. Click on the icons below to view articles containing more information.
1 Chew, D.P., French, J., Briffa, T.G., Hammett, C. J., Ellis, C. J., Ranasinghe, I., … Brieger, D. B. (2013). Acute Coronary Syndrome Care Across Australia and New Zealand: The SNAPSHOT ACS Study. MJA 2013; 199: 1-7. doi: 10.5694/mja12.11854
49 Paramedic Code STEMI Activation Reference Material
NSTEMI
NSTEMI is distinguished from unstable angina through the elevated levels of cardiac enzymes and biomarkers indicative of myocyte necrosis. The diagnosis is based on the presence of abnormal biomarker assays at 8-12 hours after the onset of chest pain1. It is thought that the lack of ST segment seen in NSTEMI is because the infarct doesn’t involve the full thickness of the myocardium (transmural). While STEMI typically results from a persistent occlusion of a large epicardial coronary artery, NSTEMI may result from a number of states that reduce coronary flow without complete occlusion. These include distal embolisation of thrombotic material accompanied by coronary spasm, atherosclerotic changes, and plaque rupture2
ECG Changes
The main ECG abnormalities seen in NSTEACS are:
• ST depression
• T Wave flattening or inversion
Other patterns suggestive of ischaemia include:
• Hyper acute T Waves
• U Wave inversion
STEACS
STEACS, commonly known as STEMI or AMI, is a clinical syndrome characterised by symptoms of myocardial ischaemia in association with persistent ECG ST segment elevation and subsequent release of biomarkers of myocardial necrosis.3


STEMI with Normal Coronary Arteries


While it is accepted that the irreversible myocardial necrosis seen in STEMI is caused by a plaque rupture with thrombus formation, STEMI can also occur in patients with normal coronary arteries. On a coronary angiogram, it has been suggested that seven percent of patients with acute STEMI myocardial infarction don’t have a significant coronary artery lesion. This phenomenon is usually seen in younger patients and in women.
1 Burns, E. (2014). Myocardial Ischaemia. Life in the Fast Lane. Retrieved from http://lifeinthefastlane.com/ecg-library/myocardialischaemia/
2 De Winter, R.J. & Tijissen, J.G. (2012). Non-ST-Segment Elevation Myocardial Infarction. Revascularization for Everyone?. J Am Coll Cardiol Intv. 2012;5(9):903-905. doi:10.1016/j.jcin.2012.07.001
3 O’Gara, P.T., Kushner, F.G., Ascheim, D.D., Casey, D.E., Chung, M. K., de Lemos, J.A., Zhao, D.X. (2013). 2013 ACCF/ AHA Guideline for the Management of ST-Elevation Myocardial Infarction. A Report of the American College of Cardiology Foundation/ American Heart Association Task Force on Practice Guidelines. Circulation. 2013; 127:e362-e425.
50 Paramedic Code STEMI Activation Reference Material
Potential mechanisms identified in these patients include:
• Coronary artery spasm

• Coagulopathy
• Toxins (including cocaine)
• Collagen vascular disease
• Emboli (secondary to cholesterol, air and sepsis)
• Coronary trauma
• Arteritis
• Myocarditis
• Factors that increase oxygen demand or decrease oxygen delivery
• Microvascular disease
• Congenital defects.
Takotsubo cardiomyopathy (stress induced cardiomyopathy) is typically characterised by transient systolic dysfunction of the left ventricle that mimics AMI but in the absence of significant coronary artery disease. In a study of 323 women aged 45 years and older with AMI (including elevated troponin), 5.9% met the criteria for stress induced cardiomyopathy.1
STEMI Diagnostic Criteria
The first critical step in STEMI management is early recognition. Patients presenting with non-traumatic chest pain suspicious of ACS require a 12-Lead ECG as part of the initial assessment. ECG changes are often seen early in the onset of myocardial infarction, and can confirm the presence of STEMI. As biomarkers may be within normal levels initially, an early biomarker assay isn’t always helpful or definitive.
A diagnosis of STEMI can be made if at least two of the following three criteria are met:
1. Patient’s clinical presentation consistent with ACS
2. 12-Lead ECG characteristics meet STEMI criteria
3. Biomarker assay indicative of myocardial infarction
Given that cardiac biomarker sensitivity is low in the first six hours of symptom onset, timely STEMI recognition and management relies heavily on patient presentation and ECG features.2 Reperfusion therapy often occurs without the results of cardiac biomarkers being available.
1 Reeder, G.S., Kennedy, H.L, & Rosenson, R.S. (2015). Overview of the Acute Management of ST Elevation Myocardial Infarction. UpToDate. Retrieved from http://www.uptodate.com/contents/overview-of-the-acute-management-of-st-elevation-myocardialinfarction
2 Schreiber, D. (2014). Cardiac Markers. Medscape. Retrieved from http://emedicine.medscape.com/article/811905-overview
51
Code
Reference Material
Paramedic
STEMI Activation
aCute myoCardial inFarCtion
Patient Presentation
STEMI patients typically delay seeking medical attention for their symptoms for up to two hours. Patient delay times are often longer in women and the elderly. It has been suggested that the delay can be attributed to:
• Patient’s symptoms differ from stereotypical presentation (intense crushing chest pain)
• About one-third of patients with AMI don’t experience typical chest pain1
• Belief that the symptoms are trivial and self-limiting
• Attributing symptoms to an existing disease
• Fear of ‘crying wolf’
• Reluctance to bother others unless ‘really sick’
• Denial of being at risk
• Financial hardship
• Poor access to health care
Characteristic Myocardial Infarction Symptoms
Patient symptoms associated with myocardial infarction can be present in prodromal (early symptoms indicating onset) or acute fashion. Prodromal symptoms include malaise, intermittent chest discomfort, and fatigue. Characteristic acute symptoms include:
• Intense unrelieved chest pain for 30 minutes or more

• Retrosternal chest pain
• Pain radiation into neck, jaw, shoulder and left arm
• Chest and retrosternal pressure / squeezing / aching / burning or stabbing
• Epigastric pain / discomfort
• GORD / fullness sensation.
1 O’Gara, P.T., Kushner, F.G., Ascheim, D.D., Casey, D.E., Chung, M. K., de Lemos, J.A., Zhao, D.X. (2013). 2013 ACCF/AHA Guideline for the Management of ST-Elevation Myocardial Infarction. A Report of the American College of Cardiology Foundation/American Heart Association Task Force on Practice Guidelines. Circulation. 2013; 127:e362-e425.
52 Paramedic Code STEMI Activation Reference Material
Clinical Signs Associated with Acute Myocardial Infarction

A thorough patient assessment can also yield additional clues suggestive of myocardial infarction. This is especially useful in the face of atypical symptoms, or when communication with the patient is unreliable. While the following clinical signs aren’t specific to myocardial infarction, they can indicate myocardial ischaemia, ventricular dysfunction, or inappropriate stimulation of the autonomic nervous system:
• Chest pain / discomfort / pressure / fullness
• Arm / shoulder / neck / throat / jaw discomfort
• Increased heart rate and tachyarrhythmias
• Bradycardia
• Irregular rhythms
• Abnormal rhythms
• Ectopic beats and palpitations
• Exertional dyspnoea and decreased exercise tolerance
• Cool clammy skin
• Nausea
• Hypotension / Hypertension
• Venous congestion and JVD
• Pulmonary oedema
Complications of Myocardial Infarction
Figure 3.3: Complications of Acute Myocardial Infarction
The likelihood and severity of MI complications can be quantified through various risk stratification tools. More information can be found by clicking the icon below. The findings of these tools provide the patient with a sense of what to expect in the future, and identify their risk of arrhythmic death.
53 Paramedic Code STEMI Activation Reference Material
Demographic factors that increase the prediction of mortality include:
• Older age
• Larger MIs
• Anterior MI
• Hypotension
• Cardiogenic shock
• Heart failure
• Tachycardias
• Wide QRS complex
• Pulmonary oedema
• Presence of risk factors (hypertension, smoking, previous CVA)
Ischaemic Complications
Infarction extension is an increase in myocardial necrosis within the infarct zone of the original MI. This increase can extend the necrosis into adjacent viable tissue, or increase the thickness of the infarct making it transmural.
Multi-vessel coronary artery disease (CAD) is common in patients with STEMI. It is estimated that up to 40% of STEMI patients demonstrate significant plaque in the non-affected vessels during angiography. This phenomenon may help explain the reocclusion rate of the infarct related artery post fibrinolytic therapy. Up to 10% of patients experience reocclusion at discharge, with the rate rising to 30% at 12 months. Percutaneous coronary intervention (PCI) has significantly reduced this rate to about 3% after 90 days.1
Angina that occurs up to 30 days post STEMI is termed infarction angina. This variant of angina is most likely to affect patients post NSTEMI, and those re-vascularised with fibrinolytic therapy as opposed to PCI.
Arrhythmic Complications
Approximately 90% of STEMI patients develop a cardiac arrhythmia during or after the event. About a quarter of these patients will have the arrhythmia manifest within 24 hours of infarction.2 The risk of life-threatening arrhythmia is greatest in the first hour, and declines thereafter.
Arrhythmias are caused by autonomic dysfunction that enhances the automaticity of myocardial tissue and the conduction system. This is further compounded through the presence of hypoxia and electrolyte imbalance. As tissue damage occurs, myocardial refractoriness is altered increasing the risk or re-entry circuit formation.
1 Grasso., A.W. (2014). Complications of Acute Myocardial Infarction. Cleveland Clinic Centre for Continuing Education. Retrieved from http://www.clevelandclinicmeded.com/medicalpubs/diseasemanagement/cardiology/complications-of-acute-myocardial-infarction/
2 Kondur, A.K. & Afonso, L.C. (2014). Complications of Myocardial Infarction. Medscape. Retrieved from http://emedicine. medscape.com/article/164924-overview#a2
54 Paramedic Code STEMI Activation Reference Material
Arrhythmias seen in MI include:
• Supraventricular (PSVT, sinus tachycardia, PAC, AF and Atrial Flutter)
• Junctional
• Bradycardias (ventricular and junctional)
• AV blocks
• Bundle branch and fascicular blocks
• Ventricular (PVC, idioventricular, VT and VF)
• Reperfusion arrhythmias
Mechanical Complications
The three major mechanical complications of MI are:
1. Ventricular free wall rupture
2. Ventricular septal rupture

3. Papillary muscle rupture with mitral valve regurgitation
While left ventricular failure accounts for the majority of MI fatalities, ventricular free wall rupture is the most serious mechanical complication. It is usually associated with a large transmural (full-thickness) infarct, or an extension of a previous MI.1 It is a common cause of death and accounts for 15-30% of deaths associate with MI. This catastrophic presentation leads to bleeding into the pericardial sac and cardiac tamponade.
1 Kondur, A.K. & Afonso, L.C. (2014). Complications of Myocardial Infarction. Medscape. Retrieved from http://emedicine. medscape.com/article/164924-overview#a2
55
Code STEMI
Reference Material
Paramedic
Activation
Goals of STEMI Management
The first critical step in STEMI management is prompt recognition. Delays in reperfusion therapy reduce the efficacy of treatment, and translates to significant morbidity and mortality. Early intervention limits the size of the infarction and salvages jeopardised ischaemic myocardium.
The goals of STEMI management can be broadly classified as:
1. Early management meeting acute needs
2. Maintenance management designed to improve long-term prognosis
Early Management
• Haemodynamic support (assessment and correction of abnormalities)
• Pain relief
• Reperfusion (PCI or fibrinolytic therapy)
• Prevent acute re-thrombosis or stent occlusion (antithrombotic therapy)
• Rate control and arrhythmia suppression (typically ß-Blocker)
Maintenance Management
• Reduce the risk of re-thrombosis (antiplatelet therapy)
• Prevent / Reduce left ventricular remodelling / hypertrophy (antihypertensive medication)
• Reduce cardiovascular disease (statin therapy)
• Prevent embolisation from thrombus or AF (anticoagulation therapy)
56
Code STEMI Activation Reference Material
Paramedic
aCs management by saas ParamediCs
While an aim of the SAAS STEMI Flow Chart is to identify patients eligible for direct transfer to a PCI facility, its primary aim is to examine a number of referral options based on the patient’s presentation, clinical assessment and location. These referral options attempt to strike a balance between patient needs and patient safety.

The flowchart is designed to be used for all patients presenting with chest pain suspicious of ACS involvement. It will guide the paramedic to the appropriate referral decision based on:
• Patient stability
• Presence of ongoing pain
• Patient specific criteria
• 12-Lead ECG criteria
• Contraindications
The four possible referral options are shown below and will be discussed in more detail shortly
57 Paramedic Code STEMI Activation Reference Material
1 2 3 4
Chest Pain Consistent with ACS
This flowchart should be applied to all patients presenting with chest pain presumed or suspected to be cardiac in origin.

The first section describes preliminary ACS care and should be considered in conjunction with the Paramedic CPG - Chest Pain.
The decision to establish IV access should not be limited to just meeting an obvious need. It should also be established on likely need or anticipated deterioration.
Capturing a 12-Lead ECG at this point has the advantage of establishing an early baseline* and measuring the effectiveness of your treatment.
* 12-Lead ECG criteria for STEMI requires 2 serial ECGs
58
Code STEMI Activation Reference Material
Paramedic
Is the Patient Stable?
Patient stability not only influences morbidity and mortality in the setting of myocardial infarction, but also influences the referral options in the pre-hospital phase.

If a patient presents as clinically unstable or deteriorates in your care, they must be referred to Clinical Support. If this isn’t possible, consult with the EOC Clinician for advice and referral options.
For the purposes of this flowchart, the term ‘Not Stable’ includes but not limited to:
• Decreasing GCS
• Requiring ventilatory support
• Inadequate MAP or BP
• Inappropriate HR or rhythm
• Observations trend suggesting deterioration
• Other concerns (Paramedic’s discretion)
Before embarking on a long transport, consider the patient’s likelihood of deterioration and where possible mitigate this risk.
If you have determined that the patient is stable, the next question you need to ask is “Has the pain resolved?”
59
Code STEMI Activation Reference Material
Paramedic
Has Pain Resolved?
Chest pain* that resolves with rest +/- nitrates is suggestive of Stable Angina (where an imbalance between myocardial oxygen demand and supply results in regional myocardial ischaemia).
By contrast, ACS occurs at rest and is usually caused by a coronary plaque rupture and intracoronary thrombosis formation. As a result, the ischaemic pain in ACS is unlikely to resolve without reperfusion therapy.
Even stable patients with ongoing ACS chest pain are at significant risk of developing lifethreatening complications.
For the purposes of this flowchart, a drop in pain score is not the same as pain resolution. If the patient still has residual pain after the completion of treatment, the pain has NOT resolved.
* Chest pain is a term used to describe discomfort in the arm/shoulder/neck/jaw or chest believed to be cardiac in origin.

60 Paramedic Code STEMI Activation Reference Material
STEMI Criteria Met?
The Code STEMI activation criteria for SAAS Paramedics is divided into a number of subcriteria. These are:
• Patient Specific Criteria
• 12-Lead ECG Criteria
• Absence of Contraindications
All sub-criteria must be met before considering Code STEMI activation. It is important to note that if Code STEMI activation isn’t indicated, this does not mean that the patient isn’t having a myocardial infarction. It simply means that access to a PCI facility isn’t one of your available referral options. Ineligible symptomatic patients should be transported to the nearest appropriate ED, and where possible notification should occur using the ISBAR format. P2 transport should also be considered.

61
Code
Reference Material
Paramedic
STEMI Activation
Patient Specific Criteria
• Symptoms consistent with ACS
• Ongoing unrelieved chest pain
• GCS=15
• Onset of symptoms < 12 hours
• Travel time to PCI facility within 60 minutes
12-Lead ECG Criteria
The following features present on 2 serial ECGs:
• ST-elevation of at least 1mm in 2 or more contiguous limb leads AND / OR
• ST-elevation of at least 2mm in 2 or more contiguous chest leads AND
• Normal QRS* complex duration or RBBB present.
For the purposes of this criterion, normal QRS segment duration is less than 0.12secs.
Contraindications
• Absence of chest pain
• Unstable patient (see previous page)
• STEMI in the setting of trauma
• STEMI in the terminal phase of a terminal illness.
62
Code STEMI Activation Reference Material
Paramedic
Referral Options
As the title Routine Care implies, this referral option is ‘business as usual’. The suggestions of ongoing observations and transport for further care are there to remind you that while your stable patient’s ACS-like symptoms have resolved, monitoring and follow-up are still required.
While Code STEMI activation is NOT warranted in this case, you may still choose to Request Clinical Support or expedite transport to an ED where appropriate
This referral option is only available when all the criteria are met. While Clinical Support is not mandated, you still have the discretion to request it where you feel it would benefit the patient.
This should be the first referral option considered. After assessing the patient during Basic Care, you should be asking the question “Is this patient stable?” If the patient is deemed unstable, Clinical Support must be requested. Where unavailable, consult with the EOC Clinician to discuss management and referral options.

You also have the discretion to request Clinical Support if you believe it is warranted.
This referral option is for stable patients with ongoing / unrelieved chest pain consistent with ACS that fails to meet the Code STEMI activation criteria.
While Clinical Support is not mandated, you still have the discretion to request it where you feel it would benefit the patient. This is especially true for cases where significant travel times are involved, and where you believe that the patient is at risk of deteriorating en-route.
63 Paramedic Code STEMI Activation Reference Material
aCtiVating Code stemi
Code STEMI Hotline
The phone number for the Code STEMI Hotline (and Code STROKE) is:
1300 365 211
Dialling the number will connect you to an automated switchboard where you will be presented with a number of pre-recorded options. Use the phone’s keypad to make your selection.

For Metropolitan PUBLIC Code STEMI, Press 1
For Metropolitan Code STROKE, Press 2
For Metropolitan PRIVATE Code STEMI, Press 4
64 Paramedic Code STEMI Activation Reference Material
Metropolitan PUBLIC Hospital Code STEMI Menu
For Metropolitan PUBLIC Code STEMI, Press 1
For the RAH, press 1
For FMC, press 2

For QEH, press 3
For the Lyell McEwin, press 4
Metropolitan PRIVATE Hospital Code STEMI Menu
For Metropolitan PRIVATE Code STEMI, Press 2
For Ashford Private, press 1
For Calvary Wakefield, press 2
65
Code STEMI Activation Reference Material
Paramedic
Code STEMI Notification
The Code STEMI notification should be done using the ISBAR mnemonic. Prior to making the call, you should take the time to collect the relevant information needed to provide an orderly and concise notification.

If you are unable to connect to the Code STEMI Hotline, notify the destination hospital ED through the routine notification process.
Note: When describing the diagnosis, you can use the correct nomenclature, or describe the ECG criteria that were met to activate Code STEMI. For example, you could say “...serial ECG showing an Inferior infarct...” or alternatively “...serial ECGs with ST elevation greater than 1mm in leads II, III and aVF with reciprocal depression in leads I and aVL.
66
Code STEMI Activation Reference Material
Paramedic
Arriving at Hospital
Activating Code STEMI doesn’t automatically grant you direct access to the cardiac catheterisation laboratory (cath lab). You may be directed to the ED if the patient is deemed to be unstable, or when the cath lab is at capacity.

When transferring your patient at the hospital, it is important to keep the patient monitored and have resuscitation equipment at hand until handover has been completed. You should also provide the receiving clinician with a copy of your serial 12-Lead ECGs, and print an additional copy for your case card.
67
Code STEMI Activation Reference Material
Paramedic
68 Paramedic Code STEMI Activation Reference Material
69 Paramedic Code STEMI Activation Reference Material
/ reFerenCe list
bilbiograPhy
bibliograPhy
UpToDate. (2014). Left Bundle Branch Block. Retrieved from http://www.uptodate.com/ contents/left-bundle-branch-block#H1
Murray, J., & Rogers, B. (2011). The 12-Lead ECG in Paramedic Practice Version 4.0. Queensland Ambulance Service.
Radhakrishnan, A. & Granato, J. E. (2012). Electrocardiograms in Acute Pericarditis, Advances in
Electrocardiograms - Clinical Applications, PhD. Richard Millis (Ed.), InTech, Retrieved from: http://www.intechopen.com/books/advances-in-electrocardiograms-clinical-applications/ acutepericarditis
Burns, E.(2015). Benign Early Repolarisation. Life in the Fast Lane. Retrieved from http:// lifeinthefastlane.com/ecg-library/benign-early-repolarisation/
Krahn, A., Link, M.S. & Downey, B.C. (2015). Early Repolarisation. UpToDate. Retrieved from http://www.uptodate.com/contents/early-repolarization
Pinto, D.S., Beltrame, J.F. & Crea, F.C. (2015). Variant Angina. UpToDate. Retrieved from http://www.uptodate.com/contents/variant-angina
Goldberger, A.L. (2014). Electrographic Diagnosis of Left Ventricular Hypertrophy. UpToDate. Retrieved from http://www.uptodate.com/contents/electrocardiographic-diagnosis-of-leftventricular-hypertrophy
Gregory, T. & Smith, M. (2011). Cardiovascular Complications of Brain Injury. Contin Educ. Crit Care Pain(2011). Retrieved from http://ceaccp.oxfordjournals.org/content/early/2011/12/21/ bjaceaccp.mkr058
Lim, H.B. & Smith, M. (2007). Review Article. Systemic Complications after Head Injury: A Clinical Review. Anaesthesia, 2007, 62, pages 474-482
Goldberger, A.L. (2015). Pathogenesis and Diagnosis of Q waves on the electrocardiogram. UpToDate. Retrieved from http://www.uptodate.com/contents/pathogenesis-and-diagnosisof-q-waves-on-the-electrocardiogram
UpToDate. (2014). Initial Evaluation and Management of Suspected Acute Coronary Syndrome (myocardial infarction, unstable angina) in the Emergency Department. Retrieved from http://www.uptodate.com/contents/initial-evaluation-and-management-of-suspectedacute-coronary-syndrome-myocardial-infarction-unstable-angina-in-the-emergencydepartment
70 Paramedic Code STEMI Activation Reference Material
Burns, E.(2015). Acute Coronary Syndromes. Life in the Fast Lane. Retrieved from http:// lifeinthefastlane.com/ccc/acute-coronary-syndromes/
Tan, W.T. & Moliterno, D. J. (2014). Unstable Angina. Medscape. Retrieved from http:// emedicine.medscape.com/article/159383-overview
Coven, D.L., Kalyanasundaram, A. & Shirani, J. (2015). Acute Coronary Syndromes. Medscape. Retrieved from http://emedicine.medscape.com/article/1910735-overview
Burns, E. (2014). Myocardial Ischaemia. Life in the Fast Lane. Retrieved from http:// lifeinthefastlane.com/ecg-library/myocardial-ischaemia/
Tomich, E.B. (2014). Takotsubo Cardiomyopathy. Medscape. Retrieved from http:// emedicine.medscape.com/article/1513631-overview
Alpert, J.S., Simons, M., Douglas, P.S., Wilson, P.W. & Breall, J.A. (2013). Risk Stratification After Acute ST-Elevation Myocardial Infarction. UpToDate. Retrieved from http://www.uptodate.com/contents/risk-stratification-after-acute-st-elevation-myocardialinfarction?source=see_link
Grasso., A.W. (2014). Complications of Acute Myocardial Infarction. Cleveland Clinic Centre for Continuing Education. Retrieved from http://www.clevelandclinicmeded.com/ medicalpubs/diseasemanagement/cardiology/complications-of-acute-myocardial-infarction/
Reeder, G.S., Kennedy, H.L. & Rosenson, R.S. (2015). Overview of the Management of ST Elevation Myocardial Infarction. UpToDate. Retrieved from http://www.uptodate.com/ contents/overview-of-the-acute-management-of-st-elevation-myocardial-infarction
71 Paramedic Code STEMI Activation Reference Material
reFerenCe list
Chapter 2
O’Gara, P.T., Kushner, F.G., Ascheim, D.D., Casey, D.E., Chung, M. K., de Lemos, J.A., Zhao, D.X. (2013). 2013 ACCF/AHA Guideline for the Management of ST-Elevation Myocardial Infarction. A Report of the American College of Cardiology Foundation/American Heart Association Task Force on Practice Guidelines. Circulation. 2013; 127:e362-e425.
Thygesen K., Alpert J.S., White H.D., Jaffe A.S., Apple F.S., Galvani M., Katus H.A., Al-Attar N.Universal definition of myocardial infarction.(2007). Circulation 2007 Nov 27; 116(22) 2634-53.
Halpern, J.E.(2011). Clinical Cardiac CT: Anatomy and Function. Thieme Publishers Series
Pollehn, T., Brady, W.J., Perron, A.D. & Morris, F. (2002). The Electrocardiographic Differential Diagnosis of ST Segment Depression. Emerg Med J 2002;19:129-135
(2013). 2013 STEMI Guideline Data Supplements. American College of Cardiology and the American Heart Association, Inc. Retrieved from http://circ.ahajournals.org/content/ suppl/2012/12/12/CIR.0b013e3182742cf6.DC1/Online_Data_Supplement.pdf
Krahn, A., Link, M.S. & Downey, B.C. (2015). Early Repolarisation. UpToDate. Retrieved from http://www.uptodate.com/contents/early-repolarization
Pinto, D.S., Beltrame, J.F. & Crea, F.C. (2015). Variant Angina. UpToDate. Retrieved from http://www.uptodate.com/contents/variant-angina
Armstrong, E.J., Bhave, P.D., Hoffmayer, K.S., Ganz, P. & McCabe, J.M.(2011). Abstract 9302: Electrographic Criteria do ST-Elevation Myocardial Infarction in Patients with Left Ventricular Hypertrophy. Circulation. 2011;124:A9302
Gregory, T. & Smith, M. (2011). Cardiovascular Complications of Brain Injury. Contin Educ. Crit Care Pain(2011). Retrieved from http://ceaccp.oxfordjournals.org/content/early/2011/12/21/ bjaceaccp.mkr058
Burns, E.(2015). Raised Intracranial Pressure. Life in the Fast Lane. Retrieved from http:// lifeinthefastlane.com/ecg-library/raised-intracranial-pressure/
Shapira, O.M. (2104). Left ventricular aneurysm and pseudoaneurysm following acute myocardial infarction. UpToDate. Retrieved from http://www.uptodate.com/contents/leftventricular-aneurysm-and-pseudoaneurysm-following-acute-myocardial-infarction
72 Paramedic Code STEMI Activation Reference Material
Chapter 3
Chew, D.P., French, J., Briffa, T.G., Hammett, C. J., Ellis, C. J., Ranasinghe, I., … Brieger, D.B. (2013). Acute Coronary Syndrome Care Across Australia and New Zealand: The SNAPSHOT ACS Study. MJA 2013; 199: 1-7. doi: 10.5694/mja12.11854
Burns, E. (2014). Myocardial Ischaemia. Life in the Fast Lane. Retrieved from http:// lifeinthefastlane.com/ecg-library/myocardial-ischaemia/
De Winter, R.J. & Tijissen, J.G. (2012). Non-ST-Segment Elevation Myocardial Infarction. Revascularization for Everyone?. J Am Coll Cardiol Intv. 2012;5(9):903-905. doi:10.1016/j. jcin.2012.07.001
O’Gara, P.T., Kushner, F.G., Ascheim, D.D., Casey, D.E., Chung, M. K., de Lemos, J.A., Zhao, D.X. (2013). 2013 ACCF/AHA Guideline for the Management of ST-Elevation Myocardial Infarction. A Report of the American College of Cardiology Foundation/American Heart Association Task Force on Practice Guidelines. Circulation. 2013; 127:e362-e425.
Reeder, G.S., Kennedy, H.L, & Rosenson, R.S. (2015). Overview of the Acute Management of ST Elevation Myocardial Infarction. UpToDate. Retrieved from http://www.uptodate.com/ contents/overview-of-the-acute-management-of-st-elevation-myocardial-infarction
Schreiber, D. (2014). Cardiac Markers. Medscape. Retrieved from http://emedicine. medscape.com/article/811905-overview
Grasso., A.W. (2014). Complications of Acute Myocardial Infarction. Cleveland Clinic Centre for Continuing Education. Retrieved from http://www.clevelandclinicmeded.com/ medicalpubs/diseasemanagement/cardiology/complications-of-acute-myocardial-infarction/
Kondur, A.K. & Afonso, L.C. (2014). Complications of Myocardial Infarction. Medscape. Retrieved from http://emedicine.medscape.com/article/164924-overview#a2
73 Paramedic Code STEMI Activation Reference Material
Consolidation exerCise answers
ECG Exercise 1
Acceptable diagnostic quality.
Regular narrow complex tachycardia (likely PSVT) rate of 215. Global ST elevation (likely due to rate).
Return to Exercise 1
ECG Exercise 2
Acceptable diagnostic quality
regular sinus rhythm, rate of 78
ST elevation > 1 mm in I and aVL (Lateral) with reciprocal changes in II, III and aVF (Inferior). Also ST elevation > 2mm in V2-V4 (Septal and Anterior).
This combination of Septal, Anterior and lateral is also known as ‘Extensive Anterior’ Involvement’.
Return to Exercise 2
ECG Exercise 3
Acceptable diagnostic quality. This ECG does not have a 10 second strip of Lead II. As a result, it may be difficult to accurately assess the rhythm. It is sufficient however to determine ST segment and T Wave abnormalities.
Mostly regular sinus tachycardia, rate of 100. LBBB morphology. (QRS duration >0.12, broad R waves in lateral leads, and dominant S wave in V1).
Return to Exercise 3
ECG Exercise 4
Acceptable diagnostic quality.
Regular sinus bradycardia rate of 52. P wave morphology suggestive of LAE.
ST elevation > 2mm in V2-V5 (Septal, Anterior and Lateral). Also 1mm elevation in Lead I, and borderline elevation aVL (Lateral)
This combination of Septal, Anterior and Lateral is also known as ‘Extensive Anterior’ Involvement’.
Return to Exercise 4
74 Paramedic Code STEMI Activation Reference Material
ECG Exercise 5
Acceptable diagnostic quality.
Regular sinus rhythm, rate of 68.
T wave abnormalities - flipped T waves in I, aVL, V4-V6 (Lateral) and T wave flattening in II & aVF (Inferior)
Return to Exercise 5
ECG Exercise 6
Acceptable diagnostic quality.
Atrial flutter with 2:1 block* (atrial rate of 300, ventricular rate of 150).
*The block ratio in Atrial Flutter can change. Have a look at the Lead II 10 second strip. In the first R-R interval, the block ratio is 2:1. The following two are 3:1 (atrial rate 300 ventricular rate 100), then reverts back to 2:1 for the remainder of the ECG
Return to Exercise 6
ECG Exercise 7
Acceptable diagnostic quality.
Third degree AV block (AKA complete heart block) with a ventricular rate of 37. ST elevation > 1 mm in II, III & aVF (Inferior) with reciprocal ST depression in I, aVL (Lateral). Also pathological* Q waves in II & III (Inferior).
Return to Exercise 7
ECG Exercise 8
Acceptable diagnostic quality.
NSR rate of 78.
Return to Exercise 8
75
Code STEMI Activation Reference Material
Paramedic

 Produced by:
