We acknowledge the Bundjalung, Gumbaynggirr and Yaegl people as the Traditional Owners of the land on which we live and work. We honour the First Nations peoples culture and connection to land, sea and community. We pay our respects to their Elders past, present and emerging.
Our Planning Framework
The IP&R Framework guides the way local government plans, documents and reports its future strategies.
The IP&R Framework begins with the community’s aspirations over a period of least 10 years, which is considered by each newly elected council and is underpinned by a suite of integrated plans that set out a vision and objectives.
The Framework then examines specific actions to achieve those aspirations. It involves a reporting structure to communicate progress to the Council and the community as well as a structured review timeline to ensure the goals and actions are still relevant.
The essential
Community Engagement Strategy
The Community Engagement Strategy is based on social justice principles and details how we engage with our community to prepare the Community Strategic Plan.
Community Strategic Plan
The Community Strategic Plan (CSP) is the overarching document for all plans and policies of the Council. It identifies the community’s aspirations and priorities for the future of the local government area.
The five themes of the CSP:
Community
Creating harmony with the natural environment to retain and improve the quality of community life.
Infrastructure
Maintaining Clarence.
Economy
Strengthening that complements
Environment
Valuing, management of the Clarence’s natural environment for current and future generations.
Leadership
Setting the overall direction and long-term goals for the Clarence in accordance with community aspirations.
Delivery Program
The Delivery Program is the key directional document for the term of the elected council. It is developed by a newly elected council and adopted before the end of June in the year following the election. It is presented as a statement of commitment to the community by outlining the focus the Council intends to contribute towards achieving the long-term aspirational goals of the community, as identified in the Community Strategic Plan.
Operational Plan
Supporting the Delivery Program is an annual Operational Plan prepared by the general manager and staff. The Operational Plan outlines how the commitments of the Delivery Program will be achieved by detailing what the organisation will deliver and where, how delivery will be resourced, what the cost will be, who will be accountable for actions taken and how performance will be measured. It is a document of organisational accountability. The Operational Plan is intrinsically linked to staff performance, with outcomes reflected in individual workplans.
The Clarence Valley leadership team in consultation with
Our values
As part of the community Clarence Valley is a community full of opportunity, ensuring that our communities are connected; service level needs in harmony with our environment, and we continue to strive collectively for a better future. The values underpinning Council’s vision and the workforce delivering this are the STRIVE values. Council aims to support
We STRIVE for
our values.
Safety
We have a safety focused workplace culture wellbeing and the community
Teamwork
We one council towards shared the greater good of the community
Respect
We are inclusive, treat people with courtesy and fairness, and ensure each individual is valued and heard
behave in a way that is honest, open, and transparent. We responsibility for our actions and strive for excellence
We deliver services effectively, and environmentally and financially sustainable
We engage with our staff and community to inform our decision making, and create awareness of our activities
Introduction
The Resourcing Strategy forecasts Council’s ability to deliver assets and services to the community over the next 10 years in line with the Community Strategic Plan – The Clarence 2032. It comprises of Council’s Long Term Financial Plan, Workforce Management Strategy and Asset Management Planning.
Long-Term Financial Plan (LTFP)
The Long-Term Financial (LTFP) Council financial sustainability over the long term.
Our LTFP is used our Delivery Program. The Plan covers a ten
• Planning assumptions
• Projected
• Sensitivity
• Financial modelling
• Methods of
We will review our development of our annual Operational Plan. The review will include:
• An assessment of the projections
• An answer
• An answer accurate.
• An explanation estimates and actual expenditure.
Workforce Management Strategy
The Workforce Management Strategy aims to identify current and predicted workforce issues and trends and what will be done to address them.
Our Workforce Management Strategy outlines our commitment to ensuring the Council has the capacity, capability, skills and sustainability within its workforce to deliver positive outcomes for the organisation and ultimately the community by meeting the objectives of the Community Strategic Plan. The Strategy seeks to address major challenges faced by the Council in its endeavours to remain responsive to its community and financially sustainable. The challenges identified include an ageing workforce, workplace health and safety, workforce diversity and leadership, and learning and development needs.
Asset Management Planning
Asset management planning is critical to the operation of the Council and its continuing financial sustainability. Clarence Valley Council is the custodian of approximately $2.5B of community assets to support community activity. These assets include roads, water and sewerage services, drains, bridges, footpaths, buildings, floodplain protection structures, sporting facilities, parks and gardens. The Council is responsible for accounting for and managing these assets to ensure they are maintained in a safe/serviceable condition for their specific use by the community. To do this, the Council must determine acceptable maintenance service levels and the long-term cost of maintaining those service levels. It must then ensure that sufficient financial and human resources are provided now, and in the future, to meet those obligations.
In September 2012, the Council appointed Jeff Roorda & Associates to undertake a review of the Council’s asset management systems and processes, with the key objective of identifying areas where changes and improvements can occur. Contractors are engaged to conduct annual desktop revaluations, with full revaluations conducted on a five-year cycle of the Council’s key infrastructure assets, including buildings, roads, water, sewer and other structures. The data from this process has been incorporated and summarised in the AMS.
In 2015, an asset the Council’s auditor on behalf of the Office of Local Government. The assessment identified areas for improvement, and an action plan has been implemented to address these.
Asset Management elements:
Asset Management
The Council’s Asset for undertaking asset management in a structured and coordinated way and addresses the following:
• Establishing providing a platform for service delivery.
• Integrating
• Maximising performance measurements.
• Assigning accountability and responsibility for service delivery.
• Promoting sustainability to protect the needs of future generations.
Asset Management System (AMS)
Each financial year, the Council develops a new AMS; this identifies assets critical to the Council’s operations and outlines the risk management strategies for those assets. It also includes specific actions required to improve asset management capabilities, project resource requirements and timeframes.
The AMS and AMPs have been developed in line with the Council’s 2025/26 to 2034/35 LTFP. The medium-term projected expenditure is $96M per the general fund AMPs per year (average operations and maintenance expenditure plus projected renewals required over 10 years).
The medium-term LTFP budgeted expenditure over the ten-year planning period is $92M per year (average operations and maintenance plus capital renewal budgeted expenditure in the LTFP over 10 years). The financing shortfall is $5M per year, a medium-term (10-year) financing indicator of 93.5%. This scenario is financially sustainable in the long term. The Council will be able to maintain the condition of infrastructure assets in a sustainable fashion. Performing renewals as they are required will stop the deterioration and failure of assets, thereby reducing the levels of risk. Levels of service can be maintained at current levels.
The LTFP Asset Building and Infrastructure Asset Renewal Ratio by Fund indicates that in the General Fund Council will be expending 226.42% of funds on Asset Renewal in comparison to the annual estimated Depreciation. This is higher than the Council’s target range of 90% to 110%, which is attributable to the significant grant funds that have been approved for expenditure in 2022–2023 and 2025–2026. The Water Fund 395.06% and Sewer fund of 464.77% which is reflecting the pattern of renewals planned as opposed to how this ratio is calculated which effective measures renewals against depreciation on a straight-line basis.
The Council has prepared the following AMPs:
Transport AMP,
▪ sealed roads
▪ unsealed roads
▪ bridges
▪ drainage
▪ stormwater
▪ traffic infrastructure
▪ footpaths
▪ cycleways
Buildings AMP,
▪ amenity buildings
▪ community halls/centres
▪ depots
▪ sporting facilities
▪ office/administrative others
Floodplain AMP,
▪ levees
▪ pumps and related
▪ drains
▪ off-creek storage (dam)
▪ chlorination plant
▪ fluoridation and stabilisation plant
▪ water pump stations
▪ reticulation and trunk mains Sewer AMP, including:
▪ sewage treatment plants
▪ sewer pump stations
including stormwater pipelines, junction pits and inlets
other structures Swimming Pools, including:
buildings
other structures Airports, including:
buildings
runways
other structures
Reporting
The Council’s Annual Report on achievements measured against the Delivery Program is prepared by 30 November each year. It includes:
• Assets acquired by the Council during the year.
• Assets held by the Council at the end of the financial year.
• An estimate of the amount of funding required to bring assets up to a satisfactory standard.
• An estimate of the annual expense to maintain assets at that standard.
• The Council’s asset maintenance program for that year.
Introduction
The Long-Term Financial Plan (LTFP) is a 10-year rolling plan that informs decision-making and demonstrates how the objectives of the CSP and commitments of the DP and OP will be resourced and funded.
The LTFP captures financial implications of asset management and workforce planning. For example, by identifying how additional assets will be funded, or existing assets renewed or upgraded and what provisions are made for changes to service levels
The LTFP is a tool to aid decision making, priority setting and problem solving. It is a guide for future action, to be reviewed and updated annually, and addresses the following:
• how council will survive future financial pressures
• opportunities
• whether council
• how council
The LTFP is prepared in accordance with the provisions of the Local Government Amendment (Planning and Reporting) The LTFP must include:
• projected income
• planning assumptions
• sensitivity analysis, the LTFP
• financial modelling
• methods of monitoring
• major capital
What Is Financial Sustainability?
TCorp has defined financial sustainability in the following terms:
1. ‘A local government will be financially sustainable over the long term when it is able to generate sufficient funds to provide the levels of service and infrastructure agreed with its community.’
There is a need to achieve at least a break-even general fund operating position on an ongoing basis. The Council has several key financial objectives to achieve financial sustainability, which have been considered during the preparation of the LTFP. These objectives are:
Balanced Budgets
The Council strives revenues/reserve funding) annually.
Continued Operational
The Council is committed culture of continuous improvement is maintained and ‘value for money’ is achieved.
Estimates, Assumptions and Forecasts
All LTFPs must be based on a set of assumptions, which generally relate to factors that are most likely to affect the overall outcome of the LTFP. The following assumptions have been considered, discussed, and ultimately used as a basis to forecast the Council’s long-term financial position over the 10-Year Plan.
Planned Assumptions
Assumptions and into the 2025/2026 budget and ‘planned’ 10
Key Assumptions
Scenario 1 –
General rate revenue will be increased by 4.3% as per the determined Rate Peg and assumed at 3.5% from 2026/2027 approved SRV rate peg increase, which means that the standard rate peg now applies. For the next four years (2025/2026 to 2027/2028), the estimated yield from the now in SRV component of our rate base will be restricted and then subsequently used to improve infrastructure as per the SRV requirements and will now be referenced as the Infrastructure Renewal Value of our rates income stream. The estimated yield in 2024/2025 is $5.99m.
Revenue streams growth forecasts where a direct relationship on the forecasts specifically determined for the Clarence Valley Council (currently + 0.85% p.a.).
Recurrent operating expenditure for 2025/2026 will be based on the actual 2023/2024 and estimated 2024/2025 Financial Statement results. This position will then be further adjusted for contractual obligations or for expected spend, as informed through discussion with management. From 2026/2027 onwards, recurrent operating expenditure generally will be indexed in line with expected inflation.
Recurrent operating revenue for 2025/2026 onwards will initially be increased in line with service deliverables and as evidenced through discussion with management. A general indexation rate of 3.5% for 2025/2026, 3% for 2026/2027 and then 2.5% pa from 2027/2028 onwards. This will be applied on all general revenue streams where no other evidence is available to support a specific revenue increase.
Interest and investment income are forecast at a conservative rate of 3.5% for 2025/2026 and 2026/2027, 3% for 2027/2028 and then 2.5% from 2028/2029 onwards, based on the running yield
of the Council's investment portfolio (a value average of $125 million per month) for the quarter ended 30 September 2024.
Water charges will be indexed by 10% p.a. for 4 years from 2025/2026 to 2028/29 and then 3% from 2029/30 onwards.
Sewer charges will be indexed by 10% p.a. for 2 years from 2025/2026 to 2026/27 and then 3% p.a. from 2027/2028 Onwards.
Domestic waste management charges will be calculated based on the reasonable cost requirements (income funds the operating and maintenance costs associated with providing the service) for the 2025/2026 Budget.
Operating grants – The Council has assumed it will continue to receive operating grants in relation to ongoing operations (where evidenced by management) and that these will generally increase annually in line with estimated indexation of between 3 to 2.5% each year. Operating grants received for specific project-related purposes have been included in the year the Council anticipates they will be received.
Capital grants – The capital grants applied in the model will be based on the capital grants on historical averages over the last 5 years with adjustments for known grants would could be span over multiple years.
The Financial Assistance Grant value is estimated at $14,400,000, which is an increase of approximately 4%. This assumes the current prepayment arrangements stand; however, it is noted that the actual value and payment will be determined by the Federal Government in late May 2025. The Council has assumed over the 10 years of the LTFP that the ‘in advance’ tap has not been turned off and, therefore, the Council does not have to report a drop in Financial Assistance Grant income.
Tax-equivalent dividends will be based on the maximum allowable rate of $3 per assessment (which equates to approximately $70K from the Water Fund and $80K from the Sewer Fund). These figures will be adjusted by both estimated charge increases, and population increases.
All positions on the adopted organisation structure are to be funded unless otherwise indicated.
Employee wage increases are per the LG Award 2023 to 2026 which is 2.5% for 2025/2026 and estimated at 2.5% p.a. for 2026/2027 onwards.
Leave entitlement accruals estimates assume that all positions in the organisation structure will be filled.
Workers’ compensation premiums will be based on 3.5% of the estimated wages from 2025/2026 onwards. The historical Basic Tariff Premium as a percentage on wages is as follows:
• 20220-23 = 2.37%
• 2023-24 = 2.37%
• 2024-25 = 3.14%
Over the last three years claims performance history percentage continues to significantly increase, (Calculated as the Claims Amount divided by the Basic Tariff) this has more than tripled from a percentage of 2.37% in 2022/2023 to a current YTD 11.90% in 2024/2025. This will have an impact of higher premiums over the next three years especially if this trend continues and even to a greater extent if the trend worsens. As the smoothing reserve was removed in 2019/2020 council will now need to budget for this increase in full.
Council historically receives a Work, Health & Safety rebate this is now called the Safety & Wellbeing Incentive. For 2025/2026 the state government has not confirmed this will be available
and therefore this has been excluded. Any savings realised will be transferred to the smoothing reserve.
Superannuation – Employees are generally in one of two schemes, which are:
• The Defined Benefits Scheme: calculated as per employee contribution.
• The Super Guarantee Scheme (SG): The Council is legislatively required to contribute 12% of the employee's gross wages for 2025/2026. The SG rate will then remain fixed at this rate into the foreseeable future.
Electricity expenditure varies by Fund and historically have been on a upward trend, therefore these charges have been indexed at 5% for 2025/2026 onwards
Council’s insurers have indicated that the hard insurance market cycle has ended but still recommend council be conservative by forecasting a 5% increase each year in premiums. Final premiums will not be known until next year which will also be impacted by any increase in the asset infrastructure and valuations. This applies to the Property, Public Liability, Councillors & Officers Liabilities, Cyber Liability, Personal Accident & Corporate Travel, Environmental Liability, Motor Fleet and General Insurance policies.
State Emergency Levies and Rural Fire contributions have been indexed by 3% p.a. using 2024/2025 actual cost as the base.
Surf Life Saving contributions to Minnie and Yamba have been index by 3.2%
Surf Life Saving Contracts have increased by 3% pa for 2025/2026 to 2027/2028 and then by 2.5% from 2027/2028 onwards.
New Loans: Will be required for Water Cycle Infrastructure and have been based upon an estimated interest rate of 6% over 20 years. The amount required will depend on the success of current grant submissions and final construction costs. At this stage the LTFP has assumed Council will not receive any Grants relating to these submissions. The new projected loan borrowings included are for Sewer Fund $26M in 2026-27 and for the Water Fund $20m in 2026-27 and $30M in 2027-28.
Proposed Key Assumptions for the 2025/2026 LTFP Scenario 2 – An Optimistic Population increase of 1% above current projection of 0.85%
All assumptions listed in Scenario 1 will be applied to a second scenario for the LTFP, except for the population increase which will be estimated at 1.85%.
Capital Expenditure and Service Level Variations for 2025/2026 to 2034/2035
The LTFP includes the 2025/2026 Capital Expenditure Program, as reported in the 2025/2026 Operational Plan. The capital projects proposed have been determined based on recurrent renewal projects, deferred projects from 2024/2025 and additional priority projects identified by section managers.
It is proposed that a future capital works program will be informed by the AMPs, considering levels of renewal expenditure required to meet the ‘Fit for the Future’ performance ratios and in line with the Council's Project Management Framework. Projects approved through this process will be prioritised and wherever possible offset by available grant funding.
Sensitivity/Risk Analysis
By their very nature, all LTFPs have risks associated with assumptions and impacts on estimated expenditure and income streams. Some items identified that could potentially impact this plan are:
• AMP updates and Asset Revaluations can change useful life assumptions, depreciation expenses and revised whole-of-life costs.
• The Council’s agreed service level changes.
• Interest rate changes.
• Flood events.
• Legislative changes.
• Pandemics.
• Grant funding changes.
• Employment costs, changes to rates of pay through the Local Government State Award negotiations.
• Indexing applied to recurrent grant income being lower than anticipated.
• Population growth.
• Global economic impacts.
• Joint works.
In predicting certain income streams such as grants and contributions, asset revaluation adjustments and depreciation movements are very problematic and as such, the estimates for these pose a much higher risk.
In this LTFP, the estimates for grants and contributions have been based on historical averages, excluding anomalies such as major floods or significant programs associated with economic stimuli, including Inflation, recession and pandemics.
It is important to point out that operating grants reported in the Income Statement (in accordance with the Financial Statement accounting legislation) includes the Federal Government’s ‘Roads to Recovery’ funding, even though the Council may use this funding for capital expenditure. Revenue streams are also recognised when received as opposed to when they are spent.
As the landscape changes each year and the Council’s asset management and other data improves, so too will the LTFP’s projections and outputs to assist strategic decision-making.
The LTFP includes two scenarios to examine the impacts of Rates income on the operating result. Scenario 1 assumes Council will apply the full determined rate peg of 4.3%, while Scenario 2 shows the impact of optimistic increase in population of 1.85%.
A summary of the impact is indicated in the table on previous page.
SENSITIVITY ANALYSIS OF INCOME TO POPULATION GROWTH – General Fund Only
It is proposed that future LTFPs will include scenarios showing the impact of different levels of service and funding review of all its services and updating its Financial Strategy. This along with the communities accepted service levels, capacity, and distribution of the budget, infrastructure asset base, asset renewals and asset additions.
Attachments Consolidated Income Statement
C2larence Valley Council
Long Term Financial Plan 2025/2026 to 2034/2035 Consolidated Balance Sheet
Income Statement – General Fund
C2larence Valley Council
Balance Sheet – General Fund
Long Term Financial Plan 2025/2026 to 2034/2035
General
Fund – Key Financial Performance Indicators
C2larence Valley Council
Long Term Financial Plan 2025/2026 to 2034/2035
Balance Sheet – Water Fund
C2larence Valley Council
Water Fund – Key Financial Performance Indicators
Long Term Financial Plan 2025/2026 to 2034/2035
Income Statement – Sewer Fund
C2larence Valley Council
Long Term Financial Plan 2025/2026 to 2034/2035
Sewer Fund – Key Financial Performance Indicators
C2larence Valley Council
Financial Planning Policy
Key Financial Indicators (KFI):
FINANCIAL INDICATORS
1 Operational Liquidity (short-term focus)
Unrestricted Current Ratio – Unrestricted current assets divided by unrestricted current liabilities, as per Note 13 of Accounting Practice & Financial Reporting Update 25 >1.5:1.
Purpose – This is a measure of the Council’s liabilities with its short-term assets.
1.2 Rates and Annual Charges Outstanding
outstanding divided by rates & annual charges 13 of the Local Government Code of Accounting Reporting Update 25 – benchmark <10%.
Purpose – This measure assesses the impact annual charges on the Council’s liquidity and the adequacy of the Council’s debt recovery efforts.
1.3 Available Working Funds
KEY FINANCIAL INDICATORS
‘Fit for the TYPE
COUNCIL’S KFI GOAL Future’ KFI (General Fund Only)
Purpose – Similar to the Unrestricted Current Ratio, this is of the Council’s ability to meet short-term financial shocks, whether they be reductions in anticipated revenues or unplanned additional expenditure (measured in $). Water Fund
1.4 Cash Expense Cover Ratio – The current year's cash and cash equivalents and all term deposits divided by payments from the cash flow of operating and financing activities, multiplied 13 of the Local Government Code of Accounting Practice & Financial Reporting Update 25 – benchmark >3 months.
Purpose – This liquidity ratio indicates the Council can continue paying for its immediate expenses without additional cash inflow.
2.1 Operating Performance Ratio – The total excluding capital grants and contributions less operating expenses, divided by the total continuing operating revenue. operating revenue excludes fair value adjustments and reversal of revaluation decrements, net gain/(loss) on sale of assets and the net share of interests in joint ventures & associates, Local Government Code of Accounting Update 25 – benchmark >0%.
Purpose – This ratio measures the Council’s achievement of containing operating expenditure within operating revenue. The Council should
within 5 i.e. by 2028/29
2. Fiscal Responsibility (Council elected-term
KEY FINANCIAL INDICATORS
not be recording recurring operating deficits funding operating results from capital revenues.
2.2 Own Source Revenue Ratio – The total continuing operating revenue (excluding ALL grants & contributions), divided by the total continuing operating revenue inclusive of all grants and contributions. The total continuing operating revenue excludes fair value adjustments and reversal of revaluation decrements, net gain/(loss) on sale of assets and the net share of interests in joint ventures
Note 13 of the Local Government Code of Accounting Practice & Financial Reporting Update 25 – benchmark >60%.
Purpose – This ratio measures fiscal flexibility. It is the degree of reliance on external funding sources such as operating grants & contributions. The Council’s financial flexibility source revenue increases.
‘Fit for the TYPE
COUNCIL’S KFI GOAL Future’ KFI (General Fund Only)
Long Term Financial Plan 2025/2026 to 2034/2035
KEY FINANCIAL INDICATORS
2.3 Debt Service Cover Ratio – Operating result fair value adjustments and reversal of revaluation decrements, net gain/(loss) on sale of assets, interest expense, depreciation / impairment / amortisation and the net share of interests in joint ventures & associates), divided by principal repayments (from the Statement of Cash Flows) plus borrowing costs (from the Income Statement), as per Note 13 of the Local Government Code of Accounting Practice & Financial Reporting Update 25 >2x.
Purpose – This ratio measures the availability service debt including interest, principal and lease payments.
2.4 Debt Service Ratio – Cost of debt service repayments) divided by total continuing capital grants and contributions).
Purpose – A Council with a low or zero level of debt may incorrectly place the funding burden on current ratepayers spread across generations, who also benefit from the assets. High levels of debt generally indicate a weakness in financial sustainability and/or poor balance sheet management.
COUNCIL’S KFI GOAL Future’ KFI (General
2.5 Real Operating Expenditure Per Capita – Operating expenditure indexed by the Local Government Cost Index, divided by population of the Council area. Per IPART’s ‘Fit for the Future’ (FFTF) requirement, there must be a demonstrated decrease in the ratio over time, i.e. operational savings (net of IP&R supported service improvements) over 5 years
Purpose – Changes in real operating expenditure per capita are considered to assess how effectively the Council:
• can realise natural efficiencies as population increases (through lower average costs of service delivery and representation); and
• can make necessary adjustments to maintain current efficiency if the population is declining (e.g. appropriate reductions in staffing or other costs)
Assuming that service levels remain constant, a decline in real expenditure per capita indicates efficiency improvements (i.e. the same level of output per capita is achieved with reduced expenditure).
3.1 Building & Asset Renewal Ratio – Expenditure on building and infrastructure asset renewals divided by depreciation, amortisation & impairment for building and infrastructure assets, as per Special Schedule 7 of the Local Government Code of Accounting Practice & Financial Reporting Update 25 – benchmark >100%.
Purpose – This measure assesses the rate at which building & infrastructure assets are being renewed & upgraded against the rate at which they are depreciating.
3.2 Infrastructure Backlog Ratio – Estimated cost to bring assets to a satisfactory condition, divided by carrying value of infrastructure, building, other structures and depreciable land improvement assets, as per Special Schedule 7 of the Local Government Code of Accounting Practice & Financial Reporting Update 25 – benchmark <2%.
Purpose – This ratio shows what the proportion of the infrastructure backlog is against the total value of the Council’s infrastructure.
3.3 Cost to bring assets to agreed service level – Estimated cost to bring to an agreed level of service set by the Council, divided by gross replacement cost, as per Special Schedule 7 of the Local Government Code of Accounting Practice & Financial Reporting Update 26.
There is no industry benchmark available.
Purpose – To assess the proportion of outstanding renewal works compared to the total suite of assets that the Council has under its care and stewardship.
3.4 Asset Maintenance Ratio – Actual asset maintenance divided by required asset maintenance, as per Special Schedule 7 of the Local Government Code of Accounting Practice & Financial Reporting Update 25 – benchmark >100%.
Purpose – Compares actual vs required annual asset maintenance. A ratio above 100% indicates that the Council is investing enough funds that year to halt the growth of the infrastructure backlog.
Long Term Financial Plan 2025/2026 to 2034/2035
KEY FINANCIAL INDICATORS
3.5 Asset Sustainability Ratio – Planned capital expenditure on renewing and replacing existing assets (net of proceeds from sale of replaced assets), divided by the optimal level proposed in the Council’s AMP. Local Government Association South Australia Financial Sustainability Information Paper No.9: Financial Indicators – Revised February 2012.
Purpose – Indicates the extent to which existing non-financial assets are being renewed and replaced compared with what is needed to costeffectively maintain service levels. Achievement of the suggested target would mean that the Council was reasonably optimising the timing of capital outlays on the renewal/replacement of assets.
COUNCIL’S KFI GOAL Future’ KFI (General Fund Only)
Purpose
Council’s Workforce Management Strategy (WMS) is reviewed and re-developed every four years and is included in the Resourcing Strategy with the Long Term Financial Plan and Asset Management Strategy. to ensure integration between these key documents and ongoing alignment to the Community Strategic Plan.
The WMS has been developed under a data driven risk-based approach to ensure that Council has the people capability, skills, capacity and sustainability within its workforce to achieve Council’s vision, goals and objectives outlined in the Community Strategic Plan, the four-year Delivery Program and annual Operational Plan.
Vision – The Clarence Valley is a Community of Opportunity.
Workforce planning is an ongoing process. This strategy aims to provide context of our current state, support our current workforce needs, outline risks to our workforce and identify how we plan to ensure staffing and skill requirements meet the future needs of Council.
Context
What does our current workforce look like?
To achieve our vision, goals and objectives, we first need to understand our current state. From this, with our future needs in mind, we can determine where the gaps are and what is needed to achieve what we have set out to do in our overarching plans, programs and strategies.
Organisational Structure
Workforce Snapshot
The below snapshot provides an overview of our current workforce composition. This includes the positions adopted in our structure (FTE), the actual number of people working here (headcount) and other data used to understand Council’s workforce.
in the Clarence Valley LGA
*Position and Employee Data as at 31 December 2024 – People and Culture Quarterly Report Q2 2025
In addition to the above, we are also able to break down different aspects of our current workforce to measure diversity within Council’s workforce. The table below shows the number of people within our organisation who have shared with us that they are First Nations, have a disability or have culturally and linguistically diverse backgrounds.
*Employee diversity as at 31 December 2024
Our Senior Leadership Team has seen an increase in diversity over the past two years with an increase in female leaders from 23% in 2023 to 47% in 2024.
Tenure
Our overview of tenure statistics pictured in below suggest that the opportunity to learn from others with years of specialist Clarence Valley Council experience is available. This is further supported by our lower than industry average turnover of just 11.08%. The risk to loss of corporate knowledge is reduced by successfully retaining employees in Council over the years. The Council's median employee tenure stands at 6.2 years, with an average tenure of 10.1 years, suggesting a relatively stable workforce with a mix of newer employees and long-serving employees.
Age
of employees by years of service as at 31 December 2024
The age of Council’s work force is broken up below showing the distribution of employees by age. As you can see, there is a trend indicating that Clarence Valley Council has an ageing workforce with a large proportion of staff over 50 years old. This will inevitably lead to retirement waves in the coming years.
Number
Distribution of Councils workforce by age as at 31 December 2024
Pending Retirement impacts
3.88% of our workforce is over 67 years of age. To understand the areas of Council that will most likely be impacted by an ageing workforce nearing retirement we analysed this further to determine who would be most impacted by those predicted most likely to retire soon. The pie chart below, Figure 8, illustrates the distribution of employees over the age of 67 by section. The largest portion, 45%, is found in the Civil Services section. A portion of our over 67 workforce is also located within Water Cycle and Communications and Engagement.
Over 67s per section
Water Cycle
Finance and Systems
Environment and Regulatory Services Development and Land use planning
Cultural, Community and Industry
Open Spaces and Facilities
Strategic Infastructure
Civil Services
Organisational Development
Staff over 67 by section at 31 December 2024
Workforce Challenges
People and Culture has been ranked highly in terms of overall risk for Clarence Valley Council. According to the 2024 JLT Public Sector Risk Report, this risk ranks 5th highest for regional organisations and 6th overall nationally. Challenges relating to Council’s workforce have been identified and assessed based on our analysis of the current state of the workforce using data from our Human Resources Management System. The most significant drivers factoring into People and Culture risk are outlined below and link directly to the highest strategic risk for Clarence Valley Council, as outlined in the Community Strategic Plan, which is Financial Sustainability. People drive significant cost to the organisation and so identifying and managing associated risks is key to a sustainable workforce now and into the future. This strategy aims to foster a sustainable workforce.
Loss of key team people
Council is at risk of losing key team people due to its ageing workforce. This issue is not unique to Clarence Valley Council. As our population ages inherently our workforce ages. People are living longer, healthier lives now and can work for longer, which also contributes to our ageing workforce. As more employees retire it is harder to fill the skills gaps left behind if proper strategies and plans are not in place. Many of the actions contained in this document are designed to address the risk of skills shortages and loss of knowledge because of retirement to preserve critical knowledge and continue to deliver essential services to the level expected by the community. A significant consideration in managing this risk is how to retain the age group from 50 and up and extend their time in the workplace. A focus on addressing intergenerational challenges may lead to continued respect in the workplace, teamwork, understanding and collaboration across generations in our workforce.
Capacity to attract and retain professional staff
There are a number of drivers impacting Clarence Valley Council’s ability to attract and retain staff. Part of this is access to a suitable pool of candidates locally and limitations on budgets resulting in reduced ability to compete with other similar organisations, such as other tiers of government.
Other factors reducing the available suitable staff and retention include an ageing workforce and a skills shortage. Skills shortages occur when an employer has difficulties filling vacancies in an occupation or specialised area despite competitive pay and conditions of employment. During the 2024 calendar year, Clarence Valley Council readvertised 5 professional positions due to no suitable candidates being available. This suggests that there is a lack of qualified and experienced people in the region.
Many staff wear multiple hats at Clarence Valley Council. Because our Council is a regional Council of 538 staff, spread over a large geographical area with a small rate payer base, quite often staff are required to have knowledge across a broader range of functions and the large range of technical skills to provide what has been outlined in the overarching plans. These factors further reduce the ability to attract and retain suitable professional staff with most having one area of expertise rather than two or more.
Rising employment costs
Costs associated with the employment market include wages or salaries, employment related taxes and the costs of other employee benefits such as health and wellbeing programs, training, safety costs and recruitment. Industrial instruments that Council is required to comply with influence costs in addition to CPI and competition for qualified staff over time.
For example, the Local Government (State) Award 2023 prescribed an increase to salaries of 4.5% from 1 July 2023, 3.5% from 1 July 2024 and will lead to an increase of 3% from 1 July 2025. This highlights the importance of strategic planning to control our People and Culture risk to ensure a sustainable workforce.
What Council has been doing
My Employee Journey
The My Employee Journey Framework continues to ensure the journey of all our employees is successful, fulfilling and engaging and that good performance is rewarded and celebrated.
We continue to improve how we measure our individual performance and propose to fully introduce the CVC Capability Framework. This will be implemented throughout the whole organisation over the next year. Our workforce will have transparent goals to achieve, and over the next four years, we will continue to ensure our workforce has the skills, capability and engagement to be successful.
Trainee and Apprentice Program
The Clarence Valley Council Trainee and Apprentice Program is designed to provide local youth with valuable hands-on experience while developing essential skills for their future careers. This initiative offers a range of opportunities across various fields, including trades, administration, and environmental services. Participants receive mentorship from experienced professionals, ensuring they gain practical knowledge and insights into local government operations. By fostering a supportive learning environment, the program not only enhances individual career prospects but also contributes to the community's overall development and sustainability. This commitment to nurturing local talent reflects the Council's dedication to building a vibrant, skilled workforce for the future.
Figure 9- My Employee Journey
Work Experience
Clarence Valley Council provides unpaid work experience for people who are currently studying at secondary and tertiary levels. These placements are a great opportunity to learn from our staff and gain new skills and on-the-job experience, while exploring possible career opportunities. We aim to provide all applicants with meaningful work experience in their preferred area where possible, however the volume of applications that Council receives means that it may be necessary to decline some applications. All applications will be assessed in terms of timing of the placement, workloads of our employees and the availability of our people in the requested area to mentor and supervise students.
Careers at Council Expo
Clarence Valley Council holds an annual expo to showcase the current vacancies and various sections which include Civil, Water Cycle, Open spaces, Rangers, Engineers, and more, these stalls have staff that are in those current roles presenting with displays or hands on learning to learn about the roles. We organise external stakeholders such as employment agencies and training organisations to come along so that you can get all employment information for career progression, education, professional development, and lots more in a one stop shop.
Veterans Employment Program
Clarence Valley Council recognises the unique skill and attributes demonstrated by service personnel in their service to our country. Because of this, Council created its own Veterans Employment Program, launched in December 2023 to help address skills gaps while recognising the transferable skills and attributes Veterans hold to serve our local community.
Clarence Valley Council held the industries first Veterans Employment expo in November 2024. A range of expert service providers, facilitated by Council staff, provided information to local businesses on the benefits of hiring Veterans, highlighted what Council is doing to attract and retain Veterans and allowed an opportunity for local Veterans to network, find support services, learn what a role at Council involves and to find out more about how to apply for positions with Council. In the 2023/24 financial year 6,600 people left the Defence Force. This means 6,600 highly trained, skilled and capable people seeking opportunities to enter the market.
Veterans Affairs places 1,769 Veterans in the Clarence Valley LGA. Australian Bureau of Statistics census data obtained in 2021 showed that Clarence Valley Councils total population was 54,115 of this 42,728 were over 20 years old (adult working age). Veterans make up about 3% of the total population and 4% of our adult population.
Clarence Valley Council currently employs 5 Veterans and reservists, which is about 1%. Given the percentage of Veterans in our community it is possible to locally recruit more highly trained and highly skilled returned service personnel to increase our workforce capacity. The continuation of this program, and improvement of this program into the future is highlighted as an action in this strategy.
People and Culture Partner meetings
Senior People and Culture Officers partner with Senior Leadership on an ongoing basis to enable guidance and support in people processes to better support staff. This partnering approach focuses on the employee life cycle outlined in Council’s ‘My Employee Journey’, for example attraction and selection of staff, learning and development, career progression and transition to retirement. These meetings focus on addressing workforce challenges and promoting a positive workplace culture. This collaborative approach not only enhances leadership capabilities but also ensures that the Council's diverse workforce is enabled to achieve outcomes for the community as identified in the CSP, DP and OP.
Health and Wellbeing Program
The Clarence Valley Council Health and Wellbeing Program for employees is a comprehensive initiative designed to promote overall health and prevent illness in the workplace. The program includes skin checks to detect early signs of skin cancer, flu vaccinations to protect against seasonal influenza, and
lung function testing to monitor respiratory health. Additionally, fit testing ensures employees are using proper respiratory protection, while regular hearing tests help identify potential hearing loss early on. To enhance awareness and engagement, the program also hosts health expos as part of our end of year event, providing employees with access to valuable resources and information on maintaining their wellbeing.
Learning and Development
The 2023 staff survey results indicated that learning and development and career progression are the two most valued aspects of engagement for staff. Councils Learn, Develop Grow learning and development plan has been finalised for the 2024/2025 year, implementing the 70:20:10 learning model. This plan supports the development of staff capability in alignment with the Capability Framework.
Clarence Valley Council’s Learning and Development team provided 139 face-to-face training sessions over the past 12 months, ranging from ‘Code of Conduct’ sessions to ‘Certificate III in Civil Services’ Council employees completed 2,768 free training courses through our eLearning platform Go1.
Leadership Development
Since 2023 Council has been running the LEDA Leadership Development Program. With 19 graduates and 12 employees are currently enrolled the program for 2025.
Eloise’s Story
“As a people manager, I found the LEDA program to be extremely beneficial. The strategies learned can be applied immediately to day-to-day interactions with my team on all levels, from informal catchups to performance reviews.
The course is broken down into a number of modules, each focusing on an area of development that can be conveniently completed online prior to the mentoring sessions. The main themes focus on self-reflection and understanding your own communication style, how to communicate effectively and respectfully, conflict resolution, and developing your team.
The mentoring sessions with Henriett were instrumental in allowing me to fully understand the strategies introduced in the course work. Henriett provided realistic examples on how we can apply our learnings in the workplace and the group discussions were a great way to gain insight into the positive results experienced by others enrolled in the course, and how they were utilising the strategies effectively.
I’d recommend this course to all people managers, no matter your level experience, or anyone looking to further their career by stepping into a management role.“
Luke’s Story
“Approximately half of the LEDA program is focused on improving yourself as a Leader. Then the second half really focuses on improving your ability to interact and manage people. The content if filled with up-to-date information based on the most recent research and includes a variety of videos, animations, and activities to explain concepts in an easy-to-understand way.
The program stretches over the course of the year, I found it best to complete one Journey every second Friday or so to keep up with the content in time for the group sessions with Henriett each month. The group sessions were very in depth, and it was good to hear from other colleagues about how they were completing the course and hearing about real world examples that outlined the material in the program.
One of my main takes aways is the Red Brain Green Brain states. Where if someone is in a green brain state, the brain sends energy to the prefrontal cortex to allow the person to think and behave calm and rationally. But if someone feels threatened, their brain can go into the red brain state where energy is taken away from the prefrontal cortex and applied to the amygdala which makes faster decisions to fight or flight. This makes it harder for a person to make logical decisions in the red brain
state. Couple that with mirror neurons and you can see why its important to remain calm when managing others.
I definitely recommend this program for anyone who is in or is intending to move into a leadership role of any kind.”
Allira’s Story
“I really valued the opportunity to participate in the LEDA Program it has raised my awareness and enhanced my skillset to being an effective leader in the future. I liked how the program was spread over an extended period allowing the time to do the work at my own pace whilst managing periods of high work demand. I enjoyed learning about the growth mindset and hope that I can really incorporate that into any future leadership opportunities I may be lucky enough to take on.”
Face to Face Induction Sessions
Council has reintroduced face to face induction sessions post covid and they have been having a positive impact on new employees. These give new employees an opportunity to meet the General Manager and Directors as well as key People & Culture and Safety Staff. The training provides a place to learn about the organisation and how their new position fits into the organistaion and how their position impacts the community.
Some feedback from new staff
“Working for Clarence Valley Council offers a dynamic and community focused environment where employees can make a real impact. With a strong emphasis on collaboration, professional development, and work life balance, the council provides opportunities to contribute to meaningful projects that enhance the region’s infrastructure, services, and overall quality of life.
Working for Clarence Valley Council means being part of a dedicated team committed to serving the community and improving local services. The council fosters a supportive workplace with opportunities for growth, innovation, and a strong focus on sustainability and community wellbeing.” Mark
“Starting my role at Clarence Valley Council during the first week of Ex-Cyclone Alfred was a true eye-opening to the dedication and resilience of the team. I was immediately impressed by how staff seamlessly transitioned across departments, stepping up to support the community when it mattered most. Now, four weeks in, I can genuinely say I love the work. The Council’s strong values, the friendliness of the team, and the collaborative spirit make this a great place to be.
The variety in my role within Economic Development keeps every day interesting, and it is inspiring to be part of a team so committed to driving growth in tourism and positive change in the region.” Pip
“I feel very fortunate to be able to live and work in the Clarence Valley and am passionate about making it the best place to live, work and visit. Working for Clarence Valley Council is a truly rewarding experience.
The team are experienced, collaborative and truly passionate about our region. There is a great team culture that values and recognises hard work and encourages ongoing training and development that leads to career progression.” Kylie
Engagement
Clarence Valley Council engages with the workforce in a variety of ways through the normal course of its operations. This might be through engagement surveys, the Joint Consultative Committee, the Health and Safety Committee and through focus group sessions with the General Manager. These methods proved valuable in adding context to our data and informing this Workforce Management Strategy. Engagement has supported the development of strategic actions designed to address our People and Culture Risk and the associated drivers or challenges heightening this key risk area.
Staff Engagement Surveys
As well as doing a staff engagement survey every two years, Council is committed to doing annual pulse surveys to focus on employee engagement and satisfaction. These initiatives provide valuable insights into the workforce's perspectives and culture through encouragement of open communication and continuous improvement. The biannual surveys delve deeply into various aspects of workplace life, enabling the council to identify trends, celebrate successes, and address areas needing attention. Meanwhile, the annual pulse surveys offer a more immediate snapshot of employee sentiments, allowing for timely adjustments to policies and practices.
Focus Groups
Focus groups with Councils General Manager were held following the results of the staff engagement survey being finalised and shared with staff. After identifying key areas for improvement, staff had an opportunity to communicate directly with the General Manager about ideas and potential outcomes. Once this was established clear actions were identified and set to map out the pathway to improve these aspects of employment at Council.
Joint Consultative Committee
This Committee, comprised of and chaired by staff from all areas of Council, allows an opportunity for consultation on key employment issues from policies and procedures to new ideas for improvement and feedback on programs proposed to be implemented by Council or those already in place. It provides an opportunity for staff at all levels, through their committee representatives to communicate with senior leadership and influence what matters to them and their colleagues.
Health and Safety Committee
The Health and Safety Committee plays fosters engagement by creating a collaborative environment where employees actively participate in shaping a safe and healthy workforce culture. By involving workers in identifying potential hazards, discussing safety policies and procedures, and suggesting improvements, staff are empowered to take ownership of their well-being. As a result of this engagement, staff have been confident in sharing their ideas for a workplace focused on staff wellbeing, which in turn influences higher retention rates within Council.
Strategic Direction
Values
Our values: STRIVE drive how we work at Council and are key to supporting our workplace culture. These values underpin the way we work, including our Workforce Management Strategy.
Safety
We have a safety focused workplace culture to ensure the wellbeing of our staff and the community.
Teamwork
We work together as one council towards shared goals and for the greater good of the community.
Respect
We are inclusive, treat people with courtesy and fairness, and ensure each individual is valued and
Integrity
We behave in a way that is honest, open, and transparent. We will take responsibility for our actions and
Value
We deliver services efficiently, effectively, and in an environmentally and financially sustainable manner.
Engagement
We engage with our staff and community to inform our decision making and create awareness of our activities.
Points of Linkage
There are a number of strategies, plans and programs that have been developed across Council that impact our workforce and support the outcomes of the workforce management strategy. Strategy documents that are interrelated have been identified as points of linkage below.
Points of linkage include:
• Equal Opportunity Plan
• Recruitment Strategy
• Disability Inclusion Action Plan
• Reconciliation Action Plan
• First Nations Employment Strategy
• Safety Strategies and Programs
• Health and Wellbeing plans.
Strategic Actions
The below table identifies the challenges we aim to address through this workforce planning strategy and maps each measurable action back to an objective and the related theme these actions support in the Community Strategic Plan.
Loss of key team people Leadership Continued implementation of the My Employee Journey
Limited capacity to attract and retain professional staff Leadership Continued implementation of the My Employee Journey
Loss of key team people Leadership Continued implementation of the My Employee Journey
Limited capacity to attract and retain professional staff Leadership Economy Continued implementation of the My Employee Journey
Limited capacity to attract and retain professional staff Leadership Continued implementation of the My Employee Journey
Review recruitment policy and procedure every two years to ensure currency and enablement of future employment need.
Develop, implement and invest in a leadership development framework
Review STRIVE value definitions and what STRIVE values mean in action
Complete an organisation wide training and capability needs analysis with consideration for identifying key education partners in the valley and incorporating them in that planning
Review and publish a robust learning and development plan prior to the commencement of each financial year
Limited
Limited
Introduction
This AMS is designed to provide a plan to manage the Council’s physical infrastructure assets, including the establishment of a framework to guide the planning, construction, maintenance, and operation of infrastructure essential for Clarence Valley Council to provide services to the community.
Asset management planning incorporates an Asset Management Policy, Asset Management Strategy and Asset Management Plans. These documents provide guidance for improving the Council’s asset management systems and practices. This AMS and associated AMP are aligned with the 30 June 2024 Report on Infrastructure figures and reflect the 2025/26 to 2034/35 LTFP.
Our Assets
Our assets summaries below
Libraries
Gallery & Museums
Sporting fields & facilities
Showgrounds
Roads
Bridges & culverts
Footpaths & cycleways
Kerb & gutter
Parks & reserves
Stormwater
Water supply network
Sewerage service network
Airport & aerodrome
Community halls
Swimming pools
Cemetery
Our assets summaries below
Parking facilities
Saleyard
Holiday parks
Coastal & estuary management
CBD assets
Depots
Waste management
Landfill
Floodplain assets
Stormwater network
Reserves & wetlands
Noxious weed assets
Corporate buildings
Streetscaping
Public amenities
In late 2014, CVC undertook a Council-wide service review primarily to address budgetary shortfalls. The service review provided a framework of all Council services and was linked to the assets. This review has led to asset rationalisation and efficiency savings by eliminating ‘end-of-life’ or underused assets, contributing to the future sustainability of the Council.
In 2015, an asset management audit preparedness assessment was performed by the Council’s auditor on behalf of the Office of Local Government. The assessment identified areas for improvement, and an action plan has been implemented to address these.
Asset Conditions
Condition assessments for assets are undertaken using the Institute of Public Works Engineering Australasia’s (IPWEA) International Infrastructure Management Manual’s (IIMM) recommended five- point scale:
Condition 1 Very good condition – No work required (normal maintenance) Condition 2 Good condition –
Only minor maintenance work required Condition 3 Fair or moderate condition – Maintenance work required
Condition 5 Very poor condition – Urgent renewal/replacement required
The following graph demonstrates that most of the Council’s assets are in good to fair or moderate condition.
To define what condition ratings are acceptable, the Council will take into consideration the following:
• Community views/acceptance
• Establishing asset standards necessary to provide and support desired levels of service now and into the future
• Determining appropriate and sustainable levels of maintenance and renewals/upgrades
• Risk-hazard and risk-reduction requirements
Management strategies for assets in ‘poor’ condition (ratings 4 and 5) are detailed in each individual AMP. There are considerable costs associated with the renewal and/or upgrade of these assets, although it should be noted that not all will necessarily be required to be renewed. Any assets that should have already been renewed but have not due to funding limitations are deemed as backlog works. Any delay in carrying out these works could result in increased annual operation and maintenance costs as well as increased risks and consequences of failure.
The table below is an extract from the Report on Infrastructure Assets, included in the Special Schedules of the Annual Financial Statements for 2023/24. This indicates that the cost to bring the Council’s infrastructure assets to a satisfactory standard is currently $143.7M.
The Council currently endeavours to maintain its assets at a condition rating between 1 and 3. Any assets rated 4 or 5 will be assessed for risk and managed through a replacement/renewal program or alternatively disposed of. Current conditions scores have been established through previous inspections and revaluation processes. As such, it is imperative that current assigned scores, inspection processes and procedures are reviewed and where necessary adjusted on an annual basis.
Asset Values
As of 30 June 2024, the estimated replacement value of the Council’s assets is over $3.3B and is represented below by the major asset groups as a percentage of the total asset replacement value:
Asset Replacement Value
Asset Condition Report
The condition state of major infrastructure assets, as reported in the Clarence Valley General Purpose Financial Statement for the year ending 30 June 2024, is included below:
Clarence Valley Council
Asset Management Strategy 2025/2026 – 2034/2035
Clarence Valley Council
Asset Management Framework
The Council has developed an asset management framework that comprises an asset management policy supported by the AMS and individual AMPs.
The Transport AMP has now been further split into individual plans for roads, bridges, and footpaths. A specific AMP has also been created for water facilities assets.
Figure 4: The Council’s Asset Management Framework
Management Framework
Asset Management Policy
The Council’s Asset Management Policy sets the broad direction for all asset management activities, and its aim is to:
‘Strategically provide, maintain, renew and replace an appropriate stock of community infrastructure that is required to support the communities of the Clarence Valley Council; is sustainable across the long term; and is provided at the lowest possible life cycle cost.’
Asset Management System (AMS)
There is evidence to suggest that historically, little or no analysis was done to understand the cumulative consequences of decisions to build capital infrastructure projects. The construction of infrastructure has been driven by short-term objectives with little consideration given to the recurrent whole-of-life (strategic) impacts of the decisions. This position is constantly changing as the Council’s data-capturing systems and processes improve. More accurate asset data will ensure credible and robust AMPs. This is turn will better inform future strategic planning and the determination of a four-year rolling capital works program.
AMS – Goals
The key goal of this AMS is to ensure that services:
• Provide value for present and future generations of residents and visitors
• Are delivered in the most cost-effective manner
• Are guided by the AMP outputs, the community’s requirements, and the ability to pay.
To develop and maintain a robust/credible AMS, several key elements need to be present, including:
• Sound information and systems
• Comprehensive asset management planning
• Rigour in financial modelling and assumptions
• Accurate workforce planning
• Community involvement in establishing service standards
• Performance management of asset management
Accordingly, the following goals have been identified and prioritised to facilitate a more strategic approach to asset management at Clarence Valley Council in future periods:
Goal 1 – Have a cross-organisational an asset management advisory group in place that reports directly to the Executive. This will provide assurance that all asset management activities are consistent with the objectives of the IP&R Framework and are supported by the LTFP. The advisory group will also monitor the implementation of the asset management improvement and risk plans for all asset classes.
Goal 2 – Consider the ongoing ownership costs (recurrent whole-of-life) of new capital works proposals as part of project scoping, and model these through the Council’s LTFP to identify impacts and risks.
Goal 3 – Undertake a detailed assessment of the resources required to implement this AMS, and ensure it is integrated with the other resourcing strategies so that a program of
improvement and milestones can be implemented and performance-managed.
Goal 4 – Identify the maintenance and renewal ‘shortfall’ and any renewal and replacement ‘backlogs’ for all asset groups.
Goal 5 – Develop comprehensive risk management plans for all major asset groups.
Goal 6 – Integrate all knowledge and asset management systems for infrastructure assets.
Goal 7 – Review and maintain AMPs for all major asset groups already developed.
These goals have been incorporated into the Asset Management Improvement Plan, detailed in Appendix 1.
Asset Management Plans (AMPs)
AMPs are detailed category. An AMP has been developed for each major asset category, as illustrated in the Council’s Asset Management Framework diagram.
The Council’s operational
• The objective service/s
• The service challenges
• Forecasted
• A description
• Identification
• Risks
• Financial replacement including any gaps or renewal backlogs
• Assumptions, exclusions presented
• Maintenance,
• Key performance
• An asset management
The Council subscribes government to assist in the development of asset management planning. The NAMS+ suite of templates has been used for development of the AMPs as ‘core’ plans, which are practical documents designed to be easily understood and used by asset managers. The level of detail within each individual plan is dependent upon the scope and size of the asset category contained in the plan together with the level of asset data maturity.
An annual review of the individual AMPs is required to ensure they provide a useful and up-todate management tool and reference document. The review of the AMPs will include changes in objectives, policies, service levels, systems, technologies, and any other relevant amendment, including changes to community expectations.
Over time, the Council will work from ‘core’ asset management towards ‘advanced’ asset management planning, through a cycle of continuous improvement that will support the changing needs of the Council and the community.
A summary of each AMP has been included in this strategy.
AMPs and Strategy Methodology
The AMS and AMPs have been developed in line with the Council’s 2024/25 to 2033/34 LTFP. The LTFP has been prepared based on a set of assumptions and the ‘Fit for the Future’ key performance indicator benchmarks.
There are four key indicators for asset management and sustainability utilised in the AMPs and AMS:
Life cycle costs (or whole of life costs) the costs that required to sustain the service levels over the longest asset life. cycle costs include operating and maintenance expenditure and asset consumption (depreciation expenses). Life cycle costs can be compared to life cycle expenditure to give an indicator of sustainability in service provision.
Life cycle expenditure renewal costs. Life cycle expenditure will vary depending on the timing of asset renewals.
The life cycle costs, and life cycle expenditure comparison highlights any differences between present outlays If the life cycle expenditure is lower than the life cycle cost, there is a and it is most likely that outlays will need to be increased or cuts in services made in the future.
The Asset Sustainability whether projected capital renewal and replacement expenditure can be financed in the LTFP. The Council’s Financial Planning Policy outlines a target range of between 90
The four key indicators are detailed in the following table for the general fund assets only:
SUSTAINABILITY INDICATORS
The medium-term term. The Council will be able to maintain the condition of infrastructure assets in a sustainable fashion. Performing renewals as they are required will stop the deterioration and failure of assets, thereby reducing the levels of risk. Levels of service can be maintained at current levels.
The Asset Sustainability Ratio indicates that the Council will have 100% of the funds required for the optimal renewal Council’s target range of 90% to 110%. The ratio indicates an optimised budgeted capital expenditure, assisting in minimising the life cycle costs of the assets.
• Consideration should be given to the percentage of the Council’s transport assets, which are currently in average condition. Renewal shortfalls currently indicated will need to be investigated and addressed.
• There is a funding shortfall of $2.01M on average per year over the life of the 10- Year Plan for maintenance, operations, renewals, and upgrade/new assets, totalling $20.1M for the life of the plan.
• Additional grant funding will be sought for programs, especially for capital programs.
• Grant funding where there is no certainty of the grant funding being available has not been included in the assessment.
• Appropriate maintenance programs are implemented to ensure all assets reach their maximum useful life within budgetary constraints.
• The Council is implementing a detailed inspection program to identify and rectify defects, especially those that pose a safety issue to motorists, in a timely manner.
Last Condition Survey • Valuation dated – March 2023, valuation by AssetVal • Condition assessment undertaken by Clarence Valley Council
Main Findings
Note * The residual risk is the risk remaining after the selected risk treatment plan is operational.
• The Council manages approx. 1,512km of sealed roads and 945.3km of unsealed roads.
• The major influences on the road network in future will be the devolved old Pacific Highway as each new section is completed.
• Major emphasis is to increase maintenance levels in the following areas:
o Sealed road resealing
o Sealed road shoulder maintenance
o Unsealed road resurfacing
o Widening regional roads where required to meet current traffic loading
• General focus will be on managing condition 4 and 5 roads and maintaining roads at condition 3 and above.
• Additional data is to be gathered on the unsealed road network to better schedule resurfacing requirements.
• Further investigations to be carried out on the program and requirements to seal currently unsealed roads and options to return very-low traffic sealed roads to unsealed roads
• Council also maintains:
o 49 car parks
o 980 traffic facility items (including traffic medians, pedestrian refuges, kerb blisters, speed humps, school crossings and edging around trees)
o 32.67 km of guardrail and road fencing
o 433 roadside furniture items (including bus shelters, bollards, seating and bicycle racks)
o 89 Council-owned streetlights (this does not include general streetlights that are not owned by the Council)
o 13,236 signs
• Major emphasis is to implement programs in the following areas:
o Flood resilience of Yamba and Iluka Roads.
o Implement a Gap Seal Program over a 15-year period.
• There is a funding shortfall of $534 on average per year over the life of the 10Year Plan for maintenance, operations, renewals, and upgrade/new assets, totalling $5.34K for the life of the plan.
• Additional grant funding will be sought for programs, especially for capital programs.
• Grant funding where there is no certainty of the grant funding being available has not been included in the assessment.
• Appropriate maintenance programs are implemented to ensure all assets reach their maximum useful life within budgetary constraints.
• The Council is implementing a detailed inspection program to identify and rectify defects, especially those that pose a safety issue to motorists, in a timely manner.
• Valuation dated – March 2023, valuation by AssetVal
• Condition assessment undertaken by Clarence Valley Council
Detail the critical risks and risk management approach taken.
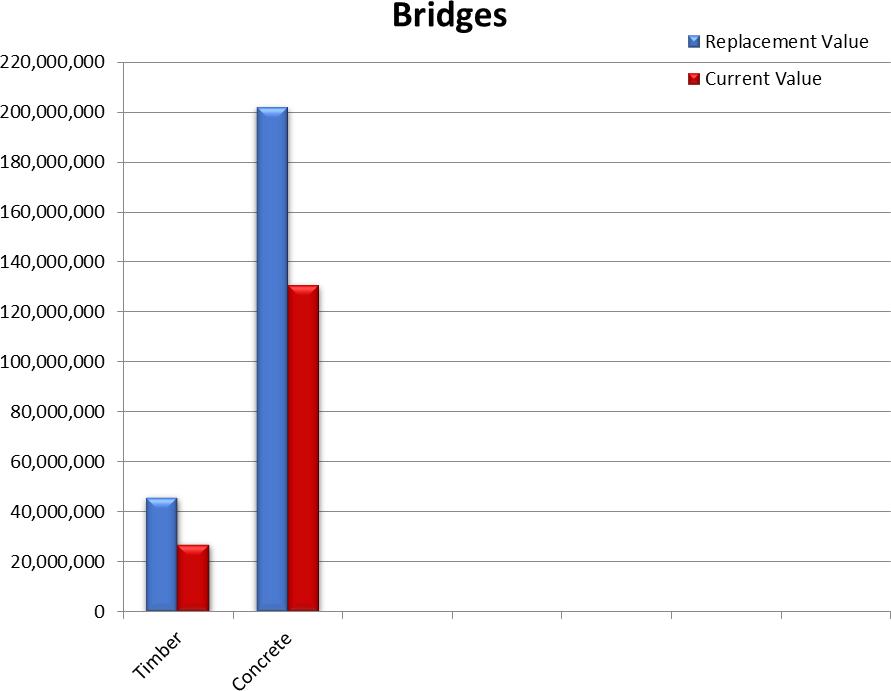
Note * The residual risk is the risk remaining after the selected risk treatment plan is operational. bridges. results in increased the following areas: and maintaining bridges to better schedule Main Findings
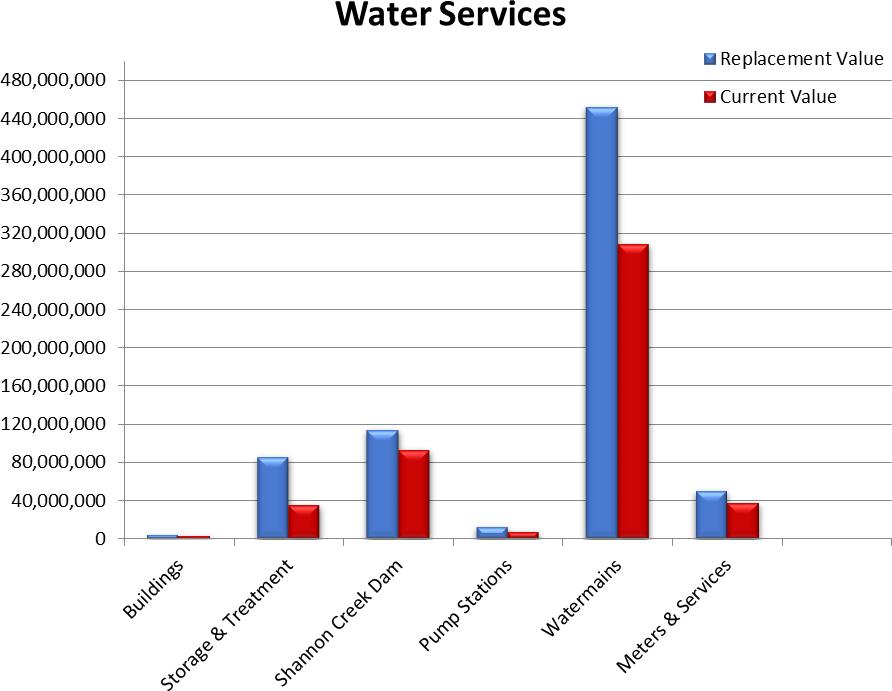
Water Facilities
Sustainability Report
Long
Budget Implications
• Consideration should be given to the percentage of the Council’s water facilities assets, which are currently in average condition. Renewal shortfalls currently indicated will need to be investigated and addressed.
• There is a funding shortfall of $8.9K on average per year over the life of the 10- Year Plan for maintenance, operations, renewals, and upgrade/new assets, totalling $89K for the life of the plan.
• Additional grant funding will be sought for programs, especially for capital programs.
• Grant funding where there is no certainty of the grant funding being available has not been included in the assessment.
Maintenance Programs
• Appropriate maintenance programs are implemented to ensure all assets reach their maximum useful life within budgetary constraints.
• The Council is implementing a detailed inspection program to identify and rectify defects, especially those that pose a safety issue to motorists, in a timely manner.
Last Condition Survey AssetVal Valley Council
Critical Risks & Risk Management
Detail the critical risks and risk management approach taken.
Service or Asset at Risk
Boat ramps, wharves and jetties
There is an impact by natural disasters (during and post natural disasters). M If the road is not already closed, display a closed sign at water facilities during flood events.
Note * The residual risk is the risk remaining after the selected risk treatment plan is operational.
• The Council also maintains:
o 33 wharves/jetties
Main Findings
o 46 boat ramps following areas:
Renew water facility components currently at condition rated 4 or 5 over year period, and implement the programs previously adopted by the River Wharves Development assets and maintaining water facility assets to
9,943,962.00 994,396.13
8,537,856.00 853,785.63 85.86% -140,610.55
Sustainability Report
Long Term – Lifecycle Costs
Budget Implications
Maintenance Programs
• Consideration should be given to the percentage of the Council’s water facilities assets, which are currently in average condition. Renewal shortfalls currently indicated will need to be investigated and addressed.
• There is a funding shortfall of $140K on average per year over the life of the 10Year Plan for maintenance, operations, renewals and upgrade/new assets, totalling $1.4M for the life of the plan.
• Additional grant funding will be sought for programs, especially for capital programs.
• Grant funding where there is no certainty of the grant funding being available has not been included in the assessment.
• Appropriate maintenance programs are implemented to ensure all assets reach their maximum useful life within budgetary constraints.
• The Council is implementing a detailed inspection program to identify and rectify defects, especially those that pose a safety issue to motorists, in a timely manner.
Last Condition Survey Council
Detail the critical risks and risk management approach taken.
Critical Risks & Risk Management
Footpaths/ Cycleways Injury from trip on footpath
Footpaths/ Cycleways Defectnot being recorded
Note
Main Findings
Objective
Completefootpath audit, and schedule routine inspections from which regular maintenance can be prioritised.
Integrate existing AI defect inspection procedure to undertake footpathinspections and defect identification
* The residual risk is the risk remaining after the selected risk treatment plan is operational. cycleways.
The Council has pedestrian access mobility plans and bike plans prepared for Grafton, South Grafton, Maclean, Yamba, Iluka, Woombah, Lawrence and Ulmarra. Preparation of plans for the remaining villages and a review of the plan are planned for completion the following areas:
Continued implementation of the Pedestrian Access and Mobility Plan
General focus will be on managing condition 4 and 5 footpath segments and footpath/cycleway network condition to better schedule maintenance and replacement requirements. This includes measuring the severity of defects so that a more directed maintenance and potential programs and funding
To manage the Council’s:
• road network in a safe and serviceable condition.
• bridges in a safe and serviceable condition.
• rural drainage network to ensure that the network operates and allows the free passage of water in a safe manner.
• footpath and off-road cycleway network to ensure that it is free of significant defects and meets the community’s walking and cycling needs.
• car parks to provide adequate parking opportunities for the community.
• traffic facilities to provide increased safety to the public using the road network.
• guardrail/safety fencing so that it offers protection to motorists.
• roadside furniture to provide additional amenities for pedestrians at required locations.
• street lighting to improve safety in car parks and on urban streets.
• signs to provide appropriate warning and advice to motorists.
• water facilities to provide and enhance the usage of the Council’s natural waterways.
• other assets in a safe and serviceable condition.
Performance Measures Target
(a) Ensure that maintenance works are undertaken effectively.
(b) Develop detailed forward worksprograms.
• Review and monitor the inspection system to better target maintenance works to areas required.
• Review and monitor maintenance procedures to ensure effective practices are utilised.
• Implement upgraded maintenance programs.
• Collect detailed data, including updated condition data, on all assets.
• Prepare detailed maintenance works programs.
• Monitor effectiveness of implemented programs though overall asset condition
(c) Asset management prioritise future works. updated asset data on an annual desktop revaluation of transport assets as per the
Activities
(a)Ensure that mainten are undertaken
Reviewand monitor inspection system to better target maintenance works to areas required.
Review and monitor maintenanceprocedures to ensure effective practices are utilised.
Implement upgraded maintenanceprograms.
(b) Develop detailed forw programs.
Collect detailed data, includingupdated condition data, on all assets.
Prepare detailed maintenanceworks programs.
Monitor effectiveness of implemented programs though overall asset condition assessments.
Seekadditional sources of funding for capital works.
• Consideration should be given to the percentage of the Council’s water assets, which are currently in average condition. Renewal shortfalls currently indicated will need to be investigated and addressed.
There is a shortfall of $2.3M on average per year which equates to a $23M over the life of the 10- Year Plan for maintenance, operations, renewals, and upgrade/new assets. The Office of Water’s (OoW) Best Practice Management Guidelines require the Council to have a robust 30-year financial model for its water fund. This is monitored and updated each year with the audited financial statements. The FINMOD 30-year financial model has indicated that this projected funding can be met under the current pricing path.
• The renewal program in the Water Services AMP, which has been included in the LTFP, is based on the current water supply asset renewal requirements. The AMP has assessed only 4.1% of the assets as being in a ‘poor’ condition. However, a significant proportion of water assets that are currently assessed as being in ‘fair’ or ‘good’ condition are at, or have exceeded, their theoretical life. It is only proposed to schedule replacement of these assets when their condition deteriorates to a ‘poor’ condition, and there is insufficient evidence to enable establishment of a timeframe for this deterioration. Within the next 3 years, further analysis of asset deterioration will be performed. It is proposed that the cash surplus in the water fund be used to establish a water renewal reserve, with the maximum reserve amount to be set as a percentage of the gross replacement cost of the water infrastructure. The percentage is to be determined through the further analysis of asset deterioration. Future unscheduled water asset renewals
In addition, a risk identified in the AMS is regulatory change that would mandate This requires CVC to upgrade estimated that the capital cost of commencing in2025-26 through to
Condition Survey
Appropriate maintenance programs are implemented to ensure all assets reach maximum useful life within budgetary constraints.
The water fund financial modelling has also not included the potential future 75,000ML, which was foreshadowed in water supply as potentially being required by the year 2046, although current consumption trends indicate that augmentation would not be If this augmentation were to The climate change impacts from the Nymboida River of Shannon Creek Dam. Maintenance Programs
A maintenance management system (MMS) has been implemented, with a assets. Since the introduction of to preventative maintenance,
Australis Valley Council
Last
Main Findings
Note * The residual risk is the risk remaining after the selected risk treatment plan is operational.
• The Council's water supplies are unfiltered. While the water supply generally meets the Australian Drinking Water Guidelines (ADWG) requirements, recommended limits for aesthetic limits are occasionally exceeded. These do not present a health risk. The main complaint is dirty or discoloured water, which is addressed with mains flushing and source management.
• All water supplies are chlorinated and (other than Glenreagh and Coutts programmed to be completed 2025/26) stabilised due to natural soft water.
• As part of the Drinking Water Quality Assurance Management Plan (DWQAMP), additional treatment barriers (inc. filtration) may be required.
• A particular risk to water supply infrastructure is that in several locations, there are water mains that are threatened by riverbank erosion, and there are single pipelines crossing waterways. The forward financial plan proposes to manage these risks.
Objective
Performance Measures
(a) Ensure that maintenance works are undertaken effectively.
There is an inability to upgrade water treatment if regulatory changes require potentially be in breach of the
quality, affordable, and environmentally and Total Water Cycle
environmental impacts. target maintenance works to ensure effective practices are
(b) Develop detailed forward worksprograms. on all assets. though overall asset condition
(c) Ensure good governance and administrative support for the Council and organisation.
(d) Asset management
• Comply with the OoW’s Best Practice Management Guidelines.
• Review and implement the Strategic Business Plan (SBP) and the Development Servicing Plan (DSP) for water services.
• Water supply is managed in accordance with the DWQAMP.
• Investigate water treatment upgrades for both main and village supplies to improve drinking water quality in accordance with the DWQAMP.
• Drinking water supply meets the ADWG.
• Develop technical standards to assess and prioritise future works (e.g., standards to assess risk-based replacement programs).
• Review and update the Water AMP in line with updated asset data on an annual basis.
• Review and update data from the result of the annual desktop revaluation of water assets for current value.
• Review and update data from the full revaluation of water assets as per the NonCurrent Asset Accounting Procedures.
Activities Who When
(a)Ensure that mainten are undertaken effect
ively
Manage the drinking water system to minimise environmental impacts.
Reviewand monitor the inspection system to better target maintenance works to areas required.
Review and monitor maintenance procedures to ensure effective practices are utilised.
Implement upgraded maintenance programs.
(b) Develop detailed programs.
Collect detailed data, includingupdated condition data, on assets.
Prepare detailed maintenanceworks programs.
Monitor effectiveness implemented programs though overall asset condition assessments.
Seekadditional sources of funding for capital works.
(c) Ensure good administrative Council and organisat
Comply with the OoW’s Best Practice Management Guidelines.
Reviewand implement the SBP and the DSP for water services.
Water supply is managedin accordance with the DWQAMP.
Investigate water treatment upgrades for both main and village supplies to improve drinking water quality in accordance with the DWQAMP.
• Consideration should be given to the percentage of the Council’s
-33,385,126
Maintenance Programs
• There is a shortfall budget over the life of the 10-Year Plan for maintenance, operations, renewals, and upgrade/new assets of $3.9M pa which equates to $39M over the life of the plan. The OoW’s Best Practice Management Council is required to have a robust 30-year financial model for its sewer fund. This is monitored and updated each year when the audited financial statements are completed, The FINMOD 30-year financial model has indicated that this projected funding can be met under the current pricing path.
• Therenewal program in the Sewerage AMP, which has been included in the LTFP, is based on the current sewerage asset renewal requirements. The AMP has assessed only 21.6% of the assets as being in a ‘poor’ condition. However, a significant proportion of sewer assets that are currently assessed as being in ‘fair’ or ‘good’ condition are at, or have exceeded, their theoretical life. It is only proposed to schedule replacement of these assets when their condition deteriorates to a ‘poor’ condition, and there is insufficient evidence to enable establishment of a timeframe for this deterioration. It is proposed that the cash surplus in the sewer fund be used to establish a sewer renewal reserve, with the maximum reserve amount to be set as a percentage of the gross replacement cost of the sewer infrastructure. The percentage is to be determined through the further analysis of asset deterioration. Future unscheduled sewer asset renewals will be funded from this reserve.
Last Condition Survey to ensure all assets reach are now committed to preventative maintenance, unplanned and breakdown work. to determine reticulation
with External Verification by Council
Sewerage Services
Objective
selected risk treatment plan is Best Practice Guidelines. the changing of environmental requirements, which may require unforeseen augmentation in the future. feasible schemes for rural villages. change requires an place the Council in breach of
Sewerage Services
Provide high-quality management of sewerage services that is ecologically, socially, and economically sustainable.
Performance Measures Target
• The sewer network is adequately maintained to prevent environmental overflows and offensive odours.
(a) Ensure that maintenance works are undertaken effectively.
(b) Develop detailed forward worksprograms.
(c) Ensure good governance and
• Review and monitor the inspection system to better target maintenance works to areas required.
• Review and monitor maintenance procedures to ensure effective practices are utilised.
• Implement upgraded maintenance programs.
• Collect detailed data, including updated condition data, on all assets.
• Prepare detailed maintenance works programs.
• Monitor effectiveness of implemented programs though overall asset condition assessments.
• Comply with the OoW’s Best Practice Management Guidelines.
administrative support for the Council and organisation.
(d) Asset management
• Review and implement the SBP and the DSP for sewer services.
• Meet Environmental Protection Licence requirements for environmental release of recycled water and NOW requirements for reuse.
• All trade waste dischargers to have appropriate agreements and be inspected.
• All recycled water end is used to have appropriate agreements and monitoring.
• Develop technical standards to assess and prioritise future works (e.g., standards to assess risk-based replacement programs).
• Review and update the Sewerage AMP in line with updated asset data on an annual basis.
• Review and update data from the result of the annual desktop revaluation of sewerage assets for market/current value.
• Review and update data from the full revaluation of sewerage assets as per the Non-Current Asset Accounting Procedures.
• Consideration should be given to the percentage of the
or
Maintenance Programs
• There is a funding shortfall of $830K on average per year over the life of the 10Year Plan for maintenance, operations, renewals and upgrades/new assets, totalling $8.3M for the life of the plan.
• Appropriate funding is required to ensure maintenance programs are implemented so that assets reach their end-of-useful life.
• Funding includes a proportion of Clarence Coast Reserve Trust funding for buildings located within the Reserve Trust managed by the Council.
• Grant and community support funding is to be sought wherever possible to assist in making up the funding shortfall when upgraded/new buildings are proposed.
• Other contributions from grants or other sources have been considered in the plan.
• Appropriate maintenance programs are implemented to ensure all assets reach their maximum useful life within budgetary constraints.
• The Council regularly inspects buildings and undertakes maintenance programs to ensure as a priority they are safe.
• Asbestos management safety is a priority for the Council’s renewal, upgrade, and disposal programs.
Last Condition Survey AssetVal Council
Main Findings
Service or Asset at Risk
Can Happen
Buildings Materials containing asbestos within existingbuildings are disturbed/broken.
Loss or partial loss of infrastructure providingservices to the Community
Asbestos identified in buildings is managed according to the CVC Asbestos Management Protocol.
Effected buildings recorded in Asbestos Risk Register, together with control measures and a completion date for removal.
Business continuity plan in place.
Adequate infrastructure is in place to reduce
Maintenance is appropriately at an operational level
Future planning improvements can be documented risks and utilisation of these in establishing future priorities
improve
on
Capital allocations be for ongoing upgrades to older facilities that do not meet legislation.
selected risk treatment plan is
• The buildings are classified as either specialised or non-specialised buildings being made up of: Specialised
o Amenities, cemeteries, community, community halls/centres, depots, parks and reserves, RFS/SES, sheds, sporting. Non-Specialised
o Community health, cultural, museums, office/administration, public libraries, residential.
• Additional buildings are included in other AMPs such as waste, holiday parks, saleyards and pools.
• The current rationalisation of the Council’s building footprint is to reduce operations and maintenance costs; this will have a major impact during the life of this plan. The need for this arose due to the number of buildings and facilities the Council is still carrying from the amalgamation of former councils.
• The rationalisation of the Council’s buildings has commenced with the sale of a number of properties and the construction of new encompassing facilities.
• A review of the Developer Contribution Plan is to be undertaken.
• The focus will be on strategically planning for condition 4–5 buildings and any condition 3 buildings that are likely to move to condition 4 in the next 10 years. Ensure data is available to determine whether the maintenance required to achieve the estimated useful life is achieved.
• Asbestos management plans and their implementation for major buildings will be a key action. It is a priority to manage asbestos and its removal wherever practicable.
• Assets in condition 5 will require demolition and disposal, and some will be replaced and upgraded.
• A review of residential properties has been undertaken with buildings identified for disposal.
• The focus on energy/efficiency is for major facilities to reduce operational costs associated with power use, (e.g. major upgrade of air conditioning systems and installation of solar panels).
• Focus on providing all-accessible access to buildings and facilities due to the changing demographics of an ageing population.
Objective serviceable condition. Provide
Performance
Measures
(a) Ensure that maintenance works are undertaken effectively. maintenance works to effective practices are
(b) Develop detailed forward works programs. all assets. new/upgraded works programs aligned to available budgets. overall building asset
(c) Ensure good governance and administrative support for the Council and organisation. replacement/upgrade/disposal of assets. is appropriate to the new Community Strategic Plan when completed.
• Develop technical standards to assess and prioritise future works.
• Review and update the Buildings AMP in line with updated asset data on an annual basis.
(d) Asset management
• Review and update data from the result of the annual desktop revaluation of the building portfolio for market/current value.
• Review and update data from the full revaluation of the building portfolio as per the Non-Current Asset Accounting Procedures.
Activities Who When
(a)Ensure that maintenance work are undertaken effectively
7
Review and monitor the inspection system to better target maintenance works to areas required.
Review and monitor maintenance procedures to ensure effective practices are utilised.
(b) Develop detailed forw programs.
Collect detailed data, includingupdated condition data, on all assets. MOS&F & IAPS 8
Prepare detailed maintenance, renewal and new/upgraded works programs targeting condition 4 and 5 assets and safety issues aligned to available budgets.
Monitoreffectiveness of implemented programs though overall building asset condition assessments.
Seekadditional sources of funding for capital works.
(c) Ensure good govern administrative support Council and organisat
Review the property portfolio for the replacement/upgrade/ disposal of assets.
Review the Developer Contributions Plan 2011 to ensure it is appropriate to the Community Strategic Plan.
(d) Asset Management
Develop technical standards to assess and prioritise future works.
Review and update the Buildings AMP in line with updated asset data on an annual basis.
7 Manager of Open Spaces & Facilities
8 Infrastructure Asset Planning Supervisor
Review and update data from the result of the annual desktop revaluationof building portfolio for current value.
Review and update data from the full revaluationof building portfolio as per the Non- Current Asset Accounting Procedures.
• Consideration should be given to the percentage of the Council’s Open Spaces assets, which are currently rated condition 3 to 5. Renewal shortfalls will need to be investigated and addressed.
• There is a funding shortfall of $280K on average per year over the life of the 10Year Plan for maintenance, operations, renewals and upgrades/new assets, totalling $2.8M for the life of the plan.
• Grant and community support funding is to be sought wherever possible to assist in making up the funding shortfall when upgraded/new buildings are proposed.
• Other contributions from grants or other sources have been considered in the plan.
• Appropriate maintenance programs are implemented to ensure all assets reach their maximum useful life within budgetary constraints.
• Develop or review asset inspection programs for the various types of facilities. Last Condition Survey
• Valuation dated – March 2022, desktop valuation by AssetVal
• Condition assessment undertaken by Clarence Valley Council
o Utilities (lighting, water tanks, septic tanks)
o Sports structures (grandstands, irrigation, sporting structures)
o Other structures
o Green assets such as sports fields and street trees are not currently valued.
• The Council currently manages:
Main Findings risk treatment plan is footpaths, internal roads &
o 123 parks (~101 ha)
o 25 sports grounds (~209 ha)
o 194 general community uses (~194 ha)
o 69 natural areas (~573 ha)
o 19 areas of cultural significance (~93 ha)
• Asset service hierarchy from Open Spaces Strategic Plan and Generic Plan of Management
o Regional
o District
o Local
• Levels of service have been defined and documented for most of these areas.
• Community surveys conducted revealed the community is satisfied overall with current Open Spaces levels of service.
Objective
Open Spaces
To provide high-quality and sustainable sport and recreational opportunities at a safe and functional standard and appropriate appearance that meet our community’s needs.
Performance Measures Target
(a) Ensure that maintenance works are undertaken effectively.
(b) Develop detailed forward works programs.
• Review and monitor the inspection system to better target maintenance works to areas required.
• Review and monitor maintenance procedures to ensure effective practices are utilised.
• Collect detailed data, including updated condition data, on all assets.
• Prepare detailed maintenance, renewal and new/upgraded works programs aligned to available budgets. though overall building asset
(c) Ensure good governance and administrative support for Council and organisation. replacement/upgrade/disposal of assets, as defined in ensure it is appropriate to the Sports Facilities Plan. changes.
(d) Asset management prioritise future works. updated asset data on an desktop revaluation of open the Open Spaces portfolio as
Collect detailed data, includingupdated condition data, on all assets.
Prepare detailed maintenance, renewal and new/upgraded works programs targeting condition 4 and 5 assets and safety issues aligned to available budgets.
Monitoreffectiveness of implemented programs though overall Open Spaces asset condition assessments.
Seekadditional sources of funding for capital works.
(c) Ensure good administrative Council and organisat
Reviewasset portfolio for replacement/ upgrade/disposal of assets, as defined in the Open Spaces Strategic Plan
Review the Developer Contributions Plan to ensure it is appropriate to the Community Strategic Plan.
Reviewcontract maintenance agreements.
(d) Asset Management
Develop technical standards to assess and prioritise future works.
Reviewand update Open Spaces AMP in line with updated asset data on an annual basis.
& IAPS 10
Review and update data from the result of the annual desktop revaluation of the Open Spaces portfolio for current value.
Review and update data from the full revaluation of the Open Spaces portfolio as per the Non- Current Asset Accounting Procedures.
• Grafton Regional Landfill has approx. 70 years of landfill space remaining at current filling
Budget Implications
• Consideration should be given to the percentage of the Council’s waste assets, which are currently in a fair or moderate condition.
• There is a funding shortfall of $18.9K on average per year over the life of the 10Year Plan for maintenance, operations, renewals and upgrades/new assets, totalling $189K for the life of the plan.
• Domestic waste is self-funding.
• Regional landfill is self-funding.
• Other waste services, which include the network of transfer stations, are funded by a waste management fund.
Maintenance Programs
• Appropriate maintenance programs are implemented to ensure all assets reach their maximum useful life within budgetary constraints. Last Condition Survey
• Valuation dated – March 2022, desktop valuation by AssetVal
• Condition assessment undertaken by Clarence Valley Council
facilities
Main Findings
Waste Injury at unsupervised
Baryulgil Waste transfer station
equipment, when necessary.
H Training for staff in all waste management procedures
H Clear procedures followed as per EPA Licence
H Safe work procedures followed by waste staff and patrons at waste sites follow safety directions
Review operation of the site in line with the Waste Management Strategy.
Remove hazards when identified
Regularly maintain site the impact of restrictions, and implement any recommended by the
Reinforce public education programs on
risk treatment plan is sites, this expenditure is landfill cells are not
Objective
effective and meet the community’s expected service level while also complying with environmental and health and safety requirements.
(a) Ensure that maintenance works are undertaken effectively.
(b) Develop detailed forward works programs.
Performance Measures Target
• Review and monitor the inspection system to better target maintenance works to areas required.
• Review and monitor maintenance procedures to ensure effective practices are utilised.
• Review and monitor contractor agreements.
• Collect detailed data, including updated condition data, on all assets.
• Develop and implement waste management capital works programs.
• Monitor effectiveness of implemented programs though overall asset condition
(c) Compliance
(d) Asset management
assessments.
• Implement the Solid Waste Management Strategy within the agreed timeframe.
• Implement the annual Waste Education Program.
• Implement the Regional Landfill Environmental Management Plan.
• Comply with Landfill POEO Act Licence.
• Develop technical standards to assess and prioritise future works.
• Review and update the Waste AMP in line with updated asset data on an annual basis.
• Review and update data from the result of the annual desktop revaluation of the waste portfolio for market/current value.
• Review and update data from the full revaluation of waste portfolio as per the Non-Current Asset Accounting Procedures.
Activities Who When
(a) Ensure that mainten worksareundertaken effectively
Reviewand monitor inspection system to better target maintenance works areas required.
Review and monitor maintenance procedures to ensure effective practices utilised.
Review and monitor contractor agreements.
(b) Develop detailed works programs.
Collect detailed data, includingupdated condition data, on assets.
• There is a funding shortfall of $1.06M on average per year over the life of the 10Year Plan for maintenance, operations, renewals and upgrades/new assets, totalling $10.6M for the life of the plan.
• Additional grant funding will be sought for programs, especially for capital programs.
• Grant funding where there is no certainty of the grant funding being available has not been included in the assessment.
• Appropriate maintenance programs are implemented to ensure all assets reach their maximum useful life within budgetary constraints.
• The Council is implementing a detailed inspection program to identify and rectify defects, especially those that pose a safety issue, in a timely manner.
Valuation dated – March 2023, valuation by AssetVal Condition assessment undertaken by Clarence Valley Council
Main Findings
Road Culverts Pipecollapse in roadway
Prioritiseany identified maintenance and/or renewal work
Capital upgrades to existingsystems where overflows occur most frequently and with the most impact
Completeculvert audit and commence programmed maintenance on a basis.
culvert audit commence programmed maintenance on a priority basis.
risk treatment plan is
Floods have had an impact on the condition of some of the stormwater network, It is possible that there are which have not yet appeared as
stormwater network through CCTV inspection on an ongoing basis will be implemented to better determine the 5 stormwater segments and maintaining stormwater segments at condition 3 and above.
butt-jointed pipes. Many of these culverts have separated and become disjointed, causing them to not operate correctly and raising concerns over their structural integrity.
• Culvert inspections also identified that many of the culverts, including inlets and outlets, are at least partially blocked, causing them to operate inefficiently.
• The major emphasis is to increase maintenance levels in the following areas:
• Culvert maintenance, clearing culverts on a regular cycle
• Replacing culverts where pipes have separated and become disjointed
• The general focus will be on managing condition 4 culverts and maintaining culverts at condition 3 and above.
• The Council maintains 287 km of kerbs and gutters and 272 km of open drains.
• As part of the assessment, no allowance has been made for the construction of new kerbs and gutters that are not associated with provision of new stormwater drainage. Construction of new kerbs and gutters in this situation will be included in the costs associated with the provision of the stormwater drainage.
• The major emphasis is to increase maintenance levels in the following areas:
• Renewing surface drainage conditions rated 4 or 5 over a 20-year period and not constructing any new kerbs or gutters unless associated with stormwater works.
• Additional data is to be gathered on the condition of culverts and other transport
Objective
Stormwater
To manage the stormwater network in a safe and serviceable condition so that the stormwater system operates efficiently under normal rainfall conditions.
Performance Measures Target
(a) Ensure that maintenance works are undertaken effectively.
(b) Develop detailed forward works programs.
• Review and monitor the inspection system to better target maintenance works to areas required.
• Review and monitor maintenance procedures to ensure effective practices are utilised.
• Review and monitor contractor agreements.
• Collect detailed data, including updated condition data, on all assets.
• Develop and implement waste management capital works programs. implemented programs though overall asset condition
(c) Asset management prioritise future works. updated asset data on an annual annual desktop revaluation of the of waste portfolio as per the
Activities
(a)Ensure that are undertaken
Reviewand monitor inspection system to better target maintenance works to areas required.
(b) Develop detailed forw programs.
Collect detailed data, including
Monitor effectiveness of implemented programs though overall asset condition assessments.
Seekadditional sources of funding for capital works.
• There is a funding shortfall of $258K on average per year over the life of the 10Year Plan for maintenance, operations, renewals and upgrades/new assets, totalling $2.58M for the life of the plan.
• Funding for holiday parks is sourced from the CCRT15 Fund, not the Council’s general fund.
• A fair or moderate condition may not be sufficient in a competitive environment for certain assets such as amenities; cabins may be required to be maintained in a good to very good condition.
• Appropriate maintenance programs are implemented to ensure all assets reach their maximum useful life within budgetary constraints.
• Maintain a cabin refurbishment program.
• Valuation dated – March 2022, desktop valuation by AssetVal
• Condition assessment undertaken by Clarence Valley Council
Main Findings
Objective
Holiday Parks The loss of appointment as Crown Land Manager
H Financialmanagement of Crown Land in accordance with Division 3.4 of the Crown Land ManagementAct 2016
Quarterly meetings with Crown Lands Department
Note * The residual risk is the risk remaining after theselected risk treatment plan is operational.
• Holiday parks managed by the Council are:
• Calypso Holiday Park Yamba
• Iluka Riverside Holiday Park Iluka
• Brooms Head Holiday Park
• Minnie Water Holiday Park
• Wooli Holiday Park
Holiday Parks
Brooms Head Holiday Park
development plans for Wooli and
To operate the caravan parks in a sustainable manner while returning an adequate return on investment by offering customers a high-quality holiday experience.
Performance Measures Target
(a) Ensure that maintenance works are undertaken effectively.
(b) Develop detailed forward works programs.
(c) Sustainable Operation
• Review and monitor the inspection system to better target maintenance works to areas required.
• Review and monitor maintenance procedures to ensure effective practices are utilised.
• Maintain assets to meet customer expectations.
• Collect detailed data, including updated condition data, on all assets.
• Prepare detailed maintenance, renewal and new/upgraded works programs and safety issues aligned to available budgets.
• Monitor effectiveness of implemented programs.
• Oversee the professional management of caravan parks through regular contract reviews.
• Develop and implement Business Development Strategy for all holiday parks.
• Develop and implement an effective marketing strategy for all holiday parks.
• Review and set pricing appropriate to the target market.
• Develop technical standards to assess and prioritise future works.
• Review and update the Holiday Parks AMP in line with updated asset data on an annual basis.
(d) Asset management
• Review and update data from the result of the annual desktop revaluation of the holiday parks portfolio for market/current value.
• Review and update data from the full revaluation of the holiday parks portfolio as per the Non-Current Asset Accounting Procedures.
Activities Who When
(a) Ensure that mainten works are undertaken effectively
Reviewand monitor the inspection system to better target maintenance works to areas required.
Review and monitor maintenance procedures to ensure effective practices are utilised.
Maintain assets tomeet customer expectations.
(b) Develop detailed forw works programs.
Collect detailed data, includingupdated condition data, on assets.
Prepare detailed maintenance, renewal and new/upgraded works programs and safety issues aligned available budgets..
Monitoreffectiveness implemented programs though overall asset condition assessments.
(c) Sustainable
Oversee the professional management of caravanparks through regular contract reviews.
Develop and implement Business Development Strategy for all holiday parks.
Developand implement an effective marketing strategy for all holiday parks.
Review and set pricing appropriate to the target market.
(d) Asset Management
Develop technical standards to assess and prioritise future works.
Reviewand update the Holiday Parks AMP in line with updated asset data on an annual basis.
Review and update data from the result of the annual desktop revaluation of the Holiday Parks portfolio for current value.
Review and update data from the full revaluation of the Holiday Parks portfolio as per the Non- Current Asset Accounting Procedures.
806,236.00 80,623.60
785,031.94 78,503.19 97.37% -2,120.41
Sustainability Report
Budgeted Renewal and Shortfall Report
• Consideration should be given to the percentage of the
Maintenance Programs
Condition Survey
• There is a funding shortfall of $2.1K on average per year over the life of the 10Year Plan for maintenance, operations, renewals and upgrades/new assets, totaling $21K for the life of the plan.
• The condition profile will change when other structures’ reviews are completed.
• The major future expenditure budget for the effluent management system will be required.
• Appropriate maintenance programs are implemented to ensure all assets reach their maximum useful life within budgetary constraints.
• Develop and/or review asset inspection programs for the saleyards.
• Ensure appropriate maintenance programs are implemented to ensure assets reach end-of-useful life.
• Valuation dated – March 2022, desktop valuation by AssetVal
• Condition assessment undertaken by Clarence Valley Council
Main Findings
Objective
Performance Measures
numberof head, cents/kilogram impact on operations
Saleyard Operations Saleyard income makes the continued operation unsustainable.
Loading Ramps
Loadingramps do not allow enough separation between workers and animals.
Seek out alternate uses/opportunities.
Reviewand implement marketing plan and service plan
Seek funding for improvements/ upgrades to meet current standards
Seek funding to upgrade ponds and treatment plant
risk treatment plan is treatment plant.
loading and unloading of
weather protection for the sale
agricultural industry in the
(a) Ensure that maintenance works are undertaken effectively. target maintenance works to areas required.
(b) Develop detailed forward works programs.
(c) Sustainable Operation
• Review and monitor maintenance procedures to ensure effective practices are utilised.
• Collect detailed data, including updated condition data, on all assets.
• Develop and implement saleyard management capital works programs.
• Monitor the effectiveness of implemented programs though overall asset condition assessments.
• Develop and review a business plan for saleyards.
• Seek opportunities to promote saleyards.
• Coordinate WHS with yard users through the Saleyards Advisory Committee.
(d) Asset management
• Develop technical standards to assess and prioritise future works.
• Review and update the Saleyards AMP in line with updated asset data on an annual basis.
• Review and update data from the result of the annual desktop revaluation of saleyard assets for market/current value.
• Review and update data from the full revaluation of the saleyard portfolio as per the Non-Current Asset Accounting Procedures.
Activities
(a) Ensure that mainten works are undertaken effectively
Reviewand monitor the inspection system to better target maintenance works to areas required.
Review and monitor maintenance procedures to ensure effective practices utilised.
(b) Develop detailed works programs.
Collect detailed data, includingupdated condition data, on assets.
Developand implement saleyard management capital works programs
Monitoreffectiveness implemented programs though overall asset condition assessments.
(c) Sustainable
Develop and review business plan for saleyards.
Seekopportunities promote saleyards.
Who When
Coordinate WHS with yard users through the Saleyards Advisory Committee.
(d) Asset Management
Develop technical standards to assess and prioritise future works.
Review and update the Salyards AMP in line with updated asset data on an annual basis.
Review and update data from the result of the annual desktop revaluation of the Saleyard assets for current value.
Review and update data from the full revaluation of the Saleyardsportfolio as per the Non- Current Asset Accounting Procedures.
Sustainability Report
• Consideration should be givento the percentage of the Council’s floodplain assets, which are
Maintenance Programs
Last Condition Survey
• There is a funding shortfall of $10K on average per year over the life of the 10Year Plan for maintenance, operations, renewals and upgrade/new assets, totaling $1M for the life of the plan.
• Additional grant funding will be sought for programs, especially for capital programs.
• Where there is no certainty of grant funding being available, it has not been included in the assessment. This is particularly relevant with funding from the Office of Environment and Heritage, which has not been included in this assessment. This funding is typically received on a 2:1 basis for approved projects. Successful funding applications under this program therefore have the potential to significantly affect the nominated deficit figure.
• Appropriate maintenance programs are implemented to ensure all assets reach their maximum useful life within budgetary constraints.
• Valuation dated – March 2023, valuation by AssetVal Council
Main Findings
Levees Thelevee wall fails. H Regularmaintenance program L
Four yearly condition assessment programs
Public works inspections
Note * The residual risk is the risk remaining after the selected risk treatment plan is operational.
• Levees
• Open drains
• Culvert assets
• Floodgates
• Bridges
• Rock protection
Floods have a major impact on the condition of floodplain assets. In general, the restoration cost of these assets has been excluded from the assessment on the receive natural disaster relief assistance for damage However, damage will occur to assets from repeated flood events that may not be able to be attributed to single events but will cause The restoration costs of these in the following areas: inspection and maintenance on a 4implementation of an increased spraying program annum period plus mechanical cleaning of drains as
The general focus will be on managing condition 4 and 5 floodplain assets and maintaining floodplain assets rated at condition 3 and above.
Additional detailed data is to be gathered on the floodplain network, especially rural levees, to better determine the extent of the condition of the assets and to effectively. This is also to include
The Council is implementing a detailed inspection program to identify and rectify defects, especially those that pose a safety issue, in a timely manner.
Floodplain
Objective
To provide and maintain floodplain assets that afford protection to urban and rural communities and their assets from flood events.
(a) Ensure that maintenance works are undertaken effectively.
(b) Develop detailed forward works programs.
Performance Measures Target
• Review and monitor the inspection system to better target maintenance works to areas required.
• Review and monitor maintenance procedures to ensure effective practices are utilised.
• Implement upgraded maintenance programs.
• Collect detailed data, including updated condition data, on all assets.
• Prepare detailed maintenance works programs.
• Monitor effectiveness of implemented programs though overall asset condition
(c) Asset management
assessments.
• Seek additional sources of funding for capital works.
• Develop technical standards to assess and prioritise future works (e.g., standards to assess risk-based replacement programs).
• Review and update the Floodplain AMP in line with updated asset data on an annual basis.
• Review and update data from the result of the annual desktop revaluation of floodplain assets for market/current value.
• Review and update data from the full revaluation of floodplain assets as per the Non-Current Asset Accounting Procedures.
Activities Who When
(a) Ensure that mainten works are undertaken effectively
Reviewand monitor inspection system to better target maintenance works to areas required.
Review and monitor maintenance procedures to ensure effective practices utilised.
(b) Develop detailed works programs.
Collect detailed data, includingupdated condition data, on assets.
Prepare detailed maintenance works programs
Monitoreffectiveness implemented programs though overall asset condition assessments.
Seekadditional sources of funding for capital works
(c) Asset Management
Develop technical standards to assess and prioritise future works.
Review and update the Floodplain AMP in line with updated asset data on an annual basis.
Review and update data from the result of the annual desktop revaluation of the Floodplain assets for current value.
Review and update data from the full revaluation of the Floodplainassets as per the Non- Current Asset Accounting Procedures.
• Consideration should be given to the percentage of the Council’s swimming pool assets, which are currently in fair to moderate condition.
• Over a 10-year period, there is an average funding shortfall of $331K for maintenance, operations, renewals, upgrades and new projects at existing pools, totalling $3.31M for the life of the plan.
• Appropriate maintenance programs are implemented to ensure all assets reach their maximum useful life within budgetary constraints.
• Pool contractors are required to carry out maintenance as scheduled.
• Valuation dated – March 2022, desktop valuation by AssetVal
• Condition assessment undertaken by Clarence Valley Council
Aquatic Facilities
Main Findings
of pool infrastructure.
Objective
risk treatment plan is community pool complexes: Complex yet to make an impact to the findings of the AMP (these will be included in the next version). of the South Grafton Indoor
encourage participation. and maintain infrastructure in an efficient and effective manner.
Performance Measures Target
(a) Ensure that maintenance works are undertaken effectively.
(b) Develop detailed forward works programs.
• Review and monitor the inspection system to better target maintenance works to areas required.
• Review and monitor maintenance procedures to ensure effective practices are utilised.
• Collect detailed data, including updated condition data, on all assets.
• Prepare detailed maintenance, renewal and new/upgraded works programs targeting condition 4 and 5 assets and safety issues aligned to available budgets.
• Monitor effectiveness of implemented programs by changes in the overall swimming pools asset condition assessments.
• Seek additional sources of funding for capital works.
(c) Ensure good governanceand administrative support for the Council and organisation.
(d) Asset management
• Review and implement the Aquatic Facilities Strategy.
• Continue to review fee structure and implement any changes.
• Review and monitor contractor agreements.
• Develop technical standards to assess and prioritise future works.
• Review and update the Swimming Pools AMP in line with updated asset data on an annual basis.
• Review and update data from the result of the annual desktop revaluation of the swimming pools portfolio for market/current value.
• Review and update data from the full revaluation of the swimming pools portfolio as per the Non-Current Asset Accounting Procedures.
Activities Who When
(a) Ensure that mainten works are undertaken effectively
Reviewand monitor inspection system to better target maintenance works to areas required.
Review and monitor maintenance procedures to ensure effective practices utilised.
(b) Develop detailed works programs.
Collect detailed data, includingupdated condition data, on assets.
Prepare detailed maintenance, renewal and new/upgraded works programs and safety issues aligned available budgets..
Monitoreffectiveness of implemented programs though overall asset condition assessments.
Seekadditional sources of funding for capital works
(c) Ensure good governance and administrative support for the Council and organisation.
Reviewand implement the Aquatic Facilities Strategy.
Continue to review fee structure and implement any changes.
Review and monitor contractor agreements.
(d) Asset Management
Develop technical standards to assess and prioritise future works.
Review and update the Aquatic Facilities AMP in line with updated asset data on an annual basis.
Review and update data from the result the annual desktop revaluation of the Aquatic Facilities portfolio for current value.
Reviewand update data from the full revaluation of the Aquatic Facilities portfolio as per the Non- Current Asset Accounting Procedures.
3,374,438.75 337,443.88
Sustainability Report
Budget Implications
Maintenance Programs
Last Condition Survey
• Consideration should be given to the percentage of the Council’s airport assets, which are currently in fair or moderate condition.
• Over a 10-year period, there is an average funding shortfall of $70K for maintenance, operations, renewals, upgrades and new projects, totalling $7M for the life of the plan.
• Additional grant funding will be sought for programs, especially for capital programs.
• Appropriate maintenance programs are implemented to ensure all assets reach their maximum useful life within budgetary constraints.
• The Council has a detailed inspection program to identify and rectify defects, especially those that pose a safety issue to aircraft, in a timely manner.
• Valuation dated – March 2022, desktop valuation by AssetVal
• Condition assessment undertaken by Clarence Valley Council
Main Findings
Regional Airport –Terminal
Airline discontinues service and usage of airport
Regional Airport Planes flight path hindered.
Objective
Minor heavy patching of failure areas
VH Seekalternate service providers when necessary.
H Administrative - NOTAM Raised and New Data changes published
Remove Trees ASAP
Note * The residual risk is the risk remaining after the selected risk treatment plan is operational.
• The Council maintains the following major airport assets:
• Buildings
The Council has undertaken significant renewal and upgrade works in recent years, including strengthening and sealing the runway, extending the apron, apron lighting, replacing the fence, and replacing the generator. assets and maintaining assets
services to the Clarence Valley area, which continually meets and exceeds the CASA operational requirements.
Performance Measures Target
(a) Ensure that maintenance works are undertaken effectively.
(b) Develop detailed forward works programs.
(c) Asset
• Review and monitor the inspection system to better target maintenance works to areas required.
• Review and monitor maintenance procedures to ensure effective practices are utilised.
• Implement upgraded maintenance programs.
• Collect detailed data, including updated condition data, on all assets.
• Prepare detailed maintenance works programs.
• Monitor the effectiveness of implemented programs though overall asset condition assessments.
• Seek additional sources of funding for capital works.
• Develop technical standards to assess and prioritise future works (e.g., standards
management to assess risk-based replacement programs).
• Review and update the Airport AMP in line with updated asset data on an annual basis.
• Review and update data from the result of the annual desktop revaluation of airport assets for market/current value.
• Review and update data from the full revaluation of airport assets as per the Non- Current Asset Accounting Procedures.
Activities Who When
(a) Ensure that mainten works are undertaken effectively
Reviewand monitor the inspection system to better target maintenance works to areas required.
Review and monitor maintenance procedures to ensure effective practices utilised.
Implement upgraded maintenance programs.
(b) Develop detailed works programs.
Collect detailed data, includingupdated condition data, on assets.
Prepare detailed maintenance, works programs.
Monitoreffectiveness implemented programs though overall asset condition assessments.
Seekadditional sources of funding for capital works
(c) Asset Management
Develop technical standards to assess and prioritise future works.
Review and update the Airport AMP in line with updated asset data on an annual basis.
24 Manager of Open Spaces & Facilities
25 Infrastructure Asset Planning Supervisor
Review and update data from the result of the annual desktop revaluation of the Airport assets for current value.
Review and update data from the full revaluation of the Airport assets as per the Non- Current Asset Accounting Procedures.
The Path Forward
Objectives
Clarence Valley Council Community Strategic Plan – The Clarence 2035 outlines the following objectives to be achieved through the effective management of the Council’s assets:
Community
Community Objective
CO1 A proud and inviting community with opportunities to connect, belong and feel safe
CO2 people are
CO3
CO4 growth, development and
CO5 health, education and
Infrastructure
Infrastructure
IN1
IN2 infrastructure including water,
IN3 that improves amenity and liveability
IN4 Footpaths and cycleways that are interconnected, maintained and reach destinations
IN5 Impact of natural disasters on infrastructure is minimised
Economy
Economy Objective
EC1 Business led innovation is supported and encouraged.
EC2 An attractive environment for industry and local businesses to flourish.
EC3 Dispersed and sustainable tourism.
EC4 Telecommunications enable economic growth.
EC5 Employment and education are diverse and accessible
Environment
Environment
EN1 are enhanced and
EN2
EN3
EN4 and education.
EN5
Leadership
Leadership Objective
LE1 Council is accountable and representative with open and transparent leadership.
LE2 Council is financially responsible and sustainable.
LE3 Council represents, advocates and demonstrates a positive and connected partnership with all levels of government.
LE4 Diverse views are considered in decision making.
LE5 Resources and services are managed efficiently and effectively.
Where Do We Want to Be?
To have a strong future, the Council needs to demonstrate to its community that it is financially sound, operating efficiently and in a strong position to grow and deliver quality services into the future. This requires the Council to be:
• Sustainable
• Efficient
• Effective in managing infrastructure and delivering services for communities.
• Capable of having the scale and capacity to engage effectively across community, industry and government.
CVC undertook a service review in 2014, which ensured linkages of service provision to assets and resulted in the rationalisation of some assets. An asset management improvement plan was developed from this and past asset management strategies to guide the Council from its then current situation through to the desired situation of sustainability and best practice asset management. The Asset Management Improvement Plan is a living document, meaning it will be updated and changed over time.
The continual development and enhancement of the Council’s asset management system is an essential part this system develops, so will the accuracy and reliability of the data, enabling improved confidence in associated strategic decision management system is a continual improvement process, which is a ‘work in progress’ requiring assessment and development for the betterment of the organisation and the community (SOAP Strategic Organisational Action Plan), reporting and
Performance reporting will be undertaken by the Council’s Asset Management Advisory Group, which will strategically guide and oversee asset life cycle management for the Council, ensuring that asset management are achieved. This management planning process and monitoring and reporting on the achievement of the outcomes in the individual AMPs.
The Asset Management
•
•
• Manager, Water Cycle
• Manager, Finance and Systems
• Coordinator of Corporate Systems
• Finance & Asset Strategy Planner
• Infrastructure Asset Planning Supervisor
The members of the group will change over time in line with organisational structure changes and requirements as the Council moves from core to advanced asset management.
It is critical that the Review Group ensures that the Strategic AMPs reflect the operational activities of the Council.
Appendices
Appendix 1 – The Asset Management Improvement Plan (To Be Reviewed and Updated During 2023– 24)
Asset Management Area
Priority (As Determined in the Asset Management Gap Analysis)
Asset Identification and Recording (Asset Strategy 2007)
1. Recommendation 12
That the Council develops a funding model that addresses the sustainable renewal of infrastructure and identifies all asset life cycle costs.
Consider the ongoing ownership costs (recurrent whole-of-life) of new capital works proposals as part of projectscoping and model into the Council’s LTFP to identify impacts and risks.
3. Goal 7
Should be commenced ASAP in conjunction with the development of the single asset register – not using a single register.
Developa funding model.
Undertake a detailed assessment of the resources required to implement this AMS, and ensure it is integrated with the other resourcing strategies so that a program of improvement and milestones can be implemented and performance managed.
4. Recommendation 2
That the impact of new assets from growth be considered as part of the Council’s 10-year financial plans and life cycle costs in the AMPs. That S94 Plans be reviewed and utilised for infrastructure assets where possible.
5. Goal 3
In conjunction with the preparation of AMPs
An integrated Asset ManagementSystem has been developed and implemented in CiA.
Cleansing and refinement of the data is currently being undertaken by the Asset Owners.
Develop a funding model in conjunction with AMP review, SS7, & ‘Fit for the Future’.
AMPs consider the impacts of ‘whole-of-life costs’ of new capital works and predicts a LTFP
In conjunction with the preparation of AMPs
End of financial year
AMPs consider the impact of budgets and gaps and include new assets – to be represented in LFTP
Conducted annually in conjunction with the
Asset Management Area
Priority
(As Determined in the Asset Management Gap Analysis)
AMS 2015
Associated Recommendation
Identify the maintenance and renewal ‘shortfall’ and any renewal and replacement ‘backlogs’ for all asset groups.
6. Goal 5
Reviewand update comprehensive risk management plans for all major asset groups.
2021-22
preparation of The Report on Infrastructure Assets (SS7)
Infrastructure Risk Management Plans have been reviewed and incorporated into the AMP & AMS March 2025. They are to be review on a 4yr cycle inline with the Council elections or if there is any significant risk not previously identified.
AMS 2015
Asset Data Maintenance
An integrated Asset ManagementSystem has been developed and implemented in CiA. Cleansing and refinement of the data is currently being undertaken by the Asset Owners.
(Asset Strategy 2007) for Fleet & IT assets loaded 2015.
9. Recommendation 9
In planning
Asset Data Maintenance
(Asset Strategy 2007)
AMPs (Asset Strategy 2007)
That a plan for updating of asset data be developed and integrated into existing business processes and work procedures where possible.
10. Recommendation 4
That existing service levels be identified, documented and reviewed to ensure that they are appropriate for currently available resources and are sustainable in the long term.
In conjunction with the preparation of AMPs
section uses systems to record requests and actions.
A data flow process will be developed as part of the CiA (corporate information) system.
To be developed in line with ‘as constructed’’ data and data flows/transfers – finance. Integrated processed have been implanted in 2024 financial year and will be refined continually refined in CiA.
Service levels documented in AMPs as ‘what we do now’ & loosely defined.
Community consultation is ongoing and staged for groups of assets.
Asset Management Area
Priority
(As Determined in the Asset Management Gap Analysis)
AMPs
(Asset Strategy 2007)
AMS 2015
Asset Data
Maintenance
(Asset Strategy 2007)
11. Recommendation 5
That a performance reporting system for service levels is developed to report on performanceagainst adopted service levels.
In conjunction with the preparation of AMPs
Currently use P&R (customer request system), but without pre- determined and agreed service levels, it is difficult to monitor.
Some levels of service are provided by contracted service agreements, which are monitored.
Asset Data
Maintenance
(Asset Strategy 2007)
12. Goal 2
Review and maintain AMPs for all major asset groups already developed.
13. Recommendation 10
That a process for the formal ‘handover’ of new and renewed assets from construction to operational status be developed to ensure that asset capitalisation information is identified and documented as an integral component of the project management process. The process is to include assets constructed by and donated to the Council by developers and others.
15. Recommendation 8
That there is greater use of the GIS for operational purposes, including making asset attribute data available to all staff and automating the investigation of asset-related business processes.
AMP Revision Scheduleand IP&R Framework- driven
During 2021–22
Ongoing
AMPs reviewed annually with updates to financial information and processes reviewed every 4yrs.
The contributed asset process started being reviewed in 2020–21. This needs to be completed as soon as possible.
Significant improvements have achieved in the notification and formal handover of contributed assets by developers, further improvements are required to be made with contributions from other agencies and sporting groups.
GIS data is currently being updated by each section. With the centralisation of asset registers, some GIS data updates are now being processed by the asset unit. We are currently awaiting an internal audit report on the processes and recommendations.