RESEARCH REPORT Customer Satisfaction Survey 2022 A random telephone survey of Clarence Valley residents September 2022


CUSTOMER SATISFACTION SURVEY 2022: REF 6456, SEPTEMBER 2022
Limitations/Liability


CUSTOMER SATISFACTION SURVEY 2022: REF 6456, SEPTEMBER 2022 RESEARCH REPORT Customer Satisfaction Survey 2022 A random telephone survey of Clarence Valley residents September 2022 Prepared by: James Parker and Craig
Document Reference: 6456 Version: 01 Taverner Research Group | T +61 2 9212 2900 | W www.taverner.com.au A Level 2, 88 Foveaux Street, Surry Hills, NSW 2010, Australia | Taverner Research Group is wholly owned by Tobumo Pty Ltd | ABN 93 003 080 500 Confidential/Disclaimer Notice The information contained herein is confidential and has been supplied under a confidentiality agreement. If you are not authorised to view or be in possession of this document you are hereby notified that any dissemination, distribution or duplication of this document is expressly prohibited. If you receive this document in error, please notify Taverner Research Group immediately on +61 2 9212 2900.
Stuchbury
While all care and diligence has been exercised in the preparation of this report, Taverner Research Group does not warrant the accuracy of the information contained within and accepts no liability for any loss or damage that may be suffered as a result of reliance on this information, whether or not there has been any error, omission or negligence on the part of Taverner Research Group or its employees.

CUSTOMER SATISFACTION SURVEY 2022: REF 6456, SEPTEMBER 2022
EXECUTIVE
2. SURVEY METHODOLOGY
3. SURVEY
SERVICES
DRIVERS
SERVICES
IMPROVEMENTS
4. APPENDIX 1: QUESTIONNAIRE
5. APPENDIX 2: RESPONDENT PROFILE AND WEIGHTING
6. APPENDIX 3: 2022 SUBGROUP TABLES
CONTENTS 1.
SUMMARY 8
9 2.1. DATA COLLECTION 9 2.2. DATA HANDLING 9 2.3. DATA WEIGHTING 9 2.4. DATA ANALYSIS 9
FINDINGS 10 3.1. PERFORMANCE OF CLARENCE VALLEY COUNCIL 10 3.2. COUNCIL FACILITIES AND
11 3.3.
OF SATISFACTION 20 3.4. CUSTOMER
24 3.5. COUNCIL WEBSITE 36 3.6.
TO THE REGION 38
39
56
59
FIGURES
Figure 1 Overall Satisfaction with Clarence Valley Council 10
Figure 2 Overall Satisfaction Internal Benchmarks 10
Figure 3 Reasons for Overall Satisfaction 11
Figure 4 Council Facilities or Services Satisfaction 13
Figure 5 Infrastructure Comparisons to Regional NSW Benchmarks 15
Figure 6 Services 1 Comparisons to Regional NSW Benchmarks 16
Figure 7 Services 2 Comparisons to Regional NSW Benchmarks 17
Figure 8 Council Facilities or Services Importance 18
Figure 9 Quadrant Analysis 21
Figure 10 Most Important Use of Council Resources 23
Figure 11 Recent Contact with Council 24
Figure 12 Frequency of Contact with Council in the past 12 months 25
Figure 13 Issue Contacted Council Regarding 26
Figure 14 Number of Contacts Required to Resolve their Most Recent Inquiry 27
Figure 15 Why Issue has Not Yet Been Resolved 27
Figure 16 Method of Contact 28
Figure 17 Satisfaction with How Well Council Handled your Inquiry 29
Figure 18 Satisfaction with How Well Council Handled your Inquiry (mean scores) 29
Figure 19 Method Prefer Making a Payment 30
Figure 20 Method Prefer Requesting Council to Do Something 30
Figure 21 Method Prefer Finding Out about Emergency Planning and Recovery Activities 31
Figure 22 Method Prefer Providing Feedback on Important or Topical Issues 31
Figure 23 Method Prefer General Requests for Information 32
Figure 24 Method Prefer Finding out about Council Policies or Activities 32
Figure 25 Method Prefer Finding out about Local Activities and Events 33
Figure 26 Method Prefer Finding out about Local Flooding, Road Closures, etc 34
Figure 27 Access to Council’s Website 36
Figure 28 Rate Council’s Website for Usefulness of Content 37
Figure 29 Rate Council’s Website for Ease of Navigation 37
CUSTOMER SATISFACTION SURVEY 2022: REF 6456, SEPTEMBER 2022
FIGURES
Figure 30 Improvements to the Region 38
CUSTOMER SATISFACTION SURVEY 2022: REF 6456, SEPTEMBER 2022
TABLES
Table 1 Overall Satisfaction with Clarence Valley Council Compared to External Benchmark 11
Table 2 Council Facilities or Services Satisfaction Internal Benchmarks (mean scores) 14
Table 3 Significantly Higher Mean Scores for Importance among 2022 Subgroups 17
Table 4 Council Facilities or Services Importance Internal Benchmarks (mean scores) 19
Table 5 Quadrant Analysis 22
Table 6 Significantly Higher Reason for Inquiry among 2022 Subgroups 25
Table 7 Method of Contacting Council Top Three Preferences in 2022 34
Table 8 Data Weighting Factors Age/Sex 56
Table 9 Weighted Sample Profile 1 (Age) 56
Table 10 Weighted Sample Profile 2 (Gender) 56
Table 11 Weighted Sample Profile 3 (Length of time lived in Clarence Valley LGA) 56
Table 12 Weighted Sample Profile 4 (Town live nearest to) 57
Table 13 Weighted Sample Profile 5 (Ratepayer status) 57
Table 14 Weighted Sample Profile 6 (Urban or rural setting) 57
CUSTOMER SATISFACTION SURVEY 2022: REF 6456, SEPTEMBER 2022
1. EXECUTIVE SUMMARY
1. EXECUTIVE SUMMARY
Among the key findings:
Overall satisfaction
The proportion of residents dissatisfied rose significantly in this latest survey, from 25% to 39% (while the proportion satisfied fell from 33% to 29%). The overall satisfaction mean score of 2.7 was significantly below the 3.3 average across 25 regional NSW councils.
Facilities and services
Of the 23 facilities and services that residents surveyed were asked to rate for their level of satisfaction, 15 received a mean rating higher than the “neutral” score of 3.0 out of 5.
The top rated facilities and services for satisfaction were:
• Libraries
• Sewerage
• Support for sport and cultural events
• Lifeguards
• Waste and recycling
The lowest rated facilities and services for satisfaction were:
• Maintenance of unsealed roads
• Maintenance of sealed roads
• Development application processing

•
Economic development
In 2022, Clarence Valley Council was the best regional NSW council on record for Libraries, Sewerage, Online services, Support for sport and cultural events and Lifeguards, and the worst on record for Maintenance of sealed roads.
The three most important uses of Council resources had a 40% tie between Maintenance of unsealed roads and Flood plain and coastline management (N.B. Maintenance of sealed roads was not available to be chosen). The quadrant analysis showed Maintenance of sealed roads to be ranked the most important, and among the lowest in satisfaction.
Customer services
The number of residents surveyed who contacted Council in the past 12 months increased from 43% in 2020 to 57% in 2022. The proportion of those being resolved with just one contact has remained relatively static since 2020
Online or CVC website was the first preference in 2022 for six of the eight inquiry-types asked about, though less popular with residents surveyed aged 60+.
Council website
Use of Council’s website in 2022 was 53% in the past six months, up from 43% in 2020. Ratings by users for Usefulness of content dropped from a mean score in 2020 of 3.4 to 3.1 in 2022. Ratings for Ease of navigation dropped from 3.3 in 2020 to 3.1 in 2022.
Page 8 of 65 CUSTOMER SATISFACTION SURVEY 2022: REF 6456, SEPTEMBER 2022
This research study was commissioned by Clarence Valley Council to better understand key issues, community needs and priorities regarding the services and facilities provided by the Council.
2. SURVEY METHODOLOGY
2. SURVEY METHODOLOGY
2.1. DATA COLLECTION
Data was collected by Taverner Research Group via random CATI (telephone) interviewing during the period Tuesday 23 August to Thursday 1 September 2022, inclusive.
In total 402 adult residents completed the survey (226 via mobile phone and 176 via fixed line phone) A copy of the questionnaire is available in Appendix 1.
Based on the number of households within the Clarence Valley LGA, a random sample of 402 adult residents implies a margin for error of +/ 4.9% at the 95% confidence level. This means that if we conducted a similar poll 20 times, results should reflect the views and behaviour of the overall survey population in this case “all Clarence Valley LGA adult residents excluding council employees and councillors” - to within a +/- 4.9% margin in 19 of those 20 surveys.
2.2. DATA HANDLING
Data handling and analysis was carried out using the statistical database program “Q”. All responses are de identified to ensure the anonymity of respondents.
2.3. DATA WEIGHTING
The data was collected via random sampling. To ensure that the report is representative of the broader Clarence Valley Council community, the data has been weighted post collection to broadly represent the LGA in terms of population distribution by age and gender (based on 2021 Census data). Respondent profile and weighting information is included in Appendix 2.
2.4. DATA ANALYSIS
Statistical testing was conducted across results by age, gender, region, and urban versus rural Significantly higher/lower differences, at the 95% confidence level, are identified in tables in Appendix 3 (blue figures for significantly higher and red figures for significantly lower)
Page 9 of 65 CUSTOMER SATISFACTION SURVEY 2022: REF 6456, SEPTEMBER 2022
3.
FINDINGS
3.1. PERFORMANCE OF CLARENCE VALLEY COUNCIL Overall
Page 10 of 65 CUSTOMER SATISFACTION SURVEY 2022: REF 6456, SEPTEMBER 2022
SURVEY
3.
satisfaction
residents
satisfied
39%
Overall Satisfaction with Clarence
Q14. Please rate your satisfaction with Council’s overall performance on a scale of 1 5 where 1 means you are very dissatisfied and 5 means you are very satisfied? Base: All respondents 2018/2022 (n=1202) Overall satisfaction declined from mean scores above 3.0 achieved in previous surveys (see
below) to 2.7 out of 5 in 2022
2 Overall Satisfaction Internal Benchmarks Q14. Please rate your satisfaction with Council’s overall performance on a scale of 1 5 where 1 means you are very dissatisfied and 5 means you are very satisfied? Base: All respondents 2018/2022 (n=1202)
satisfaction
10% 16% 36% 30% 7% 11% 14% 42% 27% 6% 20% 19% 33% 25% 4% 0% 5% 10% 15% 20% 25% 30% 35% 40% 45% 1 Very dissatisfied 2 3 4 5 Very satisfied 2018 2020 2022 3.1 3 2.7 1 2 3 4 5 2018 2020 2022
As shown in Figure 1 below, significantly more
surveyed in 2022 were “Very dissatisfied” than in 2020 or 2018. Overall 29% were
against
dissatisfied (and the balance neutral). Figure 1
Valley Council
Figure 2
Figure
As shown in Table 1 below, Clarence Valley Council’s 2022 mean score for overall
was lower than the average mean in regional NSW.
SURVEY FINDINGS
3. SURVEY FINDINGS
Table 1 Overall Satisfaction with Clarence Valley Council Compared to External Benchmark
Clarence Valley 2022 mean Regional NSW average mean Regional NSW highest mean Regional NSW lowest mean
3.3 4.1 2.3 As shown in Figure 3 below, ‘Roads need improvement’, ‘Council red tape’, ‘Some services lacking’, ‘Wasteful’ and ‘Council does a poor job’ were significantly higher mentions in 2022 than in 2020. The perceived poor quality of local roads was a consistent theme throughout the survey.
3.2. COUNCIL FACILITIES
Page 11 of 65 CUSTOMER SATISFACTION SURVEY 2022: REF 6456, SEPTEMBER 2022
2.7
Figure 3 Reasons for Overall Satisfaction Q15 Could you briefly explain why you gave that score Base: All respondents 2022 (n=402)
Poor
Good
AND SERVICES Residents were asked to rate their satisfaction with 23 different facilities and services provided by Clarence Valley Council, using a scale of one to five where one means “Very poor” and five means “Excellent” 39% 20% 18% 17% 12% 11% 11% 6% 5% 5% 5% 4% 1% 8% 24% 18% 8% 4% 4% 9% 4% 8% 8% 4% 2% 3% 1% 6% 17% 22% 6% 15% 6% 8% 4% 7% 10% 6% 3% 6% 1% 4% 0% 5% 10% 15% 20% 25% 30% 35% 40% Roads and infrastructure need improvement Council is doing a good job Council too slow to act/red tape Some services lacking Wasteful Room for improvement Council does a poor job
communication Rates and charges too high Needs to promote employment/business Too City-centric Tries very hard
communication Other 2022 2020 2018
3. SURVEY FINDINGS
Satisfaction with facilities and services
In 2022, almost two-thirds (62%, see Figure 4 next page) gave a score of four or five out of five for Waste and recycling. Nearly three out of four (74%) gave a score of one or two out of five for Maintenance of sealed roads.
Only four of the 23 facilities and services saw an increase in their mean satisfaction scores in 2022 compared to 2020 (see Table 2, two pages down) Libraries, Sewerage, Waste and recycling and Protection of the natural environment and biodiversity. The largest decreases in mean satisfaction scores were for Maintenance of sealed roads ( 27%) and Development application processing ( 21%).
There was only one significant difference detected in the 2022 subgroup analysis of means satisfaction scores Area “Other” (not Grafton/South Grafton/Maclean/Yamba/Iluka) had a significantly lower mean for Maintenance of sealed roads (see Appendix 3).
Page 12 of 65 CUSTOMER SATISFACTION SURVEY 2022: REF 6456, SEPTEMBER 2022
Page 13 of 65 CUSTOMER SATISFACTION SURVEY 2022: REF 6456, SEPTEMBER 2022 3. SURVEY FINDINGS Figure 4 Council Facilities or Services Satisfaction Q11 Please rate your satisfaction with the following Council facilities or services Base: All respondents 2022 (n=402) 15% 1% 33% 16% 20% 24% 14% 23% 5% 28% 11% 15% 6% 1% 26% 6% 11% 10% 2% 44% 17% 29% 35% 63% 74% 50% 43% 36% 35% 35% 34% 32% 23% 24% 22% 30% 26% 16% 16% 13% 19% 15% 8% 9% 3% 1% 17% 18% 11% 29% 25% 22% 28% 12% 30% 22% 34% 32% 24% 24% 24% 26% 22% 15% 21% 13% 23% 16% 3% 5% 7% 6% 12% 20% 19% 23% 31% 33% 27% 31% 31% 40% 49% 35% 52% 54% 57% 62% 35% 51% 53% 61% 0% 10% 20% 30% 40% 50% 60% 70% 80% 90% 100% Maintenance of unsealed roads Maintenance of sealed roads Development application processing Economic development Maintenance of public toilets Tourism marketing Flood plain and coastline management Council pools Footpaths and cycleways Online services such as the website Enforcement of regulations by rangers Protection of the natural environment and biodiversity Maintenance of bridges Cleanliness of streets Cultural facilities Parks, reserves and playgrounds Sporting facilities Water supply Waste and recycling Lifeguards Support for sport and cultural events Sewerage Libraries N/A Bottom 2 Neutral Top 2
3. SURVEY FINDINGS
Table 2 Council Facilities or Services Satisfaction Internal Benchmarks (mean scores)
Facility or service
2018 2020 2022 2020 vs 2022
Libraries 4.2 4.3 4.5 +6%
Sewerage 4.0 3.8 4.0 +5%
Support for sport and cultural events 3.7 3.8 3.7 2%
Lifeguards 4.1 4.0 3.7 7%
Waste and recycling 3.8 3.6 3.7 +3%
Water supply 3.8 3.7 3.6 3%
Sporting facilities 3.8 3.8 3.6 5%
Parks, reserves and playgrounds 3.5 3.8 3.5 7%
Cultural facilities 3.5 3.6 3.4 6%
Cleanliness of streets 3.6 3.4 3.3 5%
Maintenance of bridges 3.4 3.5 3.1 10%
Protection of the natural environment and biodiversity 3.2 3.1 3.1 +1%
Enforcement of regulations by rangers 3.3 3.1 3.0 3%
Online services such as the website 3.5 3.4 3.0 11%
Footpaths and cycleways 3.1 3.1 3.0 5%
Council pools 3.4 3.4 2.8 17%
Flood plain and coastal management 3.2 3.2 2.8 14%
Tourism marketing 2.9 2.8 2.6 7%
Maintenance of public toilets 3.1 3.0 2.6 11%
Economic development 2.8 2.6 2.4 7%
Development application processing 2.7 2.4 1.9 21%
Maintenance of sealed roads 2.7 2.5 1.9 27%
Maintenance of unsealed roads 2.2 2.2 1.8 20%
Page 14 of 65 CUSTOMER SATISFACTION SURVEY 2022: REF 6456, SEPTEMBER 2022
3. SURVEY FINDINGS
Comparison of satisfaction to other regional NSW councils
Figure 5 below shows Clarence Valley Council compared to a cumulative benchmark of regional NSW councils for facilities or services considered Infrastructure. Clarence Valley Council in 2022 was slightly under the mean for Maintenance of unsealed roads, Maintenance of bridges, Council pools and Parks, reserves and playgrounds, and slightly above the middle for Footpaths and cycleways, Water supply and Sporting facilities. Clarence Valley Council did worse than any other regional NSW council for Maintenance of sealed roads, and better than any other regional NSW council for Libraries and Sewerage.
Figure 5 Infrastructure Comparisons to Regional NSW Benchmarks
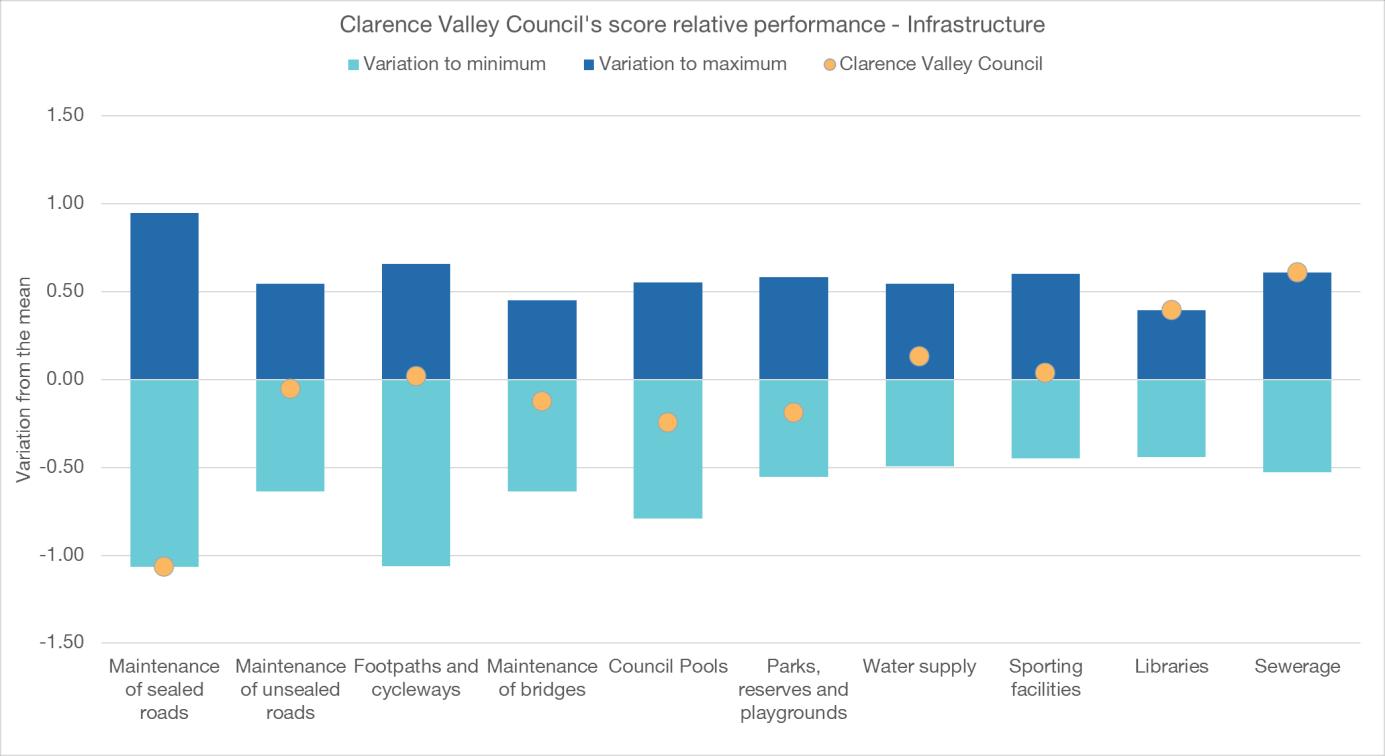
Page 15 of 65 CUSTOMER SATISFACTION SURVEY 2022: REF 6456, SEPTEMBER 2022
Q11. Please rate your satisfaction with the following Council facilities or services… Base: All Respondents 2022 (n=402)
3. SURVEY FINDINGS
Figure 6 below shows how Clarence Valley Council compared to a cumulative benchmark of regional NSW councils for facilities or services considered Services (second half of Services on next page). Clarence Valley Council in 2022 was ahead of the middle of regional NSW councils on all these services except Flood plain and coastline management and Cleanliness of streets.
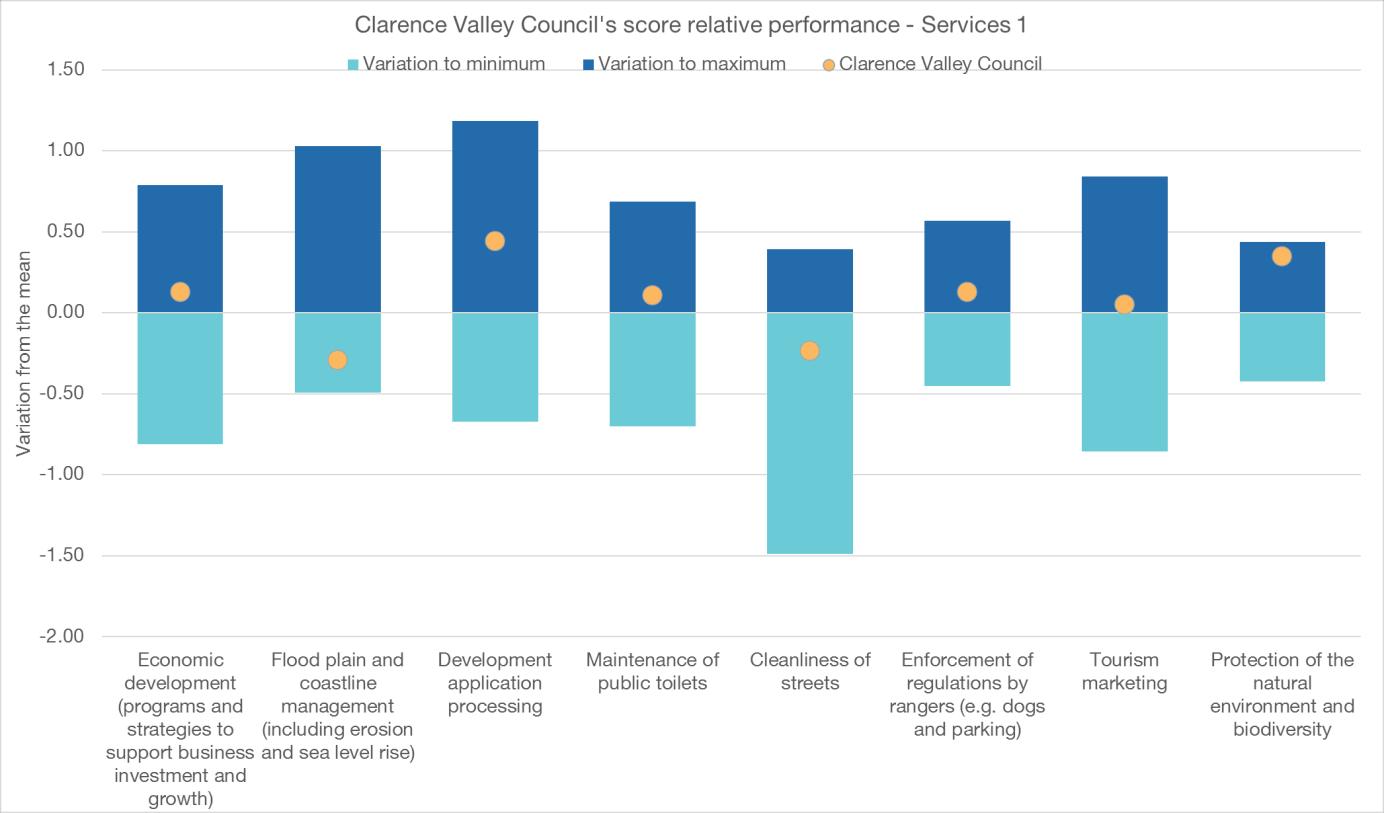
Figure 6 Services 1 Comparisons to Regional NSW Benchmarks
Figure 7 (next page) shows how Clarence Valley Council compared to a cumulative benchmark of regional NSW councils for facilities or services considered Services (this is the second half of Services). Clarence Valley Council in 2022 was the best regional NSW council observed for Online services such as website, Support for sport and cultural events and Lifeguards.
Page 16 of 65 CUSTOMER SATISFACTION SURVEY 2022: REF 6456, SEPTEMBER 2022
Q11. Please rate your satisfaction with the following Council facilities or services… Base: All Respondents 2022 (n=402)
Page 17 of 65 CUSTOMER SATISFACTION SURVEY 2022: REF 6456, SEPTEMBER 2022
SURVEY FINDINGS
Services
Regional
Q11 Please rate your satisfaction with the following Council facilities or services…
All Respondents 2022 (n=402) Importance of facilities and services Roads and sanitation services drew the highest mentions of “5 Critical”, and the more intangible and esoteric services drew the least mentions in 2022 (see Figure 8 next page). Table 3 Significantly Higher Mean Scores for Importance among 2022 Subgroups Facility or service Subgroup Libraries Aged 60+ Tourism marketing Aged 60+ Enforcement of regulations by rangers Aged 60+ Sporting facilities Aged 18 39 Protection of the natural environment and biodiversity Females Cultural facilities (Grafton Regional Art Gallery and support to museum) Females Lifeguards Maclean/Yamba Enforcement of regulations by rangers Iluka Footpaths and cycleways Urban Maintenance of unsealed roads Rural Water supply Urban, Mixed
3.
Figure 7
2 Comparisons to
NSW Benchmarks
Base:
Page 18 of 65 CUSTOMER SATISFACTION SURVEY 2022: REF 6456, SEPTEMBER 2022 3. SURVEY FINDINGS Figure 8 Council Facilities or Services Importance Q12+13. How important are these facilities or services Base: All Respondents 2022 (n=402) 13% 19% 13% 13% 16% 4% 12% 6% 14% 3% 1% 6% 17% 6% 3% 5% 2% 6% 4% 14% 1% 5% 1% 17% 15% 11% 13% 14% 12% 11% 6% 7% 10% 6% 6% 9% 9% 5% 7% 3% 5% 5% 4% 3% 1% 1% 27% 27% 33% 26% 25% 22% 21% 22% 23% 21% 19% 18% 14% 18% 15% 20% 14% 15% 12% 8% 9% 6% 4% 29% 22% 25% 29% 24% 37% 27% 35% 23% 32% 41% 35% 24% 30% 36% 27% 31% 21% 27% 21% 30% 17% 22% 14% 16% 18% 19% 22% 24% 30% 30% 33% 34% 34% 35% 36% 37% 40% 41% 50% 53% 53% 54% 57% 71% 73% 0% 10% 20% 30% 40% 50% 60% 70% 80% 90% 100% Cultural facilities Tourism marketing Enforcement of regulations by rangers Online services such as the website Libraries Support for sport and cultural events Council Pools Economic development Development application processing Footpaths and cycleways Cleanliness of streets Sporting facilities Lifeguards Maintenance of public toilets Parks, reserves and playgrounds Protection of the natural environment Maintenance of bridges Flood plain and coastline management Maintenance of unsealed roads Sewerage Waste and recycling Water supply Maintenance of sealed roads 1 Unimportant 2 Important 3 4 Very important 5 Critical
3. SURVEY FINDINGS
As shown in Table 4 below, the largest increase in importance mean score was Flood plain and coastline management (+14%) and the largest decrease in importance mean score was Tourism marketing ( 13%)
Table 4 Council Facilities or Services Importance Internal Benchmarks (mean scores)
Facility or service
2018 2020 2022 2020 vs 2022
Maintenance of sealed roads 4.3 4.4 4.7 +6% Water supply 4.2 4.3 4.5 +4% Waste and recycling 4.2 4.3 4.4 +2%
Maintenance of bridges 3.9 4.1 4.2 +3%
Maintenance of unsealed roads 3.5 3.9 4.2 +9%
Flood plain and coastline management 3.7 3.6 4.1 +14% Parks, reserves and playgrounds 3.7 4.0 4.0 +1% Cleanliness of streets 3.9 4.0 4.0 0% Sewerage 3.7 3.8 4.0 +5%
Protection of the natural environment and biodiversity 3.9 3.9 3.9 +1% Sporting facilities 3.5 3.8 3.9 +3% Footpaths and cycleways 3.6 3.9 3.8 2%
Maintenance of public toilets 3.6 3.9 3.8 1% Economic development 3.4 3.8 3.8 2% Support for sport and cultural events 3.6 3.8 3.6 3%
Development application processing 2.6 3.5 3.5 +1%
Council Pools 3.0 3.5 3.5 0% Lifeguards 3.5 3.7 3.5 6% Online services such as the website 2.6 3.2 3.3 +2% Libraries 3.3 3.4 3.2 5%
Enforcement of regulations by rangers 3.3 3.5 3.2 8%
Cultural facilities 3.0 3.2 3.2 3% Tourism marketing 3.3 3.5 3.0 13%
Page 19 of 65 CUSTOMER SATISFACTION SURVEY 2022: REF 6456, SEPTEMBER 2022
3. SURVEY FINDINGS
3.3. DRIVERS OF SATISFACTION
This section of the report aims to identify the key drivers of resident satisfaction via a deeper analysis of the relationship between satisfaction with, and importance of the cited services and facilities
Quadrant analysis simultaneously analyses the importance of a service in terms of driving overall satisfaction and the performance of services in terms of resident satisfaction. To do this, mean satisfaction scores are plotted against importance scores for each Council service.
To form quadrants, the average importance score and average satisfaction score across all services and facilities were calculated. Services and facilities with a mean satisfaction score less than the overall average were classified as ‘lower’ performing while those with a mean score above the average were classified as ‘higher’ performing. Similarly, services and facilities have ‘higher’ or ‘lower’ importance depending on their position above or below the overall average.
These scores do not suggest the service or facility is not important in the personal lives of residents. It strictly relates to relative importance in creating overall satisfaction with Council.
Figure 9 (over page) is Council’s performance/importance quadrant.
1. The upper right quadrant (high importance and high satisfaction) represents current service strengths or ‘Strengths to maintain’.
2. The upper left quadrant (high importance but low satisfaction) denotes services where satisfaction should be improved or ‘Priorities for Council’
3. The lower left quadrant (relatively lower importance and relatively lower satisfaction) represents lower priority service dimensions or ‘Second order issues’
4. The lower right quadrant (relatively lower importance and high satisfaction) represents Council’s ‘Opportunities’. These are higher performing services that are not yet having a strong impact on creating overall satisfaction with Council.
Page 20 of 65 CUSTOMER SATISFACTION SURVEY 2022: REF 6456, SEPTEMBER 2022
3. SURVEY FINDINGS
Figure 9 Quadrant Analysis
Page 21 of 65 CUSTOMER SATISFACTION SURVEY 2022: REF 6456, SEPTEMBER 2022
3. SURVEY FINDINGS
Water supply rated highly in importance (mean 4.5) and satisfaction (mean 3.7). In 2022, Sewerage had lower importance (mean 4.0) but higher satisfaction (mean 4.0) than Water supply.
Meanwhile, a major priority for Council lies in Maintenance of sealed roads, which had a high importance (mean 4.7) against a low satisfaction (mean 1 9). As shown in
Figure 9 (previous page), Maintenance of roads (both sealed and unsealed) stand our prominently as issues of concern
Overall, the diversity of priorities and opportunities for Council indicates how overall satisfaction can be improved by aligning Council efforts with improving facilities and services valued by respondents.
Table 5 Quadrant Analysis
PRIORITIESFORCOUNCIL
11 Maintenance of bridges 2 Sewerage
12 Protection of the natural environment and biodiversity 5 Waste and recycling
15 Footpaths and cycleways 6 Water supply
17 Flood plain and coastline management (including erosion and sea level rise) 7 Sporting facilities
STRENGTHSTO MAINTAIN
19 Maintenance of public toilets 8 Parks, reserves and playgrounds
20 Economic development (programs and strategies to support business investment and growth) 10 Cleanliness of streets
23 Maintenance of unsealed roads
22 Maintenance of sealed roads
SECONDORDERISSUES
13 Enforcement of regulations by rangers (e.g. dogs and parking) 1 Libraries
14 Online services such as the website 4 Lifeguards
OPPORTUNITIES
16 Council Pools 9 Cultural facilities (Grafton Regional Art Gallery and support to museum)
18 Tourism marketing 3 Support for sport and cultural events (e.g. Bridge to Bridge Ski Race, Jacaranda Festival, Maclea
21 Development application processing
Figure 10 (next page) has the results of the question asking respondents to choose the three highest priorities for Council, out of the facilities and services they had considered of Critical importance at Q12 (which excluded the four facilities and services at Q13 i.e. sealed roads, waste and recycling, water supply and sewerage as they were otherwise likely to dominate)
Maintenance of unsealed roads was the highest response in 2022, as it was in 2020, though with a large leap in responses (this may be due to the road damage incurred by the extraordinarily wet weather throughout southeast Australia in early 2022)
The largest increase in absolute terms as well as compared to its 2020 result was for Flood plain and coastline management (including erosion and sea level rise).
Wave on wave trends were shown in:
• Increases for Maintenance of unsealed roads; Flood plain and coastline management; Maintenance of bridges; Parks, reserves and playgrounds; Development application processing; Maintenance of public toilets; Cleanliness of streets; Cultural facilities (Grafton Regional Art Gallery and support to museum).
• Decreases for Protection of the natural environment; Lifeguards; Libraries; Tourism marketing; Enforcement of regulations by ranger.
Tourism marketing and Enforcement of regulations by rangers were one third of their 2020 responses in 2022.
Page 22 of 65 CUSTOMER SATISFACTION SURVEY 2022: REF 6456, SEPTEMBER 2022
Figure
Page 23 of 65 CUSTOMER SATISFACTION SURVEY 2022: REF 6456, SEPTEMBER 2022
3. SURVEY FINDINGS
10 Most Important Use of Council Resources Q16 Could you tell me which you see as being the 3 most important uses of Council resources?
services
Base: All respondents 2018/2022 (n=1202) 40% 40% 19% 18% 18% 16% 15% 12% 12% 12% 11% 11% 10% 6% 5% 4% 3% 3% 2% 28% 21% 20% 15% 15% 10% 13% 18% 11% 15% 10% 13% 3% 8% 8% 4% 9% 3% 6% 18% 18% 24% 13% 9% 6% 12% 12% 10% 7% 8% 17% 6% 9% 7% 3% 9% 1% 7% 0% 5% 10% 15% 20% 25% 30% 35% 40% 45% Maintenance of unsealed roads Flood plain and coastline management Protection of the natural environment Maintenance of bridges Parks, reserves and playgrounds Development application processing Sporting facilities Economic development Maintenance of public toilets Footpaths and cycleways Cleanliness of streets Lifeguards Council Pools Libraries Support for sport and cultural events Cultural facilities Tourism marketing Online
such as the website Enforcement of regulations by rangers 2022 2020 2018
3. SURVEY FINDINGS
3.4. CUSTOMER SERVICES
This section of the report covers Clarence Valley Council’s customer services. It includes recent contact with Council, the number of times contacted Council, issue contacted Council regarding, number of contacts about that issue, if not resolved then why, method of contact, satisfaction with the handling of their inquiry, and preferred method of contact for a range of issues
Recent contact with Council
Fifty seven percent of residents surveyed contacted Council in the past 12 months in 2022, up significantly (+14%) from 2020 (see Figure 11 below). This is likely to be a result of increased requests or assistance sought due to COVID and more recently storms and flooding.
Figure 11 Recent Contact with Council
Page 24 of 65 CUSTOMER SATISFACTION SURVEY 2022: REF 6456, SEPTEMBER 2022
Q17. Have you contacted Council within the past 12 months for a reason other than to make a payment? Base: All respondents 2018/2022 (n=1202) 41% 43% 57% 59% 57% 43% 0% 10% 20% 30% 40% 50% 60% 70% 80% 90% 100% 2018 2020 2022
Did not contact council Contacted council in the past 12 months
FINDINGS
Number
Page 25 of 65 CUSTOMER SATISFACTION SURVEY 2022: REF 6456, SEPTEMBER 2022
SURVEY
3.
residents
12 Frequency of Contact with Council in the past 12 months Q18 How many times have you contacted Council during this time? Base: Respondents who contacted Council in the past 12 months (n=550)
of times contacted Council The proportion of
surveyed who contacted Council Four or more times increased each wave (see Figure 12 below), from 34% in 2018, to 37% in 2020 and 39% in 2022 Figure
contacting
Table 6 Significantly Higher Reason for Inquiry among 2022 Subgroups Reason for inquiry Subgroup Drainage problem Aged 60+ Rates inquiry Other area Drainage problem Iluka Vegetation and trees – e.g. requesting Council to clear vegetation or mow grass Urban 22% 27% 23% 20% 18% 19% 23% 17% 18% 34% 37% 39% 1% 1% 1% 0% 10% 20% 30% 40% 50% 60% 70% 80% 90% 100% 2018 2020 2022 Once Twice Three times Four or more times Unsure
Reason for
Council As shown in Figure 13 next page, the reason for contacting Council in 2022 had a lot of similar proportions to 2018, so the changes from 2018 to 2020 were not maintained. In Table 6 below are the 2022 subgroups who had a significantly higher reason for inquiry (see Appendix 3)
Page 26 of 65 CUSTOMER SATISFACTION SURVEY 2022: REF 6456, SEPTEMBER 2022
SURVEY
3.
FINDINGS
Thinking about your most recent inquiry, what was that contact regarding?
Respondents who contacted Council in the past 12 months
18% 9% 7% 5% 8% 5% 9% 0% 2% 4% 2% 0% 21% 11% 9% 8% 7% 4% 4% 3% 2% 2% 2% 2% 20% 9% 7% 5% 8% 7% 12% 3% 2% 0% 4% 3% 0% 5% 10% 15% 20% 25% Development application (DA) Road and footpath improvement Vegetation and trees Water, sewage Ranger matters Rates inquiry Garbage/Waste management/Recycling/Tips Water billing Traffic management/parking Road or bridge closures Drainage problem Community services 2022 2020 2018
Figure 13 Issue Contacted Council Regarding Q19
Base:
(n=550)
3. SURVEY FINDINGS
Resolving the issue of most recent contact to Council
Figure 14 Number of Contacts Required to Resolve their Most Recent Inquiry
Figure 15 Why Issue has Not Yet Been Resolved
Page 27 of 65 CUSTOMER SATISFACTION SURVEY 2022: REF 6456, SEPTEMBER 2022
residents
The proportion of
surveyed whose issue was not yet resolved continued to increase in 2022, while the proportion addressed with one contact has continued to decline (see Figure 14 below) Males were significantly more likely to make four or more contacts (see Appendix 3).
Q20 And regarding that matter, how many times did you need to contact Council to have your issue resolved?
Respondents who contacted Council in the past 12 months (n=550) As shown in Figure 15 below, the proportion of residents surveyed with an issue that had not been resolved because Council didn’t respond has halved since 2018.
Base:
Q21 Can you briefly explain why you don’t believe the issue has been resolved? Base: Respondents whose contact with Council in past 12 months was not yet resolved (n=215) 34% 28% 29% 13% 14% 14% 8% 5% 6% 10% 11% 7% 32% 38% 41% 3% 4% 3% 0% 10% 20% 30% 40% 50% 60% 70% 80% 90% 100% 2018 2020 2022 One Two Three Four or more Not yet resolved Unsure 54% 28% 17% 0% 57% 17% 24% 2% 62% 14% 25% 0% 0% 10% 20% 30% 40% 50% 60% 70% Issue is still ongoing Council didn't respond Issue not resolved in respondent's favour Other 2018 2020 2022
3. SURVEY FINDINGS
Method of contact
As shown in Figure 16 below, first making contact with Council Face-to-face was less than half in 2022 of what it was in 2018 (This may be COVID-related) But the proportion being reported by phone continues to increase survey-to-survey.
Figure 16 Method of Contact
Satisfaction with Council handling of latest inquiry
As shown in Figure 17 below, the proportion of residents saying their issue was handled well (i.e. score of 4 or 5) dropped from 43 to 39%. This was particularly due to a significant fall in the number of those saying the issue has been handled “very well” down from 29 to 18%.
While the proportion saying their query has been handled poorly (score of 1 or 2) stayed unchanged at 43%, again there was a marked shift from “quite” to “very” poorly suggesting a polarisation of views on service performance.
There is also a strong (and logical) correlation between the number of times taken to resolve an issue, and overall satisfaction with Council. Of those inquiries requiring just one point of contact, 38% were satisfied with Council performance - against 25% dissatisfied. However for those requiring three or more contacts to resolve, this flipped entirely to 48% dissatisfied with overall Council performance vs. just 18% satisfied.
As with most other Councils, this highlights the critical relationship between customer service and overall satisfaction.
Page 28 of 65 CUSTOMER SATISFACTION SURVEY 2022: REF 6456, SEPTEMBER 2022
you
Q22 How did
first make contact with Council? Base: Respondents who contacted Council in the past 12 months (n=550)
13% 1% 17%
23% 0% 16%
29% 4% 8% 0% 10% 20% 30%
68%
61%
59%
40% 50% 60% 70% Telephone Face-to-face Letter or fax Email or website 2022 2020 2018
3. SURVEY FINDINGS
Figure 17 Satisfaction with How Well Council Handled your Inquiry
Q23 How would you rate your satisfaction with the way Council handled that latest inquiry?
Base: Respondents who contacted Council in the past 12 months (n=550)
Satisfaction with the way Council handled latest inquiry declined from mean scores at or above 3.0 achieved in previous surveys (see Figure 18 below) to 2.8 out of five in 2022.
Figure 18 Satisfaction with How Well Council Handled your Inquiry (mean scores)
Q23. How would you rate your satisfaction with the way Council handled that latest inquiry?
Base: Respondents who contacted Council in the past 12 months (n=550)
Method of contacting Council by inquiry type
The proportion of residents surveyed who preferred to make a payment Face to face was nearly half in 2022 of what it was in 2018 (see Figure 19 below). Significantly less preferred Phone in 2022 than in 2020. Those aged 60+ remained the most likely to want to interact face to face. Meanwhile online contact continues to grow in popularity for payments (from 54% in 2018 to 62% now.)
Page 29 of 65 CUSTOMER SATISFACTION SURVEY 2022: REF 6456, SEPTEMBER 2022
20% 6% 25% 16% 33% 27% 16% 15%
29%
9% 18% 21% 18% 0% 5% 10% 15% 20% 25% 30% 35%
14%
34%
40% 1 Very poorly 2 3 4 5 Very well 2018 2020 2022 3.4 3 2.8 1 2 3 4 5 2018 2020 2022
Figure 19 Method Prefer Making a Payment
Page 30 of 65 CUSTOMER SATISFACTION SURVEY 2022: REF 6456, SEPTEMBER 2022 3. SURVEY FINDINGS
Q26 In your dealings with Council, what method would you prefer to conduct or find out about the following Making a payment Base: All respondents 2018/2022 (n=1202) The proportion of residents surveyed who preferred to ‘request Council to do something’ Online or via the CVC website tripled from 2108 to 2022
39
Letter
Method
Requesting Council
Something Q26. In your dealings with Council, what method would you prefer to conduct or find out about the following Requesting Council to do something (e g fix a pothole) Base: All respondents 2018/2022 (n=1202) 32% 23% 17% 5% 13% 7% 54% 52% 62% 1% 5% 5% 2% 2% 3% 3% 3% 4% 3% 2% 2% 0% 10% 20% 30% 40% 50% 60% 70% 80% 90% 100% 2018 2020 2022 Face to face Phone Online or CVC website Email Letter Other Unsure 26% 22% 17% 55% 51% 48% 7% 12% 21% 8% 11% 10% 1% 2% 2% 4% 2% 3% 0% 10% 20% 30% 40% 50% 60% 70% 80% 90% 100% 2018 2020 2022 Face to face Phone Online or CVC website Email Other Unsure
(see Figure 20 below). Significantly more residents surveyed in 2022 aged 18
preferred Online or CVC website, and significantly more aged 60+ preferred a
Figure 20
Prefer
to Do
3. SURVEY FINDINGS
Significantly fewer residents surveyed in 2022 preferred finding out about emergency planning Faceto face compared to 2020, and significantly more preferred Social media in 2022 compared to 2020 (see Figure 21 below).
Figure 21 Method Prefer Finding Out about Emergency Planning and Recovery Activities
(n=1202) As shown in Figure 22 below, in 2022 39% of residents surveyed preferred providing feedback Online or CVC website, compared to 33% in both 2018 and 2020. Significantly more female residents surveyed in 2022 preferred Social media.
Page 31 of 65 CUSTOMER SATISFACTION SURVEY 2022: REF 6456, SEPTEMBER 2022
In your dealings with council, what method would you prefer to conduct or find out about the following Finding out about emergency planning and recovery activities
respondents
Q26
Base: All
2018/2022
Providing
Issues Q26. In your dealings with Council, what method would you prefer to conduct or find out about the following…Providing feedback on important or topical issues
All respondents
for information
56% 13% 7% 4% 25% 23% 27% 33% 34% 3% 8% 6% 4% 5% 6% 0% 4% 8% 4% 5% 2% 6% 6% 6% 5% 0% 10% 20% 30% 40% 50% 60% 70% 80% 90% 100% 2018 2020 2022 Face to face Phone Online or CVC website Email Letter Social media Other media Other Unsure 23% 12% 10% 17% 19% 15% 33% 33% 39% 12% 17% 17% 5% 5% 4% 1% 4% 3% 2% 3% 1% 2% 3% 8% 6% 7% 0% 10% 20% 30% 40% 50% 60% 70% 80% 90% 100% 2018 2020 2022 Face to face Phone Online or CVC website Email Letter Social media Other media Other Unsure
Figure 22 Method Prefer
Feedback on Important or Topical
Base:
2018/2022 (n=1202) The proportion of residents surveyed who preferred general requests
Face to face was slightly more than half of what it was in 2018, and the proportion who preferred by Email was close to triple in 2022 what it was in 2018 (see Figure 23 below).
Figure 23 Method Prefer General Requests for Information
Figure 24 Method Prefer Finding out about Council Policies or Activities
Page 32 of 65 CUSTOMER SATISFACTION SURVEY 2022: REF 6456, SEPTEMBER 2022
SURVEY
3.
FINDINGS
Q26 In your dealings with Council, what method would you prefer to conduct or find out about the following General requests for information Base: All respondents 2018/2022 (n=1202) As shown in Figure 24 below, significantly more residents surveyed preferred finding out about Council policies or activities Online or CVC website in 2022 than in 2020. Significantly less residents surveyed in 2022 aged 60+ preferred Online or CVC website.
Q26 In your dealings with Council, what method would you prefer to conduct or find out about the following Finding out about Council policies or activities Base: All respondents 2018/2022 (n=1202) 25% 19% 14% 37% 42% 34% 26% 26% 34% 5% 7% 13% 5% 5% 4% 3% 1% 2% 0% 10% 20% 30% 40% 50% 60% 70% 80% 90% 100% 2018 2020 2022 Face to face Phone Online or CVC website Email Other Unsure 17% 13% 8% 16% 13% 10% 44% 52% 61% 3% 5% 5% 3% 4% 4% 2% 2% 3% 5% 3% 10% 2% 3% 6% 4% 3% 0% 10% 20% 30% 40% 50% 60% 70% 80% 90% 100% 2018 2020 2022 Face to face Phone Online or CVC website Email Letter Social media Other media Other Unsure
3. SURVEY FINDINGS
The proportion of residents surveyed who preferred to find out about local activities and events via Social media (Facebook, etc) was more than double that in 2020. The proportion in 2022 who preferred Face to face was a third of that in 2018 and 2020 (see Figure 25 next page).
Significantly more residents surveyed in 2022 aged 18 39 preferred Social media. Significantly more aged 60+ preferred Face to face and Other media (TV, radio, newspapers). Significantly more males preferred a Letter. Significantly more residents surveyed in rural areas preferred Online or CVC website.
Figure 25 Method Prefer Finding out about Local Activities and Events
Base: All respondents 2018/2022 (n=1202)
Significantly less residents surveyed preferred Other media (TV, radio, newspapers) to find out about local flooding, road closures, etc in 2022 than in 2020 (see Figure 26 below). Significantly more residents surveyed in 2022 aged 18 39 preferred Social media. Significantly more aged 60+ preferred Other media (TV, radio, newspapers).
Page 33 of 65 CUSTOMER SATISFACTION SURVEY 2022: REF 6456, SEPTEMBER 2022
Q26. In your dealings with Council, what method would you prefer to conduct or find out about the following Finding out about local activities and events
6% 6% 2% 5% 8% 4% 38% 44% 42% 2% 6% 4% 1% 3% 6% 10% 11% 23% 13% 13% 36% 6% 3% 3% 3% 3% 0% 10% 20% 30% 40% 50% 60% 70% 80% 90% 100% 2018 2020 2022 Face to face Phone Online or CVC website Email Letter Social media Other media Other Unsure
Method Prefer Finding out about Local Flooding, Road Closures, etc
Page 34 of 65 CUSTOMER SATISFACTION SURVEY 2022: REF 6456, SEPTEMBER 2022 3. SURVEY FINDINGS
Q26 In your dealings with Council, what method would you prefer to conduct or find out about the following finding out about local flooding, road closures, etc Base: All respondents 2018/2022 (n=1202)
Online or CVC website
reasons for inquiries
Contacting Council Top
2022 Reason for inquiry 1ST 2ND 3RD Making a payment Online or CVC website Face to face Phone Requesting Council to do something (e.g. to fix a pothole) Phone Online or CVC website Face to face Finding out about emergency planning and recovery activities Online or CVC website Social media Face to face Providing feedback on important or topical issues Online or CVC website Email Phone General requests for information Phone Online or CVC website Face to face Finding out about Council policies or activities Online or CVC website Phone Face to face Finding out about local activities or events Online or CVC website Social media Other media (TV, radio, newspapers) 4% 5% 2% 8% 13% 12% 35% 41% 42% 1% 3% 3% 1% 1% 8% 10% 19% 19% 13% 41% 8% 5% 3% 1% 4% 0% 10% 20% 30% 40% 50% 60% 70% 80% 90% 100% 2018 2020 2022 Face to face Phone Online or CVC website Email Letter Social media Other media Other Unsure
Figure 26
As shown in Table 7 below,
was the highest preference for six of the eight
(and second highest for the other two). The higher-cost instantservice/individualised communications (Phone and Face-to-face) dominated the rest of the top three preferences. Table 7 Method of
Three Preferences in
3. SURVEY
FINDINGS
Finding out about local flooding, road closures, etc Online or CVC website
Social media Other media (TV, radio, newspapers)
Page 35 of 65 CUSTOMER SATISFACTION SURVEY 2022: REF 6456, SEPTEMBER 2022
3.5. COUNCIL WEBSITE
The proportion of residents surveyed who had accessed the Council website over the past six months was significantly higher in 2022 than in 2020 (see Figure 27 below) Those aged 60+ were the least likely to have accessed the website (see Appendix 3).
Page 36 of 65 CUSTOMER SATISFACTION SURVEY 2022: REF 6456, SEPTEMBER 2022
3. SURVEY FINDINGS
Council’s
Q24 Have you accessed the Council website over the past six months? Base: All respondents 2018/2022 (n=1202) 31% 43% 53% 69% 57% 47%
100%
not access website Accessed
website
six months
Figure 27 Access to
Website
0% 10% 20% 30% 40% 50% 60% 70% 80% 90%
2018 2020 2022 Did
Council
in
3. SURVEY FINDINGS
As shown in Figure 28 below, the proportion of residents surveyed who gave Council’s website Usefulness of content a score of “5 Excellent” in 2022 was less than half of the proportion in 2020. In 2022, female residents surveyed had a mean score significantly higher than males (see Appendix 3)
Figure 28 Rate Council’s Website for Usefulness of Content
Base:
of
Page 37 of 65 CUSTOMER SATISFACTION SURVEY 2022: REF 6456, SEPTEMBER 2022
How would you rate Council’s website on…Usefulness of content?
Q25.
Respondents who accessed Council website
the
in
past six months (n=473) Meanwhile the proportion of residents surveyed who gave Council’s website Ease of navigation a score of “1 Very poor” was more than twice in 2022 what it was in 2020 (see Figure 29 below).
How would you rate Council’s website on Ease
navigation?
Respondents
accessed
7% 13% 26% 36% 18% 7% 11% 33% 31% 18% 8% 18% 34% 32% 7% 0% 5% 10% 15% 20% 25% 30% 35% 40% 1 Very poor 2 3 4 5 Excellent 2018
7% 13% 31% 30% 19% 6% 20% 30% 27% 17% 15% 16% 25% 30% 13% 0% 5% 10% 15% 20% 25% 30% 35% 1 Very poor 2 3 4 5 Excellent 2018 2020 2022
Figure 29 Rate Council’s Website for Ease
Navigation Q25.
of
Base:
who
Council website in the past six months (n=473)
2020 2022
3.6. IMPROVEMENTS TO THE REGION
Respondents were asked, in an unprompted question, what they had seen elsewhere that they thought would work well in the Clarence Valley. Responses have been coded to identify key themes. As shown in Figure 30 below, the proportion of residents survey who said More use of the river in 2022 was less than third who said it in 2020, and Better roads was mentioned in 2022 by almost twice as many as in 2020. Full verbatims will be provided to Council in a separate MS Excel file.
Figure 30 Improvements to the Region
Page 38 of 65 CUSTOMER SATISFACTION SURVEY 2022: REF 6456, SEPTEMBER 2022
3. SURVEY FINDINGS
Have you seen anything when travelling to other places that you think would work well in the Clarence Valley, or add to the quality of life in your region?
Q27
improvement
Base: All respondents 2018/2022 (n=1202) 42% 10% 7% 2% 5% 5% 4% 8% 2% 5% 3% 2% 1% 0% 11% 46% 8% 7% 7% 5% 5% 5% 4% 2% 2% 1% 1% 0% 0% 9% 45% 12% 8% 9% 6% 3% 9% 5% 1% 4% 2% 1% 1% 1% 8% 0% 10% 20% 30% 40% 50% Nothing/no
necessary More tourism Better/cleaner open spaces More use of the river More cultural spaces/events Beautification of the shire Fix footpaths/cycleways Better roads Attract more businesses More youth facilities More retail shops Greater community involvement Better healthcare facilities Unsure Other 2022 2020 2018
4. APPENDIX 1: QUESTIONNAIRE
4. APPENDIX 1: QUESTIONNAIRE
Q1. Good afternoon/evening, my name is (name) and I am calling from Taverner Research on behalf of Clarence Valley Council. Council has commissioned us to conduct a short telephone survey to help them understand residents' priorities and satisfaction with a number of Council services.
The survey takes around 12 minutes, all information you provide would be confidential, and we are not trying to sell anything. Would you be willing to assist us by completing a brief survey for Council this afternoon/evening?
Offer a CALL BACK if inconvenient time. If still NO, ask if there is any other adult's home who may be willing to do the survey. If they wish to check validity of poll, ask them to call at Council on 6643 0200 in business hours
Yes 1 No 2 Q1
Answer If Attribute "No" from Q1 is SELECTED
Q2. Thank you for your time.
End
Q3. Before we commence I just have a few quick qualifying questions. Firstly can you confirm that you live in the Clarence Valley local government area?
If unsure ask which is their local Council.
Yes 1 No 2 Q3
Answer If Attribute "No" from Q3 is SELECTED
Page 39 of 65 CUSTOMER SATISFACTION SURVEY 2022: REF 6456, SEPTEMBER 2022
4. APPENDIX 1: QUESTIONNAIRE
Q4. I'm sorry but you have to be living in the Clarence Valley LGA to participate in this survey. Thank you for your time.
End Q5. Are you currently a Clarence Valley Councillor or employed by Clarence Valley Council?
Yes 1 No 2 Q5
Answer If Attribute "Yes" from Q5 is SELECTED
Q6. I'm sorry, but Councillors and Council staff do not qualify to participate in this survey. Thank you for your time.
End Q7. Would your age be between?
PROMPTED. Researchers note respondents must be 18 or over to participate. If under 18, ask if there an adult available to speak with. 18 39 1 40 59 2
Page 40 of 65 CUSTOMER SATISFACTION SURVEY 2022: REF 6456, SEPTEMBER 2022
Q7 60+ 3
Q30. Do you identify as…?
PROMPTED Male 1 Female 2 Non binary 3 Other 4 Q30
Q8. How long have you lived in the Clarence Valley LGA? DO NOT AID Less than 1 year 1 1 5 years 2 6 10 years 3 Q8 More than 10 years 4
Q9. Which residential suburb or town do you live in or nearest to? Grafton 1 South Grafton 8 Maclean 2 Yamba 3 Iluka 4 Coutts Crossing 5 Q9 Ulmarra 6
Page 41 of 65 CUSTOMER SATISFACTION SURVEY 2022: REF 6456, SEPTEMBER 2022
4. APPENDIX 1: QUESTIONNAIRE
Glenreagh 7 Copmanhurst 9 Wooli/Minnie Waters 10 Lawrence 11 NONE of these (terminate)
Q10. May I have your first name for the survey? Q10
Q11. To get us underway can you please rate your satisfaction with the following Council facilities or services, we'll use a scale of 1 5, where 1 means you think it is very poor, and 5 means you think it is excellent. We only want you to rate the services you use, so if not just say “not applicable”. Now [Q10], there are many services to rate can you please only answer with a number from 1 5, as we can't record any comments here. So first we have:
PROMPTED 1 to 5 answers only 1 Very poor 2 3 4 5 Very good 66 NA Flood plain and coastline management (including erosion and sea level rise) 1 2 3 4 5 6 Q11_1
Protection of the natural environment and biodiversity 1 2 3 4 5 6 Q11_2
Page 42 of 65 CUSTOMER SATISFACTION SURVEY 2022: REF 6456, SEPTEMBER 2022
4. APPENDIX 1: QUESTIONNAIRE
Cleanliness of streets 1 2 3 4 5 6 Q11_3 Maintenance of bridges 1 2 3 4 5 6 Q11_4 Maintenance of public toilets 1 2 3 4 5 6 Q11_5 Footpaths and cycleways 1 2 3 4 5 6 Q11_6 Libraries 1 2 3 4 5 6 Q11_7
4. APPENDIX 1: QUESTIONNAIRE
Parks, reserves and playgrounds
1 2 3 4 5 6 Q11_8
Tourism marketing 1 2 3 4 5 6 Q11_9
Lifeguards 1 2 3 4 5 6 Q11_1 0
Cultural facilities (Grafton Regional Art Gallery and support to museum) 1 2 3 4 5 6 Q11_1 1
Economic development (programs and strategies to support business investment and growth)
1 2 3 4 5 6 Q11_1 2
Enforcement of regulations by rangers (e.g. dogs and parking) 1 2 3 4 5 6 Q11_1 3
Council Pools 1 2 3 4 5 6 Q11_1 4
Development application processing 1 2 3 4 5 6 Q11_1 5
Sporting facilities 1 2 3 4 5 6 Q11_1 6
Online services such as the website 1 2 3 4 5 6 Q11_1 7
Water supply 1 2 3 4 5 6 Q11_1 8
Maintenance of sealed roads 1 2 3 4 5 6 Q11_1 9
Maintenance of unsealed roads 1 2 3 4 5 6 Q11_2 0
Waste and recycling 1 2 3 4 5 6 Q11_2 1
Sewerage
Support for sport and cultural events (e.g. Bridge to Bridge Ski Race, Jacaranda Festival, Maclean Highland Gathering)
1 2 3 4 5 6 Q11_2 2
1 2 3 4 5 6 Q11_2 3
Page 43 of 65 CUSTOMER SATISFACTION SURVEY 2022: REF 6456, SEPTEMBER 2022
4. APPENDIX 1: QUESTIONNAIRE
Q12. Thanks very much [Q10]. I'm now going to go back through the list, and ask you how IMPORTANT those facilities or services are to you or other members of your immediate household. Again we'll use a 5 point scale, where 1 is unimportant, 2 is important, 4 is very important and 5 is critical.
PROMPTED 1 to 5 answers only
1 Unimpo rtant
2 3 4 Very importa nt
5 Critical
Flood plain and coastline management (including erosion and sea level rise) 1 2 3 4 5 Q12_1
Protection of the natural environment and biodiversity 1 2 3 4 5 Q12_2
Cleanliness of streets 1 2 3 4 5 Q12_3
Maintenance of bridges 1 2 3 4 5 Q12_4
Maintenance of public toilets 1 2 3 4 5 Q12_5
Footpaths and cycleways 1 2 3 4 5 Q12_6
Libraries 1 2 3 4 5 Q12_7
Parks, reserves and playgrounds 1 2 3 4 5 Q12_8
Tourism marketing 1 2 3 4 5 Q12_9
Lifeguards 1 2 3 4 5 Q12_1 0
Cultural facilities (Grafton Regional Art Gallery and support to museum) 1 2 3 4 5 Q12_1 1
Economic development (programs and strategies to support business investment and growth)
1 2 3 4 5 Q12_1 2
Page 44 of 65 CUSTOMER SATISFACTION SURVEY 2022: REF 6456, SEPTEMBER 2022
Page 45 of 65 CUSTOMER SATISFACTION SURVEY 2022: REF 6456, SEPTEMBER 2022 4.
1
Water
Sewerage 1
Waste
1
APPENDIX 1: QUESTIONNAIRE Enforcement of regulations by rangers (e.g. dogs and parking) 1 2 3 4 5 Q12_1 3 Council Pools 1 2 3 4 5 Q12_1 4 Development application processing 1 2 3 4 5 Q12_1 5 Sporting facilities 1 2 3 4 5 Q12_1 6 Online services such as the website 1 2 3 4 5 Q12_1 7 Maintenance of unsealed roads 1 2 3 4 5 Q12_1 8 Support for sport and cultural events (e.g. Bridge to Bridge Ski Race, Jacaranda Festival, Maclean Highland Gathering) 1 2 3 4 5 Q12_1 9 Q13. CONTINUED from previous question. PROMPTED
Unimpo rtant 2 3 4 Very importa nt 5 Critical Maintenance of sealed roads 1 2 3 4 5 Q13_1
supply 1 2 3 4 5 Q13_2
2 3 4 5 Q13_3
and recycling
2 3 4 5 Q13_4 Q14. Thanks [Q10], now could you please rate your satisfaction with Council's overall performance on a scale of 1-5, where 1 means you are very dissatisfied, and 5 means you are very satisfied.
Page 46 of 65 CUSTOMER SATISFACTION SURVEY 2022: REF 6456, SEPTEMBER 2022 4.
rating
1 Very dissatisfied 1 2 2 3 3 Q14 4 4 5 Very satisfied 5
APPENDIX 1: QUESTIONNAIRE Confirm
if necessary
4. APPENDIX 1: QUESTIONNAIRE
Q15. Could you briefly explain why you gave that score?
PROBE for an answer
*Q16. You rated the following services as being of critical importance. Once I read the list back to you, could you tell me which you see as being the 3 most important uses of council resources?
Excludes sealed road maintenance, water supply, sewerage and waste/Recycling.If asked why these weren't read out, SAY........ We know from previous surveys that these are always critical and would like to see what else is important.
Answer If Attribute "Flood plain and coastline management (including erosion and sea level rise)" from Q12 is 5 Critical
Flood plain and coastline management (including erosion and sea level rise) 6 Q16_1
Answer If Attribute "Protection of the natural environment and biodiversity" from Q12 is 5 Critical
Protection of the natural environment and biodiversity 8 Q16_2
Answer If Attribute "Cleanliness of streets" from Q12 is 5 Critical
Cleanliness of streets 9 Q16_3
Answer If Attribute "Maintenance of bridges" from Q12 is 5 Critical
Maintenance of bridges 10 Q16_4
Answer If Attribute "Maintenance of public toilets" from Q12 is 5 Critical
Maintenance of public toilets 11
Answer If Attribute "Footpaths and cycleways" from Q12 is 5 Critical
Q16_5
Footpaths and cycleways 12 Q16_6
Answer If Attribute "Libraries" from Q12 is 5 Critical
Page 47 of 65 CUSTOMER SATISFACTION SURVEY 2022: REF 6456, SEPTEMBER 2022
Q15
4. APPENDIX 1: QUESTIONNAIRE
Libraries 13 Q16_7
Answer If Attribute "Parks, reserves and playgrounds" from Q12 is 5 Critical
Parks, reserves and playgrounds 14 Q16_8
Answer If Attribute "Tourism marketing" from Q12 is 5 Critical
Tourism marketing 15 Q16_9
Answer If Attribute "Lifeguards" from Q12 is 5 Critical
Lifeguards 16 Q16_1 0
Answer If Attribute "Cultural facilities (Grafton Regional Art Gallery and support to museum)" from Q12 is 5 Critical
Cultural facilities (Grafton Regional Art Gallery and support to museum) 17 Q16_1 1
Answer If Attribute "Economic development (programs and strategies to support business investment and growth)" from Q12 is 5 Critical
Economic development (programs and strategies to support business investment and growth)
18 Q16_1 2
Answer If Attribute "Enforcement of regulations by rangers (e.g. dogs and parking)" from Q12 is 5 Critical
Enforcement of regulations by rangers (e.g. dogs and parking) 20 Q16_1 3
Answer If Attribute "Council Pools" from Q12 is 5 Critical
Council Pools 21 Q16_1 4
Answer If Attribute "Development application processing" from Q12 is 5 Critical
Development application processing 22 Q16_1 5
Answer If Attribute "Sporting facilities" from Q12 is 5 Critical
Sporting facilities 23 Q16_1 6
Page 48 of 65 CUSTOMER SATISFACTION SURVEY 2022: REF 6456, SEPTEMBER 2022
4. APPENDIX 1: QUESTIONNAIRE
Answer If Attribute "Online services such as the website" from Q12 is 5 Critical
Online services such as the website 24 Q16_1 7
Answer If Attribute "Maintenance of unsealed roads" from Q12 is 5 Critical
Maintenance of unsealed roads 28 Q16_1 8
Answer If Attribute "Support for sport and cultural events (e.g. Bridge to Bridge Ski Race, Jacaranda Festival, Maclean Highland Gathering)" from Q12 is 5 Critical
Support for sport and cultural events (e.g. Bridge to Bridge Ski Race, Jacaranda Festival, Maclean Highland Gathering)
31 Q16_1 9
Q17. Now [Q10], have you contacted Council within the past 12 months, other than to make a payment?
UNPROMPTED
Yes 1 No 2 Go to Q24 Q17
Unsure 666 Go to Q24
Q18. Could you please tell me approximately how many times you have contacted Council during this time?
UNPROMPTED
Once 1 Twice 2 Three times 3 Q18
Page 49 of 65 CUSTOMER SATISFACTION SURVEY 2022: REF 6456, SEPTEMBER 2022
4. APPENDIX 1: QUESTIONNAIRE
Four or more times 4 Unsure 666
Q19. Thinking about your most recent inquiry, what was that contact regarding?
UNPROMPTED
Garbage/Waste management/Recycling/Tips 1
Development application (DA) 2
Building inspection inquiries 3
Rates inquiry 4
Water billing 5
Water, sewage 6 Septic tanks 7
Drainage problem 8
Community services (availability of facilities, grants for projects, community events, aged and disabled services etc.)
9
Ranger matters barking dogs, livestock, etc. 10 Q19
Vegetation and trees e.g. requesting council to clear vegetation or mow grass 11
Other parks and gardens 12 Road and footpath improvements 13
Library 14
Cultural facilities 15
Cultural or sporting events 16
Traffic management/parking 17
Page 50 of 65 CUSTOMER SATISFACTION SURVEY 2022: REF 6456, SEPTEMBER 2022
4. APPENDIX 1: QUESTIONNAIRE
Road or bridge closures 18
Can't recall 19
OTHER
Q20. And regarding that matter, how many times did you need to contact Council to have your issue resolved?
UNPROMPTED
One 1 Two 2 Three 3 Four or more 4 Q20
Not yet resolved 5
Unsure 666
Q21. Can you briefly explain why you don't believe the issue has been resolved?
Answer If Attribute "Not yet resolved" from Q20 is SELECTED
UNPROMPTED
Issue still ongoing 1
Council didn't respond 2 Q21
Issue not resolved in respondent's favour 3
OTHER
Page 51 of 65 CUSTOMER SATISFACTION SURVEY 2022: REF 6456, SEPTEMBER 2022
Q22. Thinking again about that experience, how did you first make contact with Council? UNPROMPTED Telephone 1 Face to face 2 Letter or fax 3 Q22 Email or website 4 Unsure 5
Q23. And how would you rate your satisfaction with the way Council handled that latest inquiry, on a scale of 1 5, where 1 means you think it was handled very poorly and 5 means you think it was handled very well?
Q24. [Q10], have you accessed the Council website over the past six months? UNPROMPTED Yes 1 No 2
Page 52 of 65 CUSTOMER SATISFACTION SURVEY 2022: REF 6456, SEPTEMBER 2022
4. APPENDIX 1: QUESTIONNAIRE
UNPROMPTED 1 Very poorly 1 2 2 3 3 Q23 4 4 5 Very well 5
Q24
Q25. Using a 1-5 scale where 1 is very poor and 5 is excellent, how would you rate Council's website on the following two factors?
Answer If Attribute "Yes" from Q24 is SELECTED
PROMPTED- read out options 1 Very poor 2 3 Neutral 4 5 Excelle nt
Ease of navigation 1 2 3 4 5 Q25_1 Usefulness of content 1 2 3 4 5 Q25_2
Q26. In your dealings with Council, what method would you prefer to conduct or find out about the following?
UNPROMPTED. Fac e to fac e
Pho ne Onli ne or CH CC web site
Em ail Lett er Soc ial me dia (fac ebo ok etc)
Oth er me dia (TV , radi o, new spa per s)
Oth er Uns ure Making a payment
Page 53 of 65 CUSTOMER SATISFACTION SURVEY 2022: REF 6456, SEPTEMBER 2022
4. APPENDIX 1: QUESTIONNAIRE
1 2 3 4 5 6 8 999 666 Q26_1 Requesting Council to do something (e.g. fix a pothole) 1 2 3 4 5 6 8 999 666 Q26_2 Finding out about emergency planning and recovery activities 1 2 3 4 5 6 8 999 666 Q26_3
4. APPENDIX 1: QUESTIONNAIRE
Providing feedback on important or topical issues 1 2 3 4 5 6 8 999 666 Q26_4
General requests for information 1 2 3 4 5 6 8 999 666 Q26_5
Finding out about Council policies or activities 1 2 3 4 5 6 8 999 666 Q26_6
Finding out about local activities and events 1 2 3 4 5 6 8 999 666 Q26_7
Finding out about local flooding, road closures etc. 1 2 3 4 5 6 8 999 666 Q26_8
Q27. And just a couple of other things before we finish. Firstly [Q10], have you seen anything when travelling to other places that you think would work well in the Clarence Valley, or add to the quality of life in your region?
Q31. And finally a couple of demographic questions. Firstly, are you a ratepayer?
UNPROMPTED. Means ratepayer within Clarence Valley LGA only.
Yes 1 No 2 Q31
Page 54 of 65 CUSTOMER SATISFACTION SURVEY 2022: REF 6456, SEPTEMBER 2022
Q27
4. APPENDIX 1: QUESTIONNAIRE
Q32. And do you live in an urban or rural setting?
Urban is town. Rural is on a property
Urban 1 Rural 2 Q32
Mixed/unsure 3
Q33. Just before we finish, Clarence Valley Council is looking to establish a randomly selected online research panel of local residents. This is being established to provide a quick and easy way for locals such as yourself to provide feedback to Council on issues of community importance from time to time. Is this something that might interest you?
May have already joined the online panel
Yes 1 No 555 Go to Q36 Q33
Q34. That's great. If I could just get your surname email address, Council will be in touch shortly with further details.
Read back email address carefully. If respondent is concerned, assure them that their contact details will be supplied only to Council, who will not share them with anyone else. And their survey responses will be separated from their contact details to protect the anonymity of their answers.
Surname 1
Email address 2
Q35. Thank and end survey.
Page 55 of 65 CUSTOMER SATISFACTION SURVEY 2022: REF 6456, SEPTEMBER 2022
5. APPENDIX 2:
PROFILE AND WEIGHTING
5. APPENDIX 2: RESPONDENT PROFILE AND WEIGHTING
Page 56 of 65 CUSTOMER SATISFACTION SURVEY 2022: REF 6456, SEPTEMBER 2022
RESPONDENT
Table 8 below reports the weighting factors for the sample. Using a high number of mobile phone numbers resulted in better access to young respondents and weighting factors that are within acceptable standards for community surveys.
Data
Age/Sex Population Ideal Actual Weights Age Male Female Male Female Male Female Male Female 18 to 39 8,670 8,382 80 77 22 23 3.63 3.35 40 to 59 5,757 6,039 53 56 38 59 1.39 0.94 60 plus 7,218 7,608 66 70 115 145 0.58 0.48 Total 21,645 22,029 199 203 175 227
Table 8
Weighting Factors
In order to obtain a clear view of the sample’s profile and to conduct comparison tests, demographic characteristics including age, gender, town live nearest to, time live in Clarence Valley LGA, ratepayer status and whether living in an urban or rural setting were collected. Tables 9 to 14 (below and on next page) detail the weighted sample profile for this survey.
Age % # 18 to 39 39% 157 40 to 59 27% 108 60 plus 34% 136
Weighted
Gender % # Male 50% 199 Female 50% 202
11 Weighted Sample Profile 3 (Length of time lived in
Length of time lived in Clarence Valley LGA % # 1 to 5 years 6% 25 6 to 10 years 14% 58 More than 10 years 79% 318
Table 9 Weighted Sample Profile 1 (Age)
Table 10
Sample Profile 2 (Gender)
Table
Clarence Valley LGA)
Page 57 of 65 CUSTOMER SATISFACTION SURVEY 2022: REF 6456, SEPTEMBER 2022 5. APPENDIX 2: RESPONDENT PROFILE AND WEIGHTING
12 Weighted Sample Profile 4 (Town live nearest to) Town live nearest to % # Grafton 38% 152 South Grafton 15% 61 Maclean 16% 62 Yamba 11% 44 Iluka 2% 9 Coutts Crossing 4% 15 Ulmarra 3% 13 Glenreagh 3% 14 Copmanhurst 3% 10 Wooli/Minnie Waters 1% 4 Lawrence 4% 17
13 Weighted Sample Profile 5 (Ratepayer status) Ratepayer % # Yes 87% 350 No 13% 52
14 Weighted Sample Profile 6 (Urban or rural setting) Urban or rural % # Urban 52% 209 Rural 50% 159 Mixed/Unsure 8% 33
Table
Table
Table
5. APPENDIX 2: RESPONDENT PROFILE AND WEIGHTING
Page 58 of 65 CUSTOMER SATISFACTION SURVEY 2022: REF 6456, SEPTEMBER 2022
6. APPENDIX 3: 2022 SUBGROUP TABLES
Q7Andwouldyouragebebetween?byBANNER
Total Age Gender Region*3 Liveinanurbanorruralsetting?
18-39 40-59 60+ Male Female
Column%
Grafton/South Grafton Maclean/Yam ba Other Iluka Urban Rural Mixed/Unsure 18-39 11% 100% 0% 0% 13% 10% 14% 8% 10% 0% 10% 13% 9% 40-59 24% 0% 100% 0% 22% 26% 27% 20% 22% 23% 21% 27% 34% 60+ 65% 0% 0% 100% 66% 64% 59% 71% 68% 77% 69% 60% 56% Prefernottosay(DON'TREADOUT) 0% 0% 0% 0% 0% 0% 0% 0% 0% 0% 0% 0% 0% Prefernottosay(DON'TOFFER) 0% 0% 0% 0% 0% 0% 0% 0% 0% 0% 0% 0% 0%
Q8HowlonghaveyoulivedintheClarenceValleyLGA?byBANNER
Column%
Total Age
Gender Region*3 Liveinanurbanorruralsetting?
18-39 40-59 60+ Male Female Grafton/South Grafton Maclean/Yam ba Other Iluka Urban Rural Mixed/Unsure
Lessthan1year 0% 0% 0% 0% 0% 0% 0% 0% 0% 0% 0% 0% 0% 1-5years 6% 11% 3% 3% 8% 4% 4% 6% 15% 0% 5% 9% 3% 6-10years 14% 15% 16% 12% 16% 13% 15% 13% 17% 5% 14% 12% 26% Morethan10years 79% 73% 81% 85% 76% 83% 81% 81% 68% 95% 81% 79% 71%
Q9Whichresidentialsuburbortowndoyouliveinornearestto?byBANNER
Total Age Gender Region*3 Liveinanurbanorruralsetting? Column%
18-39 40-59 60+ Male Female Grafton/South Grafton Maclean/Yam ba Other Iluka Urban Rural Mixed/Unsure
Grafton 38% 43% 40% 31% 42% 34% 67% 0% 0% 0% 46% 29% 28% SouthGrafton 15% 15% 17% 13% 11% 19% 27% 0% 0% 0% 20% 10% 12% Maclean 16% 13% 15% 19% 14% 17% 0% 59% 0% 0% 11% 20% 24% Yamba 11% 9% 9% 14% 12% 10% 0% 41% 0% 0% 17% 4% 3%
Iluka 2% 0% 3% 4% 3% 2% 0% 0% 0% 100% 2% 3% 3% CouttsCrossing 4% 0% 5% 7% 4% 4% 0% 0% 26% 0% 1% 8% 5%
Ulmarra 3% 7% 0% 2% 5% 2% 0% 0% 22% 0% 1% 8% 0%
Glenreagh 3% 7% 0% 2% 4% 3% 6% 0% 0% 0% 0% 6% 12%
Copmanhurst 2% 2% 2% 3% 2% 3% 0% 0% 17% 0% 0% 6% 0%
Wooli/MinnieWaters 1% 0% 2% 1% 1% 1% 0% 0% 6% 0% 1% 0% 4%
Lawrence 4% 4% 6% 3% 4% 5% 0% 0% 29% 0% 1% 7% 8%
Noneofthese 0% 0% 0% 0% 0% 0% 0% 0% 0% 0% 0% 0% 0%
Woombah 0% 0% 0% 0% 0% 0% 0% 0% 0% 0% 0% 0% 0%
Other(Specify) 0% 0% 0% 0% 0% 0% 0% 0% 0% 0% 0% 0% 0%
Page 59 of 65 CUSTOMER SATISFACTION SURVEY 2022: REF 6456, SEPTEMBER 2022
6. APPENDIX 3: 2022
SUBGROUP TABLES
TABLES
Total Age Gender Region*3 Liveinanurbanorruralsetting?
Protectionofthenaturalenvironmentandbiodiversity 3.12 3.27 3.11 2.97 3.10 3.14 3.30 2.94 2.87 2.64 3.22 3.07 2.70
Cleanlinessofstreets
publictoilets
marketing
Culturalfacilities(GraftonRegionalArtGalleryandsupporttomuseum) 3.35 3.24 3.25 3.54 3.36 3.34 3.32 3.52 3.19 2.79 3.28 3.34 3.92
Economicdevelopment(programsandstrategiestosupportbusinessinvestmentandgrowth) 2.43 2.37 2.29 2.62 2.31 2.55 2.42 2.46 2.44 2.18 2.48 2.41 2.10
Enforcementofregulationsbyrangers(e.g.dogsandparking) 3.02 3.00 3.21 2.89 2.84 3.21 3.04 2.99 3.08 2.44 2.95 3.17 2.66
CouncilPools 2.79 2.74 2.66 2.98 2.93 2.67 2.62 3.33 2.46 3.69 2.72 2.87 2.93
Developmentapplicationprocessing 1.89 1.77 1.80 2.12 1.84 1.97 1.90 1.92 1.79 1.86 2.01 1.84 1.52
Sportingfacilities 3.58 3.55 3.40 3.76 3.64 3.51 3.70 3.39 3.42 3.40 3.68 3.44 3.54
Onlineservicessuchasthewebsite 3.01 2.86 3.18 3.05 2.75 3.26 2.99 3.14 2.90 2.96 3.12 3.00 2.48 Watersupply 3.58 3.22 3.90 3.77 3.65 3.51 3.58 3.60 3.57 3.50 3.72 3.39 3.39
Maintenanceofsealedroads
1.85 1.67 1.98 1.94 1.88 1.81 1.97 1.84 1.41↓ 1.61 2.05 1.62 1.58
Maintenanceofunsealedroads 1.80 1.75 1.91 1.78 1.88 1.72 1.83 1.90 1.60 1.48 1.97 1.63 1.70
Wasteandrecycling 3.67 3.58 3.64 3.80 3.70 3.64 3.73 3.65 3.47 3.65 3.76 3.50 3.90 Sewerage 4.04 4.18 3.98 3.92 3.98 4.10 4.01 4.15 3.94 4.12 4.09 3.85 4.15 Supportforsportandculturalevents(e.g.BridgetoBridgeSkiRace,JacarandaFestival,Maclea 3.69 3.71 3.56 3.76 3.55 3.82 3.63 3.89 3.52 3.66 3.82 3.66 2.89
Q12+13MeansbyBANNER 18-39 40-59 60+ Male Female Grafton/South Grafton Maclean/Yam ba Other Iluka Urban Rural Mixed/Unsure
Total Age Gender Region*3 Liveinanurbanorruralsetting? Average
Floodplainandcoastlinemanagement(includingerosionandsealevelrise) 4.11 4.13 4.19 4.02 4.07 4.15 3.97 4.23 4.35 4.55 4.14 4.18 3.59 Protectionofthenaturalenvironmentandbiodiversity 3.91 3.74 4.13 3.94 3.61 4.22 3.89 3.99 3.86 4.07 4.02 3.78 3.86
Cleanlinessofstreets 4.01 4.01 4.01 4.02 3.89 4.14 4.04 4.10 3.75 4.25 4.17 3.82 3.99
Maintenanceofbridges 4.23 4.27 4.28 4.15 4.21 4.25 4.20 4.29 4.20 4.43 4.15 4.30 4.42
Maintenanceofpublictoilets 3.82 3.84 3.76 3.84 3.73 3.91 3.73 4.01 3.75 4.15 3.88 3.72 3.97
Footpathsandcycleways 3.83 3.69 3.88 3.95 3.70 3.96 3.85 3.92 3.59 3.85 4.04 3.50 4.08
Libraries 3.23 2.99 3.11 3.60 3.00 3.45 3.19 3.24 3.33 3.32 3.36 3.10 3.00
Parks,reservesandplaygrounds 4.03 4.26 3.91 3.87 3.88 4.18 4.09 4.03 3.87 3.74 4.14 3.89 4.07
Tourismmarketing
Lifeguards
Culturalfacilities(GraftonRegionalArtGalleryandsupporttomuseum)
Economicdevelopment(programsandstrategiestosupportbusinessinvestmentandgrowth)
Enforcementofregulationsbyrangers(e.g.dogsandparking)
CouncilPools
3.01 2.51 3.31 3.34 3.02 3.00 3.08 2.90 2.92 3.21 3.06 2.96 2.94
3.51 3.36 3.70 3.52 3.39 3.62 3.28 4.07 3.30 3.98 3.61 3.42 3.31
3.16 2.90 3.33 3.32 2.85 3.46 3.14 3.26 3.07 3.01 3.33 2.88 3.39
3.77 3.63 4.02 3.73 3.85 3.68 3.79 3.72 3.78 3.60 3.80 3.75 3.69
3.23 3.05 3.08 3.55 3.19 3.26 3.16 3.31 3.18 4.29 3.34 3.02 3.52
3.53 3.49 3.75 3.40 3.46 3.60 3.47 3.59 3.63 3.66 3.54 3.42 3.92
Developmentapplicationprocessing 3.54 3.53 3.63 3.48 3.60 3.48 3.50 3.64 3.46 3.76 3.33 3.81 3.57
Sportingfacilities 3.89 4.18 3.80 3.62 3.86 3.91 3.93 3.95 3.61 3.86 3.95 3.74 4.20
Onlineservicessuchasthewebsite 3.28 3.31 3.44 3.12 3.23 3.33 3.28 3.43 3.04 2.99 3.30 3.25 3.25
Maintenanceofunsealedroads 4.21 4.44 4.29 3.89 4.10 4.32 4.11 4.34 4.37 4.18 3.99 4.45 4.43
Supportforsportandculturalevents(e.g.BridgetoBridgeSkiRace,JacarandaFestival,Maclea 3.64 3.73 3.66 3.53 3.46 3.83 3.72 3.69 3.29 3.49 3.83 3.33 3.97
Maintenanceofsealedroads 4.66 4.67 4.75 4.59 4.66 4.67 4.66 4.69 4.63 4.68 4.62 4.69 4.77
Watersupply 4.47 4.44 4.61 4.41 4.41 4.54 4.41 4.61 4.41 4.78 4.73 4.05 4.89
Sewerage 3.97 3.71 4.22 4.07 3.99 3.95 4.11 4.12 3.13 4.23 4.61 3.10 4.10
Wasteandrecycling 4.39 4.44 4.33 4.38 4.36 4.43 4.37 4.55 4.20 4.50 4.48 4.26 4.47
Page 60 of 65 CUSTOMER SATISFACTION SURVEY 2022: REF 6456, SEPTEMBER 2022
6. APPENDIX 3: 2022 SUBGROUP
Q11Satisfactionrating2byBANNER 18-39 40-59 60+ Male Female Grafton/South Grafton Maclean/Yam ba Other Iluka Urban Rural Mixed/Unsure Floodplainandcoastlinemanagement(includingerosionandsealevelrise) 2.75 2.81 2.82 2.61 2.78 2.71 3.01 2.41 2.49 2.21 2.86 2.61 2.70
3.27 3.07 3.41 3.38 3.23 3.30 3.16 3.39 3.60 2.33 3.34 3.26 2.83
Maintenanceofbridges 3.13 3.08 3.16 3.17 3.20 3.06 3.16 3.22 2.86 2.96 3.28 2.97 2.95
Maintenanceof
2.64 2.37 2.77 2.94 2.79 2.49 2.63 2.60 2.70 3.05 2.67 2.73 1.95 Footpathsandcycleways 2.99 3.03 2.97 2.97 3.05 2.93 2.96 3.08 3.04 2.33 2.87 3.20 2.78 Libraries 4.53 4.65 4.48 4.45 4.53 4.53 4.58 4.32 4.63 4.35 4.55 4.52 4.41 Parks,reservesandplaygrounds 3.51 3.36 3.48 3.74 3.42 3.61 3.54 3.50 3.40 3.63 3.62 3.40 3.43
Tourism
2.64 2.69 2.63 2.60 2.45 2.82 2.49 2.99 2.63 2.61 2.58 2.65 3.09
Lifeguards 3.67 3.28 3.78 3.99 3.80 3.53 3.61 3.75 3.68 3.78 3.54 3.85 3.66
Average
Q14Pleaserateyoursatisfaction
with
Age Gender Region*3 Liveinanurbanorruralsetting?
Column% Total Q16YouratedthefollowingservicesasbeingofcriticalimportancebyBANNER 18-39 40-59 60+ Male Female
ofstreets 11% 14% 7%
18% 16% 18% 20% 21% 15% 17% 14% 30% 7% 15% 20% 25%
12% 15% 10% 10% 7% 17% 10% 14% 12%
16% 13%
Economicdevelopment(programsandstrategiesto 12% 12% 15% 11% 19%↑ 5%↓ 14% 10% 10% 22% 13% 10% 16%
Enforcementofregulationsbyrangers(e.g.dogs 2% 0% 2% 5% 2% 3% 2% 3% 2% 17%↑ 2% 2% 1%
CouncilPools 10% 9% 16% 5% 5% 14% 14% 2% 9% 7% 12% 6% 14%
2% 3% 3% 2% 3% 3% 1% 3% 0% 2% 3% 0% Maintenanceofunsealedroads 40% 46% 39%
33% 34% 45% 40% 37% 40% 60% 32% 49% 40% Supportforsportandculturalevents(e.g.Bridg 5% 7% 3% 5% 5% 4% 5% 7% 2% 0% 6% 4% 3% Age Gender Region*3 Liveinanurbanorruralsetting? Column% Total Q17HaveyoucontactedCouncilwithinthepast12months,OTHERthantomakeapayment?byBANNER 18-39 40-59 60+ Male Female Grafton/South Grafton Maclean/Yam ba Other Iluka Urban Rural Mixed/Unsure Yes 57% 62% 62% 48% 60% 55% 54% 62% 61% 72% 52% 65% 55% No 41% 33% 38% 51% 37% 44% 43% 38% 39% 28% 46% 33% 45% Unsure 2% 4% 0% 1% 2% 2% 3% 1% 0% 0% 2% 2% 0% 666 0% 0% 0% 0% 0% 0% 0% 0% 0% 0% 0% 0% 0% Age Gender Region*3 Liveinanurbanorruralsetting? Column% Total
Page 61 of 65 CUSTOMER SATISFACTION SURVEY 2022: REF 6456, SEPTEMBER 2022
6. APPENDIX 3: 2022 SUBGROUP TABLES Grafton/South Grafton Maclean/Yam ba Other Iluka Urban Rural Mixed/Unsure Floodplainandcoastlinemanagement(includinge 40% 38% 43% 40% 39% 40% 36% 40% 51% 55% 39% 45% 17% Protectionofthenaturalenvironmentandbiodive 19% 17% 14% 24% 12% 25% 15% 28%
Council'soverallperformancebyBANNER 18-39 40-59 60+ Male Female Grafton/South Grafton Maclean/Yam ba Other Iluka Urban Rural Mixed/Unsure 1Verydissatisfied 20% 27% 19% 11% 23% 16% 22% 17% 13% 22% 15% 22% 38% 2 19% 20% 15% 23% 19% 20% 19% 17% 25% 27% 20% 19% 19% 3 33% 27% 41% 34% 31% 35% 29% 36% 42% 18% 31% 37% 27% 4 25% 25% 23% 26% 26% 23% 25% 27% 18% 32% 29% 21% 10% 5Verysatisfied 4% 2% 2% 6% 1% 6% 5% 2% 3% 0% 5% 1% 6% Average 2.7 2.6 2.7 2.9 2.6 2.8 2.7 2.8 2.7 2.6 2.9 2.6 2.3
15% 29% 22% 18% 6%
11% 15% 7% 13% 11% 2%↓ 16%
Cleanliness
14% 8% 9%
Maintenanceofbridges
Maintenanceofpublictoilets
11% 12% 11% 10% Footpathsandcycleways 12% 7% 14%
11% 12% 10% 11% 28% 16% 6% 16% Libraries 6% 2% 6% 12% 3% 9% 7% 7% 2% 0% 7% 5% 7% Parks,reservesandplaygrounds 18% 27% 13% 11% 16% 20% 21% 14% 13% 0% 20% 16% 10% Tourismmarketing 3% 0% 4% 6% 5% 1% 4% 2% 2% 0% 3% 2% 12% Lifeguards 11% 11% 13% 8% 12% 9% 9% 16% 9% 5% 12% 9% 8% Culturalfacilities(GraftonRegionalArtGallery 4% 4% 5% 4% 4% 5% 4% 6% 2% 0% 5% 1% 16%
Developmentapplicationprocessing 16% 20% 15% 11% 20% 11% 12% 24% 15% 22% 9% 22% 25% Sportingfacilities 15% 15% 18% 12% 14% 16% 20% 12% 3% 0% 17% 9% 32% Onlineservicessuchasthewebsite 3%
6. APPENDIX 3: 2022 SUBGROUP TABLES
Q18CouldyoupleasetellmeapproximatelyhowmanytimesyouhavecontactedCouncilduringthistime?byBANNER
Age Gender Region*3 Liveinanurbanorruralsetting? Column% Total
18-39 40-59 60+ Male Female Grafton/South Grafton Maclean/Yam ba Other Iluka Urban Rural Mixed/Unsure Once 23% 25% 17% 25% 23% 23% 30% 14% 13% 17% 32% 15% 8% Twice 19% 21% 17% 19% 13% 26% 18% 21% 21% 24% 22% 18% 11% Threetimes 18% 21% 13% 18% 18% 18% 15% 19% 28% 0% 15% 24% 0% Fourormoretimes 39% 32% 49% 38% 45% 33% 35% 44% 38% 60% 30% 42% 74% Unsure 1% 0% 3% 0% 1% 1% 1% 1% 0% 0% 0% 1% 8% 666 0% 0% 0% 0% 0% 0% 0% 0% 0% 0% 0% 0% 0%
Q19Thinkingaboutyourmostrecentinquiry,whatwasthatcontactregarding?byBANNER
18-39 40-59 60+ Male Female Grafton/South Grafton Maclean/Yam ba Other Iluka Urban Rural Mixed/Unsure
Garbage/Wastemanagement/Recycling/Tips 9% 14% 4% 5% 6% 12% 11% 4% 13% 0% 9% 9% 0% Developmentapplication(DA) 18% 25% 15% 9% 24% 11% 18% 21% 9% 22% 8% 22% 47%
Buildinginspectioninquiries 0% 0% 0% 1% 0% 0% 0% 0% 2% 0% 1% 0% 0% Ratesinquiry 5% 7% 3% 4% 4% 6% 2% 2% 22% 0% 2% 9% 0% Waterbilling 0% 0% 0% 1% 0% 0% 0% 1% 0% 0% 0% 1% 0%
Water,sewage 5% 7% 3% 4% 7% 3% 8% 2% 1% 15% 8% 3% 0% Septictanks 0% 0% 0% 0% 0% 0% 0% 0% 0% 0% 0% 0% 0% Drainageproblem 2% 0% 0% 6% 2% 1% 1% 2% 0% 17% 2% 0% 6%
Communityservices(availabilityoffacilities,grantsforprojects,communityevents,agedanddisabledservicesetc.) 0% 0% 0% 1% 0% 0% 0% 1% 0% 0% 1% 0% 0%
Rangermatters-barkingdogs,livestock,etc. 8% 7% 7% 9% 7% 8% 6% 13% 3% 7% 11% 6% 0%
Vegetationandtrees-e.g.requestingcounciltoclearvegetationormowgrass 7% 7% 7% 8% 7% 7% 7% 10% 4% 0% 14% 1% 3%
Otherparksandgardens 0% 0% 0% 0% 0% 0% 0% 0% 0% 0% 0% 0% 0%
Roadandfootpathimprovements 9% 7% 12% 10% 6% 13% 12% 8% 3% 0% 8% 12% 3%
Library 0% 0% 0% 0% 0% 0% 0% 0% 0% 0% 0% 0% 0%
Culturalfacilities 0% 0% 0% 0% 0% 0% 0% 0% 0% 0% 0% 0% 0%
Culturalorsportingevents 0% 0% 0% 1% 0% 0% 0% 0% 0% 0% 0% 0% 0%
Trafficmanagement/parking 2% 0% 5% 1% 2% 2% 3% 0% 2% 0% 3% 1% 0%
Roadorbridgeclosures 4% 0% 8% 4% 3% 4% 1% 4% 9% 22% 1% 6% 8% Can'trecall 1% 0% 4% 0% 2% 0% 2% 0% 0% 0% 1% 0% 8% Other(specify)
Page 62 of 65 CUSTOMER SATISFACTION SURVEY 2022: REF 6456, SEPTEMBER 2022
Q20Andregardingthatmatter,howmanytimesdidyouneedtocontactCounciltohaveyourissueresolved?byBANNER 18-39 40-59 60+ Male Female Grafton/South Grafton Maclean/Yam ba Other Iluka Urban Rural Mixed/Unsure One 29% 36% 27% 22% 28% 31% 31% 26% 28% 31% 33% 30% 3% Two 14% 18% 13% 10% 12% 17% 17% 15% 6% 0% 16% 15% 5% Three 6% 4% 8% 7% 7% 5% 6% 7% 4% 0% 10% 1% 8% Fourormore 7% 11% 4% 4% 12% 1% 8% 4% 10% 0% 4% 8% 20% Notyetresolved 40% 32% 41% 53% 40% 41% 34% 45% 50% 69% 35% 44% 53% Unsure 3% 0% 6% 4% 2% 4% 4% 2% 3% 0% 2% 3% 11% 666 0% 0% 0% 0% 0% 0% 0% 0% 0% 0% 0% 0% 0% Age Gender Region*3 Liveinanurbanorruralsetting? Column% Total
31% 25% 33% 37% 28% 33% 29% 33% 33% 18% 32% 29% 27% Age Gender Region*3 Liveinanurbanorruralsetting? Column% Total
6. APPENDIX 3: 2022 SUBGROUP TABLES
Q21Canyoubrieflyexplainwhyyoudon'tbelievetheissuehasbeenresolved?byBANNER
Column%
Total Age
Gender Region*3 Liveinanurbanorruralsetting?
18-39 40-59 60+ Male Female Grafton/South Grafton Maclean/Yam ba Other Iluka Urban Rural Mixed/Unsure
Issuestillongoing 44% 44% 41% 47% 38% 51% 52% 48% 25% 24% 40% 47% 47% Councildidn'trespond 11% 0% 22% 12% 12% 9% 6% 7% 23% 31% 14% 8% 14% Issuenotresolvedinrespondent'sfavour 8% 12% 3% 9% 13% 4% 13% 5% 3% 13% 15% 5% 0% Other(specify) 36% 44% 34% 32% 37% 36% 30% 39% 48% 31% 31% 41% 39%
Q22Thinkingagainaboutthatexperience,howdidyoufirstmakecontactwithCouncil?byBANNER
Total Age
Gender Region*3 Liveinanurbanorruralsetting?
18-39 40-59 60+ Male Female Grafton/South Grafton Maclean/Yam ba Other Iluka Urban Rural Mixed/Unsure Telephone 68% 75% 73% 53% 69% 68% 68% 70% 66% 69% 63% 72% 78% Face-to-face 13% 10% 7% 25% 10% 18% 7% 20% 22% 31% 13% 16% 3% Letterorfax 1% 0% 0% 3% 1% 1% 1% 0% 2% 0% 2% 0% 0% Emailorwebsite 17% 15% 20% 18% 21% 13% 24% 10% 11% 0% 21% 12% 20% Unsure 0% 0% 0% 1% 0% 0% 0% 0% 0% 0% 0% 0% 0%
Column%
Q23AndhowwouldyourateyoursatisfactionwiththewayCouncilhandledthatlatestinquiry?byBANNER
18-39 40-59 60+ Male Female Grafton/South Grafton Maclean/Yam ba Other Iluka Urban Rural Mixed/Unsure
34% 32% 31% 40% 34% 34% 33% 33% 33% 70% 34% 34% 37%
9% 7% 12% 10% 8% 10% 10% 8% 10% 7% 12% 7% 5%
Page 63 of 65 CUSTOMER SATISFACTION SURVEY 2022: REF 6456, SEPTEMBER 2022
1Verypoorly
2
3 18% 18% 22% 13% 24% 11% 18% 22% 15% 0% 15% 18% 33% 4 21% 21% 21% 20% 17% 25% 19% 17% 36% 0% 20% 21% 22% 5Verywell 18% 21% 14% 17% 16% 20% 20% 20% 5% 22% 19% 20% 3% Average 2.8 2.9 2.7 2.6 2.7 2.9 2.8 2.8 2.7 2.0 2.8 2.9 2.5 Total Age Gender Region*3 Liveinanurbanorruralsetting? Column% Q24HaveyouaccessedtheCouncilwebsiteoverthepastsixmonths?byBANNER 18-39 40-59 60+ Male Female Grafton/South Grafton Maclean/Yam ba Other Iluka Urban Rural Mixed/Unsure Yes 53% 60% 60% 39% 49% 57% 50% 60% 54% 24% 50% 55% 61% No 47% 40% 40% 61% 51% 43% 50% 40% 46% 76% 50% 45% 39% Total Age Gender Region*3 Liveinanurbanorruralsetting? Column%
6. APPENDIX 3: 2022 SUBGROUP TABLES
Q25Usinga1-5scalewhere1isverypoorand5isexcellent,howwouldyourateCouncil'swebsiteonthefollowingtwofactors2byBANNER
Total Age
Gender Region*3 Liveinanurbanorruralsetting?
18-39 40-59 60+ Male Female Grafton/South Grafton Maclean/Yam ba Other Iluka Urban Rural Mixed/Unsure Easeofnavigation 3.1 3.1 3.1 3.0 2.7 3.4 3.2 3.2 2.6 2.3 3.2 3.0 2.9 Usefulnessofcontent 3.1 2.9 3.3 3.2 2.8 3.4 3.1 3.3 2.8 2.7 3.1 3.1 3.3
Average Q30GenderbyBANNER
Column%
Total Age Gender Region*3 Liveinanurbanorruralsetting?
18-39 40-59 60+ Male Female Grafton/South Grafton Maclean/Yam ba Other Iluka Urban Rural Mixed/Unsure
Male 44% 49% 39% 44% 100% 0% 41% 46% 48% 46% 43% 44% 44% Female 56% 51% 61% 56% 0% 100% 59% 54% 52% 54% 57% 56% 56% Non-binary 0% 0% 0% 0% 0% 0% 0% 0% 0% 0% 0% 0% 0% Other 0% 0% 0% 0% 0% 0% 0% 0% 0% 0% 0% 0% 0% Prefernottosay(DON'TREADOUT) 0% 0% 0% 0% 0% 0% 0% 0% 0% 0% 0% 0% 0%
Q31Andfinallyacoupleofdemographicquestions.Firstly,areyouaratepayerwithintheClarenceValleyLGA?byBANNER
Total Age Gender Region*3 Liveinanurbanorruralsetting?
18-39 40-59 60+ Male Female Grafton/South Grafton Maclean/Yam ba Other Iluka Urban Rural Mixed/Unsure Yes 87% 82% 87% 93% 86% 88% 85% 88% 93% 87% 82% 92% 93% No 13% 18% 13% 7% 14% 12% 15% 12% 7% 13% 18% 8% 7%
Column%
Q32Anddoyouliveinanurbanorruralsetting?byBANNER
Column%
inanurbanorruralsetting?
Q33ClarenceValleyCouncilislookingtoestablisharandomlyselectedONLINEresearchpaneloflocalresidents.Interested?byBANNER
inanurbanorruralsetting? Column%
Page 64 of 65 CUSTOMER SATISFACTION SURVEY 2022: REF 6456, SEPTEMBER 2022
18-39 40-59 60+ Male Female Grafton/South Grafton Maclean/Yam ba Other Iluka Urban Rural Mixed/Unsure Urban 52% 51% 46% 59% 49% 56% 61% 55% 14% 41% 100% 0% 0% Rural 40% 42% 42% 35% 41% 38% 31% 36% 77% 47% 0% 100% 0% Mixed/Unsure 8% 7% 12% 7% 10% 7% 8% 9% 10% 12% 0% 0% 100% Total Age Gender Region*3 Live
18-39 40-59 60+ Male Female Grafton/South Grafton Maclean/Yam ba Other Iluka Urban Rural Mixed/Unsure Yes 40% 35% 51% 36% 40% 40% 37% 42% 49% 50% 43% 36% 44% No 60% 65% 49% 64% 60% 60% 63% 58% 51% 50% 57% 64% 56% Alreadyonthepanel 0% 0% 0% 0% 0% 0% 0% 0% 0% 0% 0% 0% 0% Age Gender Region*3 Total Live

65 of 65 CUSTOMER SATISFACTION SURVEY 2022: REF SEPTEMBER 2022 6. APPENDIX 3: 2022 SUBGROUP TABLES Taverner Research Group T +61 2 9212 2900 | W www.taverner.com.au A Level 2, 88 Foveaux Street, Surry Hills, NSW 2010 | Taverner Research Group is wholly owned by Tobumo Pty Ltd | ABN 93 003 080 500
