

PROPOSED OPERATING & CAPITAL BUDGET
FY 2024-2025


www.suffolkva.us
Table of Contents: Page City Manager's Message 7 Executive Summary by Fund 11 Proposed Organizational Structure 39 General Operating Fund Revenue and Expense Summary 43 General Government 49 Judicial 71 Public Safety 87 Public Works 99 Health & Welfare 103 Education 111 Parks & Recreation and Cultural 113 Community Development 119 Other Public Services 129 Non Departmental 131 Capital Projects Fund 135 Special Revenue Funds Aviation Fund 141 Transit Fund 145 Downtown Business Overlay Taxing District 149 RT. 17 Taxing District 153 Road Maintenance Fund 157 Grants Fund 161 Law Library Fund 165 Debt Service Fund 171 Enterprise Funds Public Utilities Fund 177 Stormwater Management Fund 187 Refuse Services Fund 191 Internal Service Funds Fleet Management Fund 197 Information Technology Fund 201 Risk Management Fund 205 Component Unit School Fund 211 Appendix Appendix A - Personnel Summary By Fund 217 Appendix B - Statistical Information, Charts, & Graphs 221 Appendix C - Summary of Reserve Funds 229 Appendix D - Financial Policy Compliance Report 231 Appendix E - Proposed Budget Ordinances and Resolutions 255 City of Suffolk Proposed FY 24-25 Operating and Capital Budget 3
THIS PAGE INTENTIONALLY BLANK
4
City Manager’s Message
5
THIS PAGE INTENTIONALLY BLANK
6
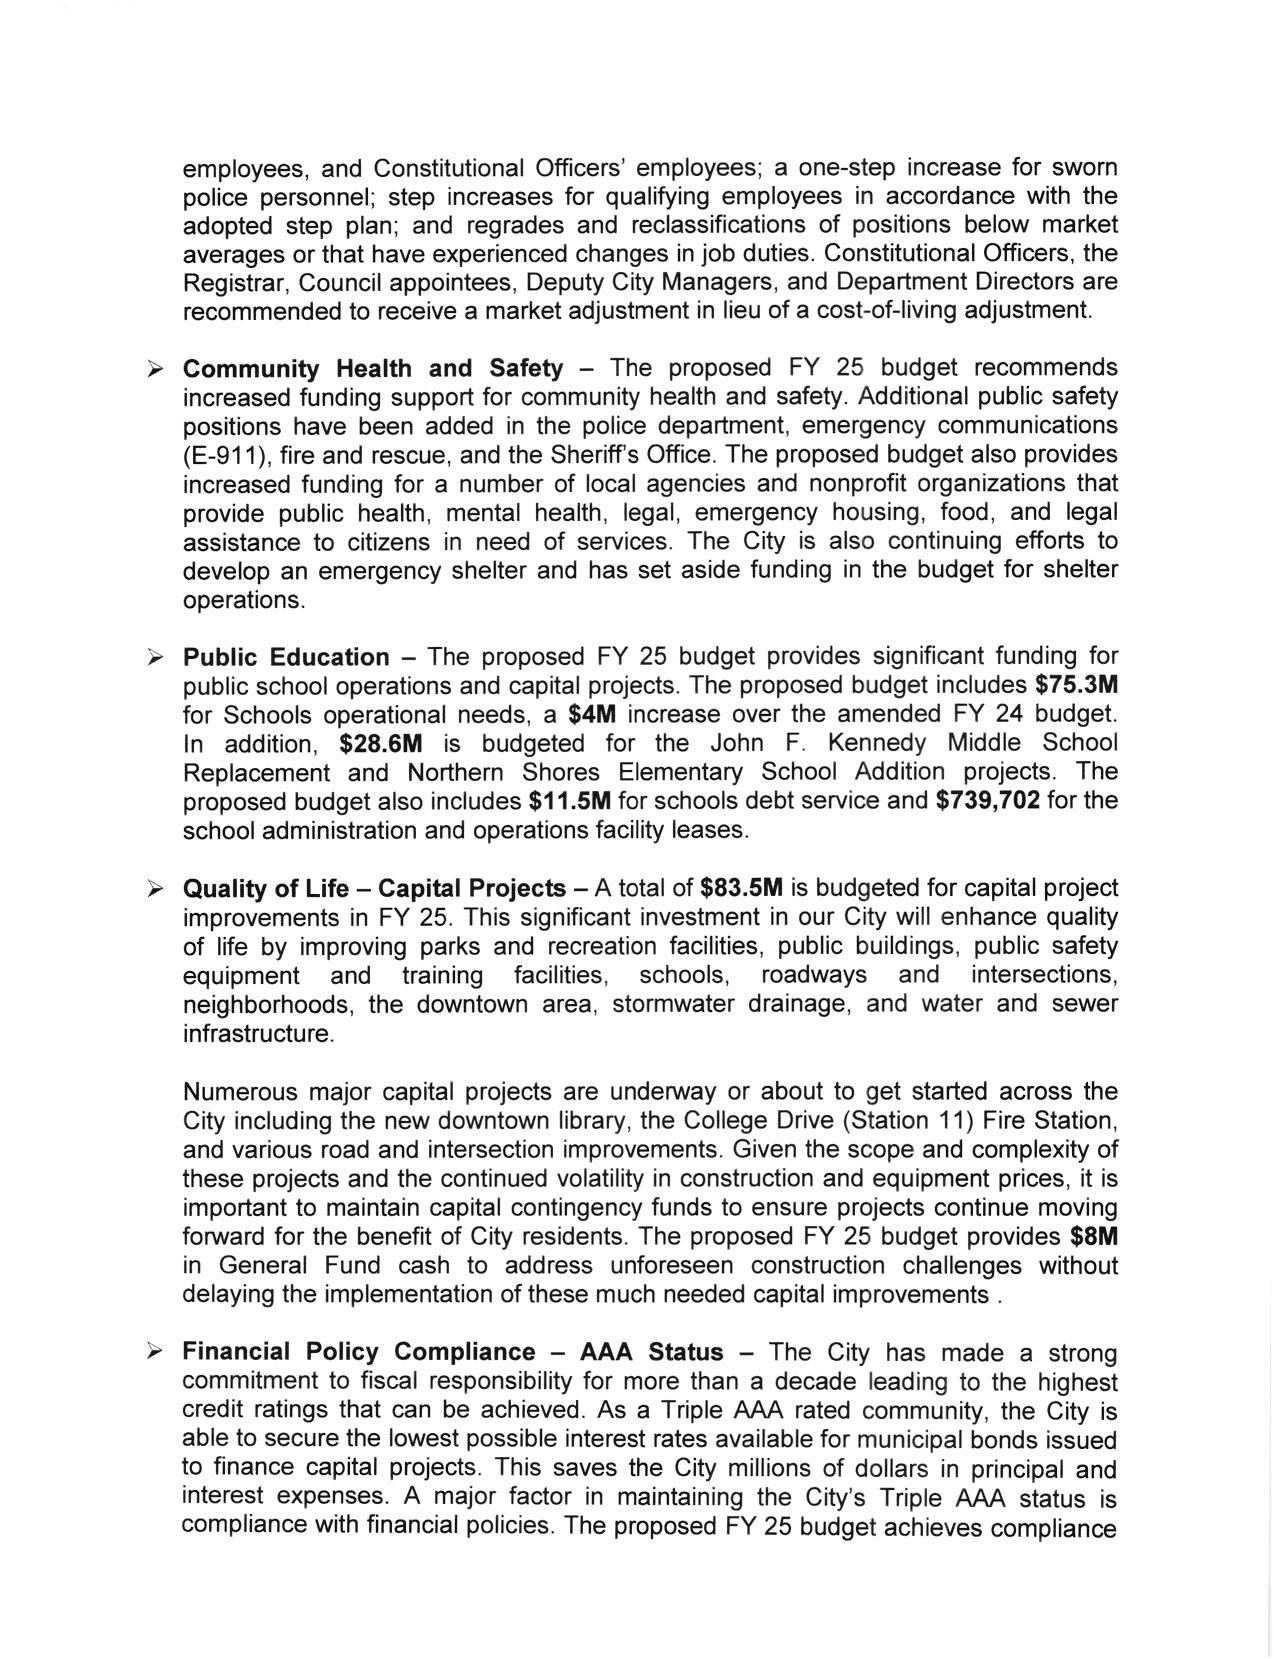
April 3,2024
The Honorable Council City of Suffolk, Virginia
Dear Council Members:
I am pleased to present the proposed Fiscal Year 2024-2025 (FY 25) Operating and Capital Budget for City Council's consideration. The proposed FY 25 budget addresses the operational and capital needs necessary to provide City services, facilities, and infrastructure to support the City's growing population. As you can see, the overall FY 25 budget is $882,100,325, which is a 0.4o/o increase over FY 24. The proposed General Fund budget is recommended at $324,213,302, a 9.87o increase over the current fiscal year.
The priorities of the proposed FY 25 budget include:
> Maintain Service Levels in Our Growing City with No Tax Rate lncrease - The proposed FY 25 budget maintains the citywide real estate tax rate at $1.09 per $100 of assessed value. The additional real estate tax rates levied in the Downtown Business Overlay Taxing District (DBOD) and the Route 17 Special Taxing District are proposed at the current rates of $.105 and $.24, respectively.
F Critical Personnel Needs and Employee Compensation - The City's population continues to grow and eclipsed 100,000 citizens over the last year. Additional personnel resources are needed to keep pace with workload and service demand in a number of departments. Forty-four (44) new full-time positions are recommended in the proposed FY 25 budget including Fire & Rescue (8), Police (7), Emergency Communications (6), Planning and Community Development (3), Social Services/Children's Services Act (CSA) (2), Animal Shelter (2), lnformation Technology (2), Sheriff (1), Commonwealth's Attorney (1), Commissioner of the Revenue (1), Communications (1), Parks and Recreation (1 ), Finance (1 ), Purchasing (1), Economic Development (1), Tourism (1), City Manager (1), Public Utilities (1), Mosquito Control (1), Fleet Management (1), Risk Management (1).
The ability to attract and retain a skilled workforce is paramount to the City's ability to provide high quality programs and services to the citizens of Suffolk. The City made progress with employee compensation in FY 22 with the implementation of the compensation study and step plan. However, other localities in the region have responded with their own pay adjustments placing certain positions in Suffolk below the region average. To remain competitive in the highly competitive job market, the proposed FY 25 budget recommends a four percent (4%) cost-of-living adjustment for full-time and regular part-time employees, grant employees, the Registrar's
P.O. BOX 1858, SUFFOLK, VIRGINIA 23439-1858 PHONE: (757) 514-4012
CITY OF SUFFOLK
7
CITY MANAGER
employees, and Constitutional Offlcers' employees; a one-step increase for sworn police personnel; step increases for qualifying employees in accordance with the adopted step plan; and regrades and reclassifications of positions below market averages or that have experienced changes in job duties. Constitutional Officers, the Registrar, Council appointees, Deputy City Managers, and Department Directors are recommended to receive a market adjustment in lieu of a cost-of-living adjustment.
Community Health and Safety - The proposed FY 25 budget recommends increased funding support for community health and safety. Additional public safety positions have been added in the police department, emergency communications (E-9'11), fire and rescue, and the Sheriffs Office. The proposed budget also provides increased funding for a number of local agencies and nonprofit organizations that provide public health, mental health, legal, emergency housing, food, and legal assistance to citizens in need of services. The City is also continuing efforts to develop an emergency shelter and has set aside funding in the budget for shelter operations.
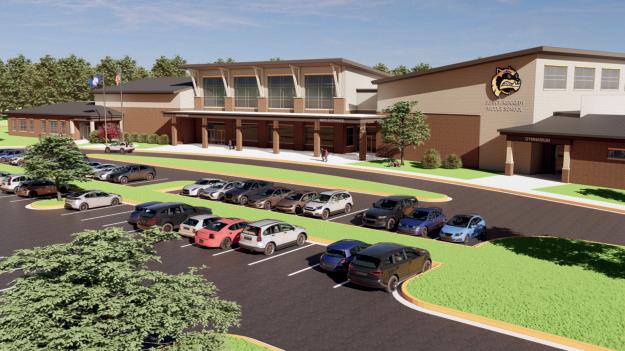
Public Education - The proposed FY 25 budget provides significant funding for public school operations and capital projects. The proposed budget includes t75.3M for Schools operational needs, a $4M increase over the amended FY 24 budget. ln addition, $28.6M is budgeted for the John F. Kennedy Middle School Replacement and Northern Shores Elementary School Addition projects. The proposed budget also includes $11.5M for schools debl service and $739,702 for the school administration and operations facility leases.
Quality of Life - Capital Projects - A total of $83.5M is budgeted for capital project improvements in FY 25. This significant investment in our City will enhance quality of life by improving parks and recreation facilities, public buildings, public safety equipment and training facilities, schools, roadways and intersections, neighborhoods, the downtown area, stormwater drainage, and water and sewer infrastructure.
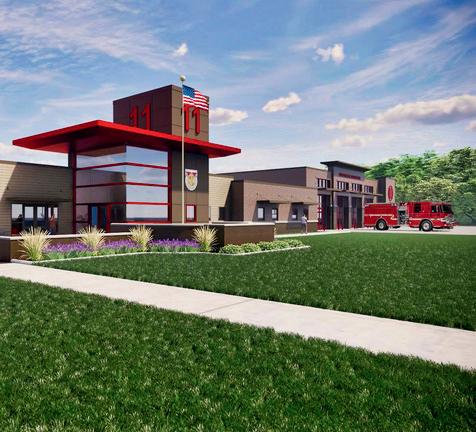
Numerous major capital projects are undeMay or about to get started across the City including the new downtown library, the College Drive (Station '11) Fire Station, and various road and intersection improvements. Given the scope and complexity of these projects and the continued volatility in construction and equipment prices, it is important to maintain capital contingency funds to ensure projects continue moving foMard for the benefit of City residents. The proposed FY 25 budget provides $8M in General Fund cash to address unforeseen construction challenges without delaying the implementation of these much needed capital improvements
Financial Policy Compliance - AAA Status - The City has made a strong commitment to fiscal responsibility for more than a decade leading to the highest credit ratings that can be achieved. As a Triple AArq rated community, the City is able to secure the lowest possible interest rates available for municipal bonds issued to finance capital proJects. This saves the City millions of dollars in principal and interest expenses. A major factor in maintaining the City's Triple AAA status is compliance with financial policies. The proposed FY 25 budget achieves compliance
8
with all of the City's adopted financial policies including capital pay-go, debt to assessed value and general government operations, and fund balance reserves.
Public Utilities
The Utility Fund is a self-sustaining enterprise fund, which provides safe drinking water and sewage collection services to customers in the City of Suffolk. The proposed FY 25 Utility Fund budget is recommended at $71.8M and includes $7.5M to cash fund utility capital projects in FY 25. Cash funding utility capital projects helps to mitigate future water and sewer rate impacts by preventing the need for additional debt issuance which must be paid back over 20 years through principal and interest payments.
The Utility Fund faces several challenges in FY 25 including:
. Equivalent Residential Units (ERUS) are projected to Iemain flat at 550 ERUS resulting in no anticipated revenue growth from water and sewer connections.
. Bulk water contracts with the City of Norfolk and Portsmouth are projected to increase $441,'195. The Norfolk water contract includes a consumer price index increase next year, and Portsmouth is increasing its water rate 6% which will result in additional costs for bulk water purchase. The City's surface water lakes and groundwater permit do not provide enough water supply to serve our growing community. The City has entered inlo bulk water contracts with Norfolk and Portsmoulh to ensure adequate water supply for citizens and businesses.
. The cost of chemicals and lab supplies continue to increase adding $180,000 in expenses to the Public Utilities budget.
Adjustments to the water and sewer rates are necessary in FY 25 including $.47 monthly per cubic feet to the water rate and S.12 monthly per cubic feet to the sewer rate. The fixed monthly meter service charge will remain at $15.25 per month. The average customer with a 5 ccf combined water and sewer bill will see an increase of approximately $2.95 per month ot 2.8o/o not including any rate adjustments adopted by the Hampton Roads Sanitation District (HRSD).
Stormwater Manaqement Fund
The Stormwater Management Fund is a self-sustaining enterprise fund that oversees the City's state and federal stormwater regulatory permits, development plan review and inspections, stormwater drainage improvements, and mosquito control operations. The Stormwater Management Fund is supported by stormwater fees paid by residential and commercial property owners, permit and inspection fees, and the sale of services to other City funds.
The Stormwater Management Fund budget is recommended at $9.6M in FY 25. The monthly stormwater fee is proposed to remain $7.50 per month, per ERU. Approximately $5.9M in stormwater projects are included in the FY 25 Capital budget to address drainage improvements needed throughout the City. Fy 25 marks the third
9
consecutive year of debt issuance in support of stormwater capital projects. Stormwater debt service will increase by $804,299 in FY 25.
Refuse Fund
The Refuse Fund budget is proposed at $13.6M in FY 25. The proposed budget maintains current service levels for trash collection, disposal, and recycling. The proposed FY 25 Refuse Fund budget utilizes approximately $2.4M from the Refuse Fund unrestricted fund balance to replace multiple aging refuse trucks and to stabilize the refuse rate at the current monthly fee of $25.25 per month.
Closino Remarks
The proposed FY 25 budget is fiscally sound and addresses the operating and capital needs of our growing City of '100,690 residents. The proposed budget maintains the real estate tax rate at its current level, addresses personnel resources to address workload and service demands, compensates our hard working and dedicated employees to ensure the City remains competitive in the region, increases funding for community health and safety and public education, enhances quality of life through capital improvement projects, and complies with all City financial policies to help maintain our AAA status.
The proposed FY 25 budget will be presented to City Council at the work session on April 3, 2024. As you review the proposed budget, please feel free to contact me should you have any questions. WrW-*
Albert S. Moor ll, P.E. City Manager10
Attachment
CITY OF SUFFOLK, VIRGINIA
PROPOSED FY 2024-25 OPERATING AND CAPITAL BUDGET
Annual Operating and Capital Budget by Fund Recommended Prior Yr. Budget Budget Budget Budget % Fund 2021-2022 2022-2023 2023-2024 2024-2025 Change General Fund $ 237,816,531 $ 263,051,194 $ 295,250,072 $ 324,213,302 10% Capital Projects Fund 60,673,312 62,142,627 131,757,223 83,514,269 -37% Debt Service Fund 29,396,660 30,973,668 33,444,121 34,228,465 2% Downtown Business Overlay District 174,091 190,421 230,842 228,443 -1% Route 17 Special Taxing District 1,989,160 4,526,712 2,565,433 2,675,020 4% Grants Fund 660,129 660,129 800,000 800,000 0% Transit System Fund 2,431,160 1,682,962 2,435,624 3,189,830 31% Aviation Facilities Fund 1,078,197 1,082,899 1,127,319 1,136,650 1% Law Library Fund 48,847 50,460 50,719 0 -100% Road Maintenance Fund 29,722,740 32,307,128 32,119,837 36,732,494 14% Fleet Management Fund 13,949,849 15,154,998 14,956,873 17,347,316 16% Information Technology Fund 13,844,606 14,233,559 15,493,577 17,118,453 10% Risk Management Fund 19,627,218 21,931,001 22,291,801 23,191,500 4% Utility Fund 71,384,777 67,106,896 81,156,518 71,778,919 -12% Stormwater Fund 7,937,478 8,331,177 8,553,039 9,633,418 13% Refuse Services Fund 10,681,077 11,168,391 11,516,086 13,582,526 18% School Fund 196,784,863 232,977,616 224,836,452 242,729,720 8% Total Funds Budget $ 698,200,695 $ 767,571,838 $ 878,585,536 $ 882,100,325 11
Local Tax Dollar for City Services
General Fund

Public Safety 30¢ Education and Related Debt 27¢ Capital Pay-Go 7¢ Debt Service 7¢ Health & Welfare 6¢ General Government 6¢ Parks, Recreation, & Cultural 5¢ Judicial 4¢ Community Development 4¢ Public Works 2¢ Non-Departmental 1¢ Local & Regional Organizations 1¢ $1.00 12
Notes:
FY 2023 Actual amounts are tied to the City's Annual Comprehensive Financial Report (ACFR) and do not reflect receipts carried forward from prior years or unexpended funds for future years.
Fund Balances are shown in total to include nonspendable, restricted, unrestricted, committed, assigned, and unassigned fund balance classifications.
FY 2023 FY 2024 FY 2025 Actual Budget Budget REVENUES General Property Taxes $ 178,451,277 $ 198,185,884 $ 214,079,668 Other Local Taxes 61,187,205 57,606,203 59,668,872 Permits, Fees, and Regulatory Licenses 3,198,075 2,566,000 2,680,800 Fines and Forfeitures 847,987 945,000 925,000 Use of Money and Property 13,461,299 2,803,627 4,963,940 Charges for Services 123,995,857 135,541,945 144,350,380 Miscellaneous Revenue 8,405,671 3,179,556 3,147,100 Recovered Costs 1,906,518 1,102,050 1,405,568 Revenue from the Commonwealth 199,669,672 221,990,535 220,890,731 Revenue from the Federal Government 53,083,598 37,967,974 39,318,613 Fund Transfers In 123,997,423 150,314,325 149,642,184 Long Term Debt Issuance 31,484,877 38,467,994 15,219,609 Fund Balance - 27,914,443 25,807,862 TOTAL REVENUES $ 799,689,456 $ 878,585,536 $ 882,100,325
Summary of Revenues and Expenditures for All Funds FY 2023 - FY 2025
- by Function General Government $ 45,934,878 $ 61,063,956 $ 61,314,736 Judicial 11,501,040 11,782,698 12,768,222 Public Safety 84,285,405 88,009,647 99,498,364 Public Works 96,394,609 124,174,623 102,635,435 Public Utilities 25,455,240 53,709,622 39,007,193 Health & Welfare 15,061,449 18,108,027 19,112,866 Education 226,611,636 248,036,452 271,304,720 Parks, Recreation & Cultural 16,537,735 20,811,067 21,470,782 Community Development 9,705,409 14,524,992 17,534,565 Other Public Services 7,477,320 6,708,655 6,134,356 Non-Departmental 26,798,569 20,769,334 19,596,010 Debt 41,956,020 59,385,105 60,931,586 Fund Transfers Out 124,685,090 151,501,359 150,791,490 TOTAL EXPENDITURES $ 732,404,401 $ 878,585,536 $ 882,100,325 Projected Fund Balances - June 30, 2024 $ 323,227,103 Projected Fund Balances - June 30, 2025 $ 302,773,347
EXPENDITURES
13
THIS PAGE INTENTIONALLY BLANK
14
City of Suffolk All Funds Revenues and Expenditures Summary FY 2024 - 2025 Proposed Operating and Capital Budget Downtown Business Overlay Taxing General Fund Aviation Fund District Fund REVENUES General Property Taxes $ 211,176,205 $ - $ 228,443 Other Local Taxes 59,668,872 -Permits, Fees, and Regulatory Licenses 1,459,800 -Fines and Forfeitures 675,000 -Use of Money and Property 4,384,132 261,804Charges for Services 4,470,269 -Miscellaneous Revenue 529,000 695,000Recovered Costs 1,140,568 -Revenue from Commonwealth 24,452,979 -Revenue from Federal Government 5,830,319 -Fund Transfers In 3,115,171 179,846Long Term Debt Issuance - -Fund Balance 7,310,987 -TOTAL REVENUES $ 324,213,302 $ 1,136,650 $ 228,443 EXPENDITURES - by Function General Government $ 17,496,137 $ - $Judicial 12,768,222 -Public Safety 95,313,364 -Public Works 7,652,961 - 228,443 Public Utilities - -Health & Welfare 19,112,866 -Education - -Parks, Recreation & Cultural 17,542,693 -Community Development 12,785,397 -Other Public Services 2,070,979 1,035,731Non-departmental 2,799,450 -Debt - -Fund Transfers Out 136,671,232 100,919TOTAL EXPENDITURES $ 324,213,302 $ 1,136,650 $ 228,443 Fund Balances - June 30, 2023 $ 98,014,544 $ 838,167 $ 308,933 Restatement of Beginning Fund Balance: - -Estimated Operating Surplus/(Deficit) FY24: 25,472,116 -Appropriations to/from Fund Balances during the year - FY24 (1,665,550) -Projected Fund Balances - June 30, 2024 121,821,110 838,167 308,933 Appropriations to/from Fund Balances during the year - FY25 (7,310,987) -Projected Fund Balances - June 30, 2025 $ 114,510,123 $ 838,167 $ 308,933 15
General Property Taxes
Other Local Taxes
Permits, Fees, and Regulatory Licenses
Fines and Forfeitures
Use of Money and Property
Charges for Services
Miscellaneous Revenue
Recovered Costs
Revenue from Commonwealth
Revenue from Federal Government
Fund Transfers In Long Term Debt Issuance
Fund Balance
City of Suffolk
Funds Revenues and Expenditures Summary FY 2024 - 2025 Proposed Operating and Capital Budget
All
REVENUES
TOTAL
- by Function General Government Judicial Public Safety Public Works Public Utilities Health & Welfare Education Parks, Recreation & Cultural Community Development Other Public Services Non-departmental Debt Fund Transfers Out TOTAL EXPENDITURES Fund Balances - June 30, 2023 Restatement of Beginning Fund Balance: Estimated Operating Surplus/(Deficit) FY24: Appropriations to/from Fund Balances during the year - FY24 Projected Fund Balances - June 30, 2024 Appropriations to/from Fund Balances during the year - FY25 Projected Fund Balances - June 30, 2025 Law Library Debt Service Transit Fund Fund Fund - $ - $- -- -- -- -62,000 -428,604 -- -664,032 -1,576,194 -9,000 - 34,228,465 - -450,000 -3,189,830 $ - $ 34,228,465 - $ - $- -- -- -- -- -- -- -- -2,973,146 -- -- - 34,228,465 216,684 -3,189,830 $ - $ 34,228,465 3,456,103 $ 232,414 $ 643,011 - -- -- (22,719)3,456,103 209,695 643,011 (450,000) -3,006,103 $ 209,695 $ 643,011 16
REVENUES EXPENDITURES
General Property Taxes
Other Local Taxes Permits, Fees, and Regulatory Licenses Fines and Forfeitures
Use of Money and Property Charges for Services Miscellaneous Revenue Recovered Costs Revenue from Commonwealth Revenue from Federal Government Fund Transfers In Long Term Debt Issuance Fund Balance
City of Suffolk All Funds Revenues and Expenditures Summary FY 2024 - 2025 Proposed Operating and Capital Budget
REVENUES
TOTAL REVENUES
- by Function General Government Judicial Public Safety Public Works Public Utilities Health & Welfare Education Parks, Recreation & Cultural Community Development Other Public Services Non-departmental Debt Fund Transfers Out TOTAL EXPENDITURES Fund Balances - June 30, 2023 Restatement of Beginning Fund Balance: Estimated Operating Surplus/(Deficit) FY24: Appropriations to/from Fund Balances during the year - FY24 Projected Fund Balances - June 30, 2024 Appropriations to/from Fund Balances during the year - FY25 Projected Fund Balances - June 30, 2025 Utility Fleet Mgmt. Information Technology Fund Fund Fund $ - $ - $ - $ - -- -- -298,004 -63,919,227 13,791,816 17,118,453 21,996 -- -- -- -- -- -7,539,692 3,555,500$ 71,778,919 $ 17,347,316 $ 17,118,453 $ $ - $ - $ 16,485,888 $ - -- -- 17,024,16431,467,501 -- -- -- -- -54,500 -6,491,095 86,491 179,683 25,378,410 - 148,500 8,387,413 236,661 304,382 $ 71,778,919 $ 17,347,316 $ 17,118,453 $ $ 37,489,823 $ 18,144,402 $ 999,391 - -172,863 - 43,725 (16,440,362) (3,175,000)21,222,324 14,969,402 1,043,116 (2,185,586) (3,555,500)$ 19,036,738 $ 11,413,902 $ 1,043,116 17
EXPENDITURES
REVENUES General Property Taxes
Other Local Taxes
Permits, Fees, and Regulatory Licenses
Fines and Forfeitures
Use of Money and Property
Charges for Services
Miscellaneous Revenue
Recovered Costs
Revenue from Commonwealth
Revenue from Federal Government
Fund Transfers In Long Term Debt Issuance Fund Balance
City of Suffolk
Funds Revenues and Expenditures Summary FY 2024 - 2025 Proposed Operating and Capital Budget
All
TOTAL REVENUES
- by Function General Government Judicial Public Safety Public Works Public Utilities Health & Welfare Education Parks, Recreation & Cultural Community Development Other Public Services Non-departmental Debt Fund Transfers Out TOTAL EXPENDITURES Fund Balances - June 30, 2023 Restatement of Beginning Fund Balance: Estimated Operating Surplus/(Deficit) FY24: Appropriations to/from Fund Balances during the year - FY24 Projected Fund Balances - June 30, 2024 Appropriations to/from Fund Balances during the year - FY25 Projected Fund Balances - June 30, 2025 Risk Mgmt. Route 17 Taxing Refuse Fund District Fund Fund - $ 2,675,020 $- -- - 801,000 - -- -22,341,501 - 10,036,526 - -- - 265,000 - -- -- -- -850,000 - 2,480,000 23,191,500 $ 2,675,020 $ 13,582,526 22,877,710 $ - $- -- -- - 13,313,526 - -- -- -- -- -- -214,772 1,604,434- -99,018 1,070,586 269,000 23,191,500 $ 2,675,020 $ 13,582,526 10,538,437 $ 4,592,640 $ 5,358,823 - -545,813 122,893 81,726 (850,000) (436,196) (634,722) 10,234,250 4,279,337 4,805,827 (850,000) - (2,480,000) 9,384,250 $ 4,279,337 $ 2,325,827 18
EXPENDITURES
General Property Taxes
Other Local Taxes Permits, Fees, and Regulatory Licenses
Fines and Forfeitures
Use of Money and Property Charges for Services Miscellaneous Revenue
Recovered Costs
Revenue from Commonwealth Revenue from Federal Government
Fund Transfers In Long Term Debt Issuance Fund Balance
City of Suffolk
Revenues and Expenditures Summary FY 2024 - 2025 Proposed Operating and Capital Budget
All Funds
REVENUES
TOTAL REVENUES
- by Function General Government Judicial Public Safety Public Works Public Utilities Health & Welfare Education Parks, Recreation & Cultural Community Development Other Public Services Non-departmental Debt Fund Transfers Out TOTAL EXPENDITURES Fund Balances - June 30, 2023 Restatement of Beginning Fund Balance: Estimated Operating Surplus/(Deficit) FY24: Appropriations to/from Fund Balances during the year - FY24 Projected Fund Balances - June 30, 2024 Appropriations to/from Fund Balances during the year - FY25 Projected Fund Balances - June 30, 2025 Road Maintenance Stormwater Capital Projects Fund Mgmt. Fund Fund $ - $ - $- -420,000 -250,000 -20,000 -1,265,605 8,507,64922,500 - 300,000 - -32,258,475 - 32,017,159 -- - 35,977,501 - - 15,219,609 2,495,914 1,125,769$ 36,732,494 $ 9,633,418 $ 83,514,269 $ - $ - $ 3,655,000 - -- - 4,185,000 34,730,629 6,803,392 22,882,320 - - 7,539,692 - -- - 28,575,000 - - 3,928,089 - - 4,749,168 - -- 220,085 8,000,000 - 1,176,2112,001,865 1,433,730$ 36,732,494 $ 9,633,418 $ 83,514,269 $ 15,897,066 11,809,706 $ 97,537,134 - -10,024,464 334,230(2,741,166) (163,836)23,180,364 11,980,100 97,537,134 (2,495,914) (1,125,769)$ 20,684,450 $ 10,854,331 $ 97,537,134 19
EXPENDITURES
REVENUES
General Property Taxes
Other Local Taxes
Permits, Fees, and Regulatory Licenses
Fines and Forfeitures
Use of Money and Property
Charges for Services
Miscellaneous Revenue
Recovered Costs
Revenue from Commonwealth
Revenue from Federal Government
Fund Transfers In Long Term Debt Issuance
Fund Balance
TOTAL REVENUES
EXPENDITURES - by Function General Government Judicial Public Safety Public Works Public Utilities Health & Welfare Education Parks, Recreation & Cultural Community Development
Other Public Services Non-departmental Debt Fund Transfers Out
Fund Balances - June 30, 2023 Restatement of Beginning Fund Balance:
FY24:
All Funds Revenues and Expenditures Summary
Proposed Operating and Capital Budget
City of Suffolk
FY 2024 - 2025
TOTAL EXPENDITURES
Estimated Operating Surplus/(Deficit)
Appropriations to/from
Balances
Projected
Balances
Appropriations to/from Fund Balances during the year - FY25 Projected Fund Balances - June 30, 2025 Grants Schools Fund Fund Grand Total $ - $ - $ 214,079,668 - - 59,668,872 - - 2,680,800 - - 925,000 - - 4,963,940 - 2,837,334 144,350,380 - 1,150,000 3,147,100 - - 1,405,568 - 131,498,086 220,890,731 - 31,912,100 39,318,613 800,000 75,332,201 149,642,184 - - 15,219,609 - - 25,807,862 $ 800,000 $ 242,729,720 $ 882,100,325 $ 800,000 $ - $ 61,314,736 - - 12,768,222 - - 99,498,364 - - 102,635,435 - - 39,007,193 - - 19,112,866 - 242,729,720 271,304,720 - - 21,470,782 - - 17,534,565 - - 6,134,356 - - 19,596,010 - - 60,931,586 - - 150,791,490 $ 800,000 $ 242,729,720 $ 882,100,325 $ 3,705,605 $ 11,317,028 $ 320,883,227 - -- - 36,797,830 - (8,324,403) (34,453,954) 3,705,605 2,992,625 323,227,103 - - (20,453,756) $ 3,705,605 $ 2,992,625 $ 302,773,347 20
Fund
during the year - FY24
Fund
- June 30, 2024
City of Suffolk
Proposed FY 2024-25 Operating and Capital Budget
General Fund - Executive Summary
BUDGET PRIORITIES:
•
•
•
•
• Assistant Director of Downtown Development - City Manager's Office
• Assistant Fire Chief (2) - Fire & Rescue
• Benefits Program Manager - Social Services
• Buyer - Purchasing
• Call Taker (2) - Police - Emergency Communications
• Communications Operator (4) - Police - Emergency Communications
• CSA Management Specialist - Social Services
• DEI-B Analyst and Training Consultant - Human Resources
• Deputy Sheriff II - Sheriff
• Family Services Program Manager - Social Services
• Fire Captain - Fire & Rescue
• Fire Recruit (5) - Fire & Rescue
• Grants Manager - Finance
• Police Captain - Police
• Police Recruit (5)/Canine Officer (1) - Police
• Recreation Specialist - Parks and Recreation
• Senior Deputy Commissioner of the Revenue - Commissioner of the Revenue
• Service Support Manager - Planning and Community Development
• Visitor Center Advisor (converted from part-time) - Tourism
• Webmaster - Communications
• Zoning Official - Planning and Community Development
• Zoning Technician - Planning and Community Development FINANCIAL POLICY COMPLIANCE STATUS:
Current R.E. Tax Rate: 1.09 $ % Proposed R.E. Tax Rate: 1.09 $ General Fund Change Proposed Tax Rate Adjustment: - $ Reassessment Tax Rate Impact to Citizens: 0.02 $ Proposed Revenues: 324,213,302 $ 9.8% Proposed Expenditures: 324,213,302 $ 9.8% Unfunded Gap: 0 $
1 Maintain Service Levels in Our Growing City with No Tax Rate Increase 2 Critical Personnel Needs and Employee Compensation 3 Community Health and Safety 4 Public Education 5 Quality of Life - Capital Improvements 6 Financial Policy Compliance - AAA Status OTHER IMPORTANT BUDGET ITEMS TO NOTE: $4M new + $2M FY 24 mid-year funding for Suffolk Public Schools.
Net 38 new full-time positions to address increasing service demand and workload.
Administrative Assistant - Commonwealth's Attorney's Office
Agricultural Specialist
Economic
-
Development
Animal
Caretaker - Animal Shelter
Animal Control Officer - Animal Shelter
Unassigned Fund Balance as % of Governmental Funds - 20% minimum 20.0% Projected Capital Cash "Pay-Go" - 3% min. of General Fund Expenses 11.5% Projected
Debt as % of Assessed Value - 4% maximum 1.4% Projected
Debt as % of General Govt. Expense - 10% maximum 6.2% Projected
21
SUMMARY OF BUDGETED REVENUE CHANGES FROM PRIOR YEAR: 28,963,230 $ 10% Revenue Gains / (Losses) : - Local Tax 17,849,265 $ - Miscellaneous/Fees 2,617,750 - State Revenue & Aid 490,357 - Federal Revenue & Aid 484,200 - Other 7,521,658 SUMMARY OF BUDGETED EXPENDITURE CHANGES FROM PRIOR YEAR: 28,963,230 $ 10% Expenditure Increases / (Decreases): - Personnel & Benefits 10,764,682 $ - Purchased Services 36,865 - Professional Services 741,796 - Repairs and Maintenance 107,293 - Maintenance Service Contracts 168,000 - Printing and Binding 30,540 - Advertising 158,300 - Juvenile Detention Services 480,275 - Information Technology 1,514,353 - Fleet 1,498,260 - Risk 798,113 - Utilities 91,000 - Postage 14,435 - Telecommunications 9,222 - Lease of Equipment 158,297 - Lease of Buildings (62,870) - Travel & Training 157,372 - EDIP- Dues and Memberships 21,303 - Codes (3,000) - Rewards 15,000 - Marketing- Office Supplies 43,256 - Uniforms 187,854 - Books & Subscriptions 105,973 - Other Operating Supplies 93,970 - Merchandise for Resale- Copier 5,443 - Special Programs 155,818 - Capital Outlay (63,974) - Regional Jail Detention Costs (280,623) - Health & Welfare - Social Services 51,111 - Local Organization Contributions 164,327 - Regional Organization Memberships 15,698 - Local Contribution to Schools 6,296,723 - Debt Payments 788,743 - Contingency (60,000) - Transfer to Other Funds (Aviation, Capital, Debt, Fleet, Grants, Public Utilities, Transit) 4,759,677 TOTAL INCREASED SERVICE REQUIREMENTS: 28,963,230 $ 22
City of Suffolk
Proposed FY 2024-25 Operating and Capital Budget
Capital Projects Fund - Executive Summary
Includes:
$7,539,692 in Public Utility cash funding for essential water/sewer projects.
$4,982,750 in Stormwater Bonds for stormwater drainage capital projects.
Cash Pay-Go Funding to leverage significant grant support of the following projects:
$32M or 38% of proposed capital project expenses funded by State/Federal dollars including Virginia Literary Loans.
$26.6M for Capital Pay-Go and contingency to safeguard projects against escalating construction and equipment costs.
FINANCIAL POLICY COMPLIANCE STATUS:
% Capital Projects Change Proposed Revenues: 83,514,269 $ -37% Proposed Expenditures: 83,514,269 $ -37% Unfunded Gap: - $ Increase / (Decrease) from Prior Fiscal Year: (48,242,954) $
Includes
of the
% Education: 2025 Bond $ Grant $ Grant Northern Shores Elementary Addition 3,575,000 $ Transportation: Pitchkettle Road Realignment 6,037,000 RT58 Improvements - Longstreet Land to Holland Bypass 624,859 10,236,859 $ - $
$25M in Literay
for John F. Kennedy Middle School
GO Bonded Projects
following:
Loan
replacement.
Aviation: Cash Pay-Go Grant $ T Hanger G 120,000 $ 480,000 $ 80% 120,000 $ 480,000 $
Capital Cash "Pay-Go" - 3% min. of General Fund Expenses 11.5% Projected
23
City of Suffolk
Proposed FY 2024-25 Operating and Capital Budget
Aviation Facilities Fund- Executive Summary
Includes:
Administrative and operational services and facilities to the general aviation community. Division maintains and operates the Suffolk Executive Airport to include runways, taxiways, hangar facilities, apron and tie down facilities, fueling facilities, required navigational equipment, and the airport café.
A transfer of $179,846 to support Airport operations from the General Fund to a Special Revenue Fund under the management of the Department of Economic Development.
% Aviation Change Proposed Revenues: 1,136,650 $ 1% Proposed Expenditures: 1,136,650 $ 1% Unfunded Gap: - $ Increase / (Decrease) from Prior Fiscal Year: 9,331 $
24
City of Suffolk
Proposed FY 2024-25 Operating and Capital Budget
Downtown Business Overlay Tax District Fund - Executive Summary
Includes:
Funding to foster economic development in Downtown Suffolk. Revenues provide for beautification enhancements to the downtown business district, sidewalk and street sweeping, and refuse services.
% Current Tax Rate: 0.105 $ DBOD Change Proposed Tax Rate: 0.105 $ Proposed Tax Rate Adjustment: - $ Proposed Revenues: 228,443 $ -1% Proposed Expenditures: 228,443 $ -1% Unfunded Gap: - $ Increase / (Decrease) from Prior Fiscal Year: (2,399) $
25
City of Suffolk
Proposed FY 2024-25 Operating and Capital Budget
Law Library Fund - Executive Summary
Includes:
Funding to provide the general public and legal community access to current legal and consumer protection information at no cost. A special fee of $4.00 is levied on civil court cases in the General District and Circuit Courts. This fee is held in a separate fund for the purpose of providing the public and Officers of the Court with a reliable network of legal information and educational support. This fund also supports community outreach efforts, legal publications, the salaries of support staff, and operating costs of the library.
Temporarily closed for courthouse renovations. No funding budgeted in FY 25.
% Law Library Change Proposed Revenues: - $ -100% Proposed Expenditures: - $ -100% Unfunded Gap: - $ Increase / (Decrease) from Prior Fiscal Year: (50,719) $
26
Includes:
Funding to promote infrastructure improvements to facilitate economic development and business attraction in the taxing district located in North Suffolk.
Transfer of debt service for payment of financed infrastructure improvements in the taxing district. Proposed FY 2024-25 Operating and Capital Budget RT17 Tax District Fund - Executive Summary
% Current Tax Rate: 0.24 $ RT. 17 Tax District Change Proposed R.E. Tax Rate: 0.24 $ Proposed Tax Rate Adjustment: - $ Proposed Revenues: 2,675,020 $ 4% Proposed Expenditures: 2,675,020 $ 4% Unfunded Gap: 0 $ Increase / (Decrease) from Prior Fiscal Year: 109,587 $
27
City of Suffolk
Proposed FY 2024-25 Operating and Capital Budget
% Road Maintenance Change Proposed Revenues: 36,732,494 $ 14% Proposed Expenditures: 36,732,494 $ 14% Unfunded Gap: 0 $ Increase / (Decrease) from Prior Fiscal Year: 4,612,657 $
Includes:
Funding provides for road maintenance, traffic engineering and signals, signage, paving and street improvements, bridge repairs, and street light utilities.
State Road Maintenance revenue based on City lane miles of: 1,291.46 secondary and 380.26 primary.
28
Road Maintenance Fund - Executive Summary City of Suffolk
City of Suffolk
Proposed FY 2024-25 Operating and Capital Budget
Debt Fund - Executive Summary
% Debt Change Proposed Revenues: 34,228,465 $ 2% Proposed Expenditures: 34,228,465 $ 2% Unfunded Gap: - $ Increase / (Decrease) from Prior Fiscal Year: 784,345 $ Includes: Annual
service for General
Includes GO Bond
Education: Northern Shores Elementary Addition 3,575,000 $ Transportation: Pitchkettle Road Realignment 6,037,000 RT58 Improvements - Longstreet Land to Holland Bypass 624,859 10,236,859 $ FINANCIAL POLICY COMPLIANCE STATUS: Debt as % of Assessed Value - 4% maximum 1.4% Projected Debt as % of General Govt. Expense - 10% maximum 6.2% Projected
debt
Government Projects.
Revenue for the following projects:
29
City of Suffolk
Proposed FY 2024-25 Operating and Capital Budget
Public Utilities - Executive Summary
Includes:
New customer revenue projection of 550 ERUs (Equivalent Residential Units)
The following rate structure adjustments are proposed effective July 1:
Transfer of $7.5M to cash fund Public Utilities Capital Projects.
Provides for 1 new full-time position:
• Programmer Analyst
% Public Utilities Change Proposed Revenues: 71,778,919 $ -12% Proposed Expenditures: 71,778,919 $ -12% Unfunded Gap: (0) $ Increase / (Decrease) from Prior Fiscal Year: (9,377,599) $
FY 24 FY 25 % Change Water per 100 cubic feet 10.63 $ 11.10 $ 4% Sewer per 100 cubic feet 7.56 $ 7.68 $ 2% Meter Service Charge 5/8 inch & 3/4 inch meter 15.25 $ 15.25 $ 0% Water Availability Charge - Single Family 5,520 $ 5,520 $ 0% Sewer Availability Charge - Single Family 6,000 $ 6,000 $ 0%
FINANCIAL POLICY COMPLIANCE STATUS: Utility Fund Financial Independence of the General Fund Yes Unrestricted Cash and Long Term Investments Balance at 25% of operations 36% Bond amortization not to exceed useful life of projects financed Yes Debt Service Coverage Ratio of 1.15 or greater 1.16
30
Includes:
State/Federal mandated stormwater management services citywide to include mosquito control services.
Debt service for stormwater capital projects.
Provides for 1 new full-time position:
• Mosquito Technician (converted from part-time)
% Current Monthly Fee per ERU: 7.50 $ Stormwater Change Proposed Monthly Fee per ERU: 7.50 $ Proposed Revenues: 9,633,418 $ 13% Proposed Expenditures: 9,633,418 $ 13% Unfunded Gap: 0 $ Increase / (Decrease) from Prior Fiscal Year: 1,080,379 $
31
City of Suffolk Proposed FY 2024-25 Operating and Capital Budget Stormwater Fund - Executive Summary
Proposed FY 2024-25 Operating and Capital Budget City of Suffolk Transit Fund - Executive Summary
Includes:
Operation of six bus routes and ADA service.
A transfer of $418,604 from the General Fund to support Transit operations.
$450,000 from Transit Fund balance previously provided from General Fund transfers to support operational needs.
Increase in state and federal funding of $637,658 for Transit operations.
% Transit Change Proposed Revenues: 3,189,830 $ 31% Proposed Expenditures: 3,189,830 $ 31% Unfunded Gap: - $ Increase / (Decrease) from Prior Fiscal Year: 754,206 $
32
City of Suffolk
Proposed FY 2024-25 Operating and Capital Budget
Refuse Fund - Executive Summary
Includes:
Provides for refuse, recycling, bulk refuse pick up and disposal costs at the Southeastern Public Service Authority (SPSA) regional landfill.
Provides for Citywide residential refuse and recycling pick-up to an estimated 32,600 households.
Compliance with state mandated citywide recycling requirement.
$2M provided for replacement of refuse trucks.
$480,000 from Refuse Fund unrestricted fund balance provided for rate stabilization.
% Current Monthly Fee per Household: 25.25 $ Refuse Change Proposed Monthly Fee per Household: 25.25 $ Proposed Revenues: 13,582,526 $ 18% Proposed Expenditures: 13,582,526 $ 18% Unfunded Gap: 0 $ Increase / (Decrease) from Prior Fiscal Year: 2,066,440 $
33
City of Suffolk
Proposed FY 2024-25 Operating and Capital Budget
Grants Fund - Executive Summary
Includes:
$800,000 in local cash match funds to leverage state and federal grant opportunities for the City.
% Grants Change Proposed Revenues: 800,000 $ 0% Proposed Expenditures: 800,000 $ 0% Unfunded Gap: - $ Increase / (Decrease) from Prior Fiscal Year: - $
34
City of Suffolk
Proposed FY 2024-25 Operating and Capital Budget
Fleet Fund - Executive Summary
Includes:
Cost estimate for fuel of $3.33 per gallon.
$3.5M cash funding for fleet equipment additions and replacements due to cost and safety factors.
Provides for 1 new full-time position:
• Fleet Support Associate
% Fleet Change Proposed Revenues: 17,347,316 $ 16% Proposed Expenditures: 17,347,316 $ 16% Unfunded Gap: 0 $ Increase / (Decrease) from Prior Fiscal Year: 2,390,443 $
35
City of Suffolk
Proposed FY 2024-25 Operating and Capital Budget
Information Technology Fund - Executive Summary
Includes:
Funding for citywide technology support services including:
- information technology disaster recovery
- website maintenance
- telecommunications, radio and tower services
- network infrastructure
- internet services
- hardware and software program support
Provides for 2 new full-time positions:
• Business Analyst
• Project Manager
% Information Technology Change Proposed Revenues: 17,118,453 $ 10% Proposed Expenditures: 17,118,453 $ 10% Unfunded Gap: (0) $ Increase / (Decrease) from Prior Fiscal Year: 1,624,876 $
36
City of Suffolk
Proposed FY 2024-25 Operating and Capital Budget
Risk Fund - Executive Summary
Includes:
Mandated coverage of workers compensation, public safety "line of duty" benefits, employee drug and alcohol screenings, and property/liability insurance.
Mandated provision of health insurance benefits to employees with employer/employee cost sharing formula.
Net 1 new full-time position:
% Risk Change Proposed Revenues: 23,191,500 $ 4% Proposed Expenditures: 23,191,500 $ 4% Unfunded Gap: 0 $ Increase / (Decrease) from Prior Fiscal Year: 899,699 $
Risk Management Specialist retitled from Administrative
of Human Resources Benefits Consultant retitled from Employee Relations Consultant transferred from Department of Human Resources Human Resources Manager retitled Training Manager transferred to Department of Human Resources
Projected compliance for Risk Stabilization Reserve of 20% of anticipated claims. 45%
Analyst transferred from Department
FINANCIAL POLICY COMPLIANCE STATUS:
37
City of Suffolk
Proposed FY 2024-25 Operating and Capital Budget
School Operating Fund - Executive Summary
Year to Year Comparative Data
% Schools Change Proposed Revenues: 242,729,720 $ 8% Proposed Expenditures: 242,729,720 $ 8% Unfunded Gap: - $ Increase / (Decrease) from Prior Fiscal Year: 17,893,268 $ Includes: Request: Recommended: $4M increase + $2M mid-year FY 24 funding in local support for Suffolk Public Schools operations 6,000,000 $ 6,000,000 $ Adopted FY 24 Requested FY 25 Recommended FY 25 % Change Operating Fund 185.4 $ 198.0 $ 198.0 $ 6.80% Lease of Building 0.4 $ 0.7 $ 0.7 $ 75.00% Grant Fund 29.8 $ 34.0 $ 34.0 $ 14.09% Food Services Fund 9.6 $ 10.0 $ 10.0 $ 4.17% Operating Request: 225.2 $ 242.7 $ 242.7 $ 7.77% School Debt Service: 11.9 $ 11.5 $ 11.5 $ -3.36% Total School Funding: 237.1 $ 254.2 $ 254.2 $ 7.21% Student Population: September Enrollment: 14,490 14,518 14,518 0% Average Daily Membership: 14,000 14,000 14,000 0%
38


Citizens City Attorney Clerk of the Circuit Court Sheriff Assessor City of Suffolk FY 20242025 Operating and Capital Budget Organizational Chart Director of Human Resources Chief of Police Fire Chief City Manager Other Authorities, Boards, and Commissions Planning Commission Director of Finance City Clerk School Board Treasurer Commissioner of the Revenue Commonwealth’s Attorney Deputy City Manager Director of Public Works Director of Economic Development Director of Planning & Community Development Director of Public Utilities Director of Parks & Recreation Director of Capital Programs & Facilities Deputy City Manager Director of Social Services Director of Libraries City Council Director of Information Technology Director of Media & Community Relations Elected Officials Appointed Officials
SUFFOLK FOR VISION
SUFFOLK CITY COUNCIL
Suffolk is a vibrant and fiscally strong community leading the region in advancements in education, comprehensive transportation, public safety and diverse economic growth while continuing to preserve its rural heritage and enhancing its neighborhoods and urban centers.
Throughout 430 square miles of rich land and pristine waterways, citizens and tourists treasure the beautiful trails, rivers and open spaces. Residents, visitors and merchants delight in the revitalized downtown featuring cultural, educational and recreational opportunities.
Diverse shopping, businesses and entertainment venues abound. A sense of harmony and pride permeates this rare community, where crime is low; where schools are cutting edge; where people and goods move safely and efficiently throughout the city; and where citizens receive valuable services and have opportunities to be engaged.
Suffolk is the desired destination of the Hampton Roads Region. The City achieves this by focusing on the following:


TARGETED AREAS
PUBLIC SAFETY
Preserve, promote, and continue to invest in public safety.
FINANCIAL STABILITY
Continue practices that ensure strong financial management and fiscal responsibility.
GROWTH MANAGEMENT AND COMPREHENSIVE PLANNING
Use the Comprehensive Plan and Unified Development Ordinance to enable and facilitate private investment in strategic target areas and preserve, conserve, and protect the City's unique natural and agricultural heritage.
CIVIC ENGAGEMENT AND RESPONSIVE CITY SERVICES
Ensure that all citizens have pertinent information in a timely manner and provide convenient and diverse means for citizen input; provide responsive, effective and efficient programs and services to citizens.
EXPANDED ECONOMIC DEVELOPMENT
Implement strategies that add new businesses and provide jobs for a skilled and diverse workforce, retain and enhance existing businesses, promote entrepreneurship, create a vibrant downtown, and build an economy that expands our tax base.
PUBLIC EDUCATION
Create a structure of shared accountability between the City and Schools to build an educational environment known for excellence.
LEISURE, HEALTH, AND WELLNESS
Implement programs and services designed to improve the health, economic and social wellbeing of citizens.
TRANSPORTATION
Increase capacity and connectivity of our roadways and public transportation system.
AAA RATED STANDARD & POOR’S AND FITCH RATINGS.
NERD WALLET - BEST PLACES FOR YOUNG FAMILIES/BEST CITIES FOR VETERANS IN AMERICA - 2015.
9TH BEST COMMUNITY ON BEST PLACES TO LIVE TOP 25
LIST OF “WHERE THE JOBS ARE” – CNN MONEY MAGAZINE – 2012.
ONE OF AMERICA’S BEST SMALL CITIES TO LIVE - CNN MONEY MAGAZINE 2010.
FAST GROWING

CITY,
COMPANIES. 40
HOME TO FAST GROWING
General Operating Fund
41
THIS PAGE INTENTIONALLY BLANK
42
SUFFOLK, VIRGINIA PROPOSED FY 2024-25 OPERATING
Budget 2021-2022 2022-2023 2023-2024 2023-2024 2024-2025 % Revenue Type Actual Actual Budget Projected Recommended Change GENERAL PROPERTY TAXES Real Property $ 117,584,079 $ 137,128,382 $ 156,989,609 $ 160,257,540 $ 168,376,205 7% Public Service Corporation Taxes 4,842,247 4,901,989 4,800,000 5,338,750 5,000,000 4% Personal Property 32,009,431 31,685,199 32,000,000 35,693,855 36,000,000 13% Penalties and Interest on Taxes 1,833,288 2,162,422 1,600,000 2,127,379 1,800,000 13% Total General Property Taxes $ 156,269,045 $ 175,877,992 $ 195,389,609 $ 203,417,524 $ 211,176,205 8% OTHER LOCAL TAXES Sales and Use Tax 16,370,460 18,035,988 16,500,000 18,575,550 17,500,000 6% Communications Sales Tax 2,499,745 2,434,071 2,000,000 2,306,089 2,000,000 0% Utility Taxes ( Electric / Gas) 5,024,008 5,034,466 4,700,000 4,904,249 4,800,000 2% Business License Tax 10,964,624 11,819,247 11,000,000 11,819,247 11,500,000 5% Motor Vehicle License Tax / Fee 2,709,174 2,837,185 2,500,000 2,837,185 2,700,000 8% Bank Stock Tax 747,889 768,872 706,203 706,203 768,872 9% Recordation & Probate Tax 3,279,397 1,851,695 2,200,000 1,708,524 1,800,000 -18% Tobacco Tax 1,831,481 1,849,863 1,600,000 1,474,492 1,600,000 0% Admissions Tax 177,788 227,453 100,000 273,309 200,000 100% Lodging Tax 2,206,627 2,067,131 1,800,000 2,067,131 1,800,000 0% Meals Tax 15,592,762 14,261,234 14,500,000 16,075,344 15,000,000 3% Total Other Local Taxes $ 61,403,956 $ 61,187,205 $ 57,606,203 $ 62,747,323 $ 59,668,872 4% TOTAL LOCAL TAX REVENUE $ 217,673,001 $ 237,065,197 $ 252,995,812 $ 266,164,847 $ 270,845,077 7% PERMITS, PRIVILEGE FEES, AND REGULATORY LICENSES Animal License 29,414 25,298 25,000 20,463 25,000 0% Land Use Application Fee 29,070 14,940 15,000 15,000 15,000 0% Land Transfer Fee 4,871 3,430 3,000 3,000 3,000 0% Zoning, Use and Ordinance Fee 469,283 339,460 300,000 300,000 300,000 0% Building Permits 1,608,485 1,297,186 1,000,000 1,475,227 1,000,000 0% Weapons Permits 65,104 74,032 70,000 59,002 50,000 -29% Borrow Pit Fees 176,078 129,046 65,000 65,000 65,000 0% Fishing Permits 1,377 380 1,300 1,300 1,300 0% Miscellaneous Permits 593 695 500 500 500 0% Total Permits, Privilege Fees, and Regulatory Licenses $ 2,384,274 $ 1,884,467 $ 1,479,800 $ 1,939,492 $ 1,459,800 -1% FINES & FORFEITURES General District Court Fines 383,726 363,076 375,000 375,000 375,000 0% Parking Fines and Violation Fees 133,678 135,652 120,000 109,385 100,000 -17% False Alarm Violation Fees 199,853 175,737 200,000 200,000 200,000 0% Total Fines & Forfeitures $ 717,257 $ 674,465 $ 695,000 $ 684,385 $ 675,000 -3% REVENUE FROM USE OF MONEY AND PROPERTY Interest on Investments 307,011 4,306,672 1,000,000 16,029,138 2,000,000 100% Interest on Bond Proceeds 208,917 3,634,415 1,000,000 5,349,533 2,000,000 100% Municipal Center Building Rent 191,870 203,248 203,248 203,248 209,545 3% Park Facility Use Fees 32,050 21,590 25,000 25,000 25,000 0% Recreational Building Rental 123,700 142,044 100,000 123,455 100,000 0% Antenna Space Rental 34,560 34,560 34,560 34,560 41,472 20% Vending Machine Commission 15,771 19,152 - 14,300 -Other Rentals 8,115 8,115 6,615 8,215 8,115 23% Total Revenue from Use of Money and Property $ 921,994 $ 8,369,796 $ 2,369,423 $ 21,787,449 $ 4,384,132 85% GENERAL FUND Revenue Summary 43
CITY OF
AND CAPITAL BUDGET
OF SUFFOLK, VIRGINIA PROPOSED FY 2024-25 OPERATING AND CAPITAL BUDGET Budget 2021-2022 2022-2023 2023-2024 2023-2024 2024-2025 % Revenue Type Actual Actual Budget Projected Recommended Change GENERAL FUND Revenue Summary
Excess Fees - Circuit Court Clerk 213,134 88,734 100,000 100,000 100,000 0% Sheriff's Fees (Serving Court Papers) 7,099 4,474 5,787 5,787 5,787 0% Court Appointed Attorney Fees 15,848 25,022 18,000 18,000 18,000 0% Court Security Fee 67,715 72,368 80,000 80,000 80,000 0% Commonwealth Attorney's Fees 7,824 8,356 8,000 8,000 8,000 0% Police 36,056 36,778 35,000 35,000 35,000 0% Fire & Rescue 14,620 5,022 15,000 15,000 15,000 0% EMS Fee 2,644,364 3,195,157 2,868,408 2,868,408 3,182,932 11% Animal Control Fees 21,940 31,154 50,000 50,000 50,000 0% Recreation & Special Event Fees 632,410 799,863 600,000 600,000 600,000 0% Library Fines and Charges 10,572 13,557 15,000 11,099 15,000 0% Tourism Special Event Fees 8,569 22,509 23,000 8,093 28,000 22% Charges for Planning & Community Development - - 50 50 50 0% Sale of Service - Capital Projects Administration 33,853 49,540 55,000 55,000 50,000 -9% Sale of Service - Road Maintenance (Police Weights & Measures) 151,971 240,436 115,000 182,196 200,000 74% Sale of Service - Road Maintenance Fund (Landscape by P&R) 800 - 7,500 7,500 7,500 0% Grave Openings 108,000 85,085 90,000 87,754 75,000 -17% Total Charges for Services $ 3,974,775 $ 4,678,055 $ 4,085,745 $ 4,131,887 $ 4,470,269 9% MISCELLANEOUS REVENUE SRHA - Payment in Lieu of Taxes - - 3,000 - 3,000 0% Sale of Salvage/Surplus Property 3,959 704 1,000 2,338 1,000 0% Sale of Real Estate 21,065 11,199 15,000 6,933 15,000 0% Delinquent Tax Collection Fee 614,723 783,172 500,000 639,641 500,000 0% Miscellaneous Revenue (401,206) (484,638) - (389,501) -Sales - Tourism 14,961 15,947 10,000 10,000 10,000 0% Total Miscellaneous Revenue $ 253,502 $ 326,384 $ 529,000 $ 269,411 $ 529,000 0% RECOVERED COSTS Reimbursement - Other Localities 55,651 58,108 100,000 100,000 100,000 0% Reimbursement - School Board 488,589 641,604 631,550 631,550 890,068 41% Reimbursement - Community Service Board 199,977 188,582 150,000 150,000 150,000 0% Reimbursement - Jury Duty Compensation 1,038 930 500 920 500 0% Reimbursement - Extradition of Prisoners 35,483 26,429 - 45,819 -Total Recovered Costs $ 780,738 $ 915,652 $ 882,050 $ 928,289 $ 1,140,568 29% TOTAL REVENUE FROM FEES / CHARGES $ 9,032,540 $ 16,848,821 $ 10,041,018 $ 29,740,913 $ 12,658,769 26% REVENUE FROM THE COMMONWEALTH - NON CATEGORICAL AID Mobile Home Titling Tax 37,724 32,755 25,000 32,755 25,000 0% Tax on Deeds - Grantors Tax 746,545 542,418 450,000 450,000 450,000 0% Rolling Stock Tax 130,114 138,544 125,000 138,544 125,000 0% Police House Bill 599 3,075,124 3,380,654 3,380,652 3,522,634 3,522,634 4% Personal Property Tax Relief 10,169,730 10,169,730 10,169,730 10,169,730 10,169,730 0% Vehicle Rental Tax 245,212 250,946 200,000 250,946 200,000 0% Games of Skill 18,000 - - - -Total Non-Categorical Aid $ 14,422,449 $ 14,515,047 $ 14,350,382 $ 14,564,609 $ 14,492,364 1% 44
CITY
CHARGES FOR SERVICES
SUFFOLK, VIRGINIA PROPOSED FY 2024-25 OPERATING
CAPITAL
Budget 2021-2022 2022-2023 2023-2024 2023-2024 2024-2025 % Revenue Type Actual Actual Budget Projected Recommended Change GENERAL FUND Revenue Summary SHARED EXPENSES Commonwealth Attorney 1,118,106 1,134,463 1,225,673 1,225,673 1,225,673 0% Sheriff 1,102,701 1,141,792 1,209,916 1,209,916 1,209,916 0% Commissioner of the Revenue 229,973 240,374 253,810 253,810 253,810 0% Treasurer 270,348 288,525 306,662 306,662 306,662 0% Registrar 101,660 92,380 106,071 106,071 106,071 0% Circuit Court Clerk 576,610 626,834 628,220 635,220 635,220 1% Total Shared Expenses $ 3,399,399 $ 3,524,368 $ 3,730,352 $ 3,737,352 $ 3,737,352 0% CATEGORICAL AID Asset Forfeiture Funds 4,713 2,775 - 11,782 -Jurors' Fees 5,820 24,630 10,000 42,890 40,000 300% Courthouse Maintenance Fees 24,514 30,367 30,000 30,367 30,000 0% Public Assistance Grants 2,359,231 2,661,991 2,938,158 2,938,158 3,128,633 6% Comprehensive Services Act 1,518,461 1,731,741 1,820,468 1,820,468 1,864,132 2% Property Seizure Program - Police 11,459 5,081 - 35,345 -Wireless E911 Grant 492,679 437,642 400,000 437,642 400,000 0% Miscellaneous Grants 377 224 - 2,391 -Four for Life Grant - EMS 93,893 93,435 93,893 93,893 93,435 0% Fire Programs Fund 342,357 378,438 378,438 424,690 424,690 12% Library Aid 237,572 157,586 210,931 247,524 242,374 15% Total Categorical Aid $ 5,091,075 $ 5,523,912 $ 5,881,888 $ 6,085,150 $ 6,223,264 6% TOTAL STATE REVENUE $ 22,912,923 $ 23,563,327 $ 23,962,622 $ 24,387,111 $ 24,452,979 2% REVENUE FROM THE FEDERAL GOVERNMENT - NON CATEGORICAL AID Property Seizure Program - Police 5,748 3,042 - 838 -Public Safety DEA Overtime 14,170 - - - -Public Assistance Grants 5,259,003 5,643,557 5,326,119 5,326,119 5,810,319 9% Refuge Revenue Sharing (Dismal Swamp) 21,100 23,504 20,000 20,000 20,000 0% TOTAL FEDERAL REVENUE $ 5,300,021 $ 5,670,103 $ 5,346,119 $ 5,346,957 $ 5,830,319 9% FUND TRANSFERS Transfer from Fund Balance - - - - 7,310,987Indirect Cost Return: Transfer from Road Maintenance Fund 714,960 563,241 578,590 578,590 667,056 15% Transfer from Transit 95,589 219,659 167,731 167,731 156,684 -7% Transfer from Aviation Fund 89,329 100,135 95,562 95,562 100,919 6% Transfer from Utility Fund 808,685 737,020 788,941 788,941 847,721 7% Transfer from Stormwater Fund 279,372 335,756 341,634 341,634 433,730 27% Transfer from Refuse Fund 302,897 244,397 268,971 268,971 269,000 0% Transfer from Fleet Management Fund 280,676 263,842 239,199 239,199 236,661 -1% Transfer from Information Technology Fund 290,789 351,128 337,321 337,321 304,382 -10% Transfer from Risk Management Fund 68,350 99,896 86,551 86,551 99,018 14% TOTAL OTHER REVENUE $ 2,930,647 $ 2,915,074 $ 2,904,500 $ 2,904,500 $ 10,426,158 259% TOTAL REVENUES $ 257,849,132 $ 286,062,521 $ 295,250,072 $ 328,544,328 $ 324,213,302 9.8% 45
CITY OF
AND
BUDGET
GENERAL GOVERNMENT
Budget 2021-2022 2022-2023 2023-2024 2023-2024 % 2024-2025 % 2024-2025 % Actual Actual Budget Exp To Dec Exp Request Incr Recommended Change
CITY OF SUFFOLK, VIRGINIA PROPOSED FY 2024-25 OPERATING AND CAPITAL BUDGET
City Council $ 444,475 $ 516,151 $ 765,187 $ 315,483 41% $ 768,668 0% $ 797,594 4% City Manager 1,162,914 1,213,640 1,371,650 613,360 45% 1,381,649 1% 1,654,125 21% Budget & Strategic Planning 374,556 391,951 420,789 197,855 47% 522,051 24% 467,366 11% City Attorney 1,290,388 1,286,717 1,507,740 663,398 44% 1,507,866 0% 1,564,288 4% Human Resources 1,555,246 1,689,892 2,053,811 931,481 45% 2,082,964 1% 2,147,774 5% Commissioner of the Revenue 1,159,466 1,316,428 1,355,066 608,739 45% 1,448,264 7% 1,569,389 16% Assessor 1,907,744 2,178,399 2,562,643 1,144,803 45% 2,571,643 0% 2,814,605 10% Treasurer 1,761,661 1,903,806 2,053,705 994,599 48% 2,076,681 1% 2,216,471 8% Finance 1,714,759 1,950,187 2,162,778 975,625 45% 2,334,365 8% 2,439,930 13% Purchasing 359,339 386,439 412,155 191,263 46% 471,731 14% 510,768 24% Registrar 828,826 940,224 1,263,980 699,039 55% 1,244,333 -2% 1,313,828 4% Total General Government $ 12,559,373 $ 13,773,835 $ 15,929,503 $ 7,335,644 46% $ 16,410,215 3% $ 17,496,137 10%
Circuit Court Judges 220,222 228,375 342,245 114,801 34% 334,245 -2% 361,641 6% General District Court 60,901 87,053 87,246 15,917 18% 107,246 23% 107,246 23% Magistrate's Office 13,725 14,463 17,975 5,824 32% 15,075 -16% 15,075 -16% Juvenile & Domestic Relations Court 13,347 13,261 17,939 5,910 33% 19,653 10% 19,039 6% Court Services Unit 847,633 793,516 973,885 657,027 67% 1,454,160 49% 1,454,160 49% Clerk of the Circuit Court 1,679,449 1,818,378 2,015,766 880,258 44% 2,072,174 3% 2,158,034 7% Sheriff 3,563,618 3,836,164 4,032,012 1,887,172 47% 4,205,916 4% 4,494,237 11% Commonwealth's Attorney 3,509,711 3,715,581 4,244,911 1,823,885 43% 4,416,147 4% 4,158,791 -2% Total Judicial $ 9,908,606 $ 10,506,792 $ 11,731,978 $ 5,390,794 46% $ 12,624,616 8% $ 12,768,222 9% PUBLIC SAFETY Police 26,459,081 29,397,864 32,190,510 15,259,966 47% 34,703,801 8% 37,182,807 16% Police - Emergency Communications 1,670,661 2,094,824 2,606,831 1,190,666 46% 3,301,079 27% 3,463,797 33% Animal Shelter Management 758,966 982,915 1,145,391 510,039 45% 1,326,553 16% 1,401,329 22% Fire and Rescue 35,991,963 41,171,428 45,156,596 22,130,171 49% 46,969,548 4% 48,962,727 8% Fire and Rescue - Emergency Management 9,376 11,452 15,617 2,523 16% 22,627 45% 22,627 45% Western Tidewater Regional Jail 4,492,631 4,560,701 4,560,701 2,280,351 50% 4,280,078 -6% 4,280,078 -6% Total Public Safety $ 69,382,678 $ 78,219,185 $ 85,675,647 $ 41,373,716 48% $ 90,603,686 6% $ 95,313,364 11% PUBLIC WORKS Public Works - Administration 1,013,405 1,210,369 1,378,627 549,866 40% 1,500,792 9% 1,504,380 9% Capital Programs & Facilities 4,412,774 4,921,294 5,530,134 2,724,678 49% 5,795,138 5% 6,148,582 11% Total Public Works $ 5,426,179 $ 6,131,663 $ 6,908,761 $ 3,274,544 47% $ 7,295,930 6% $ 7,652,961 11%
46
JUDICIAL
GENERAL FUND Expenditure Summary
GENERAL FUND Expenditure Summary
HEALTH & WELFARE
PROPOSED
Budget 2021-2022 2022-2023 2023-2024 2023-2024 % 2024-2025 % 2024-2025 % Actual Actual Budget Exp To Dec Exp Request Incr Recommended Change
CITY OF SUFFOLK, VIRGINIA
FY 2024-25 OPERATING AND CAPITAL BUDGET
Social Services 10,862,477 10,825,545 13,451,269 5,068,421 38% 13,733,961 2% 14,290,669 6% Children's Services Act 2,184,136 2,478,687 2,811,757 940,673 33% 2,855,494 2% 2,867,511 2% Western Tidewater Health District 1,095,655 1,189,651 1,245,000 622,500 50% 1,300,000 4% 1,300,000 4% Western Tidewater Community Service Board 474,404 550,000 600,000 300,000 50% 654,686 9% 654,686 9% Total Health & Welfare $ 14,616,672 $ 15,043,883 $ 18,108,027 $ 6,931,594 38% $ 18,544,141 2% $ 19,112,866 6% EDUCATION Transfer to School Operating - Local Support 65,377,695 66,507,115 69,775,180 29,966,634 43% 76,071,903 9% 76,071,903 9% Total Education $ 65,377,695 $ 66,507,115 $ 69,775,180 $ 29,966,634 43% $ 76,071,903 9% $ 76,071,903 9% PARKS, RECREATION & CULTURAL Parks and Recreation - Administration 2,676,052 3,257,913 3,630,475 1,618,471 45% 3,891,591 7% 4,002,343 10% Parks and Recreation - Parks, Gateways & Maintenance 2,981,017 3,357,279 3,850,403 1,651,332 43% 3,955,657 3% 4,250,878 10% Parks and Recreation - Recreation 2,271,375 2,995,979 4,091,301 1,933,834 47% 5,579,022 36% 4,599,180 12% Library 3,470,088 3,933,816 4,173,547 2,140,910 51% 4,565,351 9% 4,690,293 12% Total Parks, Recreation & Cultural $ 11,398,532 $ 13,544,987 $ 15,745,726 $ 7,344,547 47% $ 17,991,621 14% $ 17,542,693 11% COMMUNITY DEVELOPMENT Planning and Community Development 4,111,620 4,699,826 6,666,015 2,464,300 37% 7,696,819 15% 7,340,865 10% Economic Development 1,786,768 968,649 2,718,906 628,538 23% 2,726,905 0% 2,918,228 7% Tourism 735,388 823,914 892,155 443,767 50% 1,039,150 16% 986,222 11% Communications 886,899 796,411 1,196,820 463,524 39% 1,489,550 24% 1,452,303 21% Virginia Cooperative Extension Service 31,084 55,703 79,117 7,604 10% 87,779 11% 87,779 11% Total Community Development $ 7,551,759 $ 7,344,504 $ 11,553,012 $ 4,007,733 35% $ 13,040,203 13% $ 12,785,397 11% OTHER PUBLIC SERVICES Local and Regional Organizations 1,215,257 2,376,244 1,885,955 1,279,995 68% 2,355,168 25% 2,070,979 10% Total Other Public Services $ 1,215,257 $ 2,376,244 $ 1,885,955 $ 1,279,995 68% $ 2,355,168 25% $ 2,070,979 10% NON-DEPARTMENTAL Non-departmental 673,338 1,356,352 2,885,372 6,973 0% 2,799,450 -3% 2,799,450 -3% Transfer to Funds (Capital, Debt, Transit, Aviation) 33,494,035 37,751,872 55,050,910 27,986,944 51% 53,024,243 -4% 60,599,329 10% Total Non-departmental $ 34,167,372 $ 39,108,224 $ 57,936,282 $ 27,993,917 48% $ 55,823,693 -4% $ 63,398,779 9% Total General Fund Expenditures $ 231,604,123 $ 252,556,432 $ 295,250,072 $ 134,899,118 46% $ 310,761,175 5% $ 324,213,302 9.8% 47
THIS PAGE INTENTIONALLY BLANK
48
City Council Description
The City Council is the legislative and policy making body of the City Government. It establishes policies, sets goals and priorities, and interprets and represents the needs of the community to ensure the economic, social, educational, and physical quality of the City. The City Council is supported by the City Clerk whose office is responsible for the preservation and maintenance of the legislative record; recording and publishing City Council minutes; serving as an information center to address inquiries from citizens, municipal departments, and agencies; the management of boards and commissions; and fulfilling research requests.
Council Target Area
Civic Engagement & Responsive City Services
Budget Highlights:
No significant changes.
FY 25 Objectives
To prepare City Council meeting minutes in accordance with State Code provisions
To comply with Freedom of Information Act (FOIA) requests within five working days as outlined in the State Code.
To disseminate all City Council resolutions and ordinances within seven days of approval.
FY 23 FY 24 FY 25 Actual Projected Estimate Number of internal and external inquiries received 2,200 2,600 3,000 Average response time to internal and external inquiries 2 days 2 days 2 days Average time to post Council actions to website 2 days 2 days 2 days Meeting minutes prepared in accordance with State Code 100% 100% 100% Percent of FOIA requests answered within five working days 100% 100% 100% Percent of ordinances/resolutions disseminated within seven days 95% 96% 97%
Key Measures
49
Department: City Council Budget Detail 2021-2022 2022-2023 2023-2024 2023-2024 % 2024-2025 % 2024-2025 % Account Number: 100-11110- Actual Actual Budget Exp to Dec Exp Requested Change Recommended Change 51100.02 Salaries and Wages $ 306,127 $ 321,258 $ 440,092 $ 186,012 42% $ 440,092 0% $ 453,897 3% 52100 FICA 23,123 24,062 33,667 13,748 41% 33,667 0% 34,723 3% 52210 VRS Retirement 5,131 27,179 35,268 14,269 40% 35,268 0% 39,033 11% 52400 Group Life 2,360 2,624 3,405 1,377 40% 3,405 0% 3,590 5% 53100 Professional Services 295 67 5,000 216 4% 5,000 0% 5,000 0% 54100 Information Technology 52,620 52,731 69,031 30,132 44% 69,031 0% 77,264 12% 54500 Risk Management 15,532 28,995 109,859 54,929 50% 100,839 -8% 112,722 3% 55210 Postal Services 121 189 1,000 121 12% 1,000 0% 1,000 0% 55230 Telecommunications 10,249 11,502 12,347 3,948 32% 12,347 0% 12,347 0% 55500 Travel and Training 11,900 20,603 20,000 3,495 17% 30,000 50% 25,000 25% 55810 Dues & Association Memberships 190 285 750 - 0% 1,000 33% 1,000 33% 55840 Code Expense 5,358 6,876 10,000 5,126 51% 7,000 -30% 7,000 -30% 56001 Office Supplies 2,549 4,285 5,500 616 11% 5,500 0% 5,500 0% 56012 Books and Subscriptions 878 840 750 496 66% 1,000 33% 1,000 33% 56017 Copier Costs 2,372 2,647 3,519 996 28% 3,519 0% 3,519 0% 56026 Special Events 5,671 12,010 15,000 - 0% 20,000 33% 15,000 0% Total Operating Expenditures $ 444,475 $ 516,151 $ 765,187 $ 315,483 41% $ 768,668 0% $ 797,594 4% 56026 - Special Events: Christmas Party, Peanut Fest City Reception and special event sponsorships Personnel Summary 2021-2022 2022-2023 2023-2024 2024-2025 2024-2025 Range Class Actual Actual Budget Requested Recommended Mayor 1 1 1 1 1 Councilman 7 7 7 7 7 City Clerk 1 1 1 1 1 221 Deputy City Clerk 1 1 1 1 1 210 Assistant City Clerk 1 1 1 1 1 Number of Full-Time Positions 11 11 11 11 11 50
City Manager
Description
Council Target Area FY 25 Objectives
Civic Engagement & Responsive City Services
To move the City forward by advancing City Council’s vision and priorities.
To ensure delivery of quality services to the citizens of Suffolk.
To attract and maintain the City’s workforce to meet citizen demand for services.
The City Manager is the Chief Executive Officer of the City of Suffolk and is responsible for the day-to-day administration of City Government. The City Manager recommends policy alternatives to the City Council and implements the policies and priorities established by the governing body in accordance with the city charter, city code and ordinances, and state and federal regulations. Other essential activities and duties include oversight of operating departments, coordination of legislative affairs with state and congressional leaders, and serving as a liaison to businesses, community organizations, and various local and regional boards and commissions. Key Measures
Budget Highlights:
Assistant Director of Downtown Development added to enhance coordination of downtown initiatives.
FY 23 FY 24 FY 25 Actual Projected Estimate Bond Rating: Moody’s Aaa Aaa Aaa Standard’s and Poor’s AAA AAA AAA Fitch AAA AAA AAA Unassigned Fund Balance 20% 20% 20% Jobs created 598 795 850 Capital Investment $369M $384M $395M
Expanded Economic Development
promote
economic growth
sustainability. Financial Stability To maintain the City’s
financial position through compliance with City financial policies. 51
To
and facilitate
and
strong
Department: City Manager Budget Detail 2021-2022 2022-2023 2023-2024 2023-2024 % 2024-2025 % 2024-2025 % Account Number: 100-12110- Actual Actual Budget Exp to Dec Exp Requested Change Recommended Change 51100.02 Salaries and Wages $ 800,545 $ 793,283 $ 872,423 $ 415,592 48% $ 872,423 0% $ 1,077,434 23% 51100.04 Salaries and Wages - Overtime 667 475 - - - - - -51100.14 Transportation Expense 17,770 22,800 22,800 10,830 48% 22,800 0% 22,800 0% 52100 FICA 55,719 53,289 66,740 24,207 36% 66,740 0% 82,424 23% 52210 VRS Retirement 95,678 108,373 121,092 58,922 49% 121,092 0% 165,098 36% 52400 Group Life 8,140 10,516 11,690 5,694 49% 11,690 0% 14,438 23% 53100 Professional Services 45,400 54,300 60,000 14,349 24% 60,000 0% 60,000 0% 53600 Advertising - 2,310 - 126 - 5,000 - 5,00054100 Information Technology 48,912 50,645 64,779 30,097 46% 64,779 0% 72,810 12% 54200 Fleet - - - - - - - -54500 Risk Management 54,545 77,287 80,052 40,026 50% 80,052 0% 82,049 2% 55210 Postal Services 50 40 100 2 2% 100 0% 100 0% 55230 Telecommunications 9,767 12,544 12,856 4,275 33% 12,856 0% 12,856 0% 55410 Lease/Rent of Equipment - - 1,000 - 0% 1,000 0% 1,000 0% 55500 Travel and Training 12,160 12,965 20,000 3,170 16% 20,000 0% 20,000 0% 55810 Dues and Association Memberships 1,845 2,327 7,200 45 1% 7,200 0% 7,200 0% 56001 Office Supplies 4,416 5,132 7,000 1,834 26% 7,000 0% 7,000 0% 56012 Books and Subscriptions 506 416 1,500 8 1% 1,500 0% 1,500 0% 56017 Copier Costs 6,796 6,937 7,417 3,148 42% 7,417 0% 7,417 0% 56026 Special Events - - 15,000 1,036 7% 20,000 33% 15,000 0% Total Operating Expenditures $ 1,162,914 $ 1,213,640 $ 1,371,650 $ 613,360 45% $ 1,381,649 1% $ 1,654,125 21% 53100 - Professional Services: Legislative Services Personnel Summary 2021-2022 2022-2023 2023-2024 2024-2025 2024-2025 Range Class Actual Actual Budget Requested Recommended City Manager 1 1 1 1 1 Deputy City Manager 1 2 2 2 2 Chief of Staff 1 - - -223 Assistant Director of Downtown Development - - - - 1 217 Senior Administrative Analyst 1 1 1 1 1 214 Administrative Analyst - - - 1 1 209 Executive Office Administrator 1 1 1 1 1 205 Executive Administrative Assistant 2 2 2 1 1 204 Staff Support Assistant 1 1 1 1 1 Number of Full-Time Positions 8 8 8 8 9 52
Description
Finance – Budget and Strategic Planning
The Division of Budget and Strategic Planning provides financial, management information, control, and guidance to the City Council, City Manager, and City departments. The primary responsibilities of the division include the development of the annual operating and capital budget and capital improvements program and plan, revenue and expenditure analysis and quarterly financial reporting, strategic financial planning, and fiscal impact analysis. Key
Financial Stability
To develop a balanced budget in accordance with local and state laws and City financial policies.
To prepare quarterly budget projection reports within 30 days of the end of each fiscal quarter.
To achieve a variance between budgeted and actual General Fund revenue of 5% or less.
Budget Highlights:
Reclassification of Budget Analyst positions to Senior Budget Analyst and Budget Manager to address increasing complexity and workload of job duties and functions.
FY 23 FY 24 FY 25 Actual Projected Estimate Projection reports submitted within 30 days of quarter end 100% 100% 100% Financial Policies: Capital Pay-Go at least 3% of General Fund budget less transfers 4.5% 10.3% 11.5% Debt as percentage of assessed value at/below 4% 1.7% 1.5% 1.4% Debt as percentage of general govt. expenditures at/below 10% 6.4% 6.6% 6.2% Variance of actual to projected General Fund revenue 8.7% 5.0% 5.0%
Measures
Council Target Area FY 25 Objectives
53
Division: Budget & Strategic Planning (Department of Finance) Budget Detail 2021-2022 2022-2023 2023-2024 2023-2024 % 2024-2025 % 2024-2025 % Account Number: 100-12440- Actual Actual Budget Exp to Dec Exp Requested Change Recommended Change 51100.02 Salaries and Wages $ 266,503 $ 273,791 $ 287,121 $ 139,199 48% $ 369,535 29% $ 320,669 12% 52100 FICA 19,726 20,119 21,965 10,219 47% 28,269 29% 24,531 12% 52210 VRS Retirement 32,644 37,955 39,852 19,926 50% 51,291 29% 46,722 17% 52400 Group Life 3,508 3,664 3,847 1,924 50% 4,952 29% 4,297 12% 53600 Advertising 6,219 5,855 6,400 - 0% 6,400 0% 6,400 0% 54100 Information Technology 17,541 15,848 20,834 9,039 43% 20,834 0% 23,179 11% 54500 Risk Management 23,313 28,995 30,129 15,065 50% 30,129 0% 30,927 3% 55210 Postal Services 28 31 100 - 0% 100 0% 100 0% 55230 Telecommunications 461 440 3,308 127 4% 3,308 0% 3,308 0% 55500 Travel and Training - 353 2,000 95 5% 2,000 0% 2,000 0% 55810 Dues and Association Memberships 575 1,215 1,200 725 60% 1,200 0% 1,200 0% 56001 Office Supplies 1,191 1,256 1,500 479 32% 1,500 0% 1,500 0% 56012 Books and Subscriptions - 21 200 - 0% 200 0% 200 0% 56017 Copier Costs 2,847 2,409 2,333 1,057 45% 2,333 0% 2,333 0% Total Operating Expenditures $ 374,556 $ 391,951 $ 420,789 $ 197,855 47% $ 522,051 24% $ 467,366 11%
2021-2022 2022-2023 2023-2024 2024-2025 2024-2025 Range Class Actual Actual Budget Requested Recommended 223 Assistant Director of Finance - Budget 1 1 1 1 1 219 Budget Manager - - - 1 1 218 Senior Budget Analyst - - - 1 1 217 Budget Analyst 2 2 2 1Number of Full-Time Positions 3 3 3 4 3 54
Personnel Summary
City Attorney
Description
The Suffolk City Attorney’s Office provides legal representation, consult, and advice to the Suffolk City Council and all City Departments. The Office represents the City and Council in Court proceedings and in grievance matters.
To strive to resolve legal disputes involving the City in a manner which is professional and fiscally responsible.
To provide accurate and reliable legal advice to City Council and to the various City departments to ensure that the actions taken by the City in furtherance of the Comprehensive Plan are lawful and promote the wellbeing of all Suffolk citizens. Civic Engagement & Responsive
Budget Highlights:
No significant changes.
To strive to provide the Council and the Departments with the most current, relevant, and proactive legal advice when requested.
Target Area FY 25 Objectives Financial Stability
Council
Growth Management & Comprehensive Planning
Services
City
Key Measures FY 23 Actual FY 24 Projected FY 25 Estimate Number of legal requests for services Number of contract reviews Number of court appearances Number of real estate matters handled 1,528 150 129 150 2,000 160 200 175 2,400 220 250 200 55
Department: City Attorney Budget Detail 2021-2022 2022-2023 2023-2024 2023-2024 % 2024-2025 % 2024-2025 % Account Number: 100-12210- Actual Actual Budget Exp to Dec Exp Requested Change Recommended Change 51100.02 Salaries and Wages $ 785,463 $ 881,782 $ 960,575 $ 447,480 47% $ 960,575 0% $ 1,017,678 6% 51100.14 Transportation Expense 6,150 6,000 - 2,850 - - - -52100 FICA 58,418 64,245 73,484 31,842 43% 73,484 0% 77,852 6% 52210 VRS Retirement 94,931 120,933 133,328 66,644 50% 133,328 0% 160,806 21% 52400 Group Life 10,188 11,735 12,872 6,455 50% 12,872 0% 13,637 6% 53100 Professional Services 159,071 10,725 50,000 5,880 12% 50,000 0% 50,000 0% 53100.11 Legal Services 3,663 4,726 4,788 1,745 36% 4,414 -8% 4,414 -8% 53600 Advertising 2,364 218 1,000 - 0% 1,000 0% 1,000 0% 54100 Information Technology 56,245 51,490 111,419 28,056 25% 111,419 0% 75,667 -32% 54500 Risk Management 70,120 87,115 100,327 50,164 50% 100,327 0% 102,786 2% 55210 Postal Services 1,696 1,722 2,000 1,143 57% 2,500 25% 2,500 25% 55230 Telecommunications 13,127 12,277 14,877 4,101 28% 14,877 0% 14,877 0% 55500 Travel and Training 8,476 11,217 17,500 6,235 36% 17,500 0% 17,500 0% 55810 Dues and Association Memberships 4,430 4,120 7,100 4,545 64% 7,100 0% 7,100 0% 56001 Office Supplies 3,379 3,912 5,000 617 12% 5,000 0% 5,000 0% 56012 Books and Subscriptions 4,764 5,898 5,000 2,057 41% 5,000 0% 5,000 0% 56017 Copier Costs 7,904 8,601 8,470 3,586 42% 8,470 0% 8,470 0% Total Operating Expenditures $ 1,290,388 $ 1,286,717 $ 1,507,740 $ 663,398 44% $ 1,507,866 0% $ 1,564,288 4% Personnel Summary 2021-2022 2022-2023 2023-2024 2024-2025 2024-2025 Range Class Actual Actual Budget Requested Recommended City Attorney 1 1 1 1 1 Deputy City Attorney 1 1 1 1 1 219/222/223 Assistant City Attorney I-III 3 4 4 4 4 214 Paralegal Administrator 1 1 1 1 1 210 Legal Services Coordinator 1 1 1 1 1 208 Paralegal 2 2 2 2 2 Number of Full-Time Positions 9 10 10 10 10 56
Human Resources
Description
The Department of Human Resources provides support to the City Manager and City departments in the recruitment, hiring, development, and retention of employees. These services are provided through data collection, needs projection, recruitment, selection, retention, general training, advice to management, and review of human resources policies and procedures. The Department oversees ongoing programs related to employee health and welfare, employee recognition, and employee relations with internal and external customers. Key
Council Target Area
Civic Engagement & Responsive City Services
FY 25 Objectives
To implement technology enhancements with a focus on data integrity and business needs.
To implement an off-boarding process with a focus of analyzing and reporting out data.
To leverage technology to assist in talent acquisition and brand recognition as a great place to work.
Budget Highlights:
Training Manager position established and transferred to Human Resources from Risk Management Fund.
Diversity Equity and Inclusion – Belonging (DEI-B) Analyst and Training Consultant position established via full-time position transfer from the Department of Social Services.
Two positions transferred from Human Resources to Risk Management Fund.
Increased funding for professional services and travel and training.
Measures FY 23 Actual FY 24 Projected FY 25 Estimate New hires Average time to hire Percent of vacant positions 422 50-80 days 12.0% 545 50-80 days 12.9% 450 50-80 days 12.0%
57
Department: Human Resources Budget Detail 2021-2022 2022-2023 2023-2024 2023-2024 % 2024-2025 % 2024-2025 % Account Number: 100-12220- Actual Actual Budget Exp to Dec Exp Requested Change Recommended Change 51100.02 Salaries and Wages $ 825,976 $ 743,316 $ 1,089,010 $ 427,969 39% $ 1,089,080 0% $ 1,169,048 7% 51100.04 Salaries and Wages - Overtime 937 726 - 28 - - - -51100.06 Salaries and Wages - Part-time 58,390 95,655 36,401 26,212 72% 42,037 15% 37,857 4% 52100 FICA 66,099 61,787 86,094 33,670 39% 86,530 1% 92,328 7% 52210 VRS Retirement 97,728 98,645 151,155 60,411 40% 151,164 0% 192,042 27% 52400 Group Life 9,919 9,557 14,593 5,856 40% 14,594 0% 15,665 7% 52820 Tuition Assistance 10,531 15,506 30,000 9,225 31% 33,000 10% 30,000 0% 53100 Professional Services 55,943 119,634 97,000 54,810 57% 107,000 10% 107,000 10% 53200 Temporary Help Service Fees 206,276 34,940 - 5,914 - - - -53500 Printing & Binding 33 720 - - - - - -53600 Advertising 4,033 2,361 5,000 4,191 84% 5,000 0% 5,000 0% 54100 Information Technology 68,647 316,127 320,044 183,960 57% 320,044 0% 250,716 -22% 54500 Risk Management 54,344 96,368 129,792 64,896 50% 129,792 0% 143,395 10% 55210 Postal Services 5,990 3,430 3,500 456 13% 3,500 0% 3,500 0% 55230 Telecommunications 17,424 19,149 26,551 6,263 24% 26,551 0% 26,551 0% 55500 Travel & Training 6,677 38,441 20,000 18,047 90% 30,000 50% 30,000 50% 55810 Dues and Association Memberships 5,886 2,947 3,500 2,562 73% 3,500 0% 3,500 0% 55841 Service Awards 13,380 16,829 25,000 18,757 75% 25,000 0% 25,000 0% 56001 Office Supplies 9,103 6,568 8,000 6,808 85% 8,000 0% 8,000 0% 56012 Books and Subscriptions 6,567 332 3,000 - 0% 3,000 0% 3,000 0% 56014 Other Operating Supplies 27,720 - - - - - - -56017 Copier Costs 3,644 3,484 5,172 1,449 28% 5,172 0% 5,172 0% 58200 Capital Outlay - 3,369 - - - - - -Total Operating Expenditures $ 1,555,246 $ 1,689,892 $ 2,053,811 $ 931,481 45% $ 2,082,964 1% $ 2,147,774 5% Personnel Summary 2021-2022 2022-2023 2023-2024 2024-2025 2024-2025 Range Class Actual Actual Budget Requested Recommended Director of Human Resources 1 1 1 1 1 223 Assistant Director of Human Resources 1 1 1 1 1 220 Training Manager - - 1 - 1 220 Talent Acquisition Manager 1 1 1 1 1 220 HRIS Manager 1 1 1 -220 Employee Relations Manager - - - 1 1 220 Compensation Manager - 1 1 1 1 219 Employee Experience Manager 1 - - -217 Senior Talent Acquisition Consultant - - 2 1 1 217 Senior Administrative Analyst - - - 1217 HRIS Analyst - - - - 1 217 DEIB Analyst and Training Consultant - - - - 1 214 Talent Acquisition Consultant 2 2 1 3 3 214 Employee Relations Consultant 1 1 1 1214 Compensation Analyst - - - - 1 214 Administrative Analyst - 2 1 2206 Human Resources Assistant 1 3 3 1 1 205 Administrative Assistant 1 - - -Number of Full-Time Positions 10 13 14 14 14 58
Commissioner of the Revenue Description
The Office of the Commissioner of the Revenue is required by Section 15.2-1600 of the Code of Virginia. The Commissioner of the Revenue is an elected official whose responsibilities are to assess individual personal property, business personal property, and machinery and tools for taxation and issue City business licenses and administer special taxes on meals, lodging, cigarettes, and admissions. The Office also processes state income and estimated tax returns, assesses public service corporations, maintains the City’s personal property record and assessment books, enforces City business license codes, and assists individuals and businesses with tax and license inquiries, as well as with income and estimated tax inquiries.
Council Target Area
Financial Stability
Civic Engagement & Responsive City Services
FY 25 Objectives
To assess all personal property and other local taxes in accordance with the Code of Virginia and Suffolk City Code.
To achieve 100% audit compliance with the Commonwealth of Virginia Auditor of Public Accounts.
To enroll all deputies in the Career Development Program of the Commissioners of the Revenue Association of Virginia.
To maintain accreditation with the Virginia Commissioner of the Revenue’s Association.
To respond to all customer inquiries and initiate resolutions to problems within one business day.
Budget Highlights:
Senior Deputy Commissioner of the Revenue position added to address growth in tax accounts.
Additional part-time funding to address workload increase.
Key Measures FY 23 Actual FY 24 Projected FY 25 Estimate Percent compliance with Auditor of Public Accounts audit Percent of customer inquiries responded to within one business day Accreditation with the Va. Commissioner of the Revenue Association Personal Property items Business Licenses Prepared food and beverage accounts Lodging Accounts 100% 100% 100% 142,541 6,591 392 21 100% 100% 100% 146,202 6,790 423 21 100% 100% 100% 147,488 6,800 434 26
59
Department: Commissioner of the Revenue Budget Detail 2021-2022 2022-2023 2023-2024 2023-2024 % 2024-2025 % 2024-2025 % Account Number: 100-12310- Actual Actual Budget Exp to Dec Exp Requested Change Recommended Change 51100.02 Salaries and Wages $ 721,905 $ 796,790 $ 793,413 $ 359,555 45% $ 837,392 6% $ 903,718 14% 51100.04 Salaries and Wages - Overtime 1,286 856 - - - - - -51100.06 Salaries and Wages - Part-time 25,556 32,997 36,176 19,571 54% 66,353 83% 66,535 84% 52100 FICA 56,059 61,184 63,463 27,695 44% 69,136 9% 74,224 17% 52210 VRS Retirement 85,730 103,500 110,126 52,521 48% 116,230 6% 149,349 36% 52400 Group Life 8,718 10,005 10,632 5,088 48% 11,221 6% 12,110 14% 53200 Temporary Help Service Fees 7,001 12,648 - - - - - -53500 Printing and Binding 5,253 4,473 10,210 688 7% 11,250 10% 11,250 10% 53600 Advertising 177 926 600 44 7% 800 33% 800 33% 54100 Information Technology 84,965 91,369 106,899 45,198 42% 106,899 0% 119,041 11% 54500 Risk Management 93,115 125,242 129,792 64,896 50% 129,792 0% 133,171 3% 55210 Postal Services 13,731 15,692 20,315 9,378 46% 22,000 8% 22,000 8% 55230 Telecommunications 6,885 7,913 10,977 2,552 23% 10,977 0% 10,977 0% 55500 Travel and Training 4,247 6,289 7,000 2,124 30% 9,000 29% 9,000 29% 55810 Dues and Association Memberships 1,880 2,757 2,250 1,290 57% 2,500 11% 2,500 11% 56001 Office Supplies 29,666 28,469 36,000 12,709 35% 36,000 0% 36,000 0% 56012 Books and Subscriptions 1,850 2,011 2,300 811 35% 3,800 65% 3,800 65% 56017 Copier Costs 11,443 13,306 14,914 4,618 31% 14,914 0% 14,914 0% 58200 Capital Outlay - - - - - - - -Total Operating Expenditures $ 1,159,466 $ 1,316,428 $ 1,355,066 $ 608,739 45% $ 1,448,264 7% $ 1,569,389 16% Personnel Summary 2021-2022 2022-2023 2023-2024 2024-2025 2024-2025 Range Class Actual Actual Budget Requested Recommended Commissioner of the Revenue 1 1 1 1 1 222 Chief Deputy Commissioner of the Revenue 1 1 1 1 1 216 Auditor 1 1 1 1 1 210 Property Tax Analyst - 1 1 1 1 210 Customer Service Manager - - - 1 1 209 Business Tax Investigator 1 1 1 1 1 Deputy Commissioner of the Revenue IV 1 - - -208 Senior Deputy Commissioner of the Revenue 3 3 2 3 3 208 Administrative Specialist 1 1 1 1 1 206 Deputy Commissioner of the Revenue - 4 5 4 4 Deputy Commissioner of the Revenue II 2 - - -Deputy Commissioner of the Revenue I 2 - - -Number of Full-Time Positions 13 13 13 14 14 NOTE: Comp Board provides partial salary reimbursement for 9 of 14 full time positions with reimbursement by the State and contribution by the City for the balance for operations. 60
City Assessor
Description
The purpose of the City Assessor’s Office is to discover, list, and value all real property in the City of Suffolk. Real estate values are based on local market conditions and governed by Section 58.1-3200 of the Code of Virginia, which requires assessments to strive for one hundred percent of market value.
To continue ensuring the highest levels of accuracy and quality of assessments through a deepening understanding and reliance on the features and capabilities available in the CAMA system.
To continue to enhance the Assessor’s website by adding a new module to provide property owners, the private sector, and market participants with a way to compare properties and better understand their assessments.
To continue utilization of the Community Outreach Committee to provide citizen outreach and education through speaking engagements at civic leagues and homeowners associations throughout the City as requested.
Growth Management & Comprehensive Planning
Leisure, Health & Wellness
Budget Highlights:
No significant changes.
To ensure the long range effectiveness of the office and its ability to manage the explosive growth in the City by developing a strategic plan.
To build on enhancements made to the workplace environment, as well as the work/life balance by encouraging staff involvement geared toward more efficient operations.
Measures FY 23 Actual FY 24 Projected FY 25 Estimate Number of parcels assessed Number of property transfers Median Residential Sales Price Total Taxable Value Building Permits worked Number of assessment appeals 41,297 3,150 $389,900 $13.2B 270 364 41,783 2,275 $392,500 $15.7B 255 300 42,150 2,800 $397,000 $16.1B 260 325
Key
Target Area FY 25
Financial Stability
Council
Objectives
Responsive
Services
Civic Engagement &
City
Civic Engagement & Responsive City Services
61
Department: City Assessor Budget Detail 2021-2022 2022-2023 2023-2024 2023-2024 % 2024-2025 % 2024-2025 % Account Number: 100-12320- Actual Actual Budget Exp to Dec Exp Requested Change Recommended Change 51100.02 Salaries and Wages $ 1,188,057 $ 1,275,774 $ 1,556,688 $ 713,931 46% $ 1,556,688 0% $ 1,639,708 5% 51100.04 Salaries and Wages - Overtime - 42 - 259 - - - -51100.06 Salaries and Wages - Part-time - 43,598 69,869 3,884 6% 69,869 0% 72,664 4% 51100.27 Special Compensation 883 - 2,100 - 0% 2,100 0% 2,100 0% 52100 FICA 88,229 97,622 124,592 53,294 43% 124,592 0% 131,157 5% 52210 VRS Retirement 144,847 175,651 216,068 100,560 47% 216,068 0% 261,765 21% 52400 Group Life 16,553 16,985 20,860 9,736 47% 20,860 0% 21,972 5% 53500 Printing and Binding 2,877 282 7,000 - 0% 7,000 0% 7,000 0% 53600 Advertising 433 1,552 2,500 - 0% 3,000 20% 3,000 20% 54100 Information Technology 146,809 245,333 219,406 113,625 52% 219,406 0% 316,502 44% 54200 Fleet 11,145 17,385 19,169 8,771 46% 19,169 0% 10,602 -45% 54500 Risk Management 148,223 203,131 209,945 104,972 50% 209,945 0% 225,190 7% 55210 Postal Services 21,510 24,700 25,000 1,160 5% 26,500 6% 26,500 6% 55230 Telecommunications 19,851 26,376 30,493 8,797 29% 30,493 0% 30,493 0% 55500 Travel and Training 20,890 26,522 25,000 13,317 53% 30,000 20% 30,000 20% 55810 Dues and Association Memberships 5,035 5,449 8,000 5,743 72% 10,000 25% 10,000 25% 56001 Office Supplies 3,781 3,159 6,500 1,599 25% 6,500 0% 6,500 0% 56011 Uniforms & Wearing Apparel 979 - 1,400 - 0% 1,400 0% 1,400 0% 56012 Books and Subscriptions 2,316 2,007 4,000 168 4% 4,000 0% 4,000 0% 56014 Other Operating Supplies - - 975 - 0% 975 0% 975 0% 56017 Copier Costs 12,826 12,833 13,078 4,986 38% 13,078 0% 13,078 0% 58200 Capital Outlay 72,500 - - - - - - -Total Operating Expenditures $ 1,907,744 $ 2,178,399 $ 2,562,643 $ 1,144,803 45% $ 2,571,643 0% $ 2,814,605 10% 53500 - Printing and Binding: Assessment notices. Personnel Summary 2021-2022 2022-2023 2023-2024 2024-2025 % 2024-2025 Range Class Actual Actual Budget Requested Change Recommended Assessor 1 1 1 1 1 222 Deputy Assessor 2 2 2 1 1 218 Real Estate Valuation/Cama Analyst 1 1 1 1 1 216 Valuation Manager 1 1 2 3 3 215 Commercial Appraiser 2 2 2 2 2 210/211/214 Appraiser I-III 8 8 9 9 9 211 Data Analyst 1 1 1 1 1 209 Senior Land Records Technician 1 1 1 2 2 207 Land-Use Compliance Coordinator 1 1 - -205 Land Records Technician 1 1 1 -205 Administrative Assistant 1 1 1 1 1 202 Office Assistant 1 1 1 1 1 Number of Full-Time Positions 21 21 22 22 22 62
City Treasurer
Description
The scope of the Treasurer's Office includes the collection of state and local funds, the disbursements and investment of local funds, and the accounting of those funds. The Treasurer is responsible for all activities related to the receipt, deposit, investment, reconciliation, and disbursements of funds. The integrity of the operation of the Treasurer's Office revolves around the proper use of government accounting. This ensures that the public funds entrusted to the Treasurer's care are monitored in a fiscally responsible manner. The Treasurer is personally responsible for the locality's funds. The legal authority for the Treasurer's duties is grounded in the Constitution of Virginia, the Code of Virginia, local ordinances and charter provisions, case law from court decisions, and opinions of the Attorney General. Key Measures
Budget Highlights:
No significant changes. Council Target Area
To maintain a current three year combined real estate and personal property tax and stormwater and refuse fee collection rate of over 99%.
To continue to monitor and refine the State Set-Off Debt Collections Program and DMV block processes for the collection of taxes.
To maintain a well-trained workforce by enrolling staff in classes and/or college courses to improve and expand skills to ensure high quality customer service.
To continue to partner with City departments to collect all revenue owed to the City.
To continue to take advantage of all technological opportunities made available to better collect, invest, and manage the City’s funds.
FY 23 Actual FY 24 Projected FY 25 Estimate Tax Collection Rate: Real Estate Personal Property Stormwater Maintenance Fee Vehicle License Fee Refuse Collection Fee Number of online payments processed Debt Set-Off Number of claims filed Value of claims submitted Amount of claims collected 99% 94% 98% 85% 97% 89,310 38,040 $18.5M $1.8M 99% 95% 98% 86% 98% 91,000 38,500 $20.4M $1.2M 99% 95% 98% 86% 98% 93,000 38,900 $22.4M $1.2M
FY 25 Objectives
Financial Stability
63
Department: City Treasurer Budget Detail 2021-2022 2022-2023 2023-2024 2023-2024 % 2024-2025 % 2024-2025 % Account Number: 100-12410- Actual Actual Budget Exp to Dec Exp Requested Change Recommended Change 51100.02 Salaries and Wages $ 1,058,373 $ 1,118,644 $ 1,193,302 $ 564,842 47% $ 1,193,302 0% $ 1,273,801 7% 51100.04 Salaries and Wages - Overtime 71 266 - 156 - - - -51100.06 Salaries and Wages - Part-time 28,883 35,993 35,378 17,204 49% 37,586 6% 36,793 4% 52100 FICA 82,406 86,203 93,994 43,062 46% 94,163 0% 100,260 7% 52210 VRS Retirement 124,171 152,871 165,630 82,117 50% 165,630 0% 197,943 20% 52400 Group Life 14,961 14,794 15,990 7,954 50% 15,990 0% 17,069 7% 53300 Repair and Maintenance 1,316 493 1,000 86 9% 1,000 0% 1,000 0% 53600 Advertising 4,188 2,683 4,500 1,268 28% 5,000 11% 5,000 11% 54100 Information Technology 105,243 100,748 131,532 57,251 44% 131,532 0% 146,802 12% 54200 Fleet 8,424 7,734 10,306 3,874 38% 10,306 0% 11,442 11% 54500 Risk Management 132,119 163,947 169,880 84,940 50% 169,880 0% 174,068 2% 55210 Postal Services 129,725 130,757 135,000 105,233 78% 155,000 15% 155,000 15% 55230 Telecommunications 19,931 26,733 29,587 8,573 29% 29,587 0% 29,587 0% 55500 Travel and Training 7,439 9,151 12,000 1,055 9% 12,000 0% 12,000 0% 55810 Dues and Association Memberships 1,590 1,854 2,200 2,004 91% 2,300 5% 2,300 5% 56001 Office Supplies 17,146 17,817 15,000 3,329 22% 15,000 0% 15,000 0% 56012 Books and Subscriptions 5,698 9,300 8,200 2,740 33% 8,200 0% 8,200 0% 56015 Merchandise for Resale 6,386 7,560 16,600 3,156 19% 16,600 0% 16,600 0% 56017 Copier Costs 13,589 16,258 13,605 5,753 42% 13,605 0% 13,605 0% 58200 Capital Outlay - - - - - - - -Total Operating Expenditures $ 1,761,661 $ 1,903,806 $ 2,053,705 $ 994,599 48% $ 2,076,681 1% $ 2,216,471 8% NOTE: Comp Board provides partial salary reimbursement for 11 of 17 full time positions with reimbursement by the State and contribution by the City of the balance annually for operations. Personnel Summary 2021-2022 2022-2023 2023-2024 2024-2025 2024-2025 Range Class Actual Actual Budget Requested Recommended Treasurer 1 1 1 1 1 221 Chief Deputy Treasurer II - Operations 1 1 1 1 1 216 Compliance Manager 1 1 1 1 1 216 Chief Deputy Treasurer I - Operations 1 1 1 1 1 216 Chief Deputy Treasurer I - Accounting 1 1 1 1 1 214 Deputy Treasurer - Accounting 1 1 1 1 1 214 Assistant Compliance Manager 1 1 1 1 1 210 Deputy Treasurer IV 2 - - -210 Customer Service Manager - - 2 2 2 208 Senior Deputy Treasurer - 3 2 2 2 208 Deputy Treasurer III 1 - - -206 Deputy Treasurer II 3 - - -206 Deputy Treasurer - 7 6 6 6 205 Deputy Treasurer I 4 - - -Number of Full-Time Positions 17 17 17 17 17 64
Description
Finance – Administration and Accounting
The Department of Finance provides for the general accounting, budget, payroll, accounts payable, accounts receivable, purchasing, and timely and accurate financial reporting of City funding. The Department is responsible for the issuance of general obligation and revenue bonds and other structure debt, as well as the administration of debt.
To maintain the City’s strong financial position and AAA bond ratings.
To attain an unmodified audit opinion of the City’s financial statements.
To conduct payroll processes in an efficient and effective manner in accordance with state and federal regulations.
To provide fiscal oversight and accountability for all local, state, federal, and private sources of funding received by the City.
To provide financial information and reporting information to Suffolk citizens by publishing the Popular Annual Finance report (PAFR)
Budget Highlights:
Grants Manager position added to address accounting oversight necessary for growth in City grant funds.
Key Measures FY 23 Actual FY 24 Projected FY 25 Estimate Annual Audit Opinion received GFOA Certificate of Excellence in Financial Reporting received Number of transactions processed: Accounts Payable Payroll Value of transactions processed: Accounts Payable Payroll Unmodified 50,954 24 $249M $97.4M Unmodified 45,348 24 $278M $108.7M Unmodified 45,348 24 $278M $108.7M
Target Area FY 25 Objectives Financial Stability
Council
65
Department: Finance - Administration and Accounting Budget Detail 2021-2022 2022-2023 2023-2024 2023-2024 % 2024-2025 % 2024-2025 % Account Number: 100-12420- Actual Actual Budget Exp to Dec Exp Requested Change Recommended Change 51100.02 Salaries and Wages $ 1,030,851 $ 1,101,780 $ 1,228,213 $ 474,327 39% $ 1,325,886 8% $ 1,401,006 14% 51100.04 Salaries and Wages - Overtime 734 146 - 26 - - - -51100.06 Salaries and Wages - Part-time 29,444 4,904 38,611 - 0% 38,611 0% 40,155 4% 52100 FICA 79,100 82,350 96,912 34,991 36% 104,384 8% 110,249 14% 52210 VRS Retirement 124,647 150,976 170,476 67,347 40% 184,033 8% 246,041 44% 52400 Group Life 11,461 14,637 16,458 7,878 48% 17,767 8% 18,773 14% 53100 Professional Services 18,935 6,310 37,149 - 0% 37,149 0% 37,149 0% 53100.02 Accounting and Auditing Services 121,055 124,790 147,200 147,230 100% 183,800 25% 183,800 25% 53200 Temporary Help Service Fees 14,055 112,415 - 92,542 - - - -53500 Printing and Binding 10,957 5,606 14,215 2,481 17% 14,215 0% 14,215 0% 53600 Advertising - 214 200 - - 200 0% 200 0% 54100 Information Technology 77,068 126,025 190,726 49,325 26% 190,726 0% 153,593 -19% 54500 Risk Management 116,402 154,116 159,690 79,845 50% 159,690 0% 163,844 3% 55210 Postal Services 7,843 8,055 7,758 3,794 49% 7,758 0% 7,758 0% 55230 Telecommunications 11,953 13,308 13,198 4,169 32% 13,198 0% 13,198 0% 55500 Travel and Training 11,341 24,618 24,715 4,196 17% 39,022 58% 32,022 30% 55810 Dues and Association Memberships 1,445 4,178 4,435 1,724 39% 4,604 4% 4,604 4% 56001 Office Supplies 7,818 5,436 4,873 2,955 61% 4,873 0% 4,873 0% 56012 Books and Subscriptions 129 178 635 - 0% 1,135 79% 1,135 79% 56017 Copier Costs 7,084 7,419 7,314 2,793 38% 7,314 0% 7,314 0% 58200 Capital Outlay 32,438 2,726 - - - - - -Total Operating Expenditures $ 1,714,759 $ 1,950,187 $ 2,162,778 $ 975,625 45% $ 2,334,365 8% $ 2,439,930 13% Personnel Summary 2021-2022 2022-2023 2023-2024 2024-2025 2024-2025 Range Class Actual Actual Budget Requested Recommended Director of Finance 1 1 1 1 1 223 Assistant Director of Finance 1 1 1 1 1 220 Controller - 1 1 1 1 219 Payroll Manager 1 1 1 1 1 219 Grants Manager - - - 1 1 219 Financial Reporting and Compliance Manager - 1 1 1 1 219 Accounting Manager 1 - - -218 Senior Accountant - - - 3 3 216 Senior Accountant 3 4 4 -215 216 Programmer Analyst 1 1 1 1 1 215 Grants Accountant - 1 1 1 1 214 Accounts Payable Accountant - 1 2 1 1 214 Accountant 3 - - 3 3 208 Payroll Technician 2 2 2 1 1 208 Administrative Specialist - - 1 1 1 207 Senior Accounting Technician 2 1 - -205 Administrative Assistant 1 1 - -Number of Full-Time Positions 16 16 16 17 17 66
Description
The Division of Purchasing provides a centralized system for the management of public funds expended for the procurement of materials, supplies, equipment, professional consulting and other services, and construction. The Division also provides for the transfer or disposal of surplus property and administers the City’s purchasing card program.
Budget Highlights:
Additional Buyer position added to address growth in City bids, request for proposals, and contracted services.
Finance – Purchasing
Key Measures FY 23 Actual FY 24 Projected FY 25 Estimate Number of procurement instruments issued: RFP IFB RFQ Sole Source Number of Purchase Orders Purchase Order modifications Dollar Value of Purchase Orders Purchasing Card transactions Dollar Value of Purchasing Card transactions Surplus Property Revenue 20 46 8 67 971 648 $97.1M 20,985 $7.0M $263,579 28 55 8 70 1,200 650 $150.0M 22,000 $8.0M $350,000 30 60 8 75 1,300 650 $160.0M 23,500 $8.5M $400,000
Council Target Area FY 25 Objectives Financial Stability To monitor and enforce City, state, and federal procurement policies, procedures, laws, and statutes. To maximize vendor participating in City solicitations through increased outreach. To conduct training and education for City employees about purchasing policies, procedures, and statutes. 67
Division: Purchasing (Department of Finance) Budget Detail 2021-2022 2022-2023 2023-2024 2023-2024 % 2024-2025 % 2024-2025 % Account Number: 100-12530- Actual Actual Budget Exp to Dec Exp Requested Change Recommended Change 51100.02 Salaries and Wages $ 232,884 $ 239,505 $ 256,351 $ 120,767 47% $ 304,838 19% $ 326,964 28% 51100.04 Salaries and Wages - Overtime - - - - - - - -51100.06 Salaries and Wages - Part-time - - - - - - - -52100 FICA 17,501 17,521 19,611 8,631 44% 23,320 19% 25,013 28% 52210 VRS Retirement 28,263 33,115 35,582 17,765 50% 42,312 19% 53,176 49% 52400 Group Life 3,037 3,208 3,435 1,724 50% 4,085 19% 4,381 28% 53200 Temporary Help Service Fees - 4,550 - - - - - -53600 Advertising 5,585 1,096 3,000 345 12% 3,000 0% 3,000 0% 54100 Information Technology 23,611 30,627 27,904 12,054 43% 27,904 0% 30,906 11% 54500 Risk Management 31,029 38,619 40,095 20,048 50% 40,095 0% 41,151 3% 55210 Postal Services 165 130 500 65 13% 500 0% 500 0% 55230 Telecommunications 1,504 1,460 4,999 486 10% 4,999 0% 4,999 0% 55500 Travel and Training 2,202 2,462 5,000 403 8% 5,000 0% 5,000 0% 55810 Dues and Association Memberships 7,522 8,654 7,866 6,857 87% 7,866 0% 7,866 0% 56001 Office Supplies 1,817 2,622 3,000 843 28% 3,000 0% 3,000 0% 56012 Books and Subscriptions 1,299 - 1,300 - 0% 1,300 0% 1,300 0% 56017 Copier Costs 2,921 2,870 3,512 1,276 36% 3,512 0% 3,512 0% Total Operating Expenditures $ 359,339 $ 386,439 $ 412,155 $ 191,263 46% $ 471,731 14% $ 510,768 24% Personnel Summary 2021-2022 2022-2023 2023-2024 2024-2025 2024-2025 Range Class Actual Actual Budget Requested Recommended 220 Purchasing Agent 1 1 1 1 1 213 Senior Buyer 1 2 2 2 2 210 Buyer 1 - - 1 1 204 Purchasing Technician 1 1 1 1 1 Number of Full-Time Positions 4 4 4 5 5 68
Registrar
Description
The Registrar is appointed by the City of Suffolk Electoral Board whose three members are appointed by the Circuit Court Judges. The Registrar is responsible for carrying out directives from the State Board of Elections and the Suffolk Electoral Board to ensure all eligible citizens the right to vote. The duties of the Registrar’s Office include arranging and supervising primary, general, and special elections at the local, state, and federal levels, registering voters, and maintaining registration records that reflect up to date information.
Council Target Area FY 25 Objectives
Civic Engagement & Responsive City Services
To conduct elections under guidance of the Electoral Board in accordance with federal, state, and local laws.
To strengthen the Office of the Registrar by providing certified training for staff and implementing an election office employee handbook.
Budget Highlights:
Additional funding for election supplies and rental equipment.
Increased Information Technology maintenance contract costs associated with new voting software purchased in current fiscal year.
Key Measures FY 23 Actual FY 24 Projected FY 25 Estimate Number of registered voters Percent of election results certified within three days Number of polling precincts 72,991 100% 31 77,500 100% 31 80,000 100% 31
69
Department: Registrar Budget Detail 2021-2022 2022-2023 2023-2024 2023-2024 % 2024-2025 % 2024-2025 % Account Number: 100-13200- Actual Actual Budget Exp to Dec Exp Requested Change Recommended Change 51100.02 Salaries and Wages $ 160,580 $ 218,711 $ 246,325 $ 115,892 47% $ 246,325 0% $ 271,914 10% 51100.04 Salaries and Wages - Overtime 21,554 27,586 - 16,342 - - - -51100.06 Salaries and Wages - Part-time 130,803 26,606 36,001 11,115 31% 36,001 0% 37,441 4% 51100.27 Special Compensation 135,068 278,517 538,850 153,736 29% 450,000 -16% 450,000 -16% 52100 FICA 32,493 35,443 62,820 15,384 24% 56,023 -11% 58,091 -8% 52210 VRS Retirement 19,306 29,984 34,190 16,846 49% 34,190 0% 44,447 30% 52400 Group Life 2,115 2,904 3,301 1,634 49% 3,301 0% 3,644 10% 53100 Professional Services - - - - - 93,500 - 93,50053300 Repair and Maintenance 60,825 144,464 127,000 47,283 37% 67,400 -47% 67,400 -47% 53500 Printing & Binding - - - - - 25,000 - 25,00053600 Advertising 2,417 3,148 5,500 - 0% 1,600 -71% 1,600 -71% 54100 Information Technology 34,252 25,511 32,602 12,054 37% 32,602 0% 61,172 88% 54500 Risk Management 24,899 30,636 41,898 20,949 50% 41,898 0% 43,126 3% 55210 Postal Services 46,550 38,767 37,500 22,309 59% 30,000 -20% 30,000 -20% 55230 Telecommunications 10,778 7,770 12,297 2,372 19% 12,297 0% 12,297 0% 55410 Lease/Rent of Equipment 2,769 5,065 4,500 - 0% 10,000 122% 10,000 122% 55420 Lease/Rent of Building 3,750 3,320 15,000 4,950 33% 10,000 -33% 10,000 -33% 55500 Travel and Training 5,439 11,259 12,000 4,870 41% 15,000 25% 15,000 25% 55810 Dues and Association Memberships 730 650 1,000 400 40% 1,000 0% 1,000 0% 56001 Office Supplies 39,091 34,038 20,000 29,149 146% 45,000 125% 45,000 125% 56017 Copier Charges 9,268 6,942 7,196 3,303 46% 7,196 0% 7,196 0% 58200 Capital Outlay 86,139 8,902 26,000 220,452 848% 26,000 0% 26,000 0% Total Operating Expenditures $ 828,826 $ 940,224 $ 1,263,980 $ 699,039 55% $ 1,244,333 -2% $ 1,313,828 4% Personnel Summary 2021-2022 2022-2023 2023-2024 2024-2025 2024-2025 Range Class Actual Actual Budget Requested Recommended General Registrar 1 1 1 1 1 208 Deputy Registrar 1 1 2 2 2 204 Assistant Registrar 1 2 - -202 Absentee Coordinator - - 1 1 1 Number of Full-Time Positions 3 4 4 4 4 70
Circuit Court – Judges
Description
The Circuit Court is the trial court of general jurisdiction in the Commonwealth of Virginia. The Circuit Court has jurisdiction over: 1) Civil Actions involving monetary claims over $4,500, by appeals from the General District Court, by original jurisdiction, and contesting the validity of a City or municipal ordinance or corporate bylaw, and involving equitable proceedings; 2) Criminal Cases including all felonies punishable by confinement in the penitentiary and misdemeanor charges originating from a grand jury indictment or appeal from the General District Court or Juvenile and Domestic Relations District Court, or from state and local administrative agencies or boards. The Circuit Court also handles any case for which jurisdiction is not specified in the Code of Virginia. Additionally, the Circuit Court convenes grand juries to consider bills of indictment charging people with serious crimes. The Circuit Court may also convene special grand juries to investigate criminal activity in the community or malfeasance of governmental agencies or officials.
Budget Highlights:
No significant changes.
71
Department: Circuit Court - Judges Budget Detail 2021-2022 2022-2023 2023-2024 2023-2024 % 2024-2025 % 2024-2025 % Account Number: 100-21100- Actual Actual Budget Exp to Dec Exp Requested Change Recommended Change 51100.02 Salaries and Wages $ 165,309 $ 166,211 $ 247,804 $ 82,794 33% $ 247,804 0% $ 257,716 4% 52100 FICA 12,841 12,801 18,957 6,377 34% 18,957 0% 19,715 4% 52210 VRS Retirement 20,280 23,041 34,395 12,097 35% 34,395 0% 40,225 17% 52400 Group Life 2,179 2,225 3,321 1,168 35% 3,321 0% 3,453 4% 53300 Repair and Maintenance - - 400 - 0% 400 0% 400 0% 54500 Risk Management 15,537 19,370 20,163 10,082 50% 20,163 0% 30,927 53% 55210 Postal Services 554 704 1,200 486 41% 1,200 0% 1,200 0% 55230 Telecommunications 1,996 1,905 3,951 551 14% 3,951 0% 3,951 0% 56001 Office Supplies 766 1,378 2,985 977 33% 2,985 0% 2,985 0% 56012 Books & Subscriptions 392 250 700 115 16% 700 0% 700 0% 56017 Copier 369 490 369 154 42% 369 0% 369 0% 58200 Capital Outlay - - 8,000 - - - -Total Operating Expenditures $ 220,222 $ 228,375 $ 342,245 $ 114,801 34% $ 334,245 -2% $ 361,641 6%
2021-2022 2022-2023 2023-2024 2024-2025 2024-2025 Range Class Actual Actual Budget Requested Recommended 218 Judicial Staff Attorney - - 1 1 1 218 Court Administrator - Civil 1 1 1 1 1 218 Court Administrator - Criminal 1 1 1 1 1 Number of Full-Time Positions 2 2 3 3 3 72
Personnel Summary
General District Court
Description
The General District Court is responsible for the trial of misdemeanor cases, traffic infractions, preliminary hearings in felony matters, and civil cases and suits up to $15,000. The General District Court has three divisions (criminal, traffic, and civil) and is responsible for maintaining the records and accounts of each of these divisions.
Budget Highlights:
Slight increase in funding for Court Appointed Attorney expenses.
Increased capital outlay funding for furniture replacement.
73
Department: General District Court Budget Detail 2021-2022 2022-2023 2023-2024 2023-2024 % 2024-2025 % 2024-2025 % Account Number: 100-21200- Actual Actual Budget Exp to Dec Exp Requested Change Recommended Change 53100 Professional Services $ 3,994 $ 1,520 $ 5,000 $ 460 9% $ 5,000 0% $ 5,000 0% 53100.10 Court Appointed Attorney Fees 38,793 65,333 45,000 3,962 9% 50,000 11% 50,000 11% 53300 Repair & Maintenance - - - - - - - -55230 Telecommunications 3,685 3,516 3,051 1,018 33% 3,051 0% 3,051 0% 55410 Lease/Rent of Equipment 1,305 1,585 2,500 740 30% 2,500 0% 2,500 0% 55500 Travel and Training - - 4,500 - 0% 4,500 0% 4,500 0% 55810 Dues and Association Memberships 285 - 1,500 300 20% 1,500 0% 1,500 0% 56001 Office Supplies 3,789 5,056 5,000 3,955 79% 10,000 100% 10,000 100% 56011 Uniforms & Wearing Apparel - 57 - - - - - -56012 Books and Subscriptions 1,617 5,559 7,000 1,896 27% 7,000 0% 7,000 0% 56017 Copier 3,951 4,426 3,695 1,447 39% 3,695 0% 3,695 0% 58200 Capital Outlay 3,482 - 10,000 2,139 21% 20,000 100% 20,000 100% Total Operating Expenditures $ 60,901 $ 87,053 $ 87,246 $ 15,917 18% $ 107,246 23% $ 107,246 23% 74
Magistrate’s Office
Description
The Magistrate’s Office serves as an immediate buffer between law enforcement and citizens and can authorize or deny law enforcement the ability to detain individuals suspected of crimes. In addition, the Magistrate provides services in disputes involving citizens versus citizens. These functions are available 24 hours per day. The Magistrate conducts hearings as the first step in the legal process to determine whether there is probable cause to move forward in one of the following statutory procedures: to issue arrest or search warrants in criminal cases; to issue a temporary detention order in either civil, medical, or criminal cases; or to authorize pretrial seizures in civil matters. Where individuals have been arrested, Magistrates are called upon to conduct bail hearings to determine whether they should be committed to jail or released, and, if released, the conditions of release. Magistrates preside over hearings, maintain order and proper decorum, administer oaths, define issues, interpret and explain pertinent laws, take testimony, question parties, and issue or decline to issue the legal process requested.
To conduct neutral and impartial hearings for both the public and law enforcement related to arrests, searches, emergency protective orders, bail, emergency custody orders, and temporary detention orders.
To work effectively with the community served by the Magistrate’s Office including judges, clerks, law enforcement agencies, jails, community services boards, and the citizens of the Fifth Judicial District.
To engage in continuing legal education and training of all staff members as well as local law enforcement agencies.
To provide a safe environment where stakeholders can access judicial services.
Budget Highlights:
Area
No significant changes. Council Target
FY 25 Objectives
Civic Engagement & Responsive City Services
Key Measures CY 21 Actual CY 22 Actual CY 23 Actual Number of arrest warrants and summonses issued Number of search warrants issued Number of emergency custody and temporary detention orders issued Number of emergency protective orders issued Number of commitments, recognizances, and releases issued Number of total processes Total amount of cash bonds processed 6,579 789 969 1,606 6,874 16,817 $74,750 6,464 866 968 1,508 6,962 16,768 $104,000 6,600 979 1,035 1,447 7,284 17,345 $82,600 75
Department: Magistrate Budget Detail 2021-2022 2022-2023 2023-2024 2023-2024 % 2024-2025 % 2024-2025 % Account Number: 100-21300- Actual Actual Budget Exp to Dec Exp Requested Change Recommended Change 53300 Repair and Maintenance $ - $ - $ 400 $ - 0% $ 400 0% $ 400 0% 55230 Telecommunications 1,075 1,026 1,387 297 21% 1,387 0% 1,387 0% 55420 Lease/Rent of Building 9,000 9,000 9,000 4,500 50% 9,000 0% 9,000 0% 55810 Dues and Association Memberships - 200 500 - 0% 500 0% 500 0% 56001 Office Supplies 2,104 1,841 2,000 372 19% 2,200 10% 2,200 10% 56017 Copier Costs 1,546 1,680 1,588 654 41% 1,588 0% 1,588 0% 58200 Capital Outlay - 717 3,100 - - - - -Total Operating Expenditures $ 13,725 $ 14,463 $ 17,975 $ 5,824 32% $ 15,075 -16% $ 15,075 -16% 76
Juvenile and Domestic Relations Court
Description
The Juvenile and Domestic Relations District Court has jurisdiction in matters involving juvenile delinquency, juvenile traffic infractions, adult criminal matters with a juvenile victim, children subjected to abuse or neglect, family abuse, family or household members charged with an offense against a family or household member, protective orders, child and/or spousal support, custody and/or visitation issues, abandonment of children, foster care and entrustment agreements, court-ordered rehabilitative services, court consent for certain medical treatments, commitment of mentally ill or retarded children, petitions filed by school boards against parents, and judicial by-pass for authorization of abortions by minors. The Juvenile and Domestic Relations District Court Clerk’s Office is the administrative arm of the court. The Clerk of Court is the court’s chief administrative officer and is accountable to the presiding judges for all office functions, including personnel matters, finance, court housekeeping, maintenance of court records and information systems, assisting with outside liaison, preparation of budgets, and conducting research and planning in relation to court operations.
Budget Highlights:
No significant changes.
77
Department: Juvenile and Domestic Relations District Court Budget Detail 2021-2022 2022-2023 2023-2024 2023-2024 % 2024-2025 % 2024-2025 % Account Number: 100-21610- Actual Actual Budget Exp to Dec Exp Requested Change Recommended Change 53100.10 Court Appointed Attorney Fees $ 332 $ - $ 600 $ - 0% $ 600 0% $ 600 0% 53300 Repair & Maintenance - - - - - - - -55230 Telecommunications 3,672 3,370 8,386 975 12% 9,000 7% 8,386 0% 55410 Lease/Rent of Equipment 662 751 400 291 73% 400 0% 400 0% 55500 Travel & Training - - 400 - 0% 400 0% 400 0% 55810 Dues and Association Memberships - 150 400 175 44% 400 0% 400 0% 56001 Office Supplies 5,917 5,914 5,000 3,021 60% 6,000 20% 6,000 20% 56012 Books and Subscriptions 559 523 500 552 110% 600 20% 600 20% 56017 Copier Costs 2,205 2,554 2,253 896 40% 2,253 0% 2,253 0% Total Operating Expenditures $ 13,347 $ 13,261 $ 17,939 $ 5,910 33% $ 19,653 10% $ 19,039 6% 78
Court Service Unit
Description
The Fifth District Court Service Unit is a local organizational unit of the Virginia Department of Juvenile Justice which aims to protect the public through a balanced approach of accountability and comprehensive services that prevent and reduce delinquency through partnerships with families, schools, communities, law enforcement, and others, while providing opportunities for delinquency youth to become responsible and productive citizens.
Council Target Area
Civic Engagement & Responsive City Services
FY 25 Objectives
To reduce recidivism of youth involved in the Suffolk Juvenile and Domestic Relations Court and strengthen community safety.
To maintain effective partnerships with local agencies including law enforcement by responding promptly to requests for collaboration, questions, and information.
To exceed 98% compliance per Department of Juvenile Justice standards for probation, parole, and direct care case contact.
To divert eligible and appropriate intake matters away from the court and to agencies that can better address their needs.
To improve retention of staff and develop a highly proficient unit.
Budget Highlights:
Increased funding required for juvenile detention placements at Merrimac and James River Detention Centers. Less costly Chesapeake Juvenile Detention Center is no longer accepting juvenile detention placements from localities outside of Chesapeake.
Key Measures FY 23 Actual FY 24 Projected FY 25 Estimate Number of juveniles receiving services Number of juveniles placed in secure detention Average Length of Stay in secure detention Percent of juvenile intakes diverted to in-house diversion program or Juvenile Conference Committee 444 82 23 days 16% 550 100 30 days 20% 550 100 30 days 20% 79
Department: Court Services Unit Budget Detail 2021-2022 2022-2023 2023-2024 2023-2024 % 2024-2025 % 2024-2025 % Account Number: 100-21650- Actual Actual Budget Exp to Dec Exp Requested Change Recommended Change 53845 Juvenile Detention Costs $ 840,259 $ 791,026 $ 969,725 $ 656,306 68% $ 1,450,000 50% $ 1,450,000 50% 55230 Telecommunications 2,610 2,491 4,160 721 17% 4,160 0% 4,160 0% 58200 Capital Outlay-Additions 4,764 - - - - - - -Total Operating Expenditures $ 847,633 $ 793,516 $ 973,885 $ 657,027 67% $ 1,454,160 49% $ 1,454,160 49% 80
Description
The Clerk of the Circuit Court is required by 15.2-1600 of the Code of Virginia and the Rules of the Supreme Court of Virginia. The Clerk of Court is charged with the custody, safekeeping, and proper indexing of legal and quasi-legal papers deposited in the Clerk’s Office. The Clerk's Office is responsible for the filing of civil suits, docketing and filing of criminal actions, and the filing of divorce suits and adoption petitions. Additional services provided by the Clerk's Office include recording land records and plats, probating wills, administering various oaths' of office, issuing marriage licenses, recording military discharge forms (DD-214's), and recording assumed business names. The Clerk is also an acceptance agent for the U.S. Department of State and accepts passports applications on its behalf.
Budget Highlights:
No significant changes. Council Target
To collect taxes and fees associated with the legal recordation of land records and complete turnaround documents within 24 hours of presentation.
To perform all 800 plus mandated duties placed upon the Clerk within the guidelines established by the Code of Virginia.
To provide direct administrative support to the judges in court proceedings with 100% accuracy.
Clerk of the Circuit Court
Area
Services
FY 25 Objectives Civic Engagement & Responsive City
Key Measures CY 21 Actual CY 22 Actual CY 23 Actual Criminal Cases commenced Civil Cases commenced Wills/Estates initiated Judgments Deed/Land Instruments Finance Statements Fictitious Names Marriage License Notary Qualifications Concealed Handgun Applications Passport Application 2,865 1,211 492 5,843 23,845 563 0 401 530 1,978 1,036 2,557 1,194 490 5,056 17,529 748 3 420 485 2,153 1,610 3,413 1,322 468 5,352 13,521 487 0 375 429 2,110 1,896 81
NOTE: Comp Board provides partial salary reimbursement for 12 of 16 full time positions with reimbursement by the State and contribution by the City of the balance annually for operations.
Department: Clerk of the Circuit Court Budget Detail 2021-2022 2022-2023 2023-2024 2023-2024 % 2024-2025 % 2024-2025 % Account Number: 100-21710- Actual Actual Budget Exp to Dec Exp Requested Change Recommended Change 51100.02 Salaries and Wages $ 894,360 $ 957,286 $ 1,008,881 $ 468,151 46% $ 1,048,699 4% $ 1,084,499 7% 51100.04 Salaries and Wages - Overtime 56 - - - - - - -51100.06 Salaries and Wages - Part-time 86,031 97,850 112,823 47,864 42% 119,343 6% 121,319 8% 52100 FICA 72,571 77,631 85,810 37,966 44% 89,355 4% 92,245 7% 52210 VRS Retirement 109,566 131,993 140,033 68,140 49% 145,559 4% 169,560 21% 52400 Group Life 11,866 12,779 13,519 6,599 49% 14,053 4% 14,532 7% 53100 Professional Services 15,200 20,205 5,000 - 0% 5,000 0% 5,000 0% 53100.10 Legal Services - Court Appointed 7,891 12,166 10,000 1,896 19% 10,000 0% 10,000 0% 53100.16 Legal Services - Jurors 26,029 45,754 97,000 43,439 45% 97,000 0% 97,000 0% 53300 Repair and Maintenance 21,000 21,000 22,500 - 0% 22,500 0% 22,500 0% 53320 Maintenance Service Contracts - - - 2,247 - - - -54100 Information Technology 220,592 218,846 256,120 87,574 34% 256,120 0% 275,274 7% 54500 Risk Management 116,434 144,491 159,771 79,886 50% 159,771 0% 163,897 3% 55210 Postal Services 14,000 13,999 14,000 6,000 43% 16,000 14% 16,000 14% 55230 Telecommunications 12,679 6,844 27,576 2,112 8% 27,576 0% 27,576 0% 55410 Lease/Rent of Equipment 3,141 3,141 3,141 785 25% 3,500 11% 3,500 11% 55500 Travel and Training 1,117 1,416 2,500 803 32% 2,500 0% 2,500 0% 55810 Dues and Association Memberships 765 792 765 380 50% 1,875 145% 1,875 145% 56001 Office Supplies 14,245 18,614 15,000 6,146 41% 18,000 20% 18,000 20% 56012 Books and Subscriptions 407 414 965 55 6% 460 -52% 460 -52% 56017 Copier Costs 24,247 25,031 27,863 9,436 34% 27,863 0% 28,298 2% 58110 Capital Outlay-TTF 6,970 - - - - - - -58200 Capital Outlay 20,283 8,126 12,500 10,778 86% 7,000 -44% 4,000 -68% Total Operating Expenditures $ 1,679,449 $ 1,818,378 $ 2,015,766 $ 880,258 44% $ 2,072,174 3% $ 2,158,034 7% Personnel Summary 2021-2022 2022-2023 2023-2024 2024-2025 2024-2025 Range Class Actual Actual Budget Requested Recommended Clerk of the Circuit Court 1 1 1 1 1 222 Chief Deputy Court Clerk 1 1 1 1 1 210 218 Court Liaison Administrator - 1 1 1 1 210 Deputy Court Senior Accountant 1 1 1 1 1 209 Senior Deputy Court Clerk 3 2 2 2 2 205/206/208 Deputy Court Clerk I-III 9 10 10 11 10 Number of Full-Time Positions 15 16 16 17 16
82
Sheriff Description
The Sheriff’s Department performs the duties for civil process ordered by the Courts and provides security for the Courthouse and all courts while in session. The Sheriff’s Department may provide transportation for certain juvenile prisoners awaiting trial or commitment to state facilities and adult citizens under temporary detention orders or civil commitment to a state hospital.
Budget Highlights:
Additional Deputy Sheriff II position added due to increased juvenile and mental health transports, high security court hearings, protective orders, and evictions.
Funding added for deputy bullet proof vest replacements.
Council Target Area FY 25 Objectives Public Safety To enhance the safety and security of the Mills E. Godwin Courts Complex for citizens, Sheriff’s Office employees, victims, and other stakeholders. To promote a safe, healthy, and diverse community by providing public education information to citizens that focuses on crime awareness and civic engagement. Key Measures CY 21 Actual CY 22 Actual CY 23 Estimate Number of civil enforcement contacts and papers executed Number of security searches conducted at the court building entrance Number of inmates held in court building lock up High Risk Court Hearings Transportation mileage Number of staffing hours on transports Number of protective orders served Number of training hours for office personnel 43,102 117,000 2,245 12 18,523 809 679 2,482 58,000 135,000 3,300 23 29,700 1,128 741 1,702 69,000 140,000 3,600 30 33,000 1,300 864 2,100 83
Department: Sheriff Budget Detail 2021-2022 2022-2023 2023-2024 2023-2024 % 2024-2025 % 2024-2025 % Account Number: 100-21810- Actual Actual Budget Exp to Dec Exp Requested Change Recommended Change 51100.02 Salaries and Wages $ 1,809,990 $ 2,075,783 $ 2,034,990 990,020 49% $ 2,135,301 5% $ 2,256,940 11% 51100.04 Salaries and Wages - Overtime 77,466 17,514 - 8,416 - - -51100.06 Salaries and Wages - Part-time 401,242 383,460 474,055 169,129 36% 474,055 0% 493,017 4% 52100 FICA 170,755 182,948 191,942 85,897 45% 199,616 4% 210,372 10% 52210 VRS Retirement 205,385 259,921 282,457 139,635 49% 296,380 5% 331,146 17% 52400 Group Life 17,363 25,099 27,269 13,486 49% 28,613 5% 30,243 11% 53100 Professional Services - - 1,000 - 0% 1,000 0% 1,000 0% 53600 Advertising 119 168 500 44 9% 500 0% 500 0% 54100 Information Technology 351,288 324,228 415,877 205,977 50% 415,877 0% 429,716 3% 54200 Fleet 135,379 144,260 143,522 65,261 45% 143,522 0% 208,217 45% 54500 Risk Management 271,066 291,121 317,382 158,691 50% 317,382 0% 348,641 10% 55210 Postal Services 5,078 5,500 5,700 5,081 89% 5,700 0% 5,700 0% 55230 Telecommunications 19,048 20,004 22,827 6,427 28% 22,827 0% 22,827 0% 55410 Lease/Rent of Equipment 735 735 3,000 367 12% 3,000 0% 3,000 0% 55500 Travel and Training 9,830 16,909 17,000 9,206 54% 19,500 15% 19,000 12% 55810 Dues and Association Memberships 3,267 3,321 5,560 2,682 48% 6,140 10% 6,100 10% 56001 Office Supplies 9,536 7,699 8,000 3,444 43% 8,500 6% 8,500 6% 56011 Uniforms & Wearing Apparel 31,065 33,977 40,600 15,937 39% 86,872 114% 78,186 93% 56012 Books and Subscriptions 666 1,527 750 339 45% 1,550 107% 1,550 107% 56014 Other Operating Supplies 35,629 22,956 31,000 3,281 11% 31,000 0% 31,000 0% 56017 Copier Costs 8,711 10,665 8,581 3,851 45% 8,581 0% 8,581 0% 58200 Capital Outlay - 8,370 - - - - - -Total Operating Expenditures $ 3,563,618 $ 3,836,164 $ 4,032,012 $ 1,887,172 47% $ 4,205,916 4% $ 4,494,237 11% NOTE: Comp Board provides partial salary reimbursement for 21 of 31 full time positions with reimbursement from the State and contribution by the City of the balance annually for operations. Personnel Summary 2021-2022 2022-2023 2023-2024 2024-2025 2024-2025 Range Class Actual Actual Budget Requested Recommended Sheriff 1 1 1 1 1 S308 Chief Deputy Sheriff 1 1 1 1 1 S306 Deputy Sheriff - Captain 1 1 1 1 1 S305 Deputy Sheriff - Lieutenant 1 1 1 1 1 S304 Deputy Sheriff - Sergeant 5 5 5 5 5 S301/S302/S303 Deputy Sheriff I-III 16 16 18 20 19 214 Administrative Analyst - - 1 1 1 210 Community Outreach Coordinator 1 1 1 1 1 208 Accreditation Manager 1 1 1 1 1 202 Office Assistant - 1 - -Number of Full-Time Positions 27 28 30 32 31 84
Description
Commonwealth’s Attorney
The Office of the Commonwealth’s Attorney prosecutes criminal offenses in the City of Suffolk. The Office prosecutes cases in the Juvenile and Domestic Relations Court, the General District Court, and the Circuit Court. It also prepares briefs for the Virginia Court of Appeals and the Virginia Supreme Court. In addition, the Office investigates cases and advises other City law enforcement personnel during investigations as to the substance and procedure of the criminal law. The Office also issues opinions on conflict of interest matters and is responsible for the collection of unpaid fines and court costs. In addition to prosecuting felony cases, the Office also prosecutes all misdemeanor cases in which a crime victim requests assistance, all drunk driving cases, certain domestic violence cases, all crimes that occur in schools, and all misdemeanor and traffic appeals to Circuit Court including violations of local ordinances.
Council Target Area FY 25 Objectives
Public Safety
To continue working with law enforcement partners to reduce gun, drug, and gang crime.
To promote community outreach and awareness and crime prevention by attending or hosting 100 community events.
To provide over 50 hours of training to police officers, fire and rescue, and other law enforcement agency personnel.
Key Measures
Budget Highlights:
Administrative Assistant position added to free up legal assistants to focus time on assisting attorneys with case work and trial preparation.
FY 23 Actual FY 24 Projected FY 25 Estimate Circuit Court defendants prosecuted Circuit Court indictments prosecuted Number of victims and witnesses assisted Number of community outreach events attended/hosted Number of hours of instruction provided to local law enforcement Number of misdemeanor cases prosecuted (excluding domestic violence and related charges) 699 1,614 9,881 187 50 525 710 1,634 9,981 190 55 551 720 1,664 10,081 195 58 578 85
Department: Commonwealth's Attorney Budget Detail 2021-2022 2022-2023 2023-2024 2023-2024 % 2024-2025 % 2024-2025 % Account Number: 100-22100- Actual Actual Budget Exp to Dec Exp Requested Change Recommended Change 51100.02 Salaries and Wages $ 2,306,859 $ 2,453,131 $ 2,559,554 $ 1,161,176 45% $ 2,680,237 5% $ 2,626,835 3% 51100.04 Salaries and Wages - Overtime 948 324 - 144 - - - -51100.06 Salaries & Wages - Part-time 120,113 137,819 126,176 60,313 48% 126,176 0% 131,223 4% 52100 FICA 179,117 184,843 205,458 93,849 46% 214,691 4% 210,991 3% 52210 VRS Retirement 277,538 335,378 355,266 170,021 48% 372,017 5% 419,497 18% 52400 Group Life 29,814 32,500 34,298 16,565 48% 35,915 5% 35,200 3% 53100 Professional Services 209 1,011 3,500 282 8% 3,500 0% 3,500 0% 53300 Repair and Maintenance - - 3,120 - 0% 3,120 0% 3,120 0% 53600 Advertising 159 507 500 44 9% 500 0% 500 0% 54100 Information Technology 251,175 189,433 548,708 143,012 26% 566,230 3% 317,458 -42% 54200 Fleet 19,607 13,544 14,700 7,113 48% 14,700 0% 5,838 -60% 54500 Risk Management 203,000 252,509 260,870 130,435 50% 260,870 0% 266,814 2% 55210 Postal Services 5,934 7,334 6,500 469 7% 6,500 0% 6,500 0% 55230 Telecommunications 25,280 20,168 35,689 5,489 15% 35,689 0% 35,689 0% 55500 Travel and Training 7,190 4,680 7,230 3,459 48% 7,780 8% 7,680 6% 55810 Dues and Association Memberships 10,735 12,320 13,000 2,250 17% 14,165 9% 14,125 9% 55854 Asset Forfeiture - State - - - - - - - -55855 Asset Forfeiture - Federal - - - - - - - -56001 Office Supplies 32,432 22,223 21,000 5,015 24% 21,400 2% 21,200 1% 56012 Books and Subscriptions 8,505 11,355 10,694 7,236 68% 14,009 31% 13,972 31% 56014 Other Operating Supplies - 1,113 - - - - - -56017 Copier 31,096 35,390 38,648 17,014 44% 38,648 0% 38,648 0% 58200 Capital Outlay - - - - - - - -Total Operating Expenditures $ 3,509,711 $ 3,715,581 $ 4,244,911 $ 1,823,885 43% $ 4,416,147 4% $ 4,158,791 -2% NOTE: Comp Board provides partial salary reimbursement for 17 of 27 full time positions with reimbursement from the State and contribution by the City of the balance annually for operations. Personnel Summary 2021-2022 2022-2023 2023-2024 2024-2025 2024-2025 Range Class Actual Actual Budget Requested Recommended Commonwealth's Attorney 1 1 1 1 1 Deputy Commonwealth's Attorney 4 4 3 3 3 222 Chief Administrative Manager 1 1 1 1 1 218/221/222 Assistant Commonwealth's Attorney I-III 10 10 11 12 11 219 Chief Investigator 1 1 1 1 1 210 Legal Services Coordinator - 1 1 1 1 210 Community Outreach Coordinator 1 1 1 1 1 208 Legal Assistant 8 7 7 7 7 205 Administrative Assistant - - - 1 1 202 Office Assistant - - - 1Number of Full-Time Positions 26 26 26 29 27 86
Police Department
Description
The Suffolk Police Department is committed to law enforcement excellence and public service through partnership with the community. The Department seeks to improve the quality of life for citizens by focusing on the primary responsibilities of suppression of crime, apprehension of criminal offenders, and recovery of property, while providing proactive crime prevention and community policing services.

To maintain Commission on the Accreditation of Law Enforcement Agencies (CALEA) accreditation for the Police Department and accreditation in the area of forensics.
To enhance training in the area of crisis intervention training or mental health first aid to all police officers.
To provide community outreach programs through senior police academy, open house events, Explorer program, youth public safety academy, civic league participation, and other special events throughout the year.
To utilize technology to reduce criminal activity, solve crime, and reduce traffic collisions.
Budget Highlights:
Five new Police Officers, a Canine Officer, and Police Captain.
Advertising funding added to enhance recruiting efforts.
Increase in operating lines for uniforms and wearing apparel, travel and training, supplies, and equipment needs.
FY
Public Safety
Council Target Area
25 Objectives
To track and maintain adequate response times to calls for service utilizing technology to minimize such response times.
Key Measures FY 23 Actual FY 24 Projected FY 25 Estimate Average Response Times: Priority 1 Calls Priority 2 Calls Priority 3 Calls Clearance Rate (Part I Offenses) Motor Vehicle and Traffic Enforcement Traffic Citations DUI Arrests Motor Vehicle Crashes Traffic Fatalities 6.38 21.59 38.49 28% 7,378 168 2,158 9 5.99 21.50 23.76 27% 6,082 136 2,061 12 5.99 23.39 19.94 28% 5,305 107 2,058 12 87
Department: Police Budget Detail 2021-2022 2022-2023 2023-2024 2023-2024 % 2024-2025 % 2024-2025 % Account Number: 100-31100- Actual Actual Budget Exp to Dec Exp Requested Change Recommended Change 51100.02 Salaries and Wages $ 11,696,541 $ 13,042,562 $ 15,229,915 $ 6,524,433 43% $ 16,652,673 9% $ 17,142,508 13% 51100.04 Salaries and Wages - Overtime 2,573,976 2,589,111 1,166,522 1,161,984 100% 1,166,522 0% 1,166,522 0% 51100.06 Salaries and Wages - Part-time 324,449 402,437 455,965 215,251 47% 600,320 32% 474,203 4% 52100 FICA 1,088,801 1,190,937 1,289,209 582,581 45% 1,409,093 9% 1,436,917 11% 52210 VRS Retirement 1,381,147 1,722,159 2,091,336 881,041 42% 2,311,391 11% 2,476,920 18% 52400 Group Life 152,269 166,414 204,081 85,143 42% 223,146 9% 229,710 13% 53000.16 Purchased Services - Refuse Collection 606 606 511 303 59% 511 0% 511 0% 53100 Professional Services 265,120 322,726 360,230 198,639 55% 405,443 13% 405,443 13% 53300 Repair and Maintenance 19,103 23,980 53,260 11,050 21% 61,260 15% 61,260 15% 53500 Printing and Binding 3,826 8,478 11,737 983 8% 11,737 0% 11,737 0% 53600 Advertising - - - - - 150,000 - 150,00054100 Information Technology 3,698,502 3,268,629 3,907,460 2,320,312 59% 3,907,460 0% 4,863,229 24% 54200 Fleet 1,777,748 1,937,152 2,113,645 911,859 43% 2,113,645 0% 2,980,342 41% 54500 Risk Management 2,279,731 2,814,357 2,989,757 1,494,878 50% 2,989,757 0% 3,084,661 3% 55100 Utilities 144,787 172,344 160,000 78,363 49% 160,000 0% 160,000 0% 55210 Postal Services 5,993 6,339 8,000 3,414 43% 8,000 0% 8,000 0% 55230 Telecommunications 252,039 253,787 364,860 88,355 24% 364,860 0% 364,860 0% 55410 Lease/Rent of Equipment 78,947 89,031 246,987 49,095 20% 391,387 58% 391,387 58% 55500 Travel and Training 222,239 244,949 354,000 156,929 44% 420,910 19% 420,910 19% 55810 Dues and Association Memberships 2,175 3,420 5,106 615 12% 5,106 0% 5,106 0% 55842 Rewards 7,391 22,000 25,000 10,851 43% 40,000 60% 40,000 60% 56001 Office Supplies 26,443 29,995 43,000 17,239 40% 45,000 5% 43,000 0% 31700-56007 Property Seizure 20,709 (32,487) - - - - - -31705-58200 E-Ticking Fee 2,915 3,026 - - - - - -31710-56007 Confiscation Program - 17,846 - - - - - -56011 Uniforms & Wearing Apparel 163,794 205,331 335,300 132,063 39% 412,100 23% 412,100 23% 56012 Books and Subscriptions 970 1,449 2,000 1,606 80% 2,000 0% 2,000 0% 56014 Other Operating Supplies 150,812 161,505 362,133 157,099 43% 378,333 4% 378,333 4% 31715-56014 DARE - - - - - - - -56017 Copier Costs 53,474 58,372 56,457 23,833 42% 56,457 0% 56,457 0% 56026 Special Events 21,266 34,718 47,940 18,936 39% 65,940 38% 65,940 38% 58200 Capital Outlay 43,309 636,691 306,100 133,112 43% 350,750 15% 350,750 15% Total Operating Expenditures $ 26,459,081 $ 29,397,864 $ 32,190,510 $ 15,259,966 47% $ 34,703,801 8% $ 37,182,807 16% 53100 - Professional Services: Promotional assessment, polygraph, medical/psych./fitness for duty Evals; false alarm billing services; PPE testing; CALEA Accred.; vet services; biohazard disposals. 55500 - Travel & Training: HRCJA training of new officers; recertification of officers; specialized training for officers 56014 - Other Operating Supplies: ammunition, dog food, recruiting and safety supplies, crime scene processing materials. Department: Police Personnel Summary 2021-2022 2022-2023 2023-2024 2024-2025 2024-2025 Range Class Actual Actual Budget Requested Recommended Chief of Police 1 1 1 1 1 P308 Deputy Chief of Police 3 3 3 3 3 P307 Police Captain 5 5 5 6 6 P306 Police Lieutenant 10 10 11 11 11 P305 Police Sergeant 24 24 25 25 25 P301/P302 P303/P304 Police Recruit/Police Officer/Senior Police Officer/Master Police Officer 157 156 155 169 160 219 Mental Health Consultant Wellness Coordinator - 1 1 1 1 217 Public Information Officer - - 1 1 1 217 Police Planner 1 1 1 1 1 215 Forensic Supervisor 1 1 1 1 1 214 Administrative Analyst 1 1 1 1 1 211 Records Management Supervisor 1 1 1 1 1 211 Crime Analyst - - - 2 2 210 Forensic Technician - - - 5 5 210 Crime Analyst 2 2 2 -210 Community Outreach Coordinator - - - 1 1 208 Police Logistics Support Operator - - 1 1 1 208 Forensic Technician 4 5 5 -208 Administrative Specialist 1 1 1 1 1 208 Accounting Associate 1 1 1 1 2 206 Marketing Specialist 1 1 1 1 1 205 Quartermaster - - 1 1 1 205 Police Records Technician 13 16 16 16 15 205 Administrative Assistant 1 1 1 1 1 204 Staff Support Assistant 1 1 1 1 1 204 Accounting Technician 1 1 1 1 1 Number of Full-Time Positions 229 233 237 253 244 88
Description
Police Department – Emergency Communications
The Police – Emergency Communications Division is the Public Safety Answering Point (PSAP) for all landline and wireless nonemergency and 911 calls. The Division receives and dispatches all police and fire and rescue related calls, monitors, and dispatches on-call City agencies, state police, and state game commission agencies. In addition, the Division furnishes information from the National Crime Information Center and Virginia Criminal Information Network relating to wanted persons, license checks, and general broadcasts from all criminal justice agencies across the nation.
Council Target Area FY 25 Objectives
Public Safety
To maintain accreditation for emergency communications through the Commission on the Accreditation of Law Enforcement Agencies (CALEA).
To provide a high level of customer service to citizens and other departments within the City.
To implement Level 1 and Level 2 of the Marcus Alert System.
To make progress on the upgrade of the Computer Aided Dispatch (CAD) and Records Management System (CMS).
To leverage advancements in technology to reduce call processing and dispatch time.
Budget Highlights:
Two call taker positions added to address non-emergency calls.
Four communication operator positions added to address growth in calls for service and anticipated increase in calls with the implementation of the Marcus Alert program.
Key Measures FY 23 Actual FY 24 Projected FY 25 Estimate Calls for Service (Police): Self-Initiated calls received from officers Calls from citizens Calls for Service (Fire & EMS) Self-Initiated calls received from officers Calls from citizens Number of calls reviewed by supervisors Percent of reviewed calls meeting or exceeding expectations 75,607 43,870 1,077 17,989 330 95% 56,813 44,525 1,140 18,767 368 96% 44,404 44,208 1,240 19,725 399 97% 89
Division: Police Emergency Communications (Department of Police) Budget Detail 2021-2022 2022-2023 2023-2024 2023-2024 % 2024-2025 % 2024-2025 % Account Number: 100-31400- Actual Actual Budget Exp to Dec Exp Requested Change Recommended Change 51100.02 Salaries and Wages $ 839,319 $ 1,119,028 $ 1,681,419 $ 639,264 38% $ 1,953,655 16% $ 2,189,141 30% 51100.04 Salaries and Wages - Overtime 262,283 250,865 24,857 154,334 621% 50,000 101% 24,857 0% 51100.06 Salaries and Wages - Part-time 54,606 84,179 33,255 40,628 122% 194,744 486% 34,585 4% 52100 FICA 86,501 108,297 133,074 66,723 50% 168,178 26% 172,017 29% 52210 VRS Retirement 97,791 139,742 228,617 88,291 39% 271,167 19% 358,998 57% 52400 Group Life 11,645 13,474 22,531 8,580 38% 26,179 16% 29,334 30% 53100 Professional Services 5,231 8,756 18,850 3,657 19% 24,975 32% 24,975 32% 53300 Repair and Maintenance - - 2,500 877 35% 5,000 100% 5,000 100% 54500 Risk Management 224,269 279,117 289,021 144,511 50% 289,021 0% 306,731 6% 55230 Telecommunications 74,290 71,657 114,041 20,247 18% 114,041 0% 114,041 0% 55500 Travel and Training 8,105 10,004 11,835 7,857 66% 21,610 83% 21,610 83% 55810 Dues and Association Memberships 238 176 300 - 0% 300 0% 300 0% 56011 Uniforms & Wearing Apparel 5,381 5,292 15,531 1,518 10% 22,209 43% 22,209 43% 56014 Other Operating Supplies 1,002 4,236 6,000 571 10% 7,000 17% 7,000 17% 58200 Capital Outlay - - 25,000 13,608 54% 153,000 512% 153,000 512% Total Operating Expenditures $ 1,670,661 $ 2,094,824 $ 2,606,831 $ 1,190,666 46% $ 3,301,079 27% $ 3,463,797 33% Personnel Summary 2021-2022 2022-2023 2023-2024 2024-2025 2024-2025 Range Class Actual Actual Budget Requested Recommended P306 Police Lieutenant - - - 1 1 216 PSAP Manager 1 1 1 -213 Communications Lead Operator 5 5 5 5 5 212 Senior Communications Operator - 9 15 15 15 210 Communications Operator 23 14 9 13 13 204 Call Taker - - - 2 2 Number of Full-Time Positions 29 29 30 36 36 90
Description
The Animal Shelter Management Division of the Suffolk Police Department investigates all reports concerning domestic animals within the City, provides 24 hour services for emergency situations involving animals, houses and cares for all animals coming into the facility in accordance with the Code of Virginia, implements an adoptive and redemptive services program, and educates citizens regarding domestic animal laws and regulations.
Council Target Area
Civic Engagement & Responsive City Services
FY 25 Objectives
To increase the number of adoptions and redemptions.
To increase animal transfers through coordination with rescue organizations.
To increase adoption events provided throughout the year.
To utilize social media to provide public information on prevailing animal control challenges, advertise adoptions, and located animals.
To enhance training for all animal shelter and animal control staff.
Budget Highlights:
Animal control officer and animal caretaker positions provided to address increase in number of calls for service and animal shelter workload.
Police Department – Animal Shelter
Measures FY 23 Actual FY 24 Projected FY 25 Estimate Number of adoptions Number of redemptions Number of transfers Number of animal foster homes Citizen calls for service Self-Initiated calls for service 218 247 821 26 2,179 2,662 243 213 844 26 2,180 2,702 262 201 875 26 2,880 2,771 91
Key
Division: Animal Shelter Management (Department of Police) Budget Detail 2021-2022 2022-2023 2023-2024 2023-2024 % 2024-2025 % 2024-2025 % Account Number: 100-35100- Actual Actual Budget Exp to Dec Exp Requested Change Recommended Change 51100.02 Salaries and Wages $ 324,294 $ 424,073 $ 488,093 $ 233,031 48% $ 582,294 19% $ 618,541 27% 51100.04 Salaries and Wages - Overtime 29,611 39,143 3,286 17,510 533% 20,000 509% 3,286 0% 51100.06 Salaries and Wages - Part-time 22,156 17,165 44,219 11,636 26% 47,502 7% 45,987 4% 52100 FICA 28,006 35,423 40,973 18,951 46% 49,709 21% 51,088 25% 52210 VRS Retirement 38,641 56,152 67,747 33,378 49% 80,822 19% 104,458 54% 52400 Group Life 4,162 5,429 6,540 3,236 49% 7,803 19% 8,288 27% 53000.02 Purchased Services - Road Maintenance (incineration) 23,500 23,500 23,500 11,750 50% 23,500 0% 23,500 0% 53000.16 Purchased Services - Refuse Collection 1,474 1,530 1,500 737 49% 1,500 0% 1,500 0% 53100 Professional Services 35,755 73,772 116,550 29,214 25% 121,050 4% 121,050 4% 53200 Temporary Help Service Fees - 6,531 - - - - - -53300 Repair and Maintenance - - 2,000 - 0% 2,000 0% 2,000 0% 54200 Fleet 73,280 72,663 65,000 39,968 61% 85,000 31% 116,626 79% 54500 Risk Management 97,883 113,956 115,022 57,511 50% 115,022 0% 114,653 0% 55100 Utilities 38,869 47,969 33,149 23,172 70% 33,149 0% 33,149 0% 55230 Telecommunications 2,557 2,182 4,210 585 14% 4,210 0% 4,210 0% 55410 Lease/Rent of Equipment 19,166 19,166 20,562 9,583 47% 20,562 0% 20,562 0% 55500 Travel and Training 1,000 700 2,000 500 25% 4,750 138% 4,750 138% 55810 Dues and Association Memberships 150 115 580 - 0% 580 0% 580 0% 56001 Office Supplies 412 1,399 1,300 478 37% 1,300 0% 1,300 0% 56011 Uniforms & Wearing Apparel 3,467 4,339 4,000 1,236 31% 6,800 70% 6,800 70% 56014 Other Operating Supplies 14,583 25,435 28,000 15,945 57% 30,000 7% 30,000 7% 56015 Merchandise for Resale - 1,457 3,000 - 0% 3,000 0% 3,000 0% 56017 Copier Costs - - - - - - - -58200 Capital Outlay - 10,815 74,160 1,619 2% 86,000 16% 86,000 16% Total Operating Expenditures $ 758,966 $ 982,915 $ 1,145,391 $ 510,039 45% $ 1,326,553 16% $ 1,401,329 22% Personnel Summary 2021-2022 2022-2023 2023-2024 2024-2025 2024-2025 Range Class Actual Actual Budget Requested Recommended 215 Chief Animal Control Officer 1 1 1 1 1 215 Animal Shelter Manager 1 1 1 1 1 207 Animal Control Officer - - - 6 6 206 Animal Control Officer 5 5 5 -203 Animal Caretaker - - - 5 5 202 Animal Caretaker 3 4 4 -Number of Full-Time Positions 10 11 11 13 13 92
Fire & Rescue
Description
The Suffolk Department of Fire and Rescue provides fire prevention, fire protection, public education, emergency management, and emergency medical care and transportation to the citizens of Suffolk 24 hours per day, 365 days per year. The Fire Prevention Bureau of the Department of Fire and Rescue performs fire prevention and education, commercial fire inspections, new construction plans review in conjunction with the City Building Official, and fire/arson investigations in order to determine cause and origin.
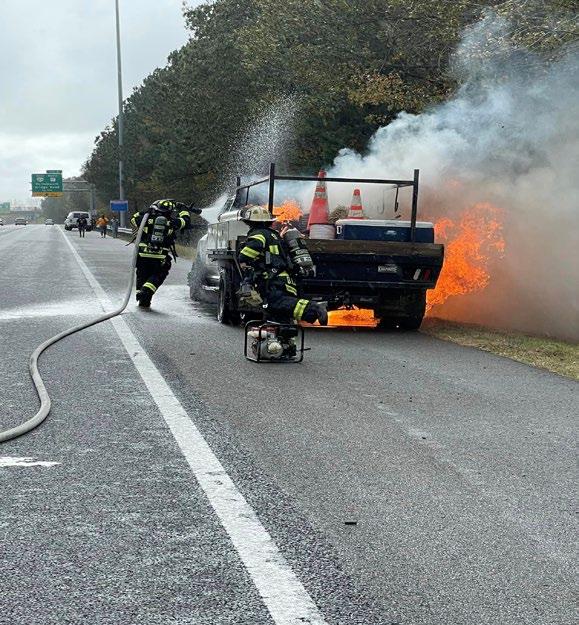
To recruit, hire, and start a new fire academy recruit school to fill all budgeted fulltime positions.
To implement an organizational restructure with the addition of assistant fire chief positions
To advance ongoing capital projects to construction including the burn building and new Fire Station 11.
Budget Highlights:
Eight new positions including five Firefighters, two Assistant Chiefs, and one Captain.
Increase in supplemental pay for eligible EMT-Intermediate and EMT Paramedic officers (lieutenant or higher).
Increased funding for professional services to address EMS billing contract increase, maintenance service contracts for added LUCAS units, personal protective clothing and uniform expenses, travel and training needs, and emergency medical and janitorial supplies.
Public
Council Target Area FY 25 Objectives
Safety
Key Measures FY 23 Actual FY 24 Projected FY 25 Estimate Calls for Service Average Response Time Number of Fires Fire Prevention: Plan Reviews Fire/Safety Inspections Investigations Arson, Bomb Threats, Threats to Burn Fire Prevention Events 19,020 6:45 300 509 251 76 31 57 19,500 6:50 350 520 300 85 26 65 20,000 6:50 350 535 350 92 18 72 93
Department: Fire and Rescue Budget Detail 2021-2022 2022-2023 2023-2024 2023-2024 % 2024-2025 % 2024-2025 % Account Number: 100-32100- Actual Actual Budget Exp to Dec Exp Requested Change Recommended Change 51100.02 Salaries and Wages $ 15,116,377 $ 18,563,278 $ 21,895,324 $ 9,787,381 45% $ 23,188,127 6% $ 23,812,837 9% 51100.04 Salaries and Wages - Overtime 6,441,233 6,982,619 4,631,309 3,577,116 77% 4,631,309 0% 4,631,309 0% 51100.06 Salaries and Wages - Part-time 471,301 358,777 459,454 142,065 31% 468,141 2% 477,832 4% 52100 FICA 1,616,277 1,891,418 2,064,436 986,659 48% 2,164,000 5% 2,212,531 7% 52210 VRS Retirement 2,081,287 2,497,400 3,027,981 1,382,732 46% 3,218,512 6% 3,469,409 15% 52400 Group Life 223,400 241,235 293,397 133,496 46% 310,721 6% 319,092 9% 53000.16 Purchased Services - Refuse Collection 7,478 7,365 9,011 2,968 33% 9,011 0% 9,011 0% 53100 Professional Services 287,748 234,978 232,333 99,086 43% 310,333 34% 310,333 34% 53100.22 Medical Services 150,691 108,352 280,996 188,153 67% 280,996 0% 280,996 0% 53200 Temporary Help Service Fees 6,665 - - - - - - -53300 Repair and Maintenance 41,453 40,058 57,000 54,091 95% 57,000 0% 57,000 0% 53320 Maintenance Service Contracts 140,133 134,953 198,510 115,443 58% 262,510 32% 262,510 32% 53500 Printing and Binding 997 1,106 1,160 - 0% 1,160 0% 1,160 0% 54100 Information Technology 2,277,010 2,190,891 2,691,033 1,461,614 54% 2,691,033 0% 3,174,181 18% 54200 Fleet 2,090,545 2,223,345 2,308,669 1,128,224 49% 2,308,669 0% 2,681,241 16% 54500 Risk Management 3,131,129 3,623,966 4,134,937 1,970,014 48% 4,134,937 0% 4,334,852 5% 55100 Utilities 242,293 294,600 220,626 128,331 58% 270,626 23% 270,626 23% 55210 Postal Services 633 174 850 47 6% 850 0% 850 0% 55230 Telecommunications 96,921 81,699 143,708 28,535 20% 143,708 0% 143,708 0% 55410 Lease/Rent of Equipment 165,687 165,686 176,988 82,843 47% 176,988 0% 176,988 0% 55440 Fire Hydrant Rental 200,000 200,000 200,000 100,000 50% 200,000 0% 200,000 0% 55500 Travel and Training 198,105 214,028 193,351 110,167 57% 203,551 5% 203,551 5% 55645 Four for Life - EMS Support * 88,320 92,617 93,893 35,520 38% 93,893 0% 93,435 0% 55700 VFD Operations 15,425 12,500 22,500 3,125 14% 22,500 0% 22,500 0% 55810 Dues and Association Memberships 21,032 22,551 22,927 20,996 92% 22,927 0% 22,927 0% 55843 Fire Programs Fund Expense * 94,123 36,584 378,438 - 0% 424,690 12% 424,690 12% 56001 Office Supplies 6,705 7,588 5,560 1,517 27% 6,116 10% 6,116 10% 56007 Repair and Maintenance Supplies 17,439 10,868 15,000 3,769 25% 15,000 0% 15,000 0% 56007.12 Educational Supplies 10,661 10,569 12,500 2,303 18% 12,500 0% 12,500 0% 56011 Uniforms & Wearing Apparel 349,723 372,089 373,624 190,278 51% 438,524 17% 434,324 16% 56012 Books and Subscriptions 1,766 13,526 21,640 6,598 30% 21,640 0% 21,640 0% 56014 Other Operating Supplies 160,829 150,665 195,230 69,812 36% 205,230 5% 205,230 5% 56017 Copier Costs 23,300 29,587 23,210 12,670 55% 23,210 0% 23,210 0% 58200 Capital Outlay - Additions 215,278 356,358 771,000 304,617 40% 651,136 -16% 651,136 -16% Total Operating Expenditures $ 35,991,963 $ 41,171,428 $ 45,156,596 $ 22,130,171 49% $ 46,969,548 4% $ 48,962,727 8% 53100 - Professional Services: Dept. of Forestry contracts for forest fire prevention & suppression; independent ladder testing services & EMS billing; firefighter entrance testing. 53100.22 - Medical Services: OSHA required annual medical eval.'s & medical director services. 55440 - Fire Hydrant Rental: Fire hydrant rentals and maintenance charges from Public Utilities. 56007 - Repair & Maintenance Supplies: Supplies to maintain building facilities, tools and equipment. 56014 - Other Operating Supplies: Medical supplies, emergency food supplies, & janitorial supplies for facilities. * Amounts for Four for Life and Fire Programs are estimates of grant funds to be received and are offset by anticipated revenues in the General Fund. Department: Fire and Rescue Personnel Summary 2021-2022 2022-2023 2023-2024 2024-2025 2024-2025 Range Class Actual Actual Budget Requested Recommended Fire Chief 1 1 1 1 1 F311 Deputy Fire Chief 3 3 3 3 3 Fire Marshal 1 - - -F310 Assistant Fire Chief - - 2 5 5 F309 Battalion Chief 8 9 11 12 12 F308 Fire Captain 22 25 24 25 25 F308 Deputy Emergency Management Coordinator 1 1 1 1 1 F307 Fire Lieutenant 36 39 39 39 39 F301/F302/F303 F304/F305/F306 Firefighter Recruit/Firefighter-AEMT/Senior Firefighter-AEMT/Firefighter EMT Intermediate/Paramedic/Firefighter Paramedic/Master Firefighter-AEMT/Master Firefighter Paramedic 217 230 228 246 232 F305 Public Education Specialist - Fire Investigator 1 1 - -F305 Fire Investigator/Inspector - - 1 1 1 214 Fire Protection Plans Reviewer 1 1 1 1 1 214 Administrative Analyst 1 1 1 -208 Accounting Associate 1 1 1 1 1 207 Planning Technician 1 1 1 1 1 205 Administrative Assistant 1 1 1 1 1 202 Stockroom Clerk - - 1 1 1 202 Office Assistant 2 2 2 2 2 Number of Full-Time Positions 297 316 318 340 326 94
Description
Fire & Rescue – Emergency Management
The Emergency Management Division of the Suffolk Department of Fire and Rescue is responsible for disaster preparedness and seeks to lessen the impact of natural and man-made disasters on the Suffolk community through effective mitigation, planning, emergency response, and recovery. This is accomplished through a comprehensive allhazards emergency management program aimed at coordinating local, state, and federal resources during a disaster.
Council Target Area
Public Safety
FY 25 Objectives
To administer a comprehensive all-hazards Emergency Management program that coordinates local, state, federal, and non-governmental organization resources to address both natural and man-made disasters affecting the City.
To ensure the City’s Local Emergency Planning Committee is in compliance with applicable local, state, and federal regulations.
To complete the transition of the emergency warning and notification system to the Everbridge software system.
To update and readopt the Emergency Operations Plan, Hazard Specific Annexes, Emergency Support Functions, and supporting plans.
To establish new and strengthen existing relationships with private nonprofit organizations that provide assistance with small venue sheltering in the City.
Budget Highlights:
Additional travel and training funding for emergency management staff responsible for coordination of the City’s response to emergency weather and other safety events.
Key Measures FY 23 Actual FY 24 Projected FY 25 Estimate Number of training exercises attended by emergency management staff Percentage of City staff with emergency management responsibilities receiving at least one class annually Percent compliance with state and federal emergency management mandates Department specific emergency management training activities 3 100% 100% 1 3 100% 100% 1 3 100% 100% 2 95
Division: Emergency Management (Department of Fire & Rescue) Budget Detail 2021-2022 2022-2023 2023-2024 2023-2024 % 2024-2025 % 2024-2025 % Account Number: 100-35500- Actual Actual Budget Exp to Dec Exp Requested Change Recommended Change 55210 Postal Services $ - $ - $ 50 $ - 0% $ 50 0% $ 50 0% 55230 Telecommunications 4,760 4,542 5,547 1,315 24% 5,547 0% 5,547 0% 55500 Travel and Training 2,405 5,685 6,000 820 14% 12,680 111% 12,680 111% 55810 Dues and Association Memberships 270 475 520 299 58% 850 63% 850 63% 56001 Office Supplies 564 84 1,500 - 0% 1,500 0% 1,500 0% 56014 Other Operating Supplies 1,377 666 2,000 89 4% 2,000 0% 2,000 0% 58200 Capital Outlay - - - - - - - -Total Operating Expenditures $ 9,376 $ 11,452 $ 15,617 $ 2,523 16% $ 22,627 45% $ 22,627 45% 96
Western Tidewater Jail Authority
Description
The Western Tidewater Regional Jail Authority is a regional partnership of the cities of Suffolk and Franklin, and the counties of Isle of Wight and Southampton, which provides incarceration services to enhance the safety and security of the residents of these localities. The City of Suffolk supports the regional jail’s operations through a local funding contribution based on the inmate population served.
97
Department: Western Tidewater Regional Jail Budget Detail 2021-2022 2022-2023 2023-2024 2023-2024 % 2024-2025 % 2024-2025 % Account Number: 100-33200- Actual Actual Budget Exp to Dec Exp Requested Change Recommended Change 57001 Required Jurisdiction Contribution $ 4,492,631 $ 4,560,701 $ 4,560,701 $ 2,280,351 50% $ 4,280,078 -6% $ 4,280,078 -6% Total Operating Expenditures $ 4,492,631 $ 4,560,701 $ 4,560,701 $ 2,280,351 50% $ 4,280,078 -6% $ 4,280,078 -6%
98
Above represents required local contribution to operate the regional jail facility. Local jurisdiction costs are apportioned based on % of local inmate population.
Public Works – Administration
Description
The Department of Public Works provides a wide range of services in support of the economic vitality and quality of life of the City of Suffolk and its citizens including fleet management, refuse collection, stormwater and mosquito control, roadway maintenance, traffic engineering, and transit services.
Council Target Area
Civic Engagement & Responsive City Services
Growth Management & Comprehensive Planning
FY 25 Objectives
To provide high quality services within allocated resources.
To provide exceptional and cost effective collection and disposal of solid waste.
To engage citizens by providing a comprehensive review of Public Works services and provide them with options to communicate with the Department.
To complete street improvements identified in the Village and Neighborhood Initiatives of the Capital Improvements Program and Plan. Transportation
To provide safe roads and adequate traffic signals for quality transportation and travel options.
Budget Highlights:
No significant changes.
Key Measures FY 23 Actual FY 24 Projected FY 25 Estimate Number of lane miles resurfaced Lane Miles maintained Number sign fabrications, repairs, and replacements Tons of refuse collected Tons of curbside recycling collected Transit Ridership (non-ADA) 130 1,669 2,633 42,781 5,503 72,551 130 1,671 2,750 45,000 5,800 73,247 130 1,671 2,750 48,000 6,100 73,977 99
Department: Public Works - Administration Budget Detail 2021-2022 2022-2023 2023-2024 2023-2024 % 2024-2025 % 2024-2025 % Account Number: 100-41100- Actual Actual Budget Exp to Dec Exp Requested Change Recommended Change 51100.02 Salaries and Wages $ 291,691 $ 290,839 $ 300,787 $ 145,625 48% $ 300,787 0% $ 335,204 11% 51100.04 Salaries and Wages - Overtime - 2 - 58 - - -51100.06 Salaries and Wages - Part-time - - - - - - - -52100 FICA 22,106 21,846 23,010 11,189 49% 23,010 0% 25,643 11% 52210 VRS Retirement 14,543 39,637 41,749 21,198 51% 41,749 0% 54,446 30% 52400 Group Life 1,444 3,835 4,031 2,054 51% 4,031 0% 4,492 11% 53000.02 Purchased Services - RM Dirt Roads 145,319 161,866 175,000 119,735 68% 200,000 14% 200,000 14% 53000.06 Purchased Services - Stormwater - Engineering 421,522 525,896 550,000 161,034 29% 550,000 0% 550,000 0% 53000.43 Purchased Services - RM Salary Allocation 19,216 17,534 23,135 11,568 50% 25,000 8% 25,000 8% 53000.44 Purchased Services - RM Streetlight Installation 20,000 20,000 30,000 15,000 50% 40,000 33% 40,000 33% 53000.45 Purchased Services - RM Impact Analysis 15,000 15,000 15,000 7,500 50% 15,000 0% 15,000 0% 53100 Professional Services 5,634 30,127 47,000 8,627 18% 55,000 17% 155,000 230% 53130 Landfill Closure Monitoring - 4,490 - - - 15,000 - 15,00053600 Advertising - 420 1,000 348 35% 1,000 0% 1,000 0% 54100 Information Technology 23,386 16,445 21,247 9,039 43% 21,247 0% 23,179 9% 54200 Fleet 1,112 1,374 2,787 466 17% 2,787 0% 1,660 -40% 54500 Risk Management 25,225 31,166 33,001 16,501 50% 33,001 0% 34,224 4% 55210 Postal Services 180 180 300 149 50% 350 17% 350 17% 55230 Telecommunications 5,262 4,747 5,230 1,499 29% 5,230 0% 5,230 0% 55500 Travel and Training 866 2,690 1,200 360 30% 1,200 0% 1,200 0% 55810 Dues and Association Memberships 830 1,794 1,000 705 71% 1,800 80% 1,800 80% 56001 Office Supplies - - 1,500 - 0% 1,500 0% 1,500 0% 56012 Books and Subscriptions - - 250 5 2% 300 20% 300 20% 56014 Other Operating Supplies 69 9,906 - 10,408 - 10,000 - 10,00056017 Copier Costs - 2,575 1,400 1,358 97% 2,800 100% 4,152 197% 58200 Capital Outlay - 8,000 100,000 5,440 5% 150,000 50% -Total Operating Expenditures $ 1,013,405 $ 1,210,369 $ 1,378,627 $ 549,866 40% $ 1,500,792 9% $ 1,504,380 9% Personnel Summary 2021-2022 2022-2023 2023-2024 2024-2025 2024-2025 Range Class Actual Actual Budget Requested Recommended Director of Public Works 1 1 1 1 1 220 Public Works Fund Manager 1 1 1 1 1 205 Administrative Assistant 1 1 1 1 1 Number of Full-Time Positions 3 3 3 3 3 100
Capital Programs and Facilities
Description
The Department of Capital Programs and Facilities is responsible for the administration and management of capital projects, building maintenance, and custodial functions. As part of its capital project management functions, the Department coordinates with City departments, user groups, and approval agencies; develops project plans and budgets; oversees land acquisition, consultant selection, contract negotiation and monitoring, architectural and engineering consultants and contractors; and manages contract payments, fees, and project expenditures. The Department’s building maintenance and custodial functions include general building maintenance and custodial services, HVAC systems maintenance, and the repair of electrical, plumbing, and other building systems.
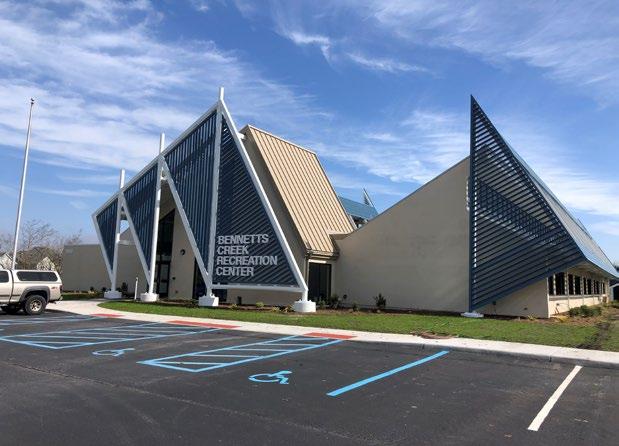
To continue to efficiently implement capital projects within established budgets.
Budget Highlights:
Increased funding for maintenance contracts, repair and maintenance, and supplies to maintain additional square footage of City facilities.
Key Measures FY 23 Actual FY 24 Projected FY 25 Estimate Building Maintenance and Custodial: Number of buildings maintained Square footage of buildings maintained Service Requests: Building Maintenance Custodial Average response time to service requests 47 1,095,000 1,710 1,620 1 day 49 1,122,000 2,000 1,750 1 day 51 1,180,000 2,200 2,000 1 day
Council Target Area FY 25 Objectives Civic Engagement & Responsive City Services To implement capital projects that encourage citizen engagement and efficient service delivery To collaborate with Suffolk Public Schools to implement projects that support the growth and enhancement of public education. Financial Stability
101
Department: Capital Programs & Facilities Budget Detail 2021-2022 2022-2023 2023-2024 2023-2024 % 2024-2025 % 2024-2025 % Account Number: 100-43250 Actual Actual Budget Exp to Dec Exp Requested Change Recommended Change 51100.02 Salaries and Wages $ 1,093,030 $ 1,243,635 $ 1,503,112 $ 623,987 42% $ 1,503,112 0% $ 1,615,610 7% 51100.04 Salaries and Wages - Overtime 42,462 19,421 - 10,535 - - - -51100.06 Salaries and Wages - Part-time 71,259 69,059 145,630 22,071 15% 145,630 0% 151,455 4% 52100 FICA 89,528 98,330 126,129 48,548 38% 126,129 0% 135,180 7% 52210 VRS Retirement 130,791 168,718 208,629 89,141 43% 208,632 0% 258,222 24% 52400 Group Life 13,544 16,346 20,142 8,636 43% 20,142 0% 21,649 7% 53000.16 Purchased Services - Refuse Collection 10,316 10,194 11,322 5,045 45% 11,322 0% 11,322 0% 53100 Professional Services - 5,221 - 921 - - - -53300 Repair and Maintenance 318,101 372,461 265,000 146,077 55% 400,000 51% 400,000 51% 53320 Maintenance Service Contracts 652,362 654,956 800,000 576,648 72% 880,000 10% 880,000 10% 54100 Information Technology 175,404 163,158 201,805 115,570 57% 201,805 0% 261,696 30% 54200 Fleet 63,790 87,341 100,250 25,965 26% 100,250 0% 104,665 4% 54500 Risk Management 417,513 503,266 592,689 296,345 50% 592,689 0% 703,355 19% 55100 Utilities 622,091 662,649 655,000 279,328 43% 655,000 0% 655,000 0% 55210 Postal Services 32 30 100 1 1% 100 0% 100 0% 55230 Telecommunications 15,138 19,639 16,494 5,537 34% 16,494 0% 16,494 0% 55410 Lease/Rent of Equipment 417,187 417,187 534,515 208,593 39% 534,515 0% 534,515 0% 55500 Travel and Training 6,493 4,512 14,000 178 1% 14,000 0% 14,000 0% 56001 Office Supplies 1,068 178 2,000 501 25% 2,000 0% 2,000 0% 56011 Uniforms & Wearing Apparel 21,284 25,216 22,000 15,549 71% 22,000 0% 22,000 0% 56014 Other Operating Supplies 247,619 351,772 300,000 129,466 43% 350,000 17% 350,000 17% 56017 Copier Costs 3,763 8,066 11,318 5,163 46% 11,318 0% 11,318 0% 58200 Capital Outlay - 19,938 - 110,875 - - - -Total Operating Expenditures $ 4,412,774 $ 4,921,294 $ 5,530,134 $ 2,724,678 49% $ 5,795,138 5% $ 6,148,582 11% Personnel Summary 2021-2022 2022-2023 2023-2024 2024-2025 % 2024-2025 % Range Class Actual Actual Budget Requested Change Recommended Change Director of Capital Programs & Buildings 1 1 1 1 1 223 Assistant Director of Capital Programs & Buildings 1 1 1 1 1 216 Capital Security Administrator - - 1 1 1 216 Building Superintendent 1 1 1 1 1 212 Physical Security Administrator - 1 - -211 Security Specialist - - 1 2 2 211 Lead Mechanic - - - 1 1 210 Facilities Inspector 1 1 1 1 1 209 Building Maintenance Technician 5 6 6 4 4 208 General Services Supervisor 1 1 1 1 1 207 Senior Accounting Technician 1 1 1 1 1 207 Custodial Supervisor 2 2 2 2 2 204 Staff Support Assistant - - - 1 1 202 Custodial Worker 12 12 12 11 11 Number of Full-Time Positions 25 27 28 28 28 102
Social Services Description
The Department of Social Services administers a variety of federal and local financial assistance and human services programs. The Department’s services are categorized into five broad service areas: Financial Services, Employment Services, Foster Care Services, Child/Adult Prevention/Protection Services, and Community Corrections.
To exceed the 95% state target for timely response to first contacts for child protective services.
To process benefit applications in a timely manner in accordance with state standards.
To focus on preventative measures to decrease the number of children entering into foster care.
To continue to host employment fairs and assist new and existing businesses by providing recruitment space and a pool of qualified applicants.
Budget Highlights:
Two new positions added including Benefits Program Manager and Family Services Program Manager.
Increased state and federal funding provided for adoption subsidies.
Family Services Specialist position transferred to the Department of Human Resources for establishment of DEI-B Analyst and Training Consultant position.
Council Target Area FY 25 Objectives Civic
& Responsive City Services
Summer Youth Employment program funding moved from Social Services to Parks and Recreation
Engagement
To protect vulnerable children and the elderly from abuse and neglect by responding to 98% of valid investigative reports with state mandated guidelines.
Key Measures FY 23 Actual FY 24 Projected FY 25 Estimate Supplemental Nutrition Assistance Program (SNAP): Number of persons receiving SNAP Percent of eligible households receiving SNAP Temporary Assistance for Needy Families (TANF): Number of persons/households receiving TANF Number of TANF children receiving childcare subsidies Medicaid Program: Number of households receiving Medicaid Average cost per Medicaid case Foster Care Program: Number of children in foster care Average cost per case Employment Programs: Percent of TANF recipients in employment activities Number of visitors at the Suffolk Workforce Development Center 11,919 81% 610 57 22,942 $2,558 48 $22,388 63.2% 9,407 13,619 82% 650 70 26,000 $3,000 45 $30,000 65% 11,000 15,334 84% 700 70 26,400 $3,500 40 $33,000 67% 13,000 103
Above costs are offset by estimated State/Federal Revenues of: $8,938,953 Personnel Summary
Department: Social Services Budget Detail 2021-2022 2022-2023 2023-2024 2023-2024 % 2024-2025 % 2024-2025 % Account Number: 100-53100- Actual Actual Budget Exp to Dec Exp Requested Change Recommended Change 51100.02 Salaries and Wages $ 4,965,918 $ 4,621,963 $ 5,833,787 $ 2,218,653 38% $ 5,976,513 2% $ 6,270,915 7% 51100.04 Salaries and Wages - Overtime 52,590 68,214 - 158,756 - - - -51100.06 Salaries and Wages - Part-time 376,889 365,697 579,761 175,928 30% 579,761 0% 602,951 4% 51100.27 Leave Compensation - - 100,000 - - 100,000 0% 100,000 0% 52100 FICA 400,010 372,493 498,286 188,287 38% 501,555 1% 533,501 7% 52210 VRS Retirement 601,776 632,636 809,730 320,336 40% 829,540 2% 1,029,641 27% 52400 Group Life 65,045 61,393 78,173 30,997 40% 80,085 2% 84,030 7% 52600 Unemployment - - 19,490 - 0% 19,490 0% 19,490 0% 53100 Professional Services 43,023 145,061 89,011 90,134 101% 89,011 0% 89,011 0% 53200 Temporary Help Service Fees - 103,926 - 69,558 - - - -53300 Repair and Maintenance 1,285 1,599 10,000 600 6% 10,000 0% 10,000 0% 54100 Information Technology 684,087 596,485 769,722 339,358 44% 769,722 0% 954,180 24% 54200 Fleet 41,763 36,040 38,000 15,599 41% 38,000 0% 36,982 -3% 54500 Risk Management 817,175 993,095 1,052,098 526,049 50% 1,052,098 0% 1,113,360 6% 55210 Postal Services 23,810 20,142 70,000 14,329 20% 70,000 0% 70,000 0% 55230 Telecommunications 99,363 117,013 153,872 37,847 25% 153,872 0% 153,872 0% 55420 Lease/Rent of Building 1,198,251 1,152,854 1,292,572 158,488 12% 1,332,572 3% 1,230,994 -5% 55500 Travel and Training 11,799 25,588 50,000 5,905 12% 50,000 0% 50,000 0% 55676 Summer Youth Program 5,917 63,398 140,000 66,619 48% 140,000 0% - -100% 55677 Suffolk Workforce Development 10,211 7,014 20,000 2,164 11% 20,000 0% 20,000 0% 55701.02 Auxiliary Assistance - Blind, Aged & Disabled 203,016 171,937 250,000 80,080 32% 250,000 0% 250,000 0% 55701.04 Aid to Dependent Children 2,072 10,090 2,500 524 21% 2,500 0% 2,500 0% 55701.06 Aid to Dependent Children - Foster Care 529,522 457,160 550,000 166,669 30% 550,000 0% 550,000 0% 55701.08 Fuel Assistance - - 1,000 - 0% 1,000 0% 1,000 0% 55701.10 Healthy Families - 105 60,000 - 0% 60,000 0% 60,000 0% 55701.14 Title XX Purchased Services 213,819 191,580 275,000 82,116 30% 275,000 0% 275,000 0% 55701.16 Adoption Payments 401,772 471,644 450,000 260,175 58% 510,000 13% 510,000 13% 55701.18 Employment Services Program 11,446 24,040 100,000 4,092 4% 100,000 0% 100,000 0% 55701.22 Quality Initiative Program - 299 - - - - - -55701.24 General Relief 12,000 11,612 15,000 8,595 57% 30,000 100% 30,000 100% 55810 Dues and Association Memberships 2,051 2,410 2,051 1,009 49% 2,025 -1% 2,025 -1% 56001 Office Supplies 26,934 31,132 80,000 17,123 21% 80,000 0% 80,000 0% 56017 Copier Costs 60,933 68,925 61,217 28,432 46% 61,217 0% 61,217 0% Total Operating Expenditures $ 10,862,477 $ 10,825,545 $ 13,451,269 $ 5,068,421 38% $ 13,733,961 2% $ 14,290,669 6%
2021-2022 2022-2023 2023-2024 2024-2025 2024-2025 Range Class Actual Actual Budget Requested Recommended Director of Social Services 1 1 1 1 1 223 Assistant Director of Social Services 2 2 2 2 2 219 Administrative Services Manager 1 1 1 1 1 218 Family Services Program Manager - - - 1 1 218 Benefit Program Manager - - - 1 1 216 Social Services Information Technology Administrator 1 1 1 1 1 216 Self Sufficiency Supervisor - 1 1 1 1 216 Family Services Worker Supervisor 4 4 4 4 4 216 Benefit Programs Supervisor 5 4 4 4 4 214 Workforce Center Coordinator 1 1 1 1 1 214 Senior Self Sufficiency Specialist - 1 1 1 1 214 Senior Family Services Specialist - 3 3 3 2 214 Accountant - - - - 1 210 Senior Probation Officer - - 1 1 1 210 Clerical Support Manager 1 1 1 1 1 208/210/211 Benefit Programs Specialist I-III 34 35 35 35 35 209 Self Sufficiency Specialist 4 5 5 5 5 209 Family Services Specialist 28 24 26 26 26 208 Accounting Associate 4 4 4 4 3 207 Fraud Investigator 1 1 1 1 1 204 Senior Human Services Associate 2 2 2 2 2 204 Family Services Assistant - 1 1 1 1 203 Human Services Associate 11 10 10 10 9 202 Workforce Development Assistant - 1 1 1 2 202 Office Assistant 2 1 1 1 1 Number of Full-Time Positions 102 104 107 109 108 104
Social Services –
Children’s Services Act
Description
The Children’s Services Act (CSA) was implemented by state legislation as a collaborative system of services and funding that is to be child-centered, family-focused, and community-based when addressing the strengths and needs of troubled and at-risk youth and their families. The CSA is administered by a City Council appointed board comprised of representatives from Social Services, Juvenile Court Services, the Community Services Board, the Health Department, Public Schools, the Police Department, a Private and Public Provider, and Parent Representative. The Department of Social Services serves as the fiscal agent and supervises the CSA Division staff.
Council Target Area
Civic Engagement & Responsive City Services
FY 25 Objectives
To maintain the average cost per year for CSA services at or below the average state cost per service.
To schedule reviews of 95% of eligible participants within 30 days of receipt of appointment requests.
To direct parental referrals to appropriate member agencies and/or facilitate intake through CSA office within 30 days of request.
To continue partnering with Suffolk Public Schools to enhance attendance and behavior of children by participation of school representatives on CSA teams.
To explore new community-based services and providers in order to expand these resources and reduce the number of children placed in residential care.
Budget Highlights:
One new full-time CSA Management Specialist provided to assist with increasing client needs and case complexity. Position converted from an existing part-time position.
Part-time funding added for Office Assistant
Key Measures FY 23 Actual FY 24 Projected FY 25 Estimate Number of children receiving CSA services Number of children placed in congregate care Average Length of Stay in congregate care Percentage of successful discharges from services per provider Percentage of reviews scheduled within 30 days of receipt 90 10 7 months 71% 100% 110 15 9 months 75% 100% 115 17 9 months 75% 100% 105
Department: Children's Services Act Budget Detail 2021-2022 2022-2023 2023-2024 2023-2024 % 2024-2025 % 2024-2025 % Account Number: 100-53500- Actual Actual Budget Exp to Dec Exp Requested Change Recommended Change 51100.02 Salaries and Wages $ 133,937 $ 138,643 $ 142,944 $ 56,721 40% $ 189,122 32% $ 192,874 35% 51100.04 Salaries and Wages - Overtime 275 606 - - - - - -51100.06 Salaries and Wages - Part-time 50,591 44,662 38,262 24,314 64% 26,741 -30% 27,811 -27% 52100 FICA 13,826 13,621 13,862 6,178 45% 16,514 19% 16,882 22% 52210 VRS Retirement 16,417 18,896 19,841 7,866 40% 26,250 32% 31,656 60% 52400 Group Life 1,764 1,824 1,915 761 40% 2,534 32% 2,585 35% 53000.08 CSA Purchased Services 1,951,859 2,241,186 2,575,000 834,867 32% 2,575,000 0% 2,575,000 0% 54500 Risk Management 15,467 19,249 19,933 9,967 50% 19,333 -3% 20,703 4% Total Operating Expenditures $ 2,184,136 $ 2,478,687 $ 2,811,757 $ 940,673 33% $ 2,855,494 2% $ 2,867,511 2% Personnel Summary 2021-2022 2022-2023 2023-2024 2024-2025 2024-2025 Range Class Actual Actual Budget Requested Recommended 131 CSA Coordinator 1 1 1 1 1 126 CSA Management Specialist 1 1 1 2 2 Number of Full-Time Positions 2 2 2 3 3 Above
$1,864,132 106
costs are offset by estimated State Revenues of:
Description
Suffolk Health Department
The Suffolk Health Department is part of the Western Tidewater Health District which includes Isle of Wight County, Southampton County, the City of Franklin, and the City of Suffolk. The Health Department aims to achieve and maintain optimum personal and community health with an emphasis on disease prevention, environmental protection, and the promotion of good health.
Leisure, Health & Wellness
Key Measures
Additional $55,000 in funding provided to support vital public health programs and services. Council Target Area
To maintain a high percentage of Nurse Family Partnership program children age 7 months or older who are screened for developmental delays.
To maintain a high percentage of Nurse Family Partnership program babies up to date on immunizations.
To increase the number of teens served in family planning clinics.
To increase the percentage of 7th graders that receive the HPV vaccination.
To increase enrollment in the Women, Infant, Children (WIC) program.
Percent of Nurse Family Partnership babies up to date on immunizations
Percentage of teens served in family planning clinics Percentage
Budget Highlights:
FY 25 Objectives
FY 23 Actual FY 24 Projected FY 25 Estimate
months
older
Percent of Nurse Family Partnership children 7
or
screened for developmental delays
of
Women, Infant, Children (WIC) enrollment 100% 100% 10.8% 88.9% 1,318 100% 100% 14% 92% 1,383 100% 100% 18% 95% 1,350 107
7th graders receiving HPV vaccinations
Department: Support of Western Tidewater Health District Budget Detail 2021-2022 2022-2023 2023-2024 2023-2024 % 2024-2025 % 2024-2025 % Account Number: 100-51100- Actual Actual Budget Exp to Dec Exp Requested Change Recommended Change 55610 Transfer to Western Tidewater Health District $ 1,095,655 $ 1,189,651 $ 1,245,000 $ 622,500 50% $ 1,300,000 4% $ 1,300,000 4% Total Operating Expenditures $ 1,095,655 $ 1,189,651 $ 1,245,000 $ 622,500 50% $ 1,300,000 4% $ 1,300,000 4% 108
Western Tidewater Community Services Board Description
The Western Tidewater Community Services Board provides ongoing mental health, substance abuse, and mental retardation related services to the children and families of the City of Suffolk. Treatment services include ongoing medical, counseling, and support services. Most of the Western Tidewater Community Services Board’s consumers are underinsured families with children and adult members suffering from chronic and pervasive disabilities.
Council Target Area
Leisure, Health & Wellness
FY 25 Objectives
To launch an extended community stabilization program for youth in an effort to provide 45 days of care for children and adolescents in crisis and minimize time away from school, family, and prevent future out of home placements.
To enhance training and public awareness related to services and supports to the community.
To expand access to care for various services and supports through the addition of 4,000 square feet of additional treatment space to the Crisis Receiving Center and Residential Crisis Unit.
Key
Budget Highlights:
Additional $54,686 in funding provided to support critical mental health, substance abuse, and support services.
Measures FY 23 Actual FY 24 Projected FY 25 Estimate Number of persons receiving mental health services Number of persons receiving intellectual disabilities services Number of persons receiving substance abuse services Number of persons receiving assessment and emergency services Total persons served Total Service Units 1,527 352 111 1,471 3,461 163,210 1,150 357 120 1,493 3,513 164,842 1,565 361 125 1,508 3,548 166,491 109
Department: Support of Western Tidewater Community Service Board Budget Detail 2021-2022 2022-2023 2023-2024 2023-2024 % 2024-2025 % 2024-2025 % Account Number: 100-52100- Actual Actual Budget Exp to Dec Exp Requested Change Recommended Change 55620 Transfer to Western Tidewater CSB $ 474,404 $ 550,000 $ 600,000 $ 300,000 50% $ 654,686 9% $ 654,686 9% Total Operating Expenditures $ 474,404 $ 550,000 $ 600,000 $ 300,000 50% $ 654,686 9% $ 654,686 9% 110
School Support
Description
Each year, the Suffolk City Council appropriates local funding in support of Suffolk Public Schools operating expenses as well as the Suffolk School Administration office lease. This funding is used by the school division for the operation of its 11 elementary schools, 5 middle schools, 3 high schools, an alternative school, and the College and Career Academy at Pruden.
111
Department: Support of Schools Budget Detail 2021-2022 2022-2023 2023-2024 2023-2024 % 2024-2025 % 2024-2025 % Account Number: 100-60010- Actual Actual Budget Exp to Dec Exp Requested Change Recommended Change 55420 Local Support for Lease/Rent of Building $ 442,979 $ 442,979 $ 442,979 $ 282,490 64% $ 739,702 67% $ 739,702 67% 55640 Support of Schools 64,934,716 66,064,136 69,332,201 29,684,145 43% 75,332,201 9% 75,332,201 9% Total Operating Expenditures $ 65,377,695 $ 66,507,115 $ 69,775,180 $ 29,966,634 43% $ 76,071,903 9% $ 76,071,903 9% Total School Fund Revenues: State / Federal / Other $ 167,397,519 8% $ 167,397,519 8% Transfer from General Fund - Local Support 75,332,201 9% 75,332,201 9% 242,729,720 242,729,720 Total Operating Revenues: $ 242,729,720 8% $ 242,729,720 8% Total School Fund Expenditures: Instruction $ 179,695,426 6% $ 179,695,426 6% Administration and Attendance 4,899,950 2% 4,899,950 2% Health and Psychology 3,323,176 2% 3,323,176 2% Pupil Transportation 10,859,472 6% 10,859,472 6% Operation and Maintenance 23,678,402 20% 23,678,402 20% Food Services 10,341,554 8% 10,341,554 8% Technology 9,931,740 11% 9,931,740 11% Local Support Reduction to REQUEST: - - -Total Operating Expenses: $ 242,729,720 8% $ 242,729,720 8% 112
Parks and Recreation
Description
The Department of Parks and Recreation provides a variety of high quality recreational and leisure programs for the citizens of Suffolk. The Department is responsible for maintaining over 1,800 acres of parkland including four regional parks, 21 community parks, 14 athletic fields, and 60 city gateways; administration of the Bennett’s Creek, East Suffolk, and Curtis R. Milteer, Sr. recreation centers, and 6 joint-use recreational facilities; the Office on Youth; and the Suffolk Art Gallery. The Department is organized into the divisions of Administration; Parks, Gateways, and Facilities Maintenance; and Recreation.
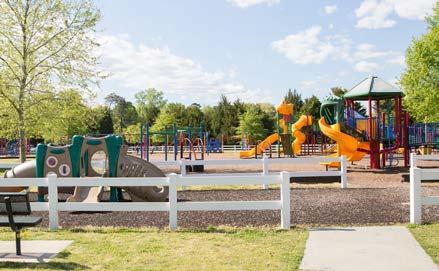
Council Target Area FY 25 Objectives
Leisure, Health, and Wellness
Financial Stability
Growth Management & Comprehensive Planning
Civic Engagement & Responsive City Services
To provide a wide variety of core recreation program services including art and culture, health and wellness, out of school time, active adults, aquatics, and adult and youth athletics.
To provide specialized fitness programs and new group offerings to allow participants to reach their fitness goals.
To be good stewards of City funds while providing high quality recreation programs and events with associated fees set fairly and responsibly.
To enhance the maintenance and upkeep of the downtown area for residents and visitors.
To evaluate and survey all programs and services to continue meeting community needs.
Budget Highlights:
One new full-time Recreation Specialist provided to address work demand in Recreation Division.
Increased funding for expenses related to fee activities for recreation programs and utilities.
Key Measures FY 23 Actual FY 24 Projected FY 25 Estimate Park Visitors Recreation Center member visits Before/After-School and Summer Camp program participants Number of youth participating in prevention programs Number of therapeutic recreation program participants Park acres maintained 510,610 63,395 3,810 500 100 1,829 550,000 69,734 4,409 550 125 2,000 600,000 76,707 4,500 575 150 2,200 113
Department: Parks and Recreation - Administration Budget Detail 2021-2022 2022-2023 2023-2024 2023-2024 % 2024-2025 % 2024-2025 % Account Number: 100-71100- Actual Actual Budget Exp to Dec Exp Requested Change Recommended Change 51100.02 Salaries and Wages $ 798,720 $ 899,711 $ 785,117 $ 363,403 46% $ 785,117 0% $ 833,865 6% 51100.04 Salaries and Wages - Overtime 1,576 5,761 - 896 - - - -51100.06 Salaries and Wages - Part-time 27,548 89,136 56,956 32,824 58% 70,396 24% 59,234 4% 52100 FICA 60,663 72,994 64,419 29,019 45% 67,019 4% 68,322 6% 52210 VRS Retirement 94,157 122,165 108,974 54,224 50% 108,974 0% 135,815 25% 52400 Group Life 8,173 11,837 10,521 5,255 50% 10,521 0% 11,174 6% 53100 Professional Services - 420 - - - 225,000 - 225,00053300 Repair and Maintenance 2,000 - 2,600 - - 1,000 -62% 1,000 -62% 53500 Printing and Binding 10,139 11,824 12,000 3,768 31% 15,000 25% 15,000 25% 53600 Advertising 14,726 13,885 16,000 9,429 59% 16,000 0% 16,000 0% 54100 Information Technology 727,999 817,594 1,256,825 478,471 38% 1,256,825 0% 1,200,733 -4% 54200 Fleet 10,047 10,707 12,000 6,250 52% 12,000 0% 7,966 -34% 54500 Risk Management 596,097 784,760 870,166 435,083 50% 870,166 0% 972,404 12% 55100 Utilities 810 - 6,000 - 0% 6,000 0% 6,000 0% 55210 Postal Services 2,032 1,355 2,000 2,048 102% 3,000 50% 3,000 50% 55230 Telecommunications 58,430 66,012 60,331 22,872 38% 60,331 0% 60,331 0% 55500 Travel and Training 15,600 25,031 16,200 13,114 81% 19,000 17% 19,000 17% 55810 Dues and Association Memberships 3,308 3,120 3,150 (305) -10% 4,105 30% 4,105 30% 56001 Office Supplies 6,965 6,890 6,850 2,630 38% 6,850 0% 6,850 0% 56011 Uniforms & Wearing Apparel - 1,782 750 (132) -18% 750 0% 750 0% 56012 Books and Subscriptions 168 96 500 46 9% 500 0% 500 0% 56014 Other Operating Supplies 21,077 28,525 16,230 8,786 54% 18,000 11% 18,000 11% 56017 Copier Costs 33,117 40,285 35,037 18,202 52% 35,037 0% 37,293 6% 56026 Special Events 182,700 244,023 287,850 132,587 46% 300,000 4% 300,000 4% Total Operating Expenditures $ 2,676,052 $ 3,257,913 $ 3,630,475 $ 1,618,471 45% $ 3,891,591 7% $ 4,002,343 10% 56026 - Special Events: Special events supported by sponsorships and fees of $40,175. Personnel Summary 2021-2022 2022-2023 2023-2024 2024-2025 2024-2025 Range Class Actual Actual Budget Requested Recommended Director of Parks & Recreation 1 1 1 1 1 223 Assistant Director of Parks & Recreation 1 1 1 1 1 218 Senior Planner 1 1 1 1 1 216 Business Manager 1 1 1 1 1 214 Youth Outreach Coordinator 1 1 - -212 Volunteer Coordinator - - - - 1 212 Recreation Supervisor 3 3 3 3 2 209 Therapeutic Recreation Specialist 1 1 - -209 Superintendent of Cemeteries - 1 1 1 1 208 Accounting Associate 1 1 1 1 1 206 Marketing Specialist 1 1 1 1 1 205 Administrative Assistant 1 1 1 1 1 202 Office Assistant 1 1 1 1 1 Number of Full-Time Positions 13 14 12 12 12 114
Department: Parks and Recreation - Parks, Gateways, and Facility Maintenance Budget Detail 2021-2022 2022-2023 2023-2024 2023-2024 % 2024-2025 % 2024-2025 % Account Number: 100-71200- Actual Actual Budget Exp to Dec Exp Requested Change Recommended Change 51100.02 Salaries and Wages $ 877,442 $ 1,044,603 $ 1,277,519 $ 538,710 42% $ 1,277,519 0% $ 1,376,555 8% 51100.04 Salaries and Wages - Overtime 40,737 41,367 17,389 25,705 148% 17,389 0% 17,389 0% 51100.06 Salaries and Wages - Part- time 130,918 112,222 139,378 60,783 44% 142,506 2% 144,953 4% 52100 FICA 78,086 88,551 109,723 46,119 42% 109,962 0% 117,726 7% 52210 VRS Retirement 107,013 143,952 177,433 76,972 43% 177,320 0% 221,959 25% 52400 Group Life 11,798 13,930 17,119 7,453 44% 17,119 0% 18,446 8% 53000.16 Purchased Services - Refuse Collection 41,938 53,588 53,500 42,288 79% 53,500 0% 53,500 0% 53000.46 Purchased Services - RM Banners 6,506 6,787 7,000 2,810 40% 7,000 0% 7,000 0% 53300 Repair and Maintenance 130,825 158,929 150,000 60,366 40% 175,000 17% 175,000 17% 53320 Maintenance Service Contracts 634,219 784,238 780,000 247,675 32% 804,000 3% 804,000 3% 54200 Fleet 463,448 437,988 454,342 259,443 57% 454,342 0% 594,351 31% 55100 Utilities 280,193 297,330 475,000 174,686 37% 516,000 9% 516,000 9% 55410 Lease/Rent of Equipment 128 5,000 5,000 40,830 817% 14,000 180% 14,000 180% 55500 Travel and Training 5,644 5,834 7,000 3,667 52% 7,000 0% 7,000 0% 56001 Office Supplies 145 411 1,000 - 0% 1,000 0% 1,000 0% 56011 Uniforms & Wearing Apparel 34,572 40,096 49,000 20,049 41% 52,000 6% 52,000 6% 56014 Other Operating Supplies 130,075 116,481 120,000 39,769 33% 120,000 0% 120,000 0% 56026 Special Events 3,760 5,971 10,000 4,007 40% 10,000 0% 10,000 0% 58200 Capital Outlay 3,570 - - - - - - -Total Operating Expenditures $ 2,981,017 $ 3,357,279 $ 3,850,403 $ 1,651,332 43% $ 3,955,657 3% $ 4,250,878 10% 56026 - Special Events: Special events supported by sponsorships and fees of $2,995. Personnel Summary 2021-2022 2022-2023 2023-2024 2024-2025 2024-2025 Range Class Actual Actual Budget Requested Recommended 217 Parks Manager 1 1 1 1 1 214 Grounds Maintenance Superintendent 1 1 1 1 1 209 Superintendent of Cemeteries 1 - - -209 Park Superintendent 1 1 1 1 1 209 Maintenance Coordinator 3 3 3 3 3 208 Grounds Crew Leader - 1 2 2 2 206 207 Park Supervisor 3 4 4 4 4 206 Recreation Facilities Supervisor 1 1 1 1 1 202 Park Attendant - 4 4 4 4 202 Grounds Maintenance Worker 8 7 9 9 9 202 Custodial Worker 3 3 3 3 3 Number of Full-Time Positions 22 26 29 29 29 115
Department: Parks and Recreation - Recreation Budget Detail 2021-2022 2022-2023 2023-2024 2023-2024 % 2024-2025 % 2024-2025 % Account Number: 100-71350- Actual Actual Budget Exp to Dec Exp Requested Change Recommended Change 51100.02 Salaries and Wages $ 870,411 $ 1,039,646 $ 1,514,022 $ 681,385 45% $ 1,597,794 6% $ 1,677,113 11% 51100.04 Salaries and Wages - Overtime 8,629 8,716 - 4,195 - - - -51100.06 Salaries and Wages - Part-time 529,728 850,233 1,249,501 649,343 52% 2,487,518 99% 1,445,081 16% 51100.10 Salaries and Wages - Seasonal 65,551 120,137 - 24,939 - - - -52100 FICA 111,383 151,531 211,410 102,175 48% 312,526 48% 238,848 13% 52210 VRS Retirement 106,174 138,916 210,146 95,261 45% 221,774 6% 286,648 36% 52400 Group Life 13,292 13,496 20,288 9,245 46% 21,410 6% 22,473 11% 53100 Professional Services 3,110 3,590 18,120 4,392 24% 23,690 31% 23,690 31% 53300 Repair and Maintenance 34,257 24,560 85,617 32,217 38% 83,610 -2% 83,610 -2% 53500 Printing and Binding 440 138 3,000 955 32% 3,000 0% 3,000 0% 53600 Advertising - - 1,000 - 0% 1,000 0% 1,000 0% 54200 Fleet 126,434 137,703 137,000 66,548 49% 137,000 0% 128,016 -7% 55100 Utilities 65,253 80,330 90,000 33,712 37% 90,000 0% 90,000 0% 55410 Lease/Rent of Equipment 69,854 69,638 72,662 - 0% 71,700 -1% 71,700 -1% 55420 Lease/Rent of Building 4,511 2,231 5,100 - 0% 5,100 0% 5,100 0% 55500 Travel and Training 11,728 14,366 12,800 8,988 70% 14,800 16% 14,800 16% 55810 Dues and Association Memberships 1,415 772 1,000 110 11% 1,000 0% 1,000 0% 55845 Expenses Related to Fee Activities 197,593 256,698 297,175 136,228 46% 331,825 12% 331,825 12% 56001 Office Supplies 1,849 7,696 9,325 1,442 15% 10,125 9% 10,125 9% 56011 Uniforms & Wearing Apparel 7,940 21,423 26,210 15,394 59% 26,500 1% 26,500 1% 56014 Other Operating Supplies 15,878 37,361 44,175 28,533 65% 47,175 7% 47,175 7% 56026 Special Events 11,946 9,304 82,750 21,287 26% 91,475 11% 91,475 11% 58200 Capital Outlay 14,000 7,494 - 17,486 - - - -Total Operating Expenditures $ 2,271,375 $ 2,995,979 $ 4,091,301 $ 1,933,834 47% $ 5,579,022 36% $ 4,599,180 12% 56026 - Special Events: Supported by sponsorships and fees of $9,700. Personnel Summary 2021-2022 2022-2023 2023-2024 2024-2025 2024-2025 Range Class Actual Actual Budget Requested Recommended 214 Youth Outreach Coordinator - - 1 1 1 214 Recreation Manager 2 2 2 2 2 212 Recreation Supervisor 4 4 4 4 4 212 Cultural Arts Coordinator 1 1 1 1 1 212 Athletic Supervisor 1 1 1 1 1 209 Therapeutic Recreation Specialist - - 1 1 1 209 Recreation Program Specialist 1 1 1 1 2 207 208 Recreation Specialist 12 12 12 14 12 208 Fitness Specialist 3 3 3 3 3 208 Bus Operator - - 1 1 1 202 Office Assistant 3 3 3 3 3 202 Custodial Worker 2 2 2 2 2 Number of Full-Time Positions 29 29 32 34 33 116
Library
Description
The Suffolk Library System offers access to a comprehensive collection of materials and works to encourage social, economic, cultural, and intellectual growth. The Library System is comprised of the Morgan Memorial Library, North Suffolk Library, Chuckatuck Library Branch, and the Bookmobile. Additionally, the Library System manages the City’s records management functions.
Council Target Area
Civic Engagement & Responsive City Services
Leisure, Health, & Wellness
Public Education
FY 25 Objectives
To capitalize on libraries as natural gathering spaces by providing spaces inside and outside our libraries that meet the diverse needs of customers.
To expand services and resources around identified needs to address gaps for those historically with little access to library and community resources
To analyze library and community data, projecting future community needs, and anticipating societal and ideological developments
To provide access to technology that addresses community needs, responds to barriers to access in Suffolk, and reduces digital divides.
To address the growing educational gap by creating excitement and innovative experiences in partnership with the learning community in Suffolk.
Budget Highlights:
Additional part-time Library Services Coordinator to assist with Early Childhood Development Commission (ECDC) implementation of Dolly Parton Imagination Library program to provide books to children under 5 years old.
Additional funding for library books and subscription services including audiobooks, ebooks, and other items.
Key Measures FY 23 Actual FY 24 Projected FY 25 Estimate Print/Audiobook Circulation Ebooks/Eaudio/Emagazines/Efilms Circulation Number of people served at outreach visits Number of children participating in classes/events Number of teens participating in classes/events Number of adults participating in classes/events Number of families participating in classes/events 298,066 49,275 5,040 9,346 800 2,765 6,289 300,000 55,000 5,000 9,500 825 2,800 6,300 305,000 60,000 5,200 10,000 850 3,000 6,750 117
Department: Library Budget Detail 2021-2022 2022-2023 2023-2024 2023-2024 % 2024-2025 % 2024-2025 % Account Number: 100-73100- Actual Actual Budget Exp to Dec Exp Requested Change Recommended Change 51100.02 Salaries and Wages $ 1,636,948 $ 1,778,264 $ 1,866,719 $ 845,950 45% $ 1,917,630 3% $ 2,007,446 8% 51100.04 Salaries and Wages - Overtime 3,470 3,372 - 881 - - - -51100.06 Salaries and Wages - Part-time 283,483 244,160 336,559 158,334 47% 400,329 19% 383,181 14% 52100 FICA 145,394 150,547 168,551 74,882 44% 177,324 5% 182,883 9% 52210 VRS Retirement 197,534 238,039 259,101 122,234 47% 266,167 3% 335,207 29% 52400 Group Life 21,168 23,059 25,014 11,854 47% 25,696 3% 26,900 8% 53000.16 Purchased Services - Refuse 2,947 3,040 4,000 1,445 36% 4,000 0% 4,000 0% 53100 Professional Services - 450 - - - - - -53200 Temporary Help Service Fees - 47,882 - 44,691 - - - -53300 Repair & Maintenance 140 410 - - - - - -54100 Information Technology 357,305 329,152 388,894 223,244 57% 388,894 0% 445,701 15% 54200 Fleet 41,394 39,684 41,200 20,650 50% 41,200 0% 52,218 27% 54500 Risk Management 284,928 358,588 334,031 167,015 50% 334,031 0% 386,577 16% 55100 Utilities 57,046 63,128 69,450 26,188 38% 69,450 0% 69,450 0% 55210 Postal Services 4,340 5,114 9,000 3,385 38% 9,000 0% 9,000 0% 55230 Telecommunications 48,495 112,197 28,654 30,721 107% 42,822 49% 42,822 49% 55420 Lease/Rent of Buildings 19,068 19,188 19,068 9,588 50% 22,776 19% 22,776 19% 55500 Travel and Training 13,792 26,267 17,500 14,051 80% 24,000 37% 19,000 9% 55667 Early Childhood Development Commission 59,999 28,000 60,000 10,553 18% 66,425 11% 66,425 11% 55810 Dues and Association Memberships 2,005 2,626 2,600 2,215 85% 6,900 165% 3,000 15% 55846 Marketing 6,920 6,354 9,000 2,760 31% 9,000 0% 9,000 0% 56001 Office Supplies 52,093 43,537 44,000 32,416 74% 57,500 31% 50,000 14% 56012 Books and Subscriptions 178,423 315,157 420,000 313,217 75% 630,000 50% 520,000 24% 56017 Copier Costs 31,763 36,017 30,207 14,967 50% 30,207 0% 30,207 0% 56026 Special Events 16,763 22,303 20,000 9,667 48% 24,500 23% 24,500 23% 58200 Capital Outlay 4,672 37,282 20,000 - - 17,500 -13% - -100% Total Operating Expenditures $ 3,470,088 $ 3,933,816 $ 4,173,547 $ 2,140,910 51% $ 4,565,351 9% $ 4,690,293 12% Personnel Summary 2021-2022 2022-2023 2023-2024 2024-2025 2024-2025 Range Class Actual Actual Budget Requested Recommended Director of Libraries 1 1 1 1 1 223 Assistant Director of Libraries 1 1 1 1 1 218 Library Manager 4 4 4 4 4 214 Administrative Analyst 1 1 1 1 1 213 Senior Librarian 4 4 4 4 4 211 Record Management Supervisor - - - 1211 Marketing and Community Relations Supervisor - 1 1 1 1 211 Learning and Staff Development Supervisor - 1 1 1 1 211 ECDC Coordinator 1 1 1 1 1 210 Librarian 4 4 4 4 4 208 Library Services Coordinator 8 6 6 6 6 205 Administrative Assistant 1 1 1 1 1 204 Staff Support Assistant 1 1 1 1 1 202 Library Associate 7 7 7 7 7 Number of Full-Time Positions 33 33 33 34 33 118
Description
Planning and Community Development
The Department of Planning and Community Development is responsible for the City’s overall land planning program and building permit, inspections, enforcement, and zoning administration. The Department also manages the Community Development Block Grant (CDBG) and HOME Investment Partnership (HOME) grant programs and staffs the Suffolk Planning Commission, Board of Zoning Appeals, Wetlands Board, and Historic Landmark Commission. The Department is comprised of the divisions of Planning and Community Development Services.
Council Target Area
Growth Management & Comprehensive Planning
FY 25 Objectives
To provide opportunities for both passive and active recreation space and improvements within high quality residential development in accordance with adopted ordinances and policies.
To facilitate job creation and private investment through plan review approval and building inspections.
To provide opportunities for citizen feedback, engagement and participation in land use matters and the process of updating the City’s comprehensive plan.
To coordinate, review, and provide recommendations on land use matters that are consistent with adopted land use plans, ordinances, and policies. Key
Number of community development applications processed
Number of building plan reviews completed
Number of building permits processed Number of building inspection requests Number of code compliance inspections Percent
requests for inspections performed within two business days
Budget Highlights:
Three new full-time positions including Zoning Official, Zoning Technician, and Service Support Manager.
Additional funding for property demolition to enhance community development in the City.
FY 23 Actual FY 24 Projected FY 25 Estimate
Measures
Number of development
approved Percent of development plans reviewed within 30 days 15,095 1,599 17,853 34,328 8,800 95% 378 89% 11,680 1,241 10,377 29,834 5,847 95% 288 92% 11,886 1,264 10,567 30,381 5,955 97% 301 95% 119
of
plans
Department: Planning and Community Development Budget Detail 2021-2022 2022-2023 2023-2024 2023-2024 % 2024-2025 % 2024-2025 % Account Number: 100-81100- Actual Actual Budget Exp to Dec Exp Requested Change Recommended Change 51100.02 Salaries and Wages $ 2,235,135 $ 2,507,880 $ 3,301,762 $ 1,270,770 38% $ 3,533,555 7% $ 3,694,174 12% 51100.04 Salaries and Wages - Overtime 57,665 39,376 - 6,128 - - - -51100.06 Salaries and Wages - Part-time 44,577 43,256 - - - - - -52100 FICA 173,085 190,226 252,585 93,494 37% 270,317 7% 282,604 12% 52210 VRS Retirement 268,200 341,200 458,285 185,065 40% 490,457 7% 609,026 33% 52400 Group Life 28,611 33,015 44,244 17,948 41% 47,350 7% 49,502 12% 53100 Professional Services 23,925 21,350 30,400 11,353 37% 35,400 16% 35,400 16% 53100.06 Professional Services - Consulting Services 258,112 342,191 900,000 105,707 12% 1,250,000 39% 500,000 -44% 53100.30 Professional Services - Demolition 116,901 126,063 400,000 231,738 58% 750,000 88% 750,000 88% 53175 Neighborhood Improvements 24,732 29,874 70,000 6,705 10% 100,000 43% 100,000 43% 53200 Temporary Help Service Fees 5,670 - - - - - - -53600 Advertising 57,330 25,133 20,000 11,764 59% 21,000 5% 21,000 5% 54100 Information Technology 241,258 266,064 323,377 156,070 48% 323,377 0% 364,338 13% 54200 Fleet 96,577 108,997 106,000 43,666 41% 106,000 0% 144,331 36% 54500 Risk Management 350,950 450,770 541,062 270,531 50% 541,062 0% 572,137 6% 55210 Postal Services 15,245 20,389 17,500 685 4% 12,500 -29% 12,500 -29% 55230 Telecommunications 37,464 43,261 57,207 17,266 30% 57,207 0% 52,260 -9% 55500 Travel and Training 15,247 45,324 40,000 15,875 40% 50,000 25% 50,000 25% 55810 Dues and Association Memberships 3,579 4,420 8,650 1,864 22% 8,650 0% 8,650 0% 56001 Office Supplies 14,969 15,029 60,000 3,090 5% 60,000 0% 60,000 0% 56011 Uniforms & Wearing Apparel - 1,809 - - - - - -56012 Books and Subscriptions 7,075 8,204 8,500 1,740 20% 8,500 0% 8,500 0% 56014 Other Operating Supplies - 136 - - - 5,000 - -56017 Copier Costs 35,313 35,860 26,444 12,842 49% 26,444 0% 26,444 0% 58200 Capital Outlay - - - - - - - -Total Operating Expenditures $ 4,111,620 $ 4,699,826 $ 6,666,015 $ 2,464,300 37% $ 7,696,819 15% $ 7,340,865 10% 53170 - Professional Service - Demolition: Demo of unsafe structures and public nuisance. 53175 - Neighborhood Improvements: Removal of trash, debris, weeds, grass, inoperable vehicles and nuisances in violation of City ordinances. Personnel Summary 2021-2022 2022-2023 2023-2024 2024-2025 2024-2025 Range Class Actual Actual Budget Requested Recommended Director of Planning & Community Development 1 1 1 1 1 223 Assistant Director of Planning 1 1 1 1 1 223 Assistant Director of Community Development 1 1 1 1 1 219 Current Planning Manager 1 1 1 1 1 219 Comprehensive Planning Manager 1 1 1 1 1 218 Service Support Manager - - - 1 1 218 Senior Planner 2 2 3 3 3 218 Building Official 1 1 1 1 1 217 Zoning Administration and Enforcement Manager 1 1 1 1 1 217 Housing/Property Maintenance Official 1 1 1 1 1 217 Assistant Building Official/Inspector 1 1 1 2 1 214 Plans Reviewer 2 3 3 3 3 214 Fire Protection Building Plans Reviewer 1 1 1 1 1 214 Administrative Analyst 1 1 1 1 1 213 Planner I/II 3 4 4 4 4 213 Permit Manager 1 1 1 1 1 213 Assistant Zoning Administration and Enforcement Coordinator 1 1 1 1 1 212 Zoning Official - - - 1 1 209/210/212 Building Inspector I-III 9 10 10 10 10 208/209 Zoning Inspector I-II 2 2 3 3 3 209 Housing/Property Maintenance Inspector 4 5 5 5 5 208 Senior Permit Technician 4 3 3 3 3 207 Zoning Technician - - - 1 1 207 Planning Technician 3 3 3 3 3 207 Permit Technician 2 4 4 4 4 204 Staff Support Assistant 1 1 1 1 1 202 Office Assistant 1 1 2 2 2 Number of Full-Time Positions 46 51 54 58 57 120
Economic Development
Description
The Department of Economic Development helps secure the City’s tax base by attracting industry and creating new jobs. The Department is tasked with maintaining and encouraging a favorable business environment throughout the City. The Department also provides staff support to the Economic Development Authority (EDA) and oversees the divisions of Aviation Facilities and Tourism.
Council Target Area FY 25 Objectives
Expanded Economic Development
To continue implementation of the downtown master plan with a special focus on entrepreneurship and economic gardening for retail and restaurant sectors.
To work with regional partners to create new tax revenues and attract high-paying jobs in advanced manufacturing, food and beverage, agriculture, and other growing sectors.
To facilitate the development of strategic publicprivate partnerships to encourage the highest and best use of property within Suffolk.
To partner with internal and external organizations to improve neighborhoods, quality of life, and housing opportunities for Suffolk residents.
To access federal, state, and local grant opportunities, tax credits, and other resources to encourage and facilitate redevelopment, mixeduse, infill, greenfield, brownfield, and other projects throughout Suffolk.

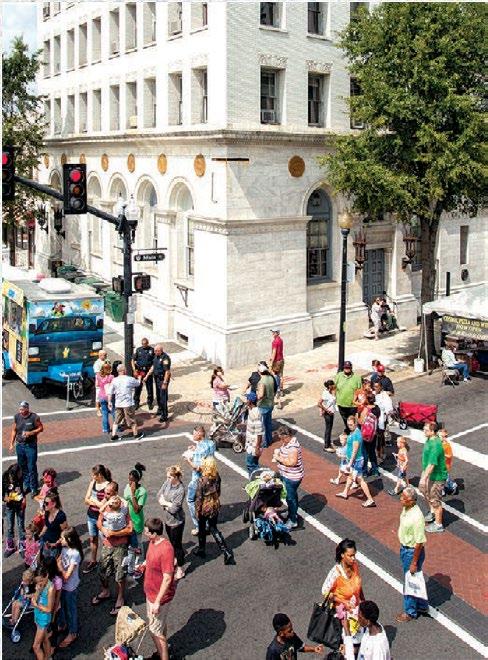
Budget Highlights:
Full-Time Agricultural Specialist position added to promote economic opportunities for the City’s agricultural sector.
Key Measures CY 22 Actual CY 23 Actual CY 24 Estimate Number of jobs created Amount of capital investment secured Square footage of capital investment Existing industry visits Marketing missions undertaken 598 $369M 3,000,000 506 147 795 $384M 3,200,000 447 157 850 $395M 3,500,000 470 165 121
Department: Economic Development Budget Detail 2021-2022 2022-2023 2023-2024 2023-2024 % 2024-2025 % 2024-2025 % Account Number: 100-81500- Actual Actual Budget Exp to Dec Exp Requested Change Recommended Change 51100.02 Salaries and Wages $ 289,537 $ 368,430 $ 490,198 $ 188,713 38% $ 490,198 0% $ 631,534 29% 51100.04 Salaries and Wages - Overtime 30 114 - 24 - - - -51100.14 Transportation Expense 5,533 2,767 4,000 1,900 47% 4,000 0% 4,000 0% 52100 FICA 21,767 27,522 37,500 14,184 38% 37,500 0% 48,312 29% 52210 VRS Retirement 34,036 49,274 68,039 27,329 40% 68,039 0% 104,845 54% 52400 Group Life 5,241 4,785 6,569 2,659 40% 6,569 0% 8,463 29% 53100 Professional Services 48,188 37,830 100,000 22,193 22% 100,000 0% 100,000 0% 53500 Printing and Binding - - 4,000 129 3% 4,000 0% 4,000 0% 54100 Information Technology 29,233 21,976 28,192 12,054 43% 28,192 0% 30,906 10% 54200 Fleet 5,197 4,642 5,055 1,711 34% 5,055 0% 1,310 -74% 54500 Risk Management 46,657 57,930 60,094 30,047 50% 60,094 0% 61,600 3% 55210 Postal Services 1,603 788 5,000 330 7% 5,000 0% 5,000 0% 55230 Telecommunications 8,331 10,210 9,136 2,918 32% 9,136 0% 9,136 0% 55500 Travel and Training 12,442 30,134 45,000 15,347 34% 45,000 0% 45,000 0% 55671 Economic Development Investment Program 972,827 55,743 1,500,000 120,000 8% 1,500,000 0% 1,500,000 0% 55810 Dues and Association Memberships 110,187 119,915 132,000 109,733 83% 140,000 6% 140,000 6% 55846 Marketing 187,665 162,235 216,000 75,842 35% 216,000 0% 216,000 0% 56001 Office Supplies 3,693 1,906 3,000 1,213 40% 3,000 0% 3,000 0% 56012 Books and Subscriptions - 6,919 350 350 100% 350 0% 350 0% 56017 Copier Costs 4,601 5,531 4,772 1,864 39% 4,772 0% 4,772 0% Total Operating Expenditures $ 1,786,768 $ 968,649 $ 2,718,906 $ 628,538 23% $ 2,726,905 0% $ 2,918,228 7% 53100 - Professional Services: Conceptual site plans for commercial/industrial sites, legal support for EDA. 55671 - Economic Development Investment Program: Funds are reserved with accumulating balance reappropriated annually for expenditure. Personnel Summary 2021-2022 2022-2023 2023-2024 2024-2025 2024-2025 Range Class Actual Actual Budget Requested Recommended Director of Economic Development 1 1 1 1 1 222 Assistant Director of Economic Development 1 1 1 1 1 218 Senior Business Development Manager - - - - 1 218 217 Business Development Manager 1 1 1 1 1 217 Economic Development Manager 1 1 1 1216 Agricultural Specialist - - - - 1 214 Business Development Analyst 1 1 1 1 1 210 Economic Development Associate 1 1 1 1 1 Number of Full-Time Positions 6 6 6 6 7 122
Description
The Division of Tourism is the destination marketing organization (“DMO”) of record for the City of Suffolk. The Division works with public and private hospitality sectors to conceptualize and implement programs encouraging sustainable economic growth and development by increasing visitor and conference business. The Division operates the Visitor Center and gift shop and the Seaboard Station Railroad Museum, as well as plans and produces various special events including the Suffolk Farmers’ Market
Council Target Area FY 25 Objectives
Expanded Economic Development
Tourism
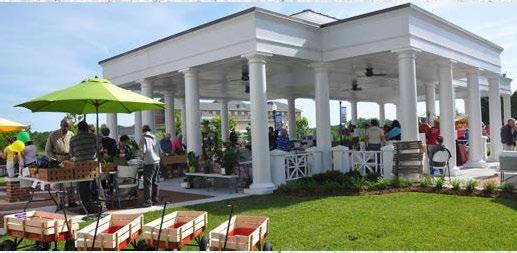
To enhance tourism product for business and leisure travelers, conference and meeting planners, increasing consumer expenditures, generating valuable tax revenue to support essential services for Suffolk’s citizens.
To strategize methods to increase consumer support and spending with local businesses and attractions.
To work with rural communities to development agritourism products resulting in untapped revenue streams.
To educate the public about the history of Suffolk with an emphasis on the Seaboard Station Railroad Museum, Great Dismal Swamp Wildlife Refuge, and other historic landmarks and Suffolk’s cultural heritage.
To offer quality, year-round, family-friendly tours and events for citizens and visitors.
Budget Highlights:
Full-Time Visitor Center Advisor added to address staffing needs at Suffolk Visitors Center.
Increase in professional services funding for kayak rental program.
Increase in funding for special events programs.
Key Measures CY 22 Actual CY 23 Projected CY 24 Estimate Number of Visitor Center/Farmers’ Market patrons Farmers’ Market vendor sales Number of interpretive tour customers Number of interpretive tour customers Number of conferences, reunions, weddings, events serviced 28,316 $253,000 587 44 28,073 $314,000 550 42 28,000 $300,000 565 45 123
Division: Tourism (Department of Economic Development) Budget Detail 2021-2022 2022-2023 2023-2024 2023-2024 % 2024-2025 % 2024-2025 % Account Number: 100-81550- Actual Actual Budget Exp to Dec Exp Requested Change Recommended Change 51100.02 Salaries and Wages $ 199,873 $ 218,032 $ 229,958 $ 108,126 47% $ 327,637 42% $ 269,582 17% 51100.04 Salaries and Wages - Overtime 2,107 - - - - - - -51100.06 Salaries and Wages - Part-time 121,087 132,286 144,372 62,348 43% 109,980 -24% 114,379 -21% 52100 FICA 24,717 26,420 28,636 12,861 45% 33,478 17% 29,373 3% 52210 VRS Retirement 24,377 30,219 31,918 15,959 50% 45,476 42% 52,671 65% 52400 Group Life 2,619 2,917 3,081 1,541 50% 4,390 42% 3,612 17% 53000.16 Purchases Services - Refuse Collection 303 303 303 152 50% 303 0% 303 0% 53100 Professional Services - - 4,000 - 0% 30,000 650% 30,000 650% 53500 Printing and Binding 1,321 1,218 2,000 687 34% 3,000 50% 3,000 50% 53600 Advertising 50,077 50,290 45,000 40,316 90% 50,000 11% 50,000 11% 54100 Information Technology 17,540 49,394 60,017 27,119 45% 60,017 0% 69,538 16% 54200 Fleet 12,929 13,511 14,796 4,740 32% 14,796 0% 3,119 -79% 54500 Risk Management 30,598 29,203 30,354 15,177 50% 30,354 0% 30,927 2% 55100 Utilities 12,907 13,587 28,900 8,850 31% 28,900 0% 28,900 0% 55210 Postal Services 2,209 1,776 6,000 949 16% 6,000 0% 6,000 0% 55230 Telecommunications 1,382 1,318 2,219 382 17% 2,219 0% 2,219 0% 55500 Travel and Training 2,986 5,206 6,500 2,377 37% 6,500 0% 6,500 0% 55810 Dues and Association Memberships 2,735 3,297 3,500 2,674 76% 3,500 0% 3,500 0% 55846 Marketing 76,040 59,706 60,000 26,333 44% 60,000 0% 60,000 0% 56001 Office Supplies 4,313 7,201 8,500 4,546 53% 8,500 0% 8,500 0% 56015 Merchandise for Resale 14,637 14,332 20,000 11,505 58% 20,000 0% 20,000 0% 56017 Copier Costs 10,374 13,665 10,100 5,268 52% 10,100 0% 10,100 0% 56026 Special Events 120,256 150,031 152,000 91,858 60% 184,000 21% 184,000 21% Total Operating Expenditures $ 735,388 $ 823,914 $ 892,155 $ 443,767 50% $ 1,039,150 16% $ 986,222 11% 56026 - Special Events: Costs offset by sponsorships and fees of: $28,000. Personnel Summary 2021-2022 2022-2023 2023-2024 2024-2025 2024-2025 Range Class Actual Actual Budget Requested Recommended 218 Tourism Development Manager 1 1 1 1 1 216 Tourism Development Specialist 1 2 2 3 2 207 Visitor Center Supervisor 1 - - -202 Visitor Center Advisor - - - 1 1 Number of Full-Time Positions 3 3 3 5 4 124
Communications
Description
The Communications Department provides communication and public information advice to the City Manager, City Council, and City departments; serves as the City’s spokesperson with news and media outlets; oversees the City’s Freedom of Information Act (FOIA) Office, Municipal Access Channel 190, and the City’s website; disseminates information regarding City activities, programs, and services; and coordinates public meetings and forums.
Council Target Area
Civic Engagement & Responsive City Services
FY 25 Objectives
To continue to work with all City departments to highlight City services, spur new business growth, and inform citizens of community assets via the coordination and production of programming for the Municipal Channel, creation of public service announcements, media releases, and via our vast social media platforms.
To courteously and professionally greet citizens, answer questions, provide assistance, and direct calls as operators of the City’s switchboard and as frontline ambassadors to citizens entering City Hall.
To continue with the coordination of all aspects of multiple City events, including the annual State of the City, national award winning National Night Out, ribbon cutting and ground breaking ceremonies for City facilities, and Investiture ceremonies in addition to the creation, coordination, and production of high quality citizen engagement materials for City departments.
To handle Freedom of Information Act (FOIA) requests properly and timely in accordance with local and state laws and statutes.
To serve as the public information officer at incidents during regular business hours for breaking news and the production of media releases, on-air interviews with local media, and responses to media inquiries related to specific incidents. Key
Number of public service announcements
Number of programs produced on Municipal Channel 190 Number of followers, fans, or subscribers to City social media websites Number
FOIA requests received
Budget Highlights:
Webmaster position added to coordinate ongoing updates to the City’s website.
Increase in professional services funding for logo and slogan rebranding and social media management tool.
Measures FY 22 Actual FY 23 Projected FY 24 Estimate
Percent of FOIA requests responded to within mandatory timeframes prescribed by state law 116 113 77,000 3,330 98% 127 124 78,000 2,730 99% 139 136 85,000 3,549 100% 125
of
Department: Communications Budget Detail 2021-2022 2022-2023 2023-2024 2023-2024 % 2024-2025 % 2024-2025 % Account Number: 100-81650- Actual Actual Budget Exp to Dec Exp Requested Change Recommended Change 51100.02 Salaries and Wages $ 432,635 $ 349,313 $ 605,132 $ 258,592 43% $ 707,974 17% $ 746,278 23% 51100.04 Salaries and Wages - Overtime 16,210 19,563 10,000 10,048 100% 15,000 50% 10,000 0% 51100.06 Salaries and Wages - Part-time 29,989 32,971 34,256 14,390 42% 83,476 144% 35,627 4% 52100 FICA 35,847 28,984 49,678 20,764 42% 61,693 24% 60,581 22% 52210 VRS Retirement 50,870 46,597 83,992 36,895 44% 98,267 17% 123,333 47% 52400 Group Life 6,048 4,509 8,109 3,578 44% 9,487 17% 10,000 23% 53100 Professional Services - 15,493 20,000 2,050 10% 110,000 450% 110,000 450% 53200 Temporary Help Service Fees - 30,646 - 22,954 - - - -53300 Repair and Maintenance 9,963 12,460 15,000 2,465 16% 15,000 0% 15,000 0% 53320 Maintenance Service Contracts 22,489 21,204 25,000 7,884 32% 25,000 0% 25,000 0% 53500 Printing and Binding 181 - 3,000 - 0% 3,500 17% 3,500 17% 54100 Information Technology 57,398 109,117 184,600 27,832 15% 184,600 0% 125,625 -32% 54200 Fleet 6,186 5,761 7,139 397 6% 7,139 0% 2,914 -59% 54500 Risk Management 46,730 58,000 61,096 30,548 50% 61,096 0% 82,127 34% 55210 Postal Services 459 505 1,000 190 19% 1,200 20% 1,200 20% 55230 Telecommunications 12,230 15,141 9,686 5,369 55% 9,686 0% 9,686 0% 55500 Travel and Training 523 833 10,000 19 0% 25,000 150% 20,000 100% 55810 Dues and Association Memberships 149 986 1,200 - 0% 1,500 25% 1,500 25% 55846 Marketing 25,585 17,785 20,000 7,105 36% 20,000 0% 20,000 0% 56001 Office Supplies 3,498 4,990 4,000 1,381 35% 5,000 25% 5,000 25% 56012 Books and Subscriptions 161 759 750 519 69% 750 0% 750 0% 56017 Copier Costs 7,961 7,525 8,182 3,578 44% 8,182 0% 8,182 0% 56026 Special Events - 13,269 30,000 6,965 23% 30,000 0% 30,000 0% 58200 Capital Outlay 121,787 - 5,000 - 0% 6,000 20% 6,000 20% Total Operating Expenditures $ 886,899 $ 796,411 $ 1,196,820 $ 463,524 39% $ 1,489,550 24% $ 1,452,303 21% Personnel Summary 2021-2022 2022-2023 2023-2024 2024-2025 2024-2025 Range Class Actual Actual Budget Requested Recommended Director of Media & Community Relations 1 1 1 1 1 223 Assistant Director of Media & Community Relations 1 1 1 1 1 217 Video Production Manager 1 1 1 -216 Webmaster - - - 1 1 216 Multi-Media Analyst 1 1 2 4 4 216 FOIA Specialist - - 1 2 2 207 Video Production Assistant 1 1 1 -205 Administrative Assistant 1 1 1 1Number of Full-Time Positions 6 6 8 10 9 126
Description
Virginia Cooperative Extension
The Virginia Cooperative Extension Service is a division of Virginia Polytechnic and State University responsible for providing technical information, educational programs, and problem solving consultation in the area of agriculture, 4-H and youth, home economics, natural resources, and community resource development for all citizens.
Council Target Area
Civic Engagement & Responsive City Services
Expanded Economic Development
Budget Highlights:
No significant changes.
FY 25 Objectives
To establish a cooperative partnership with each school in order to provide positive youth development programming to students in the areas of healthy living, civic engagement, STEM, and agriculture.
To expand youth participation in community 4-H clubs including, but not limited to, livestock and poultry, equine, canine, and teen leadership.
To work collectively with all department staff to bring innovative, interdisciplinary programming to traditionally underserved areas of the local community and updating our situational analysis report.
To continue to create and maintain local partnerships that enable Virginia Cooperative Extension programming to be based on community needs and are equal and accessible to all citizens.
To increase the profitability of local agricultural producers, both large and small, while also promoting sustainable farming practices and introducing technology that assists in all facets of their livelihoods.
Key Measures FY 23 Actual FY 24 Projected FY 25 Estimate Agriculture and Natural Resources: Number of programs offered Number of citizens participating in programs Youth Programs: Number of youth programs offered Number of youth participating in youth programs 19 441 32 500 21 475 40 550 21 480 40 575 127
Department: Virginia Cooperative Extension Budget Detail 2021-2022 2022-2023 2023-2024 2023-2024 % 2024-2025 % 2024-2025 % Account Number: 100-83500- Actual Actual Budget Exp to Dec Exp Requested Change Recommended Change 53100 Professional Services $ 25,354 $ 50,137 $ 68,960 $ 5,177 8% $ 77,622 13% $ 77,622 13% 55210 Postal Services 836 120 750 70 9% 750 0% 750 0% 55230 Telecommunications 2,457 2,344 4,160 679 16% 4,160 0% 4,160 0% 55500 Travel and Training - - 1,200 - 0% 1,200 0% 1,200 0% 55810 Dues and Association Memberships 120 130 500 245 49% 500 0% 500 0% 56001 Office Supplies 429 1,059 1,700 718 42% 1,700 0% 1,700 0% 56017 Copier Costs 1,889 1,913 1,847 715 39% 1,847 0% 1,847 0% Total Operating Expenditures $ 31,084 $ 55,703 $ 79,117 $ 7,604 10% $ 87,779 11% $ 87,779 11% 128
Local and Regional Organizations
Description
The City of Suffolk provides financial assistance to a number of local and regional non-profit organizations which provide services to Suffolk’s citizens. Many of the organizations receive matching grants or support from other localities allowing for more extensive and comprehensive services than the City could afford on its own due to economies of scale.
129
Department: Local and Regional Organizations Budget Detail 2021-2022 2022-2023 2023-2024 2023-2024 % 2024-2025 % 2024-2025 % Account Number: 100-151100- Actual Actual Budget Exp to Dec Exp Requested Change Recommended Change Regional Membership Organizations: 55661 Hampton Roads Planning District Commission $ 80,716 $ 86,517 $ 86,517 $ 99,179 115% $ 100,690 16% $ 100,690 16% 55680 Hampton Roads Military and Fed Fac. Alliance 46,912 47,480 48,065 24,033 50% 49,590 3% 49,590 3% 55810 City Wide Dues/ Memberships 31,150 56,874 60,000 58,093 97% 65,000 8% 65,000 8% Local Organization Partnerships: 55655 SRHA $ 157,500 $ 165,000 $ 185,000 $ 92,500 50% $ 171,309 -7% $ 171,309 -7% 55674 Suffolk Center for the Cultural Arts 367,500 1,367,500 385,875 192,938 50% 447,793 16% 447,793 16% 55678 Suffolk Office of the Public Defender - - 207,000 207,000 100% 207,000 0% 207,000 0% Local Nonprofit Organization Contributions: 55619 STOP Inc. $ - $ - $ 10,000 $ 10,000 100% $ 15,000 50% $ 10,000 0% 55621 Beacon of Hope - - - 112,030 - - - -55646 Fifth Judicial District Drug Court 50,000 50,000 50,000 25,000 50% 80,000 60% 50,000 0% 55648 Suffolk Nansemond Historic Society 3,675 5,000 10,000 10,000 100% 21,500 115% 12,500 25% 55651 Senior Services of Southeastern Virginia 10,500 13,000 50,000 25,000 50% 70,677 41% 50,000 0% 55652 ForKids 31,500 35,000 45,000 22,500 50% 55,000 22% 50,000 11% 55653 Food Bank of Southeastern Virginia 20,000 20,000 20,000 20,000 100% 40,000 100% 30,000 50% 55654 The Genieve Shelter 23,000 25,000 30,000 15,000 50% 40,000 33% 35,000 17% 55656 Endependence Center, Inc. 7,875 7,875 10,000 10,000 100% 15,000 50% 10,000 0% 55657 Eastern Virginia Medical School - - 99,010 49,505 50% 101,980 3% 99,010 0% 55658 Riddick's Folly 21,000 25,000 35,000 17,500 50% 35,000 0% 35,000 0% 55659 Suffolk Fine Arts Commission 12,000 12,000 12,000 - 0% 12,000 0% 12,000 0% 55660 Suffolk Clean Community Commission 15,689 19,675 30,000 4,724 16% 35,000 17% 35,000 17% 55662 CHKD Child Abuse Program 5,000 10,000 20,000 20,000 100% 20,000 0% 20,000 0% 55664 Suffolk Sister Cities International 5,250 5,250 7,500 7,500 100% 7,500 0% 7,500 0% 55665 Peanut Soil and Water Conservation District 5,000 5,000 10,000 10,000 100% 12,000 20% 12,000 20% 55668 The Children's Center 21,000 21,000 30,000 15,000 50% 35,000 17% 35,000 17% 55669 Meals on Wheels of Suffolk and Isle of Wight - - - - - 5,000 - 5,00055675 Suffolk Festivals, Inc. 30,000 30,000 40,000 20,000 50% 75,000 88% 45,000 13% 55679 Virginia Legal Aid Society 8,400 8,400 15,000 15,000 100% 50,000 233% 20,000 33% 55681 Western Tidewater Free Clinic 185,800 214,650 248,986 124,493 50% 310,918 25% 300,000 20% 55688 Paul D Camp Community College 26,250 30,000 54,953 27,477 50% 54,953 0% 54,953 0% 55689 Suffolk Literacy Council 2,500 - - - - - - -55694 Hampton Roads Workforce Council 22,040 22,523 24,049 12,025 50% 24,634 2% 24,634 2% 55695 Coalition Against Poverty (CAPS) 25,000 25,000 35,000 17,500 50% 50,000 43% 35,000 0% 55697 Court Appointed Special Advocates (CASA) - 22,000 22,000 11,000 50% 22,000 0% 22,000 0% 55698 Mercy Medical Angels - 1,000 5,000 5,000 100% 5,000 0% 5,000 0% 55699 Suffolk General District Court - Behavioral Health Docket - 45,500 - - - - - -Suffolk Christian Fellowship Center - - - - - 30,374 - 15,000Suffolk Youth Athletic Association - - - - - 40,250 - -Walk In It Inc. - - - - - 50,000 - -Total Operating Expenditures $ 1,215,257 $ 2,376,244 $ 1,885,955 $ 1,279,995 68% $ 2,355,168 25% $ 2,070,979 10% 130
Non-Departmental General Fund
Description
The Non-Departmental General Fund budget includes expenditures that cover the costs associated with a number of City departments including anticipated costs for leave compensation, unemployment payments, and transfers to other funds.
131
Department: Non-Departmental - General Fund Budget Detail 2021-2022 2022-2023 2023-2024 2023-2024 % 2024-2025 % 2024-2025 % Account Number: 100-091400- Actual Actual Budget Exp to Dec Exp Requested Change Recommended Change Fringe Benefits & Insurances: 51100.27 Leave Compensation $ 598,742 $ - $ 1,352,697 $ - - $ 1,300,000 -4% $ 1,300,000 -4% 52100 Leave Compensation - FICA 45,629 - 72,675 - - 99,450 37% 99,450 37% 52600 Unemployment Payments 16,377 54,563 100,000 3,495 3% 100,000 0% 100,000 0% 55230 Telecommunications 12,590 12,013 - 3,477 - - - -55821 Employee Funds Expense - 42,689 - - - - - -56550 Miscellaneous - 1,247,087 - - - - - -59902 Contingency - - 1,360,000 - - 1,300,000 -4% 1,300,000 -4% Sub-Total: $ 673,338 $ 1,356,352 $ 2,885,372 $ 6,973 0% $ 2,799,450 -3% $ 2,799,450 -3% Transfer to Other Funds / Designations: 50000.208 Transfer to Suffolk Taxing District $ - $ - $ - $ 10,819 - $ - - $ -50000.210 Transfer to Road Maintenance 127,790 - - - - - - -50000.211 Transfer to Grants (Local Cash Match) 316,623 390,942 800,000 421,297 53% 800,000 0% 800,000 0% 50000.212 Transfer to Transit Fund (Operating Support) 1,008,200 418,582 753,056 - - 854,810 14% 418,604 -44% 50000.220 Transfer to Aviation Fund (Operating Support) 112,815 109,055 168,115 168,115 100% 168,554 0% 179,846 7% 50000.310 Transfer to Capital Projects (Cash Fund Projects) 5,641,950 9,000,058 21,595,411 23,195,411 107% 18,677,809 -14% 26,677,809 24% 50000.401 Transfer to Debt Service Fund 25,699,851 27,583,236 31,734,328 4,191,302 13% 32,523,070 2% 32,523,070 2% 50000.501 Transfer to Public Utilities 146,910 - - - - - - -50000.514 Transfer to Stormwater 70,739 - - - - - - -50000.520 Transfer to Refuse 36,227 - - - - - - -50000.601 Transfer to Fleet 28,792 - - - - - - -50000.603 Transfer to Information Technology (Cash Fund Projects) 291,704 250,000 - - - - - -50000.606 Transfer to Risk 12,433 - - - - - - -Sub-Total: $ 33,494,035 $ 37,751,872 $ 55,050,910 $ 27,986,944 51% $ 53,024,243 -4% $ 60,599,329 10% Total Operating Expenditures $ 34,167,372 $ 39,108,224 $ 57,936,282 $ 27,993,917 48% $ 55,823,693 -4% $ 63,398,779 9% 132
Capital Projects Fund
133
THIS PAGE INTENTIONALLY BLANK
134
Capital Projects Fund
Description
The Capital Projects Fund provides funding for nonrecurring capital expenditures which are primarily financed through transfers from the General Fund, Capital Reserve funds, and the sale of General Obligation, Stormwater, and Utility Revenue bonds. Other capital project funding sources include state and federal grants, private contributions, special revenue funds, and enterprise fund cash transfers. Capital projects are planned and funded by incorporating the total funding requirements for completion into future construction costs.
FY 25 Capital Projects
The FY 2025-2034 Capital Improvements Program and Plan (CIP) was adopted by City Council on February 21, 2024. The CIP includes a five year program totaling $383.1M and ten year horizon of $1.5B. The following guiding principles were used to develop the CIP: 1) keep existing multi-year projects moving forward, 2) prioritize projects that leverage state, federal, and other grant funds, and 3) maintain long-term affordability with a modest increase in bond capacity and utilization of recurring general fund cash and capital reserve funds within the City’s financial policies. The proposed FY 2024-2025 Capital Projects Fund budget totals $83.5M. This investment will help maintain and improve City infrastructure, quality of life, and program and service delivery.
General Government: $69.9M
Parks & Recreation
- Capital Maintenance
- Seaboard Coastline Trail
- Water Access – Nansemond River
- Lake Meade Park Improvements
- Cedar Hill Slope Stabilization
- Gateway Beautification
Public Buildings and Facilities
- Airport Terminal Kitchen/Dining Renovation
- T-Hanger G
- Capital Maintenance
- Godwin Courts Building Improvements
- Access Rd. – Joint Operations/Training Complex
- North Street Parking Improvements
Public Safety
- Fire Apparatus (Replacements)
- Ambulance (Replacements)
- Station 4 Replacement (Lake Kilby)
- Police Training Center (Whaleyville)
Transportation
- Holland Road
- Nansemond Parkway/Bennetts Pasture Intersection
- Shoulders Hill Rd./RT. 17 Intersection
- Channel Dredging/Waterway Navigation
- Rail Crossing Improvements
- Miscellaneous Roadway Improvements
- RT 58 Improvements – Longstreet to Holland
Bypass
- Townpoint Sidewalk
Transportation
- Pitchkettle Road Realignment
- Citywide Guardrail Project
- Ironside Drive Extension @ The Point at Harbour View
Public Schools
- JFK Middle School Replacement
- Northern Shores Elementary School Addition
Village & Neighborhood Initiatives
- Village & Neighborhoods
- Open Space Initiatives
- Downtown Implementation Plan Initiatives
Contingency
Public Utilities Fund: $7.5M
Water Source Development and Water Treatment
Plant Expansion
Water System Upgrades
Sanitary Sewer System Upgrades
Stormwater Fund: $5.9M
Citywide Drainage Improvements
Olde Towne Drainage Improvements
Oakland Drainage Improvements
Woodrow South Drainage
First Avenue Drainage
Sadler Heights
Downtown Infrastructure Improvements
Jefferson Street Drainage
Transit Fund: $60K
Transit Operations Facility (A/E)
135
Expenditure Summary
FUND Revenue 2021-2022 2022-2023 2023-2024 2023-2024 2024-2025 % 2024-2025 % Actual Actual Budget YTD to Dec Requested Chng Recommended Chng Transfer from General Fund (Pay-Go) $ 5,641,950 $ 9,000,058 $ 21,595,411 $ 23,195,411 107% $ 18,677,809 -14% $ 26,677,809 24% General Obligation Bonds 29,750,000 29,911,939 30,000,000 30,000,000 100% 10,236,859 -66% 10,236,859 -66% Literary Loan - - - - - 25,000,000 - 25,000,000State/Federal Aviation 77,763 2,230,697 1,470,000 234,535 16% 480,000 -67% 480,000 -67% State/Federal Fire - - - - - - - -State/Federal Parks & Recreation - - 3,816,200 65,497 2% 5,185,741 36% 2,073,089 -46% State/Federal Transit - - - - - - -State/Federal Transportation 24,728,332 29,303,248 44,346,641 6,210,945 14% 4,464,070 -90% 4,464,070 -90% Cash Proffers - 1,624,746 - - - - - -Gifts, Donations & Contributions - 448,455 - - - 300,000 - 300,000Miscellaneous Revenue - 61,834 - 184,576 - - - -Transfer from Schools - - - 15,130,400 - - - -Transfer from Aviation 9,215 4,000 - - - - - -Transfer from Road Maintenance Fund 1,055,448 704,114 733,977 1,028,977 - - - -Transfer from Transit 744,444 - - - - 60,000 - 60,000Transfer from RT17 Tax District - 4,139,443 - - - 700,000 - 700,000Transfer from Fleet - - - - - - - -Transfer from Cemetary - - - 145,141 - - - -Fund Balance - - - - - - - -Stormwater - Obligation Bonds - 500,000 4,767,994 - 0% 4,982,750 5% 4,982,750 5% State/Federal Stormwater 81,158 1,370,185 - 98,121 - - - -Transfer from Capital 260,915 - - - - - - -Transfer from Stormwater Fund 950,300 - 1,000,000 1,000,000 100% 1,000,000 0% 1,000,000 0% Public Utility - Obligation Bonds 0 - 3,700,000 - - - - -Transfer from Public Utility Fund (Pay-Go) 15,167,000 9,270,000 20,327,000 20,327,000 100% 7,539,692 -63% 7,539,692 -63% Miscellaneous Revenue - Public Utilities - - - - - - - -Information Technology - Obligation Bonds - 603,172 - - - - - -Transfer from General Fund 250,000 250,000 - - - - - -Total Revenue $ 78,716,525 $ 89,421,890 $ 131,757,223 $ 97,620,603 74% $ 78,626,921 -40% $ 83,514,269 -37%
CAPITAL PROJECTS
2021-2022 2022-2023 2023-2024 2023-2024 2024-2025 % 2024-2025 % Actual Actual Budget YTD to Dec Requested Chng Recommended Chng Capital Projects Expenditures $ 52,488,516 $ 51,442,582 $ 131,757,223 $ 33,408,174 25% $ 78,626,921 -40% $ 83,514,269 -37% Total Expenditures $ 52,488,516 $ 51,442,582 $ 131,757,223 $ 33,408,174 25% $ 78,626,921 -40% $ 83,514,269 -37% 136
PROJECTS FUND 2021-2022 2022-2023 2023-2024 2023-2024 % 2024-2025 % 2024-2025 % Account Number: Actual Actual Budget Exp to Dec Exp Requested Chng Recommended Chng Parks Bennett's Creek Recreation Center $ 2,111,357 $ 1,917,746 $ - $ 233,506 - $ - - $ -Parks & Rec - Capital Maintenance 445,260 496,818 600,000 520,348 87% 660,000 10% 660,000 10% Planters Club Improvements 161,727 - - - - - - -Sleepy Hole Park Renovation 43,136 - - - - - - -Lone Star Lakes Park 89,959 27,116 - - - - - -Trail Enhancements 58,297 35,915 50,000 - - - - -Driver Complex - 24 - - - - - -Greenways, Blueway & Trails 150 - - 30,032 - - - -Water Access - Nansemond River 1,318,431 9,556 - 2,564 - 345,000 - 345,000Jericho Lane Public Access 4,862 105,017 - 36,130 - - - -Cedar Hill Cemetery Road Repairs 18,300 - - - - - - -Cypress Park and Pool 1,145,869 321,706 - 68,571 - - - -Blackwater River Project (326) - - - - - - -Constant's North Park 2,115 22,248 - - - - - -Cedar Hill Slope Stabilization 27,202 34,765 - 1,781 - 175,000 - 175,000Holly Lawn Cemetery Improvements - - 145,141 246,040 170% - - -Seaboard Coastline Trail - - 4,270,200 113,069 3% 5,185,741 21% 2,073,089 -51% Lake Meade Park Improvements - - - - - 600,000 - 600,000Gateway Beautification - - - - - 75,000 - 75,000Public Human Resources Bldg Renovation 95,917 627,126 - 8,537 - - - -Buildings Godwin Courts Buildings Improvements - 19,150 507,500 50,671 10% 535,000 5% 535,000 5% Public Building Capital Maintenance 1,084,699 934,746 1,100,000 519,088 47% 1,420,000 29% 1,420,000 29% Access Road - Joint Operations/Training Co - 67,571 - 169,249 - 600,000 - 600,000Joint Operations Facility (Police/P&R) 1,519,833 16,876 - - - - - -Cherry Street Parking Lot Upgrades - - 500,000 - - - -North Street Parking Lot Improvements - - - - - 300,000 - 300,000Central Library 599,125 625,173 5,300,997 148,743 3% - - -Airport Equipment Storage Facility 201,640 16,265 - - - - - -Airport Obstruction Removal Adjacent 213 699 - - - - - -Airport Corporate Apron 39,938 56,970 - - - - - -Airport Apron Rehabilitation 70,149 2,261,368 - 268,829 - - - -Airport Roof Replacement Box Hangar 7 75,000 - - - - - - -Airport Drainage Rehabilitiation - - 1,500,000 - 0% - - -T-Hanger G - 18,196 - - - 600,000 - 600,000Terminal Kitchen & Dining Area Renovatio - - - - - 200,000 - 200,000Public Ambulance 40,721 1,036,045 585,000 - 0% 1,160,000 98% 1,160,000 98% Safety Fire Engines 94,758 10,560 986,700 2,045 0% 1,275,000 29% 1,275,000 29% Breathing Air Refill - - - 92,812 - - - -Fire Rescue Truck - 1,048,725 - - - - - -Aerial Ladder Truck 1,768,249 146,826 - 232,651 - - - -Lake Kilby Station Renovation 63,019 899 - 1,194 - 1,000,000 - 1,000,000Fire & Rescue Storage Building 1,728,180 805,612 - 156,084 - - - -Fire Tanker Truck 18,122 768,594 - - - - - -College Drive Fire Station 164,652 411,003 - 315,847 - - - -Joint Public Safety & Training Center 64,854 - - 369,418 - - - -Station 10 Traffic Signal 24,255 7,768 - 5,636 - - - -CAD System Replacement - 61,392 - 366,868 - - - -Police Training Center - - 762,300 - 0% 750,000 -2% 750,000 -2% Schools Hazardous Material Management 6,828 - - - - - - -Schools Major Repairs/Systems Replacemen 4,216,191 2,166,654 - - - - - -Operation Facility 40,098 - - - - - - -School Facility Assessment 44,723 - - - - - - -JFK Middle School Replacement - 1,904,018 22,000,000 4,995,564 23% 25,000,000 14% 25,000,000 14% Northern Shores Elementary - - 1,200,000 - - 3,575,000 - 3,575,000Villages Village & Neighborhood Improvements 334,362 642,830 1,271,980 267,674 21% 1,649,168 30% 1,649,168 30% Open Space Improvements 277,130 241,134 250,000 22,486 9% 250,000 0% 250,000 0% Downtown Implementation Plan Initiatives 676,789 444,781 1,450,000 1,581,716 109% 2,850,000 97% 2,850,000 97% Budget Detail 137
CAPITAL
Transport Local Urban Intrsctn Const-Comp Plan RT17/Crittenden Road Intersection 702,440 62,994 1,500,000 14,173 1% - - -Suffolk Bypass Wilroy/Godwin/Pruden I - 17,500 1,950,000 61,903 3% - - -Diverging Diamond Interchange/Godwin - - 12,900,000 198 0% - - -N Pkwy/Bennett's Pasture Rd Intersection 239,052 240,742 - 67,486 - 555,000 - 555,000Local Urban Rdway Const-Comp Plan Godwin Blvd Improvements - - 8,600,000 694 - - - -RT17 Roadway Widening - - 9,796,731 76,940 1% - - -Holland Rd Improvements 16,662,308 14,017,559 - 4,268,845 - 3,158,641 - 3,158,641Railroad Crossing Upgrade 44,914 4,191 - 982 - 400,000 - 400,000Channel Dredging 600,000 - - - - 600,000 - 600,000Shoulders Hill Rd/RT17 Intersection 457,225 303,222 3,941,000 283,617 7% 3,398,221 -14% 3,398,221 -14% Nansemond Pkwy Bridge Replacement - - - 49,347 - - - -E Washington Street 13,263 490,711 - - - - - -Longstreet Lane Bridge Replacement 39,467 9,525 - 1,326,444 - - - -Lake Cahoon Rd Deck Replacement 1,962,658 - - - - - - -Carolina Rd Bridge Replacement 1,415,278 703,699 - - - - - -Pruden Center Signal & Turn Lanes 21,328 1,642,954 - 965,519 - - - -Nansemond Pkwy/Wilroy Rd Overpass 1,854,779 696,264 - 6,501,062 - - - -Bridge Rd Traffic Signal Upgrade 679,443 354,413 - 99 - - - -Suffolk Bypass ITS 8,978 477,294 - 726,150 - - - -Portsmouth Blvd Sidewalk Phase I 84,620 65,699 - - - - - -Portsmouth Blvd Sidewalk Phase II 351,715 128,999 - 220 - - - -Portsmouth Blvd Sidewalk Phase III 397,208 104,083 - - - - - -Pitchkettle Road Improvements 288,666 2,078,867 - 196,053 - 6,037,000 - 6,037,000Miscellaneous Roadway Improvements - - 200,000 - - 200,000 - 200,000Elwood Road over Kingsdale Swamp 155,467 972,538 - - - - - -Turlington Road over Kilby Creek - 371,329 - 72,373 - - - -Nansemond Parkway Traffic Signal 2,208 195,018 - 296,350 - - - -Relocation of Zone C Headquarters 320,654 4,076,123 900,000 24,958 3% - - -Shoulders Hill Rd Multi-Use Path 60,782 34,026 - 526,197 - - - -West End Suffolk Bypass Interchange 1,620 - - - - - - -EDA Road Ctr Point Drive 760,000 17,500 - - - - - -Whaleyville Blvd Paving - 441,427 - - - - - -Kings Hwy Repaving - 210,022 - - - - - -Carolina Rd Repaving - 388,906 - - - - - -Franklin Bypass Repaving - 182,313 - - - - - -Suffolk Traffic Operations Center - 62,770 - 1,420 - - - -NSA to General Earley Drive - 1,590 - 330,416 - - - -58W Off Ramp to RT13 - 194,770 - 119,940 - - - -RT13S (15.175) to RT13S (16.172) - 13,698 - 179,662 - - - -RT13S (16.172) to RT13S (17.172) - - - 302,932 - - - -Woodlawn Drive to NSA - 1,238 - 485,795 - - - -Downtown Signal System Upgrade - - 1,500,000 - - - - -Citywide Signal System Upgrade - - 2,500,000 - - - - -Freeman Mill over Spivey Swamp - - 709,000 - - - - -Downtown Railroad Warning System - - 500,000 - - - - -Whaleyville Blvd to Little Fork - 136,371 - (136,371) - - - -Whaleyville Blvd to Mineral Spring - 140,164 - (140,164) - - - -Great Mill Hwy to Stuart Drive - 130,314 - (130,314) - - - -MP 34.77 to MP 35.77 86,681 - (86,681) - - - -Bridge Road to Lincoln Street 110,978 - (110,978) - - - -RT189 to US58 - 99,606 - (99,606) - - - -Non-Median Break Intersection Improveme - - 214,000 - - - - -RT460 Improvements - - 1,000,000 - - - - -Nansemond over Beamons Mill - - 3,369,887 - - - - -Kenyon Road Connector 1,464,857 1,529,602 - 642,657 - - - -Access Road - VA Port Logistics Park - 700,000 - - - - - -RT58 Improvements - Longstreet to Holland - - - - - 924,859 - 924,859Townpoint Sidewalk - - - - - 200,000 - 200,000Citywide Guardrail Project - - - - - 665,849 - 665,849Ironside Dr Extension @ The Point at Harbo - - - - - 700,000 - 700,000RT17 Point Place Rdwy Extension 750,000 - - - - - - -Harbour Towne Pkwy Connector & Wetland 1,011 - - - - - - -Transit Transit Operations Facility - 6,572 - 66,371 - 60,000 - 60,000Fleet Replacement of Fleet Facilities 11,137 - - - - - - -Info Technology Physical Security 266,193 229,043 - - - - - -Internet Access Expansion 230,352 - - - - - - -Geoprime Redundancy - - - 162,559 - - - -Stormwater Pughsville Drainage 202,731 - 1,411,044 92,068 7% - - -Downtown St Upgrades & Drainage Improv 1,401,147 - - 27,686 - - - -Oldetown Drainage Improvements 21,922 - 2,224,000 31,449 1% 2,446,000 10% 2,446,000 10% Citywide Drainage Improvements 818,023 - 500,000 57,824 12% 500,000 0% 500,000 0% Steeple Drive Drainage Improvements 3,298 - - 15,045 - - - -Driver Drainage Improvements - - 776,700 - - - - -First Avenue Drainage - - 156,250 - - 468,750 200% 468,750 200% Woodrow South Suffolk Drainage - - - - - 573,000 - 573,000Oakland Drainage Improvements - - 600,000 40,706 7% 1,200,000 100% 1,200,000 100% Downtown Infrastructure Improvements - - 100,000 - - 100,000 - 100,000Jefferson Street Drainage - - - - - 195,000 - 195,000Sadler Heights - - - - - 500,000 - 500,000Utilities Water Source Development & Treatment Pl - 231,730 6,902,000 624,993 9% 774,692 -89% 774,692 -89% Water Distribution and Transmission System 22,784 2,390 - 731,750 - - - -Water System Upgrades 166,463 375,552 5,975,000 300,140 5% 3,265,000 -45% 3,265,000 -45% Sanitary Sewer System Upgrades 877,437 758,398 10,850,000 1,611,334 15% 3,500,000 -68% 3,500,000 -68% Sanitary Sewer Extensions 36,161 4,370 300,000 777 - - - -Non-Departmental Transfer to School Operating Fund - - - 2,000,000 - - - -Transfer to Grants - 50,000 - - - - - -Transfer to Debt Fund 154,227 373,765 - - - - - -Transfer to Stormwater Fund 260,915 - - - - - - -Transfer to Information Technology - 603,172 - - - - - -Contingency - - 9,901,793 - - - - 8,000,000Total Operating Expenses $ 52,488,516 $ 51,442,582 $ 131,757,223 $ 33,408,174 25% $ 78,626,921 -40% $ 83,514,269 -37% 138
Special Revenue Funds
139
THIS PAGE INTENTIONALLY BLANK
140
Aviation Facilities Fund
Description
The Aviation Facilities Fund is a special revenue fund designed to account for and manage the Suffolk Executive Airport. The fund is supported by revenue generated by airport operations including fuel sales, hangar leases, tie downs, and other services provided to users of the airport as well as state and federal grant funding. The Aviation Facilities Division administers and manages the Suffolk Executive Airport including the operation of runways, taxiways, hangar facilities, apron and tie down facilities, fueling facilities, required navigational equipment, and the airport cafe.
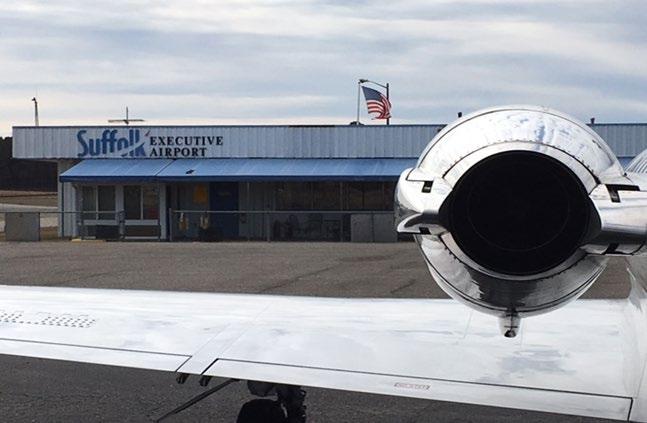
Budget Highlights:
No significant changes.
Council Target Area FY 25 Objectives Expanded Economic Development To provide services and facilities for general aviation, corporate, and charter aircraft. Key Measures FY 23 Actual FY 24 Projected FY 25 Estimate Number of airplanes taking off/flying into Suffolk Executive Airport Number of businesses located at the Suffolk Executive Airport Percent of aviation hangar space leased Gallons of fuel sold 11,000 6 100% 114,250 11,000 6 100% 114,500 11,000 6 100% 115,000 141
AVIATION FACILITIES FUND Revenue 2021-2022 2022-2023 2023-2024 2023-2024 2024-2025 % 2024-2025 % Actual Actual Budget YTD to Dec Requested Chng Recommended Chng Interest on Investments $ 7,369 $ 27,222 $ - $ - - $ - - $ -Rent of Facilities 270,154 304,186 264,204 150,448 57% 261,804 -1% 261,804 -61% Sale of Fuel 678,758 627,748 675,000 222,059 33% 675,000 0% 675,000 0% Miscellaneous Revenue 17,139 49,612 20,000 10,046 50% 20,000 0% 20,000 0% State Aviation Maintenance Grants 3,420 14,005 - 7,997 - - - -Transfer from General Fund 112,815 109,055 168,115 168,115 100% 168,554 0% 179,846 7% Total Revenue $ 1,089,656 $ 1,131,828 $ 1,127,319 $ 558,665 50% $ 1,125,358 0% $ 1,136,650 1% Expenditure Summary 2021-2022 2022-2023 2023-2024 2023-2024 2024-2025 % 2024-2025 % Actual Actual Budget YTD to Dec Requested Chng Recommended Chng Aviation Services $ 982,895 $ 1,065,986 $ 1,127,319 $ 532,672 47% $ 1,125,358 0% $ 1,136,650 1% Total Expenditures $ 982,895 $ 1,065,986 $ 1,127,319 $ 532,672 47% $ 1,125,358 0% $ 1,136,650 1% 142
AVIATION FACILITIES FUND (Department of Economic Development) Budget Detail 2021-2022 2022-2023 2023-2024 2023-2024 % 2024-2025 % 2024-2025 % Account Number: 220-150000 Actual Actual Budget Exp to Dec Exp Requested Chng Recommended Chng 51100.02 Salaries and Wages $ 116,087 $ 120,522 $ 126,391 $ 60,036 48% $ 126,391 0% $ 135,790 7% 51100.04 Salaries and Wages - Overtime 1,473 1,137 1,000 857 86% 1,500 - 1,500 50% 51100.06 Salaries and Wages - Part-time 63,905 69,109 72,128 34,437 48% 72,128 0% 75,013 4% 52100 FICA 14,282 14,623 15,263 7,311 48% 15,301 0% 16,241 6% 52210 VRS Retirement 14,160 16,600 17,543 8,696 50% 17,543 0% 22,691 29% 52400 Group Life 1,554 1,613 1,694 847 50% 1,694 0% 1,820 7% 53000.16 Purchased Service - Refuse Collection 3,695 6,359 5,500 3,099 56% 7,000 27% 7,000 27% 53300 Repair and Maintenance 26,822 22,557 40,000 25,939 65% 40,000 0% 40,000 0% 53300.110 Repair and Maintenance - State 3,420 14,005 - 9,137 - - - -53300.220 Repair and Maintenance - Aviation 180 3,296 - 8,057 - - - -53600 Advertising 4,267 4,855 5,000 1,174 23% 5,000 0% 5,000 0% 54100 Information Technology 17,540 25,223 33,895 15,066 44% 33,895 0% 38,632 14% 54200 Fleet 47,913 47,311 44,500 28,815 65% 44,500 0% 42,645 -4% 54500 Risk Management 42,568 48,133 79,878 39,939 50% 79,878 0% 64,434 -19% 55100 Utilities 32,109 37,725 32,000 17,629 55% 40,000 25% 40,000 25% 55210 Postal Services 64 13 500 10 2% 500 0% 500 0% 55230 Telecommunications 2,241 2,254 2,391 816 34% 2,391 0% 2,391 0% 55410 Lease/Rent of Equipment 27,352 4,000 12,000 - 0% - -100% - -100% 55500 Travel and Training 1,872 1,117 2,500 332 13% 2,500 0% 2,500 0% 55810 Dues and Association Memberships 145 150 200 - 0% 200 0% 200 0% 56001 Office Supplies 232 242 500 34 7% 500 0% 500 0% 56011 Uniforms & Wearing Apparel 724 474 1,500 145 10% 1,500 0% 1,500 0% 56014 Other Operating Supplies 4,739 3,173 5,000 1,346 27% 5,000 0% 5,000 0% 56015 Merchandise for Resale 414 286 1,000 216 22% 1,000 0% 1,000 0% 56017 Copier 1,342 1,600 1,375 592 43% 1,375 0% 1,375 0% 56022 Fuel Inventory 418,430 515,475 500,000 220,362 44% 500,000 0% 500,000 0% 58200 Capital Outlay 36,822 - - - - - - -91400-59905 Local Cash Match - - 30,000 - 0% 30,000 0% 30,000 0% 93000-50000.165 Transfer to GF - Indirect Cost 89,329 100,135 95,562 47,781 50% 95,562 0% 100,919 6% 93000-50000.310 Transfer to Capital 9,215 4,000 - - - - - -Total Operating Expenditures $ 982,895 $ 1,065,986 $ 1,127,319 $ 532,672 - $ 1,125,358 - $ 1,136,650 1% Personnel Summary 2021-2022 2022-2023 2023-2024 2024-2025 2024-2025 Range Class Actual Actual Budget Requested Recommended 218 Airport Manager 1 1 1 1 1 204 Airport Technician 1 1 1 1 1 Number of Full-Time Positions 2 2 2 2 2 143
THIS PAGE INTENTIONALLY BLANK
144
Transit System Fund
Description
The Transit System Fund was established to manage transportation services provided to the citizens of Suffolk. This special revenue fund is supported by fare box revenue, state and federal grants, and a transfer from the General Fund. The City contracts with Virginia Regional Transit (VRT) for the operation of the City’s transit service which includes six bus routes and ADA service.
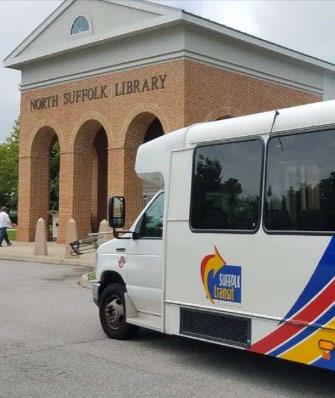
Financial Stability
Budget Highlights:
Additional State and Federal funding for buses, bus stop improvements, and bus operations Council Target
To collaborate with the Department of Parks and Recreation on the bicycle and pedestrian plan in an effort to expand multimodal connections.
To identify additional funding opportunities and to add additional revenue sources to fund expansions and improvements.
FY 25
Area
Objectives Transportation To provide safe, clean, and effective public transit. To expand public transportation access to rural, commercial, and employment centers through extended regional connections.
Key Measures FY 23 Actual FY 24 Projected FY 25 Estimate Ridership: Green Line (Main St./Godwin Blvd) Orange Line (Lake Kennedy/East Washington) Red Line (Magnolia/East Constance/Main St.) Yellow Line (Holland Road/Saratoga)/Pink Line Pink Line – Connector/Yellow Line Purple Line (North Suffolk) Americans with Disabilities Act (ADA) Ridership 23,488 20,719 7,059 5,933 9,575 5,777 2,526 22,149 21,751 7,466 5,746 9,427 6,708 2,405 22,370 21,968 7,540 5,803 9,521 6,775 2,429 145
Expenditure Summary
TRANSIT SYSTEM FUND Revenue 2021-2022 2022-2023 2023-2024 2023-2024 2024-2025 % 2024-2025 % Actual Actual Budget YTD to Dec Requested Chng Recommended Chng Interest on Investments $ 5,678 $ 85,335 $ - $ - - $ - - $ -Fare Collections 64,817 65,326 61,000 25,361 42% 62,000 2% 62,000 2% Miscellaneous 9,986 12,915 10,000 1,378 14% 10,000 0% 10,000 0% VRPT Operating Revenue 457,667 554,731 433,543 121,188 28% 484,752 12% 484,752 12% VRPT Capital Revenue 65,360 2,419 149,270 12,721 9% 179,280 20% 179,280 20% Federal Transit Administration 1,679,754 1,709,475 1,019,755 - 0% 1,576,194 55% 1,576,194 55% HRTPO - Transit Admin Assistance 9,000 9,000 9,000 9,000 100% 9,000 0% 9,000 0% Transfer from General Fund 1,008,200 418,582 753,056 - 0% 851,810 13% 418,604 -44% Fund Balance - - - - - - - 450,000Total Revenue $ 3,300,462 $ 2,857,783 $ 2,435,624 $ 169,648 - $ 3,173,036 - $ 3,189,830 31%
2021-2022 2022-2023 2023-2024 2023-2024 2024-2025 % 2024-2025 % Actual Actual Budget YTD to Dec Requested Chng Recommended Chng Transit System $ 2,885,423 $ 1,973,632 $ 2,435,624 $ 915,427 38% $ 3,173,036 30% $ 3,189,830 31% Total Expenditures $ 2,885,423 $ 1,973,632 $ 2,435,624 $ 915,427 - $ 3,173,036 - $ 3,189,830 31% 146
DIVISION: TRANSIT SYSTEM (Department of Public Works) Budget Detail 2021-2022 2022-2023 2023-2024 2023-2024 % 2024-2025 % 2024-2025 % Account Number: 212-88000- Actual Actual Budget Exp to Dec Exp Requested Chng Recommended Chng 51100.02 Salaries and Wages - Regular $ 67,928 $ 68,456 $ 71,789 $ 34,100 48% $ 71,789 0% $ 77,274 8% 52100 FICA 5,258 5,244 5,492 2,613 48% 5,492 0% 5,911 8% 52210 VRS 8,046 9,390 9,964 4,912 49% 9,964 0% 13,963 40% 52400 Group Life 896 916 962 481 50% 962 0% 1,035 8% 53000.13 Purchased Services - SW Outreach 599 2,011 5,000 2,224 44% 5,000 0% 5,000 0% 53000.16 Purchased Services - Refuse Collection 3,636 3,636 5,848 1,818 31% 5,848 0% 5,848 0% 53000.43 Purchased Services - RM Salary Allocation 31,974 12,552 12,552 6,276 50% 13,605 8% 13,605 8% 53100 Professional Services 23,192 4,491 415,670 - 0% 451,443 9% 451,443 9% 53100.105 Professional Services - Federal 1,396,868 1,546,028 267,406 361,725 135% 926,194 246% 926,194 246% 53100.110 Professional Services - State 13,937 35,058 418,543 375,025 90% 474,752 13% 474,752 13% 53100.212 Professional Services - Transit 637 (482) 10,000 - 0% 10,000 0% 10,000 0% 53300 Repair and Maintenance 5,706 5,052 10,000 - 0% 10,000 0% 10,000 0% 53300.105 Repair and Maintenance - Federal 6,407 6,760 6,000 2,817 47% 10,000 67% 10,000 67% 53300.110 Repair and Maintenance - State 17,398 - 15,000 - 0% 10,000 -33% 10,000 -33% 53300.212 Repair and Maintenance - Transit - - 10,000 - 0% 10,000 0% 10,000 0% 53600 Advertising 1,822 390 2,000 - 0% 1,000 -50% 1,000 -50% 54100 Information Technology 5,846 5,282 6,945 3,013 43% 7,106 2% 7,726 11% 54200 Fleet 5,870 5,590 6,200 2,742 44% 6,600 6% 6,299 2% 54500 Risk Management 10,743 14,390 16,503 8,252 50% 15,000 -9% 12,513 -24% 55100 Utilities 1,174 955 1,500 369 25% 1,500 0% 1,500 0% 55230 Telecommunications 512 708 1,332 236 18% 1,300 -2% 1,332 0% 55500 Travel and Training 891 1,004 5,250 1,005 19% 5,250 0% 5,250 0% 55810 Dues & Association Memberships 687 1,429 1,000 729 73% 1,500 50% 1,500 50% 56014 Other Operating Supplies 3,122 12,004 25,000 3,671 15% 25,000 0% 25,000 0% 56014.105 Other Operating Supplies - Federal - - - - - - - -58200 Capital Outlay 9,917 - 5,000 - - - - -58200.105 Capital Outlay - Federal 337,860 10,487 746,349 - - 640,000 -14% 640,000 -14% 58200.110 Capital Outlay - State 68,498 1,757 149,270 12,240 8% 179,280 20% 179,280 20% 58200.212 Capital Outlay - Transit 15,967 865 37,318 7,316 20% 66,720 79% 66,720 79% 93000-50000.165 Transfer to GF - Indirect Cost 95,589 219,659 167,731 83,866 50% 167,731 0% 156,684 -7% 93000-50000.310 Transfer to Capital Projects 744,444 - - - - 40,000 - 60,000Total Operating Expenditures $ 2,885,423 $ 1,973,632 $ 2,435,624 $ 915,427 38% $ 3,173,036 30% $ 3,189,830 31%
2021-2022 2022-2023 2023-2024 2024-2025 2024-2025 Range Class Actual Actual Budget Requested Recommended 213 Transit Manager 1 1 1 1 1 Number of Full-Time Positions 1 1 1 1 1 147
Personnel Summary
THIS PAGE INTENTIONALLY BLANK
148
Description
Downtown Business Overlay Taxing District Fund
The Downtown Business Overlay Taxing District (DBOD) is a special fund created by the City to foster economic development in downtown Suffolk. A specific additional real estate tax levy is assessed on properties in the DBOD. Revenues provide funding for enhanced beautification, refuse, sidewalk, and street maintenance services. The proposed FY 2024-2025 real estate tax rate is $.105 per $100 of assessed value for properties located in the DBOD.
149
Expenditure Summary
DOWNTOWN BUSINESS OVERLAY TAXING DISTRICT FUND Revenue 2021-2022 2022-2023 2023-2024 2023-2024 2024-2025 % 2024-2025 % Actual Actual Budget YTD to Dec Requested Chng Recommended Chng Real Property Taxes $ 186,753 $ 189,186 $ 230,842 $ 128,045 55% $ 240,500 4% $ 228,443 -1% Penalties and Interest (15) (18) - (50) - - - -Interest on Investments 49 8,933 - - - - - -Total Revenue $ 186,787 $ 198,101 $ 230,842 $ 127,995 55% $ 240,500 4% $ 228,443 -1%
2021-2022 2022-2023 2023-2024 2023-2024 2024-2025 % 2024-2025 % Actual Actual Budget YTD to Dec Requested Chng Recommended Chng Services $ 159,314 $ 188,882 $ 230,842 $ 110,228 48% $ 240,500 4% $ 228,443 -1% Total Expenditures $ 159,314 $ 188,882 $ 230,842 $ 110,228 48% $ 240,500 4% $ 228,443 -1% 150
DOWNTOWN BUSINESS OVERLAY TAXING DISTRICT FUND Budget Detail 2021-2022 2022-2023 2023-2024 2023-2024 % 2024-2025 % 2024-2025 % Account Number: 209- Actual Actual Budget Exp to Dec Exp Requested Chng Recommended Chng 41310-53000.02 Purchased Service - RM (Maintenance, Sweeping $ 57,529 $ 64,500 $ 64,500 $ 44,015 68% $ 64,500 0% $ 64,500 0% 41310-53000.46 Purchased Service - RM Banners 8,726 7,000 7,000 2,089 30% 7,000 0% 7,000 0% 41310-53100 Professional Services 34,355 51,330 92,342 19,075 21% 100,000 8% 87,943 -5% 41310-55100 Utilities 705 1,053 2,000 1,401 70% 4,000 100% 4,000 100% 42310-53000.16 Purchased Service - Refuse Fund 58,000 65,000 65,000 43,649 67% 65,000 0% 65,000 0% Total Operating Expenditures $ 159,314 $ 188,882 $ 230,842 $ 110,228 48% $ 240,500 4% $ 228,443 -1% 53100 - Professional Services: Provides for beautification and landscape services. 151
THIS PAGE INTENTIONALLY BLANK
152
Description
Route 17 Special Taxing District Fund
The Route 17 Special Taxing District is a special revenue fund created to foster economic development in a specific geographic region of northern Suffolk. An additional real estate tax levy is assessed on properties in the Route 17 Special Taxing District to provide for more complete governmental services including the construction and maintenance of roads, water and sewer infrastructure, beautification and landscaping, shoreline management and restoration, sponsorship and promotion of recreational and cultural activities, open space, public parks, and park amenities, and firefighting facilities and equipment.
The proposed FY 2024-2025 real estate tax rate is $.24 per $100 of assessed value for properties located in the Route 17 Special Taxing District. Funding generated from the additional real estate tax levy is used for debt service associated with previously completed infrastructure improvements in the taxing district as well as a capital/debt reserve for future improvement projects.
153
ROUTE 17 SPECIAL TAXING DISTRICT FUND Revenue 2021-2022 2022-2023 2023-2024 2023-2024 2024-2025 % 2024-2025 % Actual Actual Budget YTD to Dec Requested Chng Recommended Chng Real Property Taxes $ 2,042,669 $ 2,372,767 $ 2,565,433 $ 1,376,998 54% $ 2,675,020 4% $ 2,675,020 4% Penalties and Interest 8,763 11,350 - (226) - - - -Fund Balance - - - - - - - -Total Revenue $ 2,051,432 $ 2,384,117 $ 2,565,433 $ 1,376,772 54% $ 2,675,020 4% $ 2,675,020 4% Expenditure Summary 2021-2022 2022-2023 2023-2024 2023-2024 2024-2025 % 2024-2025 % Actual Actual Budget YTD to Dec Requested Chng Recommended Chng Route 17 Special Taxing District $ 398,460 $ 4,526,712 $ 2,565,433 $ 378,629 15% $ 2,675,020 4% $ 2,675,020 4% Total Expenditures $ 398,460 $ 4,526,712 $ 2,565,433 $ 378,629 15% $ 2,675,020 4% $ 2,675,020 4% 154
ROUTE 17 SPECIAL TAXING DISTRICT FUND 2021-2022 2022-2023 2023-2024 2023-2024 % 2024-2025 % 2024-2025 % Account Number: 216-81500- Actual Actual Budget Exp to Dec Exp Requested Chng Recommended Chng 93000-50000.310 Transfer to Capital Projects $ - $ 4,139,443 $ - $ - - $ 700,000 - $ 700,00093000-50000.401 Transfer to Debt Service Fund 398,460 387,269 378,629 378,629 100% 370,586 -2% 370,586 -2% Reserve for Capital/Debt - - 2,186,804 - 0% 1,604,434 -27% 1,604,434 -27% Total Operating Expenses $ 398,460 $ 4,526,712 $ 2,565,433 $ 378,629 15% $ 2,675,020 4% $ 2,675,020 4% Budget Detail 155
THIS PAGE INTENTIONALLY BLANK
156
Description
Road Maintenance Fund
The Road Maintenance Fund provides for the maintenance of primary and secondary roadways throughout the City of Suffolk including drainage ditches, sidewalks, grass mowing, and litter control. The Division also evaluates, repairs, and upgrades traffic regulatory markings, signage, and traffic signal operations; directs and manages capital and special projects; assists in the review of all site development plans; analyzes impacts relating to current and future transportation issues; administers the City’s street lighting program; and assists in supporting the Roadway Advisory Commission.
Council Target Area FY 25 Objectives
Transportation
Financial Stability

To provide safe and quality transportation options.
To continue to provide quality maintenance service of the City roadway network and supported assets.
To complete street improvements identified in the Village and Neighborhood Initiatives of the Capital Improvements Program and Plan.
To deliver high quality services within allocated resources.
Key Measures
Budget Highlights:
Additional funding provided for Bridge repairs.
Increase in capital outlay funding for equipment replacements including crash trucks, rotary cutters and mowers, dump trucks and other equipment.
Increase in funding for street light utilities.
FY 23 Actual FY 24 Projected FY 25 Estimate Roadway:
Number of
Linear feet of open conveyance
maintained Traffic: Number of traffic signals maintained Number of sign fabrications, repairs, replacements 1,669 130 3,143 397,176 106 2,633 1,671 130 3,000 300,000 107 2,750 1,671 130 3,000 300,000 108 2,750 157
Number of lane miles maintained Number of lane miles resurfaced
potholes repaired
systems
MAINTENANCE FUND Revenue 2021-2022 2022-2023 2023-2024 2023-2024 2024-2025 % 2024-2025 % Actual Actual Budget YTD to Dec Requested Chng Recommended Chng Sale of Permits A $ 74,750 $ 111,475 $ 75,000 $ 43,975 59% $ 80,000 7% $ 80,000 7% Height/Weight Permit Fees B 352,163 386,034 320,000 199,663 62% 340,000 6% 340,000 6% Fines & Forfeitures C 296,356 173,521 250,000 148,766 60% 250,000 0% 250,000 0% Automated Traffic Enforcement - - - 7,558,566 - - - -Revenue from Use of Property - SW Mosquito D 15,000 15,000 20,000 7,500 38% 30,000 50% 20,000 0% Revenue from Use of Property - Billboard Usage 1,591 1,639 - 1,688 - - - -Operations of Street Lights E 669,025 169,318 100,000 - 0% 150,000 50% 150,000 50% Developer Street Sign Contributions F 10,200 27,500 25,000 4,800 19% 25,000 0% 25,000 0% Developer Traffic Signal Contributions G - 1,400 70,000 - 0% 70,000 0% 70,000 0% Sale of Service - Stormwater (Mosquito) H 60,000 60,007 60,000 - 0% 75,000 25% 75,000 25% Sale of Service - Capital Projects I 211,310 297,233 280,000 134,843 48% 280,000 0% 280,000 0% Sale of Service - Stormwater (Engineering) J 300,000 300,000 350,000 - 0% 125,000 -64% 125,000 -64% Sale of Service - DBOD K 57,529 64,500 64,500 44,015 68% 80,000 24% 64,500 0% Sale of Service - General Fund (PW Admin) L 145,319 161,866 175,000 119,735 68% 200,000 14% 200,000 14% Sale of Service - Animal Control M 23,500 23,500 23,500 11,750 50% 25,000 6% 23,500 0% Sale of Service - Public Utilities N 6,603 3,000 10,000 - 0% 10,000 0% 10,000 0% Sale of Service - Developer Plan Review O 61,552 52,620 60,000 32,280 54% 60,000 0% 60,000 0% Sale of Service - Refuse Salary Allocation P 78,113 75,000 75,000 37,500 50% 75,000 0% 75,000 0% Sale of Service - PW Salary Allocation Q 19,216 17,534 23,135 11,568 50% 25,000 8% 25,000 8% Sale of Service - PW Streetlight Installation S 20,000 20,000 30,000 15,000 50% 40,000 33% 40,000 33% Sale of Service - Impact Analysis T 15,000 15,000 15,000 7,500 50% 15,000 0% 15,000 0% Sale of Service - Banners U 15,231 13,787 14,000 4,899 35% 10,000 -29% 14,000 0% Sale of Service - Transit Salary Allocation R 31,974 12,552 12,552 6,276 50% 13,605 8% 13,605 8% Sale of Salvage/Surplus V 6,132 5,939 5,000 2,489 50% 5,000 0% 5,000 0% Miscellaneous Revenue W 26,417 16,589 7,500 3,934 52% 7,500 0% 7,500 0% Virginia Logo Program X 8,125 10,563 10,000 4,650 47% 10,000 0% 10,000 0% Urban Maintenance Funds Y 25,491,046 29,591,549 27,303,484 16,129,553 59% 32,258,475 18% 32,258,475 18% Insurance Recovery Z - - - - - - - -Transfer from General Fund 127,790 - - - - - - -Interest Proceeds 46,466 493,212 - - - - - -Fund Balance - - 2,741,166 - 0% 1,356,969 -50% 2,495,914 -9% Total Revenue $ 28,170,409 $ 32,120,340 $ 32,119,837 $ 24,530,949 76% $ 35,616,549 11% $ 36,732,494 14%
ROAD
2021-2022 2022-2023 2023-2024 2023-2024 2024-2025 % 2024-2025 % Actual Actual Budget YTD to Dec Requested Chng Recommended Chng Road Maintenance $ 20,741,100 $ 28,652,484 $ 26,310,314 $ 18,675,798 71% $ 29,187,025 11% $ 30,027,569 14% Traffic Engineering 4,686,568 6,171,317 5,809,523 2,563,527 44% 6,429,524 11% 6,704,925 15% Total Expenditures $ 25,427,668 $ 34,823,801 $ 32,119,837 $ 21,239,325 66% $ 35,616,549 11% $ 36,732,494 14% A - Land use and commercial drive permits issued to public N - Services provided to Public Utilities B - Height & Weight Permit Fees O - Charges to developers for plans review by Engineering. C - Wide load and overweight citations allocated towards Road Maintenance P - Services provided to Refuse for salary allocation D - Revenue for office space at Operations Facility Q - Services provided to PW for salary allocation E - 7 yr. adv st. light pymts (Dev.) for st. light maint csts for new dev. Pro Rtd Bases R - Services provided to Transit for salary allocation F - Charges to developers for new st. signs related to new developments S - Cost to install street lights G - Chrgs to developers for inspectn by Traf. Engin. of traf. sgnl constrctn T - Preliminary plan and traffic impact analysis review H - Ditch cleaning services to Stormwater - mosquito control. U - Services provided to P&R for banner placement I - Services provided to Capital Projects Fund for roadwork. V - Salvage of damaged guardrail and other miscellaneous metal J - BMP residential maintenance and enhanced street sweeping services provided to SW Fund W - Misc services to depts (signs, pavemt markers, research & engineering) K - Enhanced street sweeping, roadside beautification, and clean up services provided to DBOD X - Payment for Virginia Logo System Rights on City Right of Way L - Non-VDOT funded activities - Misc Services (ex. Dirt roads) Y - State revenue estimate based on 1291.46 lane miles x $16,625.86 secondary & 380.26 x $28,317.05 primary M - Incinerator usage fee for euthanized animals Z - Insurance recovery for public property accident damage 158
Expenditure Summary
DIVISION: ROADWAY - TRAFFIC ENGINEERING (Department of Public Works) Budget Detail 2021-2022 2022-2023 2023-2024 2023-2024 % 2024-2025 % 2024-2025 % Account Number: 210-41400- Actual Actual Budget Exp to Dec Exp Requested Chng Recommended Chng 51100.02 Salaries and Wages $ 1,119,426 $ 1,214,081 $ 1,579,106 $ 683,463 43% $ 1,579,106 0% $ 1,669,172 6% 51100.04 Salaries and Wages - Overtime 194,293 200,015 77,077 140,933 183% 77,077 0% 77,077 0% 51100.06 Salaries and Wages - Part-time 6,056 (394) - - - - - -52100 FICA 96,936 104,416 126,698 61,042 48% 126,698 0% 133,588 5% 52210 VRS Retirement 149,313 165,547 219,180 95,446 44% 219,180 0% 272,128 24% 52400 Group Life 16,697 15,999 21,160 9,248 44% 21,160 0% 22,367 6% 53100 Professional Services 240,153 256,226 315,000 61,307 19% 315,000 0% 315,000 0% 53100.26 Professional Services - Traffic Signal Inspec - - 70,000 - 0% 70,000 0% 70,000 0% 53300 Repair and Maintenance 23,790 23,028 15,000 35,654 238% 25,000 67% 25,000 67% 54100 Information Technology 139,722 149,188 174,140 95,045 55% 174,140 0% 197,162 13% 54200 Fleet 182,641 197,528 188,144 114,713 61% 188,144 0% 255,343 36% 54500 Risk Management 219,583 254,456 306,731 153,365 50% 306,731 0% 310,801 1% 55100 Utilities (Street Lights) 1,574,862 1,728,808 1,610,000 666,466 41% 1,728,000 7% 1,728,000 7% 55210 Postage 230 3 500 60 12% 500 0% 500 0% 55230 Telecommunications 22,066 26,133 25,297 6,621 26% 25,297 0% 25,297 0% 55500 Travel and Training 14,662 24,173 20,000 10,155 51% 25,000 25% 25,000 25% 55810 Dues and Association Memberships 4,851 4,908 5,500 3,263 59% 5,500 0% 5,500 0% 56001 Office Supplies 1,916 3,996 4,000 2,194 55% 4,000 0% 4,000 0% 56011 Uniforms & Wearing Apparel 13,628 18,951 18,500 9,217 50% 18,500 0% 18,500 0% 56012 Books & Subscriptions 1,020 6,167 1,500 773 52% 1,500 0% 1,500 0% 56014 Other Operating Supplies 460,048 839,383 495,000 335,344 68% 700,000 41% 700,000 41% 56017 Copier Costs 7,068 6,610 5,991 2,620 44% 5,991 0% 5,991 0% 58200 Capital Outlay 13,614 650,185 291,000 15,478 5% 573,000 97% 603,000 107% 58210 New Street Light Installation 39,779 29,658 40,000 3,929 10% 40,000 0% 40,000 0% 58215 Improvements (signals/signs) 144,216 252,253 200,000 57,191 29% 200,000 0% 200,000 0% Total Operating Expenditures $ 4,686,568 $ 6,171,317 $ 5,809,523 $ 2,563,527 44% $ 6,429,524 11% $ 6,704,925 15%
2021-2022 2022-2023 2023-2024 2024-2025 2024-2025 Range Class Actual Actual Budget Requested Recommended 220 Traffic Engineering Division Manager 1 1 1 1 1 215/217/219 Civil Engineer I-III 1 1 1 1 1 218 Transportation Planning Manager 1 1 1 1 1 215 Traffic Signal System Superintendent 1 1 1 1 1 215 Sign and Paint Superintendent 1 1 1 1 1 214 Engineering Analyst 1 1 1 1 1 208/209/211 Construction Inspector I-III 1 1 1 1 1 209 Traffic Signal Technician 5 5 5 5 5 209 Sign Maintenance Manager 1 1 1 1 1 209 Paint Supervisor 1 1 1 1 1 209 Engineering Technician 1 1 1 1 1 208 Sign Shop Fabricator 1 1 1 1 1 207 Traffic Engineering Utility Technician - 1 1 1 1 207 Sign Mechanic 2 3 3 3 3 207 Highway Paint Equipment Operator 1 2 2 2 2 206 Sign Technician 2 3 3 3 3 206 Paint Technician 4 5 5 5 5 204 Staff Support Assistant 1 - - -Number of Full-Time Positions 26 30 30 30 30 159
Personnel Summary
DIVISION: ROADWAY - MAINTENANCE (Department of Public Works) Budget Detail 2021-2022 2022-2023 2023-2024 2023-2024 % 2024-2025 % 2024-2025 % Account Number: 210-41200 Actual Actual Budget Exp to Dec Exp Requested Chng Recommended Chng 51100.02 Salaries and Wages $ 3,594,478 $ 4,319,088 $ 5,195,460 $ 2,095,248 40% $ 5,195,460 0% $ 5,520,432 6% 51100.04 Salaries and Wages - Overtime 494,849 588,646 190,638 324,230 170% 190,638 0% 190,638 0% 51100.06 Salaries and Wages - Part-time 49,566 39,654 - 10,447 - 23,751 - 24,70152100 FICA 301,415 361,538 412,036 177,047 43% 413,853 0% 438,786 6% 52210 VRS Retirement 437,463 591,240 721,130 304,477 42% 721,130 0% 895,434 24% 52400 Group Life 47,138 57,700 69,619 29,450 42% 69,619 0% 73,974 6% 53000.06 Purchase Services - Stormwater Fund 225,529 159,076 176,550 86,505 49% 176,550 0% 176,550 0% 53000.10 Purchase Services - General Fund (landscap 800 - 7,500 - 0% 7,500 0% 7,500 0% 53000.12 Purchase Services - General Fund (Police W 151,971 240,436 115,000 139,982 122% 200,000 74% 200,000 74% 53000.13 Purchase Services - SW Outreach 1,111 1,289 6,469 667 10% 6,469 0% 6,469 0% 53000.16 Purchase Services - Refuse Fund 26,971 37,149 35,000 18,032 52% 40,000 14% 40,000 14% 53100 Professional Services 47,276 110,946 105,000 61,108 58% 105,000 0% 105,000 0% 53100.22 Medical Services - 174 3,500 116 3% 3,500 0% 3,500 0% 53100.36 Automated Traffic Enforcement - - - 2,280,929 - - - -53300 Repair and Maintenance 155,355 137,181 174,800 90,288 52% 200,000 14% 200,000 14% 53310 Repairs - Bridges 2,698,279 2,788,277 3,100,000 505,326 16% 3,500,000 13% 3,500,000 13% 53500 Printing and Binding - - 500 - 0% 500 0% 500 0% 54100 Information Technology 583,836 565,433 716,880 360,640 50% 716,800 0% 806,916 13% 54200 Fleet 1,502,127 1,406,899 1,528,342 656,278 43% 1,528,342 0% 1,699,829 11% 54500 Risk Management 1,039,218 1,346,959 1,341,137 670,568 50% 1,341,137 0% 1,298,452 -3% 55210 Postage 141 19 300 1 0% 300 0% 300 0% 55230 Telecommunications 14,512 16,485 29,689 5,374 18% 29,689 0% 29,689 0% 55500 Travel and Training 30,388 54,263 35,000 5,635 16% 35,000 0% 35,000 0% 55810 Dues and Association Memberships 4,465 4,555 5,000 4,165 83% 5,000 0% 5,000 0% 56001 Office Supplies 3,314 5,270 5,000 552 11% 5,000 0% 5,000 0% 56011 Uniforms & Wearing Apparel 53,781 73,686 80,000 37,711 47% 80,000 0% 80,000 0% 56012 Books and Subscriptions 868 - 1,000 120 12% 1,000 0% 1,000 0% 56014 Other Operating Supplies 457,325 549,779 730,000 209,598 29% 730,000 0% 730,000 0% 56017 Copier Costs 7,892 8,703 8,034 3,286 41% 8,034 0% 8,034 0% 56024 Street Improvements 5,683,137 11,095,999 8,500,000 7,760,683 91% 8,500,000 0% 8,500,000 0% 58200 Capital Outlay 31,265 1,494,790 373,000 187,897 50% 3,443,000 823% 3,443,000 823% 91400-59902 Contingency - - - - - - - -93000-50000.165 Transfer to GF - Indirect Cost 714,960 563,241 578,590 289,295 50% 578,590 0% 667,056 15% 93000-50000.310 Transfer to Capital Projects 1,055,448 704,114 733,977 1,028,977 140% - -100% - -100% 93000-50000.401 Transfer to Debt 1,326,220 1,329,893 1,331,163 1,331,163 100% 1,331,163 0% 1,334,809 0% Total Operating Expenditures $ 20,741,100 $ 28,652,484 $ 26,310,314 $ 18,675,798 71% $ 29,187,025 11% $ 30,027,569 14% Personnel Summary 2021-2022 2022-2023 2023-2024 2024-2025 2024-2025 Range Class Actual Actual Budget Requested Recommended 223 Assistant Director of Public Works 1 1 1 1 1 Public Works General Manager 1 - - -219 Operations Manager 1 3 3 3 3 215/217/219 Civil Engineer I-III 1 1 1 1 1 216 Operations Superintendent 7 6 6 6 6 214 Operations Office Manager 1 1 1 1 1 211 Senior Construction Inspector - 2 2 2 2 208/209/211 Construction Inspector I-III 5 3 3 3 3 209 Street Crew Leader 14 14 14 14 14 Labor Supervisor 1 - - -209 Engineering Technician 1 1 1 1 1 208 Senior Heavy Equipment Operator - 13 13 13 13 208 Maintenance Mechanic - Streets 3 3 3 3 3 208 Accounting Associate 1 1 1 1 1 207 Senior Accounting Technician - - 1 1207 Heavy Equipment Operator 36 24 24 24 24 202/204 Street Maintenance Worker I-II 30 30 30 30 30 204 Staff Support Assistant - 1 1 1 1 204 Accounting Technician 2 2 1 1 2 202 Stock Room Clerk - 1 1 1 1 202 Office Assistant - - 1 1 1 Number of Full-Time Positions 105 107 108 108 108 160
Grants Fund
Description
The Grants Fund is a special revenue fund that provides required local matching contributions to state, federal, and private grant funding secured by City departments. The Grants Fund budget is comprised of local funding transferred from the General Fund which allows the City to leverage funding from state and federal agencies and foundations to assist with a variety of activities, programs, and services for the benefit of Suffolk’s citizens. Grants awarded to the City during the fiscal year are accepted and appropriated to the Grants Fund budget.
Budget Highlights:
No changes to local matching funds to support state and federal grant opportunities.
161
GRANTS FUND Revenue 2021-2022 2022-2023 2023-2024 2023-2024 2024-2025 % 2024-2025 % Actual Actual Budget YTD to Dec Requested Chng Recommended Chng Transfer from General Fund $ 316,623 $ 390,942 $ 800,000 $ 421,297 53% $ 800,000 0% $ 800,000 0% Transfer from Capital Fund - 50,000 - - - - - -Transfer from Stormwater Fund 195,237 149,374 - 7,288 - - - -CDBG Annual Allocation 737,606 - - (87,699) - - - -HOME Annual Allocation 289,179 - - (298,361) - - - -Revenue from the Commonwealth 5,901,517 628,027 - 473,453 - - - -Revenue from the Federal Government 7,123,586 7,859,225 - 19,019,788 - - - -Miscellaneous 2,108,609 699,930 - 1,036,491 - - - -Total Revenue $ 16,672,356 $ 9,777,497 $ 800,000 $ 20,572,258 2572% $ 800,000 0% $ 800,000 0%
2021-2022 2022-2023 2023-2024 2023-2024 2024-2025 % 2024-2025 % Actual Actual Budget YTD to Dec Requested Chng Recommended Chng Grants Operating Expenditures $ 16,128,726 $ 8,811,269 $ 800,000 $ 3,120,689 390% $ 800,000 0% $ 800,000 0% Total Expenditures $ 16,128,726 $ 8,811,269 $ 800,000 $ 3,120,689 390% $ 800,000 0% $ 800,000 0% 162
Expenditure Summary
GRANTS FUND 2021-2022 2022-2023 2023-2024 2023-2024 % 2024-2025 % 2024-2025 % Account Number: 211-91400 Actual Actual Budget Exp to Dec Exp Requested Chng Recommended Chng 59905 Local Cash Match Requirements $ - $ - $ 800,000 $ - 0% $ 800,000 0% $ 800,000 0% CDBG Funding Allocation: CDBG Administration 81,888 83,576 - 29,360 - - - -ForKids Homeless Shelter 259,497 28,554 - - - - - -Ches. Bay Presvtn - Septic Pump Out - 1,145 - - - - - -SRHA Emergency Repair Program 156,180 96,606 - 99,625 - - - -Oak Terrace Affordable Housing - 250,000 - - - - - -Geneive Shelter 35,762 15,000 - - - - - -Western Tidewater Free Clinic 22,000 22,000 - - - - - -Boys and Girls Club 14,000 57,621 - - - - - -Neighborhood and Community Improvem 168,280 223,359 - - - - - -HOME Grant Allocation: Lead Agency Admin-Suffolk 18,855 26,675 - 35,788 - - - -Suffolk 1,000 74,344 - 143,285 - - - -Franklin 37,551 - - - - - - -Isle of Wight 68,624 28,563 - 10,449 - - - -Southampton 44,133 57,069 - - - - - -CHDO-Admin. 119,014 38,004 - 40,000 - - - -Other Funding Allocation: General 51,151 1,500 - - - - - -Judicial 895,531 984,439 - (8,198) - - - -Public Safety 1,026,432 1,768,796 - 1,442,618 - - - -Public Works 68,254 45,575 - 152,229 - - - -Health and Welfare 49,836 17,566 - 10,532 - - - -Education - - - - - - - -Parks, Recreation and Cultural 91,455 21,836 - 180,529 - - - -Community Development 6,447 29,645 - 59,855 - - - -CARES Act/ARPA/Non-Dept 12,912,835 4,939,396 - 896,588 - - - -93000-50000.165 Transfer to General Fund - - - 28,029 - - -Total Operating Expenses $ 16,128,726 $ 8,811,269 $ 800,000 $ 3,120,689 390% $ 800,000 0% $ 800,000 0% Budget Detail 163
THIS PAGE INTENTIONALLY BLANK
164
Law Library Fund
Description
The Law Library Fund was established to provide the general public and legal community access to current legal and consumer protection information at no cost. A special fee of $4.00 is levied on civil court cases in the General District and Circuit courts. This fee is held in a separate fund for the purpose of providing the public and Officers of the Court with a reliable network of legal information and educational support. This fund also supports community outreach efforts, legal publications, the salaries of support staff, and operating costs.
Council Target Area
Civic Engagement & Responsive City Services
Budget Highlights:
FY 25 Objectives
To provide the general public, attorneys, and other professionals with free legal resources.
To enhance awareness of the resources available at the law library.
No funding requested in FY 25.
Law Library temporarily closed for courthouse renovations.
165
Expenditure Summary
LAW LIBRARY FUND Revenue 2021-2022 2022-2023 2023-2024 2023-2024 2024-2025 % 2024-2025 % Actual Actual Budget YTD to Dec Requested Chng Recommended Chng Interest on Investments $ 532 $ 6,189 $ - $ - - $ - - $ -Law Library Fees 25,541 35,926 28,000 11,825 42% - -100% - -100% Fund Balance - - 22,719 - 0% - -100% - -100% Total Revenue $ 26,073 $ 42,115 $ 50,719 $ 11,825 23% $ - -100% $ - -100%
2021-2022 2022-2023 2023-2024 2023-2024 2024-2025 % 2024-2025 % Actual Actual Budget YTD to Dec Requested Chng Recommended Chng Circuit Court - Law Library $ 35,800 $ 9,809 $ 50,719 $ 324 1% $ - -100% $ - -100% Total Expenditures $ 35,800 $ 9,809 $ 50,719 $ 324 1% $ - -100% $ - -100% 166
LAW LIBRARY FUND 2021-2022 2022-2023 2023-2024 2023-2024 % 2024-2025 % 2024-2025 % Account Number: 213-21900- Actual Actual Budget Exp to Dec Exp Requested Chng Recommended Chng 51100.06 Salaries and Wages - Part-time $ 11,936 $ - $ 22,544 $ - - $ - - $ -52100 FICA 913 - 1,725 - - - - -55230 Telecommunications 614 338 516 170 33% - - -56001 Office Supplies - - 700 - - - - -56012 Books and Subscriptions 21,920 9,207 23,000 - - - - -56017 Copier Costs 418 263 435 154 35% - - -58200 Capital Outlay - - 1,800 - - - - -Total Operating Expenditures $ 35,800 $ 9,809 $ 50,719 $ 324 1% $ - - $ -Budget Detail 167
THIS PAGE INTENTIONALLY BLANK
168
Debt Service Fund
169
THIS PAGE INTENTIONALLY BLANK
170
Debt Service Fund
Description
The Debt Service Fund is used to account for the accumulation of resources and the payment of general long term debt principal, interest, and bond issuance costs. Revenue in this fund consists primarily of an allocation of the citywide real estate tax revenue.
Budget Highlights:
Approximately $800,000 increase in debt service for general government principal and interest.
0.00% 1.00% 2.00% 3.00% 4.00% 5.00% FY 14 FY 15 FY 16 FY 17 FY 18 FY 19 FY 20 FY 21 FY 22 FY 23 FY 24
Value % Debt to AV Policy Ceiling 0.00% 2.00% 4.00% 6.00% 8.00% 10.00% 12.00% FY 14 FY 15 FY 16 FY 17 FY 18 FY 19 FY 20 FY 21 FY 22 FY 23 FY 24
Government Expenditures % Debt to General Gov't Exp. Policy 171
Percentage of Outstanding Debt to Assessed
Debt Service as Percentage of General
DEBT SERVICE FUND Revenue 2021-2022 2022-2023 2023-2024 2023-2024 2024-2025 % 2024-2025 % Actual Actual Budget YTD to Dec Requested Chng Recommended Chng Interest on Investments $ - $ - $ - $ - - $ - - $ -2011 VPSA Interest Refund 300,581 300,581 - 151,177 - - - -Miscellaneous Revenue - - - 79,644 - - - -Local Bond Issues 18,258,122 469,766 - 379,629 - - - -Transfer from General Fund 25,699,851 27,583,236 31,734,328 4,191,302 13% 32,523,070 2% 32,523,070 2% Transfer from Road Maintenance 1,326,220 1,329,893 1,331,163 1,331,163 100% 1,334,809 0% 1,334,809 0% Transfer from RT 17 Special Taxing District 398,460 387,269 378,629 378,629 100% 370,586 -2% 370,586 -2% Transfer from Capital Projects 154,227 373,765 - - - - - -Total Revenue $ 46,137,462 $ 30,444,510 $ 33,444,121 $ 6,511,544 19% $ 34,228,465 2% $ 34,228,465 2% Expenditure Summary 2021-2022 2022-2023 2023-2024 2023-2024 2024-2025 % 2024-2025 % Actual Actual Budget YTD to Dec Requested Chng Recommended Chng Consolidated Debt $ 46,137,462 $ 30,294,219 $ 33,444,121 $ 7,068,362 21% $ 34,228,465 2% $ 34,228,465 2% Total Expenditures $ 46,137,462 $ 30,294,219 $ 33,444,121 $ 7,068,362 21% $ 34,228,465 2% $ 34,228,465 2% 172
DEBT SERVICE FUND 2021-2022 2022-2023 2023-2024 2023-2024 % 2024-2025 % 2024-2025 % Account Number: 401-95100 Actual Actual Budget Exp to Dec Exp Requested Chng Recommended Chng 59110 Bond Principal $ 36,829,187 $ 20,809,488 $ 23,087,161 $ 2,305,113 10% $ 23,972,170 4% $ 23,972,170 4% 59120 Bond Interest 8,794,842 9,004,184 9,756,960 4,437,104 45% 9,656,296 -1% 9,656,296 -1% 59130/59140 Bond Issuance and Coupon Handling 513,432 480,548 600,000 326,145 54% 600,000 0% 600,000 0% Total Operating Expenditures $ 46,137,462 $ 30,294,219 $ 33,444,121 $ 7,068,362 21% $ 34,228,465 2% $ 34,228,465 2% Budget Detail 173
THIS PAGE INTENTIONALLY BLANK
174
Enterprise Funds
175
THIS PAGE INTENTIONALLY BLANK
176
Public Utilities Fund
Description
The Department of Public Utilities is responsible for the operation, maintenance, and expansion of the City’s water and wastewater collection systems. The Department is comprised of the divisions of administration, customer service, line maintenance, maintenance, engineering and water production/quality which manage and operate the G. Robert House Water Treatment Plant and the City’s various sanitary sewer pump stations, water and sewer mains.
Council Target Area FY 25 Objectives
Civic Engagement & Responsive City Services
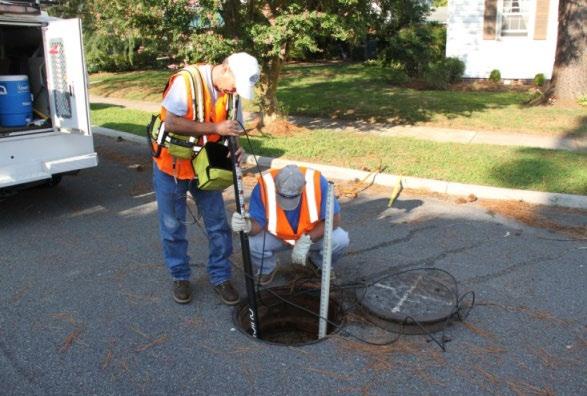
To continue to meet all drinking water standards and regulations.
To continue implementation of the Management, Operations, and Maintenance programs to minimize sanitary sewer overflows.
To produce and provide citizens with access to the annual water quality consumer confidence report.
Expanded Economic Development
To provide timely review of development initiative engineering plans and provide assistance for the implementation of utility services to economic development projects. Financial Stability
Budget Highlights:
Programmer Analyst position added to Maintenance Division to address control system programming at pump stations and reduce the need for paid consultants.
Increase in bulk water contracts with Norfolk and Portsmouth and escalation of chemicals and other operating supplies.
Key Measures FY 23 Actual FY 24 Projected FY 25 Estimate Number of water customers Number of sewer customers Water Consumption (mgd) Average Daily Water Plant Production/Max Day Production (mgd) Treatment Capacity Average Day/Max Day (mgd) Number of sanitary sewer overflows/wet weather capacity overflows MISS Utility requests Percent compliance with 72 hour marking response time Number of plan reviews Percent of plan reviews completed within 30 days of receipt 28,037 24,853 5.72 7.40/8.78 8.21/12.91 14/1 28,000 99% 494 98% 28,500 25,300 6.00 7.80/9.30 8.21/12.91 16/10 28,500 99% 500 100% 29,000 25,500 6.10 8.00/9.30 8.21/12.91 16/10 29,000 99% 500 100% 177
To ensure the Utility Fund remains self-sustaining and in compliance with adopted Utility Fund Financial Policies.
UTILITY FUND Revenue 2021-2022 2022-2023 2023-2024 2023-2024 2024-2025 % 2024-2025 % Actual Actual Budget YTD to Dec Requested Chng Recommended Chng Interest Earned $ 114,093 $ 2,319,972 $ 150,000 $ 162,773 109% $ 250,000 67% $ 250,000 67% Capitalized Interest Reserve - - - - - - - -Rental of General Property 12,220 12,220 - 6,110 - - - 5,920Antenna Space Rental - 39,668 - - - - 42,084Sale of Service - Engineering 248,024 393,490 225,000 98,837 44% 225,000 0% 225,000 0% Water Availability Charges 5,598,925 2,809,150 3,036,000 1,540,200 51% 3,036,000 0% 3,036,000 0% Bulk Water Sales 2,997,061 3,143,582 3,592,976 1,720,616 48% 3,592,976 0% 3,706,256 3% Water Service Charges 23,885,061 25,735,448 26,457,686 14,721,569 56% 26,857,686 2% 28,436,008 7% Water Connection Charges 174,765 145,600 140,000 63,170 45% 140,000 0% 140,000 0% Meter Service Charges 4,647,873 5,176,692 6,108,970 2,582,690 42% 6,122,051 0% 6,230,084 2% Hydrant Rental 200,000 200,000 200,000 100,000 50% 200,000 0% 200,000 0% Sewer Service Charges 14,991,808 16,165,605 17,083,886 9,533,042 56% 17,483,886 2% 18,180,879 6% Sewer Connection Charges 99,475 142,850 115,000 52,100 45% 115,000 0% 115,000 0% Special Fees 119,200 459,039 350,000 217,866 62% 350,000 0% 350,000 0% Sewer Availability Charges 5,936,550 3,069,300 3,300,000 1,649,855 50% 3,300,000 0% 3,300,000 0% 2009 Build American Bonds Rebate - - - - - - - -Miscellaneous 71,879 130,054 70,000 78,358 112% 70,000 0% 21,996 -69% Capital Contributions from Development 5,269,223 2,652,117 - - - - - -Transfer from General Fund 146,910 - - - - - - -Fund Balance - - 20,327,000 - 0% 7,539,692 -63% 7,539,692 -63% Total Revenue $ 64,513,067 $ 62,594,787 $ 81,156,518 $ 32,527,185 40% $ 69,282,291 -15% $ 71,778,919 -12%
2021-2022 2022-2023 2023-2024 2023-2024 2024-2025 % 2024-2025 % Actual Actual Budget YTD to Dec Requested Chng Recommended Chng Administration $ 763,121 $ 1,071,771 $ 1,189,062 $ 600,349 50% $ 1,301,691 9% $ 1,411,228 19% Customer Service 1,741,035 1,765,047 2,228,246 1,023,617 46% 2,238,201 0% 2,427,255 9% Line Maintenance 2,881,283 3,018,439 4,159,983 1,872,402 45% 4,212,004 1% 4,396,366 6% Maintenance 3,717,508 3,806,518 5,025,122 1,940,644 39% 5,132,875 2% 5,133,036 2% Water Production 12,812,738 13,337,449 15,442,870 6,991,131 45% 16,283,410 5% 16,494,795 7% Engineering 1,191,378 1,083,575 1,637,339 623,665 38% 1,535,217 -6% 1,604,821 -2% Non-Departmental 45,743,137 41,045,003 51,473,896 25,779,163 50% 38,578,892 -25% 40,311,418 -22% Total Expenditures $ 68,850,201 $ 65,127,802 $ 81,156,518 $ 38,830,971 48% $ 69,282,291 -15% $ 71,778,919 -12% 178
Expenditure Summary
DEPARTMENT: PUBLIC UTILITIES - ADMINISTRATION 2021-2022 2022-2023 2023-2024 2023-2024 % 2024-2025 % 2024-2025 % Account Number: 501-89510- Actual Actual Budget Exp to Dec Exp Requested Chng Recommended Chng 51100.02 Salaries and Wages $ 460,917 742,741 $ 620,733 $ 338,014 54% $ 712,754 15% $ 774,354 25% 51100.04 Salaries and Wages - Overtime 1,498 1,234 3,000 16 1% 3,000 0% 3,000 0% 52100 FICA 34,503 54,671 47,716 24,936 52% 54,756 15% 59,468 25% 52210 VRS Retirement 5,370 (24,337) 86,158 49,805 58% 98,931 15% 120,827 40% 52400 Group Life 5,304 9,483 8,318 4,822 58% 9,551 15% 10,376 25% 53100 Professional Services 97,658 109,843 210,000 62,897 30% 210,000 0% 210,000 0% 53300 Repairs and Maintenance 10 19 200 - 0% 200 0% 200 0% 53320 Maintenance Service Contract 150 244 240 75 31% 240 0% 240 0% 53500 Printing and Binding 20 - 250 357 143% 250 0% 250 0% 53600 Advertising - 2,649 250 - 0% 250 0% 250 0% 54100 Information Technology 57,867 69,690 83,448 55,875 67% 83,448 0% 96,718 16% 54200 Fleet 11,977 12,135 14,900 7,545 51% 14,900 0% 20,365 37% 54500 Risk Management 54,695 57,662 69,994 34,997 50% 69,994 0% 71,824 3% 55210 Postal Services 6 53 500 2 0% 500 0% 500 0% 55230 Telecommunications 7,418 7,669 9,752 2,563 26% 9,752 0% 9,752 0% 55420 Lease/Rent of Building 11,668 11,668 11,668 9,960 85% 11,668 0% 11,668 0% 55500 Travel and Training 473 952 4,000 607 15% 4,000 0% 4,000 0% 55810 Dues and Association Memberships 9,974 10,546 10,997 5,897 54% 10,997 0% 10,997 0% 56001 Office Supplies 554 1,744 2,500 315 13% 2,000 -20% 2,000 -20% 56011 Uniforms & Wearing Apparel 2,277 2,151 3,000 1,208 40% 3,000 0% 3,000 0% 56012 Books and Subscriptions - 288 500 - 0% 500 0% 500 0% 56013 GASB 87 Amort/Right of Use Asset Expens 5,011 - - - - - - -56017 Copier Costs (4,230) 667 939 458 49% 1,000 6% 939 0% 58200 Capital Outlay - - - - - - - -Total Operating Expenses $ 763,121 $ 1,071,771 $ 1,189,062 $ 600,349 50% $ 1,301,691 9% $ 1,411,228 19% 53100 - Professional Services: Consulting services. 2021-2022 2022-2023 2023-2024 2024-2025 2024-2025 Range Class Actual Actual Budget Requested Recommended Director of Public Utilities 1 1 1 1 1 223 Assistant Director of Public Utilities Operat - - 1 1 1 223 Assistant Director of Public Utilities 1 1 1 1 1 221 Utility Operations Manager 1 1 - -220 Utility Enterprise Controller - - - 1 1 217 Data Quality Control Analyst 1 1 1 1 1 208 Accounting Associate - - 1 1 1 207 Stock Room Supervisor 1 1 1 1 1 205 Administrative Assistant 1 1 - -203 Senior Stock Room Clerk 1 1 1 1 1 Number of Full-Time Positions 7 7 7 8 8 Personnel Summary Budget Detail 179
DEPARTMENT: PUBLIC UTILITIES - CUSTOMER SERVICE 2021-2022 2022-2023 2023-2024 2023-2024 % 2024-2025 % 2024-2025 % Account Number: 501-89520- Actual Actual Budget Exp to Dec Exp Requested Chng Recommended Chng 51100.02 Salaries and Wages $ 897,805 $ 844,909 $ 1,055,493 $ 497,279 47% $ 1,055,493 0% $ 1,141,335 8% 51100.04 Salaries and Wages - Overtime 14,600 19,907 25,500 7,635 30% 25,500 0% 25,500 0% 51100.06 Salaries and Wages - Part-time 21,517 24,397 18,782 12,350 66% 18,782 0% 19,534 4% 52100 FICA 68,595 65,857 84,133 38,110 45% 84,133 0% 90,757 8% 52210 VRS Retirement (4,968) 19,314 146,502 72,394 49% 146,502 0% 186,479 27% 52400 Group Life 10,689 10,901 14,144 7,041 50% 14,144 0% 15,294 8% 53100 Professional Services 280,917 289,893 303,000 123,210 41% 313,000 3% 313,000 3% 53110 Medical Services - - 1,000 - 0% 1,000 0% 1,000 0% 53200 Temporary Help Service Fees 11,658 - - - - - - -53300 Repairs and Maintenance 95 450 9,000 - 0% 8,000 -11% 8,000 -11% 53320 Maintenance Service Contracts 1,650 2,888 2,900 825 28% 2,872 -1% 2,872 -1% 53500 Printing and Binding 541 2,275 5,000 30 1% 5,000 0% 5,000 0% 54100 Information Technology 128,630 124,121 159,310 69,543 44% 159,310 0% 177,708 12% 54200 Fleet 77,477 77,579 83,970 43,411 52% 83,970 0% 114,058 36% 54500 Risk Management 150,841 186,048 229,454 114,727 50% 229,454 0% 235,160 2% 55100 Utilities 6,000 6,000 6,000 - 0% 6,000 0% 6,000 0% 55210 Postal Service 283 125 500 58 12% 500 0% 500 0% 55230 Telecommunications 21,345 22,257 29,421 6,455 22% 29,421 0% 29,421 0% 55420 Lease of Buildings 21,270 21,270 21,270 10,635 50% 21,270 0% 21,270 0% 55500 Travel and Training 2,349 300 1,750 219 13% 1,750 0% 1,750 0% 55810 Dues and Association Memberships 238 299 500 - 0% 500 0% 500 0% 56001 Office Supplies 2,883 3,926 4,000 2,709 68% 3,000 -25% 3,000 -25% 56011 Uniform & Wearing Apparel 10,130 11,632 9,000 6,008 67% 11,500 28% 11,500 28% 56012 Books and Subscriptions - - 100 - 0% 100 0% 100 0% 56014 Other Operating Supplies 13,307 22,325 14,000 9,681 69% 14,000 0% 14,000 0% 56017 Copier Costs 3,184 2,070 3,517 1,297 37% 3,000 -15% 3,517 0% 58200 Capital Outlay - 6,303 - - - - - -Total Operating Expenses $ 1,741,035 $ 1,765,047 $ 2,228,246 $ 1,023,617 46% $ 2,238,201 0% $ 2,427,255 9% 53100 - Professional Service: Contracted meter reading service. 2021-2022 2022-2023 2023-2024 2024-2025 2024-2025 Range Class Actual Actual Budget Requested Recommended 217 Utility Operations Accounts Manager 1 1 1 1 1 214 Assistant Utility Operations Accounts Mana 1 1 1 1 1 212 Field Operations Account Manager 1 1 1 1 1 209 Public Utility Billing Specialist - 3 4 4 4 208 Accounting Associate 10 1 - -206 Water Distribution Operator 2 2 2 2 2 206 Public Utility Account Representative - 6 6 6 6 202 Water Meter Service Worker 8 8 8 8 8 Number of Full-Time Positions 23 23 23 23 23 Budget Detail Personnel Summary 180
DEPARTMENT: PUBLIC UTILITIES - LINE MAINTENANCE 2021-2022 2022-2023 2023-2024 2023-2024 % 2024-2025 % 2024-2025 % Account Number: 501-89530- Actual Actual Budget Exp to Dec Exp Requested Chng Recommended Chng 51100.02 Salaries and Wages $ 985,106 $ 964,268 $ 1,342,791 $ 589,265 44% $ 1,342,791 0% $ 1,470,897 10% 51100.04 Salaries and Wages - Overtime 153,717 123,317 153,000 79,886 52% 153,000 0% 153,000 0% 52100 FICA 84,793 80,091 114,428 49,245 43% 114,428 0% 124,228 9% 52210 VRS Retirement 4,069 18,012 186,379 81,377 44% 186,379 0% 242,414 30% 52400 Group Life 14,270 12,108 17,993 7,888 44% 17,993 0% 19,710 10% 53000.02 Purchased Services - Road Maintenance 4,900 3,000 10,000 - 0% 10,000 0% 10,000 0% 53000.16 Purchased Services - Refuse Collection 14,270 15,825 15,800 14,676 93% 15,800 0% 15,800 0% 53100 Professional Services 24,194 25,369 24,000 11,171 47% 24,000 0% 24,000 0% 53110 Medical Services - 1,065 3,000 - 0% 3,000 0% 3,000 0% 53300 Repairs and Maintenance 448,063 552,790 823,900 302,216 37% 823,900 0% 823,900 0% 53320 Maintenance Service Contract 14,919 30,372 40,964 5,989 15% 42,808 5% 42,808 5% 54100 Information Technology 156,288 134,959 172,881 78,272 45% 172,881 0% 191,979 11% 54200 Fleet 468,593 420,118 546,000 240,987 44% 546,000 0% 507,873 -7% 54500 Risk Management 190,766 244,799 329,276 164,638 50% 329,276 0% 337,187 2% 55100 Utilities 15,000 15,000 15,000 - 0% 15,000 0% 15,000 0% 55230 Telecommunications 18,478 17,081 21,148 6,822 32% 21,148 0% 21,148 0% 55410 Lease/Rent of Equipment - - 25,500 6,841 27% 20,000 -22% 20,000 -22% 55420 Lease/Rent of Property - - - - - 5,500 - 5,50055500 Travel and Training 601 6,802 12,800 32 0% 12,800 0% 12,800 0% 56001 Office Supplies 387 1,539 1,800 19 1% 1,800 0% 1,800 0% 56011 Uniforms & Wearing Apparel 39,675 49,852 51,000 28,617 56% 51,000 0% 51,000 0% 56014 Other Operating Supplies 217,074 278,126 224,500 192,607 86% 274,500 22% 274,500 22% 56017 Copier Costs 2,931 2,054 2,821 1,100 39% 3,000 6% 2,821 0% 56024 Paving & Construction Supplies 23,190 21,892 25,000 10,755 43% 25,000 0% 25,000 0% 58200 Capital Outlay - - - - - - - -Total Operating Expenses $ 2,881,283 $ 3,018,439 $ 4,159,983 $ 1,872,402 45% $ 4,212,004 1% $ 4,396,366 6% 53100 - Professional Services: Miss Utility costs, immunizations, sewer cleaning. 53300 - Repairs & Maintenance: Equipment maintenance, paving, manhole repairs. 55410 - Lease of Equipment: Rental of outside repair equipment. 56014 - Other Operating Supplies: Line equipment supplies, protective equipment. 2021-2022 2022-2023 2023-2024 2024-2025 2024-2025 Range Class Actual Actual Budget Requested Recommended 216 Line Maintenance Manager 1 1 1 1 1 215 Assistant Line Maintenance Manager 1 1 1 1 1 210 Utility Crew Leader 4 4 4 4 4 208 Utilities Locator Technical Lead - - 1 1 1 208 Senior Heavy Equipment Operator - 2 2 2 2 207 Heavy Equipment Operator 5 3 3 3 3 206 Utility Field Technician 7 7 7 7 7 205 Utilities Locator 4 4 3 3 3 202 Utility Systems Worker 8 8 7 8 8 Number of Full-Time Positions 30 30 29 30 30 Personnel Summary Budget Detail 181
DEPARTMENT: PUBLIC UTILITIES - MAINTENANCE 2021-2022 2022-2023 2023-2024 2023-2024 % 2024-2025 % 2024-2025 % Account Number: 501-89540- Actual Actual Budget Exp to Dec Exp Requested Chng Recommended Chng 51100.02 Salaries and Wages $ 967,678 $ 1,448,092 $ 1,262,919 $ 552,204 44% $ 1,342,068 6% $ 1,415,946 12% 51100.04 Salaries and Wages - Overtime 111,919 134,203 100,000 47,322 47% 100,000 0% 100,000 0% 52100 FICA 79,676 119,719 104,263 44,522 43% 110,318 6% 115,970 11% 52210 VRS Retirement 12,717 (32,868) 175,293 81,884 47% 186,279 6% 234,080 34% 52400 Group Life 12,236 17,923 16,923 7,934 47% 17,984 6% 18,974 12% 53000.16 Purchased Services - Refuse Collection 2,947 2,947 2,000 1,474 74% 3,000 50% 3,000 50% 53100 Professional Services 1,105 60 5,000 - 0% 4,000 -20% 4,000 -20% 53110 Medical Services 58 1,917 4,000 - 0% 4,000 0% 4,000 0% 53300 Repairs and Maintenance 208,968 264,786 451,650 90,056 20% 451,650 0% 451,650 0% 53320 Maintenance Service Contract 4,375 4,988 5,267 1,564 30% 5,266 0% 5,266 0% 54100 Information Technology 119,072 138,169 180,766 81,320 45% 180,766 0% 204,160 13% 54200 Fleet 819,733 824,809 857,674 366,916 43% 857,674 0% 688,321 -20% 54500 Risk Management 172,574 213,007 289,411 144,706 50% 289,411 0% 306,514 6% 55100 Utilities 283,808 345,695 400,000 151,024 38% 400,000 0% 400,000 0% 55230 Telecommunications 19,657 22,632 19,529 6,345 32% 19,529 0% 19,529 0% 55410 Lease/Rent of Equipment 154,743 - 802,000 233,843 29% 806,500 1% 806,500 1% 55500 Travel and Training 3,923 3,101 12,400 1,144 9% 12,400 0% 12,400 0% 55810 Dues and Association Memberships 5,767 5,787 7,830 6,002 77% 7,030 -10% 7,030 -10% 56001 Office Supplies 1,593 1,649 2,500 1,116 45% 2,000 -20% 2,000 -20% 56011 Uniforms & Wearing Apparel 28,811 36,042 31,000 18,658 60% 35,000 13% 35,000 13% 56013 GASB 87 Amort/Right of Use Asset Expens 437,408 - - - - - - -56014 Other Operating Supplies 262,940 246,823 280,000 98,279 35% 284,000 1% 284,000 1% 56017 Copier Costs 5,799 7,038 10,697 4,333 41% 10,000 -7% 10,697 0% 58200 Capital Outlay - - 4,000 - 0% 4,000 0% 4,000 0% Total Operating Expenses $ 3,717,508 $ 3,806,518 $ 5,025,122 $ 1,940,644 39% $ 5,132,875 2% $ 5,133,036 2% 53100 - Professional Services: Air Vac evaluations. 53300 - Repair & Maintenance: Pump station repairs and vacuum services. 55410 - Lease of Equipment: Lease of portable pumps and generators. 56014 - Other Operating Supplies: Supplies and protective gear. 2021-2022 2022-2023 2023-2024 2024-2025 2024-2025 Range Class Actual Actual Budget Requested Recommended 216 Programmer Analyst - - - 1 1 216 Maintenance Manager 1 1 1 1 1 215 Assistant Maintenance Manager 1 1 1 1 1 214 Pump Station Instrumentation & Control Sy 1 1 1 1 1 213 Instrumentation and Control Technician 2 2 2 2 2 210 Utility Crew Leader 3 3 3 3 3 208 Senior Heavy Equipment Operator 1 1 1 1 1 207 Pump Station Mechanic 9 9 9 9 9 206 Utility Field Technician 2 2 2 2 2 202 Utility Systems Worker 6 6 6 6 6 Number of Full-Time Positions 26 26 26 27 27 Budget Detail Personnel Summary 182
DEPARTMENT: PUBLIC UTILITIES - WATER PRODUCTION 2021-2022 2022-2023 2023-2024 2023-2024 % 2024-2025 % 2024-2025 % Account Number: 501-89550- Actual Actual Budget Exp to Dec Exp Requested Chng Recommended Chng 51100.02 Salaries and Wages $ 1,445,113 $ 1,516,452 $ 1,618,864 $ 780,268 48% $ 1,618,864 0% $ 1,748,586 8% 51100.04 Salaries and Wages - Overtime 147,533 134,731 150,000 67,863 45% 150,000 0% 150,000 0% 51100.06 Salaries and Wages - Part-time - - - - - - - -52100 FICA 115,967 117,790 135,318 61,288 45% 135,318 0% 145,242 7% 52210 VRS Retirement (5,260) 19,320 224,698 112,437 50% 224,698 0% 272,034 21% 52400 Group Life 18,499 18,744 21,693 10,883 50% 21,693 0% 23,431 8% 53000.16 Purchases Services - Refuse Collection 1,502 1,474 3,750 709 19% 3,000 -20% 3,000 -20% 53100 Professional Services 102,691 77,082 129,300 40,592 31% 141,400 9% 141,400 9% 53110 Medical Services - 875 1,500 - 0% 1,500 0% 1,500 0% 53300 Repairs and Maintenance 109,598 161,723 119,000 121,034 102% 210,000 76% 210,000 76% 53320 Maintenance Service Contract 79,365 51,196 195,433 112,391 58% 305,933 57% 305,933 57% 53500 Printing and Binding 149 144 1,000 - 0% 1,000 0% 1,000 0% 53600 Advertising - - 1,000 - 0% 1,000 0% 1,000 0% 54100 Information Technology 156,288 147,453 194,211 84,299 43% 194,211 0% 207,432 7% 54200 Fleet 58,842 59,010 57,092 27,901 49% 57,092 0% 53,518 -6% 54500 Risk Management 254,377 318,083 306,205 153,103 50% 306,205 0% 320,858 5% 55100 Utilities 1,019,747 1,222,196 1,149,000 563,649 49% 1,149,000 0% 1,149,000 0% 55210 Postal Service 1,294 1,339 2,700 466 17% 6,000 122% 6,000 122% 55230 Telecommunications 27,579 25,820 20,203 8,995 45% 20,203 0% 20,203 0% 55410 Lease/Rent of Equipment (11,049) - 488,000 236,298 48% 488,000 0% 488,000 0% 55500 Travel and Training 6,514 7,299 19,600 5,571 28% 20,275 3% 20,275 3% 55810 Dues and Association Memberships 103,063 102,775 111,773 100,647 90% 113,758 2% 113,758 2% 55853 Bulk Water Purchase 8,157,892 8,611,046 9,480,565 4,083,229 43% 9,921,760 5% 9,921,760 5% 56001 Office Supplies 2,266 950 3,000 500 17% 2,500 -17% 2,500 -17% 56011 Uniforms & Wearing Apparel 11,830 17,019 18,600 6,599 35% 15,000 -19% 15,000 -19% 56013 GASB 87 Amort/Right of Use Asset Expens 467,703 - - - - - - -56014 Other Operating Supplies 540,876 719,609 975,000 411,000 42% 1,155,000 18% 1,155,000 18% 56017 Copier Costs 360 2,206 3,366 1,411 42% 5,000 49% 3,366 0% 58200 Capital Outlay - 3,114 12,000 - 0% 15,000 25% 15,000 25% Total Operating Expenses $ 12,812,738 $ 13,337,449 $ 15,442,870 $ 6,991,131 45% $ 16,283,410 5% $ 16,494,795 7% 53100 - Professional Services: Lab testing services, toxicity and alkaline tests. 53300 - Repairs & Maintenance: Lab equipment maintenance and services contracts; grass cutting, etc. 55853 - Bulk Water Purchase: Portsmouth water purchase. 56014 - Other Operating Supplies: Lab chemicals and supplies. 2021-2022 2022-2023 2023-2024 2024-2025 2024-2025 Range Class Actual Actual Budget Requested Recommended 220 Water Production Manager 1 1 1 1 1 219 Laboratory Manager 1 1 1 1 1 218 Assistant Water Production Manager 1 1 1 1 1 214 Water Maintenance Supervisor 1 1 1 1 1 213 Instrumentation and Control Technician 1 1 1 1 1 211 Senior Water Treatment Plant Operator 7 7 7 6 6 206 209 Water Treatment Plant Operator I 3 3 3 4 4 209 Water Maintenance Mechanic 4 4 5 5 5 209 Quality Control Technician 4 4 4 4 4 206 Water Distribution Operator 2 2 2 2 2 202 Utility Systems Worker 2 2 1 1 1 202 Custodial Worker 1 1 1 1 1 Number of Full-Time Positions 28 28 28 28 28 Personnel Summary Budget Detail 183
DEPARTMENT: PUBLIC UTILITIES - ENGINEERING 2021-2022 2022-2023 2023-2024 2023-2024 % 2024-2025 % 2024-2025 % Account Number: 501-89560- Actual Actual Budget Exp to Dec Exp Requested Chng Recommended Chng 51100.02 Salaries and Wages $ 802,173 $ 688,005 $ 1,023,816 $ 367,259 36% $ 931,795 -9% $ 949,187 -7% 51100.04 Salaries and Wages - Overtime 12,972 10,592 20,000 2,782 14% 20,000 0% 20,000 0% 51100.06 Salaries and Wages - Part-time - 7,402 - - - - - -52100 FICA 60,427 51,727 79,852 27,239 34% 72,812 -9% 74,143 -7% 52210 VRS Retirement 10,297 23,605 142,106 53,293 38% 129,333 -9% 147,617 4% 52400 Group Life 10,935 9,079 13,719 5,157 38% 12,486 -9% 12,719 -7% 53110 Medical Services - - 1,000 - 0% 1,000 0% 1,000 0% 53300 Repairs and Maintenance - 450 3,000 627 21% 1,000 -67% 1,000 -67% 53320 Maintenance Service Contract 1,350 2,363 2,154 675 31% 2,154 0% 2,154 0% 53500 Printing and Binding 12 28 500 15 3% 500 0% 500 0% 54100 Information Technology 81,854 57,585 71,101 30,132 42% 71,101 0% 77,264 9% 54200 Fleet 48,080 52,215 54,202 35,999 66% 54,202 0% 66,776 23% 54500 Risk Management 96,324 114,939 141,327 70,664 50% 141,327 0% 155,400 10% 55100 Utilities 3,600 3,600 3,600 - 0% 3,600 0% 3,600 0% 55210 Postal Service - 1 750 92 12% 750 0% 750 0% 55230 Telecommunications 16,163 18,025 21,545 4,710 22% 21,545 0% 21,545 0% 55420 Lease/Rent of Building 29,112 29,112 29,112 14,556 50% 29,112 0% 29,112 0% 55500 Travel and Training 1,192 602 6,500 1,553 24% 6,500 0% 6,500 0% 55810 Dues and Association Memberships 583 1,250 1,500 427 28% 1,500 0% 1,500 0% 56001 Office Supplies 384 528 3,000 238 8% 1,500 -50% 1,500 -50% 56011 Uniforms & Wearing Apparel 5,092 5,685 6,000 3,103 52% 6,000 0% 6,000 0% 56012 Books and Subscriptions - - 500 - 0% 500 0% 500 0% 56014 Other Operating Supplies 827 168 2,500 847 34% 1,500 -40% 1,500 -40% 56017 Copier Costs 10,003 6,617 9,556 4,297 45% 10,000 5% 9,556 0% 58200 Capital Outlay - - - - - 15,000 - 15,000Total Operating Expenses $ 1,191,378 $ 1,083,575 $ 1,637,339 $ 623,665 38% $ 1,535,217 -6% $ 1,604,821 -2% 2021-2022 2022-2023 2023-2024 2024-2025 2024-2025 Range Class Actual Actual Budget Requested Recommended 221 Utility Engineering Manager 1 1 - -220 Utility Enterprise Controller - - 1 -215/217/219 Civil Engineer I-III 4 4 4 4 4 217 Construction and Field Services Manager 1 1 1 1 1 214 Engineering Analyst - - 1 1 1 213 Senior Engineering Technician 2 2 1 -211 Senior Construction Inspector - - 4 4 4 208/209/211 Construction Inspector I-III 6 6 - -209 Utility Capital Project Inspector - - 1 1 1 209 Engineering Technician - - 1 1 1 208 Utility Construction Inspector - - 1 1 1 Number of Full-Time Positions 14 14 15 13 13 Budget Detail Personnel Summary 184
DEPARTMENT: PUBLIC UTILITIES - NONDEPARTMENTAL 2021-2022 2022-2023 2023-2024 2023-2024 % 2024-2025 % 2024-2025 % Account Number: 501-91400- Actual Actual Budget Exp to Dec Exp Requested Chng Recommended Chng 51100.27 Leave Compensation $ 31,972 $ 44,645 $ 40,000 $ - 0% $ 40,000 0% $ 40,000 0% 52100 Leave Compensation - FICA 2,446 3,415 3,000 - 0% 3,000 0% 3,000 0% 52001 Western Tidewater Water Authority 59,832 31,756 53,050 8,450 16% 54,500 3% 54,500 3% 52600 Unemployment Expense - - 5,000 - 0% 5,000 0% 5,000 0% 54500 Risk Management Expense 329,349 336,797 394,445 197,222 50% 394,445 0% 488,989 24% 55305 Employer Pension Expense 299,474 439,015 - - - - - -55306 OPEB Expense 56,391 737 - - - - - -55307 OPEB Expense - VRS Plans (32,105) (31,283) - - - - - -55424 Contribution to Reserve - - 3,886,638 - 0% 3,774,904 -3% 5,354,106 38% 55865 GASB 87 Interest Expense 30,873 - - - - - - -55890 Bad Debt Expense (261,540) 170,526 400,000 - 0% 400,000 0% 400,000 0% 58211 Depreciation 17,219,908 18,714,795 - - - - - -58225 Loss (Gain) on Disposition of Assets - 55,041 - - - - - -59902 Contingency - - 100,000 - 0% 100,000 0% 100,000 0% 59906 Environmental Incentive Reimbursement 26,250 6,750 100,000 8,500 9% 100,000 0% 100,000 0% 95100-55865 GASB 87 Interest Expense - 34,915 - - - - - -95100-59110 Bond Principal - - 14,890,513 - 0% 15,441,504 4% 15,441,504 4% 95100-59120 Bond Interest 11,350,103 10,768,807 10,385,309 4,829,785 47% 9,836,906 -5% 9,836,906 -5% 95100-59130 Bond Coupon & Handling 654,499 462,066 100,000 13,735 14% 100,000 0% 100,000 0% 93000-50000.165 Transfer to GF - Indirect Cost 808,685 737,020 788,941 394,471 50% 788,941 0% 847,721 7% 93000-50000.501 Transfer to PU - Capital Projects 15,167,000 9,270,000 20,327,000 20,327,000 100% 7,539,692 -63% 7,539,692 -63% Total Operating Expenses $ 45,743,137 $ 41,045,003 $ 51,473,896 $ 25,779,163 50% $ 38,578,892 -25% $ 40,311,418 -22% Budget Detail 185
THIS PAGE INTENTIONALLY BLANK
186
Stormwater Fund
Description
The Stormwater Fund is a self-sustaining enterprise fund comprised of the divisions of stormwater engineering and mosquito control which oversee initiatives related to infrastructure construction, maintenance, and regulatory compliance. Initiatives include stormwater, transportation, and environmental improvement projects; plan review, inspections, permitting and regulatory compliance of development projects; stormwater asset management; permit issuance impacting City right-of-ways; land acquisition services; administration of the City’s Virginia Pollutant Discharge Elimination System (VPDES) permit to ensure compliance with regulatory requirements; and mosquito control.
Council Target Area
Civic Engagement & Responsive City Services
FY 25 Objectives
To comply with the City’s Municipal Separate Storm Sewer System (MS4) permit by conducting dry weather screenings, illicit discharge investigations, stormwater facility inspections, City facility inspections, staff training, education and outreach events, and volunteer opportunities.
To provide quality plan review and inspections of the development community in an effort to maintain regulatory compliance and accept well-built infrastructure.
To provide for comprehensive review and timely issuance of permits.
To acquire property necessary for capital improvement projects in order to provide improved transportation, infrastructure, and amenities to the citizens of Suffolk.
To provide protection and safety of public health for the citizens of Suffolk through the suppression, abatement, and eradication of mosquito populations.
Budget Highlights:
One additional Mosquito Control Technician provided to address increasing calls for mosquito control services.
Increased debt service principal and interest for stormwater capital projects.
Key Measures FY 23 Actual FY 24 Projected FY 25 Estimate Number of development plans reviewed Number of acres treated with adulticide Number of acres treated with larvacide Citizen calls for mosquito services 288 12,405 3.67 434 250 25,000 10.00 250 255 25,000 10.00 250 187
A - Service revenue for management of Capital Projects by Engineering included right of way acquisition.
B - Revenue to provide for the cost of Right of Way, Asset Management, permit services to the Road Maintenance Division.
C - Revenue for general engineering services provided to Public Works .
D - Developer fees based on flat rate fees for plan review and inspections.
E - Services by Eng'g staff to the Refuse Fund.
F - Revenue for communication to the public on refuse, transit and improvement projects.
F - Represents estimated 73,329 ERU's @ $7.50/month fee.
STORMWATER UTILITY FUND Revenue 2021-2022 2022-2023 2023-2024 2023-2024 2024-2025 % 2024-2025 % Actual Actual Budget YTD to Dec Requested Chng Recommended Chng Penalties and Interest $ 78,766 $ 54,454 $ - $ 26,658 - $ - - $ -Interest Earnings 25,905 495,172 - 171,907 - - - -Sale of Services - Capital Projects A 832,065 856,554 800,000 500,577 63% 850,000 6% 850,000 6% Sale of Services - Road Maintenance B 225,529 159,076 176,550 86,505 49% 176,550 0% 176,550 0% Sale of Services - General Fund (PW Admin) C 421,522 525,896 550,000 161,034 29% 550,000 0% 550,000 0% Permit and Inspection Fees D 1,032,734 689,636 730,000 350,532 48% 600,000 -18% 600,000 -18% Sale of Services - Refuse E 35,352 45,000 45,000 990 2% 45,000 0% 45,000 0% Sale of Services - Outreach F 1,710 3,816 16,469 3,225 - 16,469 - 16,469Stormwater Utility Fee G 6,240,882 6,299,765 6,071,184 3,168,828 52% 6,269,630 3% 6,269,630 3% Miscellaneous Revenue 91,969 261,263 - 41,437 - - - -Transfer from General Fund 70,739 - - - - -Transfer from Mosquito - - - - - - - -Fund Balance - - 163,836 - - - - 1,125,769Total Revenue $ 9,057,174 $ 9,390,632 $ 8,553,039 $ 4,511,693 53% $ 8,507,649 -1% $ 9,633,418 13% Expenditure Summary 2021-2022 2022-2023 2023-2024 2023-2024 2024-2025 % 2024-2025 % Actual Actual Budget YTD to Dec Requested Chng Recommended Chng Engineering $ 5,723,948 $ 5,376,459 $ 7,582,183 $ 3,403,377 45% $ 7,458,186 -2% $ 8,523,774 12% Mosquito Control 788,892 699,671 970,856 364,101 38% 1,049,463 8% 1,109,644 14% Total Expenditures $ 6,512,840 $ 6,076,129 $ 8,553,039 $ 3,767,478 44% $ 8,507,649 -1% $ 9,633,418 13%
188
DIVISION: STORMWATER UTILITY - ENGINEERING (Department of Public Works) Budget Detail 2021-2022 2022-2023 2023-2024 2023-2024 % 2024-2025 % 2024-2025 % Account Number: 514-82220 Actual Actual Budget Exp to Dec Exp Requested Chng Recommended Chng 51100.02 Salaries and Wages $ 2,387,655 $ 2,259,329 $ 2,871,444 $ 1,214,816 42% $ 2,871,444 0% $ 3,099,926 8% 51100.04 Salaries and Wages - Overtime 13,011 12,518 10,000 8,197 82% 10,000 0% 10,000 0% 51100.06 Salaries and Wages - Part-time 4,748 24,128 46,093 7,983 17% 46,093 0% 47,937 4% 52100 FICA 177,892 169,041 223,957 90,544 40% 223,957 0% 241,576 8% 52210 VRS Retirement 11,474 14,413 398,556 175,847 44% 398,556 0% 498,957 25% 52400 Group Life 31,319 31,001 38,477 17,084 44% 38,477 0% 41,539 8% 53000.04 Purchased Services - Road Maint. Fund 300,000 300,000 350,000 - 0% 125,000 -64% 125,000 -64% 53100 Professional Services 270,572 101,990 400,000 9,630 2% 625,000 56% 400,000 0% 53100.18 HRPDC Stormwater Management Fees 38,970 38,758 40,000 40,391 101% 40,000 0% 40,000 0% 53500 Printing and Binding - - 1,000 - 0% 1,000 0% 1,000 0% 54100 Information Technology 153,071 207,480 319,260 117,937 37% 319,260 0% 313,302 -2% 54200 Fleet 65,374 63,275 68,000 28,000 41% 68,000 0% 72,229 6% 54500 Risk Management 270,768 343,134 432,851 216,425 50% 432,851 0% 506,168 17% 55210 Postal Services 282 318 1,800 100 6% 1,800 0% 1,800 0% 55230 Telecommunications 39,583 37,274 49,635 12,111 24% 49,635 0% 49,635 0% 55420 Lease/Rent of Building 74,628 74,628 74,628 37,314 50% 74,628 0% 74,628 0% 55500 Travel and Training 13,970 16,294 27,000 6,924 26% 27,000 0% 27,000 0% 55810 Dues and Association Memberships 9,643 9,441 11,700 8,436 72% 11,700 0% 11,700 0% 56001 Office Supplies 8,076 6,330 12,000 3,368 28% 12,000 0% 12,000 0% 56011 Uniform & Apparel - 2,511 5,000 2,055 - 5,000 - 5,00056012 Books and Subscriptions 365 182 - - - - - -56013 GASB 87 Amort/Right of Use Asset Expens 7,259 7,259 1,400 86 6% 1,400 0% 1,400 0% 56014 Other Operating Supplies 12,586 14,632 20,000 4,700 24% 20,000 0% 20,000 0% 56017 Copier Costs 10,801 10,950 17,951 6,875 38% 17,951 0% 17,951 0% 58200 Capital Outlay (5,997) (4,160) 108,000 - 0% 75,000 -31% 75,000 -31% 58211 Depreciation 99,248 55,570 - - - - - -91400-55305 Employer Pension Expense 263,761 295,539 - - - - - -91400-55306 OPEB Expense 21,148 81 - - - - - -91400-55307 OPEB Expense - VRS Plans 7,138 (11,418) - - - - - -91400-59902 Contingency - - 539,884 - 0% 448,888 -17% 220,085 -59% 93000-50000.165 Transfer to GF - Indirect Cost 279,372 335,756 341,634 170,817 50% 341,634 0% 433,730 27% 93000-50000.211 Transfer to Grants 195,237 149,374 - 7,288 - - - -93000-50000.514 Transfer to Capital Project 950,300 500,000 1,000,000 1,000,000 100% 1,000,000 0% 1,000,000 95100-55865 GASB 87 Interest Expense 118 80 - - - - - -95100-59110 Principal - - - - - - - 355,00095100-59120 Interest 11,577 156,762 171,912 90,294 53% 171,912 0% 621,211 261% 95100-59130 Bond Coupon & Handling - 153,989 - 126,154 - - - 200,000Total Operating Expenditures $ 5,723,948 $ 5,376,459 $ 7,582,183 $ 3,403,377 45% $ 7,458,186 -2% $ 8,523,774 12% 53000.04 - Purchased Services - Road Maintenance Fund: Residential BMP maintenance and enhanced street sweeping. 55810 - Dues & Memberships: HRPDC dues for Regional Stormwater Phase II. Personnel Summary 2021-2022 2022-2023 2023-2024 2024-2025 % 2024-2025 % Range Class Actual Actual Budget Requested Chng Recommended Chng 223 Assistant Director of Public Works 1 1 1 1 1 220 Development and Environmental Programs 1 1 1 1 1 220 Capital Improvement Project Manager 1 1 1 1 1 215/217/219 Civil Engineer I-III 7 7 7 7 7 218 Service Support Manager 1 1 1 1 1 218 Real Estate Manager for Acquisition 1 1 1 1 1 216 Construction Manager 1 1 1 1 1 214 Land Acquisition Agent 3 3 3 3 3 214 Environmental Specialist 1 1 1 1 1 214 Engineering Analyst - - 1 1 1 211 Senior Construction Inspector - 4 4 4 4 208/209/210 Construction Inspector I-III 8 5 7 7 7 210 Community Outreach Coordinator 1 1 1 1 1 210 Asset Manager 1 1 1 1 1 209 Land Acquisition Technician 1 2 2 2 2 209 Engineering Technician 6 6 6 6 6 208 CIP Utility Coordinator - 1 - -208 Accounting Associate 2 2 2 2 2 207 Permit Technician 1 1 1 1 1 207 Litter Control Coordinator 1 1 1 1 1 207 Asset Management Data Technician 1 1 1 1 1 205 Land Acquisition Aide 1 - - -202 Customer Service Representative 1 1 1 1 1 Number of Full-Time Positions 41 43 45 45 45 189
DIVISION: STORMWATER UTILITY - MOSQUITO CONTROL (Department of Public Works) 2021-2022 2022-2023 2023-2024 2023-2024 % 2024-2025 % 2024-2025 % Account Number: 514-51310- Actual Actual Budget Exp to Dec Exp Requested Chng Recommended Chng 51100.02 Salaries and Wages $ 346,945 $ 337,763 $ 367,122 $ 170,636 46% $ 399,882 9% $ 430,861 17% 51100.04 Salaries and Wages - Overtime 658 991 1,500 2,442 163% 3,000 100% 1,500 0% 51100.06 Salaries and Wages - Part-time 25,203 14,808 49,493 22,046 45% 29,493 -40% 30,673 -38% 52100 FICA 28,285 26,630 31,986 14,405 45% 33,077 3% 35,422 11% 52210 VRS Retirement 3,843 1,620 50,957 24,935 49% 55,504 9% 66,490 30% 52400 Group Life 4,511 4,551 4,919 2,411 49% 5,358 9% 5,774 17% 53000.02 Purchased Services - Road Maint. Fund (Ditc 60,000 60,007 60,000 - 0% 75,000 25% 75,000 25% 53000.16 Purchased Services - Refuse Collection 2,603 1,675 4,000 2,795 70% 10,000 150% 10,000 150% 53100 Professional Services 6,732 6,732 15,000 - 0% 15,000 0% 15,000 0% 53300 Repair and Maintenance 3,279 3,430 7,000 2,794 40% 7,000 0% 7,000 0% 53500 Printing and Binding - - 500 - 0% 500 0% 500 0% 54100 Information Technology 113,433 47,528 65,865 22,892 35% 65,865 0% 59,598 -10% 54200 Fleet 35,024 34,012 35,329 26,147 74% 35,329 0% 47,923 36% 54500 Risk Management 45,368 56,136 75,622 37,811 50% 75,622 0% 71,571 -5% 55210 Postage 1,810 1,884 1,900 446 23% 1,900 0% 1,900 0% 55230 Telecommunications 5,798 3,802 5,037 1,248 25% 5,037 0% 5,037 0% 55420 Lease/Rent of Building 15,000 15,000 20,000 7,500 38% 30,000 50% 20,000 0% 55500 Travel & Training 2,614 4,914 5,200 912 18% 5,200 0% 5,200 0% 55810 Dues and Memberships 485 316 700 323 46% 700 0% 700 0% 56001 Office Supplies 88 255 1,000 156 16% 1,000 0% 1,000 0% 56011 Uniforms & Wearing Apparel 2,227 1,951 2,800 1,099 39% 2,800 0% 2,800 0% 56012 Books and Subscriptions - 175 250 - 0% 250 0% 250 0% 56013 GASB 87 Amort/Right of Use Asset Expens 609 609 - - - - - -56014 Other Operating Supplies 84,191 65,962 163,836 22,782 14% 163,836 0% 163,836 0% 56017 Copier Costs 186 918 841 319 38% 841 0% 841 0% 58200 Capital Outlay - 8,000 - - - 27,269 - 50,769Total Operating Expenses $ 788,892 $ 699,671 $ 970,856 $ 364,101 38% $ 1,049,463 8% $ 1,109,644 14% Personnel
2021-2022 2022-2023 2023-2024 2024-2025 2024-2025 Range Class Actual Actual Budget Requested Recommended 216 Mosquito Control Superintendent 1 1 1 1 1 214 Mosquito Control Biologist 2 2 2 2 2 204 Mosquito Control Crew Leader 1 1 1 1 1 202 Mosquito Control Technician 3 3 3 4 4 Number of Full-Time Positions 7 7 7 8 8 Budget Detail 190
Summary
Refuse Fund
Description
The Refuse Fund is a self-sustaining enterprise fund created to account for and manage the City’s refuse collection services. The fund generates revenue through a monthly fee for weekly residential refuse collection, curbside recycling, the sale of trash cans, and bulk collection services. Solid waste is disposed at the regional landfill, the Southeastern Public Service Authority (SPSA). Recycling materials are collected by the Tidewater Fibre Corporation (TFC). The Department of Public Works oversees the City’s refuse collection services.

Council Target Area
Civic Engagement & Responsive City Services
FY 25 Objectives
To provide for the timely removal of trash for over 35,000 residents.
To provide up to 12 free collections annually for all residents.
To collect trash twice per week for businesses located in the Downtown Business Overlay Taxing District. Key Measures
Budget Highlights:
Increased cost of refuse disposal and recycling contract.
$.42M cash funding from Refuse Fund Balance for replacement of aging refuse trucks and rate stabilization.
FY 23 Actual FY 24 Projected FY 25 Estimate Tons of refuse collected Tons of recycling collected Recycling participation rate Number of roll-off containers leased to residential locations 42,781 5,503 57% 98 45,000 5,800 60% 115 48,000 6,100 62% 130 191
REFUSE FUND Revenue 2021-2022 2022-2023 2023-2024 2023-2024 2024-2025 % 2024-2025 % Actual Actual Budget YTD to Dec Requested Chng Recommended Chng Refuse Services Fee $ 9,576,038 $ 9,644,396 $ 9,656,265 $ 4,846,331 50% $ 11,536,488 19% $ 9,709,877 1% Automated Refuse Containers 72,380 67,808 70,000 34,875 50% 70,000 0% 70,000 0% Special Events 140 1,078 - 625 - - - -Weekly Refuse Collection 278 328 - 126 - - - -Sale of Service - Mosquito 2,603 1,675 4,000 2,795 70% 10,000 150% 10,000 150% Sale of Service - DBOD Refuse Collection 58,000 65,000 65,000 43,649 67% 69,768 7% 65,000 0% Sale of Service - RM Refuse Collection 26,971 37,149 35,000 18,032 52% 40,000 14% 40,000 14% Bulk Refuse Fees 27,170 24,385 25,000 11,653 47% 25,000 0% 25,000 0% Sale of Service - PU Refuse Collection 17,017 20,246 21,550 16,797 78% 21,550 0% 21,800 1% Sale of Service - GF Refuse Collection 65,061 76,562 80,147 54,119 68% 80,147 0% 80,147 0% Sale of Service - Aviation Refuse Collection 3,575 6,359 5,500 3,099 56% 7,000 27% 7,000 27% Sale of Service - Fleet Refuse Collection 1,474 1,445 1,854 680 37% 1,854 0% 1,854 0% Sale of Service - Transit Refuse Collection 3,636 3,636 5,848 1,818 31% 5,848 0% 5,848 0% Miscellaneous Revenue 5,723 4,037 - 3,369 - - - -Dumpster Service 214,614 266,447 220,000 99,133 45% 265,000 20% 265,000 20% Landfill Host Fee 591,305 816,099 691,200 - 0% 801,000 16% 801,000 16% Penalties & Interest 108,338 225,560 - 54,944 - - - -Transfer from General Fund 36,227 - - - - - - -Fund Balance - - 634,722 - 0% 1,952,846 208% 2,480,000 291% Total Revenue $ 10,810,550 $ 11,262,210 $ 11,516,086 $ 5,192,044 45% $ 14,886,501 29% $ 13,582,526 18% Expenditure Summary 2021-2022 2022-2023 2023-2024 2023-2024 2024-2025 % 2024-2025 % Actual Actual Budget YTD to Dec Requested Chng Recommended Chng Refuse Services $ 9,721,980 $ 10,316,536 $ 11,516,086 $ 5,126,405 45% $ 14,886,501 29% $ 13,582,526 18% Total Expenditures $ 9,721,980 $ 10,316,536 $ 11,516,086 $ 5,126,405 45% $ 14,886,501 29% $ 13,582,526 18% 192
REFUSE FUND 2021-2022 2022-2023 2023-2024 2023-2024 % 2024-2025 % 2024-2025 % Account Number: 520-42320 Actual Actual Budget Exp to Dec Exp Requested Chng Recommended Chng 51100.02 Salaries and Wages $ 1,360,488 $ 1,489,983 $ 1,822,669 $ 774,663 43% $ 1,812,669 -1% $ 1,995,726 9% 51100.04 Salaries and Wages - Overtime 123,335 196,648 56,000 93,111 166% 120,000 114% 56,000 0% 51100.06 Salaries and Wages - Part-time - 15,707 - 11,508 - 25,000 - 26,00052100 FICA 106,850 124,938 143,718 64,443 45% 149,762 4% 158,946 11% 52210 VRS Retirement 7,829 8,715 252,986 113,251 45% 251,598 -1% 321,896 27% 52400 Group Life 18,872 19,472 24,424 10,969 45% 24,290 -1% 26,743 9% 53000 Purchased Services - Landfill/Recycling 4,953,641 5,265,597 5,275,862 2,479,059 47% 5,494,376 4% 5,494,376 4% 53000.06 Purchased Services - Stormwater 35,352 45,000 45,000 990 2% 45,000 0% 45,000 0% 53000.13 Purchased Services - SW Outreach - 516 5,000 167 3% 5,000 0% 5,000 0% 53000.42 Purchased Services - Road Maintenance 78,113 75,000 75,000 37,500 50% 75,000 0% 75,000 0% 53100 Professional Services - - 5,000 - 0% 5,000 0% 5,000 0% 53100.22 Medical Services - 264 1,000 - 0% 1,000 0% 1,000 0% 53200 Temporary Help Service Fees - - - 9,957 - - - -53300 Repair and Maintenance 8,201 16,645 30,000 6,318 21% 30,000 0% 30,000 0% 53500 Printing and Binding 887 726 1,000 320 32% 1,000 0% 1,000 0% 54100 Information Technology 252,085 214,518 268,933 141,131 52% 268,933 0% 300,787 12% 54200 Fleet 1,832,074 1,878,712 1,831,500 855,760 47% 1,757,720 -4% 1,906,580 4% 54500 Risk Management 348,846 423,131 502,918 251,459 50% 502,918 0% 482,954 -4% 55100 Utilities 18,795 20,349 25,000 7,222 29% 27,000 8% 27,000 8% 55210 Postal Services 1,285 1,009 1,500 450 30% 1,500 0% 1,500 0% 55230 Telecommunications 4,642 5,266 7,160 1,332 19% 7,200 1% 7,160 0% 55500 Travel and Training 300 1,997 1,600 597 37% 1,600 0% 1,600 0% 55810 Dues and Association Memberships 6,747 6,839 8,000 7,075 88% 8,000 0% 8,000 0% 56001 Office Supplies 2,484 2,695 8,500 591 7% 8,500 0% 8,500 0% 56011 Uniforms & Wearing Apparel 47,580 43,549 48,000 23,145 48% 48,000 0% 48,000 0% 56013 GASB 87 Amort/Right of Use Asset Expens 1,578 1,578 - - - - - -56014 Other Operating Supplies 142,873 163,654 195,912 99,961 51% 286,000 46% 277,326 42% 56017 Copier 758 801 2,433 941 39% 2,435 0% 2,433 0% 58200 Capital Outlay - - 390,000 - 0% 3,490,000 795% 2,000,000 413% 91400-55305 Employer Pension Expense 52,351 66,190 - - - - - -91400-55306 OPEB Expense 17,622 230 - - - - - -91400-55307 OPEB Expense - VRS Plans (6,088) (11,457) - - - - - -91400-59902 Contingency - - 50,000 - 0% - -100% - -100% 93000-50000.165 Transfer to GF - Indirect Cost 302,897 244,397 268,971 134,486 50% 269,000 0% 269,000 0% 95100-55865 GASB 87 Interest Expense 24 16 - - - - - -95100-59110 Principal - - 160,000 - 0% 160,000 0% - -100% 95100-59120 Interest 1,560 (6,149) 8,000 - 0% 8,000 0% - -100% Total Operating Expenses $ 9,721,980 $ 10,316,536 $ 11,516,086 $ 5,126,405 45% $ 14,886,501 29% $ 13,582,526 18% 53000 - Purchased Services - Recycling: Convenience center recycling; Hazardous waste program; TFC recycling 53300 - Repair & Maintenance: Front end dumpster loader repairs; sanitization and repairs of containers 55810 - Dues & Memberships: HRPDC dues for Hampton Roads Clean Community & Debris management. Personnel Summary 2021-2022 2022-2023 2023-2024 2024-2025 2024-2025 Range Class Actual Actual Budget Requested Recommended 214 Refuse Supervisor 1 1 1 1 1 210 Customer Service Supervisor 1 1 1 1 1 209 Refuse Field Supervisor 1 1 1 1 1 208 209 Senior Refuse Equipment Operator - 19 19 19 19 207 208 Refuse Equipment Operator 26 7 7 7 7 204 Refuse Inspector 2 2 2 2 2 202 Refuse Worker 7 7 7 7 7 202 Refuse Dispatcher 2 2 2 2 2 Number of Full-Time Positions 40 40 40 40 40 Budget Detail 193
THIS PAGE INTENTIONALLY BLANK
194
Internal Service Funds
195
THIS PAGE INTENTIONALLY BLANK
196
Fleet Management Fund
Description
The Division of Fleet Management is operated as an internal service fund for the purpose of providing equipment and vehicles to City departments. The Division also houses a portion of the school transportation personnel and supplies them with controlled inventory and computerized maintenance records.
To ensure consistent and precise billing for all supported departments.
To utilize municipal and state cooperative purchasing contracts for City asset purchases to secure the most favorable prices for Fleet Management.
To sustain a sound replacement program to provide safe and suitable equipment while minimizing costs to maintain the City fleet.
To provide ongoing training opportunities for staff.
Budget Changes:
Fleet Support Associate position added to support Mechanic Supervisor with daily operations and coordination of fuel site maintenance, facility maintenance, and safety standards.
Reclassification of Stock Room Clerks to Fleet Parts Specialist to better align with job duties and functions.
Increased funding for parts and supplies due to escalating costs.
$3.5M cash funding from Fleet Fund Balance for replacement equipment/vehicles and new additions in support of City operating departments.
Target Area FY 25 Objectives
Council
Responsive City Services
Civic Engagement &
Key Measures FY 23 Actual FY 24 Projected FY 25 Estimate Number of fleet work orders received Average work order completion time Percent of time Fleet is available for users Immediate Parts Fill Rate 7,100 9.0 90% 88% 7,000 8.0 90% 85% 7,000 8.0 90% 85% 197
FLEET MANAGEMENT FUND Revenue 2021-2022 2022-2023 2023-2024 2023-2024 2024-2025 % 2024-2025 % Actual Actual Budget YTD to Dec Requested Chng Recommended Chng Interest on Investments $ 43,585 $ 525,098 $ - $ - - $ - - $ -Sale of Service - Interfund Revenue 10,153,801 10,400,763 10,932,873 5,057,692 46% 12,756,816 17% 12,590,216 15% Sale of Service - Intergovernmental Revenue 769,346 940,048 849,000 462,536 54% 1,035,000 22% 1,201,600 42% Sale of Surplus Property 153,032 258,141 - 197,518 - - - -Miscellaneous 389,000 612 - 521 - - - -Transfer from General Fund 28,792 - - - - - - -Transfer from Risk Management - - - - - - - -Fund Balance - - 3,175,000 - 0% 5,138,500 62% 3,555,500 12% Total Revenue $ 11,537,556 $ 12,124,662 $ 14,956,873 $ 5,718,267 38% $ 18,930,316 27% $ 17,347,316 16%
2021-2022 2022-2023 2023-2024 2023-2024 2024-2025 % 2024-2025 % Actual Actual Budget YTD to Dec Requested Chng Recommended Chng Fleet Management $ 9,793,247 $ 12,140,201 $ 14,956,873 $ 6,237,772 42% $ 18,930,316 27% $ 17,347,316 16% Total Expenditures $ 9,793,247 $ 12,140,201 $ 14,956,873 $ 6,237,772 42% $ 18,930,316 27% $ 17,347,316 16% Sale of Service - Intergovernmental Revenue - includes Fleet service to WTCSB, Health Dept., WTRJ, School Transportation, VRT. 198
Expenditure Summary
DIVISION: FLEET MANAGEMENT (Department of Public Works) 2021-2022 2022-2023 2023-2024 2023-2024 % 2024-2025 % 2024-2025 % Account Number: 601-12520- Actual Actual Budget Exp to Dec Exp Requested Chng Recommended Chng 51100.02 Salaries and Wages $ 1,148,045 $ 1,100,996 $ 1,219,169 $ 575,409 47% $ 1,264,223 4% $ 1,401,638 15% 51100.04 Salaries and Wages - Overtime 28,959 14,304 27,050 4,599 17% 27,050 0% 27,050 0% 52100 FICA 87,550 83,021 95,336 43,138 45% 98,782 4% 109,295 15% 52210 VRS Retirement 6,551 7,794 168,381 77,374 46% 175,474 4% 233,943 39% 52400 Group Life 14,857 15,088 16,337 7,508 46% 16,941 4% 18,782 15% 53000.13 Purchased Services - SW Outreach - - - 167 - - - -53000.16 Purchased Services - Refuse Collection 1,474 1,445 1,854 680 37% 1,854 0% 1,854 0% 53300 Repairs and Maintenance 53,168 50,792 44,000 20,076 46% 60,000 36% 60,000 36% 53320 Maintenance Service Contracts 2,354 2,581 3,000 1,212 40% 2,600 -13% 2,600 -13% 54100 Information Technology 135,162 130,180 374,580 80,089 21% 374,580 0% 194,712 -48% 54500 Risk Management 563,850 612,282 664,919 332,459 50% 664,919 0% 664,470 0% 55100 Utilities 30,405 40,196 41,000 14,500 35% 41,000 0% 41,000 0% 55210 Postal Services 29 31 150 - 0% 150 0% 150 0% 55230 Telecommunications 2,256 2,425 4,843 744 15% 4,843 0% 4,843 0% 55410 Lease/Rent of Equipment 15,177 - 41,161 20,580 50% 41,161 0% 41,161 0% 55500 Travel and Training 3,531 5,668 6,000 1,520 25% 6,000 0% 6,000 0% 55810 Dues and Association Memberships 1,150 1,233 1,500 784 52% 1,500 0% 1,500 0% 56001 Office Supplies 1,433 1,456 4,500 998 22% 4,500 0% 4,500 0% 56007.04 Vehicle & Power Equipment Fuels 2,090,413 2,104,789 2,695,350 957,279 36% 2,532,125 -6% 2,532,125 -6% 56007.06 Vehicle & Power Equipment Supplies 2,522,867 2,907,973 2,914,000 1,665,867 57% 3,358,903 15% 3,358,903 15% 56011 Uniforms & Wearing Apparel 7,802 7,915 13,760 5,026 37% 17,600 28% 17,600 28% 56013 GASB 87 Amort/Right of Use Expense 29,593 48,624 - - - - - -56014 Other Operating Supplies 35,629 30,744 73,000 14,311 20% 148,776 104% 73,000 0% 56017 Copier Costs 1,241 1,517 5,166 2,042 40% 5,166 0% 5,166 0% 91400-55305 Employer Pension Expense 51,574 126,259 - - - - - -91400-55306 OPEB Expense 9,252 121 - - - - - -91400-55307 OPEB Expense - VRS Plans (1,214) (3,018) - - - - - -91400-59902 Contingency - - 10,847 - 0% 36,097 233% 86,491 697% 95100-55865 GASB 87 Interest Expense 760 1,750 - - - - - -95100-59120 Interest (43,487) (29,143) 25,250 - 0% - -100% - -100% 93000-50000.165 Transfer to GF - Indirect Cost 280,676 263,842 239,199 119,600 50% 239,199 0% 236,661 -1% 93000-50000.310 Transfer to Capital - - - - - - - -Total Operating Expenses $ 7,081,056 $ 7,530,861 $ 8,690,352 $ 3,945,963 45% $ 9,123,443 5% $ 9,123,443 5% Expenses Related to Asset Acquisition 58200 Capital Outlay 4,281 - 3,175,000 2,291,809 72% 5,138,500 62% 3,555,500 12% 58211 Depreciation 2,222,810 4,565,365 3,091,521 - 0% 4,668,373 51% 4,668,373 51% 58225 Loss (Gain) on Disposition of Assets 485,100 43,975 - - - - - -Total Annual Budget $ 9,793,247 $ 12,140,201 $ 14,956,873 $ 6,237,772 42% $ 18,930,316 27% $ 17,347,316 16% 2021-2022 2022-2023 2023-2024 2024-2025 2024-2025 Range Class Actual Actual Budget Requested Recommended 221 Fleet & Equipment Services Manager 1 1 1 1 1 216 Fleet & Equipment Services Assistant Mana 1 1 1 1 1 212 Mechanic Supervisor 1 1 1 1 1 208/209/212 Mechanic I-III 11 11 11 11 11 211 Lead Mechanic 2 2 2 2 2 208 Accounting Associate 1 1 1 1 1 207 Stock Room Supervisor 1 1 1 1 1 205 Fleet Parts Specialist - - - 2 2 205 Administrative Assistant - - - - 1 202 Stock Room Clerk 2 2 2 -202 Office Assistant 1 1 1 1202 Fleet Support Associate - - - 1 1 Number of Full-Time Positions 21 21 21 22 22 Budget Detail Personnel Summary 199
THIS PAGE INTENTIONALLY BLANK
200
Information Technology Fund
Description
The Information Technology Fund operates as an internal service fund providing computer and other related technology and telecommunications services to City departments and other governmental agencies. Services provided include office automation, computer operation, hardware and software implementation, project management, equipment maintenance, networking and Internet, and interactive browser based application development to improve the productivity and effectiveness of user departments and agencies.
Council Target Area
Civic Engagement & Responsive City Services
FY 25 Objectives
To ensure the City’s information technology network is accessible and operational for City departments, agencies, and customers.
To maintain and enhance security of the City’s information technology network and infrastructure.
To implement technology solutions to enhance the efficiency and effectiveness of City programs and services.
To respond to departmental requests for services in a timely manner. Key
Budget Highlights:
Business Analyst position provided to facilitate improved analysis and coordination of technology requirements to address business service needs of City departments.
Project Manager position added to address technology project coordination and implementation needs and reduce reliance on outside consultants
Reclassification of Programmer Analyst to Systems Analyst to provide additional technical and systems skills for enterprise applications.
Increased funding for maintenance service contracts for Citywide and department specific hardware and software.
FY 23 Actual FY 24 Projected FY 25 Estimate
computers maintained Number of helpdesk requests received Percent of helpdesk requests closed within 72 hours Percent of time network is operational 2,700 2,030 75% 99% 2,800 2,200 78% 99% 2,900 2,400 82% 99% 201
Measures
Number of
INFORMATION TECHNOLOGY FUND Revenue 2021-2022 2022-2023 2023-2024 2023-2024 2024-2025 % 2024-2025 % Actual Actual Budget YTD to Dec Requested Chng Recommended Chng Interest on Investments $ 4,709 $ 61,521 $ - $ 5,171 - $ - - $ -Sale of Service - Interfund Revenues 12,201,635 11,722,498 15,220,293 7,434,383 49% 17,101,148 12% 16,791,587 10% Sale of Service - Intergovernmental Revenues 41,507 205,012 273,284 15,067 6% 321,654 18% 326,866 20% GIS Data & Maps 1,415 1,280 - - - - - -Miscellaneous Revenue 775 1,559 - 1,431 - - - -Transfer from General Fund 41,704 - - - - - - -Total Revenue $ 12,291,745 $ 11,991,870 $ 15,493,577 $ 7,456,052 48% $ 17,422,802 12% $ 17,118,453 10% Expenditure Summary 2021-2022 2022-2023 2023-2024 2023-2024 2024-2025 % 2024-2025 % Actual Actual Budget YTD to Dec Requested Chng Recommended Chng Information Technology $ 10,809,652 $ 12,108,522 $ 15,493,577 $ 9,236,833 60% $ 17,422,802 12% $ 17,118,453 10% Total Expenditures $ 10,809,652 $ 12,108,522 $ 15,493,577 $ 9,236,833 60% $ 17,422,802 12% $ 17,118,453 10% Sale of Service - Intergovernmental Revenue - provides service to: Community Corrections, Workforce Development Center. 202
DEPARTMENT: INFORMATION TECHNOLOGY Budget Detail 2021-2022 2022-2023 2023-2024 2023-2024 % 2024-2025 % 2024-2025 % Account Number: 603-12510- Actual Actual Budget Exp to Dec Exp Requested Chng Recommended Chng 51100.02 Salaries and Wages $ 1,478,675 $ 1,588,697 $ 2,258,953 $ 901,039 40% $ 2,483,778 10% $ 2,680,609 19% 51100.04 Salaries and Wages - Overtime 11,315 8,663 8,115 4,718 58% 8,115 0% 8,115 0% 51100.06 Salaries and Wages - Part-time 37,276 - - 19,110 - 128,400 - 133,57852100 FICA 113,855 119,629 173,431 69,167 40% 200,452 16% 215,906 24% 52210 VRS Retirement 11,904 11,356 313,543 130,425 42% 344,748 10% 463,219 48% 52400 Group Life 20,573 20,304 30,270 12,667 42% 33,283 10% 35,920 19% 53100 Professional Services 651,859 995,903 708,096 176,950 25% 708,096 0% 708,096 0% 53300 Repair and Maintenance 180,401 290,589 208,092 243,393 117% 208,092 0% 208,092 0% 53320 Maintenance Service Contracts 6,402,707 5,918,688 7,951,856 6,926,732 87% 8,904,711 12% 8,904,711 12% 54200 Fleet 13,149 18,332 19,700 9,118 46% 19,700 0% 12,029 -39% 54500 Risk Management Expense 212,083 268,378 315,131 157,565 50% 315,131 0% 334,896 6% 55100 Utilities 13,699 9,272 28,072 5,719 20% 28,072 0% 28,072 0% 55210 Postal Services 207 1,213 3,000 398 13% 3,000 0% 3,000 0% 55230 Telecommunications 42,471 38,118 111,528 10,145 9% 111,528 0% 111,528 0% 55240 Data Communications 122,687 130,490 130,600 74,026 57% 240,516 84% 240,516 84% 55410 Lease/Rent of Equipment 13,089 17,138 34,034 24,817 73% 34,034 0% 13,800 -59% 55420 Lease/Rent of Building 58,300 58,300 58,300 25,144 43% 58,300 0% 58,300 0% 55500 Travel and Training 8,916 25,316 60,000 9,209 15% 60,000 0% 60,000 0% 55810 Dues and Association Memberships 1,518 1,860 5,000 85 2% 5,000 0% 5,000 0% 56001 Office Supplies 10,826 9,685 7,000 3,506 50% 7,000 0% 7,000 0% 56011 Uniforms & Wearing Apparel - 3,614 - - - - - -56012 Books and Subscriptions 82 218 500 - 0% 500 0% 500 0% 56013 GASB 87 Amort/Right of Use Expense 34,129 522,366 - - - - - -56014 Other Operating Supplies - 4,049 - - - - - -56017 Copier Costs 9,340 9,713 12,985 6,595 51% 12,985 0% 12,985 0% 56020 Subscription Amortization Expense - 132,669 - - - - - -91400-55305 Employer Pension Expense 61,941 (244) - - - - - -91400-55306 OPEB Expense 13,484 265 - - - - - -91400-55307 OPEB Expense - VRS Plans (5,325) (20,280) - - - - - -91400-58225 Loss(Gain) on Disposition of Assets - 210,818 - - - - - -91400-59902 Contingency - - 148,515 - 0% 148,515 0% 179,683 21% 95100-55865 GASB 87 Interest Expense 3,629 34,331 - - - - - -95100-55868 Subscription Interest Expense - 6,019 - - - - - -95100-59110 Principal - - - - - - - -95100-59120 Interest 126,222 228,438 200,000 100,000 50% 200,000 0% 148,500 -26% 95100-59130 Bond Coupon & Handling - (150,080) - 189 93000-50000.165 Transfer to GF - Indirect Cost 290,789 351,128 337,321 168,661 50% 337,321 0% 304,382 -10% Total Operating Expenses $ 9,939,800 $ 10,864,953 $ 13,124,041 $ 9,079,380 69% $ 14,601,277 11% $ 14,878,437 13% Expenses Related to Asset Acquisition 58110 Non Capital Outlay 541,581 955,678 450,000 140,430 31% 571,359 27% 500,000 11% 58200 Capital Outlay (1,018,355) (709,800) 852,120 7,751 1% 1,182,750 39% 672,600 -21% 58200.100 Capital Outlay - Bond Funds 659,039 266,498 - 9,273 - - - -58211 Depreciation 687,588 731,192 1,067,416 - 0% 1,067,416 0% 1,067,416 0% Total Annual Budget $ 10,809,652 $ 12,108,522 $ 15,493,577 $ 9,236,833 60% $ 17,422,802 12% $ 17,118,453 10% Personnel Summary 2021-2022 2022-2023 2023-2024 2024-2025 2024-2025 Range Class Actual Actual Budget Requested Recommended Director of Information Technology 1 1 1 1 1 223 Assistant Director of Information Technolog 1 1 1 1 1 222 Project Manager - - - 1 1 219 220 Network Manager 2 1 1 1 1 220 IT Security Administrator 1 1 1 1 1 220 Enterprise Systems Manager 1 1 1 1 1 219 Database Administrator 1 1 1 1 1 219 Business Analyst - - - 1 1 218 Systems Analyst - - - 1 1 218 Service Support Manager 1 1 1 1 1 218 Network Engineer 2 2 2 2 2 218 GIS Manager - - - 1 1 218 Cyber Security Analyst - - 1 1 1 216 Systems Administrator 3 2 4 4 4 215 216 Programmer Analyst 6 6 6 4 4 212 Radio Communications Manager - - 1 1 1 209 211 GIS Analyst - - 1 1 1 211 Computer Support Technician 5 6 6 7 6 208 210 GIS Technician 1 1 - -209 Radio & Electronics Technician 3 3 1 1 1 208 Accounting Associate - - - - 1 207 Senior Accounting Technician 1 1 1 1Number of Full-Time Positions 29 28 30 33 32 203
THIS PAGE INTENTIONALLY BLANK
204
Risk Management Fund
Description
The Division of Risk Management operates as an internal service fund which provides for the payment of expenses associated with the City’s general liability, health insurance, and worker’s compensation coverage. The City is selfinsured for health insurance coverage. Revenue to support these expenses is obtained from the various funds within the City’s annual operating budget based on a cost reimbursement allocation.
To improve workplace safety through employee engagement in safety programs, policies, and practices as part of a total safety management system.
To reduce the City’s worker’s compensation liability exposure through the management of claims appropriately using case management and appropriate settlement strategies.
To manage rising costs of healthcare through strategic benefit plan design with the integration of health and wellness programs.
To improve employee health and well-being by implementing a robust health and wellness program.
Budget Highlights:
Additional funding provided to address projected 6% increase in health insurance premiums.
Benefits Consultant and Risk Management Specialist full-time positions transferred from General Fund, Department of Human Resources.
Human Resources Manager full-time position transferred to General Fund, Department of Human Resources, to address Training Manager needs.
Council Target Area FY 25 Objectives Civic Engagement & Responsive City Services To manage risk to the City through insurance coverage, practices, and
to lower, pass off, and mitigate risk for
to
liability, and injury.
policies appropriate
damage
property,
Key Measures FY 23 Actual FY 24 Projected FY 25 Estimate Workers Compensation: Number of claims filed Cost of claims incurred Property and Liability: Number of claims filed Cost of claims incurred Safety: Building safety inspections and audits Safety Training Classes Number of employees trained Total hours of safety training 510 $1,250,031 385 $365,864 72 65 1,025 3,212 103 $1,185,383 170 $305,897 80 85 1,365 4,254 250 $1,250,000 400 $629,676 90 90 1,595 5,806 205
Expenditure Summary
* Includes funding for OPEB (Post Employment Benefit) funding requirement per GASB 45.
* Includes funding for State unfunded Line of Duty Mandate.
RISK MANAGEMENT FUND Revenue 2021-2022 2022-2023 2023-2024 2023-2024 2024-2025 % 2024-2025 % Actual Actual Budget YTD to Dec Requested Chng Recommended Chng Sale of Service - Interfund Revenues $ 12,314,905 $ 14,992,286 $ 18,578,708 $ 9,295,171 50% $ 19,239,595 4% $ 19,543,210 5% Employee Premiums 2,793,087 2,637,424 2,863,094 1,436,679 50% 3,001,894 5% 2,798,291 -2% Interest 38,868 416,121 - - - - - -Insurance Recoveries 634,507 724,418 - 321,600 - - - -Miscellaneous Revenue (9,572) 38,781 - - - - - -Transfer from General Fund 12,433 - - - - - - -Fund Balance - - 850,000 - - 850,000 0% 850,000Total Revenue $ 15,784,229 $ 18,809,029 $ 22,291,801 $ 11,053,450 50% $ 23,091,489 4% $ 23,191,500 4%
2021-2022 2022-2023 2023-2024 2023-2024 2024-2025 % 2024-2025 % Actual Actual Budget YTD to Dec Requested Chng Recommended Chng Risk Management $ 17,997,872 $ 18,400,922 $ 22,291,801 $ 11,015,124 49% $ 23,091,489 4% $ 23,191,500 4% Total Expenditures $ 17,997,872 $ 18,400,922 $ 22,291,801 $ 11,015,124 49% $ 23,091,489 4% $ 23,191,500 4%
206
DEPARTMENT: RISK MANAGEMENT (Department of Human Resources) 2021-2022 2022-2023 2023-2024 2023-2024 % 2024-2025 % 2024-2025 % Account Number: 606-12550- Actual Actual Budget Exp to Dec Exp Requested Chng Recommended Chng 51100.02 Salaries and Wages $ 526,617 $ 556,604 $ 578,209 $ 294,726 51% $ 646,434 12% $ 637,404 10% 51100.04 Salaries and Wages - Overtime 64 - - - - - - -51100.06 Salaries and Wages - Part-Time 21,174 19,909 61,898 12,667 20% 110,114 78% 64,373 4% 52100 FICA 40,261 41,622 48,968 22,083 45% 57,876 18% 53,686 10% 52210 VRS Retirement 5,228 7,206 80,255 42,389 53% 89,725 12% 102,707 28% 52400 Group Life 5,738 7,211 7,748 4,113 53% 8,662 12% 8,541 10% 53100 Professional Services 78,183 81,327 160,377 96,120 60% 175,677 10% 175,677 10% 53200 Temporary Help Service Fees - - - - - - - -54100 Information Technology 46,775 37,823 49,025 21,093 43% 49,025 0% 54,085 10% 54200 Fleet 3,772 3,412 3,740 2,855 76% 3,740 0% 4,588 23% 55210 Postal Services 5 20 500 41 8% 500 0% 500 0% 55230 Telecommunications 12,011 8,770 18,556 2,927 16% 18,556 0% 18,556 0% 55300 Insurance Premiums 12552-55300 Insurance Premiums - Wcomp + LODA 765,459 682,508 811,820 840,611 104% 809,280 0% 809,280 0% 12553-55300 Insurance Premiums - Property/Casualty 1,546,327 1,690,299 1,811,966 1,629,240 90% 1,880,030 4% 1,880,030 4% 55420 Lease/Rent of Building 34,150 21,930 21,930 10,965 50% 21,930 0% 21,930 0% 55500 Travel and Training 11,058 16,289 12,000 6,860 57% 12,000 0% 12,000 0% 55810 Dues & Memberships 5,777 5,718 5,152 1,939 38% 5,152 0% 5,152 0% 12551-55815 Post Employment Benefits (OPEB) - - - - - - - -55825 Insurance Claims 12551-55825 Claims Payments - Health 13,001,940 12,944,314 16,802,109 6,993,285 42% 17,310,538 3% 17,310,538 3% 12552-55825 Claims Payments - Workers Compensation 773,572 178,557 969,168 458,099 47% 1,017,623 5% 1,017,623 5% 12553-55825 Claims Payments - Property/Casualty 322,973 1,595,614 524,912 349,736 67% 551,158 5% 551,158 5% 12554-56026 Health & Wellness - Special Events 26,828 - 102,650 - 0% 102,650 0% 102,650 0% 56001 Office Supplies 1,490 4,823 2,000 1,257 63% 2,000 0% 2,000 0% 56012 Books and Subscriptions 252 31,320 1,000 - 0% 1,000 0% 1,000 0% 56014 Other Operating Supplies 26,320 33,293 40,500 36,084 89% 40,500 0% 40,500 0% 56017 Copier Costs 3,262 2,819 3,732 1,181 32% 3,732 0% 3,732 0% 56026 Special Events - 84,032 - 62,464 - - - -58200 Capital Outlay - Additions 577,500 29,091 - 81,113 - - - -58211 Depreciation 104,805 107,220 - - - - - -91400-55305 Employer Pension Expense (16,309) 105,021 - - - - - -91400-55306 OPEB Expense 4,939 46 - - - - - -91400-55307 OPEB Expense - VRS Plans (648) 4,230 - - - - - -91400-59902 Contingency - - 87,036 - 0% 87,036 0% 214,772 147% 93000-50000.165 Transfer to GF - Indirect Cost 68,350 99,896 86,551 43,276 50% 86,551 0% 99,018 14% 93000-50000.601 Transfer to Fleet - - - - -Total Operating Expenses $ 17,997,872 $ 18,400,922 $ 22,291,801 $ 11,015,124 49% $ 23,091,489 4% $ 23,191,500 4% 2021-2022 2022-2023 2023-2024 2024-2025 2024-2025 Range Class Actual Actual Budget Requested Recommended 220 Risk Manager 1 1 1 1 1 220 Human Resources Manager - - - 1220 Benefits Manager 1 1 1 1 1 217 Senior Benefits Consultant 1 1 1 1 1 214 Risk Management Specialist - - - - 1 214 Leave Administrator 1 1 1 -214 Benefits Consultant 2 2 2 2 3 212 Safety Officer 2 2 2 2 2 Number of Full-Time Positions 8 8 8 8 9 Budget Detail Personnel Summary 207
THIS PAGE INTENTIONALLY BLANK
208
Component Unit - School Fund
209
THIS PAGE INTENTIONALLY BLANK
210
School Operating Fund
Description
The School Operating Fund provides funding to operate Suffolk Public Schools including 11 elementary schools, 5 middle schools, 3 high schools, an alternative school, and the College and Career Academy at Pruden. The School Operating Fund is comprised of a local appropriation from the City, state and federal funding, and miscellaneous revenue.
211
SCHOOL OPERATING FUND Revenue 2021-2022 2022-2023 2023-2024 2023-2024 2024-2025 % 2024-2025 % Actual Actual Budget YTD to Dec Requested Chng Recommended Chng State / Federal / Other $ 122,971,378 $ 151,743,365 $ 155,504,251 $ 74,431,833 48% $ 167,397,519 8% $ 167,397,519 8% Transfer from General Fund - Local Support 65,332,201 67,332,201 69,332,201 29,684,145 43% 75,332,201 9% 75,332,201 9% Transfer from Capital Projects - - - 2,000,000 - - - -Total Revenue $ 188,303,579 $ 219,075,566 $ 224,836,452 $ 106,115,977 47% $ 242,729,720 8% $ 242,729,720 8%
2021-2022 2022-2023 2023-2024 2023-2024 2024-2025 % 2024-2025 % Actual Actual Budget YTD to Dec Requested Chng Recommended Chng School Operating Expenditures $ 190,188,989 $ 222,540,964 $ 224,836,452 $ 121,029,673 54% $ 242,729,720 8% $ 242,729,720 8% Total Expenditures $ 190,188,989 $ 222,540,964 $ 224,836,452 $ 121,029,673 54% $ 242,729,720 8% $ 242,729,720 8% 212
Expenditure Summary
SCHOOL OPERATING FUND 2021-2022 2022-2023 2023-2024 2023-2024 % 2024-2025 % 2024-2025 % Account Number: 205-610000-51000 Actual Actual Budget Exp to Dec Exp Requested Chng Recommended Chng Instruction $ 134,596,748 $ 158,894,248 $ 170,257,953 $ 78,333,692 46% $ 179,695,426 6% $ 179,695,426 6% Administration and Attendance 3,746,723 4,717,868 4,788,021 2,255,655 47% 4,899,950 2% 4,899,950 2% Health and Psychology 2,624,608 2,959,795 3,261,838 1,524,950 47% 3,323,176 2% 3,323,176 2% Pupil Transportation 8,349,297 10,303,647 10,240,086 5,496,172 54% 10,859,472 6% 10,859,472 6% Operation and Maintenance 24,154,001 27,995,653 19,751,268 9,689,783 49% 23,678,402 20% 23,678,402 20% Food Services 8,615,561 9,791,802 9,567,596 4,447,769 46% 10,341,554 8% 10,341,554 8% Technology 8,102,051 7,877,950 8,969,690 4,151,252 46% 9,931,740 11% 9,931,740 11% Sub-Total: $ 190,188,989 $ 222,540,964 $ 226,836,452 $ 105,899,273 $ 242,729,720 $ 242,729,720 Transfer to Capital Improvements Fund - - - 15,130,400 - - - -Local Support Reduction to Request: - - (2,000,000) - - - - -Sub-Total: $ - $ - $ (2,000,000) $ - $ - $Total Operating Expenses $ 190,188,989 $ 222,540,964 $ 224,836,452 $ 121,029,673 54% $ 242,729,720 8% $ 242,729,720 8% Budget Detail 213
THIS PAGE INTENTIONALLY BLANK
214
215
Appendix
THIS PAGE INTENTIONALLY BLANK
216
CITY OF SUFFOLK, VIRGINIA
Personnel Summary
PROPOSED FY 2024-25 OPERATING AND CAPITAL BUDGET
2021-2022 2022-2023 2023-2024 2024-2025 Budget Budget Budget Budget General Fund: General Government: City Council 3 3 3 3 City Manager 8 8 8 9 Budget & Strategic Planning 3 3 3 3 City Attorney 9 10 10 10 Human Resources 10 13 14 14 Commissioner of Revenue 13 13 13 14 Assessor 21 21 22 22 Treasurer 17 17 17 17 Finance - Administration and Accounting 16 16 16 17 Purchasing 4 4 4 5 Registrar 3 4 4 4 Total General Government 107 112 114 118 Judicial: Circuit Court Judges 2 2 3 3 Clerk of the Circuit Court 15 16 16 16 Sheriff 27 28 30 31 Commonwealth Attorney 26 26 26 27 Total Judicial 70 72 75 77 Public Safety: Police Administration and Officers 229 233 237 244 Emergency Communications 29 29 30 36 Animal Shelter Management 10 11 11 13 Fire and Rescue 297 316 318 326 Total Public Safety 565 589 596 619 Public Works: Public Works Administration 3 3 3 3 Capital Programs & Facilities 25 27 28 28 Total Public Works 28 30 31 31 Health and Welfare: Social Services 102 104 107 108 Comprehensive Services Act 2 2 2 3 Total Health and Welfare 104 106 109 111 217
CITY OF SUFFOLK, VIRGINIA
Personnel Summary
PROPOSED FY 2024-25 OPERATING AND CAPITAL BUDGET
2021-2022 2022-2023 2023-2024 2024-2025 Budget Budget Budget Budget Parks, Recreation and Cultural: Parks and Recreation Administration 13 14 12 12 Parks, Gateway and Facility Maintenance 22 26 29 29 Recreation 29 29 32 33 Library 33 33 33 33 Total Parks, Recreation and Cultural 97 102 106 107 Community Development: Planning 46 51 54 57 Economic Development 6 6 6 7 Tourism 3 3 3 4 Communications 6 6 8 9 Total Community Development 61 66 71 77 Total General Fund 1,032 1,077 1,102 1,140 Special Revenue Funds: Transit 1 1 1 1 Aviation Facilities 2 2 2 2 Road Maintenance Road Maintenance 105 107 108 108 Traffic Engineering 26 30 30 30 Total Special Revenue Funds 134 140 141 141 Enterprise Fund: Public Utilities Administration 7 7 7 8 Customer Service 23 23 23 23 Line Maintenance 30 30 29 30 Maintenance 26 26 26 27 Water Production 28 28 28 28 Engineering 14 14 15 13 Refuse Services Refuse Services 40 40 40 40 Stormwater Utility Engineering 41 43 45 45 Mosquito Control 7 7 7 8 Total Enterprise Funds 216 218 220 222 218
CITY OF SUFFOLK, VIRGINIA
PROPOSED FY 2024-25 OPERATING AND CAPITAL BUDGET
Personnel Summary
2021-2022 2022-2023 2023-2024 2024-2025 Budget Budget Budget Budget Internal Service Funds: Fleet Management 21 21 21 22 Information Technology 29 28 30 32 Risk Management 8 8 8 9 Total Internal Service Funds 58 57 59 63 Total All Funds 1,440 1,492 1,522 1,566 219
THIS PAGE INTENTIONALLY BLANK
220
CITY DEMOGRAPHICS AND STATISTICS
This section of the Proposed FY 2024-2025 Operating & Capital Budget provides a snapshot of key demographic, economic, and social statistics about the City of Suffolk. This information is used to analyze trends that may have an impact on resource allocation decisions and to ensure that the City remains competitive with other jurisdictions in the Hampton Roads region.
Population Growth
Suffolk’s population is estimated at 100,690 residents, a 2% increase over the previous year Overall, Suffolk’s population has increased 12% over the last 10 years.
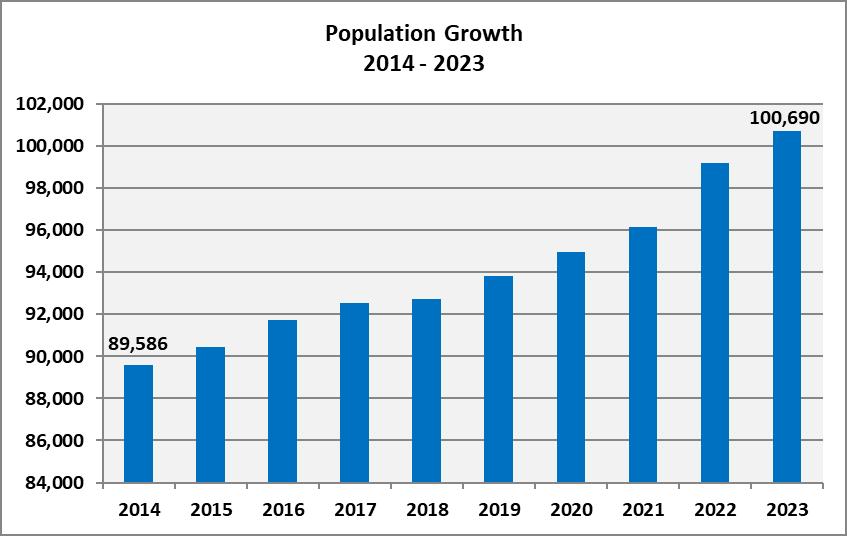
Source: Weldon Cooper Center for Public Service
Median Household Income
Median household income is estimated at $87,758, second highest in the Hampton Roads region and slightly higher the State average ($87,249).
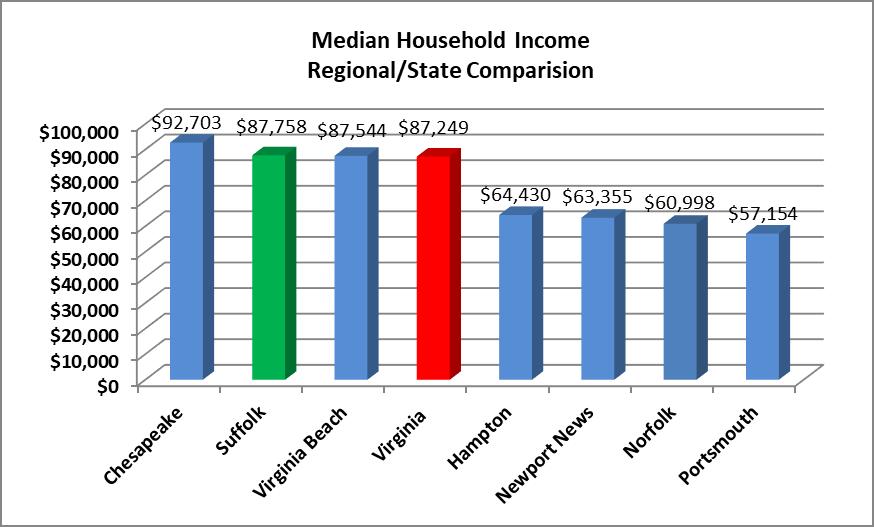
Source: U.S. Census Bureau, American Community Survey
221
Unemployment Rate
The average monthly unemployment rate has ranged from 2.8% to 3.5% in the last 12 months and generally followed the trends of state and federal unemployment. Suffolk’s unemployment rate in December 2023 was 2.8%, which was slightly higher than the state average (2.7%), but less than the national average (3.5%).
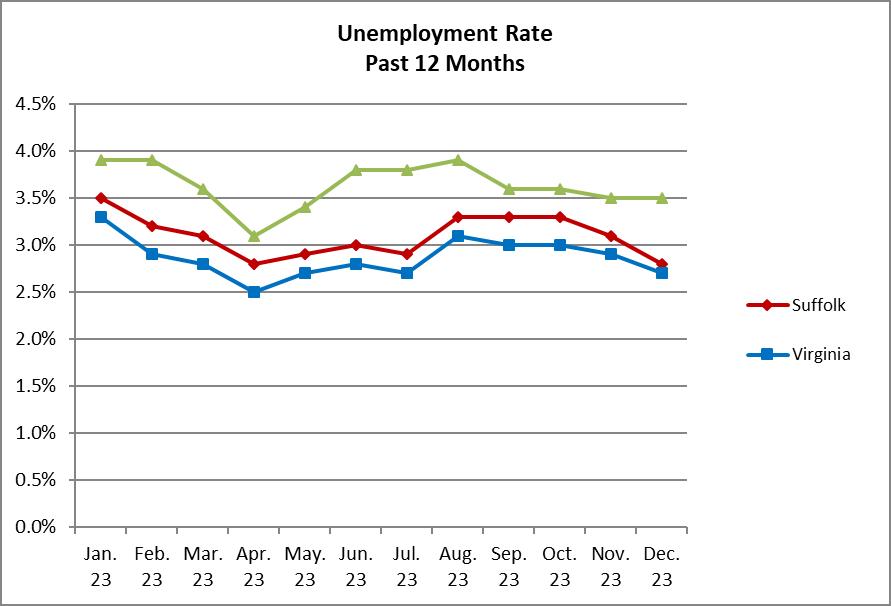
Source: Virginia Employment Commission
Direct Property Tax Rates
The graph below provides an overview of direct property tax rates for citywide real estate, personal property, and machinery and tools taxes over the last 10 years. Personal Property and machinery and tools tax rates have remained flat over the last 10 years. The real estate tax rate has ranged from $1.03 to $1.11 per $100 of assessed value.
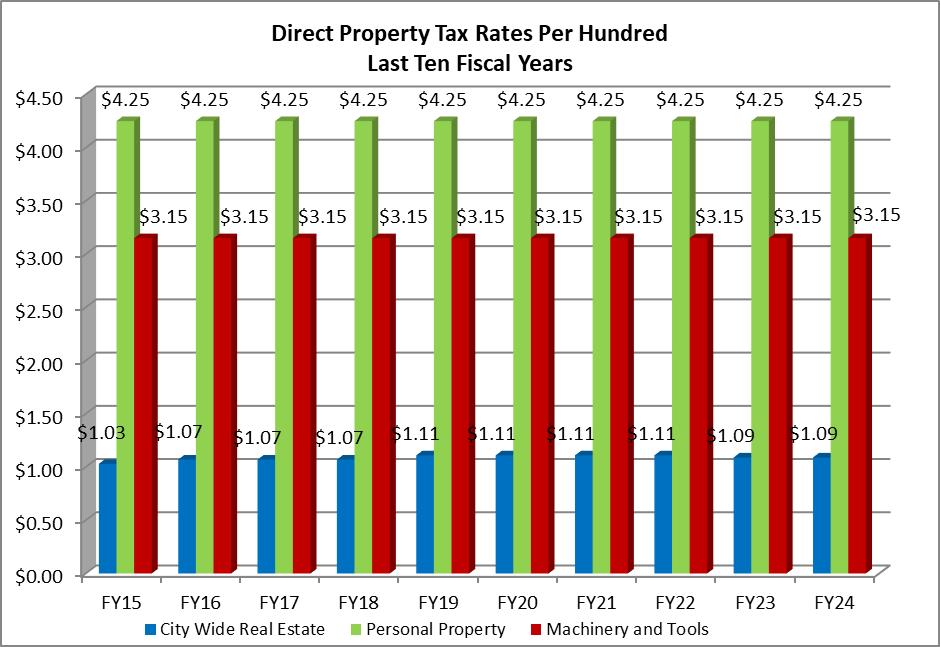
Source: Suffolk Division of Budget and Strategic Planning
222
Real Estate Tax Rate
The adopted FY24 citywide real estate tax rate is $1.09 per $100 of assessed value, third lowest among the seven largest cities in Hampton Roads.
Real Estate Tax Rate Comparison
Source: Suffolk Division of Budget and Strategic Planning
Personal Property Tax Rate
The personal property tax rate is currently $4.25 per $100 of assessed value and consistent with other localities in the Hampton Roads region.
Personal Property Tax Rate Comparsion
Source: Suffolk Division of Budget and Strategic Planning
$4.00 $4.08 $4.25 $4.33 $4.50 $4.50 $5.00 $0.00 $1.00 $2.00 $3.00 $4.00 $5.00 $6.00
$.99 $1.01 $1.09 $1.16 $1.18 $1.25 $1.30 $0.00 $0.20 $0.40 $0.60 $0.80 $1.00 $1.20 $1.40
Suffolk Hampton Newport
Norfolk
Virginia Beach Chesapeake
News
Portsmouth
223
Real Property – Total Assessed Value
As Suffolk has grown in size and stature, the total assessed value of real property has increased from $8.6 billion in FY 2014 to $13.3 billion in FY 2023.
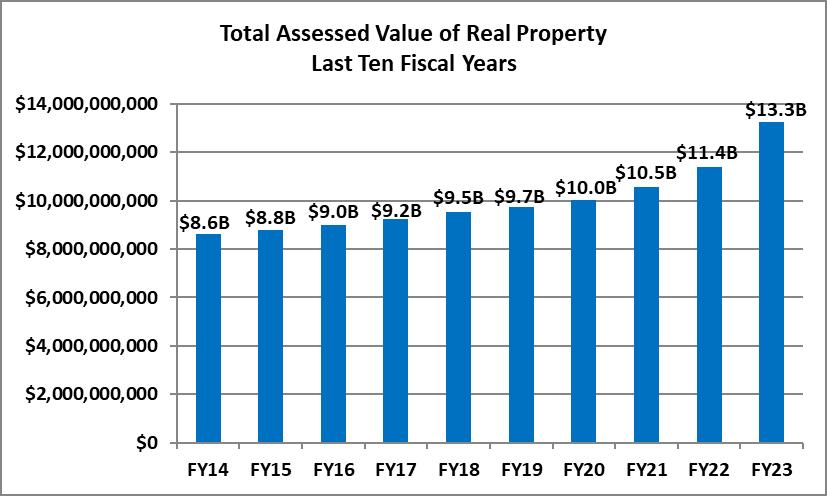
Source: Annual Financial Report for FY 2023
Allocation of Real Property Values
A comparison of real property values from FY 2010 to FY 2024 indicates that residential parcels as a percentage of the overall distribution of parcels by assessed value have decreased from 75.1% to 71.3%. Agricultural parcels have declined from 4.4% to 2.7% and commercial parcels have slightly increased from 19.0% to 20.7%. Multifamily parcels have increased from 1.3% to 5.3%.
Value
Source: City Assessor
FY 2010 FY 2024 Multifamily 1.3% 5 3% Agriculture 4 4% 2 7% Commercial 19 0% 20 7% Residential 75 1% 71 3%
Distribution of Parcels by Assessed
224
Property Tax Levies and Collections
Over the last ten years, property tax collections as a percentage of taxes levied have remained consistently strong at approximately 98% each year.
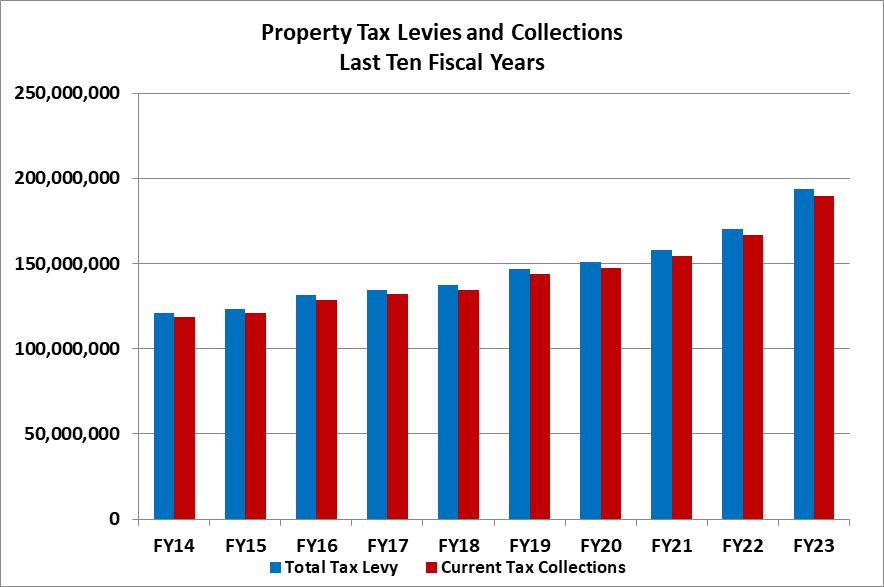 Source: City Treasurer
Taxpayer Taxable Assessed Value Amazon.com Services Inc $354,940,700 SE VA Suffolk Property Owner LLC 107,414,900 Target Corporation 65,111,900 BEC Investors LLC 65,098,900 2152 LLC 62,359,000 EGP 116 Suffolk LLC/116 Lakeview Parkway, LLC 53,232,400 GGT Hampton Roads VA Venture 50,621,200 CL Meridian LP 49,692,800 The Pergola Group 48,985,300
Major Real Property Tax Payers
Source: Annual Financial Report for FY 2023
225
Percentage Increase in Tax Revenues By Source
The chart below provides an overview of the percentage increase in tax revenue by source over the last 10 years.
Source: Annual Financial Report for FY 2023
Size of City Government
The Proposed FY 2024-2025 budget provides for 15.6 full-time positions per 1,000 citizens, a slight increase over the previous year. The Proposed FY25 budget includes 44 new positions for a total of 1,566 full-time positions.
Last Ten Fiscal Years
Source: Suffolk Division of Budget and Strategic Planning
14.00 14.20 14.40 14.60 14.80 15.00 15.20 15.40 15.60 15.80 84,000 86,000 88,000 90,000 92,000 94,000 96,000 98,000 100,000 102,000 FTEs per 1,000 Citizens Population
Full-Time Positions Per 1,000 Citizens City of Suffolk
Approved Positions Per 1,000 Citizens
226
Population
Support of Schools
Funding to support the operation of the school division is provided from local, state, federal, and other sources. Approximately 31% of the schools operating fund is derived from local fund support.
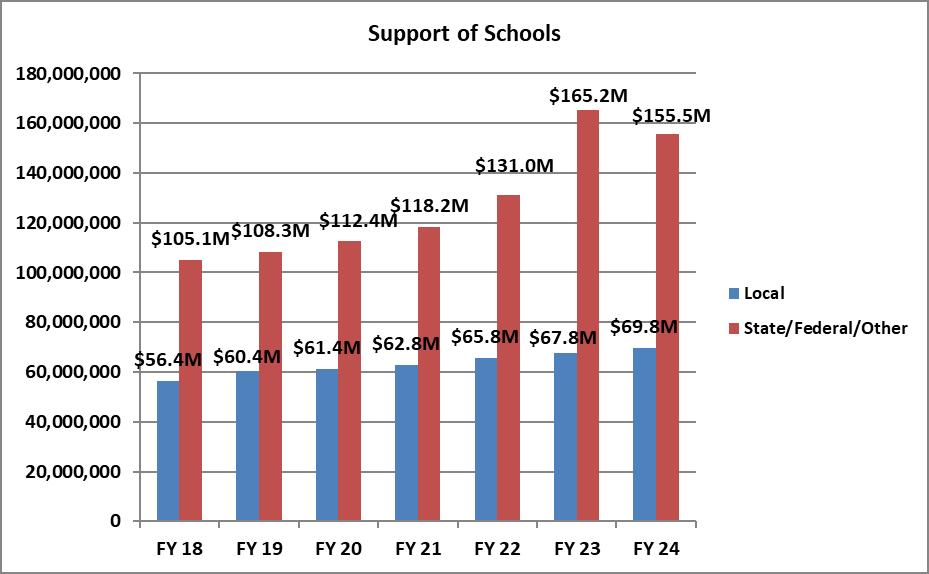
Principal Employers
Suffolk’s employment base is comprised of a diverse mix of business and industry with a workforce of over 35,000 employees. The top employers, excluding the City of Suffolk and Suffolk Public Schools, account for 9,458 employees and 27% of the City’s workforce.
Employer Type of Business Employees Navy Cyber Force ModSim & Technology 2,250 Sentara Health Systems Medical 1,503 Target Warehousing & Distribution 1,500 Amazon Warehousing & Distribution 1,000 CVN Distribution/QVC, Inc Warehousing & Distribution 700 Towne Bank Banking 600 J-7 Joint Starr ModSim & Technology 550 Wal-Mart Stores Retail 525 Bon-Secures Health Systems Medical 450 Hormel/Planters/Kraft Foods Food Processing 380 9,458
Source: Suffolk Department of Economic Development
227
Source: Suffolk Division of Budget and Strategic Planning
THIS PAGE INTENTIONALLY BLANK
228
City of Suffolk
Proposed FY 24-25 Operating and Capital Budget
Summary of Reserves and Designated Funds As of February 29, 2024
General Fund: Commonwealth Attorney - Asset Forfeiture State Designation 284,988 $ Police - Property Seizures Designation 196,819 Police - E Ticketing Fee 220,510 Police - Asset Forfeiture Designation 141,608 Dare Program Designation 2,850 Four for Life Designation 40,829 Fire Program Designation 1,827,853 Employee Vending Proceeds Designation 26,042 2,741,500 $
229
THIS PAGE INTENTIONALLY BLANK
230
Summary of Financial Policy Compliance
The City of Suffolk has established financial policies to ensure prudent financial practices and accountability of public funds managed by the City. The financial policies include guidelines for Revenues, Budget, Capital Improvements Planning, and Debt. As demonstrated in the summary below, the City is achieving compliance with its financial policies. Highlights of each major compliance area include:
FINANCIAL POLICY
Revenue:
All fees and charges shall be reviewed annually with the development of the annual operating budget.
The City will strive to achieve an overall property tax collection rate of 100%
The General Fund unassigned fund balance will not be used to finance current operations.
Restricted revenue shall only be used for the purpose intended and in a fiscally responsible manner.
Budget:
The City budget shall be balanced with planned expenditures equal to estimated revenues.
The City shall maintain a General Fund unassigned fund balance at a minimum rate of 20%.
The City will strive to maintain a Risk Stabilization Fund for its insured risks in an amount equal to 20% of anticipated annual premium costs.
Capital Improvements Planning:
The City will annually prepare and adopt a minimum five-year Capital Improvements Plan.
The City will budget an amount equal to 3% of the General Fund departmental expenditures (excluding certain transfers out, fund balance/reserve allocations, debt service, and flow-through expenditures) to pay-asyou-go capital improvements annually.
Debt:
Debt as a percentage of assessed value shall not exceed the 4% policy ceiling.
Debt as a percentage of general government expenditures shall not exceed the 10% policy ceiling.
COMPLIANCE STATUS
City fees and charges have been reviewed and updated in the proposed FY 25 budget
Revenue collections remain strong with collection rates of greater than 98%.
The proposed FY 25 budget does not include the use of funds from the General Fund unassigned fund balance to pay for current operations.
The proposed FY 25 budget utilizes restricted revenues for the designated purposes in which they were intended.
The proposed FY 25 budget is balanced with estimated revenues supporting proposed expenditures.
The General Fund unassigned fund balance is projected at 20% in FY 25.
The Risk Management unrestricted fund balance exceeds the required $4M in risk stabilization funds to support the proposed FY 25 budget.
City Council adopted the ten-year FY 2025-2034 Capital Improvements Program and Plan (CIP) on February 21, 2024. Funding is included in the proposed FY 25 budget for Year 1 projects
The proposed FY 25 budget exceeds the minimum 3% capital paygo requirement with 11.5% of General Fund departmental expenditures in cash funding for capital projects.
Debt as a percentage of assessed value is 1.4% for FY 25
Debt as a percentage of general government expenditures is 6 2% for FY 25
231
THIS PAGE INTENTIONALLY BLANK
232
FY 25

Financial Policies
Adopted: December 5, 2007
Revised: August 18, 2021
Budget Status: Responses where appropriate for all compliance requirements for FY 25 are denoted in red.
CITY OF SUFFOLK
233
CITY OF SUFFOLK, VIRGINIA FINANCIAL POLICIES
POLICY PURPOSE
The City of Suffolk (the “City”) and its governing body, the City Council (the “Council”), is responsible to the City's citizens to carefully account for all public funds, to manage City finances wisely and to plan for the adequate funding of services desired by the public, including the provision and maintenance of facilities. The following financial policies and guidelines establish the framework for the City’s overall fiscal planning and management.
1.01 Policy Goals
This fiscal policy is a statement of the guidelines and goals that will influence and guide the financial management practices of the City. A fiscal policy that is adopted, adhered to, and regularly reviewed is recognized as the cornerstone of sound financial management. Effective fiscal policy:
• Contributes significantly to the City's ability to insulate itself from fiscal crisis,
• Enhances short term and long term financial credit ability by helping to achieve the highest credit and bond ratings possible,
• Promotes long term financial stability by establishing clear and consistent guidelines,
• Directs attention to the total financial picture of the City rather than single issue areas,
• Promotes the view of linking long term financial planning with day to day operations, and
• Provides the Council and the citizens a framework for measuring the fiscal impact of government services against established fiscal parameters and guidelines.
1.02 Policy Implementation and Coordination
The City has established a Finance Committee that meets quarterly in concert with the release of the City’s quarterly financial projection. The purpose of the Finance Committee is to review the financial affairs of the city generally; and its specific duties shall include, but not be limited to: review of the quarterly financial projection; the tracking of expenditures and revenues generally; compliance with city financial policies and guidelines; and the consideration and recommendations concerning candidates for financial management positions.
1.03 Review and Revision
These polices will be reviewed for appropriateness and comparability with AAA rated jurisdictions every three years or more frequently if a need for review is identified.
234
REVENUES
2.01 Revenue Diversification
The City will strive to maintain diversified and stable revenue streams to protect the government from problematic fluctuations in any single revenue source and provide stability to ongoing services.
Current revenues will fund current expenditures and a diversified and stable revenue system will be maintained to protect programs.
FY 25 Budget Status: Local revenues are diversified in the proposed FY 25 budget. Real estate assessed values increased 5.4% overall due to reassessment and new construction. The proposed FY 25 real estate tax rate is $1.09 per $100 of assessed value. Real estate tax revenue is projected to increase $11.4M or 7% over the previous year. Personal Property assessed values have increased due to the growth of the City. A $4M or 13% increase in personal property tax revenue is projected in FY 25. Other local tax revenues are also trending higher including motor vehicle licenses (8%), sales and use (6%), business licenses (5%), and meals (3%). Overall, local tax revenue including general property and other local taxes is projected to increase $17.8M or 7% in FY 25.
2.02 Fees and Charges
All fees established by the City for licenses, permits, fines, services, applications and other miscellaneous charges shall be set to recover all or a portion of the City’s expense in providing the attendant service. These fees shall be reviewed annually with the development of the annual operating budget.
FY 25 Budget Status: City fees and charges are reviewed annually with revisions provided to recoup a fair portion of the City’s expenses associated with the service delivery.
New fees proposed in the FY 25 budget include fees for parks and recreation community room rentals at recreation centers, festival park special event rentals, and sponsored events for food vendors and merchants; a community development resource protection area/buffer determination review fee, a public hearing unreturned sign fee, a technology fee per permit, a per page scanning fee, a penalty fee for working without permits, concession go kart per track fees, an inspections completed by third party fee; a public utilities trench excavation fee when the depth is greater than six feet; and a finance W-2 reprint fee.
Other fee adjustments are provided for parks and recreation youth sports fees and special event security services; community development correction/amending permits and electrical inspections over 600 amps; and public utilities water and sewer rates per 100 cubic feet, WTWA wholesale water rate, WTWA fixed capacity charge, and water and sewer usage non-metered.
Fees proposed for elimination include community development fees for onsite inspections for relocation of up to 20 sprinkler heads, hood/extinguishing systems, and re-inspections, electrical inspections 700 to 1,200 amps, fire prevention permit inspection fees, plumbing permit inspection fees, mechanical and gas permit fees, moving and accessory structures fees, extension of permits,
OF SUFFOLK, VIRGINIA FINANCIAL POLICIES
CITY
235
CITY OF SUFFOLK, VIRGINIA FINANCIAL POLICIES
addition, alteration and repair fees based on the value of construction; and mechanical, electrical, plumbing, and gas permit fees where no permits are issued and no inspections completed; Constant’s Wharf Park and Marina daily and monthly rates without electricity; and parks and recreation fees for Cypress Park group swim, recreation center birthday party rentals, tennis ball machine rental.
2.03 Revenue Collections
The City will strive to achieve an overall property tax collection rate of 100%.
FY 25 Budget Status: The City continues to maintain strong local collection rates ranging from 96% to 99% for local taxes and fees. Local collection rates are documented annually in the Annual Comprehensive Financial Report.
2.04 Use of Fund Balance
The City’s General Fund equity balance will be utilized to provide sufficient working capital in anticipation of current budgeted revenues and to finance unforeseen emergencies without borrowing. The General Fund equity of the City (Unassigned Fund Balance) will not be used to finance current operations.
FY 25 Budget Status: The proposed FY 25 budget is balanced with current General Fund revenues supporting all current General Fund expenditures in FY 25.
2.05 Restricted Revenue
Restricted revenue (such as Medicaid or Asset Forfeiture funds) shall only be used for the purpose intended and in a fiscally responsible manner.
FY 25 Budget Status: The proposed FY 25 budget utilizes restricted revenues for designated intended purposes.
BUDGET
3.01 Balanced Budget
The provisions of the Code of Virginia shall control the preparation, consideration, adoption and execution of the budget of the City. In addition, the City Charter requires the budget to be balanced with planned expenditures equal to estimated revenues.
The City will annually adopt and execute a budget for such funds as may be required by law or by sound financial practices and generally accepted accounting principles. The budget shall control the levy of taxes and the expenditure of money for all City purposes during the ensuing fiscal year. The City budget shall be balanced within all available operating revenues, including the fund balance, and adopted by the City Council.
236
CITY OF SUFFOLK, VIRGINIA FINANCIAL POLICIES
FY 25 Budget Status: The proposed FY 25 budget is balanced for all funds operated by the City and includes appropriate tax rates where applicable to sustain operations. Budget and tax rate ordinances have been adopted by City Council for the appropriation of all required funds.
3.02 Use of Current Revenues to Support Current Expenditures
Ongoing and stable revenues will be used to support ongoing operating costs.
FY 25 Budget Status: The proposed FY 25 budget is dependent on stable revenues and conservative revenue projections to support operations.
3.03 Use of One-time Revenue and One-time Expenditure Savings
The use of one-time revenues and one-time expenditure savings (excess cash balances) will be used for non-recurring expenditures.
FY 25 Budget Status: All one-time revenues are designated to support one-time expenditures.
3.04 Review of Fees and Charges
Fees established by the City for licenses, permits, fines, services, applications and other miscellaneous charges shall be set to recover all or a portion of the City’s expense in providing the attendant service and reviewed annually with the development of the annual operating budget.
FY 25 Budget Status: All City fees and charges are reviewed annually with revisions provided to recover a portion of the City’s expenses associated with the service provision.
3.05 Revenue and Expenditure Projections
The City will prepare and annually update a long range (5 year) financial forecast model utilizing trend indicators and projections of annual operating revenues, expenditures, capital improvements and related debt service and operating costs, and fund balance levels.
FY 25 Budget Status: A five-year projection of revenues and expenditures is provided for the FY 25 budget using conservative revenue assumptions and planned capital improvements, related debt service, operating costs, projected fund balance levels and real estate tax rate adjustments.
3.06 Budget Performance Monitoring
The Finance Budget Division will maintain ongoing contact with the departmental fiscal officers during the process of the budget execution. Expenditure and revenue projections will be developed quarterly and reviewed with Departmental Directors, the Finance Committee of the City Council, the City Manager, and the City Council. The City Manager through the Budget Division of Finance will exercise appropriate fiscal management as necessary to live within the limits of the adopted budget.
237
CITY OF SUFFOLK, VIRGINIA FINANCIAL POLICIES
FY 25 Budget Status: Quarterly revenue and expenditure projections are provided to the City Manager and City Council. All required budget adjustments are reviewed and approved by the City Manager or their designee to comply with budget requirements.
3.07 Maintenance of Capital Assets
The budget should provide sufficient funds for regular repair and maintenance of capital assets.
FY 25 Budget Status: The proposed FY 25 budget provides adequate repair and maintenance funds to support City capital assets.
3.08 Fund Balance Levels
The City will employ sound financial management principles to include the establishment of an Unassigned Fund Balance sufficient to maintain required working capital and provide a reserve for unanticipated expenditures or emergencies, revenue shortfalls, and other non-recurring uses. In addition to the Unassigned Fund Balance, the City will also establish and maintain a Budget Stabilization Fund and a Capital Reserve Fund.
Unassigned Fund Balance - The ratio of Unassigned General Fund balance as a percentage of Budgeted Governmental Funds Expenditures (net of the General Fund Contribution to Schools, transfer to other Governmental Funds, and Capital Projects Fund Expenditures) plus budgeted expenditures in the School Operating and Food Service Funds indicates the ability of the City to cope with unexpected financial problems or emergencies. The larger the Unassigned General Fund balance, the greater the City’s ability to cope with financial emergencies and fluctuations in revenue cycles. The City has established a minimum rate of 20% at the close of each fiscal year as computed on the upcoming budget year.
Once the Unassigned General Fund balance minimum rate is achieved by the City, it is intended to be maintained for the upcoming fiscal year from prior year surpluses and budgeted additions as available before any other needs are addressed. In the event Unassigned Fund Balance is required to be drawn below the 20% minimum rate due to an emergency (such as a natural disaster) or due to severe economic circumstances, the City will develop a plan to restore the Unassigned Fund Balance over the ensuing two to three years.
Compliance with fund balance policy will be reviewed and reported to City Council at least annually in conjunction with the development of the Operating Budget and with any significant budget amendments made during the fiscal year.
Once the Unassigned Fund Balance policy minimum level is achieved, the City will apply year-end General Fund operating surpluses – if any – as per the following policy.
1. Use of surplus for one-time/contingency items: To the extent the Unassigned Fund Balance policy is achieved, the City may elect to utilize up to $500,000 of the prior year’s surplus, if any, for one-time operating or capital items.
2. The City will establish a Budget Stabilization Fund within the Assigned portion of the General
238
Fund Balance. At the close of each audited fiscal year, after certifying that the Unassigned Fund Balance is in compliance with these policies, the Budget Stabilization Fund shall receive a minimum of 50% of the prior year’s surplus, if any, as calculated in the prior fiscal year audit.
Balances in the Budget Stabilization Fund will be allowed to accumulate until they reach an amount equal to 2.5% of Budgeted Governmental Funds (which is defined previously in the Unassigned Fund Balance policy). Once the 2.5% level is reached no further deposits to the Budget Stabilization Fund are required except to the extent that additional deposits are required to maintain the 2.5% level as Budgeted Governmental Funds grow.
a. Transfers to the Budget Stabilization Fund may also be made as part of the adopted operating budget.
b. Withdrawals from the Budget Stabilization Fund can only be considered if there is an unexpected General Fund revenue decline or expenditure increase during the current fiscal year.
c. The City will not utilize funds from the Budget Stabilization Fund in the development or adoption of the operating budget.
3. The City will establish a Capital Reserve Fund within the Assigned portion of the General Fund Balance. At the close of each audited fiscal year, the Capital Reserve Fund shall receive a minimum of 50% of the prior year’s surplus, if any, as calculated in the prior fiscal year audit. The Capital Reserve Fund can receive a larger allocation of the surplus if the Unassigned Fund Balance and Budget Stabilization Fund policies have been met.
a. There will be no cap or limitation on the balances allowed to accumulate in the Capital Reserve Fund.
b. Balances in the Capital Reserve Fund are available for pay-as- you-go funding of capital projects and other non-recurring capital related expenditures including debt payoff/paydown.
4. To the extent that the Unassigned Fund Balance and Budget Stabilization Fund minimum policy levels have both been met, the City may elect to dedicate a portion of the year-end surplus, if any, to the Capital Reserve Fund, additional deposits to the Unassigned Fund Balance, or other one-time purposes of the City.
FY 25 Budget Status: The General Fund unassigned fund balance achieves the financial policy minimum rate of 20% of budgeted governmental funds Budget stabilization reserve funds equal 2.5% of budgeted governmental funds, and capital reserve funds have been established and are projected to total $50.9M at June 30, 2024.
3.09 Self-Insurance Rate Stabilization Fund
The City will strive to maintain a rate stabilization fund for its insured risks in an amount equal to 20% of anticipated annual premium costs. This rate stabilization fund may be reduced or increased by management based on professional judgment and anticipated claims cost estimates.
CITY OF SUFFOLK, VIRGINIA FINANCIAL POLICIES
239
FY 24 Budget Status: The Risk Management unrestricted fund balance exceeds the required $4M in rate stabilization funds to support the FY 25 budget.
CAPITAL IMPROVEMENTS PLANNING
4.01 Capital Improvement Program
In order to prepare and plan for upcoming capital needs, comply with debt ratio targets, schedule debt issuance, and systematically improve capital infrastructure, the City will annually prepare and adopt a minimum five-year Capital Improvements Plan.
The adopted Capital Improvements Plan will include major capital improvements and identify estimated revenue sources and annual operational costs for facilities to include anticipated debt service requirements.
Capital improvements do not include routine maintenance on existing capital assets.
FY 25 Budget Status: A ten-year Capital Improvements and Program and Plan (CIP) is prepared and updated annually providing five years of detailed projects, revenue sources, debt requirements and annual operating costs. This plan is prepared by the City Manager and reviewed by a committee to include two members of the Planning Commission, the Mayor, and Vice Mayor. The Plan is also reviewed, edited, and recommended by the Planning Commission to the City Council who in turn, reviews, edits and adopts the Plan for consideration of year one projects in the operating budget proposal. A current CIP was adopted by City Council in February 2024. The projects and funding included in the first year of the CIP are included in the FY 25 budget.
4.02 Pay-As-You-Go Capital Improvement Funding
The City will develop an escalation plan to accomplish an annual allocation of an amount equal to 3% of the General Fund departmental expenditures (excluding transfers out, grants, fund balance and reserve allocations, debt service, and respective flow-through expenditures) to pay-as- you-go-capital improvements annually.
The escalation plan will begin with the FY 08 adopted budget and shall be increased annually for the ensuing five (5) year period until the 3% target is achieved.
FY 25 Budget Status: The proposed FY 25 budget includes $26.7M in General Fund cash for capital projects which equates to 11.5% of General Fund departmental expenditures.
CITY OF SUFFOLK, VIRGINIA FINANCIAL POLICIES
240
CITY OF SUFFOLK, VIRGINIA FINANCIAL POLICIES
DEBT
The City Council generally follows the guidelines listed below in making financial decisions on debt issuance. Adherence to these guidelines allows the City to plan for the necessary financing of capital projects while maintaining credit worthiness. In addition, continued adherence to these policies will ensure the City’s strong financial position.
The City shall use an objective analytical approach to determine whether it can afford new or additional general purpose debt. This process shall use the City’s standards of affordability. These standards include the measures of debt service payments as a percent of current expenditures and debt as a percent of taxable real estate value.
5.01 Revenue Anticipation Notes (RANS)
The City does not intend to issue tax or revenue anticipation notes (RANS) to fund government operations but rather to manage cash in a fashion that will prevent any borrowing to meet working capital needs.
The City may issue RANS in an extreme emergency beyond the City’s control or ability to forecast when the revenue source will be received subsequent to the timing of funds needed. Such issuances will be for a period not to exceed a one year period.
5.02 Bond Anticipation Notes (BANS)
The City may issue Bond Anticipation Notes (BANS) in expectation of General Obligation or Revenue Bonds when cash is required in order to initiate or continue a capital project or when longterm markets do not appear appropriate but have a clear potential for improvement within the designated BAN time frame.
The City will not issue Bond Anticipation Notes (BANS) for a period beyond two years. If the City issues a bond anticipation note for a capital project, the BAN will be converted to a long-term bond or redeemed at its expiration.
5.03 Letters of Credit
The City may enter into a letter-of-credit (LOC) agreement when such an agreement is deemed prudent and advantageous. The City will prepare and distribute a request for proposals to qualified banks which includes terms and conditions that are acceptable to the City.
5.04 Lease Purchase Obligations
Lease purchase and master lease obligations, including certificates of participation or lease revenue bonds, shall be considered as an alternative to long-term vendor leases. Such debt shall be subject to annual appropriation.
241
CITY OF SUFFOLK, VIRGINIA FINANCIAL POLICIES
5.05 Public Private Partnerships
The City recognizes the value of developing public-private partnerships. As such, public-private partnerships financings that require the City to provide capital or credit enhancement to a project will be considered in light of the following:
• The project is multi-faceted requiring coordinated and/or accelerated development;
• The project is non-traditional with mixed use of public and private components;
• The project calls for the bundling of design, construction and operation phases; or
• There is an urgent need to construct multiple facilities or other public infrastructure simultaneously to keep pace with a rapidly growing population.
• The project has undergone a rigorous cost-benefit analysis by City Staff (or agents employed by the City for such purpose). If the project ultimately requires City credit enhancement, such obligations will be treated as if debt by the City.
5.06 Compliance with Legal Requirements
Pursuant to the Constitution of Virginia (the Constitution), the City is authorized to issue bonds secured by a pledge of its full faith and credit and unlimited taxing power. There is no requirement in the Constitution, the Virginia Code or the City Charter that the issuance of general obligation bonds be subject to the approval of voters of the City at referendum. The issuance of general obligation bonds is subject to a constitutional limitation of ten percent (10%) of the assessed value of taxable real property. The City’s Charter further limits the issuance of general obligation bonds to seven percent (7%) of the assessed value of taxable property.
5.07 Debt Ratio Policies
Debt as a Percentage of Assessed Value
This ratio indicates the relationship between the City’s debt and the total taxable value of real and personal property in the City. It is an important indicator of the City’s ability to repay debt, because property taxes are the source of the City’s revenues used to repay debt. A small ratio is an indication that the City will be better able to withstand possible future economic downturns and continue to meet its debt obligations.
This ratio is a measure of the City’s ability to repay debt without hampering other City services. A smaller ratio indicates a lesser burden on the City’s operating budget. The numerator shall include debt that is not selfsupporting from a user fee revenue stream. A selfsupporting revenue stream is defined as a revenue stream
Ceiling FY 25 Status
4% 1.4%
Debt as a Percentage of General Government Expenditures 10% 6.2%
242
CITY OF SUFFOLK, VIRGINIA FINANCIAL POLICIES
that provides coverage of all debt service obligations without general fund support (to include tax assessment districts and funds supported by committed state revenues in support of such debt). Any long term financing lease obligations which may be subject to annual appropriation by the City will also be included in the calculations of tax-supported debt service. General governmental expenditures are expenditures reported in the City’s governmental funds (excluding the General Fund Contribution to Schools and the Capital Projects Fund) and expenditures reported in the School Operating and Food Service Funds.
Compliance with the above debt policy ratios will be calculated each fiscal year in conjunction with the budget development process and provided to Council with the proposed annual budget.
5.08 Long Term Debt Policy
The City will use debt financing for capital improvement projects and unusual equipment purchases under the following circumstances:
A. When the project is included in the City’s capital improvement program and/or is generally in conformance with the City’s Comprehensive Plan.
B. When the project is not included in the City’s Capital Improvement Program, but it is an emerging critical need whose timing was not anticipated in the Capital Improvement Program, or it is a project mandated immediately by state or federal requirements.
C. When the project’s useful life, or the projected service life of the equipment, will be equal to or exceed the term of the financing.
D. When there are designated revenues sufficient to service the debt, whether from project revenues, other specified and reserved resources, or infrastructure cost sharing revenues.
The following criteria will be used to evaluate funding options for capital improvements:
A. Factors that favor pay-as-you-go:
1. Current revenues and adequate fund balances are available.
2. Project phasing is feasible.
3. Debt levels would adversely affect the City’s credit rating.
4. Financial market conditions are unstable or present difficulties in marketing the sale of long-term financing investments.
B. Factors that favor long-term financing:
1. Revenues available for debt service are considered sufficient and reliable so that longterm financing can be marketed with the highest possible credit rating.
2. The project for which financing is being considered is of the type that will allow the City to maintain the highest possible credit rating.
3. Market conditions present favorable interest rates and demand for municipal financings.
243
CITY OF SUFFOLK, VIRGINIA FINANCIAL POLICIES
4. A project is mandated by state or federal requirements and current revenues and fund balances are insufficient to pay project costs.
5. A project is immediately required to meet or relieve capacity needs.
There are many different types of long-term debt instruments available. Depending on the specific circumstances, the City will consider using the following types of financing instruments:
• General Obligation Bonds
• General Obligation Bonds sold to Virginia Public School Authority for School Capital Projects
• Revenue Bonds
• Certificates of Participation
• Lease Revenue Bonds
• Selected State Pooled-Borrowing Programs for Utility Revenue Bonds, Including Those of the Virginia Resources Authority.
5.09 Bond Structure
The City shall establish all terms and conditions relating to the issuance of bonds, and will invest all bond proceeds pursuant to the terms of the City’s Investment Policy. Unless otherwise authorized by the City, the following shall serve as bond requirements:
1. Term. All capital improvements financed through the issuance of debt will be financed for a period not to exceed the useful life of the improvements, but in no event will the term exceed thirty (30) years.
2. Capitalized Interest. From time to time certain financings may require the use of capitalized interest from the issuance date until the City has beneficial use and/or occupancy of the financed project. Interest shall not be funded (capitalized) beyond three years or a shorter period if further restricted by law. Interest earnings may, at the City’s discretion, be applied to extend the term of capitalized interest but in no event beyond the term allowed by law.
3. Debt Service Structure. Debt issuance shall be planned to achieve relatively equal payment of principal (declining debt service) while matching debt service to the useful life of facilities. The City shall avoid the use of bullet or balloon maturities except in those instances where these maturities serve to make existing overall debt service level. The City may elect a less rapid or other debt service structure, such as level debt service at its discretion.
4. Call Provisions. In general, the City’s debt will include an early redemption (or “call”) feature, which is no later than 10 years from the date of delivery of the bonds. The City will avoid the sale of non-callable bonds absent careful, documented evaluation by the City in conjunction with its financial advisor with respect to the value of the call option.
5. Original Issue Discount. An original issue discount will be permitted if the City determines that such discount results in a lower true interest cost on the bonds and that the use of an original issue discount will not adversely affect the project funding.
6. Deep Discount Bonds. Deep discount bonds may provide a lower cost of borrowing in certain markets. The City will carefully consider their value and effect on any future
244
refinancings as a result of the lower-than-market coupon associated with deep discount bonds.
7. Derivative Structures. Alternative, non-traditional financing structures such as derivatives are becoming more common in the municipal market. Structured properly, these products frequently provide a means for the City to achieve its goals in a cost effective manner.
The City will consider the use of derivatives as a hedge against future interest rate risk or to create “synthetic” fixed rate or variable rate debt, when appropriate. The City will not use derivative structures for speculative or investment purposes. The City will consider the use of derivative structures when it is able to gain a comparative borrowing advantage, and is able to quantify and understand potential risks. Prior to the use of such structures, the City will consider the adoption of a comprehensive Swap and Derivative Management Plan that is consistent and does not conflict in principle with this governing policy. Prior to use of a derivative structure, the City will provide written communication to City Council describing potential risks associated with each proposed derivative structure.
5.10 Variable Rate Debt
To maintain a predictable debt service burden, the City may give preference to debt that carries a fixed interest rate. The City, however, may consider variable rate debt. The percentage of variable rate debt outstanding (excluding debt which has been converted to synthetic fixed rate debt) shall not exceed 20% of the City’s total outstanding debt and will take into consideration the amount and investment strategy of the City’s operating cash. The City will consider issuing variable rate debt to:
a) Match Asset and Liabilities: By issuing variable rate debt the City matches variable interest rates to its short-term investment assets.
b) Potentially Lower Debt Service Costs: Historically variable interest rates are less than fixed rate cost of capital.
c) Add Flexibility and Diversity to the City’s Debt Structure: Variable rate bonds are traditionally callable every 30 days and can generally be refunded on a fixed rate basis to take advantage of low fixed rates and open up variable rate capacity for higher rate environments.
In determining its use of variable rate debt, the City will utilize an analysis from the City’s Financial Advisor evaluating and quantifying the risks and returns involved in the variable rate financing.
5.11 Refinanced Outstanding Debt
The Director of Finance with assistance from the City’s Financial Advisor will have the responsibility to analyze outstanding bond issues for refunding opportunities. The City will consider the following issues when analyzing possible refunding opportunities:
1. Refunding Policy. The City establishes a minimum aggregate present value savings threshold of 3% of the refunding bond principal amount. The present value savings will be
CITY OF SUFFOLK, VIRGINIA FINANCIAL POLICIES
245
CITY OF SUFFOLK, VIRGINIA FINANCIAL POLICIES
net of all costs related to the refinancing. Debt service savings may be taken in equal amounts over time or on an upfront or deferred basis, at the City’s discretion.
2. Restructuring. The City will refund debt when it is in the best financial interest of the City to do so. Such refundings will be limited to restructuring to meet unanticipated revenue expectations, achieve costs savings, mitigate irregular debt service payments release reserve funds or remove unduly restrictive bond covenants.
3. Term of Refunding Issues. The City will refund bonds within the term of the originally issued debt. However, the City may consider maturity extension, when necessary to achieve a desired outcome, provided that such extension is legally permissible. The City may also consider shortening the term of the originally issued debt to realize greater savings. The remaining useful life of the financed facility and the concept of inter-generational equity should guide this decision.
4. Escrow Structuring. The City shall utilize the least costly securities available in structuring refunding escrows. A certificate will be provided by a third party agent stating that the securities were procured through an arms-length, competitive bid process (in the case of open market securities), and that the price paid for the securities was reasonable within Federal guidelines. Under no circumstances shall an underwriter, agent or financial advisor sell escrow securities to the City from its own account.
5. Arbitrage. The City shall take all necessary steps to optimize escrows and to avoid negative arbitrage in its refundings. Any resulting positive arbitrage will be rebated as necessary according to Federal guidelines.
5.12 Methods of Issuance
The City will determine the method of issuance on a case-by-case basis.
1. Competitive Sale. In a competitive sale, the City’s bonds shall be awarded to the bidder providing the lowest true interest cost as long as the bid adheres to the requirements set forth in the official note of sale.
2. Negotiated Sale. The City recognizes that some securities are best sold through negotiation. In its consideration of a negotiated sale, the City shall assess the following circumstances:
a. Bonds issued as variable rate demand obligations
b. A structure which may require a strong pre-marketing effort such as a complex transaction or a “story” bond
c. Size of the issue which may limit the number of potential bidders
d. Market volatility is such that the City would be better served by flexibility in timing a sale in a changing interest rate environment
3. Private Placement. From time to time the City may elect to privately place its debt. Such placement shall be considered if other methods are not viable.
246
CITY OF SUFFOLK, VIRGINIA FINANCIAL POLICIES
5.13 Bond Insurance
The City may purchase bond insurance when such purchase is deemed prudent and advantageous. Use of bond insurance shall be based on such insurance being less costly than the present value of the difference between the interest on insured bonds versus uninsured bonds.
In the case of a competitive sale, the City may permit bidders for its bonds to purchase bond insurance if such insurance will enhance the market reception and lower the interest rate on the City’s bonds. The City will submit an application for pre-qualification for insurance to facilitate bidders’ ability to purchase bond insurance. The winning bidder in a competitive sale will bear any associated cost with such enhancement.
In the instance of a negotiated sale, the City will solicit quotes for bond insurance from interested providers. The City will select a provider whose bid is most cost effective and whose terms and conditions governing the guarantee are satisfactory to the City.
5.14 Use of Special Districts
The City may consider using special districts such as Tax Increment Financing Districts, Community Development Authorities and special taxing districts to finance projects that:
• Strengthen the employment and economic base of the City;
• Increase property values and tax revenues;
• Reduce poverty;
• Create economic stability;
• Facilitate economic self-sufficiency; or
• Assist in implementing the City’s economic development strategies.
Before using such districts, the City will consider the fiscal impact, the market feasibility and credit implications of the project or district.
5.15 Debt Service Reserves
If necessary, the City may establish a reserve fund funded from bond proceeds, subject to federal tax regulations and in accordance with the requirements of credit enhancement providers and/or rating agencies. The City may purchase reserve equivalents (i.e., a reserve fund surety or letter of credit) when such purchase is deemed prudent and advantageous. Such equivalents shall be evaluated in comparison to cash funding of reserves on a net present value basis.
5.16 Underwriter Selection
Senior Manager Selection. The City shall select a senior manager for any proposed negotiated sales. The selection criteria shall include but not be limited to the following:
• The firm’s ability and experience in managing transactions similar to that contemplated by the City
247
CITY OF SUFFOLK, VIRGINIA FINANCIAL POLICIES
• Prior knowledge and experience with the City
• The firm’s ability and willingness to risk capital and demonstration of such risk and capital availability
• Quality and experience of personnel assigned to the City’s engagement
• Financing plan presented
• Underwriting fees
Co-Manager Selection. Co-managers may be selected on the same basis as the senior manager. In addition to their qualifications, co-managers appointed to specific transactions will be a function of transaction size and the necessity to ensure maximum distribution of the City’s bonds.
Selling Groups. The City may establish selling groups in certain transactions. To the extent that selling groups are used, the Director of Finance at his or her discretion, may make appointments to selling groups from within the pool of underwriters or from outside the pool, as the transaction dictates.
Underwriter’s Counsel. In any negotiated sale of City debt in which legal counsel is required to represent the underwriter, the appointment will be made by the Senior Manager with input from the City.
Underwriter’s Discount. The Director of Finance with assistance from the City’s financial advisor will evaluate the proposed underwriter’s discount against comparable issues in the market. If there are multiple underwriters in the transaction, the Director of Finance will determine the allocation of underwriting liability and management fees.
The allocation of fees will be determined prior to the sale date; a cap on management fee, expenses and underwriter’s counsel will be established and communicated to all parties by the Director of Finance. The senior manager shall submit an itemized list of expenses charged to members of the underwriting group. Any additional expenses must be substantiated.
Evaluation of Underwriter Performance. The City will evaluate each bond sale after completion to assess the following: costs of issuance including underwriters’ compensation, pricing of the bonds in terms of the overall interest cost and on a maturity-by-maturity basis, and the distribution of bonds and sales credits.
Following each sale, the Director of Finance shall provide a report to the City Manager and City Council on the results of the sale.
Syndicate Policies. For each negotiated transaction, the Director of Finance will prepare syndicate policies that will describe the designation policies governing the upcoming sale. The Director of Finance shall ensure receipt of each member’s acknowledgement of the syndicate policies for the upcoming sale prior to the sale date.
Designation Policies. To encourage the pre-marketing efforts of each member of the underwriting team, orders for the City’s bonds will be net designated, unless otherwise expressly stated. The City shall require the senior manager to:
248
CITY OF SUFFOLK, VIRGINIA FINANCIAL POLICIES
• Equitably allocate bonds to other managers and the selling group
• Comply with MSRB regulations governing the priority of orders and allocations
• Within 10 working days after the sale date, submit to the Director of Finance a detail of orders, allocations and other relevant information pertaining to the City’s sale.
5.17 Consultants
Financial Advisor. The City shall select a financial advisor (or advisors) to assist in its debt issuance and debt administration processes. Selection of the City’s financial advisor(s) shall be based on, but not limited to, the following criteria:
• Experience in providing consulting services to entities similar to the City
• Knowledge and experience in structuring and analyzing bond issues
• Experience and reputation of assigned personnel
• Fees and expenses
Conflicts of Interest. The City requires that its consultants and advisors provide objective advice and analysis, maintain the confidentiality of City financial plans, and be free from any conflicts of interest.
Bond Counsel. City debt will include a written opinion by legal counsel affirming that the City is authorized to issue the proposed debt, that the City has met all legal requirements necessary for issuance and a determination of the proposed debt’s federal income tax status. The approving opinion and other documents relating to the issuance of debt will be prepared by counsel with extensive experience in public finance and tax issues. The Bond Counsel will be selected by the City.
Disclosure by Financing Team Members. All financing team members will be required to provide full and complete disclosure, relative to agreements with other financing team members and outside parties. The extent of disclosure may vary depending on the nature of the transaction. However, in general terms, no agreements shall be permitted which could compromise the firm’s ability to provide independent advice which is solely in the City’s best interests or which could reasonably be perceived as a conflict of interest.
5.18 City Financial Disclosure
The City is committed to full and complete financial disclosure, and to cooperating fully with rating agencies, institutional and individual investors, City departments, and the general public to share clear, comprehensive, and accurate financial information. The City is committed to meeting secondary market disclosure requirements on a timely and comprehensive basis.
249
CITY OF SUFFOLK, VIRGINIA FINANCIAL POLICIES
UTILITY FUND
It is the intent to reflect the financial policies of the Utility Fund to provide for adequate cash management and bond coverage for the operation of the system.
6.01 Independence
The Utility Fund will maintain financial independence from the General Fund by:
a. Continuing the funding of all Utility Enterprise Fund revenue requirements from the Utility Enterprise Fund, thereby receiving no financial support from the General Fund.
b. Issuing self-supporting debt payable solely from the Utility Enterprise Fund.
6.02 Unrestricted Cash and Long Term Investments Balance
It is the intent of the Utility Enterprise Fund to have adequate cash reserves to provide for ninety days of operating activity including debt service. Current unrestricted cash and cash equivalent balances plus operating long term investments will be at a target percentage rate of 25% of the operating expenses less depreciation expense plus current debt expenses (principal and interest). If the Unrestricted Cash and Long Term Investments Balance fall below the target level, the utility system will have twenty four months to bring the balance back in line with the target level.
6.03 Amortization
The Utility Fund will continue to amortize bond issues so the useful life of the project being financed is not exceeded.
6.04 Debt Service Coverage Ratio
Net Revenues should be at least 1.15 times the annual debt service requirement. Net Revenues shall be defined as operating revenues plus availability charges plus interest income plus contributions from Western Tidewater Water Authority less operating expenses plus depreciation and amortization. Excess revenues will be available to first build and maintain the Utility enterprise Cash and Cash Equivalents plus Long Term Investments then secondly to provide equity funding for future capital projects. Over time adherence to this policy will reduce the overall amount of debt issued by the City for various utility projects.
6.05 Asset Replacement and System Extension
After the completion of the City’s new water treatment facility (estimated completion is 2015), the City will review the amount of funds being set aside for replacement and/or extension of all Utility system assets such that new assets will not be 100 percent debt financed.
250
GLOSSARY
Arbitrage. The difference between the interest paid on the tax-exempt securities and the interest earned by investing the security proceeds in higher- yielding taxable securities. IRS regulations govern arbitrage on the proceeds from issuance of municipal securities.
Balloon Maturity. A later maturity within an issue of bonds which contains a disproportionately large percentage of the principal amount of the original issue.
Bond Anticipation Notes (BANs). Notes which are paid from the proceeds of the issuance of longterm bonds. Typically issued for capital projects.
Bullet Maturity. A maturity for which there are no principal and/or sinking fund payments prior to the state maturity date.
Call Provisions. The terms of the bond giving the issuer the right to redeem all or a portion of a bond prior to its stated date of maturity at a specific price, usually at or above par.
Capitalized Interest. A portion of the proceeds of a bond issue which is set aside to pay interest on the same bond issue for a specific period of time. Interest is commonly capitalized for the construction period of the project.
Commercial Paper. Very short-term, unsecured promissory notes issued in either registered or bearer form, and usually backed by a line of credit with a bank.
Community Development Authority (CDA). A Community Development Authority (CDA) is a separate authority that may be used to foster growth and development in a special taxing district. A CDA can issue debt for public purpose infrastructure paid for with tax revenues generated within the special taxing district. Public purpose infrastructure includes, but is not limited to: Roads, bridges, sidewalks, traffic signals, Parking facilities; Storm water management systems; Parks and recreational facilities; Fire Stations and equipment; and Schools and related structures. Generally, a CDA can be formed by City Council at the request of 51% or more of the landowners within the proposed district. Under state law, the District’s special tax rate cannot exceed $0.25 per $100 of assessed value.
Competitive Sale. A sale/auction of securities by an issuer in which underwriters or syndicates of underwriters submit sealed bids to purchase the securities. Contrast to a negotiated sale.
Continuing Disclosure. The principle that accurate and complete information material to the transaction which potential investors would be likely to consider material in making investment decisions with respect to the securities be made available on an ongoing basis.
Credit Enhancement. Credit support purchased by the issuer to raise the credit rating of the issue. The most common credit enhancements consist of bond issuance, direct or standby letters of credit, and lines of credit.
CITY OF SUFFOLK, VIRGINIA FINANCIAL POLICIES
251
CITY OF SUFFOLK, VIRGINIA FINANCIAL POLICIES
Debt Service Reserve Fund. The fund in which moneys are placed which may be used to pay debt service if pledged revenues are insufficient to satisfy the debt service requirements.
Deep Discount Bonds. Bonds which are priced for sale at a substantial discount from their face or par value.
Derivatives. A financial product whose value is derived from some underlying asset value.
Designation Policies. Outline how an investor’s order is filled when a maturity is oversubscribed when there is an underwriting syndicate. The senior managing underwriter and issuer decide how the bonds will be allocated among the syndicate. There are three primary classifications of order which form the designation policy: Group Net orders; Net Designated orders and Member orders.
Escrow. A fund established to hold moneys pledged and to be used to pay debt service on an outstanding issue.
Expenses. Compensates senior managers for out-of-pocket expenses including: underwriters counsel, DTC charges, travel, syndicate expenses, dealer fees, overtime expenses, communication expenses, computer time and postage.
General Obligations. Bonds issued by the City secured by the City’s pledge of its full faith and credit and unlimited taxing power.
Hedge. A transaction that reduces the interest rate risk of an underlying security.
Intergenerational Equity. Equity or fairness principal that those that benefit from a capital improvement should pay for it.
Interest Rate Swap. The exchange of a fixed interest rate and a floating interest rate between counterparties.
Letters of Credit. A bank credit facility wherein the bank agrees to lend a specified amount of funds for a limited term.
Management Fee. The fixed percentage of the gross spread which is paid to the managing underwriter for the structuring phase of a transaction.
Members. Underwriters in a syndicate other than the senior underwriter.
Negotiated Sale. A method of sale in which the issuer chooses one underwriter to negotiate terms pursuant to which such underwriter will purchase and market the bonds.
Original Issue Discount. The amount by which the original par amount of an issue exceeds its public offering price at the time it is originally offered to an investor.
Pay-As-You-Go. An issuer elects to finance a project with existing cash flow as opposed to issuing debt obligations.
252
CITY OF SUFFOLK, VIRGINIA FINANCIAL POLICIES
Present Value. The current value of a future cash flow.
Private Placement. The original placement of an issue with one or more investors as opposed to being publicly offered or sold.
Rebate. A requirement imposed by Tax Reform Act of 1986 whereby the issuer of tax-exempt bonds must pay the IRS an amount equal to its profit earned from investment of tax-exempt bond proceeds at rates exceeding the tax-exempt borrowing rate. The tax-exempt borrowing rate (or “bond yield”) is calculated pursuant to the IRS code together with all income earned on the accumulated profit pending payment.
Revenue (Limited Liability) Bonds. Bonds issued by the City secured by a specific revenue pledge of rates, rents or fees.
Selling Groups. The group of securities dealers who participate in an offering not as underwriters but rather who receive securities less the selling concession from the managing underwriter for distribution at the public offering price.
Syndicate Policies. The contractual obligations placed on the underwriting group relating to distribution, price limitations and market transactions.
Tax Increment Financing District (TIF). A Tax Increment Financing District (TIF) district is a public financing technique primarily used to foster economic development projects. Upon creation of a TIF district, a base year and base assessment is established and over time incremental increases in the TIF district’s real estate assessments and associated real estate tax revenues accrue to the TIF district and may be used to pay debt service.
Underwriter. A dealer that purchases new issues of municipal securities from the Issuer and resells them to investors.
Underwriter’s Discount. The difference between the price at which bonds are bought by the Underwriter from the Issuer and the price at which they are reoffered to investors.
Variable Rate Debt. An interest rate on a security which changes at intervals according to an index or a formula or other standard of measurement as stated in the bond contract.
253
THIS PAGE INTENTIONALLY BLANK
254
ORDINANCE NUMBER
AN ORDINANCE APPROVING THE CITY BUDGET AND APPROPRIATING FUNDS FOR EXPENDITURES CONTEMPLATED DURING THE FISCAL YEAR BEGINNING JULY 1, 2024, AND ENDING JUNE 30, 2025, AND REGULATING THE PAYMENT OF MONEY OUT OF THE CITY TREASURY
BE IT ORDAINED by the Council of the City of Suffolk, Virginia as follows:
Section 1: Except as provided in Section 2 of this ordinance, the City of Suffolk, Virginia, Proposed Annual Operating Budget, Fiscal Year 2024-2025, dated April 3, 2024, and submitted by the City Manager, is approved as the City budget for the fiscal year beginning July 1, 2024, and ending June 30, 2025.
Section 2: The City Budget shall be subject to transfers authorized by law and to such further amendments by ordinance as the City Council may deem appropriate.
Section 3: The amount named in the Proposed Annual Operating Budget for the fiscal year beginning July 1, 2024, and ending June 30, 2025, in the following fund amounts totaling $882,100,325 is hereby appropriated from the revenues of the City for use by the various funds of the City Government referenced in said budget for the said fiscal year. Any appropriation to a specific fund but identified as a revenue source in another fund is specifically designated and restricted for accounting and transfer purposes only and not for any other expenditure from the source fund.
Fund 2024-2025 General Fund $ 324,213,302 Capital Projects Fund 83,514,269 Aviation Facilities Fund 1,136,650 Transit System Fund 3,189,830 Downtown Business Overlay District 228,443 Law Library Fund 0 Route 17 Special Taxing District 2,675,020 Road Maintenance Fund 36,732,494 Debt Service Fund 34,228,465 Utility Fund 71,778,919 Stormwater Fund 9,633,418 Refuse Services Fund 13,582,526 Grants Fund 800,000 Fleet Management Fund 17,347,316 Information Technology Fund 17,118,453 Risk Management Fund 23,191,500 School Fund 242,729,720 Total Funds Budget $ 882,100,325 255
Section 4: All payments from funds shall be made in accordance with general law and with the Charter, Code, and applicable ordinances and resolutions of the City, except as otherwise specifically provided herein; provided, however, that payments from the funds appropriated for the support, maintenance, and operation of the public free schools of the City shall be made by the City Treasurer upon warrants drawn by the proper officer or officers of the School Board of the City; and provided further that payments from the funds appropriated for expenditures of the Department of Social Services shall be made by the City Treasurer upon presentation of warrants drawn by the Social Services Director and approved by the local Board of Public Welfare.
Section 5: The City Council hereby authorizes the issuance and sale of the City's revenue anticipation note or notes (the "Note" or "Notes"), pursuant to Section 15.2-2629 of the Code of Virginia of 1950, as amended (the "Virginia Code"), in the aggregate principal amount of up to $25,000,000 in anticipation of the collection of the taxes and revenues of the City for the fiscal year ending June 30, 2024. If either the City Manager or City Treasurer deems that the cash flow needs and the financial condition of the City warrant the issuance of a Note or Notes, the City Manager or the City Treasurer (each hereinafter referred to as the "City Representative") is authorized and directed to accept a proposal or proposals for the purchase of the Note or Notes and to approve the terms of the Note or Notes, provided that the aggregate principal amount of the Notes shall not exceed $25,000,000, none of the Notes shall mature later than June 30, 2025, and no interest rate on any of the Notes shall exceed 7%. The City Representative is hereby authorized and directed to execute an appropriate negotiable Note or Notes and the Clerk of the City Council (the “Clerk”) to affix the seal of the City thereto, and such City Representative is authorized and directed to deliver the Note or Notes to the purchaser thereof. The City Representative, and such officers and agents of the City as the City Representative may designate, are hereby authorized and directed to take such further action as they deem necessary regarding the issuance and sale of the Note or Notes and all actions taken by such officers and agents in connection with the issuance and sale of the Note or Notes, are ratified and confirmed. In accordance with Section 15.2-2601 of the Virginia Code, the City Council elects to issue the Notes pursuant to the provisions of the Public Finance Act of 1991, Chapter 26, Title 15.2 of the Virginia Code.
Section 6: The amounts appropriated by this ordinance shall be expended for the purpose of operating the City government and the public free school s ystem during the 20242025 Fiscal Year; and, with the exception of the items the payment of which is fixed by law, shall be expended in such proportions as may be authorized by the City Manager from time to time; provided, however, that the funds appropriated for the support, maintenance, and operation of the public free schools of the City shall be subject to the exclusive control of the School Board of the City, and the School Board may transfer, in its discretion, funds from one category to another, so long as no such transfer results in an expenditure of an amount in excess of the total amount appropriated.
256
Section 7: All outstanding encumbrances, by contract or fully executed purchase order, as of June 30, 2024, shall be offset by an equal amount of assigned Fund Balance for expenditure in the subsequent fiscal year; provided, however, that if performance of a contract or purchase order has been substantially completed, an expenditure and estimated liability shall be recorded in lieu of an encumbrance. All appropriations standing on the books of the City at the close of business for the fiscal year ending June 30, 2024, to the extent that they have not been expended or lawfully obligated or encumbered, shall lapse upon the effective date of this ordinance.
Any unexpended balances on June 30, 2024, in the designated General Fund Four for Life-EMS Support, Fire Programs Fund Expense, Police E-Ticketing Fee, Police Asset Forfeiture, Police Property Seizure, Police DARE, Commonwealth Attorney Asset Forfeiture State, Economic Development Investment Program, and Employee Vending Proceeds Accounts shall be carried forward and be available for expenditure in the succeeding fiscal year.
Any unexpended balances for capital projects appropriated in the Capital Projects Fund on June 30, 2024, shall be carried forward and be available for expenditure in the succeeding fiscal year.
Any unexpended balances for capital projects appropriated in the Information Technology Fund as of June 30, 2024, shall be carried forward and be available for expenditures in the succeeding year.
Any unexpended balances for capital projects appropriated in the Stormwater Fund as of June 30, 2024, shall be carried forward and be available for expenditures in the succeeding year.
Any unexpended balances for capital projects appropriated in the Public Utilities Fund as of June 30, 2024, shall be carried forward and be available for expenditures in the succeeding year.
Any unexpended balances appropriated in the Consolidated Grants Fund as of June 30, 2024, shall be carried forward and be available for expenditures in the succeeding fiscal year unless the time period for allowable grant expenses ends on or prior to June 30, 2024.
Section 8: The payment and settlement of any claim of any kind against the City during the 2024-2025 Fiscal Year, and final judgements, with interest and costs, obtained against the City during the 2023-2024 Fiscal Year, shall be paid upon the certification of the City Attorney and the order of the City Manager from funds appropriated to the Risk Management Fund; or from the funds appropriated for the expenditures of the Fund involved in the subject matter of the claim or judgment as the City Manager shall find necessary.
Section 9: Except as otherwise specifically required by law or approved by City Council by resolution: (1) Any salary or wage expenditure, and any expenditure of any kind or description having the effect of a salary or wage payment, shall be made only for service as described in Chapter 66 of the Code of the City of Suffolk in a position the description of which is identified in the City Pay and Compensation Plan or which
257
has received prior approval of City Council; (2) Any other expenditure shall be calculated to result in total expenditures within the plan stated in a specific City Budget account, except that transfers of unexpended and unencumbered balances or portions thereof, initiated by a department director and approved by the City Manager, are permitted between accounts.
Section 10: The City Manager is authorized and directed to do all lawful things necessary to implement and administer the City Budget for Fiscal Year 2024-2025.
Section 11: All ordinances and resolutions, or parts thereof, including but not limited to those dealing with salaries and wages, in conflict with the provisions of this ordinance, to the extent of such conflict are repealed.
Section 12: This ordinance shall be in effect on and after July 1, 2024, and it shall not be published.
READ AND PASSED: _____________________
TESTE: ____________________________________
Erika S. Dawley, City Clerk
Approved as to Form:
William E. Hutchings, Jr., City Attorney258
AN ORDINANCE LEVYING REAL PROPERTY TAXES FOR THE TAX YEAR BEGINNING JULY 1, 2024, AND ENDING JUNE 30, 2025, FOLLOWING THE APRIL 17, 2024, AND MAY 1, 2024 PUBLIC HEARINGS ADOPTING A 2.86% INCREASE IN THE CITYWIDE ASSESSMENT
BE IT ORDAINED by the Council of the City of Suffolk, Virginia, as follows:
Section 1: (a) A tax for the 2024-2025 Tax Year is levied and the rate fixed at $1.09 per $100 of assessed valuation of all taxable real property in the City. In accordance with State Code Section 58.1-3321 relative to the annual reassessment of real property and State Code Section 58.1-3007 relative to local tax levy, public hearings regarding the proposed real property tax increase of 1% or more due to reassessment for fiscal year 2024-2025 were held on April 17, 2024, and on May 1, 2024.
(b) A special service district tax, in addition to those taxes levied in paragraph (a) herein, for the 2024-2025 Tax Year, is levied and the additional rate set at $.24 per $100 of assessed valuation of taxable real property in the Route 17 Special Taxing District.
(c) A special service district tax, in addition to those taxes levied in paragraph (a) herein, for the 2024-2025 Tax Year, is levied and the additional rate set at $.105 per $100 of assessed valuation of taxable real property in the Downtown Business Overlay Taxing District
Section 2: The total tax levy rates of $1.33 per $100 of assessed valuation in the Route 17 Special Taxing District, $1.195 per $100 of assessed valuation in the Downtown Business Overlay Taxing District and $1.09 per $100 of assessed valuation on the City Wide District shall be accounted for as follows: Route 17
Section 3: This ordinance shall be effective for the 2024-2025 Tax Year, all prior actions setting the real estate tax rate to the contrary notwithstanding.
ORDINANCE NUMBER ___________
Rate per $100 Rate per $100 Rate per $100 General Fund $1.09 $1.09 $1.09 Taxing DistrictOperations and .00 .24 .105 Debt Total $1.09 $1.33 $1.195
Downtown Business City Wide Taxing District Overlay Taxing District
259
Section 4: This ordinance shall be effective on its passage and shall not be published.
READ AND PASSED: ____________________
TESTE: ___________________________________
Erika S. Dawley, City Clerk
Approved as to Form: ________________________________
William E. Hutchings, Jr., City Attorney
260
ORDINANCE NUMBER
AN ORDINANCE TO LEVY TAXES ON ALL TANGIBLE PERSONAL PROPERTY NOT EITHER EXEMPT FROM TAXATION OR OTHERWISE TAXED FOR THE 2024 AND 2025 TAX YEARS
BE IT ORDAINED by the Council of the City of Suffolk, Virginia:
Section 1: A tax levy for the tax years beginning January 1, 2024, and January 1, 2025, is fixed at $4.25 per $100 of assessed value on all tangible personal property as classified in Virginia Code Sections 58.1-3503, 58.1-3505, and subsections 6, 8, 11, 13, 14, 15, 16, 17, 19, 20, 22, 23, 24, 26, 27, 31, 32, 33, 34, 37, 38, 39, 40, 41, 42, 43, 44, 45, 46, and 48 of Virginia Code Section 58.1-3506(A), unless otherwise exempt from taxation or otherwise taxed.
Section 2: A tax levy for the tax years beginning January 1, 2024, and January 1, 2025, is fixed at $3.15 per $100 of assessed value on all machinery and tools as classified in Virginia Code Section 58.1-3507, subsections 7, 9, 21 and 25 of Virginia Code Section 58.1-3506(A), Virginia Code Sections 58.1-3508, 58.1-3508.1, 58.13508.2, 58.1-3508.3, 58.1-3508.4, 58.1-3508.5, and 58.1-3508.6, unless otherwise exempt from taxation or otherwise taxed.
Section 3: A tax levy for the tax years beginning January 1, 2024, and January 1, 2025, is fixed at $1.50 per $100 of assessed value on all boats and recreational vehicles, as classified by Virginia Code Section 58.1-3506(A) 1.a., 1.b., 12, 18, 28, 29, 30, 35 and 36 and 47.
Section 4: A tax levy for the tax years beginning January 1, 2024, and January 1, 2025, is fixed at $0.58 per $100 of assessed value on all airplanes, as classified by Virginia Code Section 58.1-3506(A) 2, 3, 4 and 5.
Section 5: A tax levy for the tax years beginning January 1, 2024, and January 1, 2025, is fixed at a basic rate of $1.09 per $100 of assessed value; at $1.33 per $100 of assessed value in the Route 17 Taxing District; and at $1.195 per $100 of assessed value in the Downtown Business Overlay Taxing District on all mobile homes, as classified by Virginia Code Section 58.1-3506 (A) 10.
Section 6: Certain farm animals, certain grains, agricultural products, farm machinery, farm implements and equipment as classified by Virginia Code Section 58.1-3505 A.1 through A.7, A.9, and A.10 shall be exempt from personal property taxation as provided for by Virginia Code Section 58.1-3505 (B).
Section 7: That State Code references in Sections 1 – 6 of this ordinance shall be taken to refer to the equivalent provisions in any 2024 amendments by the General Assembly made prior to the effective date of this ordinance
261
Section 8: This ordinance shall be effective on its passage for the 2024 and 2025 tax years and shall not be published.
READ AND PASSED: _______________
TESTE: ______________________________
Erika S. Dawley, City Clerk
Approved as to Form: ________________________________
William E. Hutchings, Jr., City Attorney
262
AN ORDINANCE ADOPTING A FEE SCHEDULE FOR THE CITY OF SUFFOLK
BE IT ORDAINED by the Council of the City of Suffolk, Virginia:
Section 1: That the Fee Schedule for the City of Suffolk, as attached hereto and incorporated herein by reference, is hereby approved, as provided in City Code Sections 2-587(a), 6-111(b), 6-238, 6-302(a), 6-338, 6392(a), 10-37(c), 10-41(b), 10-66, 10-73, 10-152, 10-183, 10-259, 10-261(b), 18-58(a), 18-137, 18-192(a), 18248, 30-53(b), 30-55(b), 30-83(e)(7)and(f), 30-85(b), 30-86(a), 30-87(a)(3),(h)(2),and(i)(6)(b)and(l), 3088(a)and(d), 30-90(a),(c)and(d)(1)and(2),(f),(g),(h)and(j), 30-93(b), 30-94(c)(1), 30-95(a)(1), 30-96(d), 31-111, Appendix B(B-1(b)) of the Unified Development Ordinance, 34-36, 34-322(b), 34-362(a), 34-365, 35-32, 38144(a)(2), 46-1(b)(1), 54-121(d), 54-123(b), 62-33(b), 62-111(e), 62-112(d), 62-113(a), 62-166, 74-36, 74-111, 74-288, 74-296, 74-332, 82-36(b), 82-72(a),(c)and(d), 82-481(d), 82-482(d), 82-681(a)and(b), 82-741, 82-742, 82-743, 82-828, 86-205(b), 86-235(b), 86-312, 86-355, 86-362, 86-462, 90-75(a), 90-102(a)(2)and(b), 90-103, 90-128(a),(b)and(c), 90-129, 90-131(2), 90-135, 90-164, 90-212(d)(2)(a)and(d)(4)(b), 90-214(a), 90-258, 90349(1)and(2), 90-356(a),(b)and(c), 90-357, 90-426, 90-451, 90-520(h), 94-64, 94-98, and 94-130.
Section 2: This ordinance shall be effective on and after July 1, 2024, and thereafter and shall not be published.
READ AND PASSED: ____________________
TESTE: ____________________________________
Erika S. Dawley, City Clerk
Approved as to Form:
William E. Hutchings, Jr., City Attorney
ORDINANCE NUMBER __________
_______________________________
263
CITY OF SUFFOLK FEE SCHEDULE FISCAL YEAR 2024-2025 Fees Fiscal Year 2023-2024 Fiscal Year 2024-2025 AIRPORT Multi Engine T-Hanger (monthly)* 319.00 319.00 Single Engine T-Hanger (monthly)* 249.00 249.00 Large T-Hanger Storage Room (monthly)* 95.00 95.00 Small T-Hanger Storage Room (monthly)* 75.00 75.00 Overnight T-Hanger 35.00 35.00 Overnight Tie Down (waived with fuel fill up) 10.00 10.00 Monthly Single Engine Tie Down* 25.00 25.00 Monthly Multi Engine Tie Down* 25.00 25.00 Jet Starter Service (per hour) 25.00 25.00 Service After Normal Business Hours (call in)* 100.00 100.00 Airport Use Fees 250.00/Day 250.00/Day Outside Storage Fee $2,500.00/mo. $2,500.00/mo. Mark-up on Fuel Sales ** Average for all prices 35% (projected) Average for all prices 35% (projected) Tow Tug 35.00 35.00
Prices
Fluctuates
ASSESSOR Copies (KB System) .25 black & white; .45 color per copy .25 black & white; .45 color per copy Custom query, tape, CD-ROM (material plus programmers time) (per minute) Cost Cost Land Use Revalidation Fee 50.00 50.00 Land Use Application 50.00 50.00 Land Use Application Late Fee 100.00 100.00 Rehabilitated Structure Application Fee 50.00 50.00 CLERK OF THE CIRCUIT COURT Commonwealth's Attorney (misdemeanor) 7.50 7.50 Commonwealth's Attorney (felony) 20.00 20.00 Sheriff's Service 12.00 12.00 Transfer of Real Estate (per parcel) 1.00 1.00 City Grantee 1/3 of state 1/3 of state City Wills and Administration 1/3 of state 1/3 of state Law Library 4.00 4.00 Grantor (per $500.00 value) 0.25 0.25 Courthouse Maintenance 2.00 2.00 Jail Admission Fee 25.00 25.00 Courthouse Security Fee 20.00 20.00 Blood Test/DNA 15.00 15.00 Local Interest varies varies Local Fines varies varies Local Jury Fees $50/day/juror $50/day/juror Court Appointed Attorney Fees varies varies Miscellaneous - Local Cost (CWP) 35.00 35.00 Electronic Summons Criminal or Traffic Case 5.00 5.00 List of Heirs or Affidavit 25.00 25.00 Local Health Care Fund 25.00 25.00 Tranfer/entry fee-Real Estate - Deeds of Partition 1.75 1.75 Document Reproduction Costs 0.50 0.50 COURT SERVICES UNIT Parental contribution toward cost of local group home placement 1/2 of child support guidelines amount 1/2 of child support guidelines amount FIFTH JUDICIAL DISTRICT COMMUNITY CORRECTIONS PROGRAM Offenders referred from a court in the Fifth District (Suffolk, Franklin, Isle of Wight, and Southampton) 100.00 100.00 Offenders referred from a court within the Fifth District and can provide documentation showing SSI disability or welfare benefits 25.00 25.00 Offenders transferred out to a CCP in another jurisdiction 25.00 25.00 Offenders transferred into the Fifth District from a CCP in another jurisdiction 100.00 100.00 FINANCE Garnishment Processing Fees $10.00 one time fee per summons $10.00 one time fee per summons W-2 Reprint 0.00 5.00 Miscellaneous Bills One time penalty of 10% up to 10.00 One time penalty of 10% up to 10.00 Miscellaneous Bills Annual interest of 10% Annual interest of 10% FIRE & RESCUE On-Site Inspection Hazardous Materials Response Responsible Party Billed Responsible Party Billed Relocation of up to 20 sprinkler heads 50.00 0.00 Hood/Extinguishing Systems 50.00 0.00 Re-Inspection Fee - All systems failing initial testing shall be charged a re-testing fee. This fee shall include all "no-shows" or cancellations without a 24 hour notice 50.00 0.00 264
*
consistent with neighboring airports. **
based on market conditions
CITY OF SUFFOLK FEE SCHEDULE FISCAL YEAR 2024-2025 Fees Fiscal Year 2023-2024 Fiscal Year 2024-2025 Permits Fireworks Permit 150.00 150.00 Tent Permit 50.00 50.00 Above/below ground hazmat storage tanks installation < 499 gallons capacity 50.00 (each additional tank 25.00) 50.00 per tank Private hydrant/water line 75.00 75.00 Above/below ground hazmat storage tanks installation 500-2000 gallons capacity, removal of tanks or fill in place any capacity or storage/dispensing system 100.00 100.00 per tank Inspection and Operational Permit Fees Site Plan Engineering Plan Review 500.00 500.00 Above/below ground hazmat storage tank installation > 2,001 gallons capacity or hazmat storage/dispensing systems 200.00 200.00 per tank Reports Incident or Computer Generated Reports-Residents No Charge No Charge General Special inspection fee, after hours, weekends, holidays 40.00 per hour/per person 40.00 per hour/per person Special event stand-by 25.00 per hour/per person 25.00 per hour/per person Burn Permit (Requirements must be met) Residential No Charge No Charge Commercial 75.00 75.00 Alarm Registration 25.00 per year 25.00 per year False Alarms (within 180 days) First False Alarm No Charge unless malicious act No Charge unless malicious act Second False Alarm 50.00 50.00 Third False Alarm 100.00 100.00 Additional False Alarms 200.00 200.00 Emergency Medical Services Basic Life Support (BLS) 425.00 425.00 Advanced Life Support Level I (ALS I) 675.00 675.00 Advanced Life Support Level II (ALS II) 825.00 825.00 Loaded Patient Mileage (LPM) 10.00 per mile 10.00 per mile Apparatus Use Fee Ambulance 30.00 per hour 30.00 per hour Command Unit 30.00 per hour 30.00 per hour Brush Truck 30.00 per hour 30.00 per hour Tanker 75.00 per hour 75.00 per hour Engine 75.00 per hour 75.00 per hour Ladder 125.00 per hour 125.00 per hour Rescue 125.00 per hour 125.00 per hour Rehab 50.00 per hour, plus supplies used 50.00 per hour, plus supplies used Emergency Communication Unit 75.00 per hour 75.00 per hour Personnel Firefighter 25.00 per hour/per person 25.00 per hour/per person Firefighter/Medic 30.00 per hour/per person 30.00 per hour/per person Officers (Captains and Lieutenants) 35.00 per hour/per person 35.00 per hour/per person Command Chiefs 45.00 per hour/per person 45.00 per hour/per person GENERAL Annual Operating Budget Cost for reproducing Cost for reproducing Capital Improvement Program and Plan Cost for reproducing Cost for reproducing Annual Comprehensive Financial Report Cost for reproducing Cost for reproducing Copies (photo) (black and white) (each) 0.25 0.25 Copies (photo) (color) (each) 0.45 0.45 Printed Materials Cost Cost Vehicle License Fees-Vehicles under 4,000 pounds 26.00 26.00 Vehicle License Fees-Vehicles 4001-10,000 pounds 30.00 30.00 Vehicle License Fees-Vehicles 10,001-25,000 pounds 35.00 35.00 Vehicle License Fees-Vehicles 25,001-40,000 pounds 60.00 60.00 Vehicle License Fees-Vehicles 40,001-55,000 pounds 80.00 80.00 Vehicle License Fees-Vehicles 55,001-70,000 pounds 125.00 125.00 Vehicle License Fees-Vehicles 70,001-99,999 pounds 150.00 150.00 Motorcycle License Fees-Motorcycles 0-99,999 pounds 24.00 24.00 Trailer License Fees-Trailers 0-10,000 pounds 6.00 6.00 Trailer License Fees-Trailers 10,001-99,999 pounds 22.00 22.00 GENERAL DISTRICT COURT Fines & Forfeitures varies varies Sheriff's Fees 12.00 12.00 Court Appointed Attorneys 120.00 120.00 Electronic Summons Criminal or Traffic Case 5.00 5.00 Courthouse Maintenance Fees 10.00 10.00 Jail Admission Fee 25.00 25.00 265
CITY OF SUFFOLK FEE SCHEDULE FISCAL YEAR 2024-2025 Fees Fiscal Year 2023-2024 Fiscal Year 2024-2025 GEOGRAPHIC INFORMATION SYSTEM Digital Map Data Topographic Data (File Set) $500.00/set or $100/per layer $500.00/set or $100/per layer Base Map (File Set) $500.00/set or $100/per layer $500.00/set or $100/per layer Planimetrics (File Set) $500.00/set or $100/per layer $500.00/set or $100/per layer Zoning (File Set) $500.00/set or $100/per layer $500.00/set or $100/per layer Printed Map Products 8.5" x 11" (ANSI A) $3.00 $3.00 11" x 17" (ANSI B) $5.00 $5.00 17" x 22" (ANSI C) $10.00 $10.00 22" x 34" (ANSI D) $10.00 $10.00 24" x 48" or 24" x 60" $12.00 $12.00 34" x 44" (ANSI E) $15.00 $15.00 36" x 60" or 36" x 72" $15.00 $15.00 Entire City Basemap $25.00 $25.00 Entire City Aerial Image $50.00 $50.00 Specialized Map Services Special Map Production Services (Per Hour) 65.00 65.00 Specialized Data Analysis Services (Per Hour) 65.00 65.00 Individual Orthophotography Tiles 1-5 tiles 100.00/tile 100.00/tile 6 - 10 tiles 50.00/tile 50.00/tile HUMAN RESOURCES COBRA administration 2% of monthly premium 2% of monthly premium JUVENILE AND DOMESTIC RELATIONS COURT Fines and Forfeitures Varies Varies Sheriff's Fees 12.00 12.00 Court Appointed Attorney 120.00 120.00 Courthouse Maintenance 5.00 5.00 Local Interest Varies Varies Jail Admission Fee 25.00 25.00 Courthouse Security Fee 10.00 10.00 LIBRARY Printer and Photocopier-Black and White (per sheet) 0.20 0.20 Printer and Photocopier-Color (per sheet) 0.40 0.40 Printer (3D)-(per-gram) 0.20 0.20 Lost Book/Materials Cost of Book/Material Cost of Book/Material Lost/Damaged Barcode, RFID Tag, Case, Cover, Artwork or Spine Label 5.00 5.00 Lost Tape or CD Cost of Replacement Tape or CD Cost of Replacement Tape or CD PARKS AND RECREATION Athletic Registration Fees Adult Flag Football - Spring & Fall Leagues 320.00 320.00 Adult Kickball 220.00 220.00 Adult Volleyball 200.00 200.00 Adult Softball League 0.00 350.00 Men's Division 350.00 0.00 Women's Division 300.00 0.00 Adult Basketball League (per team) 320.00 320.00 Late Fee 15.00 0.00 Youth Basketball (per participant) Novice-Junior Early Registration * 0.00 60.00 Lil' Dribblers Early Registration* 0.00 40.00 Youth Cheerleading Early Registration * 0.00 60.00 Youth Soccer (per participant) Novice-Junior Early Registration * 0.00 60.00 Tiny Kickz Early Registration * 0.00 40.00 Youth Basketball (per participant) Novice-Junior * 60.00 75.00 Lil' Dribblers* 40.00 55.00 Youth Cheerleading * 60.00 75.00 Youth Soccer (per participant) Novice-Junior * 60.00 75.00 Tiny Kickz* 40.00 55.00 *Parents/Guardians that serve as coach for a youth sports programs will qualify to have one child's registration fee waived. Ball Fields (Tournaments) Rental of Ball fields with Lights (half day) 60.00 60.00 Rental of Ball fields with Lights (full day) 115.00 115.00 Rental of Ball fields without Lights (half day) 40.00 40.00 Rental of Ball fields without Lights (full day) 65.00 65.00 Facilities and Parks Bennett's Creek Park Picnic Shelter Full Day 75.00 75.00 Wedding (up to 4 hours) 20.00 per hour 20.00 per hour Stage 300.00 per day 300.00 per day 266
CITY OF SUFFOLK FEE SCHEDULE FISCAL YEAR 2024-2025 Fees Fiscal Year 2023-2024 Fiscal Year 2024-2025 Constant's Wharf Park and Marina Compass Rose/Boardwalk (Weddings Only) Deposit 150.00 0.00 Compass Rose/Boardwalk (Weddings Only) Per Hour 150.00 150.00 Marina Slips Daily Rate 0-24 Feet 25.00 25.00 25-34 Feet 35.00 35.00 35-44 Feet 45.00 45.00 45-54 Feet 55.00 55.00 Monthly Rate 0-24 Feet 120.00 120.00 25-34 Feet 140.00 140.00 35-44 Feet 160.00 160.00 45-54 Feet 180.00 180.00 Daily Rate without Electricity 0-24 Feet 20.00 0.00 25-34 Feet 30.00 0.00 35-44 Feet 40.00 0.00 45-54 Feet 50.00 0.00 Monthly Rate without Electricity 0-24 Feet 100.00 0.00 25-34 Feet 120.00 0.00 35-44 Feet 140.00 0.00 45-54 Feet 160.00 0.00 Lake Kennedy Park Shelter 75.00 75.00 Cypress Park Shelter 75.00 75.00 Pool Rental Deposit 150.00 150.00 Pool rental, (two hours) 50.00 per hour + 75.00 per day for shelter 100.00 Group Swim 50.00 per hour + 75.00 per day for shelter 0.00 Festival Park Rental Special Event Rental (plus application fee) 0.00 225.00 Recreation Centers Birthday Parties 1 to 25 Patrons 35.00 per hour/ 2 hour max 0.00 26 to 50 Patrons 50.00 per hour/ 2 hour max 0.00 51 to 100 Patrons 100.00 per hour/ 2 hour max 0.00 Recreation Center Membership Membership Fees Youth (7-17 years) - Per Year 5.00 5.00 Adults (18 and older) - Per Year 20.00 20.00 Seniors (55 and older) - Per Year 5.00 5.00 Visitor Pass-Youth & Teen 2.00 1.00 Visitor Pass-Adult 5.00 5.00 Visitor Pass-Senior 1.00 1.00 Replacement Card 1.00 1.00 Fitness Room (must have membership ID) - Per Month Fitness Room (Seniors) - Per Month 5.00 5.00 Fitness Room (Adults -18 & up) - Per Month 10.00 10.00 Fitness Room (Youth & Teens-8 -17 Yrs Old) - Per Month 7.00 7.00 Unless Otherwise Noted, Non Resident Fees 25% above resident fees 25% above resident fees Recreation Center Rentals Rental hours as follows: All Centers: - Monday - Friday; 6pm to 8pm Bennett's Creek, East Suffolk & Curtis Milteer; Saturdays- 1pm to 9pm Application Processing Fee: Non Refundable 25.00 25.00 Gymnasium: (minimum 4 hour rental) Non-commercial Events Hourly Rate 65.00/hr 65.00/hr Non resident rate 81.25/hr 81.25/hr Commercial Events (w/fee or admission) Hourly Rate 75.00/hr 75.00/hr Non resident rate 93.75/hr 93.75/hr Deposit on All Rentals 150.00 150.00 Late Fee (per 15 minutes) for not vacating rental on time 25.00 per 15 minutes 25.00 per 15 minutes Community Room Resident hourly rental rate (minimum 2 hour rental) 0.00 50.00 per hour Non-resident hourly rental rate (min 2 hour rental) 0.00 70.00 per hour Multipurpose Room Resident hourly rental rate (minimum 2 hour rental) 25.00 per hour 25.00 per hour Non-resident hourly rental rate (min 2 hour rental) 35.00 per hour 35.00 per hour Conference Room Resident hourly rental rate (minimum 2 hour rental) 25.00 per hour 25.00 per hour Non-resident hourly rental rate (min 2 hour rental) 35.00 per hour 35.00 per hour Lake Meade Park and Tennis Complex Picnic Shelter Full day 75.00 75.00 Tennis Ball Machine 10.00 per hour 0.00 Dog Park Membership (Annual Membership) 10.00 10.00 267
* Please see Suffolk Parks & Recreation Program Guide for other events and rates at suffolkparksandrec.com
CITY OF SUFFOLK FEE SCHEDULE
YEAR 2024-2025 Fees Fiscal Year 2023-2024 Fiscal Year 2024-2025 Lone Star Lakes Park Wedding (up to 4 hours) 20.00 per hour 20.00 per hour Canoe Rentals (maximum of 6 canoes available) 25.00 per canoe 25.00 per canoe Special Event Application Fee Non-Profit/For-Profit 50.00 50.00 Planters Club Rental Period: 8:00 a.m. to Midnight Deposit 150.00 150.00 Application Processing Fee 25.00 25.00 Setup Fees 50.00 per hour (2 hour min/4 hour max) 50.00 per hour (2 hour min/4 hour max) Resident hourly rental rate (minimum 4-hour rental) Mon - Thurs 125.00 per hour/ Res. 125.00 per hour/ Res. Non-resident hourly rental rate (minimum 4-hour rental) Mon - Thurs 200.00 per hour/ Non Res. 200.00 per hour/ Non Res. Resident hourly rental rate (minimum 4-hour rental) Fri - Sun 225.00 per hour/ Res. 225.00 per hour/ Res. Non-resident hourly rental rate (minimum 4 hour rental) Fri - Sun 300.00 per hour/ Non Res. 300.00 per hour/ Non Res. Late Fee (per 15 minutes) for not vacating rental on time 25.00 per 15 minutes 25.00 per 15 minutes Suffolk Art Gallery Deposit 150.00 150.00 Late fee per 15 mins. for not vacating on time 25.00 per 15 minutes 25.00 per 15 minutes Hourly Rate 25.00 25.00 Sleepy Hole Park Picnic Shelter #1-7 Full Day 75.00 75.00 Picnic Shelter #8 Full Day 125.00 125.00 Wedding (up to 4 hours) 20.00 per hour 20.00 per hour Picnic Pack 25.00 25.00 Canoe/Kayack Annual Storage Fee 100.00 100.00 Custodial Fees (all rental facilities) 16.00 per hour 16.00 per hour Security Services (Suffolk Police Officers) 30.00 per hour per officer $45 per hour for officer, $50 per hour for supervisor Fee Based Activities As noted in Leisure Guide As noted in Program Guide Maintenance Equipment Mobile Bleachers - Per Day 200.00 200.00 Stage - Portable 300.00/day 300.00/day Tents - Per Day 10 x 10 125.00 125.00 20 x 20 200.00 200.00 Tables 6.00 6.00 Folding Chairs (each) 1.00 1.00 Unless Otherwise Noted, Non Resident Fees 25% above resident fees 25% above resident fees Ground Maintenance Grave Space - Single Lot 800.00 800.00 Grave Opening over 10 years of age - weekdays 850.00 850.00 over 10 years of age - Saturday 1,050.00 1,050.00 over 10 years of age - Sunday/Holiday 1,050.00 1,050.00 age 1-10 - weekdays 260.00 260.00 age 1-10 - Saturday 680.00 680.00 age 1-10 - Sunday/Holiday 860.00 860.00 infant under 1 - weekdays 140.00 140.00 infant under 1 - Saturday 560.00 560.00 infant under 1 - Sunday/Holiday 800.00 800.00 Cremation (urn burial) 400.00 400.00 Scatter Garden - Scattering of Ashes 100.00 100.00 Scatter Garden - Memorial /Plaque Engraving 225.00 225.00 Funeral after 4:00 pm in addition to above cost 100.00 100.00 Mausoleum Site Purchase 12' x 24' 22,000.00 22,000.00 Mausoleum Site Purchase - Additional Square Feet 100.00 per square foot 100.00 per square foot Parks and Recreation Sponsored Event Fees Food Vendor (per 10' x 20' space) 0.00 50.00 Merchant Vendor (per 10' x 10' space) 0.00 50.00 PLANNING AND COMMUNITY DEVELOPMENT PLANNING Rezoning Requests Standard/Conventional Rezoning Request 840.00 plus 42.00 acre 840.00 plus 42.00 acre Conditional Rezoning Requests 1,050 plus 42.00 acre 1,050 plus 42.00 acre Amendment to Previously Approved Conditional Rezoning 1,050 plus 45.00 acre 1,050 plus 45.00 acre Conditional Use Permits Conditional Use Permits Request 840.00 plus 21.00 acre 840.00 plus 21.00 acre Admendment to Previously Approved Conditional Use Permit 840.00 plus 21.00 acre 840.00 plus 21.00 acre Previously Approved Conditional Use Permit Time Extension 450.00 450.00 Application Resubmital Fees for Rezoning and Conditional Use Permits (consisting of 50 acres or more in size or 50,000 square feet in size) 500.00 $500 (3rd Submittal and beyond) Rezoning and Conditional Use Permit Deferral Fees After a Public Hearning has been scheduled (consisting of 50 acres or more in size or 50,000 square feet in size) 500.00 $500 (2nd applicant deferral request and beyond)
FISCAL
268
CITY OF SUFFOLK FEE SCHEDULE FISCAL YEAR 2024-2025 Fees Fiscal Year 2023-2024 Fiscal Year 2024-2025 Subdivision Plat Review Preliminary Subdivision Plat $100.00 per lot, $500.00 minimum $100.00 per lot, $500.00 minimum Amendment to Previously Approved Preliminary Subdivision Plat 52.50 with 315.00 minimum 52.50 with 315.00 minimum Minor Subdivision Plat 315.00 350.00 Final Major Subdivision Plat $75.00 per lot with a $500.00 minimum $75.00 per lot with a $500.00 minimum Family Transfer Subdivision Plat 350.00 350.00 Subdivision Determination 350.00 350.00 Subdivision Variance Requests 840.00 840.00 Resubmission for Preliminary Subdivision or Final Major Subdivision 350.00 350.00 Engineering Plan Review Engineering Plan Review $75.00 per lot with 500.00 minimum $75.00 per lot with 500.00 minimum Resubmission/Revision for Engineering Plan Review 350.00 350.00 Amendment to Previously Approved Engineering Plan 500.00 500.00 Site Plan Review Site Plan Review 630.00 plus 63.00 per acre 630.00 plus 63.00 per acre Resubmission/Revision for Site Plan Review 315.00 315.00 Amendment to Previously Approved Site Plan 500.00 500.00 Site Plan Waiver Request 350.00 350.00 Chesapeake Bay Preservation Area Review Resource Protection Area/Buffer Area Encroachment Review (Administrative Review) 52.50 52.50 Resource Protection Area/Buffer Exception Request (Planning Commission Review) 262.50 262.50 Resource Protection Area/Buffer Area Modification Request 52.50 52.50 Resource Protection Area/Buffer Area Restoration Plan Review 52.50 52.50 Resource Protection Area/Buffer Determination Review 0.00 52.50 Retroactive Resource Protection Area/Buffer Area Restoration Plan Review 150.00 150.00 Wetland Permit Request Wetland Board Review 262.50 262.50 Wetlands Board After the Fact 315.00 315.00 Wetland Mitigation Fee In-Lieu 1% over market rate to purchase credits in an approved tidal wetlands bank 1% over market rate to purchase credits in an approved tidal wetlands bank Historic and Cultural District Review Certificate of Appropriateness Requst (Administrative Review) 36.75 36.75 After the Fact Certificate of Appropriatness Request (Administrative Review) 73.50 73.50 Certificate of Appropriateness Requst (HLC Review) 157.50 157.50 After the Fact Certificate of Appropriateness Request (HLC Review) 262.50 262.50 Comprehensive Plan Amendment 150.00 150.00 Comprehensive Plan Consistency Review 262.50 262.50 Right-of-Way Street Abandonment and Vacation 350.00 350.00 Right-of-Way Encroachment Request 105.00 105.00 Street Name Change Request 341.25 341.25 Borrow Pit Fees (Semi-Annual) 105.00 plus 0.24 per cubic yard of material removed 105.00 plus 0.24 per cubic yard of material removed Printing Services Sheet Size (11-inch x 17-inch or smaller) Black & White 0.25 per sheet 0.25 per sheet Sheet Size (11-inch x 17-inch or smaller) Color 0.50 per sheet 0.50 per sheet Sheet Size (Larger than 11-inch x 17-inch) 10.00 per sheet 10.00 per sheet Public Hearing Unreturned Sign Fee 0.00 90.00 per sign COMMUNITY DEVELOPMENT Minimum 56.00 56.00 State Levy 2.00% 2.00% Extra Inspection Trips (each) 56.00 56.00 Correction/Amending Permit Fee 53.00 56.00 Extension of Permits 83.00 83.00 Technology Fee (Per Permit) 0.00 15.00 Cost per page scanned 0.00 5.00 Penalty for Working Without Permits N/A 276.00 Construction Cost $1 - 50,000 276.00 0.00 50,001 - 100,000 551.00 0.00 100,001 - 150,000 1,103.00 0.00 150,001 - 250,000 2,205.00 0.00 250,001 - 750,000 4,410.00 0.00 over 750,000 5,513.00 0.00 Electrical Permits (new service, temporary service & service changes) Minimum 56.00 0.00 State Levy 2.00% 0.00% Correction/Amending Permit Fee 56.00 0.00 Extension of Permits 83.00 0.00 Extra Inspection Trips (each) 56.00 0.00 Residential Power Release Inspection 56.00 56.00 Commercial Power Release Inspection 66.00 66.00 1 -100 amps Single Phase Fee 56.00 56.00 Single Phase Fee (change) 56.00 0.00 Three Phase Fee 56.00 56.00 Three Phase Fee (change) 56.00 0.00 269
CITY OF SUFFOLK FEE SCHEDULE FISCAL YEAR 2024-2025 Fees Fiscal Year 2023-2024 Fiscal Year 2024-2025 101-150 amps Single Phase Fee 56.00 56.00 Single Phase Fee (change) 56.00 0.00 Three Phase Fee 78.00 78.00 Three Phase Fee (change) 56.00 0.00 151 - 200 amps Single Phase Fee 83.00 83.00 Single Phase Fee (change) 56.00 0.00 Three Phase Fee 116.00 116.00 Three Phase Fee (change) 66.00 0.00 201 - 300 amps Single Phase Fee 110.00 110.00 Single Phase Fee (change) 66.00 0.00 Three Phase Fee 154.00 154.00 Three Phase Fee (change) 88.00 0.00 301 - 400 amps Single Phase Fee 166.00 166.00 Single Phase Fee (change) 100.00 0.00 Three Phase Fee 232.00 232.00 Three Phase Fee (change) 132.00 0.00 401 - 500 amps Single Phase Fee 221.00 221.00 Single Phase Fee (change) 132.00 0.00 Three Phase Fee 309.00 309.00 Three Phase Fee (change) 176.00 0.00 501 - 600 amps Single Phase Fee 276.00 276.00 Single Phase Fee (change) 166.00 0.00 Three Phase Fee 386.00 386.00 Three Phase Fee (change) 221.00 0.00 Over 600 amps Single Phase Fee 331.00 331.00 plus 56.00 per each additional 100 amps over 600 Single Phase Fee (change) 198.00 0.00 Three Phase Fee 463.00 463.00 plus 56.00 per each additional 100 amps over 600 Three Phase Fee (change) 265.00 0.00 700 - 799 amps Single Phase Fee (new) 386.00 0.00 Single Phase Fee (change) 232.00 0.00 Three Phase Fee (new) 541.00 0.00 Three Phase Fee (change) 310.00 0.00 800 - 899 amps Single Phase Fee (new) 441.00 0.00 Single Phase Fee (change) 265.00 0.00 Three Phase Fee (new) 617.00 0.00 Three Phase Fee (change) 353.00 0.00 900 - 999 amps Single Phase Fee (new) 497.00 0.00 Single Phase Fee (change) 298.00 0.00 Three Phase Fee (new) 695.00 0.00 Three Phase Fee (change) 397.00 0.00 1,000 - 1,099 amps Single Phase Fee (new) 551.00 0.00 Single Phase Fee (change) 331.00 0.00 Three Phase Fee (new) 772.00 0.00 Three Phase Fee (change) 441.00 0.00 1,100 - 1,199 amps Single Phase Fee (new) 607.00 0.00 Single Phase Fee (change) 364.00 0.00 Three Phase Fee (new) 816.00 0.00 Three Phase Fee (change) 463.00 0.00 1200 amps Single Phase Fee (new) 662.00 0.00 Single Phase Fee (change) 397.00 0.00 Three Phase Fee (new) 860.00 0.00 Three Phase Fee (change) 485.00 0.00 Over 1,200 amps Single Phase Fee (new) 662.00 plus 26 per 50 amps after 0.00 Single Phase Fee (change) 397.00 plus 16 per 50 amps after 0.00 Three Phase Fee (new) 860.00 plus 21 per 50 amps after 0.00 Three Phase Fee (change) 485.00 plus 11 per 50 amps after 0.00 Electrical Permits (Number of circuits required for all Commercial and Residential additions/repairs) 0 - 20 amps (per circuit) 5.00 5.00 21 - 40 6.00 6.00 41 - 60 8.00 8.00 61 - 150 17.00 17.00 over 150 amps 22.00 22.00 270
CITY OF SUFFOLK FEE SCHEDULE FISCAL YEAR 2024-2025 Fees Fiscal Year 2023-2024 Fiscal Year 2024-2025 Pool Grounding 61.00 61.00 Low Voltage (less than 50v) installation if permit required 59.00 59.00 Repair Wiring, Apparatus, Fixtures 56.00 56.00 Fire Prevention Permit Minimum 59.00 0.00 State Levy 2% 0% Correction/Amending Permit Fee 56.00 0.00 Extension of Permits 88.00 0.00 Extra Inspections Trips (each) 59.00 0.00 Fire Prevention Permit 59.00 plus .005 of value 59.00 plus .005 of value Fire Plan Review Fire sprinkler system new < 10 w/calcs, or alterations < 10 existing sprinkler heads not located in the most remote area involving new hydraulic calculations 50.00 50.00 5 foot stub-out for fire protection systems submitted separately from complete fire sprinkler or fire main 50.00 50.00 Fire alarm system alterations where the submittal does not require battery calculations, or the removal of any or all components of non-required system 50.00 50.00 Kitchen hood fire suppresion systems installation / alteration 50.00 50.00 Fire sprinkler system new installation 11-20 w/calcs, alterations of 11-20 existing sprinkler heads not located in the most remote area involving new hydraulic calculations or removal of any sprinkler heads 100.00 100.00 FM 200 clean agent system installation or alteration 100.00 100.00 Fire alarm new installations or alterations that involve < 5 devices, that require battery calculations 100.00 100.00 Spray paint booth installation / alteration 100.00 100.00 Fire sprinkler systems installation or alteration that involve > 21sprinkler heads 200.00 200.00 Fire alarm systems new installations or alterations > 6 devices, that require battery calculations 200.00 200.00 Fire Alarm and Fire Suppression $0 - 5,000 56.00 56.00 5,001 - 6,000 59.00 59.00 Above 6,000 $56 plus $9.00 per $1,000 $56 plus $9.00 per $1,000 Plumbing Permits Minimum 56.00 0.00 State Levy 2.00% 0.00% Correction/Amending Permit Fee 53.00 0.00 Extension of Permits 80.00 0.00 Extra Inspection Trips (each) 56.00 0.00 Each Fixture, Floor Drain, or Trap 8.00 8.00 Each Sewer (sanitary and storm) 8.00 8.00 Each Sewer Replaced or Repaired 39.00 39.00 Each Manhole 8.00 8.00 Each Roof Drain 8.00 8.00 Each Area Drain 8.00 8.00 Each Water Heater 8.00 8.00 Each Water Line (New Residential) 8.00 8.00 Each Water Line (Existing Residential) 39.00 39.00 Each Water Line (Commercial) 110.00 110.00 Each Sewer Line (Commercial) 110.00 110.00 Backflow Preventer 8.00 8.00 Mechanical and Gas Permits Minimum 56.00 0.00 State Levy 2.00% 0.00% Correction/Amending Permit Fee 53.00 0.00 Extension of Permits 83.00 0.00 Extra Inspection Trips (each) 56.00 0.00 Mechanical Permit Fees Chiller, Cooling Tower, Tank $36.00 each $36.00 each AC Equipment, Boiler, Furnace Gas Pack, Forced Air, Misc. Heater, Gas Piping $19.00 each $19.00 each Air Handler $9.00 each $9.00 each Duct Work, Misc Fan, Range Hood $7.00 each $7.00 each Elevator Installation $0-5,000 56.00 56.00 5,001-6,000 61.00 61.00 Above 6,000 56.00 plus $6.00 per $1,000 value 56.00 plus $6.00 per $1,000 value LPG Tanks and Associated Piping 0 - 2,000 gallons 56.00 56.00 over 2,000 56.00 plus $4.00/10,000 gallons 56.00 plus $4.00/10,000 gallons Flammable Liquid Tanks and Associated Piping 0 - 50,000 gallons 56.00 56.00 over 50,000 56.00 plus $4.00/10,000 gallons 56.00 plus $4.00/10,000 gallons Fuel Piping Outlet Each 56.00 56.00 271
CITY OF SUFFOLK FEE SCHEDULE FISCAL YEAR 2024-2025 Fees Fiscal Year 2023-2024 Fiscal Year 2024-2025 Plan Review All Structures - Residential 0 - 2,499 square feet 83.00 83.00 2,500 - 5,000 110.00 110.00 5,000 - 10,000 138.00 138.00 10,001 - 30,000 193.00 193.00 30,001 - 50,000 276.00 276.00 50,001 - 100,000 331.00 331.00 Above 100,000 386.00 386.00 All Structures - Commercial 0 - 2,499 square feet 87.00 87.00 2,500 - 5,000 116.00 116.00 5,000 - 10,000 145.00 145.00 10,001 - 30,000 203.00 203.00 30,001 - 50,000 290.00 290.00 50,001 - 100,000 348.00 348.00 Above 100,000 405.00 405.00 Moving Out of City to In City 579.00 0.00 In City to Out of City 303.00 0.00 Within City 303.00 0.00 Through City 110.00 0.00 Accessory Structures 0 - 100 square feet 56.00 0.00 101 - 300 56.00 0.00 301 - 600 71.00 0.00 Demolition One to Two Family Dwellings 61.00 61.00 Any Residential Accessory Structure 56.00 56.00 All Other Structures 0 - 60,000 square feet 110.00 110.00 over 60,000 $27/15,000 sqft $27/15,000 sqft Sign Fees 1 - 40 sq. ft. 56.00 56.00 41 - 80 sq. ft. 61.00 61.00 over 80 sq. ft. 71.00 71.00 Elevator Compliance Card 56.00 56.00 Amusement Ride Inspection Kiddie Ride 16.00 16.00 Major Ride 26.00 26.00 Spectacular Ride 27.00 27.00 Concession Go Kart per Track 0.00 300.00 Coaster that exceeds 30ft in height 0.00 200.00 Coaster that exceeds 60ft in height 0.00 400.00 Zip Line each line 0.00 150.00 Inspections completed by third party 0.00 75% of regular fee Cross Connection Inspection 56.00 0.00 Private Piers, Greenhouses, and Retaining Walls exceeding 3 feet in height $1 - 2,200 56.00 56.00 over 2,200 $56 plus 0.2% of value $56 plus 0.2% of value Miscellaneous Fees Mobile Homes 56.00 56.00 Modular Classroom Units 61.00 61.00 Tents 56.00 56.00 Chimneys 56.00 56.00 Free Standing Fireplaces/Wood Stoves 56.00 56.00 Stationary Fireplaces 56.00 56.00 Swimming Pools $1 - 2,200 56.00 56.00 over 2,200 $56 plus 0.2% of value $56 plus 0.2% of value Certificate of Occupancy Residential 56.00 56.00 Commercial 110.00 110.00 Extension of Residential, Commercial and Temp C.O. 56.00 56.00 Temporary 110.00 110.00 Rental 56.00 56.00 Two or More Units (per unit) 34.00 34.00 Reinspection 56.00 56.00 Commercial Building Clearance (Business License Inspection) 110.00 110.00 Board of Building Code Appeal 276.00 276.00 Extension of Permits 83.00 0.00 Tower, Antennas and Like Structures $0 - 4999 value 107.00 107.00 5,000 - 19,999 428.00 428.00 20,000 - 99,999 1,227.00 1,227.00 over 100,000 $1,227plus $4 per $1,000 $1,227plus $4 per $1,000 272
CITY OF SUFFOLK FEE SCHEDULE FISCAL YEAR 2024-2025 Fees Fiscal Year 2023-2024 Fiscal Year 2024-2025 Building Fees Residential New Construction .09/sq.ft. .09/sq.ft. Commercial New Construction .10/sq.ft. .10/sq.ft. Correction /Amending Permit Fee 53.00 53.00 Extension of Permits 83.00 83.00 Extra Inspection Trips (each) 56.00 56.00 Additional/Alteration/Repair (Commercial & Residential) based on value of construction $0.00-$5,000 $0.013 $0.000 $5,001-$20,000 $0.009 $0.000 $20,001 and above $0.007 $0.000 Zoning Fees Minimum 39.00 39.00 State Levy 2.00% 2.00% Commercial Business Clearance 110.00 110.00 Board of Building Code Appeal 276.00 276.00 Zoning Permits (includes Farm Affidavits) 39.00 39.00 Home Occupation Permits (zoning review) 39.00 39.00 Health Department Evaluation New Construction 110.00 110.00 Updates 56.00 56.00 Board of Zoning Appeals 551.00 551.00 Administrative Variance Request 66.00 66.00 Chesapeake Bay Special Exception Request Reviewed by Zoning Administrator 56.00 56.00 If Forwarded to Board of Zoning Appeals 331.00 331.00 Written Determination by Zoning Administrator 100.00 100.00 Junkyard Compliance Inspection (yearly) 105.00 105.00 Removal of Weeds, Excessive Vegetation Growth, Trash and Debris: Trash/Debris/Grass/Weeds/Other Substances 100.00 100.00 Grass/Weeds/Other Growth (Vacant Developed or Undeveloped Property) 75.00 75.00 Small Cell Tower Value of $0-$4,999 102.00 102.00 $5,000-$19,999 408.00 408.00 $20,000-$99,999 1169.00 1169.00 Over $100,000 1,169.00 plus 4.00 per 1,000 1,169.00 plus 4.00 per 1,000 Temporary Use Permit 39.00 39.00 Temporary Signs 39.00 39.00 Building Permits: Permit Issued No Inspections Completed 75% 75% Foundation Inspection Completed 50% 50% Framing & Foundation Inspection Completed 25% 25% Electrical Permits: Permit Issued No Inspections Completed 75% 0% Rough-in Inspections Completed 50% 0% Mechanical Permits: Permit Issued No Inspections Completed 75% 0% Rough-in Inspections Completed 50% 0% Gas Permits: Permit Issued No Inspections Completed 75% 0% Rough-in Inspections Completed 50% 0% Plumbing Permits Permit Issued No Inspections Completed 75% 0% Rough-in Inspections Completed 50% 0% * All refunds subject to $15.00 processing Fee-no refunds will be issued for amounts less than $15.00 POLICE Annual Alarm Registration 25.00 25.00 Alarm Registration Renewal 10.00 10.00 Alarm Registration Late Fee (after 30 days) 25.00 25.00 Fee to alarm company for failure to provide alarm user list 25.00 per working day until compliance 25.00 per working day until compliance Reinstatement fee for failure to provide alarm user list 100.00 + 10.00 per registered user 100.00 + 10.00 per registered user Late fee for registration renewal (after 30 days) 25.00 25.00 Use of Automatic Dialer 100.00 100.00 Audible Alarm Violation 100.00 100.00 Reinstatement Fee for failure to provide ARM 100.00 + 10.00 per registered user 100.00 + 10.00 per registered user Failure of alarm company to provide customer False Alarm Prevention checklist 50.00 50.00 Failure of alarm company to provide Alarm Installer checklist 50.00 50.00 Failure of alarm company to provide Alarm Dispatch Records request 50.00 50.00 Security Alarm Company Initial Registration 100.00 100.00 Late fee for Security Alarm Company registration (after 30 days) 25.00 25.00 273
CITY OF SUFFOLK FEE SCHEDULE FISCAL YEAR 2024-2025 Fees Fiscal Year 2023-2024 Fiscal Year 2024-2025 Security Alarm Company Registration Renewal less than 50 alarm sites in Suffolk 100.00 100.00 Security Alarm Company Registration Renewal 51+ alarm sites in Suffolk 100.00 100.00 Reinstatement fee for alarm installation/monitoring company 100.00 100.00 General false alarm fee for second response 50.00 50.00 General false alarm fee for third response 100.00 100.00 General false alarm fee for fourth and subsequent response 150.00 150.00 Robbery/panic false alarm for second response 100.00 100.00 Robbery/panic false alarm for third response 150.00 150.00 Robbery/panic false alarm for fourth and all subsequent response 250.00 250.00 Reinstatement fee to alarm user for suspended alarm registration 50.00 50.00 Late fee for failure to pay false alarm fees after 30 days 25.00 25.00 False Alarm fee for non-registered alarm per response 100.00 100.00 Fee to monitoring co. for calling in on suspended / unregistered alarm site 100.00 100.00 Fee to alarm company for making false statement 100.00 100.00 Fee to alarm company for causing false alarm response per response 75.00 75.00 Fee to monitoring company for failure to verify alarm system signal 100.00 100.00 Fee for appeals per request 25.00 25.00 Local Record Check 10.00 10.00 Accident Report 10.00 10.00 Incident Report 10.00 10.00 Fingerprinting $10 for first card, and $5 for additional cards $10 for first card, and $5 for additional cards Photographs 7.00 or cost whatever is greater 7.00 or cost whatever is greater Chauffeur's License 20.00 20.00 Solicitation Permit 15.00 15.00 Concealed Weapon Permit 35.00 35.00 Computer Generated Reports Cost, but not less than 15.00 Cost, but not less than 15.00 Certificate of Public Convenience $30.00 plus $20 for annual inspection or reinspection of each vehicle listed $30.00 plus $20 for annual inspection or reinspection of each vehicle listed Security Services Police Officer/$45 per hour, minimum 2 hours Supervisor/$50 per hour, minimum 2 hours Police Officer/$45 per hour, minimum 2 hours Supervisor/$50 per hour, minimum 2 hours Reclaim Fee (Animal Shelter and Management) 15.00 per day 15.00 per day Adoption - Feline Adoption Spayed or Neutered with Vaccines (Animal Shelter) 75.00 75.00 Adoption - Canine Spayed or Neutered with Vaccines (Animal Shelter) 95.00 95.00 Adoption - Animal other than Feline or Canine (Animal Shelter) 25.00 25.00 Dog License Fee - Spayed or Neutered (Animal Shelter) 5.00 5.00 Dog License Fee - Not Spayed or Neutered (Animal Shelter) 10.00 10.00 Dog License Fee - Duplicate 1.00 1.00 Lifetime Dog License Fee - Spayed or Neutered (Animal Shelter) 50.00 50.00 Dangerous Dog Registration Certificate 150.00 150.00 Dangerous Dog Registration Certificate Renewal 85.00 85.00 Kennel License $50 per block of 10 dogs $50 per block of 10 dogs Full Scale Accident Diagram 5.00 5.00 Audio Dispatch Tape/CD 15.00 15.00 CAD Report 6.00 6.00 Color Copy 0.50 0.50 Black & White Copy 0.25 0.25 Photographs on CD 15.00 15.00 Video Tape 15.00 15.00 PUBLIC UTILITIES Bacteriological Tests (each) 40.00 40.00 Delinquency Fees Door tag placement 10.00 10.00 Disconnect/Reconnect of Water Service 25.00 25.00 Meter Removal 50.00 50.00 Finance Charges 1.5 % per month with $0.50 minimum 1.5 % per month with $0.50 minimum Illegal Connect/Reconnection of Water Service 100.00 100.00 Water Conservation Reconnection Fees 1st Violation 250.00 250.00 Subsequent Violations 500.00 500.00 Water Rate per 100 cubic feet 10.63 11.10 WTWA Wholesale Water Rate (per 100 cubic feet) 5.36 5.63 WTWA Fixed Capacity Charge (per month) 176,248.00 177,288.00 WTWA Meter Service Charge (per month) 200.00 200.00 Water Conservation Service Charge Rate 1.25 x Meter Rate 1.25 x Meter Rate Water Usage Non Metered (per month - 5 ccf) 53.15 55.50 Meter Service Charge (per month) 5/8 and 3/4 inch meter 15.25 (Billed at $0.501 per day per billing cycle) 15.25 (Billed at $0.501 per day per billing cycle) 1 inch meter 38.15 (Billed at $1.254 per day per billing cycle) 38.15 (Billed at $1.254 per day per billing cycle) 1½ inch meter 76.25 (Billed at $2.507 per day per billing cycle) 76.25 (Billed at $2.507 per day per billing cycle) 2 inch meter 122.00 (Billed at $4.011 per day per billing cycle) 122.00 (Billed at $4.011 per day per billing cycle) 3 inch meter 228.75 (Billed at $7.521 per day per billing cycle) 228.75 (Billed at $7.521 per day per billing cycle) 4 inch meter 381.25 (Billed at $12.534 per day per billing cycle) 381.25 (Billed at $12.534 per day per billing cycle) 6 inch meter 762.50 (Billed at $25.068 per day per billing cycle) 762.50 (Billed at $25.068 per day per billing cycle) 8 inch meter 1,220.00 (Billed at $40.110 per day per billing cycle) 1,220.00 (Billed at $40.110 per day per billing cycle) 10 inch meter 1,753.75 (Billed at $57.658 per day per billing cycle) 1,753.75 (Billed at $57.658 per day per billing cycle) 274
CITY OF SUFFOLK FEE SCHEDULE FISCAL YEAR 2024-2025 Fees Fiscal Year 2023-2024 Fiscal Year 2024-2025 Water Connection Charge (installed by city) 5/8 inch & 3/4 inch meter 2,000.00 2,000.00 1 inch meter 2,300.00 2,300.00 1½ inch meter 2,600.00 2,600.00 2 inch meter 3,000.00 3,000.00 When the size is above those listed a charge equal to actual cost of installation plus 25% Actual cost x 1.25 Actual cost x 1.25 When depth of trench excavation is greater than six feet, a charge equal to actual cost of City Contractor installation N/A Actual Cost of Installation Water Connection Charge (installed by developer) 50.00 50.00 Water Availability Charge (residential) Single Family 5,520.00 5,520.00 Attached Multi Family (Building with 2 to 4 units) (cost per unit) 4,970.00 4,970.00 Attached Multi Family (Building with 5 to 16 units) (cost per unit) 4,420.00 4,420.00 Attached Multi Family (Building with 17 to 24 units) (cost per unit) 3,865.00 3,865.00 Attached Mulit Family (Building 25 + units) (cost per unit) 3,310.00 3,310.00 Mobile Home Park (cost per unit) 3,900.00 3,900.00 Water Availability Charge (commercial) 5/8 and 3/4 inch meter 5,520.00 5,520.00 1 inch meter 13,520.00 13,520.00 1½ inch meter 26,950.00 26,950.00 2 inch meter 43,120.00 43,120.00 3 inch meter 80,850.00 80,850.00 4 inch meter 134,750.00 134,750.00 6 inch meter 269,500.00 269,500.00 8 inch meter 431,200.00 431,200.00 10 inch meter 619,850.00 619,850.00 Installment Payments Down Payment 250.00 250.00 Interest Equal to prime rate - July 1 Equal to prime rate - July 1 Finance charge 1 1/2 % or $0.50 minimum per month 1 1/2 % or $0.50 minimum per month New Account Setup Charge 10.00 10.00 Fire Hydrant Meter Rental Charge (excludes water usage charge) $1,500 Deposit $1,500 Deposit Fire Hydrant Flow Test Fee/Water Model Evaluation 400.00 400.00 Sewer Collection (per 100 cubic feet) 7.56 7.68 Sewer Usage Non Metered (per month 5 ccf) 37.80 38.40 Sewer Connection Charge (installed by city) 4 inch lateral size 1,800.00 1,800.00 6 inch lateral size 3,000.00 3,000.00 Greater than 6 inch actual cost of installation plus 25% actual cost of installation plus 25% When depth of trench excavation is greater than six feet, a charge equal to actual cost of City contractor installation N/A Actual Cost of Installation Sewer Connection Charge (installed by developer) 50.00 50.00 Sewer Availability Charge (residential) Single Family 6,000.00 6,000.00 Attached Multi Family (Building with 2 to 4 units), (cost per unit) 5,400.00 5,400.00 Attached Multi Family (Building with 5 to 16 units), (cost per unit) 4,800.00 4,800.00 Attached Multi Family (Building with 17-24 units), (cost per unit) 4,200.00 4,200.00 Attached Multi Family (Building 25+ units), (cost per unit) 3,600.00 3,600.00 Mobile Home Park (cost per unit) 3,900.00 3,900.00 Sewer Availability Charge (commercial) 5/8 and 3/4 inch meter 6,000.00 6,000.00 1 inch meter 14,800.00 14,800.00 1½ inch meter 29,500.00 29,500.00 2 inch meter 47,100.00 47,100.00 3 inch meter 88,100.00 88,100.00 4 inch meter 146,800.00 146,800.00 6 inch meter 293,400.00 293,400.00 8 inch meter 469,300.00 469,300.00 10 inch meter 674,600.00 674,600.00 Engineering Review Site Plans Review $1,500 Base Fee plus $1.50/ for every foot of public water & sewer mains beyond the initial 250 and does not include pump station review fee $1,500 Base Fee plus $1.50/ for every foot of public water & sewer mains beyond the initial 250 and does not include pump station review fee Engineerying Plans Review $2,500 Base Fee plus $.15/ for every foot of public water & sewer mains plus pump station review fee $2,500 Base Fee plus $.15/ for every foot of public water & sewer mains plus pump station review fee Engineering Plans/Site Plans Amendments $500/Submittal $500/Submittal Plats 200.00 200.00 Pump Station Review/Sewer Model Evaluation $2,000 per station $2,000 per station 275
(Plans with disturbance greater than 1.0 acre shall add $250/additional acre of disturbance or any portion thereof)
The following state fees shall be added accordingly
>1.0-5.0 acres + $756
>5.0-10.0 acres + $952
acres + $1,260
Plan Amendment = $350
The following state fees shall be added accordingly
>1.0-5.0 acres + $756
>5.0-10.0 acres + $952
>10.0-50.0 acres + $1,260
>50.00-100.00 acres + $1,708
>100.00 acres + $2,688
Plan Amendment = $350 Engineering Plan Review Fee
The following state fees shall be added accordingly
>1.0-5.0 acres + $756
>5.0-10.0 acres + $952
>10.0-50.0 acres + $1,260
>50.00-100.00 acres + $1,708
>100.00
CITY OF SUFFOLK FEE SCHEDULE FISCAL YEAR 2024-2025 Fees Fiscal Year 2023-2024 Fiscal Year 2024-2025 Engineering Construction Inspection Sanitary Sewer Facilities $1.50/LF for every foot of public sewer installed $1.50/LF for every foot of public sewer installed Water Transmission/Distribution Facilities $1.50/LF for every foot of public sewer installed $1.50/LF for every foot of public sewer installed Site Plan with Public Utilities $1,500 plus $1.50 for every foot of public water or sewer mains installed $1,500 plus $1.50 for every foot of public water or sewer mains installed Inspection Fee for Overtime Work at Developers Request At Cost At Cost Environmental Incentive - Water 5/8 and 3/4 inch meter 3,250.00 3,250.00 1 inch meter 8,125.00 8,125.00 1½ inch meter 16,250.00 16,250.00 2 inch meter 26,000.00 26,000.00 3 inch meter 48,750.00 48,750.00 4 inch meter 81,250.00 81,250.00 Environmental Incentive - Sewer 5/8 and 3/4 inch meter 1,750.00 1,750.00 1 inch meter 4,375.00 4,375.00 1½ inch meter 8,750.00 8,750.00 2 inch meter 14,000.00 14,000.00 3 inch meter 26,250.00 26,250.00 4 inch meter 43,750.00 43,750.00 PUBLIC WORKS Traffic Engineering Inspection and Plan Review Site Plan: $1,000/application $1,000/application Engineering Plans: $1,500/application $1,500/application Major Final Subdivision Plats: $100/plat $100/plat Traffic Engineering Study Fee $100/hr $100/hr Traffic Signal Inspection Fee $20,000 per location $20,000 per location Inspection Services $70/hr $70/hr Golf Cart Study Fee $1,600/application $1,600/application Golf Cart Signs (per location) $250 per location $250 per location No Wake Zone Study Fee 550.00 550.00 No Wake Zone Posting At Cost At Cost Right-of-Way Encroachment Permit 125.00 125.00 Shared Mobility Device System Application Fee >10 Devices $200 10>50 Devices $1,500 50< Devices $5,000 >10 Devices $200 10>50 Devices $1,500 50< Devices $5,000 Impact Fee Defined by Permit Defined by Permit Stormwater and Public Works Engineering Storm Water Utility Fee 7.50/mo/ERU 7.50/mo/ERU Inspection Fee for Engineering Plans 2% of engineers cost estimate plus 2% of E&S bond estimate; $1,400 minimum 2% of engineers cost estimate plus 2% of E&S bond estimate; $1,400 minimum Inspection Fee for Site Plans/E&S Only Plans $400/acre;$1,400 minimum not to exceed $8,000 $400/acre;$1,400 minimum not to exceed $8,000 Inspection Fee for Overtime Work at Development Request At Cost At Cost Stormwater/E &S plan review Site Plan Review Fee Less than-10,000 sf of disturbance - $460 10,000-0.5 acre of disturbance -$835 Greater than 0.5 and up to 1.0 acre of disturbance- $1585
>10.0-50.0
>50.00-100.00 acres + $1,708 >100.00 acres + $2,688
Less than-10,000 sf of disturbance - $460 10,000-0.5 acre of disturbance -$835
than 0.5 and up to 1.0 acre of disturbance- $1585
Greater
(Plans with disturbance greater than 1.0 acre shall add $250/additional acre of disturbance or any portion thereof)
$1000 + $1/lf of roadway
acres + $2,688 Plan Amendments = $350 $1000 + $1/lf of roadway
following state fees shall be added accordingly
acres + $756 >5.0-10.0 acres + $952 >10.0-50.0 acres + $1,260 >50.00-100.00 acres + $1,708 >100.00 acres + $2,688 Plan Amendments = $350 Modification or Transfer of General Permit/Registration Statement for Discharges of Stormwater from Construction Activities Fees shall be paid pursuant to Virginia Administrative Code 9VAC25-870-825 Fees shall be paid pursuant to Virginia Administrative Code 9VAC25-870-825 Annual Maintenance fees for General or Individual Permits for Discharges of Stormwater from Construction Activities Fees shall be paid pursuant to Virginia Administrative Code 9VAC25-870-830 Fees shall be paid pursuant to Virginia Administrative Code 9VAC25-870-830 Minor Subdivision Plan Review Fee 150.00 150.00 Major Subdivision Maintenance Agreement Review Fee $750 per plat $750 per plat 276
The
>1.0-5.0
CITY OF SUFFOLK FEE SCHEDULE FISCAL YEAR 2024-2025 Fees Fiscal Year 2023-2024 Fiscal Year 2024-2025 Single Family E&S Site Plan Review 290.00 290.00 Stormwater Maintenance Agreement Review Fee 150.00 150.00 Storm Sandbags (Suffolk Residents Only) 3.00 3.00 Pro Rata Share Fees Chowan Watershed 958/acre 958/acre Great Dismal Watershed 263/acre 263/acre James River Watershed 632/acre 632/acre Permits Right of Way Permit 125.00 125.00 plus asphalt (per cubic foot) Cost Cost plus concrete (per cubic foot) Cost Cost Street Name Signs (private - black and yellow) 600.00 600.00 Street Name Signs (public - green and white) 600.00 600.00 Permits (continued) Special Permits for Oversized and Overweight Vehicles Single-Trip Permit 75.00 75.00 Single-Trip House Move Permit 100.00 100.00 Blanket-Term Permit 300.00 300.00 General Engineering Review at cost at cost In-depth Engineering Review at cost at cost Maps - Printed Map Products GIS Tax Map (single map) See Geographic Information System section for map rates See Geographic Information System section for map rates Other Map Product (single map) See Geographic Information System section for map rates See Geographic Information System section for map rates Generalized City Base Map (single map) See Geographic Information System section for map rates See Geographic Information System section for map rates Maps - Specialized Map Services Special Map Production Services (per hour) See Geographic Information System section for map rates See Geographic Information System section for map rates Specialized Data Analysis Services (per hour) See Geographic Information System section for map rates See Geographic Information System section for map rates Refuse Collection Automated Refuse Container 75.00 75.00 *Refuse and Recycling Service 25.25/mo/unit 25.25/mo/unit Bulk Refuse Service 1-12 CY bulk collection - before 12 free collections are used No Charge No Charge 13-24 CY bulk collection - before 12 free collections are used 47.50 47.50 1-12 CY bulk collection - after 12 free collections 47.50 47.50 13-24 CY bulk collection - after 12 free collections 105.00 105.00 Evictions 170.00 170.00 Bulk Refuse Service - Roll Off Weekdays 120.00 120.00 Weekends 170.00 170.00 * Does not include commercial refuse collection TRANSIT Fares-Regular Bus Service (Not Paratransit) Adult - One way (No Transfer) 1.50 1.50 Adult - All day (Unlimited Transfer) 3.00 3.00 Adult - Monthly Pass 57.50 57.50 Student (6-18 yrs) - One way (No Transfer) 1.00 1.00 Student (6-18 yrs) - All day (Unlimited Transfer) 2.00 2.00 Student (6-18 yrs) - Monthly Pass 37.50 37.50 Disabled and/or Senior (55+ yrs) - One way (No Transfer) 0.75 0.75 Disabled and/or Senior (55+ yrs) - All day (Unlimited Transfer) 1.50 1.50 Disabled and/or Senior (55+ yrs) - Monthly Pass 27.50 27.50 Fare - Paratransit - One way (Qualified individuals only) 3.00 3.00 TOURISM Conference Room (9 am to 5 pm) Non-Profit (first two hours) 25.00 25.00 Additional Hours 5.00/hour 5.00/hour For-Profit (first two hours) 75.00 75.00 Additional Hours 15.00/hour 15.00/hour Mulitpurpose Room (6 pm to midnight) Deposit (non-refundable) 150.00 150.00 Non-Profit Event 50.00/hour 50.00/hour For-Profit Event 80.00/hour 80.00/hour Visitor Center Pavilion Deposit (non-refundable) 300.00 300.00 Each additional hour (two hour minimum) 100.00/hour 100.00/hour Farmer's Market Booth Rental (Pavilion) Standard Booth 75.00/season 75.00/season Expanded Booth 125.00/season 125.00/season Exterior (Uncovered) Space 45.00/season 45.00/season One-day Vendor Pass 15.00/one day 15.00/one day Season-long Tent Space (10 x 10) - vendor must supply own tent 40.00/season 40.00/season 277
CITY OF SUFFOLK FEE SCHEDULE FISCAL YEAR 2024-2025 Fees Fiscal Year 2023-2024 Fiscal Year 2024-2025 Interpreted Bus Tour Historic District Adult 8.00 8.00 Senior (60+) and Child (3 to 12), Military 6.00 6.00 Interpreted Bus Tour Great Dismal Swamp Adult 10.00 10.00 Senior (60+) and Child (9 to 12), Military 8.00 8.00 Guided Cedar Hill Cementary Stroll Adult 7.00 7.00 Senior (60+) and Child (9 to 12), Military 5.00 5.00 Interpreted Canoe Tour 40.00 40.00 Ghost Walk Adult 10.00 10.00 Senior (60+) and Child (9 to 12), Military 8.00 8.00 Guided Nature Walks Adult 7.00 7.00 Senior (60+); Child (9-12): Military 5.00 5.00 Nansemond River Kayak Tours 40.00 40.00 Lone Star Lakes Kayak Tours 40.00 40.00 Bennett's Creek Kayak Tours 40.00 40.00 Seaboard Station Railroad Museum Guided Museum Tour (12 and older) 2.00/per person 2.00/per person Guided Museum Tour-Group Rate 1.00/per person 1.00/per person Family Membership-Unlimted Visits (up to 4 people) 40.00/year 40.00/year Seaboard Station Birthday Party Rental Package (basic) Deposit (non-refundable) 25.00 25.00 Payment Due Day of Party 100.00 100.00 Seaboard Station Birthday Party Rental Package (premier) Deposit (non-refundable) 50.00 50.00 Payment Due Day of Party 250.00 250.00 Seaboard Station Railroad Museum After Hours Reception Rental Non-profit (first two hours) 75.00 75.00 Additional Hours 25.00/hour 25.00/hour For-profit (first two hours) 150.00 150.00 Additional Hours 50.00/hour 50.00/hour Seaboard Station Railroad Museum After Hours Meeting Rental Non-profit (first two hours) 25.00 25.00 Additional Hours 5.00/hr 5.00/hr For-profit (first two hours) 50.00 50.00 Additional Hours 15.00/hour 15.00/hour Fee Based Activities Not Described Cost Cost Visitor Center Display Case - Limit of 4 $100/quarter when available $100/quarter when available TREASURER Return Check 50.00 50.00 Set Off Debt 30.00 30.00 Distress Collection Fee 30.00 30.00 Copy of Delinquent Report 100.00 100.00 Vehicle Withholding Registration Fee 25.00 25.00 Delinquent Tax Collection (prior to judgment) 30.00 30.00 Delinquent Tax Collection (after judgment) 35.00 35.00 Attorney or Collection Agency Fees 20% 20% Service Fee for Out-of-City processing (per Defendant) 28.00 28.00 For each additional warrant served 12.00 12.00 Roll Back Tax Interest 10% 10% 278
AN ORDINANCE APPROVING NEW POSITIONS, PAY GRADES, PAY GRADE CHANGES AND JOB DESCRIPTIONS REGARDING THE FY 2024-2025 OPERATING AND CAPITAL BUDGET AND THE CITY’S COMPENSATION AND CLASSIFICATION PLAN
WHEREAS, the City Council has determined that the performance of City government will be enhanced by the addition of new positions within the City’s Compensation and Classification Plan; and,
WHEREAS, pursuant to § 66-42 of the Code of the City of Suffolk, the City Council shall approve new positions, and pursuant to § 66-42 of the Code of the City of Suffolk, the City Council shall approve reassignments of existing positions to higher or lower pay grades, significant revisions to job descriptions, and new job descriptions; and,
WHEREAS, the City Manager is requesting that new positions be approved in the FY 2024-2025 Operating and Capital Budget and the City’s Compensation and Classification Plan; and,
WHEREAS, the City Manager is requesting that the corresponding new job descriptions for new positions be approved as a part of the FY 2024-2025 Operating and Capital Budget and the City’s Compensation and Classification Plan.
NOW, THEREFORE, BE IT ORDAINED by the City Council of the City of Suffolk, Virginia, that the job descriptions for new positions and revisions of existing positions of Agricultural Specialist, Grade 216; Animal Caretaker, Grade 203; Animal Control Officer, Grade N207; Appraiser I, Grade 210; Appraiser II, Grade 211; Assistant City Attorney I, Grade 219; Assistant City Attorney II, Grade 222; Assistant City Attorney III, Grade 223; Assistant Director of Downtown Development, Grade 223; Benefit Programs Specialist I, Grade 208; Benefit Programs Specialist II, Grade 210; Benefit Programs Specialist III, Grade 211; Benefits Program Manager, Grade 218; Budget Manager, Grade 219; Business Analyst, Grade 219; Business Development Manager, Grade 217; Call Taker, Grade 204; Civil Court Administrator, Grade 218; Civil Engineer IV, Grade 220; Compensation Analyst, Grade 214; Court Liaison Administrator, Grade 218; Criminal Court Administrator, Grade 218; Crime Analyst, Grade 211; DEI-B Analyst and Training Consultant, Grade 217; Employee Relations Manager, Grade 220; Family Services Program Manager, Grade 218; GIS Analyst, Grade 211; GIS Technician, Grade 210; Grants Manager, Grade 219; HRIS Analyst, Grade 217; Fleet Support Associate, Grade 202; Fleet Parts Specialist, Grade 205; Forensic Technician, Grade 210; Judicial Staff Attorney, Grade 218; Mechanic I, Grade 208; Mechanic II, Grade 209; Mechanic III, Grade 212; Network Manager, Grade 220; Park Supervisor, Grade 207; Programmer Analyst, Grade 216; Project Manager, Grade 222; Recreation Specialist, Grade 208; Refuse Equipment Operator, Grade 208; Risk Management Specialist, Grade 214; Senior Accountant, Grade 218; Senior Budget Analyst, Grade 218; Senior Business Development Manager, Grade 218; Senior Records Technician, Grade 208; Senior Refuse Equipment Operator, Grade 209; Senior Forensic Technician, Grade 212; Senior Crime Analyst, Grade 213; Senior Intelligence Analyst, Grade 213; and Senior Animal Control Officer, Grade N209; Systems Analyst, Grade 218; Water Treatment Plant Operator I, Grade 209; Water Treatment Plant Operator II, Grade 211; Webmaster, Grade 216; Wellness Coordinator, Grade
_____________
ORDINANCE NUMBER
279
219; and Zoning Official, Grade 212 which are attached as part of this Ordinance, be and are hereby approved as part of the FY 2024-2025 Compensation and Classification Plan.
BE IT FURTHER ORDAINED THAT this Ordinance shall be effective on July 1, 2024, contingent upon the corresponding jobs for the job descriptions being approved in the FY 20242025 Operating and Capital Budget.
READ AND PASSED: ________________________________
TESTE: ________________________________________
Erika S. Dawley, City Clerk
Approved as to Form: ________________________________________
William E. Hutchings, Jr., City Attorney
280
ORDINANCE NUMBER
AN ORDINANCE TO PROVIDE A COST OF LIVING ADJUSTMENT OF 4% TO FULL-TIME AND REGULAR PART-TIME CITY EMPLOYEES, GRANT EMPLOYEES, THE REGISTRAR’S EMPLOYEES, AND THE CONSTITUTIONAL OFFICERS’ EMPLOYEES
WHEREAS, the City Council has determined that a 4% cost of living adjustment be provided to all full-time and regular part-time city employees, grant employees, the Registrar’s employees and the Constitutional Officers’ employees
NOW, THEREFORE, BE IT ORDAINED by the City Council of the City of Suffolk, Virginia, that all full-time and regular part-time city employees, grant employees, the Registrar’s employees, and Constitutional Officers’ employees shall receive a 4% cost of living adjustment.
BE IT FURTHER ORDAINED that the 4% cost of living adjustment shall be effective with the first paycheck in July 2024 and shall not extend to Constitutional Officers, the Registrar, City Council Appointees, Deputy City Managers, and Department Directors.
BE IT FURTHER ORDAINED that the ordinance shall be effective on July 1, 2024, and shall not be published.
READ AND PASSED:
TESTE: _____________________________________________
Erika S. Dawley, City Clerk
Approved as to Form: _______________________________________
William E. Hutchings, Jr., City Attorney
_____________
________________________________
281
THIS PAGE INTENTIONALLY BLANK
282
AN ORDINANCE TO REAPPROPRIATE AND TRANSFER FUNDS
RECEIVED THROUGH THE AUTOMATED TRAFFIC ENFORCEMENT CAMERA PROGRAM FROM THE ROAD MAINTENANCE FUND
RESTRICTED FUND BALANCE TO THE GENERAL FUND COMMUNITY SAFETY PROJECTS COST CENTER
WHEREAS, the City Council of the City of Suffolk adopted Ordinance Number 23-O-029 on March 15, 2023, establishing an automated traffic enforcement camera program; and,
WHEREAS, the automated traffic enforcement camera program provides for the assessment and collection of civil penalties for traffic violations captured by photo-monitoring systems in designated highway work zones and school crossing zones, at traffic light signals, and on school buses; and,
WHEREAS, the civil penalties paid to the City of Suffolk for automated traffic enforcement camera violations are currently accounted for in the Road Maintenance Fund; and,
WHEREAS, the City Council of the City of Suffolk desires to establish a cost center and associated general ledger line item accounts in the General Fund to better account for and utilize civil penalties from automated traffic enforcement camera violations for community safety projects.
NOW, THEREFORE, BE IT ORDAINED that the City Council of the City of Suffolk hereby authorizes the City Manager to establish a Community Safety Projects cost center and associated line item accounts in the General Fund.
BE IT FURTHER ORDAINED that $7,090,516 is hereby reappropriated and transferred from the Road Maintenance Fund Restricted Fund Balance to the General Fund Community Safety Projects cost center and associated general ledger line item accounts as follows:
The fund amount totaling $7,090,516 is hereby appropriated for use as referenced in this ordinance and the budget approved by Ordinance Number 24-O-____. The City Manager be, and hereby is authorized and directed to do all things necessary to effectuate this action.
____________
ORDINANCE NUMBER
Revenue Transfer From/To: 210_461020 Road Maintenance Fund Balance Surplus – Assigned ($7,090,516) 100_441050.210 Interfund Transfer from Road Maintenance Fund 7,090,516 $ 0.00 Expenditure Transfer From/To: 210-93000_50000.165 Transfer to General Fund ($7,090,516) 100-31800_56036 Community Safety Projects – Automated Traffic 7,090,516 Enforcement Improvements $ 0.00
283
This ordinance shall be effective July 1, 2024, and shall not be published.
READ AND PASSED:_______________________
TESTE:____________________________________
Erika S. Dawley, City ClerkApproved as to form:
__________________________________
William E. Hutchings, Jr., City Attorney284
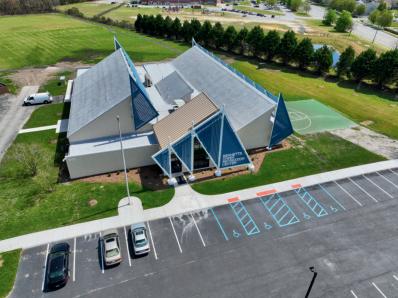
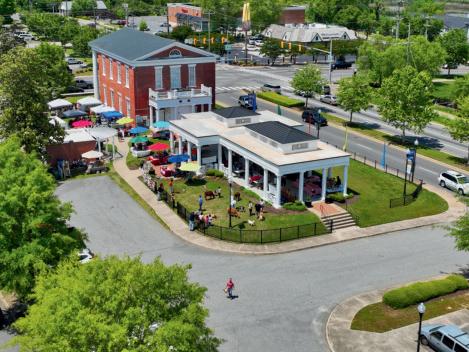
442 W. WASHINGTON ST. SUFFOLK, VIRGINIA 23434 (757)514-4006 WWW.SUFFOLKVA.US DEPARTMENT OF FINANCE -DIVISION OF BUDGET & STRATEGIC PLANNING