ANNUAL COMPREHENSIVE FINANCIAL REPORT


FOR THE FISCAL YEAR ENDED JUNE 30, 2022
CITY of SUFFOLK, VIRGINIA
CITY OF SUFFOLK, VIRGINIA
ANNUAL COMPREHENSIVE FINANCIAL REPORT
FOR THE FISCAL YEAR ENDED June 30, 2022
Prepared by:
The Department of Finance
TABLE
FINANCIAL SECTION
BASIC FINANCIAL STATEMENTS
Government-wide Financial Statements Exhibit 1: Statement of Net Position ............................................................................................................14 Exhibit 2: Statement of Activities ................................................................................................................15
Fund Financial Statements
Exhibit 3: Balance Sheet – Governmental Funds .........................................................................................16
Exhibit 4: Statement of Revenues, Expenditures, and Changes in Fund Balances – Governmental Funds .17
Exhibit 5: Statement of Net Position – Proprietary Funds ...........................................................................19
Exhibit 6: Statement of Revenues, Expenses, and Changes in Fund Net Position – Proprietary Funds ......20 Exhibit 7: Statement of Cash Flow – Proprietary Funds ..............................................................................21
Exhibit 8: Statement of Fiduciary Net Position ............................................................................................23 Exhibit 9: Statement of Changes in Fiduciary Net Position .........................................................................24 Notes to Financial Statements ..........................................................................................................................25
REQUIRED SUPPLEMENTARY INFORMATION
Exhibit 10: Schedule of Revenues, Expenditures, and Changes in Fund Balances –Budget and Actual – Budgetary Basis – General Fund ...........................................................102
Exhibit 11: Schedule of Revenues, Expenditures, and Changes in Fund Balances –Budget and Actual – Budgetary Basis – Road Maintenance Fund ..........................................106
Exhibit 12: Schedule of Changes in the City's Net Pension Liability and Related Ratios .........................107
Exhibit 13: Schedule of Changes in the School Board's (non-teacher) Net Pension Liability and Related Ratios .....................................................................................................................................108
Exhibit 14: Schedule of Employer's Proportionate Share of Net Pension Liability – School Board Teacher Retirement Plan .......................................................................................................................109
CITY OF SUFFOLK, VIRGINIA
OF CONTENTS
INTRODUCTORY SECTION
Letter of Transmittal ........................................................................................................................................... i Certificate of Achievement for Excellence in Financial Reporting ix Directory of Principal Officials ..........................................................................................................................x Organizational Chart ....................................................................................................................................... xii
Report of Independent Auditor ...........................................................................................................................1 Management’s Discussion and Analysis ............................................................................................................4
CITY OF SUFFOLK, VIRGINIA
TABLE OF CONTENTS (continued)
FINANCIAL SECTION (CONTINUED)
REQUIRED SUPPLEMENTARY INFORMATION (CONTINUED)
Exhibit 15: Schedule of Contributions, City and School Board Pension Plans ..........................................110
Notes to Required Supplementary Information Pension Plans...................................................................111
Exhibit 16: Schedule of Changes in the City's Net OPEB Liability and Related Ratios – City Trust .......112
Exhibit 17: Schedule of Changes in the School Board's Net OPEB Liability (Asset) and Related Ratios –School OPEB Trust ................................................................................................................113
Exhibit 18: Schedule of Contributions – OPEB Plan – City and School Trust .........................................114
Exhibit 19: Schedule of Annual Money Weighted Rate of Return on OPEB Plan Investments – City and School Trust .......................................................................................114
Notes to Required Supplementary Information Plan City and School OPEB Trust ..................................115
Exhibit 20: Schedule of Employer's Proportionate Share of Net OPEB Liability – Line of Duty Act Program (LODA) for the City .................................................................................................116
Exhibit 21: Schedule of Employer's Proportionate Share of Net OPEB Liability – Group Life Insurance (GLI) for the City ....................................................................................................................116
Exhibit 22: Schedule of Employer's Proportionate Share of Net OPEB Liability – Group Life Insurance (GLI) for the School Board .....................................................................................................117
Exhibit 23: Schedule of Employer's Proportionate Share of Net OPEB Liability – Health Insurance Credit Plan (HIC) – School Board Teachers ...........................................................................117
Exhibit 24: Schedule of Employer's Proportionate Share of Net OPEB Liability – Virginia Local Disability Program (VLDP) – School Board Teachers ............................................................................118
Exhibit 25: Schedule of Contributions OPEB – City State VRS Plans .....................................................119
Exhibit 26: Schedule of Contributions OPEB – School Board State VRS Plans ......................................120
Notes to Required Supplementary Information OPEB City and School Board State VRS Plans ..............121
Exhibit 27: Schedule of Changes in the School Board's Net OPEB Liability and Related Ratios –School Board Non-Teacher HIC Single Employer Plan .........................................................122
Exhibit 28: Schedule of Contributions OPEB – School Board Non-Teacher HIC Single Employer Plan123
Notes to Required Supplementary Information OPEB School Board Non-Teacher HIC Plan ..................124
OTHER SUPPLEMENTARY INFORMATION
NON-MAJOR GOVERNMENTAL FUNDS
Exhibit 29: Combining Balance Sheet – Non Major Governmental Funds ...............................................125
Exhibit 30: Combining Statement of Revenues, Expenditures, and Changes in Fund Balances –Non-Major Governmental funds ............................................................................................126
CITY OF SUFFOLK, VIRGINIA
TABLE OF CONTENTS (continued)
FINANCIAL SECTION (CONTINUED)
OTHER SUPPLEMENTARY INFORMATION (CONTINUED)
NON-MAJOR GOVERNMENTAL FUNDS (CONTINUED)
Exhibit 31: Statement of Revenues, Expenditures, and Changes in Fund Balances –Budget and Actual – Budgetary Basis – Debt Service Fund ..................................................127
Exhibit 32: Statement of Revenues, Expenditures and Changes in Fund Balances –Budget and Actual – Budgetary Basis – Special Revenue Funds...........................................128
NON-MAJOR PROPRIETARY FUNDS
Exhibit 33: Combining Statement of Net Position .....................................................................................131 Exhibit 34: Combining Statement of Revenues, Expenses and Changes in Fund Net Position .................132
Exhibit 35: Combining Statement of Cash Flows ......................................................................................133
INTERNAL SERVICE FUNDS
Exhibit 36: Combining Statement of Net Position .....................................................................................134 Exhibit 37: Combining Statement of Revenues, Expenses, and Changes in Fund Net Position ................135 Exhibit 38: Combining Statement of Cash Flows ......................................................................................136
FIDUCIARY NET POSITION
Exhibit 39: Combining Statement of Fiduciary Net Position .....................................................................137 Exhibit 40: Combining Statement of Changes in Fiduciary Net Position ..................................................138
DISCRETELY PRESENTED COMPONENT UNIT – CITY OF SUFFOLK SCHOOL BOARD
Exhibit 41: Combining Balance Sheet........................................................................................................139 Exhibit 42: Combining Statement of Revenues, Expenditures, and Changes in Fund Balances –Governmental Funds................................................................................................................140
Exhibit 43: Budgetary Reconciliation Schedule – Governmental Funds ...................................................141
Exhibit 44: Schedule of Revenues, Expenditures and Changes in Fund Balances – Budget and Actual (Non-GAAP Budgetary Basis) .................................................................................................142
Exhibit 45: Statement of Net Position – OPEB Fund .................................................................................143
Exhibit 46: Statement of Changes in Net Position – OPEB Trust Fund.....................................................144
STATISTICAL SECTION
Table 1 Net Position by Component.......................................................................................................145 Table 2 Changes in Net Position ............................................................................................................146 Table 3 Fund Balances – Governmental Funds ......................................................................................148
CITY OF SUFFOLK, VIRGINIA
TABLE OF CONTENTS (continued)
STATISTICAL SECTION (CONTINUED)
Table 4 Changes in Fund Balances – Governmental Funds ...................................................................149
Table 5 Tax Revenues by Source – Governmental Funds ......................................................................150
Table 6 Assessed Value and Estimated Actual Value of Taxable Property ...........................................151
Table 7 Direct Property Tax Rates .........................................................................................................152
Table 8 Principal Property Tax Payers ...................................................................................................153
Table 9 Property Tax Levies and Collections.........................................................................................154
Table 10 Property Value and Construction ..............................................................................................155
Table 11 Principal Commercial/Industrial Water and Sewer Consumers ................................................156
Table 12 Water and Sewer Rate Schedule................................................................................................157
Table 13 Outstanding Debt by Type.........................................................................................................158
Table 14 Legal Debt Margin ....................................................................................................................159
Table 15 Pledge-Revenue Coverage.........................................................................................................160
Table 16 Demographic and Economic Statistics ......................................................................................161
Table 17 Principal Employers ..................................................................................................................162
Table 18 Full-Time Equivalent City Government Employees by Function/Program ..............................163
Table 19 Operating Indicators by Function/Program ...............................................................................165
Table 20 Capital Asset Statistics by Function/Program ...........................................................................166
COMPLIANCE SECTION
Report of Independent Auditor on Internal Control over Financial Reporting and on Compliance and Other Matters Based on an Audit of Financial Statements Performed in Accordance with Governmental Auditing Standards ........................................................................................................167
Report of Independent Auditor on Compliance for Each Major Program and on Internal Control Over Compliance Required by the Uniform Guidance ..................................................................................169
Schedule of Expenditures of Federal Awards ............................................................................................171
Schedule of Findings and Questioned Costs ..............................................................................................174
INTRODUCTORY SECTION
CITY OF SUFFOLK

P.O. BOX 1858, SUFFOLK, VIRGINIA 23439-1858 PHONE: (757) 514-4012
November 23, 2022
The Honorable Council City of Suffolk, Virginia
Dear Council Members:
We are pleased to submit the Annual Comprehensive Financial Report (ACFR) for the period of July 1, 2021 through June 30, 2022. The code of the Commonwealth of Virginia and the charter of the City of Suffolk, Virginia (the City) require the City to publish, at the close of each fiscal year, a complete set of financial statements presented in conformity with accounting principles generally accepted in the United States of America (GAAP) and audited in accordance with Government Auditing Standards by a firm of licensed certified public accountants. This report has been prepared by the Department of Finance and complies with state law and guidelines of the Auditor of Public Accounts of the Commonwealth of Virginia.
The City’s Management assumes full responsibility for the accuracy, completeness, and reliability of all information presented in this report. We believe the data, as presented, are accurate in all material respects and are presented in a manner designed to fairly set forth the financial position and results of operations of the City as measured by the financial activity of its various funds. All disclosures necessary to enable the reader to gain the maximum understanding of the City’s financial affairs have been included. In order to provide reasonable, but not absolute, assurance regarding the data, the management of the City has designed a framework of internal accounting controls to protect the City’s assets from loss through unauthorized use or disposition, provide reliability of financial records for preparing financial statements and maintain the accountability of assets.
The concept of reasonable assurance recognizes that the cost of a control should not exceed the benefits likely to be derived and that the valuation of costs and benefits requires estimates and judgments by management. We assert to the best of our knowledge this ACFR is complete and reliable in all material aspects.
According to Section 8.08 of the City Charter and Section 15.2-2511 of the 1950 Code of Virginia, as amended, an annual audit by an independent auditor of the City is required. The City’s financial statements have been audited by Cherry Bekaert LLP As a result of an audit of the City’s financial records and transactions of all funds, component units, and departments of the City, Cherry Bekaert LLP has concluded that the financial statements are in compliance with GAAP and has issued an unmodified opinion of the City’s financial statements, as of and for the year ended June 30, 2022. The report of the independent auditor is presented as the first component of the financial section of this report.
i
` CITY MANAGER
The audit included and was part of a broader federally mandated “Single Audit” designed to meet the special needs of federal grants. The standards governing single audit engagements require the independent auditor to report not only on the fair presentation of the financial statements, but also on the City’s internal controls and compliance with legal requirements, with special emphasis on those involving the administration of federal awards. The analysis by the auditors will be a separately issued report.
GAAP requires management to provide a narrative introduction, overview, and analysis to accompany the basic financial statements in the form of a Management’s Discussion and Analysis (MD&A). This letter of transmittal is designed to complement the MD&A and should be read in conjunction with it. The City’s MD&A can be found within the financial section immediately following the independent auditor’s opinion.
Profile of the City
The present City of Suffolk was formed January 1, 1974, from the consolidation of the City of Suffolk and the City of Nansemond (formerly Nansemond County). The City is Virginia’s largest city in land area and one of the top fifteen largest cities in land area in the nation with over 400 square miles of land mass and 30 square miles of waterways. The diverse landscape includes a mix of rural, suburban and urban development areas. The City is situated in the western portion of Hampton Roads, Virginia’s coastal plain area, and is bounded by the James River to the north, the Cities of Chesapeake and Portsmouth to the east, the State of North Carolina to the south, and the Counties of Southampton and Isle of Wight to the west. The City of Suffolk is one of seven major cities that form the Norfolk-Virginia Beach-Newport News metropolitan area with 1.7 million people. This region is also known as the Hampton Roads area.
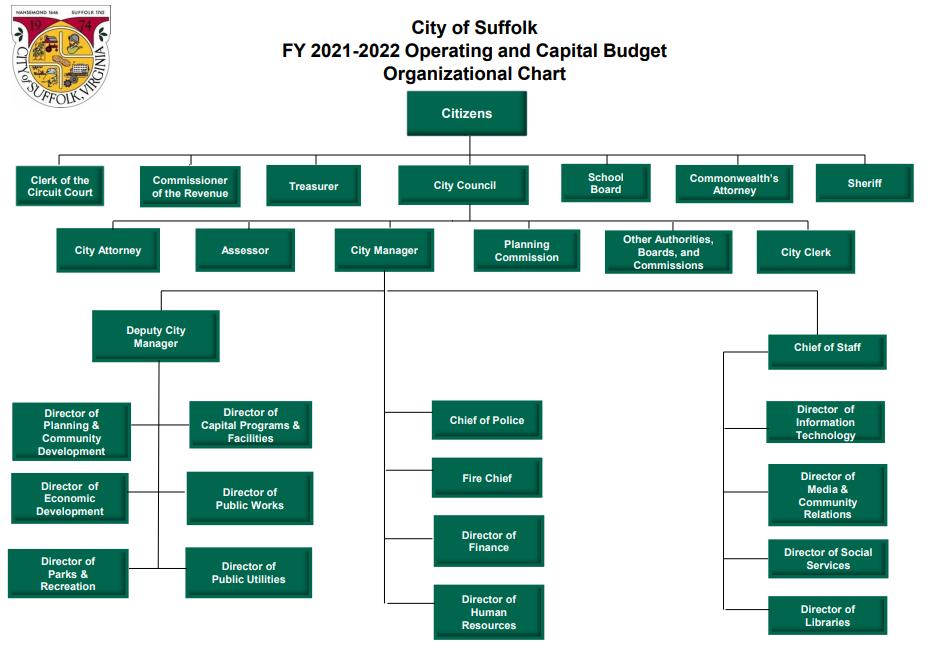
The City’s government is organized under the Council-Manager form of government. The governing body, the City Council, is composed of seven members and a Mayor who develop policies for the administration of the City. The Mayor is elected at large and the Council members are elected by borough in a city-wide election every other year with terms of office being four years. The City Council appoints a City Manager to act as administrative head of the City. The City Manager serves at the pleasure of City Council and carries out the City Council’s policies and directs business procedures. The City Manager also appoints and removes the directors of all departments.
The School Board is elected by borough. Under Virginia law, all operations of the School Board are completely independent of the City Council and City Administration. City Council is required to make an annual appropriation to the School Board based upon an approved budget, but has no authority to direct how such appropriation is expended.
As a full-service city, Suffolk provides a broad range of municipal services authorized by statute or charter. Those services include education, public safety, highways and streets, parks and recreation, sanitation, health and social services, public improvements, planning and zoning, public utilities, storm water management and general administrative services.
The funds and entities included in the City’s ACFR are those controlled by, or dependent on, the City. This determination is explained in Note 1A within the Notes to Financial Statements tab. Consequently, this report includes the public School System and the Economic Development Authority as component units and excludes related organizations such as the Suffolk Redevelopment and Housing Authority, the Western Tidewater Regional Jail Authority, and the Western Tidewater Water Authority.
ii
The City maintains budgetary controls, the objective of which is to ensure compliance with the legal provisions embodied in the annual appropriated budget approved by City Council. Budgetary control is maintained at the expenditure level of each department using an encumbrance accounting system. Open encumbrances are reported within the appropriate classification of fund balance at June 30, 2022 A description of the procedures utilized to establish budgetary data is presented in Note 1D within the Notes to Financial Statements tab.
Economic Activity – Calendar Year 2021
The City of Suffolk experienced another strong year of economic growth in 2021. New and existing retailers grew, relocated, and improved their operations, while animal clinics expanded, and the construction industry was in high demand. Local businesses benefitted directly from innovative workforce development programs, and the expansion of multiple child care facilities allowed parents to return to the workforce.
With a growing population, the demand for medical services has continued to increase in Suffolk as well. One of the many new additions in 2021 included a new medical office building in the Harbour View area of Suffolk. The TPMG ENT (ear, nose, and throat) Specialist group constructed a 7,000 square foot building for their practice. Regional healthcare leader Sentara Healthcare also continued to invest in their existing medical campuses, including Sentara Obici Hospital and Sentara Belleharbour, spending $9 million in the process. Bayview Physicians and Bon Secours also invested heavily into improving their medical services.
Several veterinarian businesses also improved facilities over the last year. Academy Animal Care added 1,500 square feet to their veterinary clinic. The COVE (Center of Veterinary Expertise) leased an additional 8,100 square feet and added new positions to their staff. Tidewater Animal Clinic designed and built a new 6,000 square foot facility with a modern surgery suite, dental suite, and ultrasound/radiograph room.
More than five million square feet of real estate is expected to come online in the coming years due to abundant e-commerce demand boosting Suffolk’s warehousing and industrial market. The rapid increase in e-commerce activity has boosted demand for distribution space in Suffolk due to the City’s close proximity to the port and convenient access to interstate highways and railroads. Most notably, the Amazon robotics fulfillment center, located in Northgate Commerce Park, opened in the summer of 2022. The 3,800,000 square foot building will create roughly 1,700 jobs for the area.
Growing construction demand allowed three large firms in construction and site development to expand their footprint in the area. VirginiaCarolina Civil, which specializes in pre-construction planning, budgeting, estimating, general contracting, subcontracting, and site development, added 25 new jobs impacting 9,200 square feet, and invested $4,000,000 with a newly constructed headquarters building. Branch Civil, an employee owned company specializing in site development, highway construction, and design-build operations, added 18 new jobs and built a 9,600 square foot operations center, an investment of $2,100,000. Atlantic Constructors, Inc. (ACI), a leader in services including structural steel, HVAC, plumbing, fire alarm and protection, and more, retrofitted an existing facility in Suffolk Industrial Park, adding 22 new jobs, and impacting 39,000 square feet, a $400,000 investment.
The need for a dedicated, skilled workforce is a key component in the success of businesses across every industry sector. To support the local workforce, the City of Suffolk’s Suffolk Workforce Development Center provides workforce assistance to Suffolk businesses. Several local employers have adopted creative and innovative workforce programs in order to develop their future pipelines of talent. Allfirst, an
iii
industrial general contractor, continues to manage an in-house apprenticeship program which teaches skills such as welding and pipefitting. Companies including Solenis and Amadas have worked with Suffolk Public Schools’ CTE (Careers and Technical Education) and Camp Community College to place interns in positions that are suited to their interests, and upon completion of the internship are able to offer them permanent full-time employment.
Suffolk has seen a recent influx of mixed-use developments (MUD), including Bridgeport, Peanut Crossing, Obici Place, and The Point at Harbour View. These developments offer a central location to live, work, eat, and play. With apartment homes often built above office space, medical facilities, retail and dining options, mixed-use developments can be a one-stop shop in driving the economy in Suffolk. These developments also serve as a safe place for recreation, commonly providing walking paths, dog parks, and space for nature appreciation, such as gardens.
Small businesses in Suffolk have rebounded from the effects of the pandemic, with citizens supporting the “Love Local, Buy Suffolk” motto. Local retail establishments have added over 160 new jobs, and impacted nearly 104,000 square feet in the past year, totaling a capital investment of $18,680,000. Downtown Suffolk has been catching the attention of small businesses. With new marketing efforts, a trendy new logo available for businesses to use, and frequent, successful events, Downtown Suffolk has seen recent growth in population and businesses, alike. The Downtown area has been abuzz with new construction, new businesses filling available space, and existing businesses completing façade improvements and restoration. Peanut Crossing, a new housing development in Downtown, came online in 2021, offering upscale living options, creative workspaces, and flexible storage. The plan for a new Downtown Festival Event Space, funded through the city’s Capital Improvement Plan, was unveiled to serve as a catalyst to support more activity Downtown. Plans are also in the works to build a new Central Library Downtown.
Altogether, 2021 proved to be a year of success for Suffolk businesses. Capital investments totaled over $185.6 million, 1,086 jobs were created, and more than 2.85 million square feet were impacted in Suffolk throughout the year. New and
Source: City of Suffolk, Virginia, Department of Economic Development
iv
Number of Jobs Square Feet Approximate Capital Investment Advanced Manufacturing 110 186,620 $15,950,000 Warehousing & Distribution 475 2,479,552 130,004,000 Medical 308 54,946 14,410,000 Retail 162 103,994 18,680,000 Office & Administration 26 14,790 2,018,000 Modeling & Simulation 5 10,233 4,075,000 Hospitality & Other
TOTAL
$185,657,000
Expanding Industry (Calendar Year 2021)
- - 520,000
1,086 2,850,135
In addition to the growth of new and expanding businesses, Suffolk has continued to experience sustained population growth. Suffolk’s population increased to 96,130 residents in 2021, a 13.6% increase since 2010. The City leads the region in population growth among the seven major cities in Hampton Roads. This positive trend is anticipated to continue in the years ahead with the City reaching 112,920 residents by 2030, according to projections by the Weldon Cooper Center at the University of Virginia.
City 2010 Census 2021
Percent Change (2010 -2021)
Suffolk 84,585 96,130 13.6%
Chesapeake 222,209 250,256 12 6% Virginia Beach 437,994 458,028 4.6% Portsmouth 95,535 97,883 2.5% Newport News 180,966 185,082 2.3% Hampton 137,467 136,581 -0.6% Norfolk 242,803 238,102 -1.9%
Source: Weldon Cooper Center for Public Service, Population Estimates.
Hampton Roads Population by City 2010 - 2021
16.0%
14.0%
12.0%
10.0%
8.0%
6.0%
4.0%
2.0%
0.0%
-2.0%
Suffolk Chesapeake Virginia Beach Portsmouth Newport News Hampton Norfolk -4.0%
Source: Weldon Cooper Center for Public Service, Population Estimates.
v
Suffolk Population Growth and Projections
120,000
110,000
100,000
90,000
80,000
130,000 2010 2020 2030 2040
Source: Weldon Cooper Center for Public Service, Population Estimates
The City of Suffolk also has the second highest median household income (MHI) in the region ($79,899) and higher than the state ($76,398) and national ($64,994) MHI
Strategic planning, key location, a highly-trained workforce and business-friendly environment once again catapulted Suffolk to the enviable position of one of the fastest growing cities in Virginia and a top pick for business development The residential growth and change in Suffolk require the City to be proactive in planning for its future to insure efficient and effective delivery of services and a high quality of life for its citizens. Through the proficient management of residential and commercial development, the City continues to offer families and businesses plenty of room to live, work and play.
Long-term Financial Planning
City Council and City Management maintain their visionary process in their commitment to planning for the future of the City. Through a series of retreats and work sessions, City Council has established priorities as the guiding principles to move the City into the twenty-first century and to develop partnerships to further the City’s objectives. Financial planning is further extended with the aid of financial advisors for bond issues and rate consultants for utility rate analysis.
In planning for the specific initiatives under these priorities, the City’s adopted ten-year Capital Improvements Plan represents a planned schedule of the City’s needed expenditures for physical improvements over the next decade. The Capital Improvements Plan, which covers the ten-year period from fiscal year 2023 through fiscal year 2032, totals approximately $975.1 million. Of this amount, utilities, stormwater, fleet, and information technology projects are estimated at $211.0 million while general government projects are estimated at $764.0 million.
Financial policies are vital in maintaining consistency and focus. One of the financial policies continually reviewed is that of fund balance levels. The ratio of unassigned General Fund balance as a percentage of budgeted governmental funds expenditures (net of the general fund contribution to the Schools, transfers to other governmental funds, and Capital Projects fund expenditures), plus the budgeted expenditures in the School Operating and Food Service Funds, indicates the ability of the City to cope with unexpected financial challenges or emergencies. The policy also states that any surplus amounts over 20% will be put into a budget stabilization fund until it reaches 2.5% based on the same ratio and the remaining will go to
vi
a capital reserve fund. The City has set the unassigned fund balance percentage at 20%. At June 30, 2022, the fund balance ratio exceeded the target. The City was also able to establish the budget stabilization fund at 2.5% and has put $21.9 million in the capital reserve fund.
Financial policies were developed for the Utility Fund which provided for written documentation of many sound business practices. Categories include financial independence, target percentage for unrestricted cash and long term investments, debt service coverage ratios, plus policies for asset replacement and system extension. The Utility Fund is further governed by revenue bond Master Trust Indenture requirements.
Awards and Recognition
Bond Ratings – Maintain rating of AAA
In August 2022, the City’s bond ratings were reaffirmed by all three rating agencies: Moody’s (Aaa), Fitch Rating Agency (AAA), and Standard and Poor’s (AAA). These ratings reflect the City’s commitment to strong financial management.
Annual Comprehensive Financial Report
The Government Finance Officers Association of the United States and Canada (GFOA) awarded a Certificate of Achievement for Excellence in Financial Reporting (Certificate) to the City of Suffolk, Virginia for its annual comprehensive financial report for the fiscal year ended June 30, 2021, representing the 37th consecutive year that the City has received this award. The Certificate is a prestigious national award recognizing conformance with the highest standards for preparation of state and local government financial reports.
In order to be awarded a Certificate, a governmental unit must publish an easily readable and efficiently organized comprehensive annual financial report, whose contents conform to program standards. Such reports must satisfy both accounting principles generally accepted in the United States of America and applicable legal requirements.
Citizen Reporting
The City of Suffolk received the GFOA Award for Outstanding Achievement in Popular Annual Financial Reporting for its Popular Annual Financial Report (PAFR) for fiscal year ended June 30, 2020 This is the sixth year that the City received the award. The report provides an overview of the City’s financial results and is designed to increase awareness throughout the community of the City’s financial operations in a user-friendly manner. The information is derived from the audited financial statements in the City’s 2020 Annual Comprehensive Financial Report
Annual Budget
The GFOA presented a Distinguished Budget Presentation Award to the City of Suffolk, Virginia for its annual budget for the fiscal year beginning July 1, 2021. In order to receive this award, a governmental unit must publish a budget document that meets program criteria as a policy document, as an operations guide, as a financial plan, and as a communications device. This is the twelfth consecutive year for this recognition and it is valid for a one-year period.
vii
ix
CITY OF SUFFOLK, VIRGINIA
DIRECTORY OF PRINCIPAL OFFICIALS
As of June 30, 2022
MEMBERS OF CITY COUNCIL
Michael D. Duman … …………….……...…Mayor Leroy Bennett……….……………………………………………………………………….…………..Vice Mayor Shelley Butler Barlow...………………………………………….…………..………………..City Council Member
Roger W. Fawcett ….…………………………………………………….……………………City Council Member Timothy J. Johnson ……………..City Council Member Donald Z. Goldberg…………………………………………………….……….…………….City Council Member Lue R. Ward, Jr. ……………………………………………….……………….……………..City Council Member Leotis L. Williams ………………………………………….…………………………………City Council Member
CONSTITUTIONAL OFFICERS
Everett C. Harris……………………………………… ..……..…………………….…………………….…Sheriff Narendra Pleas………………………………….……..……………….……………..…Commonwealth’s Attorney Susan L. Draper……..……………………………………………………………….Commissioner of the Revenue Ronald H. Williams……………………………….………………………………………………………..Treasurer W. Randolph Carter, Jr. ..……………………….…………………………………….......Clerk of the Circuit Court
CITY ADMINISTRATION
Albert S. Moor, II……………………………….………………………….……….………………… City Manager Kevin Hughes ………………………………………….………………….……….…. ………Deputy City Manager Azeez Felder …………………………………………………………….….…………………Deputy City Manager
William Hutchings City Attorney Holt Butt …. …………………………………………………………………….……………………. City Assessor Erika S. Dawley City Clerk
Gerry Jones Capital Programs and Buildings
Richard L. Stephens Deputy Emergency Management Coordinator Dr. Nancy Welch Health Clint Rudy Library Tim Kelley ….. Media and Community Relations Scott Mills – Acting Director ……… Planning and Community Development Robert Lewis Public Works
Tealen Hansen …………………..………………………………………………………….………………. Finance
Michael Barakey.. Fire and Rescue Robin Wynn ………………………. Human Resources Alfred Chandler ………………
Police Mark Furlo…. Parks and Recreation Paul Retel …………………
Public Utilities Harry Cromer Social Services
Regina Chandler – Acting Director ……………………………………………………….. Information Technology
x
…….……………………………….………………………………………...
……………………………………………………….………………...
CITY OF SUFFOLK, VIRGINIA
DIRECTORY OF PRINCIPAL OFFICIALS (continued)
As of June 30, 2022
SUFFOLK PUBLIC SCHOOLS – SCHOOL BOARD
Dr. Judith Brooks-Buck ….………………………………………….………………………………...…..Chairman Phyllis C. Byrum …….…..………………………...……………………….…………………..…….Vice Chairman
Karen L. Jenkins …………...…….Board Member
Lorita W. Mayo …………..Board Member Heather S. Howell… ……Board Member
Tyron D. Riddick… …………….Board Member Sherri D. Story…… ……………….Board Member
SUFFOLK PUBLIC SCHOOLS – ADMINISTRATION
Dr. John B. Gordon III..…………………………………….……….……………………….School Superintendent Wendy Forsman……………………………………………………..………………..Executive Director of Finance
xi
xii
FINANCIAL SECTION
Report of Independent Auditor
To the City Council City of Suffolk, Virginia
Report on the Audit of the Financial Statements
Opinions
We have audited the accompanying financial statements of the governmental activities, the business-type activities, the aggregate discretely presented component units, each major fund, and the aggregate remaining fund information of the City of Suffolk, Virginia (the “City”), as of and for the year ended June 30, 2022, and the related notes to the financial statements, which collectively comprise the City’s basic financial statements as listed in the table of contents.
In our opinion, the financial statements referred to above present fairly, in all material respects, the respective financial position of the governmental activities, the business-type activities, the aggregate discretely presented component units, each major fund, and the aggregate remaining fund information of the City, as of June 30, 2022, and the respective changes in financial position, and, where applicable, cash flows thereof, for the year then ended in accordance with accounting principles generally accepted in the United States of America.

Basis for Opinions
We conducted our audit in accordance with auditing standards generally accepted in the United States of America, the standards applicable to financial audits contained in Government Auditing Standards, issued by the Comptroller General of the United States, and the Specifications for Audits of Counties, Cities, and Towns, issued by the Auditor of Public Accounts of the Commonwealth of Virginia (the “Specifications”). Our responsibilities under those standards and specifications are further described in the Auditor’s Responsibilities for the Audit of the Financial Statements section of our report. We are required to be independent of the City and to meet our other ethical responsibilities, in accordance with the relevant ethical requirements relating to our audit. We believe that the audit evidence we have obtained is sufficient and appropriate to provide a basis for our audit opinions.
EmphasisofMatter
Change in Accounting Principle
As discussed in Note 17 to the financial statements, the City adopted the provisions of Governmental Accounting Standards Board Statement 87, Leases, effective July 1, 2021. As a result, related governmental activities, business-type activities, and enterprise funds net position, capital assets and liabilities have been restated. Our opinions are not modified with respect to this matter.
Responsibilities of Management for the Financial Statements
Management is responsible for the preparation and fair presentation of the financial statements in accordance with accounting principles generally accepted in the United States of America, and for the design, implementation, and maintenance of internal control relevant to the preparation and fair presentation of financial statements that are free from material misstatement, whether due to fraud or error.
In preparing the financial statements, management is required to evaluate whether there are conditions or events, considered in the aggregate, that raise substantial doubt about the City’s ability to continue as a going concern for twelve months beyond the financial statement date, including any currently known information that may raise substantial doubt shortly thereafter.
cbh.com 1
Auditor’s Responsibilities for the Audit of the Financial Statements
Our objectives are to obtain reasonable assurance about whether the financial statements as a whole are free from material misstatement, whether due to fraud or error, and to issue an auditor’s report that includes our opinions. Reasonable assurance is a high level of assurance but is not absolute assurance and, therefore, is not a guarantee that an audit conducted in accordance with generally accepted auditing standards, Government Auditing Standards, and the Specifications will always detect a material misstatement when it exists. The risk of not detecting a material misstatement resulting from fraud is higher than for one resulting from error, as fraud may involve collusion, forgery, intentional omissions, misrepresentations, or the override of internal control. Misstatements are considered material if there is a substantial likelihood that, individually or in the aggregate, they would influence the judgment made by a reasonable user based on the financial statements
In performing an audit in accordance with generally accepted auditing standards, Government Auditing Standards, and the Specifications, we:
Exercise professional judgment and maintain professional skepticism throughout the audit.
Identify and assess the risks of material misstatement of the financial statements, whether due to fraud or error, and design and perform audit procedures responsive to those risks. Such procedures include examining, on a test basis, evidence regarding the amounts and disclosures in the financial statements.
Obtain an understanding of internal control relevant to the audit in order to design audit procedures that are appropriate in the circumstances, but not for the purpose of expressing an opinion on the effectiveness of the City’s internal control. Accordingly, no such opinion is expressed.
Evaluate the appropriateness of accounting policies used and the reasonableness of significant accounting estimates made by management, as well as evaluate the overall presentation of the financial statements.
Conclude whether, in our judgment, there are conditions or events, considered in the aggregate, that raise substantial doubt about the City’s ability to continue as a going concern for a reasonable period of time.
We are required to communicate with those charged with governance regarding, among other matters, the planned scope and timing of the audit, significant audit findings, and certain internal control related matters that we identified during the audit.
Required Supplementary Information
Accounting principles generally accepted in the United States of America require that the management’s discussion and analysis and the schedules of required supplementary information, as listed in the table of contents, be presented to supplement the basic financial statements. Such information is the responsibility of management and, although not a part of the basic financial statements, is required by the Governmental Accounting Standards Board who considers it to be an essential part of financial reporting for placing the basic financial statements in an appropriate operational, economic, or historical context. We have applied certain limited procedures to the required supplementary information in accordance with auditing standards generally accepted in the United States of America, which consisted of inquiries of management about the methods of preparing the information and comparing the information for consistency with management’s responses to our inquiries, the basic financial statements, and other knowledge we obtained during our audit of the basic financial statements. We do not express an opinion or provide any assurance on the information because the limited procedures do not provide us with sufficient evidence to express an opinion or provide any assurance.
2
Other Supplementary Information

Our audit was conducted for the purpose of forming opinions on the financial statements that collectively comprise the City’s basic financial statements. The accompanying Other Supplementary Information, as listed in the table of contents, and the Schedule of Expenditures of Federal Awards, as required by Title 2 U.S. Code of Federal Regulations Part 200, Uniform Administrative Requirements, Cost Principles, and Audit Requirements for Federal Awards, are presented for purposes of additional analysis and are not a required part of the basic financial statements. Such information is the responsibility of management and was derived from and relates directly to the underlying accounting and other records used to prepare the basic financial statements. The information has been subjected to the auditing procedures applied in the audit of the basic financial statements and certain additional procedures, including comparing and reconciling such information directly to the underlying accounting and other records used to prepare the basic financial statements or to the basic financial statements themselves, and other additional procedures in accordance with auditing standards generally accepted in the United States of America. In our opinion, the Other Supplementary Information and the Schedule of Expenditures of Federal Awards are fairly stated, in all material respects, in relation to the basic financial statements as a whole.
Other Information
Management is responsible for the other information included in the annual report. The other information comprises the Introductory and Statistical sections, as listed in the table of contents, but does not include the basic financial statements and our auditor’s report thereon. Our opinions on the basic financial statements do not cover the other information, and we do not express an opinion or any form of assurance thereon.
In connection with our audit of the basic financial statements, our responsibility is to read the other information and consider whether a material inconsistency exists between the other information and the basic financial statements, or the other information otherwise appears to be materially misstated. If, based on the work performed, we conclude that an uncorrected material misstatement of the other information exists, we are required to describe it in our report.
Other Reporting Required by Government Auditing Standards
In accordance with Government Auditing Standards, we have also issued our report dated November 23, 2022, on our consideration of the City’s internal control over financial reporting and on our tests of its compliance with certain provisions of laws, regulations, contracts, and grant agreements and other matters. The purpose of that report is solely to describe the scope of our testing of internal control over financial reporting and compliance and the results of that testing, and not to provide an opinion on the effectiveness of the City’s internal control over financial reporting or on compliance. That report is an integral part of an audit performed in accordance with Government Auditing Standards in considering the City’s internal control over financial reporting and compliance.
Virginia Beach, Virginia
November 23, 2022
3
DISCUSSION
AND ANALYSIS
The Management of the City of Suffolk, Virginia (the “City”) presents this narrative discussion and analysis of the City’s financial performance during the fiscal year ended June 30, 2022. To enhance your understanding of the City’s financial performance, please read this discussion and analysis in conjunction with the transmittal letter in the front of this report, the City’s basic financial statements, and supporting notes following this section.
FINANCIAL HIGHLIGHTS
The government-wide financial statements report information about the City as a whole using the economic resources measurement focus and accrual basis of accounting.
• The City’s total net position (assets and deferred outflows of resources less liabilities and deferred inflows of resources) on a government-wide basis was $655.8 million at June 30, 2022. Of this balance, $472.4 million is attributed to the governmental activities and $183.4 million to the business-type activities.
• For fiscal year 2022, taxes, other general revenues net of transfers of the City’s governmental activities amounted to $244.8 million and net program expenses $190.7 million, which resulted in an increase from 2021 in net position for the City’s governmental activities of $54.1 million.
• Revenues of the City’s business-type activities were $84.2 million, expenses were $68.5 million and net transfers to the General Fund were $1.1 million, which resulted in an increase of net position for the City’s business-type activities of $14.6 million.
• The City is rated AAA with Fitch, Standard and Poor’s and Moody’s.
OVERVIEW OF THE FINANCIAL STATEMENTS
This discussion and analysis is intended to serve as an introduction to the City’s basic financial statements. The financial section of this report includes management’s discussion and analysis, the basic financial statements, and required supplementary information. The City’s basic financial statements comprise three components: 1) Government-wide financial statements, 2) Fund financial statements, and 3) Notes to the financial statements. This report also contains other supplementary information in addition to the basic financial statements.
The City’s financial statements present two kinds of statements, each with a different measurement focus and basis of accounting. The government-wide statements (economic resources measurement focus and accrual basis of accounting) provide both long and short term information about the City’s overall financial status. The fund financial statements (current financial resources measurement focus and modified accrual basis of accounting) focus on the individual functions of the city government, reporting the City’s operations in more detail then the government-wide statements. Both perspectives allow the user to address relevant questions, broaden the basis of comparison and enhance the City’s accountability.
MANAGEMENT’S
4
Government-wide Financial Statements
The government-wide financial statements are designed to provide the readers with a broad overview of the City’s finances in a manner similar to a private-sector business. These statements include all of the City’s assets, deferred outflows of resources, liabilities and deferred inflows of resources reported using the accrual basis of accounting. Government-wide financial reporting consists of two statements: The Statement of Net Position and the Statement of Activities.
The Statement of Net Position presents information on all City assets and deferred outflows of resources, and liabilities and deferred inflows of resources, with the difference reported as net position. Net position is one way to measure the City’s financial health, or financial position. Over time, increases or decreases in net position may serve as a useful indicator of whether the financial position of the City is improving or deteriorating.
The Statement of Activities presents information identifying how net position changed during the most recent fiscal year. All changes in net position are reported as soon as the underlying event giving rise to the change occurs, regardless of the timing of related cash flows. Thus, some items of revenues and expenses are reported in this statement that will result in cash flows in future fiscal periods.
In the Statement of Net Position and the Statement of Activities, the City is divided into the following categories:
• Governmental Activities – Most of the City’s basic services are reported here including general government, public safety, public works, education, health and welfare, parks and recreation and economic and community development. Government activities are financed primarily through property taxes, other taxes and state and federal grants.
• Business-type Activities – The City’s water and sewer services are reported here as well as the City’s stormwater utility, and the refuse collection service. These services are supported by charges for services based on use.
• Component Units – The City includes two separate legal entities in its report – the Suffolk School Board and the Economic Development Authority of the City of Suffolk. While legally separate, the City is financially accountable and provides operating and capital funding to these component units.
Fund Financial Statements
Fund financial statements provide more detailed information about the City’s most significant funds. Funds are groupings of related accounts that are used to maintain control over resources that have been segregated for specific activities or objectives. The City, like other state and local governments, uses fund accounting to ensure and demonstrate finance-related legal compliance. Traditional users of government financial statements will find the fund financial statement presentation more familiar. The focus is now on the City’s most significant funds. The fund financial statements are divided into three categories: governmental funds, proprietary funds and fiduciary funds.
Governmental funds – Governmental funds are used to account for essentially the same functions reported as governmental activities in the government-wide financial statements. However, unlike the government-wide financial statements, governmental fund financial statements focus on current sources and uses of spendable resources, as well as on balances of spendable resources available at the end of the fiscal year. Such information may be useful in evaluating a government’s near-term financing requirements.
Because the focus of governmental funds is narrower than that of the government-wide financial statements, it is useful to compare the information presented for governmental funds with similar information presented for
5
governmental activities in the government-wide financial statements. By doing so, readers may better understand the long-term impact of the government’s near-term financing decisions. Since this presentation does not include the long term focus of the government-wide statements, both the governmental fund Balance Sheet and the governmental fund Statement of Revenues, Expenditures, and Changes in Fund Balance provide a reconciliation to facilitate this comparison between governmental funds and governmental activities. The fund financial statements using the current financial resources measurement focus will show bond proceeds and interfund transfers as other financing sources, in addition capital outlay and bond principal payments will be shown as expenditures. The reconciliation between the fund statements and the government-wide statements will eliminate these transactions and incorporate capital assets and long term debt obligations in to the governmental activities column in the government-wide statements.
The City maintains several individual governmental funds. Information is presented separately in the governmental funds’ statements for the General, Capital Projects, Road Maintenance, Grants and Debt Service funds. Data from the other governmental funds are combined into a single, aggregated presentation. Individual fund data for each of these non-major governmental funds is provided in the form of combining statements elsewhere in this report.
Proprietary Funds – Services for which the City charges customers a fee are generally reported in proprietary funds. Proprietary funds statements, like the government-wide statements; provide both short- and long-term financial information. The City maintains two different types of proprietary funds.
Enterprise funds are used to report the same functions presented as business-type activities in the government-wide financial statements, and provide more detail and additional information, such as a cash flow statement. The City uses enterprise funds to account for its water and sewer operations, the activities of the stormwater utility fund, and the refuse collection services.
Internal Service funds are an accounting mechanism used to accumulate and allocate costs internally among the City’s various functions. The City uses internal service funds to account for its fleet management, information technology and insurance programs.
Fiduciary Funds – The fiduciary funds consist of custodial funds that are used to account for resources held for the benefit of parties outside the government. Custodial funds are not reflected in the government-wide financial statements because the resources of those funds are not available to support the City’s programs. The accounting used for custodial funds is similar to that of the proprietary funds. The OPEB trust fund is also reported as a fiduciary fund.
Notes to the Financial Statements – Included as part of the basic financial statements, the notes provide additional information that is essential to a full understanding of the data provided in the government-wide and fund financial statements. The notes to the financial statements can be found at the end of the Basic Financial Statements section of this report.
Required Supplementary Information – In addition to the basic financial statements and notes, this section presents budgetary comparison schedules, a schedule of funding progress for defined benefit pension plan and an analysis of funding progress for other postemployment benefits.
Other Supplementary Information – This section of the report presents combining and individual fund statements and schedules.
6
Statement of Net Position
The following table reflects the condensed Statement of Net Position: 20222021*20222021*20222021*
Net Position (In Millions) Governmental Activities Business-type Activities Total
Current and other assets 325.3 $ 271.5 $ 96.1 $ 93.8 $ 421.4 $ 365.3 $ Capital and other non-current assets 576.4 568.3 465.1 467.3 1,041.5 1,035.6 Total assets 901.7 839.8 561.2 561.1 1,462.9 1,400.9
Deferred Outflows of Resources 36.8 40.8 26.5 28.9 63.3 69.7
Current and other liabilities 44.4 38.8 6.7 6.4 51.1 45.2 Long-term liabilities 367.1 409.8 391.3 414.7 758.4 824.5 Total liabilities 411.5 448.6 398.0 421.1 809.5 869.7
Deferred Inflows of Resources 54.6 13.7 6.4 0.2 61.0 13.9
Net position:
Net investment in capital assets 325.9 319.4 128.9 111.4 454.8 430.8 Restricted 28.4 12.2 2.7 2.6 31.1 14.8 Unrestricted 118.1 86.7 51.7 54.7 169.8 141.4 Net position 472.4 $ 418.3 $ 183.3 $ 168.7 $ 655.7 $ 587.0 $
*FY2021 Net position restated relating to the implementation of GASB 87
The City’s combined net position (which is the City’s “bottom line”) increased by $68.7 million in fiscal year 2022 of which approximately 4.74% represents resources that are subject to external restrictions or enabling legislation. Net investment in capital assets (land, buildings, infrastructure, improvements, machinery and equipment, less accumulated depreciation and related outstanding debt used to acquire those assets) of $454.8 million comprises 69.36% of the net position. These assets are not available for future spending because they are assets used to provide services to citizens.
The City has a solid financial position with 25.90% of net position, or $169.8 million, as unrestricted. The unrestricted portion of net position is available to allow the City to provide services to citizens.
GOVERNMENT-WIDE FINANCIAL
ANALYSIS
7
Statement of Activities
Change in Net Position
(In Millions)
Governmental Activities Business-type Activities Total
The following table summarizes the changes in net position for governmental and business-type activities: 202220212022202120222021
Reve nues:
Program revenues:
Charges for services 10.6 $ 8.4 $ 77.9 $ 78.8 $ 88.5 $ 87.2 $
Operating grants and contributions 57.5 54.0 - - 57.5 54.0 Capital grants and contributions 25.2 3.8 5.3 5.5 30.5 9.3
General revenues: -
Real estate and property taxes 161.2 146.7 - - 161.2 146.7
Other taxes 61.4 53.1 - - 61.4 53.1 Grants and contributions, not restricted 14.4 14.5 - - 14.4 14.5 Unrestricted investment earnings 1.5 1.7 0.1 0.2 1.6 1.9 Miscellaneous 5.8 5.2 0.9 1.2 6.7 6.4
Total revenues 337.6 287.4 84.2 85.7 421.8 373.1
Expenses:
General government 27.9 40.0 - - 27.9 40.0 Judicial 10.5 10.9 - - 10.5 10.9 Public safety 72.9 69.0 - - 72.9 69.0 Public works 61.0 44.4 - - 61.0 44.4 Health and welfare 14.7 15.1 - - 14.7 15.1 Transportation 1.6 1.4 - - 1.6 1.4 Education 65.4 65.5 - - 65.4 65.5 Parks, recreation, cultural 12.3 12.1 - - 12.3 12.1 Community development 9.3 8.2 - - 9.3 8.2 Interest on long-term debt 8.5 6.9 - - 8.5 6.9
Utility - - 54.0 56.0 54.0 56.0 Refuse collection services - - 9.4 9.6 9.4 9.6
Stormwater utility - - 5.1 5.0 5.1 5.0
Total expenses 284.1 273.5 68.5 70.6 352.7 344.1
Excess of revenues over expenses 53.5 13.9 15.7 15.1 69.1 29.0
Loss on disposal of assets (0.5) (2.9) - - (0.5) (2.9)
Transfers 1.1 1.5 (1.1) (1.5) - -
Change in net position 54.1 12.5 14.6 13.6 68.6 26.1
Net position - beginning * 418.3 405.8 168.7 155.1 587.0 560.9
Net position - ending 472.4 $ 418.3 $ 183.3 $ 168.7 $ 655.7 $ 587.0 $
Beginning balance of net position restated related to the implementation of GASB 87.
8
Governmental Activities
Revenue Highlights:
Real estate and personal property tax revenue, the City’s largest revenue source, totaled $161.2 million and $146.7 million in fiscal years 2022 and 2021, respectively. The chart following indicates the growth in the General Property Taxes revenue over the past ten years. The increase in the real estate and personal property taxes over time is due to increase in assessed value of the real and personal property as well as tax increases in FY’s 2012, 2016, 2017, and 2019, there was no tax increase in FY2022. These tax increases were added to fund increases in education as well as public safety. $$20 $40 $60 $80 $100 $120 $140 $160 $180 Millions
General Property Tax Revenue
Source: Comprehensive Annual Financial Reports 2013 - 2022
Other Local Taxes are comprised of revenue from local sales tax, meals, lodging, and utilities increased from fiscal year 2021 into fiscal year 2022. This increase is due to increased sales and meals taxes, while the City did lose revenue due to the worldwide pandemic, there was little effect on sales taxes and the effect on the meals taxes was not as large as originally estimated. The increase is also attributable to increased economic development in the City and increasing population.
Expense Highlights:
The City is committed to ensuring the highest level of safety for its citizens and has expended $72.9 million towards public safety efforts, this represents 25.7% of the governmental expenses.
Education continues to be one of the City’s highest priorities and commitments representing $65.4 million, this amount is an increase from fiscal year 2021 and represents 23.0% of governmental expenses.
Public Safety and Education together make up 48.7% of total governmental expenses for the City.
9
Business-type Activities
The business-type activities are made up of Public Utilities, Stormwater Utilities, and Refuse Collection services.
Revenue Highlights:
Charges for services, including water and sewer fees, Stormwater utility fees and refuse collection fees represent 92.52% of the total revenues collected. These revenues decreased slightly from fiscal year 2021 to 2022 due to normal fluctuations in revenue streams in the utility funds.
Expense Highlights:
Utility Fund expenses were $41.9 million of which 43.3% is depreciation and amortization expenses. There is a slight decrease in total expenditures. Stormwater expenses were $5.1 million for fiscal year 2022, which represents a slight increase in expenditures as compared to fiscal year 2021. The refuse fund expenses were $9.4 million in fiscal year 2022, which is a slight decrease from fiscal year 2021.
FINANCIAL ANALYSIS OF THE CITY’S FUNDS
The City uses fund accounting to ensure and demonstrate compliance with finance-related legal requirements.
Governmental funds: The focus of the City’s governmental funds is to provide information on near-term inflows, outflows, and balances of spendable resources. Such information is useful in assessing the City’s financing requirements. In particular, unassigned fund balance may serve as a useful measure of a government’s net resources available for spending at the end of the fiscal year.
At the end of the current fiscal year, the City’s governmental funds reported combined ending fund balances of $239.0 million. Approximately 39.3% of this amount is available for spending at the government’s discretion (unassigned fund balance). Fund Balance is divided into five classifications: non-spendable, restricted, committed, assigned and unassigned.
General Fund: The General Fund is the chief operating fund of the City. At the end of the current fiscal year, the General Fund balance was $135.5 million of which $93.9 million represents unassigned fund balance. Fund Balance in the General Fund increased from fiscal year 2021. This increase is attributable to better than anticipated collections of real estate taxes and other local taxes such as sales tax and business license taxes.
As a measure of the General Fund’s liquidity, it may be useful to compare both unassigned fund balance and total fund balance to total budgeted expenditures. The City has a financial policy goal that unassigned fund balance should be 20% of the following fiscal years governmental funds budget. The City also has a policy that any excess amounts over the 20% will be dedicated to a budget stabilization fund, until that reaches 2% of the budgeted revenue and then to a capital reserve fund, both of these reserves are reported as committed fund balance. The restricted portion of fund balance, $1.3 million reflects restricted cash for unspent grant funds and developer deposits. The committed portion, $38.3 million, is comprised of funds committed for by the City Council for economic development incentives and cash funded capital, unspent funds re-appropriated to the School board, the budget stabilization funds and the capital reserve funds.
Debt Service Fund: The Debt Service Fund has a fund balance of $492.7 thousand. The General Fund routinely transfers monies to this fund to meet debt service requirements The fund balance in the Debt Service fund remained the same from the prior year.
10
Road Maintenance Fund: The Road Maintenance Fund has a fund balance of $18.6 million. The Road Maintenance Fund accumulates resources from the Virginia Department of Transportation for the maintenance of roadways in the City. The fund balance in the fund increased by $2.7 million from the prior year.
Grants Fund: The grants fund has a fund balance of $2.7 million. the Grants fund accumulates resources from various state and federal agencies in the form of grant for specific purposes. The majority of the activity in the grants fund in fiscal year 2022 was for pandemic response related grants. The fund balance in the grant fund increased by $544 thousand from the prior year.
Capital Projects Fund: The Capital Projects Fund accounts for all construction projects of general public improvements, excluding capital projects related to business-type activities, which are accounted for elsewhere. At the end of the current fiscal year, the fund balance was $70.2 million, $10 million was committed for contracts and purchase orders in process, and the remaining balance of $60.2 million is restricted, as it consists of unspent bond proceeds, grant funding and cash proffers for subsequent years’ projects. The overall fund balance increased in the current year, as there are several large projects that are getting started that have funds accumulated.
Five of the City’s significant capital projects are the following in fiscal year 2022
• School facility major repairs and maintenance
• Shoulders Hill Intersection Improvements
• Reconstruction of Rt. 58/Holland Road
• New Central Library
• New Fire Station
Proprietary funds: The City’s proprietary funds provide the same type of information found in the governmentwide financial statements, but in more detail.
Enterprise funds: The City’s enterprise funds account for its water and sewer operations, stormwater utility efforts, and refuse collection services. The net position of the enterprise funds at the end of the current fiscal year totaled $183.3 million
Internal service funds: The internal service funds are used to account for entity-wide fleet management, information technology and risk management programs. The total net position at the end of the current fiscal year was $39.7 million.
Trust funds: In fiscal year 2022, the City fully funded its annual contribution to the fund as calculated by the actuaries and there is currently a balance of $46.2 million cash and cash equivalents in the OPEB Trust Fund.
CAPITAL ASSETS AND DEBT ADMINISTRATION
Capital Assets: The City’s capital assets for its governmental and business-type activities as of June 30, 2022, totaled $1,039.7 million, net of accumulated depreciation. This investment in capital assets includes land, buildings, improvements other than buildings, infrastructure, machinery and equipment, intangibles, the intangible right to use leased assets, and construction in progress.
11
20222021*20222021*20222021* Land $ 23.6 $ 23.5 4.7 $ $ 4.7 $ 28.3 $ 28.2 Construction in progress 152.4 112.8 18.9 27.0 171.3 139.8 Buildings 83.4 86.4 73.4 72.9 156.8 159.3
Infrastructure 217.2 249.2 - - 217.2 249.2 Improvements other than buildings 39.2 39.4 291.4 289.8 330.6 329.2 Machinery and equipment 32.0 28.4 66.6 60.2 98.6 88.6 Intangible right to use leased assets 22.6 24.7 4.1 5.0 26.7 29.7 Intangibles 4.1 1.7 6.0 7.7 10.1 9.4 Total
*
balances restated
to the
of
87. Capital Assets (net of depreciation) (in Millions) Governmental Activities Business-type Activities Total 308.8 Land 3% Construction in
16% Buildings 15% Infrastructure 21% Improvements other than buildings 32% Machinery and equipment 9% Intangible right to use leased assets 3% Intangibles 1% Capital Assets Additional information on the City’s capital assets can be found in Note 7. 12
$ 574.6 $ 566.1 $ 465.1 $ 467.3 $ 1,039.7 $ 1,033.4
FY2021
related
implemenation
GASB
progress
Long-term debt: At the end of the current fiscal year, the City had total outstanding debt of $710.0 million. Claims payable, compensated absences and pension and OPEB liabilities are not included in these figures.
Outstanding Debt (in millions)
Governmental Activities Business-type Activities Total
20222021*20222021*20222021*
Bonds payable $ 283.8 $ 275.7 $ 367.9 $ 380.0 $ 651.7 $ 655.7
Bond Premiums 17.4 17.8 15.2 18.0 32.6 35.8
Lease Liabilities 21.6 24.7 4.1 5.0 25.7 29.7
Total $ 322.8 $ 318.2 $ 387.2 $ 403.0 $ 710.0 $ 721.2
*FY2021 restated related to implementation of GASB 87
The Commonwealth of Virginia limits the amount of general obligation debt outstanding to 10% of the locality’s assessed value of real property, which is $1.14 billion for 2022. The City Charter further limits this general obligation limit to 7% of the City’s assessed value of real property or $800.4 million. Of the debt shown above, only $441.5 million is general obligation debt that is applicable to the legal debt limits. The City has met both of the legal debt limits.
The City has a financial policy that further restricted the debt ratio of general government debt, not pledged by other revenue sources, to 4% or $457.4 million to reflect its conservative use of borrowed monies. The City has met this policy limit as well. Achieving these limits represents the City’s conservative debt borrowing policy.
Additional information on the City’s long-term debt can be found in Note 9.
ECONOMIC FACTORS
• The City’s economic development initiatives created over 1,086 new jobs and over $185.7 million dollars in new and expanding capital investment in the City during the calendar year 2021.
• For fiscal year 2022, the City’s tax rate was $1.11 per $100 and remains the third lowest tax rate in the region.
• Population in the City has increased 11.18% in the last ten years.
• The City has achieved bond ratings from Moody’s Investor Service of Aaa, and from Fitch Rating Agency and Standard and Poor’s Ratings Services of “AAA”. These ratings reflect the City’s continued commitment to strong financial management.
REQUESTS FOR INFORMATION
This financial report is designed to provide our citizens, taxpayers, customers, and investors and creditors with a general overview of the City’s finances and to demonstrate the City’s accountability for the money it receives. Questions concerning this report or requests for additional information should be directed to the City’s Department of Finance, 442 West Washington Street, Suffolk, Virginia, 23439.
13
BASIC FINANCIAL STATEMENTS
CITY OF SUFFOLK, VIRGINIA
STATEMENT OF NET POSITION June 30, 2022
Primary Government Component Units
Business- Economic Governmental type Development Activities Activities Total School Board Authority
ASSETS
Cash and cash equivalents (Note 2) 208,620,005 $ 55,920,931 $ 264,540,936 $ 23,954,979 $ 6,133,044 $
Cash and cash equivalents, restricted (Note 2) 97,678,663 31,456,942 129,135,605 - 2,123,878
Receivables, net (Note 3) 10,718,597 8,548,082 19,266,679 214,616 30,652
Due from other governments (Note 4) 6,976,113 - 6,976,113 11,589,367 -
Due from component units 636,740 - 636,740 - -
Inventories 705,061 216,413 921,474 501,347 6,609,576
Prepaid items - - - 95,000 -
Net pension asset (Note 11) - - - 3,901,996 -
Net OPEB asset - local trust (Note 12) - - - 12,003,130 -
Net OPEB asset - state plans (Note 13) - - - 30,600 -
Leases receivable 1,876,918 - 1,876,918 - 18,739,387
Capital assets: (Note 7)
Land and construction in progress 176,048,341 23,615,736 199,664,077 6,387,523 1,021,162
Other capital assets, net 375,950,748 437,415,381 813,366,129 156,929,351 18,781,490
Right to use leased assets, net of amortization 22,551,616 4,119,329 26,670,945 - 208,545
Total assets 901,762,802 561,292,814 1,463,055,616 215,607,909 53,647,734
DEFERRED OUTFLOWS OF RESOURCES
Deferred charge on refunding 4,985,446 22,399,624 27,385,070 - 57,892
Deferred outflows related to pension plan (Note 11) 19,357,588 2,912,328 22,269,916 30,279,831 -
Deferred outflows related to OPEB local trust (Note 12) 6,095,316 1,075,643 7,170,959 983,833 -
Deferred outflows related to OPEB state plans (Note 13) 6,314,259 149,491 6,463,750 4,252,948 -
Total deferred outflows of resources 36,752,609 26,537,086 63,289,695 35,516,612 57,892
LIABILITIES
Accounts payable and accrued liabilities 11,043,767 2,556,762 13,600,529 3,514,849 29,681
Accrued payroll and related liabilities 4,090,805 441,274 4,532,079 17,632,045 -
Accrued interest payable 3,475,089 3,383,050 6,858,139 - 14,839
Due to Primary Government - - - 397,485 239,255 Deposits and amounts held for others - - - - 2,500 Unearned revenues (Note 8) 25,750,774 332,011 26,082,785 - -
Long-term liabilities: (Note 9) Due within one year 32,200,707 16,782,812 48,983,519 322,312 1,161,818 Net OPEB liability -- state plans (Note 13) 179,026 - 179,026 -Due in more than one year 301,245,601 371,321,818 672,567,419 2,801,809 3,188,360
Net pension liability (Note 11) 17,824,917 2,682,623 20,507,540 73,840,253 -
Net OPEB liability -- local trust (Note 12) 212,850 37,562 250,412 - -
Net OPEB liability -- state plans (Note 13) 15,488,895 519,712 16,008,607 17,911,008 -
Total liabilities 411,512,431 398,057,624 809,570,055 116,419,761 4,636,453
DEFERRED INFLOWS OF RESOURCES
Prepaid taxes (Note 8) 1,350,840 - 1,350,840 - -
Unearned -- proffers (Note 8) 5,140,053 - 5,140,053 - -
Unearned -- deposits (Note 8) 1,633,311 - 1,633,311 - -
Deferred inflows related to leases 1,879,447 - 1,879,447 - 18,631,634
Deferred inflows related to pension plan (Note 11) 34,414,147 5,179,278 39,593,425 60,648,946 -
Deferred inflows related to OPEB local trust (Note 12) 5,755,764 1,015,723 6,771,487 8,193,328 -
Deferred inflows related to OPEB state plans (Note 13) 4,404,575 215,034 4,619,609 3,150,499 -
Total deferred inflows of resources 54,578,137 6,410,035 60,988,172 71,992,773 18,631,634
NET POSITION
Net investment in capital assets 325,875,876 128,990,591 454,866,467 163,316,874 15,661,019
Restricted:
Operating reserves - 2,651,628 2,651,628 -Cemetery care 937,254 - 937,254 - -
Other governmental purposes 27,512,882 - 27,512,882 15,905,126 2,109,039
Unrestricted 118,098,831 51,720,022 169,818,853 (116,510,013) 12,667,481
Total net position 472,424,843 $ 183,362,241 $ 655,787,084 $ 62,711,987 $ 30,437,539 $
The Notes to Financial Statements are an integral part of this statement.
EXHIBIT 1
14
CITY OF SUFFOLK, VIRGINIA
STATEMENT OF ACTIVITIES
Year Ended June 30, 2022
Program Revenues Net (Expense) Revenue and Changes in Net Position Primary Government Component Units
Operating Capital Business- Economic Charges for Grants and Grants and Governmental type Development Functions/Programs Expenses Services Contributions Contributions Activities Activities Total School Board Authority
PRIMARY GOVERNMENT:
Governmental activities:
General government administration 27,864,340 $ 4,527,721 $ 9,474,000 $ 433,763 $ (13,428,856) $ - $ (13,428,856) $
Judicial administration 10,536,210 352,911 2,437,198 - (7,746,101) - (7,746,101)
Public safety 72,861,636 2,716,979 4,803,818 - (65,340,839) - (65,340,839)
Public works 61,008,906 1,877,344 28,013,220 24,728,332 (6,390,010) - (6,390,010)
Health and welfare 14,673,123 - 9,481,473 - (5,191,650) - (5,191,650)
Transportation 1,631,135 64,817 2,146,421 65,360 645,463 - 645,463
Education 65,382,786 - - - (65,382,786) - (65,382,786)
Parks, recreation, and cultural 12,265,195 759,552 287,343 - (11,218,300) - (11,218,300)
Community development 9,261,924 - 878,525 - (8,383,399) - (8,383,399)
Interest on long-term debt 8,570,572 - - - (8,570,572) - (8,570,572)
Total governmental activities 284,055,827 10,299,324 57,521,998 25,227,455 (191,007,050) - (191,007,050) - -
Business-type activities:
Utility 53,977,360 58,898,742 - 5,269,223 - 10,190,605 10,190,605 Stormwater utility 5,087,932 8,868,561 - - - 3,780,629 3,780,629 Refuse 9,419,082 10,168,181 - - - 749,099 749,099
Total business-type activities 68,484,374 77,935,484 - 5,269,223 - 14,720,333 14,720,333 - -
Total Primary Government 352,540,201 $ 88,234,808 $ 57,521,998 $ 30,496,678 $ (191,007,050) $ 14,720,333 $ (176,286,717) $ - $ - $
COMPONENT UNITS:
School Board 183,863,793 $ 15,309 $ 126,411,113 $ - $ - $ - $ - $ (57,437,371) $ - $ Economic Development Authority 2,598,145 1,643,222 - - - - - (954,923)
Total component units 186,461,938 $ 1,658,531 $ 126,411,113 $ - $ - - - (57,437,371) (954,923)
General revenues:
Property taxes 161,212,302 - 161,212,302 -Sales and use taxes 16,370,461 - 16,370,461 -Business license taxes 10,964,624 - 10,964,624 -Meals taxes 15,592,762 - 15,592,762 - -
Utility taxes 5,024,008 - 5,024,008 - -
Communication taxes 2,499,745 - 2,499,745 - -
Motor vehicle license taxes 2,709,174 - 2,709,174 - -
Tobacco taxes 1,831,481 - 1,831,481 - -
Lodging taxes 2,206,627 - 2,206,627 - -
Recordation taxes 3,279,397 - 3,279,397 - -
The Notes to Financial Statements are an integral part of this statement.
Grants and contributions not restricted to specific programs
Other local taxes 925,677 - 925,677 -14,422,449 - 14,422,449 - -
Miscellaneous 5,730,575 853,122 6,583,697 3,063,200 121,652 City of Suffolk contribution - - - 64,934,716 962,082
Unrestricted revenues from use of money and property 1,735,694 150,244 1,885,938 12,423 278,482
Loss on disposal of assets (484,909) - (484,909) - -
Transfers (Note 5) 1,071,401 (1,071,400) 1 - -
Total general revenues and transfers 245,091,468 (68,034) 245,023,434 68,010,339 1,362,216
Net position at July 1 (as restated) Note 17
Change in net position 54,084,417 14,652,299 68,736,716 10,572,968 407,293 418,340,426 168,709,942 587,050,368 52,139,019 30,030,246
Net position at June 30 472,424,843 $ 183,362,241 $ 655,787,084 $ 62,711,987 $ 30,437,539 $
EXHIBIT 2
15
CITY OF SUFFOLK, VIRGINIA
BALANCE SHEET GOVERNMENTAL FUNDS June 30, 2022
ASSETS
Cash and cash equivalents
Total
133,185,900 $ 10,622,650 $ 20,420,122 $ -$ -$ 9,910,183 $ 174,138,855 $
Cash and cash equivalents, restricted (Note 2) 1,324,839 67,634,119 - 25,691,005 492,720 937,254 96,079,937
Receivables, net (Note 3) 10,266,950 - 89,380 2,500 - 142,505 10,501,335
Due from other governmental units (Note 4) 2,405,614 1,847,807 - 2,141,951 - 580,741 6,976,113
Due from component units 636,740 - - - - - 636,740
Leases receivable 987,359 - - - - 889,559 1,876,918
Inventories 100,474 - - - - 164,694 265,168
Total assets 148,907,876 $ 80,104,576 $ 20,509,502 $ 27,835,456 $ 492,720 $ 12,624,936 $ 290,475,066 $
LIABILITIES
Accounts payable and accrued liabilities 3,295,018 $ 4,785,761 $ 1,209,813 $ 427,462 $ -$ 207,131 $ 9,925,185 $
Accrued payroll and related liabilities 3,584,027 - 251,938 66,467 - 9,918 3,912,350
Unearned grant receipts - - - 24,602,150 - - 24,602,150
Total liabilities 6,879,045 4,785,761 1,461,751 25,096,079 - 217,049 38,439,685
DEFERRED INFLOWS OF RESOURCES
Unavailable revenues - taxes 3,004,724 - - - - 213 3,004,937
Prepaid Taxes 1,350,840 - - - - - 1,350,840
Proffers received - 5,140,053 - - - - 5,140,053
Deferred inflows related to leases 996,128 - - - - 883,319 1,879,447
Deposits 1,167,500 - 447,224 - - 18,587 1,633,311
Total deferred inflows of resources 6,519,192 5,140,053 447,224 - - 902,119 13,008,588
FUND BALANCES (NOTE
17)
Nonspendable 100,474 - - - - 164,694 265,168 Restricted 1,324,839 60,212,438 18,600,527 2,739,377 - 3,709,314 86,586,495 Committed 38,290,681 9,966,324 - - 492,720 7,642,579 56,392,304 Assigned 1,862,146 - - - - - 1,862,146 Unassigned 93,931,500 - - - - (10,819) 93,920,681
Total fund balances 135,509,640 70,178,762 18,600,527 2,739,377 492,720 11,505,768 239,026,794 Total liabilities, deferred inflows of resources, and fund balances 148,907,877 $ 80,104,576 $ 20,509,502 $ 27,835,456 $ 492,720 $ 12,624,936 $ 290,475,067 $
Total fund balances - governmental funds 239,026,794 $
Amounts reported for governmental activities in the Statement of Net Position are different because:
Capital assets used in governmental activities are not financial resources and, therefore, are not reported in the funds. 557,482,561
Unavailable revenues represent amounts that were not available to fund current expenditures and, therefore, are not reported in the funds. 3,004,937
Interest on long-term debt is not accrued in the governmental funds, but rather is recognized as an expenditure when due. (3,360,922)
Deferred charges on refunding are not current outflows of resources and not reported in the governmental funds 4,985,446
Long-term liabilities, including bonds payable, are not due and payable in the current period and, therefore, are not reported in the funds.
General obligation bonds and capital leases (278,318,472)
Lease liabilities (21,233,813)
Unamortized premiums and other credits on bonds (16,692,042)
Compensated absences (6,208,073)
Net pension and OPEB liabilities and related deferred inflows and outflows are not due and payable in the current period and therefore, not reported in the governmental funds:
Net pension liability (16,979,693)
Deferred outflows - pension plan 18,432,152
Deferred inflows - pension plan (32,782,292)
Net OPEB liability - Local trust (202,764)
Deferred outflows - OPEB Local trust 5,806,485
Deferred inflows - OPEB Local trust (5,483,024)
Net OPEB liability - state plans (15,499,196)
Deferred outflows - OPEB state plans 6,265,857
Deferred inflows - OPEB state plans (4,334,765)
Unearned revenues not recorded in the funds as it did not arise from current financial resources relating to the golf course lease agreement. (1,148,624)
The internal service funds are used by management to charge the costs of certain activities such as information technology, fleet management, and insurance to individual funds. The assets, deferred outflows of resources, liabilities, and deferred inflows of resources of the internal service funds are included in the governmental activities in the Statement of Net Position. 39,664,291
Net position of governmental activities 472,424,843 $
The Notes to Financial Statements are an integral part of this statement.
EXHIBIT 3
Capital Road Consolidated Debt Nonmajor Governmental General Projects Maintenance Grants Service Funds Funds
Primary Government
16
CITY OF SUFFOLK, VIRGINIA
STATEMENT OF REVENUES, EXPENDITURES, AND CHANGES IN FUND BALANCES GOVERNMENTAL FUNDS Year Ended June 30, 2022
Capital Road Consolidated Debt Non-major Governmental General Projects Maintenance Grants Service Funds Funds
REVENUES
Real estate and personal property taxes 156,254,217 $ - $ - $ - $ - $ 2,229,405 $ 158,483,622 $
Other local taxes 61,403,956 - - - - - 61,403,956
Permits, privilege fees and regulatory licenses 2,384,274 - 426,913 - - - 2,811,187
Fines and forfeitures 717,257 - 296,356 - - - 1,013,613
Revenue from use of money and property 936,824 - 63,057 54,130 300,581 293,940 1,648,532
Charges for services 3,974,775 - 1,724,573 15,750 - 786,255 6,501,353
Miscellaneous 1,034,240 - 40,674 125,560 - 52,121 1,252,595
Intergovernmental:
Revenue from the Commonwealth 22,912,923 24,728,332 25,491,046 374,848 - 526,447 74,033,596
Revenue from the Federal government 5,300,021 77,763 - 15,590,208 - 1,688,754 22,656,746
Total revenues 254,918,487 24,806,095 28,042,619 16,160,496 300,581 5,576,922 329,805,200
EXPENDITURES
Current:
General government administration 19,074,303 - - 7,814,185 - 884,351 27,772,839
Judicial administration 9,908,606 - - 973,093 - 35,800 10,917,499
Public safety 68,623,712 - - 3,804,561 - - 72,428,273
Public works 1,013,405 - 22,331,041 2,268,261 - 159,314 25,772,021
Health and welfare 14,616,672 - - 344,778 - - 14,961,450
Transportation - - - - - 2,045,390 2,045,390 Education 65,377,695 - - - - - 65,377,695 Parks, recreation, and cultural 11,398,532 - - 45,324 - 114,854 11,558,710
Community development 7,423,826 - - 878,525 - - 8,302,351 Nondepartmental 673,338 - - - - - 673,338
Capital outlay - 48,026,860 - - - - 48,026,860
Debt service:
Principal retirement - - - - 19,074,488 - 19,074,488
Bond issuance costs - - - - 506,360 - 506,360
Interest and fiscal charges - - - - 8,801,914 - 8,801,914
Total expenditures 198,110,089 48,026,860 22,331,041 16,128,727 28,382,762 3,239,709 316,219,188 56,808,398 (23,220,765) 5,711,578 31,769 (28,082,181) 2,337,213 13,586,012
Excess (deficiency) of revenues over/(under) expenditures
OTHER FINANCING SOURCES (USES)
Refunding bonds issued - - - - 17,990,000 - 17,990,000 General obligations bonds issued - 27,090,000 - - - - 27,090,000
Premiums on bonds issued - 2,660,000 - - 268,122 - 2,928,122
Payment to escrow agent - - - - (17,754,699) - (17,754,699)
Transfers in 2,930,647 7,451,056 127,790 511,861 27,578,758 1,121,015 39,721,128 Transfers out (33,494,035) (415,142) (3,096,628) - - (1,337,037) (38,342,842) Total other financing sources (uses), net (30,563,388) 36,785,914 (2,968,838) 511,861 28,082,181 (216,022) 31,631,709
Net change in fund balances 26,245,010 13,565,149 2,742,740 543,630 - 2,121,191 45,217,720 Fund balances at July 1 109,264,630 56,613,613 15,857,787 2,195,747 492,720 9,384,577 193,809,074 Fund balances at June 30 135,509,640 $ 70,178,762 $ 18,600,527 $ 2,739,377 $ 492,720 $ 11,505,768 $ 239,026,794 $
The Notes to Financial Statements are an integral part of this statement.
EXHIBIT 4
Total
17
CITY OF SUFFOLK, VIRGINIA
STATEMENT OF REVENUES, EXPENDITURES, AND CHANGES IN FUND BALANCES GOVERNMENTAL FUNDS
Year Ended June 30, 2022
Total Governmental Funds
Change in fund balance - total governmental funds 45,217,720 $
Adjustments for the Statement of Activities:
Governmental funds report capital outlays as expenditures while governmental activities report depreciation expense to allocate those expenditures over the life of the assets.
Capital outlay 52,498,272
Depreciation expense (42,789,419)
Revenues in the Statement of Activities that do not provide current financial resources are not reported as revenues in the funds.
Unavailable revenues 2,728,680
Lease revenue paid in form of leasehold improvements 356,000
The issuance of long-term debt provides current financial resources to governmental funds, while the repayment of the principal of long-term debt consumes the current financial resources of governmental funds. Neither transaction, however, has any effect on net position. Also, governmental funds report the effect of premiums, discounts, and similar items when debt is first issued, whereas these amounts are deferred and amortized in the Statement of Activities.
Principal repayment and payments to escrow agent 39,844,497
Net change in deferred bond charges from refunding (730,617)
Proceeds from issuance of new debt (45,080,000)
Net change in bond premiums (1,094,370)
Record the net flow of resources in the current year related to the Pension Plan. 1,977,626
Record the net flow of resources in the current year related to the OPEB City trust fund. 914,546
Record the net flow of resources in the current year related to the state OPEB plans. (602,069)
Some expenses reported in the Statement of Activities do not require the use of current financial resources and, therefore, are not reported as expenditures in governmental funds.
Accrued interest payable 73,434
Change in compensated absences 3,905
The internal service funds are used by management to charge the costs of the information technology, fleet management, and insurance. The change in net position of the internal service funds are reported with governmental activities. 766,212
Change in net position of governmental activities 54,084,417 $
The Notes to Financial Statements are an integral part of this statement.
EXHIBIT 4
18
ASSETS
Current assets:
CITY OF SUFFOLK, VIRGINIA
STATEMENT OF NET POSITION PROPRIETARY FUNDS
June 30, 2022
Business-type Activities – Enterprise Funds
Governmental Activities –Non-Major Internal Utility Fund Funds Total Service Funds
Cash and cash equivalents 40,405,779 $ 15,515,152 $ 55,920,931 $ 34,481,150 $
Cash and cash equivalents, restricted 31,077,319 379,623 31,456,942 1,598,726
Receivables, net 7,763,270 784,812 8,548,082 217,262
Inventories 216,413 - 216,413 439,893
Total current assets 79,462,781 16,679,587 96,142,368 36,737,031
Noncurrent assets:
Land and construction in progress 21,168,615 2,447,121 23,615,736 1,183,777
Other capital assets, net 437,241,258 174,123 437,415,381 15,471,583
Right to use leased assets, net of amortization 4,094,080 25,249 4,119,329 412,784
Total noncurrent assets 462,503,953 2,646,493 465,150,446 17,068,144
Total assets 541,966,734 19,326,080 561,292,814 53,805,175
DEFERRED OUTFLOWS OF RESOURCES
Deferred charge on refunding 22,399,624 - 22,399,624 -
Deferred outflows related to pension plan 1,679,095 1,233,233 2,912,328 925,436
Deferred outflows related to OPEB City trust 637,418 438,225 1,075,643 288,832
Deferred outflows related to OPEB state plans 85,161 64,330 149,491 48,404
Total deferred outflows of resources 24,801,298 1,735,788 26,537,086 1,262,672
LIABILITIES
Current liabilities:
Accounts payable and accrued liabilities 1,622,588 627,777 2,250,365 1,118,583
Accounts payable from restricted resources 306,397 - 306,397 -
Accrued payroll and related liabilities 261,420 179,854 441,274 178,455
Unearned revenues 332,011 - 332,011 -
Claims payable - - - 2,384,806
Accrued interest payable 3,374,149 8,901 3,383,050 114,167
Compensated absences 310,774 225,042 535,816 12,761
Bonds and leases payable 16,049,677 197,319 16,246,996 1,736,332
Total current liabilities 22,257,016 1,238,893 23,495,909 5,545,104
Noncurrent liabilities:
Compensated absences 238,857 107,785 346,642 300,925
Net pension liability 1,554,703 1,127,920 2,682,623 845,224
Net OPEB liability City trust 22,259 15,303 37,562 10,086
Net OPEB liability state plans 296,195 223,517 519,712 168,725
Claims payable - - - 1,650,939
Bonds and leases payable 370,588,862 386,314 370,975,176 4,908,145
Total noncurrent liabilities 372,700,876 1,860,839 374,561,715 7,884,044
Total liabilities 394,957,892 3,099,732 398,057,624 13,429,148
DEFERRED INFLOWS OF RESOURCES
Deferred inflows related to pension plan 3,001,628 2,177,650 5,179,278 1,631,855
Deferred inflows related to OPEB City trust 601,910 413,813 1,015,723 272,740
Deferred inflows related to OPEB state plans 122,553 92,481 215,034 69,813
Total deferred inflows of resources 3,726,091 2,683,944 6,410,035 1,974,408
NET POSITION
Net investment in capital assets 126,384,332 2,606,259 128,990,591 12,233,247
Restricted: 2,651,628 - 2,651,628 -
Operating reserves
Unrestricted 39,048,089 12,671,933 51,720,022 27,431,044
Total net position 168,084,049 $ 15,278,192 $ 183,362,241 $ 39,664,291 $
The Notes to Financial Statements are an integral part of this statement.
EXHIBIT 5
19
CITY OF SUFFOLK, VIRGINIA
STATEMENT OF REVENUES, EXPENSES, AND CHANGES IN NET POSITION PROPRIETARY FUNDS
Year Ended June 30, 2022
OPERATING REVENUES
Business-type Activities – Enterprise Funds
Governmental Activities –Non-Major Internal Utility Fund Funds Total Service Funds
Charges for services 58,898,742 $ 19,036,742 $ 77,935,484 $ 38,275,696 $ Other 71,879 769,023 840,902 778,742
Total operating revenues 58,970,621 19,805,765 78,776,386 39,054,438
OPERATING EXPENSES
Personnel services 6,930,504 5,008,850 11,939,354 3,676,336
Self-insured claims - - - 13,330,401 Contractual services 530,964 5,746,870 6,277,834 7,136,576 Administration 3,433,626 3,116,044 6,549,670 974,791 Supplies 1,066,280 244,299 1,310,579 49,378 Repairs and maintenance 1,971,387 11,480 1,982,867 233,569
Vehicle and power equipment – fuel - - - 2,090,413 Vehicle and power equipment – supplies - - - 2,522,867 Computers and equipment - - - 678,810 Utilities 1,438,796 68,818 1,507,614 223,529 Insurance - - - 3,079,870 Bulk-water purchases 8,157,892 - 8,157,892Depreciation and amortization 18,129,317 108,694 18,238,011 3,079,116
Building and equipment rental 205,744 89,628 295,372 120,716 Other charges 17,543 99,052 116,595 689,098
Total operating expenses 41,882,053 14,493,735 56,375,788 37,885,470
Operating income 17,088,568 5,312,030 22,400,598 1,168,968
NONOPERATING REVENUES (EXPENSES)
Loss on disposal of capital assets - - (484,909)
Interest income 114,093 36,151 150,244 87,162 Rental Income 12,220 - 12,220 -
Interest expense and other fiscal charges (11,397,010) (13,279) (11,410,289) (193,193)
Costs of issuance (638,465) - (638,465) 106,070
Recovered Costs - - - -
Contribution to WTWA infrastructure (59,832) - (59,832) -
Nonoperating revenues (expenses), net (11,968,994) 22,872 (11,946,122) (484,870)
Income before contributions and transfers 5,119,574 5,334,902 10,454,476 684,098
Capital contributions
5,269,223 - 5,269,223 389,000
Transfers in 146,910 367,881 514,791 332,929 Transfers out (808,685) (777,506) (1,586,191) (639,815)
Change in net position 9,727,022 4,925,277 14,652,299 766,212
Net position at July 1 (as restated) Note 17 158,357,027 10,352,915 168,709,942 38,898,079 Net position at June 30 168,084,049 $ 15,278,192 $ 183,362,241 $ 39,664,291 $
The Notes to Financial Statements are an integral part of this statement.
EXHIBIT 6
20
CITY OF SUFFOLK, VIRGINIA
STATEMENT OF CASH FLOWS PROPRIETARY FUNDS
Year Ended June 30, 2022
Governmental
Business-type Activities – Enterprise Funds Activities –Non-Major Internal Utility Fund Funds Total Service Funds
OPERATING ACTIVITIES
Receipts from customers 60,075,187 $ 19,651,132 $ 79,726,319 $ 39,035,134 $ Payments to employees (7,281,701) (5,121,898) (12,403,599) (3,949,035) Payments to suppliers (16,987,432) (9,168,501) (26,155,933) (31,211,855)
Net cash provided by operating activities 35,806,054 5,360,733 41,166,787 3,874,244
NONCAPITAL FINANCING ACTIVITIES
Nonoperating revenues 12,220 - 12,220Transfers from other funds 146,910 1,318,180 1,465,090 332,929 Transfers to other funds (868,517) (1,727,806) (2,596,323) (639,815)
Net cash used in noncapital financing activities (709,387) (409,626) (1,119,013) (306,886)
CAPITAL AND RELATED FINANCING ACTIVITIES
Acquisition and construction of capital assets (8,238,369) (2,551,017) (10,789,386) (1,876,436)
Proceeds from premiums on debt issuance 694,611 - 694,611 38,857
Proceeds from issuance of debt 16,170,000 - 16,170,000 215,000
Principal paid on capital debt, net (14,541,650) (169,450) (14,711,100) (2,250,359)
Refunding proceeds placed in escrow (18,686,634) - (18,686,634)Bond issuance costs 1,763,293 - 1,763,293 (150,269)
Interest paid on capital debt (11,608,249) (29,514) (11,637,763) (234,235) Net cash used in capital and related financing activities (34,446,998) (2,749,981) (37,196,979) (4,257,442)
INVESTING ACTIVITIES
Interest received 114,093 36,151 150,244 87,162 Net cash provided by investing activities 114,093 36,151 150,244 87,162
Net increase (decrease) in cash and cash equivalents 763,762 2,237,277 3,001,039 (602,922)
CASH AND CASH EQUIVALENTS
Beginning, July 1, 70,719,336 13,657,498 84,376,834 36,682,798 Ending, June 30 71,483,098 $ 15,894,775 $ 87,377,873 $ 36,079,876 $
RECONCILIATION TO STATEMENT OF NET POSITION:
Cash and cash equivalents 40,405,779 $ 15,515,152 $ 55,920,931 $ 34,481,150 $
Cash and cash equivalents, restricted 31,077,319 379,623 31,456,942 1,598,726 71,483,098 $ 15,894,775 $ 87,377,873 $ 36,079,876 $ (Continued)
The Notes to Financial Statements are an integral part of this statement.
EXHIBIT 7
21
CITY OF SUFFOLK, VIRGINIA
STATEMENT OF CASH FLOWS PROPRIETARY FUNDS
Year Ended June 30, 2022
RECONCILIATION OF OPERATING INCOME TO NET CASH PROVIDED BY OPERATING ACTIVITIES
Governmental
Business-type Activities – Enterprise Funds Activities –Non-Major Internal Utility Fund Funds Total Service Funds
Operating income 17,088,568 $ 5,312,030 $ 22,400,598 $ 1,168,968 $
Adjustments to reconcile operating income to net cash provided by operating activities:
Depreciation 18,129,317 108,694 18,238,011 3,079,116 Increase in allowance for uncollectible accounts (195,779) (140,331) (336,110)Changes in assets and liabilities: (Increase) decrease in: Receivables 1,117,753 (14,301) 1,103,452 (19,306) Inventories (64,309) - (64,309) (162,196) Increase (decrease) in: Accounts payable and accrued liabilities (100,889) 207,689 106,800 371,335 Accrued payroll and related liabilities (351,197) (113,048) (464,245) (272,699) Unearned revenues 182,590 - 182,590Claims payable - - - (290,974) Net cash provided by operating activities 35,806,054 $ 5,360,733 $ 41,166,787 $ 3,874,244 $
The Notes to Financial Statements are an integral part of this statement.
EXHIBIT 7
22
CITY OF SUFFOLK, VIRGINIA
STATEMENT OF FIDUCIARY NET POSITION June 30, 2022
OPEB Trust Custodial Fund Funds
ASSETS
Cash and cash equivalents 46,171,949 $ 140,814 $ Accounts receivable - 3,296 Total assets 46,171,949 144,110
LIABILITIES
Accounts payable - 24,248 Amounts held for others - 30,764 Total liabilities - 55,012
NET POSITION
Restricted: Postemployment benefits other than pensions 46,171,949Individuals, organizations, and other governments - 89,098
Total net position 46,171,949 $ 89,098 $
The Notes to Financial Statements are an integral part of this statement.
EXHIBIT 8
23
CITY OF SUFFOLK, VIRGINIA
STATEMENT OF CHANGES IN FIDUCIARY NET POSITION
Year Ended June 30, 2022
ADDITIONS
OPEB Trust Custodial Fund Funds
Employer contributions 729,520 $ - $
Gain on Investments 22,986Permits and fees - 43,019 Miscellaneous revenue - 55,628 Total additions 752,506 98,647
DEDUCTIONS
Administrative fees 43,015Loss on Investments 4,686,990Special welfare agency payments - 30,539 Payments to other governments - 54,386 Total deductions 4,730,005 84,925
Change in net position (3,977,499) 13,722
NET POSITION AT JULY 1 50,149,448 75,376
NET POSITION AT JUNE 30 46,171,949 $ 89,098 $
The Notes to Financial Statements are an integral part of this statement.
9
EXHIBIT
24
NOTES TO FINANCIAL STATEMENTS
CITY OF SUFFOLK, VIRGINIA NOTES TO FINANCIAL STATEMENTS
June 30, 2022
Note 1. Summary of Significant Accounting Policies
The financial statements of the City of Suffolk, Virginia (the “City”) have been prepared in conformity with accounting principles generally accepted in the United States of America (the “GAAP”) as applied to governmental units. The Governmental Accounting Standards Board (the “GASB”) is the accepted standard setting body for establishing governmental accounting and financial reporting principles. Significant accounting policies of the City are described below.
A. Reporting Entity
Primary Government – The City was formed on January 1, 1974, by the merger of the former Cities of Suffolk and Nansemond. The City of Nansemond was previously formed by the merger of the County of Nansemond and the Towns of Whaleyville and Holland. The City is a political subdivision of the Commonwealth of Virginia operating under the council-manager form of government. The elected Mayor and seven-member City Council, vested with the legislative powers, appoints the City Manager, who is the executive and administrative head of the City’s government.
The City provides a full range of services to include the following: public safety (police and fire), education, community development (planning and zoning), water treatment and distribution, sewage collection, refuse collection, maintenance of highways, streets and infrastructure, stormwater management, transit, recreational activities, cultural events, social services, and library, among other services.
Discretely Presented Component Units – Discretely presented component units are entities that are legally separate from the City, but for which the City is financially accountable, or whose relationship with the City is such that exclusion would cause the City’s financial statements to be incomplete. They are reported in a separate column in the government-wide financial statements to emphasize they are legally separate from the City.
City of Suffolk Public Schools
The City of Suffolk Public Schools (the “School Board”) is responsible for elementary and secondary education within the City. Management of the School Board is composed of seven members popularly elected to a four-year term. The School Board is fiscally dependent upon the City because the City Council approves the annual budget of the School Board, levies the necessary taxes to finance operations and approves the borrowing of money and issuance of debt. The School Board does not issue separate financial statements, as such, they have been included in these statements.
25
CITY OF SUFFOLK, VIRGINIA NOTES TO FINANCIAL STATEMENTS
June 30, 2022
Note 1 Summary of Significant Accounting Policies (Continued)
A. Reporting Entity (Continued)
Economic Development Authority of the City of Suffolk
The Economic Development Authority of the City of Suffolk (the “EDA”) was established under the Industrial Development and Revenue Bond Act – Code of Virginia. A separate board appointed by the City Council governs the EDA. The EDA is authorized to acquire, own, lease, and dispose of properties, and to conduct related activities to promote industry and develop trade by inducing manufacturing, industrial, governmental, and commercial enterprises to locate or to remain in the City. The City makes significant contributions to the EDA relating to the property the EDA develops and markets. Separate audited financial statements may be obtained from the EDA by contacting the EDA’s Deputy Secretary/Treasurer, at P.O. Box 1858, Suffolk, Virginia 23439.
The following entities are excluded from the accompanying financial statements.
Jointly governed organizations:
Western Tidewater Water Authority
The Western Tidewater Water Authority (the “Water Authority”) was created March 18, 1998, by the City Council and the Board of Supervisors of the County of Isle of Wight, Virginia (the “County”) pursuant to the Virginia Water and Sewer Authorities Act, Chapter 51, Title 15.2, Code of Virginia. The members of the Water Authority Board representing both the City and the County have equal voting interests. The Water Authority was formed for the purpose of acquiring, financing, constructing, leasing, operating, and maintaining facilities for the production, impoundment, treatment, and transmission of potable and non-potable water. The City is not obligated to pay the principal or interest on notes or any other liabilities of the Authority and has no financial interest in the Authority. Separate audited financial statements can be obtained by contacting the City Finance Director at the City of Suffolk at 442 West Washington St., Suffolk, Virginia 23434.
26
CITY OF SUFFOLK, VIRGINIA NOTES TO FINANCIAL STATEMENTS
June 30, 2022
Note 1. Summary of Significant Accounting Policies (Continued)
A. Reporting Entity (Continued)
Jointly Governed Organization: (Continued)
Western Tidewater Regional Jail Authority
The Western Tidewater Regional Jail Authority (the “Jail Authority”) was created as a political subdivision of the Commonwealth of Virginia jointly through an agreement dated November 1, 1989, among the Cities of Suffolk and Franklin, and the County of Isle of Wight (the member jurisdictions) under the Jail Authority Act, Code of the Commonwealth of Virginia. The member jurisdictions are responsible for a percentage of the annual operating costs of the jail based on the jail population. The Jail Authority has the responsibility to finance the acquisition, construction, equipping, and maintenance of a regional jail facility to operate for the benefit of the member jurisdictions.
Historically, notes issued by the Jail Authority are limited obligations payable solely from revenues received from the member jurisdictions. The City has not been obligated to pay the principal or interest on the notes or any other liability of the Jail Authority and has no financial interest in the Authority beyond its annual contribution. However, during 2014, the member jurisdictions pledged to pay its pro rata share of any debt service on the issuance of the Authority’s 2014 bonds. Separate financial statements can be obtained by contacting the Superintendent of Jail Authority at 2402 Godwin Blvd., Suffolk, Virginia 23434.
Southeastern Public Service Authority of Virginia
The Southeastern Public Service Authority of Virginia (the “PSA”) is a special purpose government entity engaged in business-type activities with no component units and was created for solid waste disposal. The members of the PSA are the Cities of Chesapeake, Franklin, Norfolk, Portsmouth, Suffolk, and Virginia Beach and the Counties of Isle of Wight and Southampton.
In fiscal year 2018, each member jurisdiction signed a new use and support agreement with the PSA and have agreed to deliver, or cause to be delivered, 100% of all municipal solid waste collected by the municipality, excluding certain classifications of waste such as recyclables, yard waste and storm debris. The City has also signed a host agreement that details the amount that the City will receive in host fees related to the waste delivered to the landfill located within the City limits from the PSA. Separate audited financial statements can be obtained by contacting the Chief Financial Officer at 723 Woodlake Drive, Chesapeake, VA 23320.
27
CITY OF SUFFOLK, VIRGINIA
NOTES TO FINANCIAL STATEMENTS
June 30, 2022
Note 1. Summary of Significant Accounting Policies (Continued)
A. Reporting Entity (Continued)
Related
Organization:
Suffolk Redevelopment and Housing Authority
The Suffolk Redevelopment and Housing Authority (the “SRHA”) administers public housing and redevelopment activities in the City. It applies, receives, and invests its own funds and formulates and approves its own budget. City Council is responsible for appointing members of the Board of SRHA, but the City’s accountability does not extend beyond making such appointments. SRHA does not have a significant operational or financial relationship with the City. Separate financial statements can be obtained by contacting the SRHA Executive Director at 530 E. Pinner Street, Suffolk, Virginia 23434.
B. Government-wide and Fund Financial Statements
The government-wide financial statements consist of a Statement of Net Position and a Statement of Activities that report information on all of the non-custodial activities of the Primary Government and its component units. Governmental activities, which normally are supported by taxes and intergovernmental activities, are reported separately from business-type activities, which rely to a significant extent on fees and charges for support. Likewise, the Primary Government is reported separately from certain legally separate component units for which the Primary Government is financially accountable.
The Statement of Net Position offers information on the assets and deferred outflows of resources, and liabilities and deferred inflows of resources, with the difference between the two reported as net position. The Statement of Activities demonstrates the degree to which the direct expenses of a given function or segment is offset by program revenues. Direct expenses are those that are clearly identifiable with a specific function or segment. Program revenues include 1) charges to customers or applicants who purchase, use, or directly benefit from goods, services, or privileges provided by a given function or segment and 2) grants and contributions that are restricted to meeting the operational or capital requirements of a particular function or segment. Taxes and other items not properly associated with program revenues are reported instead as general revenues
Separate financial statements are provided for governmental funds, proprietary funds, and custodial funds, even though the latter are excluded from the government-wide financial statements. Major individual governmental and enterprise funds are reported as separate columns in the financial statements.
The government-wide financial statements are reported using the economic resources measurement focus and the accrual basis of accounting, as are the proprietary fund and custodial fund financial statements, with the exception of agency fund financial statements, which have no measurement focus. Revenues are recorded when earned and the expenses are recorded when a liability is incurred, regardless of the timing related cash flows. Property taxes are recognized as revenue when the tax is levied.
28
CITY OF SUFFOLK, VIRGINIA NOTES TO FINANCIAL STATEMENTS
June 30, 2022
Note 1. Summary of Significant Accounting Policies (Continued)
C. Measurement Focus, Basis of Accounting, and Financial Statement Presentation Governmental Fund Types:
Governmental fund financial statements are reported using the current financial resources measurement focus and the modified accrual basis of accounting Revenues are recognized as soon as they are both measureable and available. Revenues are considered to be available when they are collectible within the current period or soon enough thereafter to pay liabilities of the current period. For this purpose, the City considers revenues to be available if they are collected within 45 days of the end of the current period.
Property taxes, franchise taxes, licenses, and interest associated with the current fiscal period are all considered to be susceptible to accrual and so have been recognized as revenues of the current fiscal period. Accordingly, real and personal property taxes are recorded as revenues and receivables when billed, net of allowances for uncollectable amounts. Property taxes not collected within 45 days after year-end are reflected as deferred inflows of resources - unavailable revenues taxes. Sales and utility taxes, which are collected by the Commonwealth or utilities and subsequently remitted to the City, are recognized as revenues and receivable upon collection, which is generally one or two months preceding receipt by the City. Licenses, permits, fines, and rents are recorded revenues when received. Intergovernmental revenues, consisting primarily of Federal, state, and other grants for the purpose of funding specific expenditures, are recognized when the qualifying expenditures have been incurred and all other eligibility requirements have been met. Revenues from general-purpose grants are recognized in the period to which the grant applies. All other revenue items are considered to be measurable and available only when the City receives cash.
Amounts reported as program revenues include charges to customers or applicants for goods, services, or privileges provided, operating grants and contributions, and capital grants and contributions, including special assessments. Internally dedicated resources are reported as general revenues rather than as program revenues. Likewise, general revenues include all taxes and contributions not restricted to specific programs and other revenues not meeting the definition of program revenues.
Expenditures are generally recognized under the modified accrual basis of accounting when the related fund liability is incurred. Exceptions to this rule include: (1) accumulated unpaid vacation leave, sick leave, and other employee amounts (e.g., other postemployment benefits), which are recognized when paid, and (2) principal and interest payments on general long-term debt, both of which are recognized when due.
As a general rule, the effect of inter-fund activity has been eliminated from the government-wide financial statements. Exceptions to this general rule are charges between the City’s proprietary funds and various other functions of the City. Elimination of these charges would distort the direct costs and program revenues reported for the various functions concerned.
The City presents the following major governmental funds:
General Fund – The General Fund is the primary operating fund of the City, which accounts for all financial resources not accounted for in another fund.
29
CITY OF SUFFOLK, VIRGINIA NOTES TO FINANCIAL STATEMENTS
June 30, 2022
Note 1. Summary of Significant Accounting Policies (Continued)
C. Measurement Focus, Basis of Accounting, and Financial Statement Presentation (Continued)
Capital Projects Fund – The Capital Projects Fund is used to account for financial resources that are restricted, committed, or assigned to expenditures for capital outlays, except for those financed by proprietary funds or for assets held in trust for individuals, private organizations, or other governments.
Road Maintenance Fund – accounts for revenue and expenditures related to maintaining roadways City wide. Revenues are derived from the state and from the sale of service to other funds.
Consolidated Grants Fund – accounts for revenue and expenditures related to grants received from various federal and state granting agencies.
Debt Service Fund – accounts for the accumulation of resources that are restricted, committed, or assigned to the expenditure for principal and interest on the general long-term debt of the City, with the exception of the debt in the proprietary funds, and compensated absences.
The City presents the following non-major governmental funds:
Special Revenue Funds – account for proceeds of specific revenue sources restricted or committed to expenditure for a specific purpose other than debt service or capital projects. These funds consist of the Suffolk Taxing District, Downtown Business Overlay District, Law Library, Route 17 Taxing District, Transit, Cemetery, and Aviation.
Proprietary Fund Types:
Proprietary funds are used to account for operations that are financed and operated in a manner similar to private business enterprises. The proprietary funds utilize the accrual basis of accounting where the measurement focus is upon determination of net income. Proprietary funds consist of enterprise and internal service funds.
Proprietary funds distinguish operating revenues and expense from non-operating items. Operating revenues and expenses generally result from providing services and producing and delivering goods in connection with the proprietary funds’ principal ongoing operations. The principal operating revenues of the Utility Fund, Stormwater Utility Fund, Refuse Fund and the internal service funds are charges to customers for sales and services. Operating expenses for enterprise funds and internal service funds include the cost of sales and services, administrative expenses, and depreciation on capital assets. All revenues and expenses not meeting the operating definition are reported as non-operating revenues and expenses.
The City presents the following major enterprise fund:
Utility Fund - accounts for the provision of water and sewer services. All activities necessary to provide such services are accounted for in this fund, including, but not limited to, administration, operation, maintenance, billing, collections, capital financing and related debt service, and capital assets.
30
CITY OF SUFFOLK, VIRGINIA NOTES TO FINANCIAL STATEMENTS
June 30, 2022
Note 1. Summary of Significant Accounting Policies (Continued)
C. Measurement Focus, Basis of Accounting, and Financial Statement Presentation (Continued)
The City presents the following non-major enterprise funds:
Stormwater Utility Fund – accounts for the maintenance and improvements to the City’s stormwater infrastructure. All activities necessary to provide such services are funded by charges to citizens and are accounted for in this fund. The City’s mosquito control activities are also accounted for in this fund.
Refuse Fund – accounts for the provision of refuse and waste management services. All activities necessary to provide such services are accounted for in this fund, including, but not limited to, administration, operation, billing, and collections.
Internal Service Funds account for the financing of goods or services provided by one department to other departments or agencies of the City on a cost-reimbursement basis. The Internal Service Funds are included in governmental activities for government-wide reporting purposes.
The City has the following internal service funds:
Information Technology Fund – accounts for technology infrastructure and allocated costs to the various departments or agencies using the service.
Fleet Management Fund – accounts for, on a cost-reimbursement basis, the financing of vehicles and related maintenance, repairs and fuel costs and allocates those costs to the various departments or agencies using the equipment.
Risk Management Fund – accounts for the funding and payment of auto, personal liability, general liability, health insurance, and workers’ compensation claims against the City exclusive of the School Board employees. Charges to other funds are based on estimated claims for the year.
Fiduciary Fund Types:
The City and School Board each have the following fiduciary funds:
OPEB Trust Fund – accounts for activities related to other postemployment benefits (OPEB). This fund accumulates resources for health insurance for retired employees.
Custodial Funds – Custodial Funds accounts for assets held by the City as an agent for individuals, private organization, and other governments. Custodial funds are not included in the government-wide financial statements. Custodial funds utilize an economic resources measurement focus. In addition to the City’s agency funds listed below.
Special Welfare Fund – accounts for receipt of welfare checks and foster children support checks from the state and payments made on behalf of individuals.
Commonwealth of Virginia Fund – accounts for monies collected by the City on behalf of the Commonwealth of Virginia.
31
CITY OF SUFFOLK, VIRGINIA NOTES TO FINANCIAL STATEMENTS
June 30, 2022
Note 1. Summary of Significant Accounting Policies (Continued)
D. Stewardship, Compliance, and Accountability
The provisions of the Code of Virginia shall control the preparation, consideration, adoption, and execution of the budget of the City. The City Charter requires the budget to be balanced with planned expenditures equal to revenue estimates. The City will prepare and annually update a long range (5 year) financial forecast model utilizing trend indicators and projections of annual operating revenues, expenditures, capital improvements, and related debt service and operating costs as well as fund balance levels. The City Manager, through the Budget and Finance division of the Finance Department, will exercise appropriate fiscal management as necessary to live within the limits of the adopted budget.
Budgeting Information
The City utilizes the following procedures in establishing annual budget.
At least 60 days prior to June 30, the City Manager submits to City Council a proposed operating budget for the fiscal year commencing the following July 1. The operating budget includes proposed expenditures and the means of financing them.
• The budget is formulated from estimates of revenues and expected expenditures from each department. The School Board is treated as a single expenditure line item.
• The City Manager submits the proposed budget to City Council and recommends an appropriation ordinance and an ordinance levying the tax rates for the ensuing year.
• City Council holds a public hearing on the proposed budget. Notice of such public hearing must appear in a local newspaper not less than seven days prior to the hearing.
• The budget must be approved by a majority vote of City Council and legally adopted before July 1. If City Council does not adopt the proposed budget before July 1, the budget as submitted is automatically adopted.
• Additional appropriations may be made by City Council only if there is an unencumbered fund balance or additional funding becomes available.
Formal budgetary integration is employed as a management control device. Annual operating budgets are adopted by ordinance passed by City Council for the General Fund, the Debt Service Fund, the Utility Fund, Stormwater Fund, Refuse Fund, the internal service funds, and the following Special Revenue Funds: Aviation, Route 17 Tax District, Downtown Business Overlay District, Road Maintenance, Transit and Law Library. Annual operating budgets are also adopted for the School Operating, School Food Service, and School Grants funds. Budgets for proprietary fund types are prepared on the accrual basis of accounting. The General, Special Revenue, and Debt Service Funds and School Board General, Grants, Food Service fund budgets are adopted on the modified accrual basis.
32
CITY OF SUFFOLK, VIRGINIA
NOTES TO FINANCIAL STATEMENTS
June 30, 2022
Note 1. Summary of Significant Accounting Policies (Continued)
D. Stewardship, Compliance, and Accountability (Continued)
Budgeting Information (Continued)
Beginning fund balances for budgetary basis presentation purposes are adjusted for the carry-forward of prior year encumbrances. According to City Code, unexpended and unencumbered appropriations lapse at June 30 of each year. Appropriations that are encumbered or assigned by City Council at June 30 are carried forward into the following year’s appropriations to allow for liquidation of the encumbrances or to complete a project.
Individual grants and projects included in the Consolidated Grants Fund and Capital Projects Fund are budgeted separate from the operating budget. These appropriations do not parallel the City’s fiscal year and the accounting, encumbering, and controlling of the funds is based upon the length of each individual grant or project, which may be more than one year.
Financial Policies
The City’s Finance Committee (the “Committee”) is empowered by City Council to implement and establish various financial policies. The Committee meets on a quarterly basis to manage and review financial activities and to insure compliance with established policies. Members of the Committee include those individuals stipulated by ordinance adopted by City Council.
It is the City’s policy to fund current expenditures with current revenues and the City’s mission is to strive to maintain a diversified and stable revenue stream to protect from problematic fluctuations in any single revenue source and provide stability to ongoing services. The City’s unassigned fund balance in the General Fund will be maintained to provide the City with sufficient working capital and a margin of safety to address local and regional emergencies without borrowing.
E. Cash and Cash Equivalents
Cash and Cash Equivalents include cash on hand, money market funds, certificates of deposit, and investments with maturities of three months or less.
F. Investments
Investments are reported at fair value. Interest income on investments is allocated to the appropriate funds based upon the average monthly cash balance of each fund. Interest income is accrued as earned.
G. Receivables
Receivables are shown net of an allowance for uncollectable amounts calculated by management using historical collection data, specific account analysis, and management’s judgment.
33
CITY OF SUFFOLK, VIRGINIA
NOTES TO FINANCIAL STATEMENTS
June 30, 2022
Note 1. Summary of Significant Accounting Policies (Continued)
H. Inventories and Prepaid Items
Inventories of materials and supplies and fuel are recorded at cost. The cost of inventory is recorded as an expenditure at the time individual inventory items are consumed (consumption method) on a first in, first out basis. Inventories held by the EDA consist of land and improvements held for sale and are valued at the lower of the cost or market.
Certain payments to vendors reflect costs applicable to future accounting periods and are recorded as prepaid items in both government-wide and fund financial statements.
I. Leases Receivable
The City’s lease receivable is measured at the present value of lease payments expected to be received during the lease term. The City may receive variable lease payments that are dependent upon the lessee’s revenue. The variable payments would be recorded as an inflow of resources.
J. Capital Assets
Capital outlays are recorded as expenditures of the governmental funds and as assets in the proprietary funds and in the government–wide financial statements to the extent the City’s capitalization threshold is met.
Buildings, improvements, machinery and equipment, intangible, and infrastructure capital outlays are recorded as capital assets and depreciated over their useful lives on a straight-line basis in both the proprietary fund’s and the government-wide statements. To the extent that the construction period has not closed, interest expense is capitalized on proprietary fund type assets. The amount of interest expense capitalized is offset by interest income earned on invested proceeds.
The City’s capitalization policy threshold is $5,000. All capital assets are valued at historical costs or estimated historical cost if actual cost was not available. Donated assets are valued at their estimated acquisition value on the date donated. Assets acquired under capital leases are capitalized at the net present value of all lease payments, and related amortization expense is included with depreciation expense.
The City has recorded intangible right to use assets as a result of implementing GASB 87. The right to use asset is initially measured as an amount equal to the initial measurement of the related lease liability. The right to use assets are amortized on a straight line basis over the life of the related lease.
34
CITY OF SUFFOLK, VIRGINIA
NOTES TO FINANCIAL STATEMENTS
June 30, 2022
Note 1. Summary of Significant Accounting Policies (Continued)
J. Capital Assets (continued)
The estimated useful lives of capital assets are as follows:
Buildings 40 years Improvements other than buildings 15-75 years Infrastructure 5-50 years Machinery and equipment 3-50 years Intangibles 5-10 years
Maintenance, repairs, and minor equipment less than $5,000 are expended/expensed when incurred. Costs that materially change capacities or extend useful lives are capitalized. Upon sale or retirement of land, buildings, or equipment, the cost and related accumulated depreciation, if applicable, are eliminated from the respective accounts and any resulting gain or loss is recorded.
K. Unavailable/Unearned Revenues
Unavailable revenues in the governmental funds consists of monies that are measurable but not available for use during the current period. Property taxes receivable at June 30 but not collected within 45 days after that date, are reported as unavailable revenues in the governmental funds’ financial statements. Unavailable revenues arise when assets are recognized before revenue recognition criteria can be satisfied and also when assets are recognized in connection with a transaction, but those assets are not yet available to finance expenditures of the current fiscal period. Grants and entitlements received before the eligibility requirements are met have been recorded as unearned revenues. Unearned revenues in the government-wide statements also consists of lease payments credited for future years relating to certified capital improvements at the golf course.
L. Deferred Outflows of Resources
Deferred outflows of resources represent a consumption of net assets that applies to a future period and so will not be recognized as an expense or expenditure until then. The City’s deferred outflows of resources consist of the amount by which the principal and premium of a refunding bond exceed the net carrying amount of the refunded debt. The related deferred outflow is being amortized over the remaining life of the refunded debt. Deferred outflows for pensions and OPEB related activities may result from changes in actuarial assumptions, differences between expected and actual experience, pension investment returns that exceed projected earnings, changes in proportionate share and contributions made subsequent to the measurement date. Changes in actuarial assumptions other than investment related are deferred and amortized over the remaining service life of all participants and investment experience amounts are deferred and amortized over a closed five-year period. Contributions made subsequent to the measurement date are expensed in the following year.
35
CITY OF SUFFOLK, VIRGINIA
NOTES TO FINANCIAL STATEMENTS
June 30, 2022
Note 1. Summary of Significant Accounting Policies (Continued)
M. Deferred Inflows of Resources
Deferred Inflows of resources represent an acquisition of net assets that applies to a future period and so will not be recognized as revenue until then. Deferred inflows of resources, under the modified accrual basis of accounting, can consist of revenues which are received in advance but are applicable to a future period, and will not be recognized until the period they become available. In governmental funds’ financial statements, receivables that will not be collected within the available period have also been reported as unavailable revenues. Deferred inflows for pensions and OPEB related activities may result from changes in actuarial assumptions, differences between the expected and actual experience, investment results and changes in proportionate share. Changes in actuarial assumptions not related to investment activity are deferred and amortized over the remaining service life of all participants and investment experience results are deferred and amortized over a closed five-year period. Deferred Inflows recorded related to leases receivable are recorded at the initiation of the lease in the amount equal to the initial recording of the lease receivable. The deferred inflow is amortized on a straight-line basis over the term of the lease.
N. Compensated Absences
City and School Board employees are granted vacation and sick pay in varying amounts based on years of service. Employees may accumulate, subject to certain limitations, unused vacation and sick pay earned and, upon retirement, termination, or death, may be compensated for certain amounts at specific rates. The cost of accumulated vacation and sick pay expected to be paid from future expendable resources is accounted for as a liability in the government-wide statements and proprietary fund statements.
For governmental fund types, the amount of accumulated unpaid vacation leave is recorded as a liability of the respective fund only if it has matured, for example, as a result of employee retirement or resignation. For proprietary funds, the cost of vacation and sick leave is recorded as a liability when earned.
O. Long-Term Liabilities
In the government-wide and proprietary funds’ financial statements, long-term debt and other long-term obligations are reported as liabilities in the appropriate Statement of Net Position. Bonds payable are reported net of the applicable bond premium or discount. Related bond issuance costs are expensed when incurred.
In the governmental funds’ financial statements, bond premiums, discounts, and bond issuance costs, are expended when incurred. The face amount of debt issued is reported as other financing sources while discounts on debt issuances are reported as other financing uses. Issuance costs, whether or not withheld from the actual debt proceeds received, are reported as debt service expenditures.
36
CITY OF SUFFOLK, VIRGINIA
NOTES TO FINANCIAL STATEMENTS
June 30, 2022
Note 1. Summary of Significant Accounting Policies (Continued)
P. Pension Plan
For the purpose of measuring the net pension liability, deferred outflows of resources and deferred inflows of resources related to pensions, and pension expense, information about the fiduciary net position of the City’s retirement benefits and additions to/deductions from the plan’s fiduciary net position have been determined on the same basis as they are reported by the Virginia Retirement System (the “VRS”). For this purpose, benefit payments (including refunds of employee contributions) are recognized when due and payable in accordance with the benefit terms. Investments are reported at fair value.
Q. VRS Sponsored OPEB Programs
Group Life Insurance (GLI)
The VRS GLI Program is a multiple employer, cost-sharing plan. It provides coverage to state employees, teachers, and employees of participating political subdivisions. The GLI Program was established pursuant to §51.1-500 et seq. of the Code of Virginia, as amended, and which provides the authority under which benefit terms are established or may be amended. The GLI Program is a defined benefit plan that provides a basic group life insurance benefit for employees of participating employers. For purposes of measuring the net GLI Program OPEB liability, deferred outflows of resources and deferred inflows of resources related to the GLI Program OPEB, and GLI OPEB expense, information about the fiduciary net position of the VRS GLI program OPEB and the additions to/deductions from the VRS GLI OPEB’s net fiduciary position have been determined on the same basis as they were reported by VRS. In addition, benefit payments are recognized when due and payable in accordance with the benefit terms. Investments are reported at fair value.
Line of Duty Act Program (LODA)
The LODA is a multiple-employer, cost-sharing plan. The LODA Program was established pursuant to §9.1-400 et seq. of the Code of Virginia, as amended, and which provides the authority under which benefit terms are established or may be amended. The LODA Program provides death and health insurance benefits to eligible state employees and local government employees, including volunteers, who die or become disabled as a result of the performance of their duties as a public safety officer. In addition, health insurance benefits are provided to eligible survivors and family members. For purposes of measuring the net LODA Program OPEB liability, deferred outflows of resources and deferred inflows of resources related to the LODA Program OPEB, and LODA Program OPEB expense, information about the fiduciary net position of the VRS LODA Program OPEB Plan and the additions to/deductions from the VRS LODA Program OPEB Plan’s net fiduciary position have been determined on the same basis as they were reported by VRS. In addition, benefit payments are recognized when due and payable in accordance with the benefit terms. Investments are reported at fair value.
37
CITY OF SUFFOLK, VIRGINIA NOTES TO FINANCIAL STATEMENTS
June 30, 2022
Note 1. Summary of Significant Accounting Policies (Continued)
Q. VRS Sponsored OPEB Programs (continued)
Virginia Local Disability Program (VLDP)
The VRS VLDP is a multiple-employer, cost-sharing plan. For purposes of measuring the VLDP OPEB liability, deferred outflows of resources and deferred inflows of resources related to the Teacher Employee VLDP OPEB, and the Teacher Employee VLDP OPEB expense, information about the fiduciary net position of the VRS VLDP and the additions to/deductions from the VLDP net fiduciary position have been determined on the same basis as they were reported by VRS. For this purpose, benefit payments are recognized when due and payable in accordance with the benefit terms. Investments are reported at fair value.
Teacher Employee Health Insurance Credit Program (THIC)
The VRS HIC Program is a multiple-employer, cost-sharing plan. The THIC Program was established pursuant to §51.1-1400 et seq. of the Code of Virginia, as amended, and which provides the authority under which benefit terms are established or may be amended. The THIC Program is a defined benefit plan that provides a credit toward the cost of health insurance coverage for retired teachers. For purposes of measuring the net THIC Program OPEB liability, deferred outflows of resources and deferred inflows of resources related to the Teacher Employee HIC Program OPEB, and the THIC Program OPEB expense, information about the fiduciary net position of the VRS THIC Program; and the additions to/deductions from the VRS THIC Program’s net fiduciary position have been determined on the same basis as they were reported by VRS. For this purpose, benefit payments are recognized when due and payable in accordance with the benefit terms. Investments are reported at fair value.
Non-Teacher Employee Health Insurance Credit Program (NTHIC)
The VRS NTHIC Program is a multiple-employer, agent defined benefit plan that provides a credit toward the cost of health insurance coverage for retired school board non-teacher employees. The NTHIC Program was established pursuant to §51.1-1400 et seq. of the Code of Virginia, as amended, and which provides the authority under which benefit terms are established or may be amended. For purposes of measuring the net NTHIC Program OPEB liability, deferred outflows of resources and deferred inflows of resources related to the NTHIC Program OPEB, and the NTHIC Program OPEB expense, information about the fiduciary net position of the VRS NTHIC Program; and the additions to/deductions from the VRS Teacher Employee HIC Program’s net fiduciary position have been determined on the same basis as they were reported by VRS. For this purpose, benefit payments are recognized when due and payable in accordance with the benefit terms. Investments are reported at fair value.
38
CITY OF SUFFOLK, VIRGINIA NOTES TO FINANCIAL STATEMENTS
June 30, 2022
Note 1. Summary of Significant Accounting Policies (Continued)
R. Fund Balance
Fund Balance is divided into five classifications based primarily on the extent to which the City is bound to observe constraints imposed upon the use of resources:
Nonspendable fund balance – Includes amounts that cannot be spent because they are either not in spendable form or, for legal or contractual reasons, must be kept intact. This classification includes inventories, prepaid amounts, assets held for sale, long-term receivables.
Restricted fund balance – Restricted funds are either externally imposed (such as debt covenants, grantor, contributors or other governments) or are imposed by law (constitutionally or enabling legislations).
Committed fund balance – The City’s committed funds include amounts that can only be used for specific purposes pursuant to constraints imposed by formal action of the highest level of decision making authority – City Council. Formal Council action includes the annual adoption of the City’s Budget Ordinance for the subsequent year, Council Ordinances appropriating funds and/or resources, and budget amendments to carry forward appropriations that were encumbered but unexpended at fiscal year-end. The same action of council is required to uncommit.
Assigned fund balance – Amounts in the assigned fund balance classification are intended to be used by the government for specific purposes but do not meet the criteria to be classified as committed, in accordance with the City’s financial policies. Intent can be stipulated by the governing body, or by designees with authority to assign such as the Finance Committee, or by the City Manager.
Unassigned fund balance – this is the residual classification of the General Fund. Only the General Fund can report a positive “unassigned fund balance”. Other governmental funds may report a negative balance in this classification.
General fund unassigned fund balance target – the ratio of General Fund unassigned fund balance as a percentage of budgeted governmental funds expenditures (net of the General Fund contribution to schools, transfer to other governmental funds, and capital projects fund expenditures) plus budgeted expenditures in the School operating and food service funds indicates the ability of the City to cope with unexpected financial problems or emergencies. The larger the general fund unassigned fund balance, the greater the City’s ability to cope with financial emergencies and fluctuations in revenue cycles.
The City has a financial policy goal that unassigned fund balance should be 20% of the following fiscal years governmental funds budget, using the formula stated above. The City also has a policy that any excess amounts over the 20% will be dedicated to a budget stabilization fund, until that reaches 2% of the budgeted revenue and then to a capital reserve fund, both of these reserves are reported as committed fund balance.
39
CITY OF SUFFOLK, VIRGINIA NOTES TO FINANCIAL STATEMENTS
June 30, 2022
Note 1. Summary of Significant Accounting Policies (Continued)
R. Fund Balance
The budget stabilization fund is established by City Council and will be added to as necessary each year with excess fund balance to maintain 2% of the budgeted revenue, the stabilization fund can be spent with approval of council. As of June 30, 2022, the balance is $11,741,438.
The City considers restricted fund balance to be spent when expenditures are incurred for purposes for which restricted and any other fund balance classification is available unless prohibited by legal documents or contracts. When expenditures are incurred for purposes for which committed, assigned, or unassigned amounts are available, the City considers committed fund balance to be spent first, followed by assigned fund balance, and lastly unassigned fund balance.
The School Board currently does not have a policy regarding whether to first apply restricted or other resources when expenditures are incurred.
S. Net Position
Net position in the government-wide and proprietary financial statements represents the difference between assets and deferred outflows of resources, and liabilities and deferred inflows of resources, and is classified as net investment in capital assets, restricted, or unrestricted. Net investment in capital assets consists of capital assets, net of accumulated depreciation, reduced by the outstanding balances of any borrowings used for the acquisition, construction, or improvement of those assets. Restricted net position is reported when there are assets and deferred outflows of resources, net of related liabilities and deferred inflows of resources, that have limitations imposed on their use either through enabling legislation adopted by the City or through external restrictions imposed by creditors, grantors, laws or regulations of other governments.
T. Estimates
The preparation of financial statements in accordance with GAAP requires management to make estimates and assumptions that affect certain reported amounts and disclosures. Accordingly, actual results could differ from these estimates.
U. Component Unit-School Board Capital Asset and Debt Presentation
By law, the School Board does not have taxing authority and, therefore, it cannot incur debt through general obligation bonds to fund the acquisition, construction, or improvement of its capital assets. That responsibility lies with the City to issue the debt on behalf of the School Board. However, the Code of Virginia requires the School Board to hold title to the capital assets (buildings and equipment) due to their responsibility for maintaining the assets. During the construction of the School Board assets, they are reflected in the City’s construction in progress balance.
40
CITY OF SUFFOLK, VIRGINIA NOTES TO FINANCIAL STATEMENTS
June 30, 2022
Note 1. Summary of Significant Accounting Policies (Continued)
U. Component Unit-School Board Capital Asset and Debt Presentation (continued)
In the Statement of Net Position, this scenario presents a dilemma for the City. Debt issued on behalf of the School Board is reported as a liability of the Primary Government, thereby reducing the net position of the City. The corresponding capital assets are reported as assets of the component unit – School Board (title holder), thereby increasing its net position.
V. Change in Accounting Principle
Effective July 1, 2021 the City has implemented the provisions of the following GASB Statements.
GASB Statement No. 87, Leases which established improved accounting and financial reporting for leases. Leases are defined as a contract, which conveys control of the right to use another entity’s nonfinancial asset for a period of time. The implementation of this statement is reflected as a prior period adjustment to the beginning net position for both leases as a lessee and as a lessor. The implementation of the statement is shown throughout the notes to the financial statements in the notes specifically related to Leases and a note related to the prior period adjustment.
GASB Statement No. 89, Accounting for Interest Cost Incurred before the End of a Construction Period, which requires that interest costs incurred prior to the end of a construction period be recognized as an expense in the period in which the cost is incurred. The implementation of this standard had no impact on the financial reporting for the City.
GASB Statement No. 92, Omnibus 2020, the objective of which is to enhance comparability in accounting and financial reporting and to improve the consistency of authoritative literature by addressing practice issues that have been identified during implementation and application of certain GASB Statements. The implementation of this standard has no material impact on the financial reporting for the City.
GASB Statement No. 93, Replacement of Interbank Offered Rates, addresses the accounting and financial reporting implications that result from the replacement of an IBOR (interbank offered rate). The implementation of this standard has no material impact on the financial reporting for the City.
GASB Statement No. 97, Certain Component Unit Criteria, and Accounting and Financial Reporting for Internal Revenue Code Section 457 Deferred Compensation Plans, and Amendment of GASB Statements No. 14 and No. 84, and a Supersession of GASB Statement No. 32, the objective of which are to (1) increase consistency and comparability related to the reporting of fiduciary component units in circumstances in which a potential component unit does not have a governing board, (2) mitigate costs associated with the reporting of certain defined contribution pension plans, defined contribution other postemployment benefit plans, and employee benefit plans other than pension plans or OPEB plans as fiduciary component units, and (3) enhance the relevance, consistency and comparability of the account and financial reporting for the Internal Revenue Code Section 457 deferred compensation plans. The implementation of this standard has no material impact on the financial reporting for the City.
41
CITY OF SUFFOLK, VIRGINIA NOTES TO FINANCIAL STATEMENTS
June 30, 2022
Note 2. Deposits and Investments
Deposits
Deposits with banks are covered by the Federal Deposit Insurance Corporation (the “FDIC”) and collateralized in accordance with the Virginia Security for Public Deposits Act (the “Act”) Section 2.2-4400 et. seq. of the Code of Virginia. Under the Act, banks and savings institutions holding public deposits in excess of the amount insured by the FDIC must pledge collateral to the Commonwealth of Virginia Treasury Board. Financial institutions may choose between two collateralization methodologies and depending upon that choice, will pledge collateral that ranges in the amounts from 50% to 130% of excess deposits. Accordingly, all deposits are considered fully collateralized.
Investments
The City’s investments are subject to credit risk, concentration of credit risk, and interest rate risk as described below. The City’s investments are not subject to custodial risk or foreign currency risk.
Credit Risk
Credit risk is the risk that an issuer or other counterpart to an investment will not fulfill its obligations. Credit risk is measured by the assignment of a rating by a nationally recognized statistical rating organization. If a credit quality disclosure is required and the investment is unrated, the disclosure should indicate that fact.
Statutes authorize the City to invest in obligations of the United States or agencies thereof, obligations of the Commonwealth of Virginia or political subdivisions thereof, obligations of the International Bank for Reconstruction and Development (the “World Bank”), the Asian Development Bank, the African Development Bank, “prime quality” commercial paper and certain corporate notes, bankers’ acceptances, repurchase agreements, the State Treasurer’s Local Government Investment Pool (the “LGIP”), and the State Non-Arbitrage Program (the “SNAP”). The City’s policy emphasizes the use of securities of high credit quality and marketability, and follows statute, but does not specify minimum credit ratings.
The Virginia Pooled OPEB Trust Fund’s investments are not restricted to fixed-income securities but rather are commingled across sectors and include investments in fixed-income securities, equity securities, and real assets. Credit quality disclosure is not required for the Virginia Pooled OPEB Trust Fund.
Interest Rate Risk
Interest rate risk is the risk that change in interest rates will adversely affect the fair value of an investment.
The City Treasurer’s policy states that the investment portfolio shall be designed to attain a market rate of return, taking into account investment risk constraints and liquidity needs. The portfolio shall be structured so that securities mature concurrent with estimated cash needs and remain sufficiently liquid to meet anticipated operating requirements. Investment of current operating funds shall have maturities of no longer than 24 months.
42
CITY OF SUFFOLK, VIRGINIA NOTES TO FINANCIAL STATEMENTS
June 30, 2022
Note 2. Deposits and Investments (Continued)
Interest Rate Risk (continued)
Interest rate risk does not apply to the SNAP pooled investments. Investments held in the Virginia Pooled OPEB Trust Fund are not restricted to fixed-income securities but rather are commingled across sectors and include investments in fixed-income securities, equity securities and real assets. Interest rate disclosures for the Virginia Pooled Trust fund is not required.
External Investment Pool
The SNAP is an open-end management investment company registered with the Securities and Exchange Commission (the “SEC”). The fair value of the positions in the SNAP is the same as the net asset value of the pool shares.
Concentration of Credit Risk
Concentration of credit risk is the risk of loss attributed to the magnitude of a governments investment in a single issuer. Investments in external investment pools are excluded from the concentration of credit risk disclosure requirements. 100% of the City’s investments at June 30 were with SNAP. These investments were not considered by management to represent a risk to the City.
Fair Value Disclosures
Fair value disclosures related to the Virginia Pooled OPEB Trust Fund are as follows:
Portfolio I: The fair value of portfolio I is determined using the NAV per share of the investments. Portfolio I is an external investment pool and is constructed to achieve an expected rate of return of approximately 7.5%. This objective is achieved by weighting the asset allocation more heavily towards equities and real assets, an allocation that tends to have greater market volatility than a portfolio weighted more heavily towards fixed income. The portfolio includes investments diversified across fixed-income, equities, and real assets. Participant redemptions may be made to pay authorized OPEB expenses. Participant withdrawals are redeemable quarterly and require a ninety-day written notice.
Portfolio II: The fair value of Portfolio II is determined using the NAV per share of investments. Portfolio II is an external investment pool and is constructed to achieve an expected rate of return of approximately 6.0% and to experience less volatility by allocating a greater weight to fixed-income investments than equity investments. The portfolio includes investments diversified across fixed-income, equities, and real assets. Participant redemptions may be made to pay authorized OPEB expenses. Participant withdrawals are redeemable quarterly and require a ninety-day written notice.
43
CITY OF SUFFOLK, VIRGINIA
NOTES TO FINANCIAL STATEMENTS
June 30, 2022
Note 2. Deposits and Investments (Continued)
Restricted Cash
The City has restricted cash as follows:
Governmental Activities Business-type Activities Primary Government
Unspent debt proceeds 69,228,527 $ 7,909,901 $ 77,138,428 $
Capital Projects 492,720 20,515,790 21,008,510 Cemetery 937,254 - 937,254 Escrow/bond/customer deposits 1,167,500 - 1,167,500 Other external purposes 25,852,662 3,031,251 28,883,913
Total 97,678,663 $ 31,456,942 $ 129,135,605 $
Cash and Cash Equivalents
Component Units
Primary Government School Board
Economic Development Authority
Deposits and Investments: SNAP 77,138,428 $ - $ - $ Deposits 316,538,113 23,954,979 8,256,922 Total 393,676,541 $ 23,954,979 $ 8,256,922 $
Statement of Net Position: Cash and cash equivalents 264,540,936 $ 23,954,979 $ 6,133,044 $ Cash and cash equivalents, restricted 129,135,605 - 2,123,878
Total 393,676,541 $ 23,954,979 $ 8,256,922 $ 44
CITY OF SUFFOLK, VIRGINIA
NOTES TO FINANCIAL STATEMENTS
June 30, 2022
Note 3. Receivables
Receivables are as follows:
Governmental Activities
General Road Maintenance Consolidated Grants Fund
Internal Service Funds
Non-major Governmental Funds Fleet Management Information Technology Total
Taxes 8,328,372 $ - $ - $ 11,726 $ - $ - $ 8,340,098 $ Accounts 6,716,363 89,380 2,500 130,988 156,262 61,000 7,156,493
Subtotal 15,044,735 89,380 2,500 142,714 156,262 61,000 15,496,591
Less Allowance (4,777,785) - - (209) - - (4,777,994)
Receivables, net 10,266,950 $ 89,380 $ 2,500 $ 142,505 $ 156,262 $ 61,000 $ 10,718,597 $
Business-type Activities
Utilities Refuse Stormwater Total
Component Unit -- School Board
Accounts 8,426,921 $ 731,911 $ 293,749 $ 9,452,581 $ 214,616 $
Less Allowance (663,651) (155,367) (85,481) (904,499) -
Receivables, net 7,763,270 $ 576,544 $ 208,268 $ 8,548,082 $ 214,616 $
Allowances for Uncollectible Accounts
The City calculates its allowances for uncollectible receivables using historical collection data and specific account analysis. The receivables shown on the Statement of Net Position are presented net of the following allowances for doubtful accounts:
Governmental Activities Business-type Activities
General Fund - Taxes receivable 3,729,454 $ - $ General Fund - EMS receivable 1,048,331 -
Non-major Funds - Taxes receivable 209Utility Fund - Accounts receivable - 663,651 Non-major Proprietary Funds - accounts receivable - 240,848 4,777,994 $ 904,499 $
45
CITY OF SUFFOLK, VIRGINIA
NOTES TO FINANCIAL STATEMENTS
June 30, 2022
Note 3. Receivables (Continued)
Property Taxes – Property taxes are levied as of January 1 for personal property for the current calendar year and as of July 1 for real estate for the current year, based on the assessed value the related property as of the date. The City’s legal right to collect property taxes attaches each year when the rates are approved and the taxes are assessed. Real estate taxes are collectible twice a year, on December 5 and June 5. Personal property taxes are due on December 5. Amounts not collected within 45 days after the end of the fiscal year are reflected as unearned revenues in the General Fund. A lien is created when the real estate taxes are levied and, after three years, it becomes enforceable by judicial sale of the property
Note 4. Due from Other Governments
Due from other governments in the fund statements are as follows:
Primary Government: General Capital Projects
Commonwealth of Virginia:
Consolidated Grants
Non-major Governmental Funds Total
State sales tax 1,356,884 $ - $ - $ - $ 1,356,884 $
Communication sales tax 204,387 - - - 204,387 Non-categorical state aid 310,464 - - - 310,464 Shared expenses 1,801 - - - 1,801 Social services reimbursement 60,239 - - - 60,239 VA Department of Transportation - 1,817,454 - - 1,817,454 Various other state aid and grants 187,618 - 1,057,710 580,741 1,826,069 2,121,393 1,817,454 1,057,710 580,741 5,577,298
Federal Government: Social services reimbursement 284,221 - - - 284,221 Various grants - 30,353 1,084,241 - 1,114,594 284,221 30,353 1,084,241 - 1,398,815
Total due from other governments 2,405,614 $ 1,847,807 $ 2,141,951 $ 580,741 $ 6,976,113 $
46
CITY OF SUFFOLK, VIRGINIA NOTES TO FINANCIAL STATEMENTS
June 30, 2022
Note 4. Due from Other Governments (Continued)
Component Unit – School Board: School Operating School Grants School Food Service Total
Commonwealth of Virginia: State sales tax 1,898,608 $ - $ - $ 1,898,608 $ Security Equipment Grant 146,063 - 146,063 1,898,608 146,063 - 2,044,671
Federal Government: School food reimbursement - - 1,745,975 1,745,975
HVAC ARP CSLFRF - 1,000,000 - 1,000,000 Title I - 1,803,464 - 1,803,464 CARES III - 1,985,306 - 1,985,306 Title VI-B - 904,565 - 904,565 CARES I - 39,832 - 39,832 CARES II - 1,453,386 - 1,453,386 Various grants 55,473 507,309 - 562,782 55,473 7,693,862 1,745,975 9,495,310 Local - 49,386 - 49,386 Total due from other governments 1,954,081 $ 7,889,311 $ 1,745,975 $ 11,589,367 $
Note 5. Interfund Transactions: General Fund Capital Projects Major Special Revenue Debt Service
Transfers to:
Non-major Special Revenue Enterprise Funds Internal Service Funds Total Transfers from: General Fund - $ 5,641,950 $ 639,651 $ 25,699,851 $ 925,778 $ 253,876 $ 332,929 $ 33,494,035 $ Major Special Revenue 714,960 1,055,448 - 1,326,220 - - - 3,096,628 Capital Projects - - - 154,227 - 260,915 - 415,142 Utility 808,685 - - - - - - 808,685
Non-major: Special Revenue 184,918 753,659 - 398,460 - - - 1,337,037 Enterprise 582,269 - - - 195,237 - - 777,506 Internal Service 639,815 - - - - - - 639,815 2,930,647 $ 7,451,056 $ 639,651 $ 27,578,758 $ 1,121,015 $ 514,791 $ 332,929 $ 40,568,848 $
Transfers are used to (1) move revenues from the funds that statute or budget requires to collect them to the funds that statute or budget requires to expend them and (2) use unrestricted revenues collected in the General Fund to finance various programs accounted for in other funds in accordance with budgeting authorization.
47
CITY OF SUFFOLK, VIRGINIA NOTES TO FINANCIAL STATEMENTS
June 30, 2022
Note 6. Transactions between Primary Government and Component Units
Significant Transactions of the City and Component Unit – School Board
Certain transactions between the City and School Board are explained here in detail to provide a more informed understanding of the operational relationship of the two entities and how such transactions are presented in the financial statements.
1. The School Board can neither levy taxes nor incur debt under Virginia Law. Therefore, the City issues debt “on behalf” of the School Board. The debt obligation is recorded as a liability of the City. The proceeds from the debt issued “on behalf” of the School Board are recorded in the City’s General Fund. This fund then accounts for capital expenditures relating to major school construction projects.
2. Debt service payments for school related bonded debt are reported as part of the City in the Statement of Revenues, Expenditures, and Changes in Fund Balance – Governmental Fund.
3. If all economic resources associated with school activities were reported with the School Board, its total expenditures would be as follows:
Expenditures of School Board – Component Unit $ 191,782,099
Repayment of School Board debt 10,156,192 $ 201,938,291
48
CITY OF SUFFOLK, VIRGINIA NOTES TO FINANCIAL STATEMENTS
June 30, 2022
Note 7. Capital Assets
The following is a summary of governmental activities’ capital asset activity: Beginning Balance* Increases Decreases Ending Balance
Capital Assets, non-depreciable
Governmental Activities
Land
23,487,994 $ 131,400 $ - $ 23,619,394 $ Construction in Progress 112,831,237 48,026,862 8,429,152 152,428,947
Total Capital assets, non-depreciable 136,319,231 48,158,262 8,429,152 176,048,341
Capital Assets, depreciable Buildings 129,269,713 70 - 129,269,783 Infrastructure 439,958,896 - 217,111 439,741,785 Improvements other than buildings 57,556,313 1,908,324 - 59,464,637 Machinery and equipment* 109,373,731 10,492,941 2,955,087 116,911,585 Intangible right to use leased assets - Equipment* 6,009,092 - - 6,009,092 Intangible right to use leased assets - Real Estate* 18,716,537 - - 18,716,537 Intangibles 4,314,785 2,850,374 - 7,165,159
Total capital assets, depreciable 765,199,067 15,251,709 3,172,198 777,278,578
Less accumulated depreciation for: Buildings 42,903,291 3,000,707 - 45,903,998 Infrastructure 190,716,371 31,809,097 - 222,525,468
Improvement other than buildings 18,136,237 2,106,930 - 20,243,167 Machinery and equipment* 81,035,342 6,280,167 2,470,178 84,845,331
Intangible right to use leased assets - Equipment - 950,095 - 950,095
Intangible right to use leased assets - Real Estate - 1,223,918 - 1,223,918 Intangibles 2,586,616 497,621 - 3,084,237
Total accumulated depreciation 335,377,857 45,868,535 2,470,178 378,776,214
Total capital assets, depreciable, net 429,821,210 (30,616,826) 702,020 398,502,364
Governmental activities, capital assets, net 566,140,441 $ 17,541,436 $ 9,131,172 $ 574,550,705 $
* Beginning balance restated for implementation of GASB 87
49
CITY OF SUFFOLK, VIRGINIA
NOTES TO FINANCIAL STATEMENTS
June 30, 2022
Note 7. Capital Assets (Continued)
The following is a summary of depreciation expense charged to various functions:
Governmental Activities:
General government $ 6,249,199 Judicial administration 8,306 Public safety 1,935,335 Public works 35,562,483 Community Development 1,140,110 Education 5,091 Parks, recreation, and cultural 968,011 45,868,535 $
Government activities included depreciation of $2,252,595 for the Fleet Maintenance fund, $104,805 for the Risk Management fund, and $721,716 for Information Technology fund.
The following is a summary of Business-type Activities capital asset activity:
Business-type Activities
Beginning Balance* Increases Decreases Ending Balance
Capital Assets, non-depreciable Land 4,675,235 $ - $ - $ 4,675,235 $ Construction in Progress 27,036,478 10,686,203 18,782,180 18,940,501
Total Capital assets, non-depreciable 31,711,713 10,686,203 18,782,180 23,615,736
Capital Assets, depreciable Buildings 105,338,227 2,999,631 - 108,337,858 Improvements other than buildings 411,481,896 9,708,968 - 421,190,864 Infrastructure 24,656 - - 24,656 Machinery and equipment 113,993,137 10,684,964 - 124,678,101 Intangible right to use leased assets - equipment 5,038,898 - - 5,038,898 Intangibles 17,075,977 761,025 - 17,837,002
Total capital assets, depreciable 652,952,791 24,154,588 - 677,107,379
Less accumulated depreciation for: Buildings 32,403,302 2,471,276 - 34,874,578 Improvement other than buildings 121,695,720 8,096,193 - 129,791,913
Infrastructure 2,311 617 - 2,928 Machinery and equipment 53,848,430 4,325,614 - 58,174,044 Intangible right to use leased assets - equipment - 919,569 - 919,569 Intangibles 9,384,895 2,424,742 - 11,809,637
Total accumulated depreciation 217,334,658 18,238,011 - 235,572,669
Total capital assets, depreciable, net 435,618,133 5,916,577 - 441,534,710
Business-type activities, capital assets, net 467,329,846 $ 16,602,780 $ 18,782,180 $ 465,150,446 $
50
CITY OF SUFFOLK, VIRGINIA NOTES TO FINANCIAL STATEMENTS
June 30, 2022
Note 7. Capital Assets (Continued)
The City has recorded right to use leased assets. The assets are right to use assets for leased equipment and real estate. The related leases are discussed in the Leases note (see note 10). The right to use lease assets are amortized on a straight-line basis over the terms of the related lease.
The following is a summary of Component Unit – School Board capital asset activity:
Component Unit -- School Board
Beginning Balance Increases Decreases Ending Balance
Capital Assets, non-depreciable Land 6,387,523 $ - $ - $ 6,387,523 $
Total Capital assets, non-depreciable 6,387,523 - - 6,387,523
Capital Assets, depreciable Buildings 255,791,049 1,084,588 - 256,875,637 Improvements other than buildings 16,650,054 364,444 - 17,014,498 Machinery and equipment 60,963,780 2,394,516 147,622 63,210,674
Total capital assets, depreciable 333,404,883 3,843,548 147,622 337,100,809
Less accumulated depreciation for: Buildings 114,719,201 5,078,296 - 119,797,497 Improvement other than buildings 13,368,396 458,572 - 13,826,968 Machinery and equipment 41,014,810 5,679,805 147,622 46,546,993
Total accumulated depreciation 169,102,407 11,216,673 147,622 180,171,458
Total capital assets, depreciable, net 164,302,476 (7,373,125) - 156,929,351
Component Unit - School Board, capital assets, net 170,689,999 $ (7,373,125) $ - $ 163,316,874 $
51
CITY OF SUFFOLK, VIRGINIA NOTES TO FINANCIAL STATEMENTS
June 30, 2022
Note 8. Unavailable and Unearned Revenues
Governmental funds report unavailable revenues in connection with receivables for revenues that are not considered to be available to liquidate liabilities in the current period. Governmental funds also defer revenue recognition in connection with resources that have been received, but not yet earned. At year end, the various components of unavailable revenues and unearned revenues in the governmental funds and governmental activities were as follows:
Governmental Funds' Governmental Activities' Unavailable Revenues Unearned Revenues
Liability:
Grant receipts -- unearned 24,602,150 $ 24,602,150 $
Golf-course lease revenue -- unearned (Note 10) - 1,148,624
Total unavailable/unearned revenues 24,602,150 $ 25,750,774 $
Deferred inflows of resouces:
Prepaid taxes and other amounts -- unearned 1,350,840 $ 1,350,840 $ Leases receivable 1,879,447 1,879,447
Developer deposits -- unearned (General) 1,167,500 1,167,500
Developer deposits -- unearned (Road Maintenance) 447,224 447,224 Hanger deposits -- unearned (Aviation) 18,587 18,587
Proffers received -- unearned 5,140,053 5,140,053
Taxes receivable, net -- unavailable 3,004,937 -
Total unavailable/unearned revenues -- governmental funds 13,008,588 $ 10,003,651 $
Unearned revenue in the Utility Fund of $332,011 represents payments that will be recognized as the City provides services to the Western Tidewater Water Authority.
52
CITY OF SUFFOLK, VIRGINIA
NOTES TO FINANCIAL STATEMENTS
June 30, 2022
Note 9. Long-Term Liabilities
The following is a summary of changes in long-term liabilities:
Beginning Balance* Additions Reductions Ending Balance Due Within One Year
Governmental Activities:
General obligation debt 271,347,465 $ 45,295,000 $ 36,593,993 $ 280,048,472 $ 21,874,488 $ Bonds from direct borrowing and direct placements 4,350,000 - 600,000 3,750,000 415,000 Add bond premiums and other credits 17,819,142 2,966,979 3,340,749 17,445,372 1,971,788 293,516,607 48,261,979 40,534,742 301,243,844 24,261,276
Lease Liabilities * 24,725,629 - 3,080,669 21,644,960 2,330,538 318,242,236 48,261,979 43,615,411 322,888,804 26,591,814
Net pension liability 56,536,142 39,715,408 78,426,633 17,824,917Net OPEB liability City trust 7,667,851 6,135,865 13,590,866 212,850Net OPEB liability state plans 16,402,073 10,040,571 10,774,723 15,667,921 179,026 Claims payable 4,326,719 16,267,741 16,558,715 4,035,745 2,384,806 Compensated absences 6,550,550 2,382,056 2,410,847 6,521,759 3,224,087
Governmental activities, long-term liabilities 409,725,571 $ 122,803,620 $ 165,377,195 $ 367,151,996 $ 32,379,733 $
Business-type activities: General obligation bonds 171,182,535 $ 980,000 $ 8,971,007 $ 163,191,528 $ 8,370,512 $ Revenue bonds 204,755,000 15,190,000 18,425,000 201,520,000 5,360,000
Bonds from direct borrowing and direct placements 3,996,000 - 775,000 3,221,000 785,000 Add bond premiums and other credits 18,009,839 694,611 3,548,116 15,156,334 820,180 397,943,374 16,864,611 31,719,123 383,088,862 15,335,692
Lease Liabilities * 5,038,898 - 905,588 4,133,310 911,304 402,982,272 16,864,611 32,624,711 387,222,172 16,246,996
Net pension liability 8,772,427 5,713,285 11,803,089 2,682,623 -
Net OPEB liability City trust 1,408,381 1,073,337 2,444,156 37,562 -
Net OPEB liability state plans 752,958 158,763 392,009 519,712Compensated absences 846,161 512,095 475,798 882,458 535,816 Business-type activities, long-term liabilities 414,762,199 $ 24,322,091 $ 47,739,763 $ 391,344,527 $ 16,782,812 $
* Beginning balances for Leases have been restated relating to the implementation of GASB 87.
The liability for compensated absences will be liquidated out of the funds in which the employee is normally paid from. For the Governmental activities these funds include: The General Fund, Roads Maintenance Fund, and Fleet, Risk Management and Information Technology internal service funds. The liability for the claims payable will be liquidated out of the Risk Management internal service fund.
53
CITY OF SUFFOLK, VIRGINIA
NOTES TO FINANCIAL STATEMENTS
June 30, 2022
Note 9. Long-Term Liabilities (Continued)
Details of long-term indebtedness are as follows:
Bonds Payable:
General Obligation Bonds:
Issue Date
Final Maturity Interest Rate Authorized and Issued Governmental Activities Business-type Activities
2011 VPSA Local School Bond (a) 12/15/1106/30/314.97 7,500,000 3,750,000 -
2013 Public Improvement and Refunding Bonds 07/30/1312/01/323.00-5.0064,415,000 5,663,472 4,331,528
2014 Public Improvement and Refunding Bonds 07/30/1502/01/422.00-5.00124,820,000 7,760,000 4,275,000
2015 Public Improvement and Refunding Bonds 07/08/1502/01/352.00-5.0041,170,000 11,240,000 -
2016 Public Improvement and Refunding Bonds 07/14/1602/01/361.50-5.0051,085,000 42,495,000 -
2016 Refunding Bonds -- Taxable 07/14/1602/01/351.10-4.0025,745,000 18,100,000 -
2017 Public Improvement and Refunding Bonds 07/27/1702/01/423.125-5.0069,775,000 24,505,000 36,760,000
2017 Taxable Refunding Bonds 07/27/1702/01/322.25-3.3620,245,000 - 19,145,000
2018 Public Improvement Bonds 08/14/1802/01/38 2.95 - 5.00 18,530,000 16,555,000 160,000
2019 Public Improvement Bonds 09/26/1902/01/40 2.5 - 5.00 21,705,000 19,980,000 350,000
2019 Taxable Refunding Bonds 09/26/1902/01/33 1.87 - 2.76 52,335,000 28,025,000 19,720,000
2020A Public Improvement Bonds 09/15/2002/01/41 1.125 - 5.00 25,635,000 25,100,000 -
2020AB Public Improvement Refunding Bonds 09/15/2002/01/42 0.18 - 2.41 115,800,000 35,540,000 77,495,000
2021A Public Improvement Bonds 10/05/2102/01/42 1.625 - 5.00 27,305,000 27,305,000 -
2021AB Public Improvement Refunding Bonds 10/05/2102/01/35 0.10 - 2.00 18,970,000 17,780,000 955,000
Total general obligation bonds 283,798,472 $ 163,191,528 $
54
CITY OF SUFFOLK, VIRGINIA
NOTES TO FINANCIAL STATEMENTS
June 30, 2022
Note 9. Long-Term Liabilities (Continued)
Details of long-term indebtedness are as follows: (Continued)
Issue Final Interest Authorized Bus iness-type Date Maturity Rate and Issued Activities
Bonds Payable:
Pledged Revenue Bonds Virginia Resources Authority (VRA):
2015B VRA Revenue and Refunding Bonds 11/18/1510/01/453.12-5.12%81,125,000 $ 40,195,000 $
2016C VRA Revenue and Refunding bonds 11/16/1610/21/432.12-5.1292,795,000 78,070,000
2017C VRA Revenue bonds 11/01/1710/01/423.012-5.12514,355,000 13,410,000
2019 VRA Refunding Bonds (a) 01/19/0010/01/251.88 4,854,000 3,221,000
2020 VRA Revenue Bonds 07/22/2010/01/46 2.125 - 5.125 14,020,000 13,715,000
2020 VRA Refunding Bonds 10/27/2010/01/45 0.374 - 2.954 41,585,000 40,940,000
2021 VRA Refunding Bonds 11/17/2110/01/37 1.485 - 2.818 15,190,000 15,190,000
Total pledged revenue bonds 204,741,000 $
(a) Indicates the bond is a direct placement or borrowing
The annual requirements to amortize long-term debt and related interest as follows:
Governmental Activities
General Obligations Bonds
Year Ending June 30, Principal Interest Principal Interest
Bonds from direct borrowings or placements
2023 21,874,488 $ 8,441,944 $ 415,000 $ 318,750 $ 2024 22,514,488 7,521,621 415,000 318,750 2025 22,499,496 6,557,614 415,000 318,750 2026 22,190,000 5,819,286 415,000 318,750 2027 21,780,000 5,187,739 415,000 318,750 2028-203290,565,000 17,047,553 1,675,000 1,115,625 2033-203759,345,000 6,090,988 -2038-204219,280,000 1,044,838 -280,048,472 $ 57,711,583 $ 3,750,000 $ 2,709,375 $
55
CITY OF SUFFOLK, VIRGINIA
NOTES TO FINANCIAL STATEMENTS
June 30, 2022
Note 9. Long-Term Liabilities (Continued)
Business-type Activities
General Obligations Bonds Revenue Bonds
Year Ending June 30, Principal Interest Principal Interest Principal Interest
Revenue Bonds from Direct Placement
2023 8,370,512 $ 4,022,073 $ 5,360,000 $ 6,877,308 $ 785,000 $ 53,176 $ 2024 8,535,512 3,700,892 5,570,000 6,658,752 800,000 38,277 2025 8,840,504 3,399,012 5,805,000 6,426,622 811,000 23,133 2026 9,020,000 3,221,113 6,070,000 6,167,828 825,000 7,755 2027 9,235,000 3,033,958 7,210,000 5,882,893 -2028-203244,475,000 12,432,351 43,235,000 25,178,408 -2033-203746,950,000 7,811,108 52,420,000 17,725,461 -2038-204226,665,000 2,450,291 61,740,000 6,945,894 -2043-20471,100,000 34,749 14,110,000 835,675 -163,191,528 $ 40,105,547 $ 201,520,000 $ 82,698,841 $ 3,221,000 $ 122,341 $
Pledge-Revenue Bond Restrictions:
The City’s Utility fund has outstanding obligations with VRA for which revenue has been pledged to secure the obligations. The net revenues of the Utility Fund have been pledged to meet the debt service requirement of these bonds. The bonds have been issued to finance the capital improvements and construction of the water and sewer systems. The total amount remaining debt service to be paid over the life of these VRA bonds is $287,562,182 through 2047
In accordance with the master trust indenture, the revenue covenant has been met for the pledged-revenue bonds. Net revenues are required to be no less than greater of (i) the sum of 1.5 times senior debt service and 1.0 times subordinate debt service for the fiscal year (ii) net revenues are not less than 1.0 times the funding requirements for transfers from the revenue fund to the bond fund, the parity debt service fund, the debt service reserve fund, the subordinate debt service fund, the repair and replacement reserve fund, and the rate stabilization fund. This coverage ratio for the current year is 2.95, which exceeds the requirement. Furthermore, there has been no occurrence of any condition or event which constitutes, or which, with notice or lapse of time, or both, would constitute an event of default within the terms of the master trust indenture.
General Obligation Bonds and the Legal Debt Limit:
General Fund revenues are used to pay all general long-term liabilities. The City retains the liability for the portion of general obligation bonds issued to fund capital projects of the School Board.
The General Fund has a contingent liability for repayment of the general obligation bonds outstanding in the Utility Fund, from which repayment is anticipated, should the Utility Fund be unable to do so.
56
CITY OF SUFFOLK, VIRGINIA
NOTES TO FINANCIAL STATEMENTS
June 30, 2022
Note 9. Long-Term Liabilities (Continued)
General Obligation Bonds and the Legal Debt Limit (continued)
General obligation bonds are direct obligations and pledge the full faith and credit of the City. The Commonwealth of Virginia imposes a legal limit of 10% of the assessed valuation of taxable real property on the amount of general obligation borrowing which may be outstanding by the City. The City has independently set a lower debt limit of 7% of the assessed valuation. As of June 30, 2022, the City’s aggregate general obligation indebtedness is approximately $701.9 million less than the Commonwealth’s limit and $358.9 million less than the City’s independent limit
School Board Long-Term Liabilities:
Following is a summary of changes in noncurrent liabilities of the School Board for the year ended June 30, 2022:
Beginning Balance Additions Reductions Ending Balance
Due Within One Year Component Unit - School Board Other postemployment benefits, net 20,311,855 $ - $ 2,400,847 $ 17,911,008 $ - $ Net pension liability 139,814,099 - 65,973,846 73,840,253Compensated Absences 2,805,968 1,958,103 1,639,950 3,124,121 322,312 162,931,922 $ 1,958,103 $ 70,014,643 $ 94,875,382 $ 322,312 $
Direct Borrowings or Placements:
The City has outstanding bonds from direct borrowings and placement related to governmental activities and Business-type activities of $3,750,000 and $3,221,000, respectively All of the bonds from direct borrowings are secured by the full faith and credit of the City’s. A portion of the direct borrowing bonds in the amount of $3,750,000 are bonds issued with the Virginia Public School Authority(VPSA). These VPSA bonds contain 1) a provision that if a default exists the governor of the State of Virginia may intercept other state aid to the City to pay the bonds and 2) a clause that allows the lender to require redemption in whole or part if it is necessary to maintain the bonds as qualified tax credit bonds, the lender may, with 90 days written notice require redemption if there are amendments to the applicable tax section or there is a reduction or elimination of the refundable credit received by the lender.
Refunding of Debt
During the fiscal year, the City issued general obligation bonds to refund previously issued General Obligation bonds that were originally issued for both the Governmental Activities and the Business-Type Activities. The City also issued revenue bonds through the VRA to refund a previously issued revenue bond through the VRA.
57
CITY OF SUFFOLK, VIRGINIA
NOTES TO FINANCIAL STATEMENTS
June 30, 2022
Note 9. Long-Term Liabilities (Continued)
Refunding of Debt (continued)
General Government Utilities Utilities
Type of bonds refunded G.O. Bonds G.O. Bonds VRA Revenue Bonds
Issue date of refunded bonds 10/5/2021 10/5/2021 11/17/2021
Total refunding bonds issued (new bonds)
$17,990,000 $980,000 $15,190,000
Value of Refunded bonds (old bonds) $15,934,505 $890,494 $13,475,000
Net Proceeds of refunding (including the premiums and costs of issuance) $17,990,000 $980,000 $15,954,611
Bond premium received $- $- $694,611
Costs of issuance $229,126 $12,482 $176,635
Aggregate difference in debt service savings $666,151 $37,201 $945,359
Difference in carrying values of debt (deferred debit) $783,880 $46,086 $1,547,120
Prior Year Defeasances:
In prior years, the City defeased certain general obligation and other bonds by placing the proceeds of new bonds in an irrevocable trust to provide all future debt service payments on the old bonds. Accordingly, the trust account assets and the liability for the defeased bonds are not included in the City’s financial statements. At June 30, 2022, the balance of these defeased bonds was $184,955,000
Bonds Authorized and Unissued:
There was no bonded debt authorized by City Council in previous years but unissued as of June 30, 2022.
Note 10. Leases
City as a Lessor – Leases Receivable:
The City has recorded fifty-eight (58) GASB Statement No. 87 leases where the City is a lessor. The revenues are received for leasing airport hangars, farmland, and communications antenna space. These related leases are discussed by type below. The discount rate for all leases is based on the average of the City’s Municipal Market Data (MMD) rate. The discount rates assigned to each lease is the average MMD rate from 7/1/2021 – 02/01/2022 and the number of years of the lease.
58
CITY OF SUFFOLK, VIRGINIA
NOTES TO FINANCIAL STATEMENTS
June 30, 2022
Note 10. Leases (continued)
City as a Lessor – Leases Receivable (continued)
Lessor activity for the year ended June 30, 2022 is as follows:
The City has a communications antenna space lease. Under the lease the lessee pays $34,560 per year for a total of 5 years, ending on December 31, 2024 and, $41,472 per year for the next 5 years, in exchange for space on the City’s communications antenna. In fiscal year 2022, the City recognized $43,595 of lease revenues and $14,802 of interest income. This lease has no variable payment terms. The lease is measured at the present value of future minimum lease payments expected to be received during the lease term at a discount rate equal to the average MMD rate for the City.
The City has two (2) farm land leases. Under the lease the lessees pay $10,250 per year for a total of 10 years, in exchange for the right to farm the associated land. In fiscal year 2022, the City recognized $1,370 of lease revenues and $26 of interest income. This lease has no variable payment terms. The leases are measured at the present value of future minimum lease payments expected to be received during the lease term at a discount rate equal to the average MMD rate for the City.
The City has fifty-five (55) airport hangar leases. Under the lease the city collects $16,304 per month in lease revenues for a total of 60 months, in exchange for the use of the hangars at the airport. In fiscal year 2022, the City recognized $215,116 of lease revenues and $5,678 of interest income. These leases have no variable payment terms. The leases are measured at the present value of future minimum lease payments expected to be received during the lease term at a discount rate equal to the average MMD rate for the City.
City as a Lessee:
The City has entered into various agreements to lease certain equipment, buildings, office space and land. The lease agreements qualify as other than short-term leases under GASB 87 and, therefore, have been recorded at the present value of the future minimum lease payments as of the date of July 1, 2021 for the initial implementation of GASB 87. The agreements have varying contractual dates.
There are no conditions related to any additional variable payments, such as those based on the future performance of the lessee or usage of the underlying asset, that are not included in the lease liabilities.
There are no residual value guarantees not included in the lease liability, along with the terms and conditions of the guarantees.
The discount rate is based on the average of the City’s Municipal Market Data (MMD) rate. The discount rate assigned to each lease is the average MMD rate from 7/1/21 – 2/1/22 and the number of years of the lease.
There are no future lease commitments, sublease transactions, sale-leaseback or lease back transactions on lease assets.
59
CITY OF SUFFOLK, VIRGINIA
NOTES TO FINANCIAL STATEMENTS
June 30, 2022
Note 10. Leases (continued)
City as a Lessee (continued):
The detail for the City’s lease agreements are contained below:
Number of individual leases Buildings 12/31/2023, and 5/31/2044 2 Land 06/30/2035, and 06/30/2026 2 Office Space 06/30/2023 1 Copiers 04/30/2025, and 02/25/2025 318 Fuel Tank 10/31/2022 2 Generators Various years through 6/30/2032 60 Mailing Equipment Various through 07/29/2026 10
Lease Classification End Dates
Future Minimum Payment Schedule
Fiscal Years Principal Interest Total 2023 $3,222,373 $356,536 $3,578,908 2024 2,663,651 328,632 2,992,283 2025 2,317,427 304,219 2,621,646 2026 2,119,608 280,820 2,400,428 2027 1,306,557 260,191 1,566,747 2028 - 2032 5,297,753 1,036,106 6,333,859 2033 – 2037 3,825,313 673,402 4,498,715 2037 – 2042 4,149,024 308,291 4,457,315 2042 – 2047 876,564 14,897 891,463 Total $25,778,270 $3,563,094 $29,341,364
Note 11. Defined Benefit Pension Plan Plan Description
The City and School Board contribute to the VRS, a qualified defined benefit retirement plan to provide pension benefits for all permanent full-time general and public safety employees of the City and the Schools. The VRS is an agent-multiple employer defined benefit plan (City and School Board) and a cost-sharing multiple employer plan (School Board) administered by VRS
Benefits Provided:
All full-time, salaried permanent (professional) employees are automatically enrolled in VRS upon employment. Benefits vest after five years of service credit, and are eligible to retire with an unreduced or reduced benefit when they meet the age and service requirements of the plan. Members can earn one month of service credit for each month they are employed and contributions are deposited into the VRS. Members are eligible to purchase prior public service, active duty military service, certain periods of leave and previously refunded VRS service as credit in their plan.
60
CITY OF SUFFOLK, VIRGINIA NOTES TO FINANCIAL STATEMENTS
June 30, 2022
Note 11. Defined Benefit Pension Plan (Continued)
The VRS also provided Death and disability benefits. Title 51.1 of the Code of Virginia (1950), as amended assigns the authority to establish and amend benefit provisions to the General Assembly of Virginia.
The System issues a publically available Annual Comprehensive Financial Report (ACFR) that includes financial statements and required supplementary information for the plans administered by VRS. A copy of that report may be obtained from the VRS website at http://www.varetire.org/Pdf/publications/2021Annual-Report.pdf or obtained by writing to the Chief Financial Officer at P.O. Box 2500, Richmond, VA 23218-2500.
The System administers different benefit structures (called plans) for the City and School Board employees: Plan 1, Plan 2 and the Hybrid Retirement Plan (“Hybrid”) each of these have different provisions with a specific eligibility and benefit structure. See Table below for details.
Benefit Terms, and Contribution Requirements
Plan 1
Plan 2 Hybrid
Description (Employees Covered): Description (Employees Covered): Description (Employees Covered): Plan 1 is a defined benefit plan. The benefit is based on a member’s age, creditable service and average final compensation at retirement using a formula. Employees are eligible for Plan 1 if their membership date is before July 1, 2010, and they were vested as of July 1, 2013.
Non-hazardous duty members were allowed to make an irrevocable decision to opt into the Hybrid plan during a special elections window held January 1 through April 30, 2014.
Plan 2 is a defined benefit plan. The retirement benefit is based on a member’s age, creditable service and average final compensation at retirement using a formula. Employees are eligible for Plan 2 if their membership date is on or after July 1, 2010 or their membership dates is before July 1, 2010 and they were not vested as of January 1, 2013.
Eligible members in Plan 2 were allowed to make an irrevocable decision to opt into the Hybrid plan during a special election window held January 1 through April 30, 2014.
The Hybrid Plan combines the features of a defined benefit and a defined contribution plan. Members hired on or after January 1, 2014 are on this plan, as well as any eligible Plan 1 or Plan 2 members who opted into the plan during the special election period.
• The defined benefit is based on the member’s age, creditable service and average final compensation.
• The benefit from the defined contribution component of the plan depends on the member and employer contributions made to the plan and the investment performance of those contributions.
Retirement Eligibility: Retirement Eligibility: Retirement Eligibility:
Normal:
• Non-hazardous duty members are eligible for an unreduced benefit at age 65 with at least 5 years of service credit or age 50 with at least 30 years of service credit.
• Hazardous duty members are eligible for an unreduced benefit beginning at age 60 with at least 5 years of service credit, or age 50 with at least 25 years of service credit.
Normal:
• Non-hazardous duty members are eligible for an unreduced benefit at their normal Social Security retirement age with at least 5 years of service credit, or when their combined age and service credit equals 90.
• Hazardous duty members’ eligibility is the same as Plan 1.
Normal:
• Defined Benefit Component: members are eligible for an unreduced benefit at their normal Social Security retirement age with at least 5 years of service credit, or when their combined age and service credit equals 90.
• Defined Contribution Component: Members are eligible to receive distributions upon leaving employment
61
CITY OF SUFFOLK, VIRGINIA
NOTES TO FINANCIAL STATEMENTS
June 30, 2022
Note 11. Defined Benefit Pension Plan (Continued)
Benefit Terms, and Contribution Requirements (continued)
Plan 1 Plan 2 Hybrid
Retirement Eligibility (continued): Retirement Eligibility(continued): Retirement Eligibility(continued):
Early Retirement with reduced benefit:
• Non-hazardous duty members may retire early with a reduced benefit at age 55 with at least 5 years of service credit, or age 50 with at least 10 years of service credit.
• Hazardous duty members may retire early with a reduced benefit at age 50 with at least 5 years of service credit.
Vesting:
• Members become vested when they have at least 5 years of creditable service
Early Retirement with reduced benefit:
• Non-hazardous duty members may retire early with a reduced benefit at age 60 with at least 5 years of service credit.
• Hazardous duty members’ eligibility is the same as Plan 1.
Vesting:
• Same as Plan 1.
Early Retirement with reduced benefit:
• Defined Benefit Component: Members are eligible for a reduced benefit at age 60 with at least 5 years of creditable service.
• Defined Contribution Component: Members are eligible to receive distributions upon leaving employment
Vesting:
• Defined Benefit Component: Same as Plan 1.
• Defined Contribution Component: After 2 years a member is 50% vested in employer contributions, after 3 years 75% vested in employer contributions and after 4 years 100% vested.
• Members are 100% vested in contributions they make.
Types of Benefits:
The VRS Basic Benefit is a lifetime monthly benefit based on a retirement multiplier as a percentage of the member’s final compensation multiplied by the member’s total service credit at retirement.
Members can elect the Basic Benefit, the Survivor Option, a Partial LumpSum Option Payment (PLOP) or the Advance Pension Option. If any option other than the basic benefit is selected a retirement reduction factor is applied.
Types of Benefits:
Same as Plan 1.
Types of Benefits:
Defined Benefit Component: Same as Plan 1.
Defined Contribution Component: The benefit is based on contributions made by the member and any matching contributions made by the City, plus net investment earnings on those contributions.
Elements of the Pension Formula: Elements of the Pension Formula: Elements of the Pension Formula:
Average Final Compensation:
• The average of the 36 consecutive months of highest compensation as a covered employee.
Average Final Compensation:
• The average of the 60 consecutive months of highest compensation as a covered employee
Average Final Compensation:
• Same as Plan 2 for the Defined Benefit Component.
.
62
CITY OF SUFFOLK, VIRGINIA
NOTES TO FINANCIAL STATEMENTS
June 30, 2022
Note 11. Defined Benefit Pension Plan (Continued)
Benefit Terms, and Contribution Requirements (continued) Plan 1 Plan 2 Hybrid
Elements of the Pension Formula (continued):
Service Retirement Multiplier:
• Non-hazardous duty members is 1.7%
• Sheriffs and regional jail superintendents is 1.85%
• Hazardous duty members other than sheriffs and regional jail superintendents is 1.7% or 1.85% as elected by the employer.
Creditable Service:
• Earned for each month employed in a covered position
Cost-of-Living Adjustments:
• Matches the first 3% increase in the Consumer Price Index for all Urban consumers (CPI-U) and half of any additional increase (up to 4%) up to a maximum of 5%
• Eligible July 1 of the 2nd calendar year of retirement.
Elements of the Pension Formula (continued):
Service Retirement Multiplier:
• For service earned, purchased or granted prior to 1/1/13, and hazardous duty members it is the same as Plan1.
• For service earned, purchased or granted after 1/1/13 for non-hazardous duty members it is 1.65%
Creditable Service:
• Same as Plan 1
Cost-of Living Adjustments:
• Matches the first 2% increase in the CPI-U and half of any additional increase (up to 2%) for a maximum of 3%.
Eligibility is the same as Plan 1.
Elements of the Pension Formula (continued):
Service Retirement Multiplier:
• Defined Benefit Component: 1.0%
• For members who opted into this plan, the retirement multiplier for their previous plan will be used for service credited in those plans.
Creditable Service:
• Defined Benefit Component: Same as Plan 1
Cost-of Living Adjustments:
• Defined Benefit Component: Same as Plan 2
• Eligibility is the same as Plans 1 and 2.
• Defined Contribution Component: Not applicable
Contribution Requirements: Contribution Requirements: Contribution Requirements:
Employees are required to contribute 5% of their compensation toward the plan, through a pre-tax salary deduction. Beginning July 1, 2012 for members in the plan, employers were required to begin making the employee pay the 5% member contribution. This could be phased in over a period of up to 5 years, the employer is required to provide a salary increase equal to the amount of the increase in the employee-paid member contribution. All employees will be paying the full 5 % by July 1, 2016.
The employer makes a separate actuarially determined contribution to VRS for all covered employees.
Same as Plan 1.
A member’s retirement benefit is funded through mandatory and voluntary contributions made by the member and the employer to both the defined benefit and the defined contribution components of the plan. Mandatory contributions are based on a percentage of the employee’s creditable compensation and are required from both the member and the employer. Additionally, members may choose to make voluntary contributions to the defined contribution component of the plan and the employer is required to match those voluntary contributions according to specified percentages.
63
CITY OF SUFFOLK, VIRGINIA
NOTES TO FINANCIAL STATEMENTS
June 30, 2022
Note 11. Defined Benefit Pension Plan (Continued)
Number of Employees by Class: City School Board – Non Teacher Plan
Retirees or beneficiaries currently receiving benefits: 790 203
Inactive Members: Vested inactive members 221 33 Non-vested inactive members 389 129 LTD - 1
Inactive members active elsewhere in VRS 431 59
Total inactive members 1,041 222
Active Employees: 1,303 313 Total 3,134 738
Contributions:
Members and employers are required to contribute to the retirement plans as provided by Title 51.1 of the Code of Virginia (1950), as amended. The member contribution is 5% of compensation contributed by members or employers. The City and School Board are required to contribute the remaining amounts necessary to fund the pension plans using the entry age normal actuarial cost method adopted by the VRS Board of Trustees. The System’s actuary computed the amount of contributions to be provided by the City and School Board. The contribution rates for fiscal year 2022 were based on the actuary’s valuation as of June 30, 2019. In addition, the actuary computed a separate contribution requirement for the School Board for the teacher cost-sharing pool using the same valuation date.
The City’s contractually required contribution rate for the year ended June 30, 2022 was 12.47% of covered employee compensation. This rate was based on actuarially determined rate from an actuarial valuation as of June 30, 2019.
This rate, when combined with employee contributions, was expected to finance the costs of benefits earned by employees during the year, with an additional amount to finance any unfunded accrued liability. Employer contributions to the pension plan for the years ended June 30, 2022 and June 30, 2021, respectively were $8,992,126 and $8,610,229.
The School Board’s contractually required contribution rate for the Teacher Retirement Plan for the year ended June 30, 2022 was 16.62% of covered employee compensation. This rate was based on actuarially determined rate from an actuarial valuation as of June 30, 2019.
The School Board’s (non-teacher plan) contractually required contribution rate for the year ended June 30, 2022 was 5.60% of covered employee compensation. This rate was based on actuarially determined rate from an actuarial valuation as of June 30, 2019.
64
CITY OF SUFFOLK, VIRGINIA
NOTES TO FINANCIAL STATEMENTS
June 30, 2022
Note 11. Defined Benefit Pension Plan (Continued)
Contributions (continued):
This rate, when combined with employee contributions, was expected to finance the costs of benefits earned by employees during the year, with an additional amount to finance any unfunded accrued liability. Based on the provisions of section 51.1-145 of the Code of Virginia, as amended, the contributions were funded at 100% of the actuarial rate for the year ended June 30, 2022. Contributions to the Teacher Retirement pension plan for the years ended June 30, 2022 and June 30, 2021, respectively were $13,650,009 and $13,881,507 Contributions to the Non-Teacher pension plan for the years ended June 30, 2022 and June 30, 2021, respectively were $444,256 and $420,144. In June 2021 the commonwealth made a special contribution of approximately $61.3 million to the VRS Teacher Employee Plan. This special payment was authorized by a budget amendment included in Chapter 552 of the 2021 Appropriation Act, and is classified as a nonemployer contribution.
Actuarial Assumptions
The most recent actuarial valuation to determine the net pension liabilities for the City and School Board was prepared as of June 30, 2020. The total pension liability was determined based on that actuarial valuation using updated actuarial assumptions applied to all periods included in the measurement, and rolled forward to the measurement date of June 30, 2021. The total pension liability in the June 30, 2020 actuarial valuation was determined using the following actuarial assumptions, applied to all periods included in the measurement:
General City and School Board (nonteacher)Employees
Public Safety Employees
School Board Teacher Retirement Plan Employees
Actuarial Cost Method Entry Age Normal Entry Age Normal Entry Age Normal Investment Rate of Return, net of pension plan investment expense, including inflation *
6.75% 6.75% 6.75% Inflation 2.5% 2.5% 2.5% Projected Salary Increases 3.5% - 5.35% 3.5% - 4.75% 3.5% - 5.95% Mortality Rates (% of deaths assumed to be service related) 15% 45% N/A
General City and School Board (non-teacher) employees:
Pre-Retirement:
Pub-2010 Amount Weight4ed Safety Employee Rates projected generationally, 95% of rates for males; 105% of rates for female set forward 2 years.
Post-Retirement:
Pub-2010 Amount Weighted Safety Healthy Retiree Rates projected generationally; 110% of rates for males; 105% of rates for females set forward 3 years.
65
CITY OF SUFFOLK, VIRGINIA NOTES TO FINANCIAL STATEMENTS
June 30, 2022
Note 11. Defined Benefit Pension Plan (Continued)
Actuarial Assumptions (continued)
Post-Disablement: Pub2010 Amount Weighted General Disabled Rates projected generationally; 95% of rates for males set back 3 years; 90% of rates for females set back 3 years.
Beneficiaries and Survivors: Pub-2010 Amount Weighted Safety Contingent Annuitant Rates projected generationally; 110% of rates for males and females set forward 2 years.
Mortality Improvement: Rates projected generationally with Modified MP-2020 Improvement Scale that is 75% of the MP-2020 rates.
Public Safety Employees:
Pre-Retirement: Pub-2010 Amount Weighted Safety Employee Rates projected generationally, 95% of rates for males; 105% of rates for females set forward 2 years.
Post-Retirement: Pub-2010 Amount Weighted Safety Healthy Retiree Rates projected generationally; 110% of rates for males; 105% of rates for females set forward 3 years.
Post – Disablement: Pub-2010 Amount Weighted General Disabled Rates projected generationally; 95% of rates for males set back 3 years; 90% of rates for females set back 3 years.
Beneficiaries and Survivors: Pub-2010 Amount Weighted Safety Contingent Annuitant Rates projected generationally; 110% of rates for males and females set forward 2 years.
Mortality Improvement: Rates projected generationally with Modified MP-2020 Improvement Scale that is 75% of the MP-2020 rates.
School Board Teacher Retirement Plan employees: Pre-Retirement: Pub-2010 Amount Weighted Teacher Employee Rates projected generationally; 110% of rates for males.
Post-Retirement: Pub-2010 Amount Weighted Teacher Healthy Retiree Rates projected generationally; males set forward 1 year; 105% of rates for females.
Post – Disablement: Pub-2010 Amount Weighted Teachers Disabled Rates projected generationally; 110% of rates for males and females.
Beneficiaries and Survivors: Pub-2010 Amount Weighted Teachers Contingent Annuitant Rates projected generationally.
Mortality Improvement: Rates projected generationally with Modified MP-2020 Improvement Scale that is 75% of the MP-2020 rates.
66
CITY OF SUFFOLK, VIRGINIA NOTES TO FINANCIAL STATEMENTS
June 30, 2022
Note 11. Defined Benefit Pension Plan (Continued)
Actuarial Assumptions (continued)
The actuarial assumptions used in the June 30, 2020 valuation were based on the results of an actuarial experience study for the period from July1, 2016 through June 30, 2020. Except the change in the discount rate which was based on VRS Board action effective as of July 1, 2019. Changes to the actuarial assumptions as a result of the experience study and VRS Board action are as follows:
General City and School Board (non-teacher) Employees: Public Safety Employees:
- Update Mortality Rates to PUB2010 public sector mortality tables. For future mortality improvements, replace load with a modified Mortality Improvement Scale MP-2020.
- Adjusted retirement to better fit experience for Plan1; set separate rates based on experience for Plan2/Hybrid; changed final retirement age.
- Adjusted withdrawal rates to better fit experience at each year age and service through 9 year of service
- Updated mortality rates to PUB2010 public sector mortality tables. Increased disability life expectancy. For future mortality improvements, replace load with a modified Mortality Improvement Scale MP-2020
- Adjusted Retirement Rates to better fit experience and changed final retirement age from65 to 70.
- Decreased withdrawal rates and changed from rates based on age and service to rates based on service only to better fit experience and to be more consistent with Locals Largest 10 Hazardous Duty.
- No change in disability rates - No change to disability rates
- No change in Line of Duty Disability rates. - No change to line of Duty Disability rates.
- No change in discount rate of 6.75% - No change in discount rate of 6.75%.
School Board Teacher Retirement Plan Employees:
- Updated mortality rates to PUB2010 public sector mortality tables. For future mortality improvements, replace load with a modified Mortality Improvement Scale MP-2020.
- Adjusted retirement rates to better fit experience for Plan 1; set separate rates based on experience for Plan2/Hybrid; changed final retirement age from 75 to 80 for all.
- Adjusted withdrawal rates to better fit experience at each year age and service through 9 years of service.
- No change in disability rates.
- No change in discount rate of 6.75%.
Net Pension Liability
The net pension liability (NPL) for the teacher retirement plan is calculated separately for each system and represents that particular system’s total pension liability determined in accordance with GASB Statement No. 67, less that system’s fiduciary net position. As of June 30, 2021, NPL amounts for the VRS Teacher Employee Retirement Plan is as follows (amounts expressed in thousands):
67
CITY OF SUFFOLK, VIRGINIA
NOTES TO FINANCIAL STATEMENTS
June 30, 2022
Note 11. Defined Benefit Pension Plan
(Continued)
Net Pension Liability (continued)
Teacher Employee Retirement Plan
Total Pension Liability $53,381,141 Plan Fiduciary Net Position 45,617,878 Employers’ Net Pension Liability $7,763,263 Plan Fiduciary Net Position as a Percentage of the Total Pension Liability 85.46%
Long-Term Expected Rate of Return
The long-term expected rate of return on pension plan investments was determined using log-normal distribution analysis in which best-estimate ranges of expected future real rates of return (expected returns, net of pension System investment expense and inflation) are developed for each major asset class. These ranges are combined to produce the long-term expected rate of return by weighting the expected future real rates of return by the target asset allocation percentage and by adding expected inflation. The target asset allocation and best estimates of arithmetic real rates of return for each major asset class are summarized in the following table:
City and School Board Pension Plans
Asset Class: Target Allocation:
Arithmetic Long-Term Expected Rate of Return
Weighted Average LongTerm Rate of Return:
Public Equity 34.00% 5.00% 1.70%
Fixed Income 15.00% 0.57% 0.09% Credit Strategies 14.00% 4.49% 0.63% Real Assets 14.00% 4.76% 0.67% Private Equity 14.00% 9.94% 1.39%
MAPS – Multi-Asset Public Strategies 6.00% 3.29% 0.20%
PIP – Private Investment Partnership 3.00% 6.84% 0.21% Total 100.00% 4.89% Inflation 2.50%
**Expected arithmetic nominal return 7.39%
** The above allocation provides a one-year return of 7.39%. However, one-year returns do not take into account the volatility present in each of the asset classes. In setting the long-term expected return for the system, stochastic projections are employed to model future returns under various economic conditions. The results provide a range of returns over various time periods that ultimately provide a median return of 6.94%, including expected inflation of 2.50%. On October 10, 2019 the VRS Board elected a long-term rate of 6.75% which is roughly at the 40th percentile of expected long-term results of the VRS fund asset allocation at that time, providing a median return of 7.11%, including expected inflation of 2.5%
68
CITY OF SUFFOLK, VIRGINIA
NOTES TO FINANCIAL STATEMENTS
June 30, 2022
Note 11. Defined Benefit Pension Plan (Continued)
Discount Rate
The discount rate used to measure the total pension liability was 6.75%. The projection of cash flows used to determine the discount rate assumed that System member contributions will be made per the VRS Statutes and the employer contributions will be made in accordance with the VRS funding policy at rates equal to the difference between actuarially determined contribution rates adopted by the VRS Board of Trustees and the member rate. Consistent with the phased-in funding provided by the General Assembly for state and teacher employer contributions; political subdivisions were also provided with an opportunity to use an alternate employer contribution rate. For the year ended June 30, 2021, the alternate rate was the employer contribution rate used in FY2012 or 100% of the actuarially determined employer contribution rate from the June 30, 2017, actuarial valuations, whichever was greater. From July 1, 2021 on, participating employers are assumed to continue to contribute 100% of the actuarially determined contribution rates. Based on those assumptions, the pension plan’s fiduciary net position was projected to be available to make all projected future benefit payments of current active and inactive employees. Therefore, the Long-term expected rate of return was applied to all periods of projected benefit payments to determine the total pension liability.
Changes in the Net Pension Liability
Increase/(Decrease)
City Pension Plan
Total Pension Liability Plan Fiduciary Net Position Net Pension Liability
Balance at 7/01/2020 343,542,326 $ 278,233,757 $ 65,308,569 $
Changes for the Year: Service cost 8,280,040 - 8,280,040 Interest 22,671,297 - 22,671,297
Change of assumptions 14,289,977 - 14,289,977 Difference between expected and actual experience (2,470,637) - (2,470,637)
Contributions -- employer - 8,393,781 (8,393,781)
Contributions -- employee - 3,350,831 (3,350,831) Net investment income - 76,007,281 (76,007,281) Benefit payments including refunds of employee contributions (15,342,506) (15,342,506)Administrative expense - (187,378) 187,378 Other changes - 7,191 (7,191) Net Changes 27,428,171 72,229,200 (44,801,029)
Balances at 6/30/2021 370,970,497 $ 350,462,957 $ 20,507,540 $
69
CITY OF SUFFOLK, VIRGINIA
NOTES TO FINANCIAL STATEMENTS
June 30, 2022
Note 11. Defined Benefit Pension Plan (Continued)
Changes in the Net Pension Liability (continued)
Increase/(Decrease) School Board (non-teacher) Plan
Total Pension Liability Plan Fiduciary Net Position Net Pension Liability (Asset)
Balance at 7/01/2020 30,594,969 $ 28,728,124 $ 1 ,866,845 $
Changes for the Year:
Service cost 669,620 - 669,620 Interest 2,025,076 - 2,025,076
Change of assumptions 899,673 - 899,673 Difference between expected and actual experience (796,573) - (796,573)
Contributions -- employer - 381,546 (381,546)
Contributions -- employee - 353,744 (353,744)
Net investment income - 7,850,056 (7,850,056) Benefit payments including refunds of employee contributions (1,187,694) (1,187,694)Admininstrative expense - (19,450) 19,450 Other changes - 741 (741)
Net Changes 1,610,102 7,378,943 (5,768,841) Balances at 6/30/2021 32,205,071 $ 36,107,067 $ (3 ,901,996) $
Sensitivity of the Net Pension Liability to Changes in the Discount Rate
In accordance with the requirements of GAAP, regarding the sensitivity of the net pension liability (rounded) to changes in the discount rate, the table below presents the net pension liability for the City and School Board calculated using the discount rate of 6.75%, as well as what it would be at a discount rate 1.00% lower and 1.00% higher.
1.00% Lower 5.75% Current Discount Rate: 6.75%
1.00% Higher 7.75%
City’s Net Pension Liability $71,960,763 $20,507,540 ($21,754,292) School Board’s (non-teacher) Net Pension Liability (Asset) $92,127 ($3,901,996) ($7,238,138) School Board’s Teacher Retirement Plan Net Pension Liability $142,507,691 $73,840,253 $17,352,115
70
CITY OF SUFFOLK, VIRGINIA
NOTES TO FINANCIAL STATEMENTS
June 30, 2022
Note 11. Defined Benefit Pension Plan (Continued)
Pension Expense, Deferred Outflows of Resources, and Deferred Inflows of Resources Related to Pensions
For the year ended June 30, 2022, the City recognized pension expense of $6,026,267
For the year ended June 30, 2022, the School Board (non-teacher) plan recognized pension expense of ($365,260)
At June 30, 2022, the School Board Teacher Retirement Plan reported a liability of $73,840,253 for its proportionate share of the Net Pension Liability. The Net Pension Liability was measured as of June 30, 2021 and the total pension liability used to calculate the Net Pension Liability was determined by an actuarial valuation performed as of June 30, 2020 and rolled forward to the measurement date of June 30, 2021.
The School Board’s proportion of the Net Pension Liability was based on the School Board Teacher Retirement Plan’s actuarially determined employer contributions to the pension plan for the year ended June 30, 2021 relative to the total of the actuarially determined employer contributions for all participating employers. At June 30, 2021, the School Board Teacher Retirement Plan’s proportion was 0.95117% as compared to 0.94792% at June 30, 2020.
For the year ended June 30, 2021, School Board’s Teacher Retirement plan recognized pension expense of $908,988 Since, for the School Board’s Teacher Retirement Plan there was a change in proportionate share between measurement dates, a portion of the pension expense was related to deferred amounts from changes in proportion and from differences between employer contributions and the proportionate share of employer contributions.
At June 30, 2022, the City and School Board reported deferred outflows of resources and deferred inflows of resources related to pensions from the following sources:
Deferred Outflows of Resources Deferred Inflows of Resources
Deferred Outflows of Resources Deferred Inflows of Resources Deferred Outflows of Resources Deferred Inflows of Resources
Difference between expected and actual experience 763,572 $ 1,782,437 $ 56,597 $ 503,715 $ - $ 6,289,265 $
Change of assumptions 12,514,218 - 568,911 - 12,936,619Net difference between projected and actual earnings on pension plan investments. - 37,810,988 - 3,910,693 - 46,532,152
Change in proportion and differences between employer contributions and proportionate share of contributions - - - 2,623,439 3,413,121 Contributions to the plan subsequent to the measurement date
8,992,126 - 444,256 - 13,650,009Total 22,269,916 $ 39,593,425 $ 1,069,764 $ 4,414,408 $ 29,210,067 $ 56,234,538 $
71
City Pension Plan School Board Non-teacher Plan School Board Teacher Retirement Plan
CITY OF SUFFOLK, VIRGINIA
NOTES TO FINANCIAL STATEMENTS
June 30, 2022
Note 11. Defined Benefit Pension Plan (Continued)
Pension Expense, Deferred Outflows of Resources, and Deferred Inflows of Resources Related to Pensions (continued)
$8,992,126, $444,256, and $13,650,009 reported as deferred outflows of resources related to pensions resulting from the City’s, School Board (non-teacher) plan and School Board’s Teacher Retirement plan (respectively) contributions subsequent to the measurement date will be recognized as a reduction of the respective Net Pension Liability in the year ended June 30, 2023.
Other amounts reported as deferred outflows of resources and deferred inflows of resources related to pensions will be recognized in pension expense as follows:
Year Ended June 30: City Pension Plan School Board (nonteacher) Plan
School Board Teacher Retirement Plan 2023 $ (2,843,002) ($823,794) ($9,502,760) 2024 (5,126,347) (869,073) (8,292,051) 2025 (6,875,482) (910,673) (9,730,909) 2026 (11,470,804) (1,185,360) (13,162,285) 2027 - - 13,525 $ (26,315,635) ($3,788,900) ($40,674,480)
Pension Plan Fiduciary Net Position
Detailed information about the VRS Teacher Retirement Plan’s Fiduciary Net Position is available in the separately issued VRS ACFR, which may be downloaded from the VRS website at http://www.varetire.org/Pdf/Publications/2021-annual-report.pdf, or by writing to the System’s Chief Financial Officer at P.O. Box 2500, Richmond, VA 23218-2500.
Note 12. Other Postemployment Benefits Program – Local Trust
Plan Description
The City has established an irrevocable trust pursuant to Section 15.21544 of the Code of Virginia, as amended for the purpose of accumulated and investing assets to OPEB, to participate in the Virginia Pooled OPEB Trust Fund and has established a local Finance Board to become a Participating Employer in the Trust Fund. The Trust Fund provides administrative, custodial, and investment services to the Participating Employers in the Trust Fund. The Trust Fund issues a separate report, which can be obtained by requesting a copy from the plan administrator, Virginia Municipal League (“VML”) at P.O. Box 12164, Richmond, Virginia 23241.
The City and School Board provide postemployment medical coverage for retired employees through a single-employer defined benefit plan. The plan is established under the authority of City Council and the School Board, which may also amend the plan as deemed appropriate.
72
CITY OF SUFFOLK, VIRGINIA NOTES TO FINANCIAL STATEMENTS
June 30, 2022
Note 12. Other Postemployment Benefits Program – Local Trust
Plan Description (continued)
Participants in the City’s and School Board’s OPEB plans must have attained 20 years and 10 years of fulltime consecutive service, respectively, and been enrolled in the group health insurance plan for the 24 months prior to their retirement date to be eligible, coverage ceases at age 65 for the school board employees Retirees pay 100% of spousal premiums and surviving spouses are not allowed to the plan.
Plan Membership
Number of Employees by Class: City School Board
Inactive members and beneficiaries currently receiving benefits 146 59
Active Employees: 1,309 1,919 Total 1,455 1,978
Contribution Requirements
The City and School Board establish employer contribution rates for plan participants as part of the budgetary process each year and determines how the plan will be funded each year and whether it will partially fund or fully fund the plan. The City and School Board currently fund postemployments health care benefits on a pay-as-you-go basis and as contributions to their respective Trust Funds.
The annual cost of OPEB is the Actuarially Determined Contribution (ADC). The City and School Board elected to pre-fund OPEB liabilities. The City and School Board are contributing the ADC, an amount actuarially determined in accordance with GAAP. The ADC represents a level of funding that, if paid on an ongoing basis, is projected to cover normal cost each year and amortize any unfunded actuarial liabilities (or funding excess) over open amortization period not to exceed thirty years.
For the fiscal year ended June 30, 2022, the City contributed $1,803,210 toward OPEB costs which was a combination of $729,520 deposited in the trust fund and $1,073,690 in claims paid on behalf of the retirees, net of premiums paid by retirees. The School Board contributed $304,691 toward OPEB costs representing claims paid on behalf of retirees.
Plan Investments
The Board of Trustees has the responsibility for managing the investment process. In fulfilling this responsibility, the Board will establish and maintain investment policies and objectives. Within this framework, the Board will monitor and evaluate the investment managers, bank custodian, and other parties, to monitor whether operations conform to the guidelines and actual results meet objectives. If necessary, the Board is responsible for making changes to achieve this. The investment objective of the fund is to maximize total long-term rate of return with reasonable risk by seeking capital appreciation and, secondarily, principal protection.
73
CITY OF SUFFOLK, VIRGINIA NOTES TO FINANCIAL STATEMENTS
June 30, 2022
Note 12. Other Postemployment Benefits Program – Local Trust (Continued)
Plan Investments (continued)
The target asset allocation and best estimates of arithmetic real rates of return for each major asset class are summarized below:
Asset Class: Target Allocation
Expected 20-Year Arithmetic Real Rate of Return
U.S Equity – Large Cap 26.00% 8.69%
U.S Equity – Small Cap 10.00% 9.87%
Non U.S. Equity – Developed 13.00% 9.42%
Non U.S. Equity – Emerging 5.00% 11.66%
US Corporate Bonds – Core 21.00% 4.07%
US Corporate Bonds – Long Duration 4.44%
US Corporate Bonds – High Yield 6.47%
Non-US Debt – Developed 2.86%
Non-US Debt – Emerging 6.87%
US Treasuries (Cash Equivalents) 2.61%
TIPS (Inflation-Protected) 3.27%
Real Estate 10.00% 8.24% Hedge Funds 10.00% 6.43%
Commodities 5.93%
Infrastructure 8.78% Private Equity 5.00% 12.87% Private debt 8.96%
Total 100.00%
There are no investments in any one organization that represent 5 percent or more of the OPEB Trust’s fiduciary net position.
For the year ended June 30, 2022, and June 30, 2021 the annual money-weighted rate of return on investments, net of investment expense was -9.28% and 30.05% respectively. The money-weighted rate of return expresses investment performance, net of investment expense, adjusted for the changing amounts actually invested.
74
CITY OF SUFFOLK, VIRGINIA
NOTES TO FINANCIAL STATEMENTS
June 30, 2022
Note 12. Other Postemployment Benefits Program – Local Trust (Continued)
Net OPEB Liability for the Plan (GASB 74 Disclosures)
The City’s net OPEB Asset was measured as of its fiscal year end June 30, 2022, based on a valuation date of January 1, 2022. The School Board net OPEB Liability was measured as of its fiscal year end of December 31, 2021 based on a valuation date of May 1, 2022 The components of the Plans’ net OPEB Asset were as follows:
Net OPEB Asset
City School Board
Total OPEB liability $37,963,277 $11,075,152 Plan fiduciary net position 46,171,949 23,078,282 Net OPEB asset ($8,208,672) ($12,003,130) Fiduciary net position as a percent of total OPEB asset 121.62% 208.38%
Actuarial Methods and Assumptions
Actuarial valuations of an ongoing plan involve estimates of the value of reported amounts and assumptions about the probability of occurrence of events far into the future. Examples include assumptions about future employment, mortality, and healthcare cost trends. Amounts determined regarding the funded status of the plan and the annual required contributions of the employer are subject to continual revision as actual results are compared with past expectations and new estimates are made about the future.
The total OPEB liability for the City as part of the actuarial valuation performed as of January 1, 2022 for the City and May 1, 2022 for the School Board, using the following actuarial assumptions:
City School Board
Investment rate of return 6.75% 6.75% Actuarial Cost Method Entry Age Normal, level percentage of pay. Entry Age Normal, level percentage of pay.
Inflation Rate 2.5% 2.5%
Projected salary increases 3.5% - 5.35% 3.50 – 5.95%
Real Wage Growth Rate 1.00% 1.00%
Health care cost trend rate: Initial 6.00% 6.00%
Ultimate (year of ultimate trend rate) 3.94% 3.94%
Mortality rates were based on amount –weighted Pub-2010 mortality tables with generationally project mortality improvements using Scale MP-2018. Generationally projected healthy and disabled mortality rates reflect differences for males and females, and for general and safety (i.e. enhanced hazardous duty) employment classifications.
75
CITY OF SUFFOLK, VIRGINIA NOTES TO FINANCIAL STATEMENTS
June 30, 2022
Note 12. Other Postemployment Benefits Program – Local Trust (Continued)
Discount Rate
The discount rate used to measure the total OPEB liability was 6.75%. The projection of cash flows used to determine the discount rate was performed in accordance with GAAP The projection’s basis was an actuarial valuation performed as of January 1, 2022 for the City and May 1, 2022 for the School Board. The fiduciary net position projections are based upon the Plan’s financial status on the measurement date, the indicated set of methods and assumptions, and the requirements of GAAP. The long-term expected rate of return on plan investments is 6.75%. The long-term expected rate of return was applied to the periods of projected benefit payments and it is not anticipated that the plan’s assets will be exhausted. The expected municipal bond rate was not applied to determine the discount rate.
Sensitivity of the Net OPEB Liability – for the Plan (GASB 74 disclosures)
The net OPEB asset is shown below as calculated at the current discount rate and current health care cost trend rate as indicated and also calculated using rates 1% lower and 1% higher. The City’s net OPEB asset for the plan was based on a valuation date of January 1, 2022 and rolled forward to a measurement date of June 30, 2022 for the City. The School Board had a valuation date of May 1, 2022 and with a measurement date of December 31, 2021.
Net OPEB Asset analysis using discount rate: 1% lower (5.75%) Current Rate (6.75%) 1% higher (7.75%)
City’s Plan ($2,104,867) ($8,208,672) ($13,158,147) School Board ($11,185,248) ($12,003,130) ($12,765,505)
Net OPEB Asset using the health care cost trend rate: Ultimate Trend 1% lower (2.94%) Current rate (3.94%) 1% higher (4.94%) City’s Plan ($13,763,106) ($8,208,672) ($1,242,355) School Board ($12,953,848) ($12,003,130) ($10,921,152)
Sensitivity of the Net OPEB Liability – for the Employer (GASB 75 disclosures)
The net OPEB liability is shown below as calculated at the current discount rate and current health care cost trend rate as shown in the tables below and also as calculated using rates 1% lower and 1% higher.
Net OPEB Liability (Asset) analysis using discount rate: 1% lower (6.5%) Current Rate (7.5%) 1% higher (8.5%)
$7,011,672 $250,412 ($5,375,024) 1% lower (5.75%) Current Rate (6.75%) 1% higher (7.75%) School Board ($11,185,248) ($12,003,130) ($12,765,505)
City’s Plan
76
CITY OF SUFFOLK, VIRGINIA
NOTES TO FINANCIAL STATEMENTS
June 30, 2022
Note 12. Other Postemployment Benefits Program – Local Trust (Continued)
Sensitivity of the Net OPEB Liability – for the Employer (GASB 75 disclosures) (continued)
Net OPEB Liability (Asset) using the health care cost trend rate: Ultimate Trend 1% lower (3.50%) Current rate (4.50%) 1% higher (5.50%)
City’s Plan ($6,392,052) $250,412 $8,411,782
Ultimate Trend 1% lower (2.94%) Current rate (3.94%) 1% higher (4.94%) School Board ($12,953,848) ($12,003,130) ($10,921,152)
Changes in the Net OPEB Liability
Increase/(Decrease) City Plan
Total OPEB Liability Plan Fiduciary Net Position Net OPEB Liability
Balance at 7/01/2020 47,210,856 $ 38,134,625 $ 9,076,231 $
Changes for the Year:
Service cost 972,561 - 972,561 Interest 3,568,007 - 3,568,007 Difference between expected and actual experience (109,112) - (109,112) Contributions -- employer - 1,742,451 (1,742,451) Net investment income - 11,551,219 (11,551,219) Benefit payments including refunds of employee contributions (1,242,451) (1,242,451)Administrative Expenses - (36,395) 36,395
Net Changes 3,189,005 12,014,824 (8,825,819) Balances at 6/30/2021 50,399,861 $ 50,149,449 $ 250,412 $
77
CITY OF SUFFOLK, VIRGINIA
NOTES TO FINANCIAL STATEMENTS
June 30, 2022
Note 12. Other Postemployment Benefits Program – Local Trust (Continued)
Changes in the Net OPEB Liability (continued)
Balance at 12/31/2020
Changes for the Year:
School Board Plan
Total OPEB Liability Plan Fiduciary Net Position Net OPEB Asset
11,818,291 $ 20,076,188 $ (8,257,897) $
Service cost 532,956 - 532,956 Interest 869,162 - 869,162 Difference between expected and actual experience (1,920,563) - (1,920,563) Contributions -- employer - 304,691 (304,691)
Net investment income - 3,020,825 (3,020,825) Benefit payments including refunds of employee contributions (304,691) (304,691)Admininstrative expense - (18,731) 18,731
Change in assumptions 79,997 - 79,997 Net Changes (743,139) 3,002,094 (3,745,233)
Balances at 12/31/2021 11,075,152 $ 23,078,282 $ (12,003,130) $
OPEB Expense, Deferred Outflows of Resources and Deferred Inflows of Resources
For the year ended June 30, 2022, the City and School Board recognized OPEB expense in the amount of $668,390 and ($1,625,701) respectively.
The aggregate amount of OPEB Expense for the City and School Board plans, including the local trust and Virginia Retirement System (VRS) plans are as follows:
OPEB Plan: City OPEB Expense School OPEB Expense Local Trust $668,390 ($1,625,701)
VRS Plans: (note 13) GLI 181,169 196,011 LODA 1,123,907HIC - 991,145 VLDP - 99,195
TOTAL: $1,973,466 ($339,350)
78
CITY OF SUFFOLK, VIRGINIA
NOTES TO FINANCIAL STATEMENTS
June 30, 2022
Note 12. Other Postemployment Benefits Program – Local Trust (Continued)
OPEB Expense, Deferred Outflows of Resources and Deferred Inflows of Resources (continued)
The City and School Board reported deferred outflows of resources and deferred inflows of resources related to OPEB from the following sources:
City School Board
Deferred Outflows of Resources Deferred Inflows of Resources
Deferred Outflows of Resources Deferred Inflows of Resources
Difference between expected and actual experience 3,232,734 $ 453,617 $ 428,401 $ 5,814,960 $ Change of assumptions 2,135,015 645,525 555,432Net difference between projected and actual earnings on plan investments. - 5,672,345 - 2,378,368 Contributions to the plan subsequent to the measurement date 1,803,210 - -Total 7,170,959 $ 6,771,487 $ 983,833 $ 8,193,328 $
Deferred outflows in the amount of $1,803,210 for the City, related to contributions subsequent to the measurement date will be recognized as a reduction of the OPEB liability in the year ended June 30, 2023 Other amounts reported as deferred outflows of resources and deferred inflows of resources will be recognized in OPEB expense in the future fiscal years and noted below:
Year Ended June 30: City OPEB Plan
School Board OPEB Plan 2023 ($353,295) ($1,478,214) 2024 (222,355) (1,850,082) 2025 (427,872) (1,474,011) 2026 (756,807) (1,149,507) 2027 445,774 (401,101) Thereafter (89,183) (856,580) Total ($1,403,738) ($7,209,495)
Additional information on changes in net OPEB Liability, related ratios, and employer contributions can be found in the required supplementary information following the notes to the financial statements.
79
CITY OF SUFFOLK, VIRGINIA NOTES TO FINANCIAL STATEMENTS June 30, 2022
Note 13. Other Postemployment Benefits Program – VRS Plans
Plan Description
Group Life Insurance Program:
All full-time, salaried permanent employees of the City and School Board, including the teachers are automatically covered by the VRS GLI Program upon employment. This plan is administered by the VRS, along with pensions and other OPEB plans, for public employer groups in the Commonwealth of Virginia. In addition to the basic group life insurance benefit, members are also eligible to elect additional coverage for themselves as well as a spouse or dependent children through the optional group life insurance program. Since this is a separate and fully insured program, it is not included as part of the GLI.
Line of Duty Act Program:
All paid employees and volunteers in hazardous duty position in the City and hazardous duty employees who are covered under the VRS, the State Police Officer’s retirement system (SPORS), or the Virginia Law Officers Retirement System (VaLORS) are automatically covered by LODA. VRS is responsible for managing the assets of the program as required by statute. Participating employers made contributions to the program beginning in FY2012. The employer contributions are determined by the VRS actuary using anticipated program costs and the number of covered individuals associated with all participating employers.
Employee Virginia Local Disability Program):
All full-time, salaried permanent (professional) employees of the School Board who are in the VRS Hybrid Retirement Plan benefit structure and whose employer has not elected to opt of the VRS-sponsored program are automatically covered by the VLDP. This plan is administered by VRS, along with pension and other OPEB plans, for eligible public employer groups in the Commonwealth of Virginia. School divisions are required by Title 51.1 of the Code of Virginia, as amended to provide short-term and long-term disability benefits for their hybrid employees either through a local plan or through the VLDP.
Teacher and Non-Teacher Employee Health Insurance Credit Programs:
All full-time, salaried permanent (professional) employees of public school divisions are automatically covered by the VRS Teacher and NTHIC Programs. This plan is administered by the System, along with pension and other OPEB plans, for public employer groups in the Commonwealth of Virginia. Members earn one month of service credit toward the benefit for each month they are employed and for which their employer pays contributions to VRS. The health insurance credit is a tax-free reimbursement in an amount set by the General Assembly for each year of service credit against qualified health insurance premiums retirees pay for single coverage, excluding any portion covering the spouse or dependents. The credit cannot exceed the amount of the premiums and ends upon the retiree’s death.
80
CITY OF SUFFOLK, VIRGINIA NOTES TO FINANCIAL STATEMENTS
June 30, 2022
Note 13. Other Postemployment Benefits Program – VRS Plans (Continued)
Plan Description (continued)
The specific information for each of the plans, including eligibility, coverage and benefits are set out in the table below:
Group Life Insurance Line of Duty Act Health Insurance
Credit Programs
Virginia Local
Disability Program
Eligible Employees: Eligible Employees: Eligible Employees: Eligible Employees: GLI was established July 1, 1960, for state employees, teachers and employees of political subdivision that elect the program.
Basic group life insurance coverage is automatic upon employment. Coverage ends for employee who leave their position before retirement eligibility or who take a refund of their contributions and interest.
Paid employees and volunteers in hazardous duty position in the City and hazardous duty employees who are covered under the VRS, the State Police Officer’s retirement system (SPORS), or the Virginia Law Officers Retirement System (VaLORS) are automatically covered by LODA.
THIC: Retired teacher employees who retire with at least 15 years of service credit. Enrolled automatically upon employment if they are full-time permanent professional salaried employees covered under VRS
NTHIC: Full-time permanent salaried employees who are covered under the VRS pension plan.
Eligible employees are enrolled automatically upon employment. Teachers and other fulltime permanent (professional) salaried employees of public school divisions covered under VRS.
Benefit Amounts: Benefit Amounts: Benefit Amounts: Benefit Amounts: Natural Death Benefit: equal to the employees’ covered compensation rounded to the next highest thousand then doubled.
Accidental Death Benefit: double the natural death benefit
Other Benefit Provisions: other benefits provided under specific circumstances, including, accidental dismemberment, safety belt benefit, repatriation benefit, felonious assault and accelerated death benefit option.
Death: A one-time payment made to the beneficiary of a covered individual. Amounts vary as follows: $100,000 when a death occurs as a direct or proximate result of performing duty as of 1/1/06 or after, or $25,000 when the cause of death is attributed to one of the applicable presumptions and occurred earlier than 5 years after retirement. An additional $20,000 benefit is payable when certain members of the National Guard and U.S Military reserves are killed in action after 10/7/01.
THIC: At retirement: Monthly benefit is $4.00 per year of servers per month with no cap on the benefit amount.
Disability retirement: If retire on disability or go on long-term disability under VLDP the benefit is either: (a) $4.00 per month, multiplied by twice the amount of service credit, or (b) $4.00 per month, multiplied by the amount of service earned had the employee been active until age 60, whichever is lower.
Short-Term Disability: Beginning after a 7 calendar-day waiting period from the first day of disability. Employees are eligible for non-work related coverage after one year of continuous participation with their current employer. During the first 5 years of continuous participation employees are eligible for 60% of their predisability income. Once the eligibility period is satisfied employees are eligible for higher income replacement levels.
81
CITY OF SUFFOLK, VIRGINIA NOTES TO FINANCIAL STATEMENTS
June 30, 2022
Note 13. Other Postemployment Benefits Program – VRS Plans (Continued)
Plan Description (continued)
Group Life Insurance Line of Duty Act Teacher Health Insurance Credit Program
The benefit amounts are subject to a reduction factor. The amount reduced by 25% on January 1 following one calendar year of separation, and an additional 25% reduction on each January 1 until it reached 25% of its original value.
Health Insurance: beginning July1, 2017 the health insurance benefits are managed through the Virginia department of human resource management and modeled after the state employee plans and provide consistent, premium-free continued health plan coverage for LODA-eligible disabled individuals, survivors and family members. Individuals must continue to meet eligibility requirements as defined by the Act.
NTHIC: At retirement: Monthly benefit is $1.50 per year of service per month with a maximum benefit of $45.00 per month.
Disability retirement: For employees who retire on disability or go on longterm disability under the VLDP, the monthly benefit is $45.00 per month.
Virginia Local Disability Program
Long-Term Disability: Begins after 125 workdays of short-term disability. Eligible if member is unable to work at all or less than 20 hours per week. Members will receive 60% of their predisability income and will be offset by any worker’s compensation benefit.
Minimum benefit and COLA: Program Notes: Program Notes: Program Notes: For members with at least 30 years of creditable service there is a minimum benefit set and is increased annually based on the VRS Plan 2 cost of living adjustment.
The monthly HIC benefit cannot exceed the individual premium amount. Employees who retire after being on long-term disability under VLDP must have at least 15 years of service credit to qualify for HIC as a retiree.
Plan Membership – School Board Non-Teacher HIC Single Employer Plan
Non-Teacher HIC School Board
Inactive members and beneficiaries currently receiving benefits 83
Active Employees: 313 Total 396
If the member is aged 60 or older will be eligible for the benefit provided they remain medically eligible.
82
CITY OF SUFFOLK, VIRGINIA
NOTES TO FINANCIAL STATEMENTS
June 30, 2022
Note 13. Other Postemployment Benefits Program – VRS Plans (Continued)
Contribution Requirements
Group Life Insurance Program:
The contribution requirements for GLI are governed by §51.1-506 and §51.1-508 of the Code of Virginia, as amended, but may be impacted as a result of funding provided to state agencies and school divisions by the Virginia General Assembly. The total rate for GLI was 1.34% of covered employee compensation. This was allocated into an employee and an employer component using a 60/40 split. The employee component was 0.80% (1.34% X 60%) and the employer component was 0.54% (1.34% X 40%). Employers may elect to pay all or part of the employee contribution; however, the employer must pay all of the employer contribution. Each employer’s contractually required employer contribution rate for the year ended June 30, 2022 was 0.54% of covered employee compensation. This rate was based on an actuarially determined rate from an actuarial valuation as of June 30, 2019. The actuarially determined rate, when combined with employee contributions, was expected to finance the costs of benefits payable during the year, with an additional amount to finance any unfunded accrued liability. Contribution to GLI from the City were $385,940 and $375,217 for the years ended June 30, 2022 and June 30, 2021, respectively. Contributions to GLI for the School Board were $1,264,187 and $493,598 for the years ended June 30, 2022 and June 30, 2021 respectively.
Line of Duty Act Program:
The contribution requirements for LODA are governed by §9.1-400.1 of the Code of Virginia, as amended, but may be impacted as a result of funding provided to state agencies by the Virginia General Assembly. Each employer’s contractually required employer contribution rate for LODA for the year ended June 30, 2022 was $722.55 per covered full-time-equivalent employee. This rate was based on an actuarially determined rate from an actuarial valuation as of June 30, 2019 and represents the pay-as-you-go funding rate and not the full actuarial cost of the benefits under the program. The actuarially determined pay-asyou-go rate was expected to finance the costs and related expenses of benefits payable during the year. Contributions to the LODA program from the City were $358,834 and $383,043 for the years ended June 30, 2022 and June 30, 2021, respectively.
Virginia Local Disability Program:
The contribution requirement for active Hybrid employees is governed by §51.1-1178(C) of the Code of Virginia, as amended, but may be impacted as a result of funding provided to school divisions by the Virginia General Assembly. Each school division’s contractually required employer contribution rate for the year ended June 30, 2022 was 0.47% of covered employee compensation for employees in the VLDP Teacher plan and 0.83% of covered employee compensation for the non-teacher employees covered in the VLDP. This rate was based on an actuarially determined rate from an actuarial valuation as of June 30, 2019. The actuarially determined rate was expected to finance the costs of benefits earned by employees during the year, with an additional amount to finance any unfunded accrued liability. Contributions from the School Board to the VLDP were $158,126 and $129,938 for the years ended June 30, 2022 and June 30, 2021, respectively.
83
CITY OF SUFFOLK, VIRGINIA NOTES TO FINANCIAL STATEMENTS
June 30, 2022
Note 13. Other Postemployment Benefits Program – VRS Plans (Continued)
Contribution Requirements (continued)
Teacher and Non-Teacher Employee Health Insurance Credit Programs: The contribution requirement for active employees is governed by §51.1-1401(E) of the Code of Virginia, as amended, but may be impacted as a result of funding provided to school divisions by the Virginia General Assembly. Each school division’s contractually required employer contribution rate for the year ended June 30, 2022 was 1.21% of covered employee compensation for employees in the THIC Program and 0.7% for employees in the NTHIC Program. This rate was based on an actuarially determined rate from an actuarial valuation as of June 30, 2019 for the THIC plan and June 30 ,2020 for the NTHIC plan. The actuarially determined rate was expected to finance the costs of benefits earned by employees during the year, with an additional amount to finance any unfunded accrued liability. Contributions from the school division to the VRS THIC Program were $1,024,485, and $1,010,627 for the years ended June 30, 2022 and June 30, 2021, respectively. Contributions from the school division to the VRS NTHIC program were $62,748 and $52,518 for the years ended June 30, 2022 and June 30, 2021, respectively.
During the 2020 session, House Bill 1513 was enacted. This bill required the addition of Health Insurance Credit benefits for non-teacher employees effective July 1, 2021. While benefit payments became effective July 1, 2021 employers were required to pre-fund the benefits beginning July 1, 2020. The bill impacted 95 employers and resulted in approximately $2.5 million of additional employer contributions in FY2021.
Long-Term Expected Rate of Return
GLI, THIC, NTHIC and VLDP:
The long-term expected rate of return on the System’s investments was determined using a log-normal distribution analysis in which best-estimate ranges of expected future real rates of return (expected returns, net of System’s investment expense and inflation) are developed for each major asset class. These ranges are combined to produce the long-term expected rate of return by weighting the expected future real rates of return by the target asset allocation percentage and by adding expected inflation. The target asset allocation and best estimates of arithmetic real rates of return for each major asset class are summarized below:
84
CITY OF SUFFOLK, VIRGINIA
NOTES TO FINANCIAL STATEMENTS
June 30, 2022
Note 13. Other Postemployment Benefits Program – VRS Plans (Continued)
Long-Term Expected Rate of Return (continued)
GLI, THIC and VLDP Programs:
Asset Class: Target Allocation
Arithmetic LongTerm Expected Rate of Return
Weighted Average Long-Term Expected Rate of Return
Public Equity 34.00% 5.00% 1.70%
Fixed Income 15.00% 0.57% 0.09% Credit Strategies 14.00% 4.49% 0.63% Real Assets 14.00% 4.76% 0.67% Private Equity 14.00% 9.94% 1.39%
MAPS – Multi-Asset Public Strategies 6.00% 3.29% 0.20% PIP – Private Investment Partnership 3.00% 6.84% 0.21% Total 100.00% 4.89% Inflation 2.50% *Expected arithmetic nominal return 7.39%
* The above allocation provides a one-year return of 7.39%. However, one-year returns do not take into account the volatility present in each of the asset classes. In setting the long-term expected return for the system, stochastic projections are employed to model future returns under various economic conditions. The results provide a range of returns over various time periods that ultimately provide a median return of 6.94%, including expected inflation of 2.50%. On October 10, 2019, the VRS Board elected a long-term rate of return of 6.75%, which was roughly at the 40th percentile of expected longterm results of the VRS fund asset allocation at that time, providing a median return of 7.11%, including expected inflation of 2.5%
LODA:
The long-term expected rate of return on LODA OPEB Program’s investments was set at 2.16% for this valuation. Since LODA is funded on a current-disbursement basis, it is not able to use the VRS Pooled Investments 6.75% assumption. Instead, the assumed annual rate of return of 2.21% was used since it approximates the risk-free rate of return. This Single Equivalent Interest Rate (SEIR) is the applicable municipal bond index rate based on the Bond Buyer General Obligation 20-year Municipal Bond Index as of the measurement date of June 30, 2021.
Net OPEB Liability (Asset)
The net OPEB liability (NOL) for the GLI, HIC, LODA and VLDP represents the programs’ total OPEB liability determined in accordance with GAAP, less the associated fiduciary net position. As of the measurement date of June 30, 2021, NOL amounts for the four programs are as follows:
85
CITY OF SUFFOLK, VIRGINIA
NOTES TO FINANCIAL STATEMENTS
June 30, 2022
Note 13. Other Postemployment Benefits Program – VRS Plans
Net OPEB Liability (Asset) (continued)
(Continued)
City and School - GLI City - LODA School – THIC SchoolVLDP
Total OPEB liability $3,577,346,000 $448,542,000 $1,477,874,000 $10,040,000 Plan fiduciary net position 2,413,074,000 7,553,000 194,305,000 11,756,000 Net OPEB liability (asset) 1,164,272,000 $440,989,000 1,283,569,000 ($1,716,000)
Fiduciary net position as a percent of total OPEB liability 67.45% 1.68% 13.15% 117.09%
The total OPEB liabilities are calculated by the System’s actuary and the plan’s fiduciary net position is reported in the System’s financial statements. The net OPEB liabilities are disclosed in accordance with the requirements of GAAP in the System’s notes to the financial statements and required supplementary information.
Actuarial Methods and Assumptions
The total GLI, THIC, NTHIC LODA and VLDP, OPEB liabilities were based on actuarial valuations as of June 30, 2020, using the Entry Age Normal actuarial cost method and the following assumptions, applied to all periods included in the measurement and rolled forward to the measurement date of June 30, 2021.
City and SchoolGLI City - LODA
School THIC, NTHIC and VLDP
Investment rate of return, net of investment expenses, including inflation 6.75% 2.16% * 6.75%
Health Care cost trend rate: Under age 65 n/a 7.00%-4.75% n/a Age 65 and older n/a 5.375% - 4.75% n/a Inflation Rate 2.50% 2.50% 2.50%
Projected salary increases:
Locality – general 3.5% - 5.35% n/a 3.5% - 5.35% Locality – hazardous duty 3.5% - 4.75% n/a 3.5% - 4.75% Teachers 3.5% - 5.95% n/a 3.5% - 5.95%
* LODA: Since LODA is funded on a current-disbursement basis, the assumed annual rate of return of 2.16% was used since it approximates the risk-free rate of return.
86
CITY OF SUFFOLK, VIRGINIA NOTES TO FINANCIAL STATEMENTS
June 30, 2022
Note 13. Other Postemployment Benefits Program – VRS Plans (Continued)
Actuarial Methods and Assumptions (continued)
Mortality Rates are as follows for all plans:
Mortality Rates – Teachers: Pre-Retirement: Pub-2010 Amount Weighted Teachers Employee Rates projected generationally; 110% of rates for males.
Post-Retirement: Pub-2010 Amount Weighted Teachers Healthy Retiree Rates projected generationally; males set forward 1 year; 105% of rates for females.
Post-Disablement: Pub-2010 Amount Weighted Teachers Disabled Rates projected generationally; 110% of rates for males and females.
Beneficiaries and Survivors: Pub-2010 Amount Weighted Teachers Contingent Annuitant Rates projected generationally. Mortality Improvement Scale: Rates projected generationally with Modified MP-2020 Improvement Scale that is 75% of the MP-2020 rates.
Mortality rates – General Employees: Pre-Retirement: Pub-2010 Amount Weighted General Employee Rates projected generationally; males set forward 2 years; 105% of rates for females set forward 3 years.
Post-Retirement: Pub-2010 Amount Weighted General Healthy Retiree Rates projected generationally; 95% of rates for males set forward 2 years; 95% of rates for females set forward 1 year.
Post-Disablement: Pub-2010 Amount Weighted General Disabled Rates projected generationally; 110% of rates for males set forward 3 ears; 110% of rates for females set forward 2 years.
Beneficiaries and Survivors: Pub-2010 Amount Weighted General Contingent Annuitant Rates projected generationally. Mortality Improvement Scale: Rates projected generationally with Modified MP-2020 Improvement Scale that is 75% of the MP-2020 rates.
Mortality rates – Hazardous Duty and Public Safety Employees: Pre-Retirement: Pub-2020 Amount Weighted Safety Employee Rates projected generationally; 95% of rates for males; 105% of rates for females set forward 2 years.
Post-Retirement: Pub-2010 Amount Weighted Safety Healthy Retiree rates projected generationally; 110% of rate for males; 105% of rates for females set forward 3 years.
87
CITY OF SUFFOLK, VIRGINIA
NOTES TO FINANCIAL STATEMENTS
June 30, 2022
Note 13. Other Postemployment Benefits Program – VRS Plans (Continued)
Actuarial Methods and Assumptions (continued)
Post-Disablement:
Pub-2010 Amount Weighted General Disables Rates projected generationally; 95% of rates for males set back 3 years; 90% of rates for females set back 3 years.
Beneficiaries and Survivors: Pub-2010 Amount Weighted Safety Contingent Annuitant Rates projected generationally; 110% of rates for males and females set forward 2 years.
Mortality Improvement Scale: Rates projected generationally with Modified MP-2020 Improvement Scale that is 75% of the MP-2020 rates.
The actuarial assumptions used in the June 30, 2020 valuation were based on the results of an actuarial experience study for the period from July 1, 2016 through June 30, 2020. Changes to the actuarial assumptions as a result of the experience study are as follows:
General Employees Teachers Hazardous Duty Employees
Mortality Rates (Preretirement, postretirement healthy, and disabled)
Update to PUB2010 public sector mortality tables. For future mortality improvements, replace load with a modified Mortality Improvement Scale MP-2020
Retirement Rates
Adjusted rates to better fit experience for Plan1; set separate rates based on experience for Plan 2/Hybrid; changed final retirement age from 75 to 80 for all.
Update to PUB2010 public sector mortality tables. For future mortality improvements, replace load with a modified Mortality Improvement Scale MP2020
Adjusted rates to better fit experience for Plan 1, set separate rates based on experience for Plan 2/Hybrid; changed final retirement age from 75 to 80 for all.
Update to PUB2010 public sector mortality tables. Increase disability life expectancy. For future mortality improvements, replace load with a modified Mortality Improvement Scale MP2020
Adjusted rates to better fit experience and changed final retirement age from 65 to 70.
Withdrawal Rates
Adjusted rates to better fit experience at each age and service decrement through 9 years of service
Disability Rates No change
Adjusted rates to better fit experience at each age and service decrement through 9 years of service
Decreased rates and changed from rates based on service only to better fit experience and to be more consistent with Locals top 10 Hazardous duty.
No change No change
Salary Scale No change No change No change
Line of Duty Disability No change n/a No change
Discount Rate No change No change No change
88
CITY OF SUFFOLK, VIRGINIA
NOTES TO FINANCIAL STATEMENTS
June 30, 2022
Note 13. Other Postemployment Benefits Program – VRS Plans (Continued)
Actuarial Methods and Assumptions (continued)
LODA: Public Safety Employees Mortality Rates (Pre-retirement, post-retirement healthy, and disabled)
Update to PUB201 public sector mortality tables. Increased disability life expectancy. For future mortality improvements. Replace load with a modified Mortality Improvement scale MP-2020.
Retirement Rates
Withdrawal Rates
Adjusted rates to better fit experience and changed final retirement age from 65 to 70.
Decreased rates and changed from rates based on age and service to rates based on service only to better fit experience and to be more consistent with Locals Top 10 Hazardous Duty.
Disability Rates No change Salary Scale No change Line of Duty Disability No change
Discount Rate
Group Life Insurance Program:
The discount rate used to measure the total GLI OPEB liability was 6.75%. The projection of cash flows used to determine the discount rate assumed that member contributions will be made per the VRS guidance and the employer contributions will be made in accordance with the VRS funding policy at rates equal to the difference between actuarially determined contribution rates adopted by the VRS Board of Trustees and the member rate. Through the fiscal year ending June 30, 2021 the rate contributed by the entity for the GLI OPEB will be subject to the portion of the VRS Board-certified rates that are funded by the Virginia General Assembly. From July 1, 2019 on, employers are assumed to contribute 100% of the actuarially determined contribution rates. Based on those assumptions, the GLI OPEB’s fiduciary net position was projected to be available to make all projected future benefit payments of eligible employees. Therefore, the long-term expected rate of return was applied to all periods of projected benefit payments to determine the total GLI OPEB liability.
Line of Duty Act Program:
The discount rate used to measure the total LODA OPEB liability was 2.16%. The projection of cash flows used to determine the discount rate assumed that employer contributions will be made per the VRS Statutes and that they will be made in accordance with the VRS funding policy and at rates equal to the actuarially determined contribution rates adopted by the VRS Board of Trustees. Through the fiscal year ending June 30, 2021, the rate contributed by participating employers to the LODA OPEB Program will be subject to the portion of the VRS Board-certified rates that are funded by the Virginia General Assembly.
Virginia Local Disability Program:
The discount rate used to measure the total School Board Employee VLDP OPEB was 6.75%. The projection of cash flows used to determine the discount rate assumed that employer contributions will be made in accordance with the VRS funding policy at rates equal to the actuarially determined contribution rates adopted by the VRS Board of Trustees. Through the fiscal year ending June 30, 2021, the rate contributed by the school division for the VRS VLDP will be subject to the portion of the VRS Board-
89
CITY OF SUFFOLK, VIRGINIA NOTES TO FINANCIAL STATEMENTS
June 30, 2022
Note 13. Other Postemployment Benefits Program – VRS Plans (Continued)
Discount Rate (continued)
Virginia Local Disability Program (continued) certified rates that are funded by the Virginia General Assembly. From July 1, 2021 on, all agencies are assumed to contribute 100% of the actuarially determined contribution rates. Based on those assumptions, the VLDP OPEB plan’s fiduciary net position was projected to be available to make all projected future benefit payments of current active and inactive employees. Therefore, the long-term expected rate of return was applied to all periods of projected benefit payments to determine the total VLDP OPEB liability.
Teacher and Non-Teacher Employee Health Insurance Credit Program:
The discount rate used to measure the total Teacher and Non-Teacher Employee HIC OPEB was 6.75%. The projection of cash flows used to determine the discount rate assumed that employer contributions will be made in accordance with the VRS funding policy and at rates equal to the actuarially determined contribution rates adopted by the VRS Board of Trustees and the member rate. Through the fiscal year ending June 30, 2021 the rate contributed by each school division for the VRS Teacher and Non-Teacher Employee Health Insurance Credit Program will be subject to the portion of the VRS Board-certified rates that are funded by the Virginia General Assembly. From July 1, 2021 on, all agencies are assumed to contribute 100% of the actuarially determined contribution rates. Based on those assumptions, the Teacher Employee HIC OPEB plan’s fiduciary net position was projected to be available to make all projected future benefit payments of current active and inactive employees. Therefore, the long-term expected rate of return was applied to all periods of projected benefit payments to determine the total Teacher and NonTeacher Employee HIC OPEB liability.
Changes in the Net NTHIC Liability
School Board Non-Teacher HIC
Total OPEB Liability Plan Fiduciary Net Position Net OPEB Liability
Balance at 6/30/2020 622,573 $ - $ 622,573 $
Changes for the Year: Service cost 10,909 - 10,909 Interest 42,022 - 42,022
Changes in assumptions 17,815 - 17,815
Contributions -- employer - 52,520 (52,520) Net investment income - 6,756 (6,756)
Benefit payments including refunds of employee contributions (35) (35)Administrative Expenses - (232) 232
Net Changes 70,711 59,009 11,702 Balances at 6/30/2021 693,284 $ 59,009 $ 634,275 $
90
CITY OF SUFFOLK, VIRGINIA
NOTES TO FINANCIAL STATEMENTS
June 30, 2022
Note 13. Other Postemployment Benefits Program – VRS Plans (Continued)
Sensitivity of the Net OPEB Liability
The following present the employer’s proportionate share of the Net OPEB liabilities using the discount rate for each plan (the current rate shown below) as well as what the NOL would be using a discount rate that is one percentage point lower or one percentage point higher.
Net OPEB Liability analysis using Discount rate: 1% lower (5.75%) Current Rate (6.75%) 1% higher (7.75%)
City - GLI $5,724,859 $3,918,355 $2,459,522
School - GLI $7,531,025 $5,154,577 $3,235,488
School - THIC $13,646,187 $12,122,156 $10,832,461 School - NTHIC $709,170 $634,275 $570,412
School VLDP ($7,014) ($30,600) ($51,300)
1% lower (1.16%) Current Rate (2.16%) 1% higher (3.16%)
City - LODA $14,114,157 $12,269,269 $10,803,351
Because the LODA Program contains a provisions for the payment of health insurance premiums, the liabilities are also impacted by the health care trend rates. The following presents the covered employer’s proportionate share of the net LODA OPEB liability using health care trend rate of 7.00% decreasing to 4.75%, as well as what the covered employer’s proportionate share of the net LODA OPEB liability would be if it were calculated using a health care trend rate that is one percentage point lower (6.00% decreasing to 3.75%) or one percentage point higher (8.00% decreasing to 5.75%) than the current rate:
Net OPEB Liability using the health care cost trend rate: 1% lower (6.00% decreasing to 3.75%) Current rate (7.00% decreasing to 4.75%) 1% higher (5.00% decreasing to 5.75%)
City - LODA $10,067,245 $12,269,269 $15,092,716
OPEB Liabilities, Expenses, Deferred Outflows of Resources and Deferred Inflows of Resources
At June 30, 2022, the City and School Board reported liabilities for the four various OPEB plans in the amount shown in the table below for their proportionate share of the OPEB plans. The OPEB Liabilities were measured as of June 30, 2021 and the total OPEB liabilities used to calculate the Net OPEB Liabilities were determined by an actuarial valuation as of June 30, 2020, and rolled forward to the measurement date of June 30, 2021 The City and School Board’s GLI, THIC and VLDP OPEB liabilities were based on the covered employer’s actuarially determined employer contributions to the plans for the year ended June 30, 2021, relative to the total of the actuarially determined employer contributions for all participating employers. The City’s proportion of the Net LODA OPEB liability was based on the City’s actuarially determined pay-as-you-go employer contributions to the LODA OPEB plan for the year ended June 30,
91
CITY OF SUFFOLK, VIRGINIA
NOTES TO FINANCIAL STATEMENTS
June 30, 2022
Note 13. Other Postemployment Benefits Program – VRS Plans (Continued)
OPEB Liabilities, Expenses, Deferred Outflows of Resources and Deferred Inflows of Resources (continued)
2020 relative to the total of the actuarially determined pay-as-you go employer contributions for all participating employers.
At June 30, 2021, the City and School Board’s respective proportions of the various programs as compared to the proportions for June 30, 2020 are shown in the table below.
City –GLI City –LODA School –GLI SchoolTHIC SchoolVLDP SchoolNTHIC Net OPEB Liability (Asset) $3,918,355 $12,269,269 $5,154,577 $12,122,156 ($30,600) $634,275 TOTALS FOR CITY AND SCHOOL $16,187,624 $17,880,408
6/30/21 Proportionate share of contributions 0.33655% 2.78220% 0.44273% 0.94441% 4.07483% n/a 6/30/20 Proportionate share of contributions 0.33753% 2.75114% 0.43943% 0.94455% 4.10950% n/a
For the year ended June 30, 2022, the City and School Board OPEB expense for the various plans as shown below. Since there was a change in proportionate share between measurement dates a portion of the VRS Teacher Employee VLDP and LODA Net OPEB expense was related to deferred amounts from changes in proportion.
OPEB Expense
City – GLI $181,169 City – LODA $1,123,907 School – GLI $196,940 School - THIC $937,181 School - NTHIC $53,964 School - VLDP $99,195
92
CITY OF SUFFOLK, VIRGINIA
NOTES TO FINANCIAL STATEMENTS
June 30, 2022
Note 13. Other Postemployment Benefits Program – VRS Plans (Continued)
OPEB Liabilities, Expenses, Deferred Outflows of Resources and Deferred Inflows of Resources (continued)
At June 30, 2022, the City and School Board reported deferred outflows of resources and deferred inflows of resources related to the OPEB plans from the following sources:
City – GLI City - LODA School NTHIC Deferred Outflows of Resources
Deferred Inflows of Resources
Deferred Outflows of Resources
Deferred Inflows of Resources
Deferred Outflows of Resources
Deferred Inflows of Resources Diff between expected and actual experience $446,902 $29,856 $1,022,927 $1,857,674 $- $Investment Experience - 935,227 - 71,048 - 3,994 Change in assumptions 216,018 536,115 3,395,314 586,896 14,252Changes in proportion 83,606 120,062 554,209 482,731 -Employer contributions subsequent to the MD 385,940 - 358,834 - 62,748Total $1,132,466 $1,621,260 $5,331,284 $2,998,349 $77,000 $3,994
School Board - GLI School Board - THIC School Board - VLDP Deferred Outflows of Resources
Deferred Inflows of Resources
Deferred Outflows of Resources
Deferred Inflows of Resources
Deferred Outflows of Resources
Deferred Inflows of Resources
Diff. Between expected and actual experience $587,898 $39,275 $- $211,531 $15,891 $22,925 Investment Experience - 1,230,288 - 159,685 - 22,853 Change in Assumptions 284,170 705,256 327,684 48,718 13,412 1,704 Changes in proportion 197,647 241,279 301,402 460,854 1,047 2,137
Employer contributions subsequent to the MD 1,264,187 - 1,024,484 - 158,126Total $2,333,902 $2,216,098 $1,653,570 $880,788 $188,476 $49,619
93
CITY OF SUFFOLK, VIRGINIA
NOTES TO FINANCIAL STATEMENTS
June 30, 2022
Note 13. Other Postemployment Benefits Program – VRS Plans (Continued)
OPEB Liabilities, Expenses, Deferred Outflows of Resources and Deferred Inflows of Resources (continued)
The amounts shown in the totals earlier reported as deferred outflows of resources related to the OPEB from the City and School Boards contributions subsequent to the measurement date will be recognized as a reduction of the Net OPEB Liability in the fiscal year ending June 30, 2023. Other amounts reported as deferred outflows of resources and deferred inflows of resources related to the OPEB will be recognized in the OPEB expense in future reporting periods as follows:
City – GLI City – LODA School – GLI School –THIC plan
School –NTHIC plan SchoolVLDP
FY 2023 ($172,392) $275,951 ($269,097) ($64,902) $2,565 ($5,189)
FY 2024 (156,592) 279,215 (208,307) (66,716) 2,565 (5,200)
FY 2025 (180,077) 280,177 (195,462) (51,923) 2,565 (5,237)
FY 2026 (306,748) 281,200 (400,270) (32,758) 2,563 (7,509)
FY 2027 (58,925) 297,208 (73,248) (18,034) - (319)
Thereafter - 560,350 - (17,369) - 4,185
Total ($874,734) $1,974,101 ($1,146,384) ($251,702) $10,258 ($19,269)
Plan Fiduciary Net Positions
Detailed information about the various programs’ Fiduciary Net Position is available in the separately issued VRS 2021 ACFR, which may be downloaded from the VRS website at http://www.varetire.org/Pdf/Publications/2021-annual-report.pdf, or by writing to the System’s Chief Financial Officer at P.O. Box 2500, Richmond, VA, 23218-2500.
Note 14. Commitments and Contingencies
Federally assisted grant programs:
The City participates in a number of federally assisted grant programs. Although the City has been audited in accordance with the provisions of the Uniform Guidance, these programs remain subject to financial and compliance audits by the grantors or their representatives. Such audits could lead to requests for reimbursements to the grantor agency for expenditures disallowed under terms of the grant. Based on prior experience, City management believes such disallowances, if any, will not be significant.
Construction Commitments:
The City has authorized expenditures for capital additions and construction of various governmental, stormwater, grant (ARPA), and utility capital projects. At June 30, 2022, projects expected to be completed at various dates through 2023 had a total unexpended balance of $47,447,938 (governmental), $1,905,808 (stormwater), $398,366 (grant – ARPA) and $3,272,343 (utility).
94
CITY OF SUFFOLK, VIRGINIA
NOTES TO FINANCIAL STATEMENTS
June 30, 2022
Note 14. Commitments and Contingencies (continued)
Encumbrances:
The City has the following encumbrances as of June 30, 2022:
General Fund
Litigation:
Road Maintenance Fund
Capital Projects Fund
Non-Major Governmental Funds Utility Fund
Non-Major Enterprise Fund
Internal Service Funds $2,727,203 $7,328,804 $47,447,938 $558,962 $3,560,906 $1,953,085 $4,289,384
There are various lawsuits pending against the City, one of which have a potential range of loss up to $1,000,000. There are no significant lawsuits pending against the School Board. These and other claims outstanding against the City and School board, in the opinion of management after consulting with legal counsel, will not materially affect the City or School Board’s financial position.
Note 15. Risk Management
The City and School Board are exposed to various risks of loss related to the following: torts; theft of damage to, and destruction of assets; errors and omissions; injuries to employees; and natural disasters. The City and School Board participate with other localities in a public entity risk pool, the Virginia Municipal League, for their coverage of property damage. The City and School Board pay an annual premium to the pools for its general insurance coverage. The agreement for the formation of the pools provides that the pools will be self-sustaining through member premiums. The City and School Board continue to carry commercial insurance for all other risks of loss.
There have been no significant reductions in insurance coverage from the prior year. Settled claims resulting from these risks have not exceeded commercial insurance coverage in any of the past three years.
Self-Insurance – City:
The City is self-insured for a portion of its health insurance risks up to $125,000 per occurrence. An external insurance policy provides coverage over the specified amount up to $1,000,000 per individual for life.
Claims payable reported in the Risk Management Fund at June 30, 2022 consists of all current self-insured claims payable, including an estimate of incurred but not reportable claims amounting to $4,035,745 the current portion of which is $2,384,806. Claims payable for health insurance are based on current enrollment and benefits and historical experience.
95
CITY OF SUFFOLK, VIRGINIA
NOTES TO FINANCIAL STATEMENTS
June 30, 2022
Note 15. Risk Management (Continued)
Self-Insurance – City (continued):
Claims payable for workers’ compensation and property and liability are based on insurance coverage and specific claims which have presented. Following is a summary of changes in claims payable for the fiscal years ended June 30, 2022 and 2021:
Beginning Balance Claims and Reserves Claim Payments Ending Balance
Workers' Compensation
20221,893,808 $ 991,844 $ 834,713 $ 2,050,939 $ 20211,800,318 $ 871,485 $ 777,995 $ 1,893,808 $
Property and Liability
20221,133,343 $ 653,405 $ 921,852 $ 864,896 $ 2021726,270 $ 1,922,734 $ 1,515,661 $ 1,133,343 $
Health Insurance
20221,299,568 $ 14,622,492 $ 14,802,150 $ 1,119,910 $ 20211,032,047 $ 15,753,691 $ 15,486,170 $ 1,299,568 $
Self-Insurance – School Board:
The School Board is self-insured for workers’ compensation benefits. Charges are made to the School Operating, Grants, and Food Service Funds as approved by City Council in the annual operating budgets. Any excess charges are reflected as nonspendable balance for workers’ compensation claims in the School Operating Fund. At June 30, 2022, $225,000 of fund balance was allocated for purposes of funding future claims.
Claims are paid by a third-party administrator acting in behalf of the School Board under terms of a contractual agreement. Administrative fees are included within the provisions of that agreement. The plan pays all claims up to $600,000 for each covered accident. Any claims exceeding $600,000 for each covered accident are paid by specific stop-loss insurance provided by a third-party insurance company. As of June 30, 2022, the workers’ compensation benefit obligation consisted of $498,943 in reported unpaid claims and estimated incurred but not reported claims.
Workers’ Compensation Self-Insurance Coverage – School Board
Changes in the balance of claims liabilities during the years ended June 30, 2022 and 2021, are as follows:
Beginning
Workers' Compensation
2022709,407 $ 223,732 $ 434,196 $ 498,943 $ 2021802,509 $ 431,855 $ 524,957 $ 709,407 $
Balance Claims and Reserves Claim Payments Ending Balance
96
CITY OF SUFFOLK, VIRGINIA NOTES TO FINANCIAL STATEMENTS
June 30, 2022
Note 15. Risk Management (Continued)
Health Insurance Self-Insurance Coverage – School Board:
Claims are paid by a third-party administrator acting on behalf of the School Board under terms of a contractual agreement. The plan pays all claims up to $125,000 for each participant. Any claims exceeding $125,000 for each participant are paid by specific stop-loss insurance provided by a third-party insurance company. As of June 30, 2022, School Operating Fund prepaids of $95,000 were held for purposes of funding the School Board’s future claims liabilities. As a result, $285,122 of the School Operating Fund balance is allocated for payment of future claims liabilities.
Note 16. Subsequent Events
On August 24, 2022, the City issued $27,735,000 of authorized Tax-Exempt General Obligation, with maturity dates of February 1, 2043. These bonds were issued to finance capital projects approved in the FY2023 Capital Improvements Plan. In addition, on August 23, 2022, the City issued $4,955,000 of stormwater revenue bonds, the proceeds of which are to be used to finance the capital projects approved in the FY2023 Capital Improvements Plan. The final maturity date of the stormwater revenue bonds is November 1, 2041.
Note 17. Prior Period Adjustment
The implementation of GASB Statement No. 87 required the reporting of leases that may not have been previously reported as capital leases as liabilities. In addition, the implementation of the standard, in some instances required a revaluation of the capital leases that were existing, and the associated assets. The implementation of this standard required the restatement of the beginning balances of Lease Receivable, and related deferred inflow of resources related to lease receivables. The implementation of this standard also required the restatement of the beginning balances of net position, leases payable, capital assets leases.
The net effect of the implementation of this standard impacted the net position of the City, due to the removal of the existing capital leases and related capital assets, as of the end of the previous fiscal year.
97
CITY OF SUFFOLK, VIRGINIA
NOTES TO FINANCIAL STATEMENTS
June 30, 2022
Note 17. Prior Period Adjustment (continued)
The effect of this restatement is shown in the following table:
Governmental Activities (excluding ISF)
Fleet Management Fund
Information Technology Fund
Risk Management Fund
Total Governmental Activities
Other capital assets, net
June 30, 2021, as previously stated $ 388,531,170 $ 13,648,195 $ 2,676,663 $ 412,694 $ 405,268,722 Restatement for Implementation of GASB 87, Leases 24,107,087 143,134 302,267 - 24,552,488 Other capital assets, net, restated 6/30/2021 $ 412,638,257 $ 13,791,329 $ 2,978,930 $ 412,694 $ 429,821,210
Lease Liabilities
June 30, 2021, as previously stated $ 1,248,513 $ - $ 34,723 $ - $ 1,283,236 Restatement for Implementation of GASB 87, Leases 23,000,610 143,134 298,650 - 23,442,393 Lease Liabilities, restated 6/30/2021 $ 24,249,123 $ 143,134 $ 333,372 $ - $ 24,725,629
Net Position
June 30, 2021, as previously stated 378,335,869 $ 26,616,124 $ (418,403) $ 12,696,741 $ 417,230,331 $ Restatement for Implementation of GASB 87, Leases 1,106,478 - 3,617 - 1,110,095 Net Position, restated 6/30/2021 379,442,347 $ 26,616,124 $ (414,786) $ 12,696,741 $ 418,340,426 $
Utility Fund Stormwater Fund Refuse Fund
Capital Assets, net
Total Businesstype Activities
June 30, 2021, as previously stated $ 430,418,518 $ 169,475 $ - $ 430,587,993 Restatement for Implementation of GASB 87, Leases 4,995,445 28,908 5,787 5,030,140 Capital Assets, net, restated $ 435,413,963 $ 198,383 $ 5,787 $ 435,618,133
Lease Liabilities
June 30, 2021, as previously stated $ 411,085 $ - $ - $ 411,085 Restatement for Implementation of GASB 87, Leases 4,593,117 28,908 5,787 4,627,813 Lease Liabilities, restated $ 5,004,202 $ 28,908 $ 5,787 $ 5,038,898
Net Position
June 30, 2021, as previously stated 157,954,700 $ 7,028,336 $ 3,324,579 $ 168,307,615 $ Restatement for Implementation of GASB 87, Leases 402,327 - - 402,327 June 30, 2021, as restated 158,357,027 $ 7,028,336 $ 3,324,579 $ 168,709,942 $
In addition to the amounts shown above the beginning balance of leases receivable and deferred inflows of resources in the General and Aviation funds were restated as shown below. There was no impact on the beginning balances of the fund balance due to this restatement as the lease and the deferred inflow were offsetting.
Leases Receivable
Deferred inflows related to leases General fund $1,041,094 $1,041,094 Aviation $1,098,435 $1,098,435
98
CITY OF SUFFOLK, VIRGINIA
NOTES TO FINANCIAL STATEMENTS
June 30, 2022
Note 18. Fund Balances
Fund Balance is classified as nonspendable, restricted, committed, assigned and/or unassigned based primarily on the extent to which the City is bound to observe constraints imposed upon the use of the resources in the government funds. The constraints placed on the general fund balance and other governmental funds balance are presented below:
General Fund Capital Projects Fund Road Maintenance
Consolidated Grants Debt Service Fund
Non-major Governmental Funds
Nonspendable: Inventories 100,474 $ - $ - $ - $ - $ 164,694 $ Total Nonspendable 100,474 - - - - 164,694
Restricted for:
Judicial Administration - - - 991,434 - 200,108 Public Safety 157,339 - - 148,323 -Public Works - Grants 1,167,500 - 18,600,527 57,449 -Cemetery Care - - - - - 937,254 Health and Welfare - - - 1,039,649 -Community Development - - - 383,672 -Transportation - - - - - 2,571,952 Parks and Recreation - - - 118,850 - -
Capital Outlay: - 6,711,101 - - -Roadway Projects - 29,722,796 - - -Schools - 1,108,953 - - -Public Facilities - 4,244,047 - - -Aviation - 102,256 - - -Recreation facilities - 18,323,285 - - -Total Restricted 1,324,839 60,212,438 18,600,527 2,739,377 - 3,709,314
Committed to:
General Government 542,688 - - - -Judicial administration 270,287 - - - -Public Safety - Police 312,726 - - - -Public Safety - Fire 1,067,794 - - - -Education 397,485 - - - -Public Works - - - - - 299,714 Aviation - - - - 607,630 Route 17 Taxing District - - - - - 6,735,235 Economic Development Incentives 2,019,813 - - - -Budget Stabilization fund 11,741,438 - - - - -
Capital Outlay - 9,966,324 - - -Capital Projects Reserve 21,938,450 - - - -Debt Service - - - - 492,720Total Committed 38,290,681 9,966,324 - - 492,720 7,642,579
Assigned to:
General Government Administration 18,185 - - - -Judicial Administration 3,263 - - - -Public Safety - Police 336,613 - - - -Public Safety - Fire 548,329 - - - -Public Works 42,913 - - - -Social Services 16,838 - - - -Parks, Recreation and Cultural 57,467 - - - -Community Development 838,538 - - -Total Assigned 1,862,146 - - - - -
Unassigned 93,931,500 - - - - (10,819)
Total Fund Balance 135,509,640 $ 70,178,762 $ 18,600,527 $ 2,739,377 $ 492,720 $ 11,505,768 $
99
CITY OF SUFFOLK, VIRGINIA NOTES TO FINANCIAL STATEMENTS
June 30, 2022
Note 18. Fund Balances (continued)
The City Council has adopted a financial policy goal that unassigned fund balance should be 20% of the following fiscal years governmental funds budget. The adopted policy also established a budget stabilization fund the policy states that any excess amounts over the 20% will be dedicated to the budget stabilization fund, until that reaches 2% of the budgeted revenue and then to a capital reserve fund, both of these reserves are reported as committed fund balance. The amounts in the budget stabilization fund can only be drawn with the approval of City Council in an emergency situation, that would result in increased expenditures over budgeted amount or significant shortfalls in revenue.
Note 19. Tax Abatement Agreements
As of June 30, 2022, the City provides tax abatement through two programs the land use program and the rehabilitated structures program.
The Land use program provides for a reduction in the assessed value for land preservation with property devoted to agricultural, horticultural, forest or open space under Code of Virginia sections 58.1-3229 thru 3230, 58.1-3235 and 58.1-3237 as well as City Ordinance 82-71-77. The property owner must make a 6 year commitment, and must revalidate the use every 6 years. The valuation of the property is determined by the State Land Evaluation Advisory Committee; this process gives the property a reduction in value based on the agricultural use. This reduction in value is used to calculate the real estate tax reduction. If the property owner fails to comply with the requirements of the use, or has a change in use, the property is subject to roll back taxes.
The rehabilitated structures program provides a partial exemption from real estate taxes for qualifying rehabilitated real estate under Code of Virginia sections 58.1-3220 thru 3221 and City Ordinance 82-481482. For qualifying properties, the initial increase in the real estate assessment caused by rehabilitation will be excused for 10 years. Upon receipt of an application the Assessor will determine the base value prior to commencement of the rehabilitation. The credit will remain with the property for the term of the exemption. There are separate requirements for residential and commercial properties to qualify for the program.
- Residential buildings should be at least 25 years old. The improvements need to increase the assessed value by no less than 40 percent. The total square footage of the building shall not be increased by more than 15 percent.
- Commercial/Industrial buildings should be at least 25 years old. The improvements need to increase the assessed value by no less than 60 percent.
- For both Residential and commercial/industrial properties, improvements to vacant land and total replacement of structures are not eligible. In order to be eligible all appropriate building permits must have been acquired and an application for exemption must be filed with the City Assessor. Amount
Tax Abatement Program City Wide Real Estate Downtown Business Overlay District Land Use program $4,348,909 $Rehabilitated Structures $47,305 $137,076 100
of Taxes Abated
CITY OF SUFFOLK, VIRGINIA NOTES TO FINANCIAL STATEMENTS
June 30, 2022
Note 20. Future Accounting Standards
The GASB has issued the following statements, which are not yet effective.
GASB Statement No. 91, Conduit Debt Obligations, provides a single method of reporting conduit debt obligations by issue and eliminates diversity in practice. This statement is effective for the fiscal year ending June 30, 2022; however, with the implementation of Statement No. 95, this has been delayed to fiscal year ending June 30, 2023.
GASB Statement No. 94, Public-Private and Public-Public Partnerships and Availability Payment Arrangements, the primary objective of which is to improve financial reporting by addressing issues related to the Public-private and Public-public partnership arrangements. This statement is effective for the fiscal year ending June 30, 2023.
GASB Statement No. 96, Subscription-Based Information Technology Arrangements, provides guidance on the accounting and financial reporting for subscriptions-based information technology arrangements for government end users. This statement is effective for the fiscal year ending June 30, 2023.
GASB Statement No. 99, Omnibus, enhances comparability in accounting and financial reporting and to improve the consistency of authoritative literature by addressing (1) practice issues that have been identified during implementation and application of certain GASB Statements and (2) accounting and financial reporting for financial guarantees. The requirements related to leases, PPP’s and SBITA’s are effective for fiscal year ending June 30, 2023, the remaining provisions are effective for fiscal year ending June 30, 2024.
GASB Statement No. 100, Accounting Changes and Error Corrections – An Amendment of GASB Statement No. 62, enhances accounting and financial reporting requirements for accounting changes and error corrections to provide more understandable, reliable, relevant, consistent and comparable information for making decisions or assessing accountability. This statement is effective for fiscal year ending June 30, 2024.
GASB Statement No. 101, Compensated Absences, the objective of this statement is to better meet the information needs of financial statement users by updating the recognition and measurement guidance under a unified model and by amending certain previously required disclosures. This statement is effective for fiscal year ending June 30, 2025.
Management has not yet evaluated the effects, if any, of adopting these standards.
101
REQUIRED SUPPLEMENTARY INFORMATION
CITY OF SUFFOLK, VIRGINIA
SCHEDULE OF REVENUES, EXPENDITURES, AND CHANGES IN FUND BALANCES - BUDGET AND ACTUAL - BUDGETARY BASIS GENERAL FUND
Year Ended June 30, 2022
REVENUES
General property taxes:
Real estate
Budgeted Amounts
Actual Variance with Original Final Amounts Final Budget
117,869,846 $ 119,474,392 $ 117,584,079 $ (1,890,313) $
Personal property 26,000,000 26,000,000 30,122,113 4,122,113
Public service corporations 4,800,000 4,800,000 4,842,247 42,247
Machinery and tools - - 1,887,318 1,887,318
Payments in Lieu of Taxes 3,000 3,000 - (3,000)
Penalties 1,300,000 1,300,000 1,818,460 518,460
Total general property taxes 149,972,846 151,577,392 156,254,217 4,676,825
Other Local Taxes
Sales and use 13,500,000 13,500,000 16,370,461 2,870,461
Utility tax 4,700,000 4,700,000 5,024,008 324,008
Communication taxes 2,300,000 2,300,000 2,499,745 199,745
Business and occupational licenses 7,500,000 7,500,000 10,964,624 3,464,624
Motor vehicle license 2,500,000 2,500,000 2,709,174 209,174
Bank stock 706,203 706,203 747,889 41,686
Recordation 2,200,000 2,200,000 3,279,397 1,079,397
Tobacco 1,900,000 1,900,000 1,831,481 (68,519)
Lodging 1,400,000 1,400,000 2,206,627 806,627
Meals 11,000,000 11,000,000 15,592,762 4,592,762
Admission - - 177,788 177,788
Total other local taxes 47,706,203 47,706,203 61,403,956 13,697,753
Permits, fees, and licenses
Animal license 35,000 35,000 29,415 (5,585)
Permits and other licenses 1,455,700 1,455,700 2,354,859 899,159
Total permits, fees, and licenses 1,490,700 1,490,700 2,384,274 893,574
Fines and forfeitures
Revenue from use of money and property:
810,000 810,000 717,257 (92,743)
Revenue from use of money 800,000 800,000 515,929 (284,071)
Revenue from use of property 376,706 376,706 420,895 44,189
Total use of money and property 1,176,706 1,176,706 936,824 (239,882)
Charges for services:
Court costs 243,787 243,787 303,796 60,009
Commonwealth's Attorney fee 10,000 10,000 7,824 (2,176)
Police and traffic control 35,000 35,000 36,056 1,056
Charges for fire and rescue service 2,227,266 2,227,266 2,658,984 431,718
Charges for other protection 50,000 50,000 21,940 (28,060)
Charges for parks and recreation 600,000 600,000 632,410 32,410
Charges for library 20,000 20,000 10,572 (9,428)
Charges for tourism 26,100 26,100 8,569 (17,531)
Charges for planning and community development 50 50 - (50)
Charges for other services 252,500 252,500 294,624 42,124
Total charges for services 3,464,703 3,464,703 3,974,775 510,072 (Continued)
EXHIBIT 10
102
CITY OF SUFFOLK, VIRGINIA
SCHEDULE OF REVENUES, EXPENDITURES, AND CHANGES IN FUND BALANCES - BUDGET AND ACTUAL - BUDGETARY BASIS GENERAL FUND Year Ended June 30, 2022
REVENUES (Continued)
Miscellaneous revenues
Recovered Costs
Budgeted Amounts
Actual Variance with Original Final Amounts Final Budget
635,894 635,894 780,738 144,844 Miscellaneous 718,000 718,000 253,502 (464,498)
Total revenue from local sources 205,975,052 207,579,598 226,705,543 19,125,945
Revenue from the Commonwealth: Noncategorical aid:
Tax on deeds 450,000 450,000 746,545 296,545
Railroad rolling stock tax 125,000 125,000 130,114 5,114
House bill 599 funds 3,200,896 3,200,896 3,075,124 (125,772)
PPTRA 10,169,730 10,169,730 10,169,730Mobile home titling tax 25,000 25,000 37,724 12,724
Vehicle rental tax 175,000 175,000 245,212 70,212
Games of skill - - 18,000 18,000
Total noncategorical aid 14,145,626 14,145,626 14,422,449 276,823
Categorical aid:
Commonwealth's Attorney
1,125,098 1,125,098 1,122,819 (2,279)
Commissioner of the Revenue 229,865 229,865 229,973 108
Treasurer 269,531 269,531 270,348 817 Sheriff 1,041,253 1,105,843 1,102,701 (3,142)
Circuit Court Clerk 604,471 624,054 101,660 (522,394)
Registrar 51,702 51,702 606,944 555,242
Total categorical aid 3,321,920 3,406,093 3,434,445 28,352
Other categorical aid:
Public assistance and welfare administration 4,380,040 4,380,040 3,877,692 (502,348) Police 350,000 350,000 504,515 154,515 Fire and rescue 410,928 410,928 436,250 25,322 Library 174,914 174,914 237,572 62,658
Total other categorical aid 5,315,882 5,315,882 5,056,029 (259,853)
Total categorical aid 8,637,802 8,721,975 8,490,474 (231,501)
Total revenue from the Commonwealth 22,783,428 22,867,601 22,912,923 45,322
Revenue from the Federal government
Categorical aid:
Public assistance and welfare administration
5,107,404 5,107,404 5,259,003 151,599 Public Safety - - 19,918 19,918 Parks, recreation and cultural 20,000 20,000 21,100 1,100
Total revenue from the Federal government 5,127,404 5,127,404 5,300,021 172,617
Total revenues 233,885,884 235,574,603 254,918,487 19,343,884
EXHIBIT 10
(Continued)
103
SCHEDULE
OF REVENUES,
EXPENDITURES,
AND
CITY OF SUFFOLK, VIRGINIA
CHANGES
IN FUND BALANCES - BUDGET AND ACTUAL - BUDGETARY BASIS GENERAL FUND Year Ended June 30, 2022
EXPENDITURES
General Government administration: Legislative:
City Council
General and financial administration:
City Manager
Budgeted Amounts
Actual Variance with Original Final Amounts Final Budget
533,303 $ 541,247 $ 444,475 $ 96,772 $
1,188,483 1,213,035 1,177,314 35,721
Budget and strategic planning 371,289 378,271 374,556 3,715
City Attorney 1,215,583 1,234,870 1,290,388 (55,518)
Human resources 1,403,658 1,511,932 1,558,615 (46,683)
Commissioner of the Revenue 1,208,108 1,226,989 1,159,466 67,523
City Assessor 2,047,025 2,076,842 1,907,744 169,098
City Treasurer
1,756,182 1,784,237 1,761,661 22,576
Finance 1,736,055 1,762,704 1,715,174 47,530
Purchasing 360,212 366,379 359,339 7,040
Capital program management 4,502,534 4,571,876 4,417,882 153,994
Media and community relations 800,155 934,335 886,899 47,436
Local and regional organizations 1,231,512 1,231,512 1,215,257 16,255
Board of Elections:
Registrar 779,263 784,354 828,826 (44,472)
Total general government administration 19,133,362 19,618,583 19,097,596 520,987
Judicial administration: Courts:
Circuit Court 222,334 226,693 220,222 6,471 District Court 93,585 93,585 60,901 32,684 Magistrate 18,061 18,061 13,725 4,336
Juvenile and Domestic Relations Court 17,560 17,560 13,347 4,213 Juvenile and Domestic Relations Court Service Unit 973,435 973,435 847,633 125,802
Circuit Court Clerk 1,731,808 1,783,856 1,682,712 101,144
Sheriff 3,325,632 3,492,012 3,563,618 (71,606)
Commonwealth's Attorney 3,619,484 3,949,312 3,509,711 439,601
Total judicial administration 10,001,899 10,554,514 9,911,869 642,645
Public safety: Police 27,609,541 28,239,039 26,772,070 1,466,969 Communications 2,094,906 2,116,664 1,670,661 446,003
Property seizure program - Federal - 190,823 20,709 170,114 Police E-ticketing - 160,253 2,915 157,338 Confiscation program - State - 122,556 - 122,556 DARE - 2,850 - 2,850 Fire 35,229,937 35,640,947 36,540,292 (899,345)
Western Tidewater Regional Jail 4,492,631 4,492,631 4,492,631Animal shelter and management 995,111 1,003,989 759,201 244,788 Emergency services 18,267 18,267 9,376 8,891
Total public safety 70,440,393 71,988,019 70,267,855 1,720,164
Public works: Administration
1,082,754 1,115,249 1,051,210 64,039
Total public works 1,082,754 1,115,249 1,051,210 64,039
EXHIBIT 10
(Continued) 104
SCHEDULE OF REVENUES,
EXPENDITURES,
AND
CITY OF SUFFOLK, VIRGINIA
CHANGES
IN FUND BALANCES - BUDGET AND ACTUAL - BUDGETARY BASIS GENERAL FUND Year Ended June 30, 2022
EXPENDITURES (Continued)
Health and welfare:
Western Tidewater Health Department
Budgeted Amounts
Actual Variance with Original Final Amounts Final Budget
1,095,655 $ 1,095,655 $ 1,095,655 $ - $
Western Tidewater CSB 474,404 474,404 474,404 -
Social Services 12,058,083 12,205,057 10,879,315 1,325,742
Comprehensive Services Act 2,512,554 2,516,073 2,184,136 331,937
Total health and welfare 16,140,696 16,291,189 14,633,510 1,657,679
Education:
Contributions to component unit school board 65,332,201 65,332,201 64,934,716 397,485
Lease rent of building 442,979 442,979 442,979 -
Total education 65,775,180 65,775,180 65,377,695 397,485
Parks, recreation, and cultural:
Parks and recreation 2,831,249 2,853,775 2,697,407 156,368
Parks and recreation maintenance 3,329,473 3,400,819 2,995,885 404,934
Parks and recreation - recreation 2,954,337 2,995,022 2,292,619 702,403
Public libraries 3,671,592 3,714,399 3,472,334 242,065
Total parks, recreation, and cultural 12,786,651 12,964,015 11,458,245 1,505,770
Community Development:
Planning and community development 4,889,188 5,559,043 4,912,836 646,207
Economic development 1,139,447 4,174,645 2,686,667 1,487,978
Tourism 761,318 766,461 735,388 31,073
Cooperative extension services 69,688 69,688 31,084 38,604
Total community development 6,859,641 10,569,837 8,365,975 2,203,862
Nondepartmental:
Salary, fringe benefits and insurance 649,997 1,440,383 673,339 767,044 Other Miscellaneous 60,000 - - -
Total nondepartmental 709,997 1,440,383 673,339 767,044
Total expenditures 202,930,573 210,316,969 200,837,294 9,479,675
Excess of revenues over expenditures 30,955,311 25,257,634 54,081,193 28,823,559
OTHER FINANCING SOURCES (USES)
Fund Balance Surplus 1,000,000 7,486,761 - 7,486,761 Transfers in 2,930,647 2,930,647 2,930,647Transfers out (34,885,958) (35,675,042) (33,494,035) (2,181,007)
Total other financing uses, net (30,955,311) (25,257,634) (30,563,388) 5,305,754
Net change in fund balances - $ - $ 23,517,805 $ 23,517,805 $
Reconciliation to Governmental Fund Statement:
Total net change in fund balance 23,517,805 $ Encumbrances 2,727,205 26,245,010 $
Total net change in fund balance per Statement of Revenues, Expenditures and Changes in Fund Balance (Exhibit 4)
EXHIBIT 10
105
CITY OF SUFFOLK, VIRGINIA
SCHEDULE OF REVENUES, EXPENDITURES, AND CHANGES IN FUND BALANCESBUDGET AND ACTUAL - BUDGETARY BASIS ROAD MAINTENANCE FUND
For the Year Ended June 30, 2022
Road Maintenance
REVENUES
Permits, fees and licenses
Miscellaneous
Budgeted Amounts
Actual Variance with Original Final Amounts Final Budget
370,000 $ 370,000 $ 426,913 $ 56,913 $ Fines and forfeitures 250,000 250,000 296,356 46,356 Revenue from use of money and property 15,000 15,000 63,057 48,057 Charges for services 1,292,303 1,292,303 1,724,573 432,270 24,500 24,500 40,674 16,174
Intergovernmental: Revenue from the Commonwealth 25,060,900 25,060,900 25,491,046 430,146 Fund balance (rollover/appropriations) 2,710,037 7,693,704 - (7,693,704) Total revenues 29,722,740 34,706,407 28,042,619 (6,663,788)
EXPENDITURES
Current: Public Works 27,429,560 31,737,569 29,659,843 2,077,726 Total expenditures 27,429,560 31,737,569 29,659,843 2,077,726
Excess (Deficiency) of revenues over (under) expenditures 2,293,180 2,968,838 (1,617,224) (4,586,062)
OTHER FINANCING USES
Transfers in - 127,790 127,790Transfers out (2,293,180) (3,096,628) (3,096,628)Total other financing uses, net (2,293,180) (2,968,838) (2,968,838) -
Net change in fund balances - $ - $ (4,586,062) $ (4,586,062) $
Reconciliation to Governmental Fund Statement:
Total net change in fund balance (4,586,062) $ Encumbrances 7,328,802
Total net change in fund balance per Statement of Revenues, Expenditures and changes in Fund Balance (Exhibit 4) 2,742,740 $
EXHIBIT 11
106
CITY OF SUFFOLK,
VIRGINIA
REQUIRED SUPPLEMENTARY INFORMATION
SCHEDULE OF CHANGES IN THE CITY'S NET PENSION LIABILITY AND RELATED RATIOS FOR THE YEAR ENDED JUNE 30,
Total Pension Liability
Service cost
6,994,155 $ 7,018,182 $ 7,104,813 $ 7,259,255 $ 7,533,051 $ 7,567,281 $ 8,132,336 $ 8,280,040 $ Interest 15,882,027 16,812,748 17,359,071 18,400,909 19,140,479 20,613,324 21,574,861 22,671,297
Changes in assumptions - - - (690,942) - 9,986,163 - 14,289,977
Difference between expected and actual experience - (5,841,034) 1,303,368 (2,868,934) 6,884,588 651,344 1,274,360 (2,470,637)
Benefit payments, including refunds of employee contributions (9,322,789) (9,837,539) (10,533,021) (11,234,683) (11,835,331) (13,199,609) (14,133,599) (15,342,506)
Net change in total pension liability 13,553,393 8,152,357 15,234,231 10,865,605 21,722,787 25,618,503 16,847,958 27,428,171
Total pension liability -- beginning 231,547,492 245,100,885 253,253,242 268,487,473 279,353,078 301,075,865 326,694,368 343,542,326
Total pension liability -- ending 245,100,885 $ 253,253,242 $ 268,487,473 $ 279,353,078 $ 301,075,865 $ 326,694,368 $ 343,542,326 $ 370,970,497 $
Plan fiduciary net position
Contributions -- employer 7,684,006 $ 7,327,510 $ 7,519,618 $ 6,958,618 $ 7,172,294 $ 7,031,636 $ 7,256,065 $ 8,393,781 $
Contributions -- employee 2,877,613 2,851,871 2,962,118 3,248,534 3,241,083 3,260,682 3,361,141 3,350,831
Net investment income 28,132,949 9,496,953 3,824,803 26,854,025 18,158,127 17,460,442 5,284,646 76,007,281
Benefit payments, including refunds of employee contributions (9,322,789) (9,837,539) (10,533,021) (11,234,683) (11,835,331) (13,199,609) (14,133,599) (15,342,506)
Administrative expense (149,011) (127,715) (132,646) (152,890) (154,614) (171,506) (178,495) (187,378)
Other 1,483 (2,019) (1,608) (24,013) (16,278) (11,042) (6,273) 7,191
Net change in plan fiduciary net position 29,224,251 9,709,061 3,639,264 25,649,591 16,565,281 14,370,603 1,583,485 72,229,200
Plan fiduciary net position -- beginning 177,492,218 206,716,469 216,425,533 220,064,797 245,714,388 262,279,669 276,650,272 278,233,757
Plan fiduciary net position -- ending 206,716,469 $ 216,425,530 $ 220,064,797 $ 245,714,388 $ 262,279,669 $ 276,650,272 $ 278,233,757 $ 350,462,957 $
Total net pension liability -- beginning 54,055,274 $ 38,384,416 $ 36,827,709 $ 48,422,676 $ 33,638,690 $ 38,796,196 $ 50,044,096 $ 65,308,569 $
Total net pension liability -- ending 38,384,416 $ 36,827,712 $ 48,422,676 $ 33,638,690 $ 38,796,196 $ 50,044,096 $ 65,308,569 $ 20,507,540 $
Plan fiduciary net position as a percentage of total pension liability 84.34% 85.46% 81.96% 87.96% 87.11% 84.68% 80.99% 94.47%
Covered payroll 55,954,879 $ 63,639,606 $ 59,144,296 $ 64,085,203 $ 67,302,874 $ 67,256,705 $ 69,343,981 $ 69,212,248 $
Net pension liability as a percentage of covered payroll 68.60% 57.87% 81.87% 52.49% 57.64% 74.41% 94.18% 29.63%
Schedules are intended to show information for 10 years. Additional years will be included as they become available.
Per GAAP, Net Pension Liability is reported using the measurement date, which is one year prior to the reporting date.
EXHIBIT 12
2014 2015 2016 2017 2018 2019 2020 2021
107
CITY OF SUFFOLK, VIRGINIA
REQUIRED SUPPLEMENTARY INFORMATION
SCHEDULE OF CHANGES IN THE SCHOOL BOARD'S (NON-TEACHER) NET PENSION LIABILITY (ASSET) AND RELATED RATIOS
FOR THE YEAR ENDED JUNE 30,
Total Pension Liability
Service cost
738,127 $ 713,970 $ 733,174 $ 668,468 $ 648,762 $ 642,823 $ 687,145 $ 669,620 $
Interest 1,455,330 1,537,449 1,650,099 1,706,059 1,742,804 1,849,648 1,921,663 2,025,076
Changes of assumptions - - - (209,695) - 801,043 - 899,673
Difference between expected and actual experience - 304,251 (570,559) (515,637) 270,296 (42,381) 148,865 (796,573)
Benefit payments, including refunds of employee contributions (1,049,323) (991,325) (901,450) (1,125,127) (1,123,413) (1,147,613) (1,263,572) (1,187,694)
Net change in total pension liability 1,144,134 1,564,345 911,264 524,068 1,538,449 2,103,520 1,494,101 1,610,102
Total pension liability -- beginning 21,315,088 22,459,222 24,023,567 24,934,831 25,458,899 26,997,348 29,100,868 30,594,969
Total pension liability -- ending 22,459,222 $ 24,023,567 $ 24,934,831 $ 25,458,899 $ 26,997,348 $ 29,100,868 $ 30,594,969 $ 32,205,071 $
Plan fiduciary net position
Contributions -- employer 587,401 $ 477,042 $ 663,115 $ 393,829 $ 395,475 $ 356,625 $ 351,095 $ 381,546 $
Contributions -- employee 330,019 312,739 314,507 324,226 324,119 341,637 339,946 353,744
Net investment income 3,042,856 1,014,884 405,924 2,848,179 1,910,589 1,823,319 548,651 7,850,056
Benefit payments, including refunds of employee contributions (1,049,323) (991,325) (901,450) (1,125,127) (1,123,413) (1,147,613) (1,263,572) (1,187,694)
Administrative expense (16,345) (13,901) (14,198) (16,505) (16,379) (18,028) (18,730) (19,450)
Other 161 (215) (171) (2,534) (1,688) (1,148) (679) 741
Net change in plan fiduciary net position 2,894,769 799,224 467,727 2,422,068 1,488,703 1,354,792 (43,289) 7,378,943
Plan fiduciary net position -- beginning 19,344,130 22,238,899 23,038,123 23,505,850 25,927,918 27,416,621 28,771,413 28,728,124
Plan fiduciary net position -- ending 22,238,899 $ 23,038,123 $ 23,505,850 $ 25,927,918 $ 27,416,621 $ 28,771,413 $ 28,728,124 $ 36,107,067 $
Total net pension liability -- beginning 1,970,958 $ 220,323 $ 985,444 $ 1,428,981 $ (469,019) $ (419,273) $ 329,455 $ 1,866,845 $
Total net pension liability (asset) -- ending 220,323 $ 985,444 $ 1,428,981 $ (469,019) $ (419,273) $ 329,455 $ 1,866,845 $ (3,901,996) $
Plan fiduciary net position as a percentage of total pension liability 99% 96% 94% 102% 102% 99% 94% 112%
Covered payroll 6,739,997 $ 6,271,733 $ 7,303,711 $ 6,556,134 $ 6,718,706 $ 7,179,989 $ 7,228,784 $ 7,502,569 $
Net pension liability (asset) as a percentage of covered payroll 3.27% 15.71% 19.57% -7.15% -6.24% 4.59% 25.83% -52.01%
Schedules are intended to show information for 10 years. Additional years will be included as they become available.
Per GAAP, Net Pension Liability is reported using the measurement date, which is one year prior to the reporting date.
EXHIBIT 13
2014 2015 2016 2017 2018 2019 2020 2021
108
CITY OF SUFFOLK, VIRGINIA
REQUIRED SUPPLEMENTARY INFORMATION
SCHEDULE OF EMPLOYER'S PROPORTIONATE SHARE OF NET PENSION LIABILITY - SCHOOL BOARD TEACHER RETIREMENT PLAN FOR THE YEAR ENDED JUNE 30,
2014 2015 2016 2017 2018 2019 2020 2021
Employer's proportion of the net pension liability
0.93031% 0.91814% 0.94584% 0.95248% 0.95078% 0.98036% 0.94792% 0.95117%
Employer's proportionate share of the net pension liability 112,425,000 $ 115,560,000 $ 132,551,000 $ 117,136,000 $ 111,812,000 $ 129,020,948 $ 137,947,254 $ 73,840,253 $
Employer's covered payroll 89,528,345 68,193,037 71,032,824 73,624,141 76,657,195 81,801,705 82,806,334 83,522,903
Employer's proportionate share of the net pension liability as a percentage of its covered payroll 125.57% 169.46% 186.61% 159.10% 145.86% 157.72% 166.59% 88.41%
Plan fiduciary net position as a percentage of the total pension liability 70.88% 70.68% 68.28% 72.92% 70.88% 73.51% 71.47% 85.46%
Note: The amounts presented have a measurement date of the previous fiscal year.
Schedules are intended to show information for 10 years. Since 2014 is the first year of this presentation, no other data is available. Additional years will be included as they become available.
EXHIBIT 14
109
Date
City Pension Plan:
Contractually Required Contribution
CITY OF SUFFOLK, VIRGINIA
REQUIRED SUPPLEMENTARY INFORMATION SCHEDULE OF CONTRIBUTIONS FOR THE YEAR ENDED JUNE 30,
Contribution in Relation to Contractually Required Contribution
Contribution Deficiency (Excess) Employer's Covered Payroll
Contributions as a % of Covered Payroll
2013 10,018,672 $ 10,197,688 $ (179,016) $ 53,979,914 $ 18.89% 2014 10,385,226 10,526,564 (141,338) 55,954,879 18.81%
2015 8,171,325 8,321,012 (149,687) 63,639,606 13.08%
2016 6,772,022 8,035,838 (1,263,816) 59,144,296 13.59%
2017 7,068,598 7,030,967 37,631 64,085,203 10.97%
2018 7,423,507 7,309,368 114,139 67,302,874 10.86%
2019 7,243,547 7,200,075 43,472 67,256,705 10.71%
2020 7,468,347 7,462,406 5,941 69,343,981 10.76%
2021 8,630,767 8,610,229 20,538 69,212,248 12.44%
2022 8,992,126 8,992,126 - 72,395,220 12.42%
School Board (non-teacher) Pension Plan:
2013 950,684 $ 938,800 $ 11,884 $ 6,839,451 $ 13.73% 2014 936,860 820,701 116,159 6,739,997 12.18% 2015 747,583 747,583 - 6,271,733 11.92% 2016 701,325 701,325 - 7,303,711 9.60% 2017 586,121 586,121 - 6,556,134 8.94% 2018 395,660 395,660 - 6,718,706 5.89% 2019 356,136 356,136 - 7,179,989 4.96% 2020 350,347 350,347 - 7,228,784 4.85% 2021 420,144 420,144 - 7,502,569 5.60% 2022 444,256 444,256 - 8,968,585 4.95%
School Board Teacher Retirement Plan:
2013 - $ 11,648,391 $ (11,648,391) $ 74,383,084 $ 15.66% 2014 - 10,439,005 (10,439,005) 89,528,345 11.66% 2015 11,594,588 11,594,588 - 68,193,037 17.00% 2016 11,533,874 11,533,874 - 71,032,824 16.24% 2017 11,760,656 11,760,656 - 73,624,141 15.97% 2018 12,290,506 12,290,506 - 76,657,195 16.03% 2019 12,543,319 12,543,319 - 81,801,705 15.33% 2020 12,616,285 12,616,285 - 82,806,334 15.24%
2021 13,881,507 13,881,507 - 83,522,903 16.62% 2022 13,650,009 13,650,009 - 84,666,483 16.12%
EXHIBIT 15
110
CITY OF SUFFOLK, VIRGINIA
NOTES TO REQUIRED SUPPLEMENTARY INFORMATION
June 30, 2022
Notes to the Required Supplementary Information related to Pensions
Changes in Benefit terms
There have been no actuarially material changes to the System benefit provisions since the prior actuarial valuation.
Changes of assumptions
The actuarial assumptions used in the June 30, 2020, valuation were based on the results of an actuarial experience study for the period from July 1, 2016, through June 30, 2020, except the change in the discount rate, which was based on VRS Board action effective as of July 1, 2019. Change to the actuarial assumptions as a result of the experience study and VRS Board action are as allows:
General City and School Board (non-teacher) Employees: Public Safety Employees:
- Updated mortality rates to PUB2010 public sector mortality tables. For future mortality improvements, replace load with a modified Mortality Improvement Scale MP-2020.
- Lowered retirement rates to better fit experience for Plan1; set separate rates based on experience for Plan2/Hybrid; changed final retirement age.
- Adjusted withdrawal rates to better fit experience at each year age and service through 9 years of service.
- Updated mortality rates to PUB2010 public sector mortality tales. Increased disability life expectancy. For future mortality improvements, replace load wit a modified Mortality Improvement Scale MP-2020.
- Adjusted retirement rates to better fit experience and changed final retirement age from 65 to 70.
- Decreased withdrawal rates and changed from rates based on age and service to rates based on service only to better fit experience and to be more consistent with Locals Largest 10 Hazardous Duty.
- No change to disability rates. - No change to disability rates.
- No change to line of duty disability rates. - No change to line of disability rates.
- No change to discount rate of 6.75% - No change to discount rate of 6.75%.
School Board Teacher Retirement Plan Employees:
- Update mortality rates to PUB2010 public sector mortality tables. For future mortality improvements, replace load with a modified Mortality Improvement Scale MP-2020.
- Adjusted Retirement rates to better fit experience for Plan 1; set separate rates based on experience for Plan 2/Hybrid; changed final retirement age from 75 to 80 for all.
- Adjusted withdrawal rates to better fit experience at each year age and service through 9 years of service.
- No change in disability rates.
- No change in discount rate of 6.75%
111
CITY OF SUFFOLK, VIRGINIA
REQUIRED SUPPLEMENTARY INFORMATION
SCHEDULE OF CHANGES IN THE CITY'S NET OPEB LIABILITY (ASSET) AND RELATED RATIOS - PLAN REPORTING CITY OPEB TRUST
FOR THE YEAR ENDED JUNE 30,
Total OPEB Liability
Service cost 886,026 $ 646,056 $ 835,242 $ 936,260 $ 972,561 $ 1,250,647 $
Interest 2,225,368 2,369,007 2,976,786 3,435,345 3,568,007 3,143,180
Difference between expected and actual experience - 5,564,681 576,876 (479,096) (109,112) (21,471,616)
Changes of assumptions or other inputs - 289,822 3,129,118 (863,241) - 5,714,895
Benefit payments, including refunds of employee contributions (1,060,396) (1,454,455) (1,655,212) (1,349,107) (1,242,451) (1,073,690)
Net change in total OPEB liability 2,050,998 7,415,111 5,862,810 1,680,161 3,189,005 (12,436,584)
Total OPEB liability -- beginning 30,201,776 32,252,774 39,667,885 45,530,695 47,210,856 50,399,861
Total OPEB liability -- ending 32,252,774 $ 39,667,885 $ 45,530,695 $ 47,210,856 $ 50,399,861 $ 37,963,277 $
Plan fiduciary net position
Contributions -- employer
3,340,696 $ 2,488,905 $ 1,655,212 $ 1,349,107 $ 1,742,451 $ 1,803,210 $
Net investment income 3,390,546 3,045,950 1,629,195 1,131,826 11,551,219 (4,707,020)
Benefit payments, including refunds of employee contributions (1,060,396) (1,454,455) (1,655,212) (1,349,107) (1,242,451) (1,073,690)
Administrative fees - (31,912) (32,333) (33,677) (36,395) -
Net change in plan fiduciary net position 5,670,846 4,048,488 1,596,862 1,098,149 12,014,825 (3,977,500)
Plan fiduciary net position -- beginning 25,720,279 31,391,125 35,439,613 37,036,475 38,134,624 50,149,449
Plan fiduciary net position -- ending 31,391,125 $ 35,439,613 $ 37,036,475 $ 38,134,624 $ 50,149,449 $ 46,171,949 $
Total net OPEB liability (asset) -- beginning 4,481,497 $ 861,649 $ 4,228,272 $ 8,494,220 $ 9,076,232 $ 250,412 $
Total Net OPEB liability (asset) -- ending 861,649 $ 4,228,272 $ 8,494,220 $ 9,076,232 $ 250,412 $ (8,208,672) $
Plan fiduciary net position as a percentage of total OPEB liability 97.33% 89.34% 81.34% 80.78% 99.50% 121.62%
Covered payroll 58,111,943 $ 67,302,874 $ 61,416,353 $ 69,886,884 $ 69,886,884 $ 75,470,202 $
Net OPEB Liability as a percentage of covered payroll 1.48% 6.28% 13.83% 12.99% 0.36% -10.88%
Schedules are intended to show information for 10 years. Since 2017 is the first year of this presentation, no other data is available. Additional years will be included as they become available.
Per GAAP, Net OPEB Liability is reported using the measurement date, which is one year prior to the reporting date.
EXHIBIT 16
2017 2018 2019 2020 2021 2022
112
CITY OF SUFFOLK, VIRGINIA
REQUIRED SUPPLEMENTARY INFORMATION
SCHEDULE OF CHANGES IN THE SCHOOL BOARD'S NET OPEB LIABILITY (ASSET) AND RELATED RATIOS SCHOOL BOARD OPEB TRUST FOR THE YEAR ENDED DECEMBER 31,
Total OPEB Liability
Service cost 518,107 $ 456,968 $ 458,381 $ 474,424 $ 532,956 $
Interest 1,168,697 1,034,554 1,024,964 1,124,926 869,162
Changes of benefit terms (391,210) - - - -
Difference between expected and actual experience (2,060,226) (651,244) 695,593 (4,196,230) (1,920,563)
Changes of assumptions or other inputs 1,303,406 34,634 - 26,928 79,997
Benefit payments, including refunds of employee contributions (1,323,985) (588,348) (1,435,329) (267,861) (304,691)
Net change in total OPEB liability (785,211) 286,564 743,609 (2,837,813) (743,139)
Total OPEB liability -- beginning 14,411,142 13,625,931 13,912,495 14,656,104 11,818,291
Total OPEB liability -- ending 13,625,931 $ 13,912,495 $ 14,656,104 $ 11,818,291 $ 11,075,152 $
Plan fiduciary net position
Contributions -- employer 1,323,985 $ 588,348 $ 1,435,329 $ 267,861 $ 304,691 $
Net investment income 2,073,264 (699,998) 2,823,320 2,533,238 3,020,825
Benefit payments, including refunds of employee contributions (1,323,985) (588,348) (1,435,329) (267,861) (304,691)
Administrative expenses (14,546) (14,727) (15,166) (15,718) (18,731)
Net change in plan fiduciary net position 2,058,718 (714,725) 2,808,154 2,517,520 3,002,094
Plan fiduciary net position -- beginning 13,406,521 15,465,239 14,750,514 17,558,668 20,076,188
Plan fiduciary net position -- ending 15,465,239 $ 14,750,514 $ 17,558,668 $ 20,076,188 $ 23,078,282 $
Total net OPEB liability (asset) -- beginning 1,004,621 $ (1,839,308) $ (838,019) $ (2,902,564) $ (8,257,897) $
Total Net OPEB asset -- ending (1,839,308) $ (838,019) $ (2,902,564) $ (8,257,897) $ (12,003,130) $
Plan fiduciary net position as a percentage of total OPEB liability 113.50% 106.02% 119.80% 169.87% 208.38%
Covered payroll 79,940,967 $ 80,618,413 $ 81,801,705 $ 90,628,803 $ 94,222,692 $
Net OPEB Asset as a percentage of covered payroll -2.30% -1.04% -3.55% -9.11% -12.74%
Schedules are intended to show information for 10 years. Since 2017 is the first year of this presentation, no other data is available. Additional years will be included as they become available.
Per GAAP, Net OPEB Liability is reported using the measurement date, which is one year prior to the reporting date.
EXHIBIT 17
2017 2018 2019 2020 2021
113
Date
City Plan:
Actuarially Determined Contribution
CITY OF SUFFOLK, VIRGINIA
REQUIRED SUPPLEMENTARY INFORMATION SCHEDULE OF CONTRIBUTIONS -- OPEB PLAN
LOCALLY OWNED OPEB TRUST
FOR THE YEAR ENDED JUNE 30,
Contributions in Relation to Required Contribution
Contribution Deficiency (Excess) Employer's Covered Payroll
Contributions as a % of Covered Payroll
2013 2,999,000 $ 3,250,647 $ (251,647) $ 55,725,400 $ 5.83%
2014 2,999,000 2,621,943 377,057 53,941,000 4.86%
2015 3,077,600 3,503,479 (425,879) 53,941,000 6.50%
2016 3,182,500 3,501,603 (319,103) 58,111,943 6.03%
2017 1,083,859 3,340,696 (2,256,837) 58,111,943 5.75%
2018 734,245 2,488,906 (1,754,661) 67,302,874 3.70%
2019 1,330,615 1,655,212 (324,597) 61,416,353 2.70%
2020 1,330,615 1,349,107 (18,492) 69,886,884 1.93%
2021 1,702,081 1,742,451 (40,370) 69,886,884 2.49%
2022 1,702,081 1,803,210 (101,129) 75,470,202 2.39%
School Board
2013 2,439,200 $ 1,467,100 $ 972,100 $ 58,391,400 $ 2.51%
2014 1,285,500 1,312,268 (26,768) 58,391,400 2.25%
2015 1,339,100 1,631,285 (292,185) 55,537,800 2.94%
2016 112,200 1,578,887 (1,466,687) 55,537,800 2.84%
2017 613,629 1,822,143 (1,208,514) 79,940,967 2.28% 2018 613,629 1,063,180 (449,551) 80,618,413 1.32% 2019 588,348 1,053,194 (464,846) 81,801,705 1.29%
2020 1,435,329 621,810 813,519 84,334,164 0.74%
2021 - 267,861 (267,861) 90,628,803 0.30%
2022 - 304,691 (304,691) 94,222,692 0.32%
CITY OF SUFFOLK, VIRGINIA
REQUIRED SUPPLEMENTARY INFORMATION SCHEDULE OF ANNUAL MONEY WEIGHTED RATE OF RETURN ON OPEB PLAN INVESTMENTS
City OPEB Trust School Board OPEB Trust
2017 13.04% 15.52%
2018 9.52% 9.52%
2019 4.67% 4.67%
2020 4.88% 4.88%
2021 30.05% 30.05%
2022 -9.28% -9.28%
Schedule is intended to show information for 10 years. Since 2017 is the first year of this presentation, no other data is available. Additional years will be included as they become available.
EXHIBIT 18
EXHIBIT 19
FOR THE YEAR ENDED JUNE 30, LOCALLY OWNED OPEB TRUST 114
CITY OF SUFFOLK, VIRGINIA
NOTES TO REQUIRED SUPPLEMENTARY INFORMATION
June 30, 2022
Notes to the Required Supplementary Information related to Other Postemployment Benefit Plans City Trust
Changes in Benefit Terms:
There were no changes in the Plan’s benefit provisions during the measurement period ending on January 1, 2022.
Changes to assumptions or other inputs
The following changes in assumptions were made for the valuation date of January 1, 2022:
- The discount rate was lowered from 7.5% to .75% to be in line with the current VRS assumption.
- The claims assumption was updated to include the most recent plan experience.
- The trend assumption was updated to the most recent table released by the Society of Actuaries.
- The salary scale assumption was updated to match that of the most recent VRS valuation.
- The decrement assumptions were updated to match those used by the most recent VRS valuation.
115
CITY OF SUFFOLK, VIRGINIA
REQUIRED SUPPLEMENTARY INFORMATION
SCHEDULE OF EMPLOYER'S PROPORTIONATE SHARE OF NET OPEB LIABILITY LINE OF DUTY ACT PROGRAM (LODA) FOR THE CITY FOR THE YEAR ENDED JUNE 30,
2017 2018 2019 2020 2021
2.76316% 2.86170% 2.62930% 2.75114% 2.78220%
Employer's proportion of the net LODA OPEB liability
Employer's proportionate share of the net LODA OPEB liability
7,261,000 $ 8,972,000 $ 9,433,565 $ 11,522,199 $ 12,269,269 $
Employer's covered payroll 23,102,737 $ 24,288,204 $ 28,324,247 $ 29,370,754 $ 27,241,531 $
Employer's proportionate share of the net pension liability as a percentage of its covered payroll 31.43% 36.94% 33.31% 39.23% 45.04%
Plan fiduciary net position as a percentage of the total LODA OPEB liability 1.30% 0.60% 0.79% 1.02% 1.30%
Note: The amounts presented have a measurement date of the previous fiscal year.
Schedules are intended to show information for 10 years. Since 2017 is the first year of this presentation, no other data is available. Additional years will be included as they become available.
CITY OF SUFFOLK, VIRGINIA
REQUIRED SUPPLEMENTARY INFORMATION
SCHEDULE OF EMPLOYER'S PROPORTIONATE SHARE OF NET OPEB LIABILITY GROUP LIFE INSURANCE PROGRAM (GLI) FOR THE CITY FOR THE YEAR ENDED JUNE 30,
2017 2018 2019 2020 2021
Employer's proportion of the net GLI OPEB liability 0.34781% 0.34952% 0.34159% 0.33753% 0.33655%
Employer's proportionate share of the net GLI OPEB liability 5,234,000 $ 5,308,000 $ 5,558,578 $ 5,632,832 $ 3,918,355 $
Employer's covered payroll 64,154,851 $ 66,461,255 $ 66,963,814 $ 69,692,322 $ 69,484,722 $
Employer's proportionate share of the net pension liability as a percentage of its covered payroll 8.16% 7.99% 8.30% 8.08% 5.64%
Plan fiduciary net position as a percentage of the total GLI OPEB liability 48.86% 51.22% 52.00% 52.64% 67.45%
Note: The amounts presented have a measurement date of the previous fiscal year.
Schedules are intended to show information for 10 years. Since 2017 is the first year of this presentation, no other data is available. Additional years will be included as they become available.
EXHIBIT 20
EXHIBIT 21
116
CITY OF SUFFOLK, VIRGINIA
REQUIRED SUPPLEMENTARY INFORMATION
SCHEDULE OF EMPLOYER'S PROPORTIONATE SHARE OF NET OPEB LIABILITY GROUP LIFE INSURANCE PROGRAM (GLI) FOR THE SCHOOL BOARD FOR THE YEAR ENDED JUNE 30,
2017 2018 2019 2020 2021
0.40934% 0.44079% 0.45715% 0.43943% 0.44273%
Employer's proportion of the net GLI OPEB liability
Employer's proportionate share of the net GLI OPEB liability 6,704,000 $ 6,695,000 $ 7,439,047 $ 7,333,367 $ 5,154,577 $
Employer's covered payroll 82,175,449 $ 83,814,437 $ 89,616,947 $ 90,437,143 $ 91,407,110 $
Employer's proportionate share of the net OPEB liability as a percentage of its covered payroll 8.16% 7.99% 8.30% 8.11% 5.64%
Plan fiduciary net position as a percentage of the total GLI OPEB liability 48.86% 51.22% 52.00% 52.64% 67.45%
Note: The amounts presented have a measurement date of the previous fiscal year.
Schedules are intended to show information for 10 years. Since 2017 is the first year of this presentation, no other data is available. Additional years will be included as they become available.
CITY OF SUFFOLK, VIRGINIA REQUIRED SUPPLEMENTARY INFORMATION
SCHEDULE OF EMPLOYER'S PROPORTIONATE SHARE OF NET OPEB LIABILITY HEALTH INSURANCE CREDIT PLANS (THIC) FOR THE SCHOOL BOARD -- TEACHERS FOR THE YEAR ENDED JUNE 30,
2017 2018 2019 2020 2021
Employer's proportion of the net HIC OPEB liability 0.95031% 0.94832% 0.97557% 0.94455% 0.94441%
Employer's proportionate share of the net HIC OPEB liability 12,056,000 $ 12,040,000 $ 12,771,160 $ 12,321,811 $ 12,122,156 $
Employer's covered payroll 74,998,650 $ 76,694,389 $ 81,827,304 $ 82,806,334 $ 83,522,903 $
Employer's proportionate share of the net OPEB liability as a percentage of its covered payroll 16.07% 15.70% 15.61% 14.88% 14.51%
Plan fiduciary net position as a percentage of the total HIC OPEB liability 7.04% 8.08% 8.97% 9.95% 13.15%
Note: The amounts presented have a measurement date of the previous fiscal year.
Schedules are intended to show information for 10 years. Since 2017 is the first year of this presentation, no other data is available. Additional years will be included as they become available.
EXHIBIT 22
EXHIBIT 23
117
CITY OF SUFFOLK, VIRGINIA
REQUIRED SUPPLEMENTARY INFORMATION
SCHEDULE OF EMPLOYER'S PROPORTIONATE SHARE OF NET OPEB LIABILITY VIRGINIA LOCAL DISABILITY PROGRAM (VLDP) - SCHOOL BOARD TEACHERS FOR THE YEAR ENDED JUNE 30,
Employer's proportion of the net VLDP OPEB liability 4.31966% 4.37837% 4.50925% 4.10950% 4.07483%
Employer's proportionate share of the net VLDP OPEB liability (asset) 25,000 $ 34,000 $ 34,661 $ 34,104 $ (30,600) $
Employer's covered payroll 11,799,069 $ 15,699,589 $ 20,626,222 $ 23,040,664 $ 25,736,865 $
Employer's proportionate share of the net OPEB liability as a percentage of its covered payroll 0.21% 0.22% 0.17% 0.15% -0.12%
Plan fiduciary net position as a percentage of the total VLDP OPEB liability 31.96% 46.18% 74.12% 78.28% 114.46%
Note: The amounts presented have a measurement date of the previous fiscal year.
Schedules are intended to show information for 10 years. Since 2017 is the first year of this presentation, no other data is available. Additional years will be included as they become available.
EXHIBIT 24
2017 2018 2019 2020 2021
118
Date
CITY OF SUFFOLK, VIRGINIA
REQUIRED SUPPLEMENTARY INFORMATION SCHEDULE OF CONTRIBUTIONS - OPEB CITY STATE VRS PLANS FOR THE YEAR ENDED JUNE 30,
Contractually Required Contribution
Contribution in Relation to Contractually Required Contribution
City Group Life Insurance Program (GLI)
Contribution Deficiency (Excess) Employer's Covered Payroll
Contributions as a % of Covered Payroll
2013 264,481 $ 264,481 $ - $ 55,100,255 $ 0.48%
2014 271,524 271,524 - 56,567,440 0.48% 2015 275,235 275,235 - 57,340,704 0.48%
2016 283,950 283,950 - 59,156,221 0.48%
2017 333,605 333,605 - 64,154,851 0.52%
2018 345,599 345,599 - 66,461,255 0.52%
2019 348,212 348,212 - 66,963,814 0.52%
2020 432,439 432,439 - 69,692,322 0.62% 2021 375,217 375,217 - 69,484,722 0.54%
2022 385,940 385,940 - 72,564,393 0.53%
City Line of Duty Act Program (LODA)
2013 246,435 $ 246,435 $ - $ 21,550,008 $ 1.14% 2014 283,038 283,038 - 21,413,893 1.32%
2015 274,077 274,077 - 21,823,152 1.26% 2016 270,316 270,316 - 21,832,593 1.24%
2017 298,011 298,011 - 23,102,737 1.29%
2018 304,819 304,819 - 24,288,204 1.26%
2019 352,885 352,885 - 28,324,247 1.25%
2020 373,881 373,881 - 29,370,754 1.27% 2021 383,044 383,044 - 27,241,531 1.41% 2022 358,834 358,834 - 31,137,183 1.15%
EXHIBIT 25
119
Date
CITY OF SUFFOLK, VIRGINIA
REQUIRED SUPPLEMENTARY INFORMATION
SCHEDULE OF CONTRIBUTIONS - OPEB SCHOOL BOARD STATE VRS PLANS FOR THE YEAR ENDED JUNE 30,
Contractually Required Contribution
Contribution in Relation to Contractually Required Contribution
School Board Group Life Insurance Program (GLI)
Contribution Deficiency (Excess) Employer's Covered Payroll
Contributions as a % of Covered Payroll
2013 375,924 $ 375,924 $ - $ 78,317,242 $ 0.48%
2014 366,756 366,756 - 76,407,583 0.48% 2015 366,410 366,410 - 76,335,421 0.48% 2016 386,299 386,299 - 80,479,145 0.48%
2017 427,312 427,312 - 82,175,449 0.52%
2018 435,835 435,835 - 83,814,437 0.52%
2019 466,008 466,008 - 89,616,947 0.52%
2020 470,273 470,273 - 90,437,143 0.52% 2021 493,598 493,598 - 91,407,110 0.54% 2022 1,264,187 1,264,187 - 94,334,223 1.34%
School Board Health Insurance Credit Program (THIC) - Teachers
2013 790,230 $ 790,230 $ - $ 71,191,867 $ 1.11% 2014 769,958 769,958 - 69,365,599 1.11% 2015 737,927 737,927 - 69,615,713 1.06%
2016 779,951 779,951 - 73,580,311 1.06%
2017 832,485 832,485 - 74,998,650 1.11%
2018 943,341 943,341 - 76,694,389 1.23% 2019 981,928 981,928 - 81,827,304 1.20%
2020 993,676 993,676 - 82,806,334 1.20% 2021 1,010,627 1,010,627 - 83,522,903 1.21% 2022 1,024,485 1,024,485 - 84,666,483 1.21%
School Board Virginia Local Disability Program (VLDP)
2013 - $ - $ - $ - $ n/a 2014 401 401 - 133,150 0.30% 2015 13,200 13,200 - 4,464,403 0.30% 2016 23,681 23,681 - 7,814,391 0.30% 2017 38,690 38,690 - 11,799,069 0.33%
2018 52,058 52,058 - 15,699,589 0.33%
2019 88,363 88,363 - 20,626,222 0.43%
2020 101,154 101,154 - 23,040,664 0.44% 2021 129,938 129,938 - 25,736,865 0.50% 2022 158,126 158,126 - 30,691,112 0.52%
EXHIBIT 26
120
CITY OF SUFFOLK, VIRGINIA
NOTES TO REQUIRED SUPPLEMENTARY INFORMATION
June 30, 2022
Notes to the Required Supplementary Information related to Other Postemployment Benefit Plans –City and School Board State VRS Plans.
Changes in Benefit Terms:
There have been no actuarially material changes to the benefit provisions since the prior actuarial valuation.
Changes to assumptions or other inputs
The actuarial assumptions used in the June 30, 2020, valuation were based on the results of an actuarial experience study for the period from July 1, 2016, through June 30, 2020. Except for the change in the discount rate for the GLI, VLDP and HIC plans, which was based on VRS Board action effective as of July 1, 2019. Changes to the actuarial assumptions as a result of the experience study and VRS Board action are as follows:
General City and School Board GLI plan employees Public Safety Employees GLI and LODA plans
- Updated mortality rates to PUB2010 public sector mortality tables. For future mortality improvements, replace load with a modified Mortality Improvement Scale MP-2020
- Adjusted retirement rates to better fit experience for Plan 1; set separate rates based on experience for Plan 2/Hybrid; changed final retirement age from 75 to 80 for all.
- Adjusted withdrawal rates to better fit experience at each age and service decrement through 9 year of service.
- No change in disability rates.
- Update to PUB2010 public sector mortality tables. Increased disability life expectancy. For future mortality improvements replace load with a modified Mortality Improvement Scale MP-2020.
- Adjusted retirement rates to better fit experience and changed final retirement age from 65 to 70.
- Decreased withdrawal rates and changed from rates based on age and service to rates based on service only to better fit experience and to be more consistent with locals Top 10 Hazardous duty.
- No change in disability rates.
- No change in salary scale. - No change in salary scale.
- No change in discount rate.
School Board Teacher GLI, HIC and VLDP:
- No change in line of duty disability rates.
- Updated mortality rates to PUB2010 public sector mortality tables. For future mortality improvements, replace load with a modified Mortality Improvement Scale MP-2020
- Adjusted retirement rates to better fit experience for Plan 1; set separate rates based on experience for Plan 2/Hybrid; changed final retirement ages from 75 to 80 for all.
- Adjusted rates to better fit experience at each age and service decrement through 9 years of service.
- No change in disability rates
- No change in Discount rate
121
CITY OF SUFFOLK, VIRGINIA
REQUIRED SUPPLEMENTARY INFORMATION
SCHEDULE OF CHANGES IN THE SCHOOL BOARD'S NET OPEB LIABILITY AND RELATED RATIOS SCHOOL BOARD NON-TEACHER HIC SINGLE EMPLOYER PLAN FOR THE YEAR ENDED JUNE 30,
2020 2021
Total OPEB Liability
Service cost - $ 10,909 $
Interest - 42,022
Changes of benefit terms 622,573Changes of assumptions or other inputs - 17,815 Benefit payments, including refunds of employee contributions - (35)
Net change in total OPEB liability 622,573 70,711
Total OPEB liability -- beginning - 622,573 Total OPEB liability -- ending 622,573 $ 693,284 $
Plan fiduciary net position
Contributions -- employer - $ 52,520 $
Net investment income - 6,756
Benefit payments, including refunds of employee contributions - (35) Administrative expenses - (232)
Net change in plan fiduciary net position - $ 59,009 $
Plan fiduciary net position -- beginning -Plan fiduciary net position -- ending - $ 59,009 $
Total net OPEB liability -- beginning - $ 622,573 $ Total Net OPEB liability -- ending 622,573 $ 634,275 $
Plan fiduciary net position as a percentage of total OPEB liability 0.00% 8.51%
Covered payroll 7,502,569 $ 7,502,569 $
Net OPEB Liability as a percentage of covered payroll 8.30% 8.45%
Schedules are intended to show information for 10 years. Since 2020 is the first year of this presentation, no other data is available. Additional years will be included as they become available.
Per GAAP, Net OPEB Liability is reported using the measurement date, which is one year prior to the reporting date.
EXHIBIT 27
122
CITY OF SUFFOLK, VIRGINIA
REQUIRED SUPPLEMENTARY INFORMATION
SCHEDULE OF CONTRIBUTIONS -- SCHOOL BOARD NON-TEACHER HEALTH INSURANCE CREDIT OPEB PLAN SCHOOL BOARD NON-TEACHER HIC FOR THE YEAR ENDED JUNE 30,
Date
Actuarially Determined Contribution
Contributions in Relation to Required Contribution
Contribution Deficiency (Excess) Employer's Covered Payroll
Contributions as a % of Covered Payroll
2021 52,518 $ 52,518 $ - $ 7,502,569 $ 0.70% 2022 62,748 62,748 - 8,968,585 0.70%
Schedules are intended to show information for 10 years. Since 2021 is the first year of this presentation, no other data is available. Additional years will be included as they become available.
EXHIBIT 28
123
CITY OF SUFFOLK, VIRGINIA
NOTES TO REQUIRED SUPPLEMENTARY INFORMATION
June 30, 2022
Notes to the Required Supplementary Information related to Other Postemployment Benefit Plans –School Board Non-Teacher Health Insurance Credit Single Employer State VRS Plan.
Changes in Benefit Terms:
There have been no actuarially material changes to the benefit provisions since the prior actuarial valuation.
Changes to assumptions or other inputs
The actuarial assumptions used in the June 30, 2020, valuation were based on the results of an actuarial experience study for the period from July 1, 2016, through June 30, 2020, except for the change in the discount rate, which was based on VRS Board action effective as of July 1, 2019. Changes to the actuarial assumptions as a result of the experience study and VRS Board action are as follows:
Mortality Rates (pre-retirement, postretirement, healthy and disabled):
Update to PUB2010 public sector mortality tables. For future mortality improvements, replace load with a modified Mortality Improvement Scale MP-2020
Retirement Rates: Adjusted rates to better fit experience for Plan 1; set separate rates based on experience for Plan 2/Hybrid; changed final retirement age from 75 to 80 for all.
Withdrawal Rates: Adjusted rates to better fit experience at each age and service decrement through 9 year of service.
Disability rates: No change. Salary Scale: No change.
Line of Duty Disability: No change.
Discount Rate: No change.
124
OTHER SUPPLEMENTARY INFORMATION
OTHER SUPPLEMENTARY INFORMATION: NON-MAJOR GOVERNMENTAL FUNDS
Special Revenue Funds are used to account for specific revenues that are legally restricted to expenditures for particular purposes.
Suffolk Taxing District Fund – accounts for revenues and expenditures related to services provided in the Suffolk Taxing District. Most revenues are derived from a specific percentage of the annual real estate tax assessments in the Suffolk Taxing District. These additional assessments ceased as of July 1, 2007.
Downtown Business Overlay District Fund – accounts for revenues and expenditures related to services provided in the Downtown Business Overlay District. Most revenues are derived from a specific percentage of the annual real estate tax assessments in the Downtown Business Overlay District.
Law Library Fund – accounts for the maintenance of a law library. Revenue is derived from court fees.
Route 17 Taxing District Fund – accounts for revenues and expenditures related to services provided in the Route 17 Taxing District. Most revenues are derived from a specific percentage of the annual real estate tax assessments in the route 17 Taxing District.
Cemetery Fund – accounts for monies received from the sale of burial sites, lots, and mausoleum sites, the revenue from which is to be applied to the perpetual care of the City’s cemeteries.
Aviation Fund – accounts for revenues generated through use of airport facilities and governmental grant programs to be used solely for expansion, maintenance, and use of city municipal airport.
Transit Fund accounts for revenues and expenditures associated with the City’s bus services. The revenue comes from a combination of state grants and fares collected from the passengers.
CITY OF SUFFOLK, VIRGINIA
COMBINING BALANCE SHEET NON-MAJOR GOVERNMENTAL FUNDS June 30, 2022
ASSETS
Assets:
Cash and cash equivalents - $ 299,380 $ 198,368 $ 6,724,265 $ - $ 2,119,752 $ 568,418 $ 9,910,183 $
Cash and cash equivalents, restricted - - - - 937,254 - - 937,254 Receivables, net: Taxes - 510 - 11,007 - - - 11,517 Accounts - - 1,796 - - 637 128,555 130,988
Due from other governmental units - - - - - 579,601 1,140 580,741 Leases receivable - - - - - - 889,559 889,559 Inventory - - - - - - 164,694 164,694
Total assets - $ 299,890 $ 200,164 $ 6,735,272 $ 937,254 $ 2,699,990 $ 1,752,366 $ 12,624,936 $
LIABILITIES
Liabilities:
Accounts payable and accrued liabilities 10,819 $ - $ 56 $ - $ - $ 122,971 $ 73,285 $ 207,131 $ Accrued payroll and related liabilities - - - - - 5,067 4,851 9,918 Unavailable revenues - - - - - - - -
Total liabilities 10,819 - 56 - - 128,038 78,136 217,049
DEFERRED INFLOWS OF RESOURCES
Unavailable revenues - taxes - 176 - 37 - - - 213 Deposits - - - - - - 18,587 18,587 Deferred inflows related to leases - - - - - - 883,319 883,319
Total deferred inflows - 176 - 37 - - 901,906 902,119
FUND BALANCES
Nonspendable - - - - - - 164,694 164,694 Restricted - - 200,108 - 937,254 2,571,952 - 3,709,314 Committed 299,714 - 6,735,235 - - 607,630 7,642,579 Unassigned (10,819) - - - - - - (10,819)
Total fund balances (10,819) 299,714 200,108 6,735,235 937,254 2,571,952 772,324 11,505,768
Total liabilities, deferred inflows of resources, and fund balances - $ 299,890 $ 200,164 $ 6,735,272 $ 937,254 $ 2,699,990 $ 1,752,366 $ 12,624,936 $
EXHIBIT 29
Downtown Total Suffolk Business Route 17 Non-Major Taxing Overlay Law Taxing Governmental District District Library District Cemetery Transit Aviation Funds
125
CITY OF SUFFOLK, VIRGINIA
COMBINING STATEMENT OF REVENUES, EXPENDITURES, AND CHANGES IN FUND BALANCE NON-MAJOR GOVERNMENTAL FUNDS
Year Ended June 30, 2022
Downtown Total Suffolk Business Route 17 Non-Major Taxing Overlay Law Taxing Governmental District District Library District Cemetery Transit Aviation Funds
Real estate taxes - $ 186,738 $ - $ 2,042,667 $ - $ - $ - $ 2,229,405 $ Revenue from use of money and property - 49 532 8,765 1,392 5,678 277,524 293,940 Charges for services - - 25,541 - - 64,817 695,897 786,255 Miscellaneous - - - - 42,135 9,986 - 52,121
Intergovernmental:Revenue from the Commonwealth - - - - - 523,027 3,420 526,447 Revenue from the Federal government - - - - - 1,688,754 - 1,688,754 Total revenues - 186,787 26,073 2,051,432 43,527 2,292,262 976,841 5,576,922
EXPENDITURES
Current: General government administration - - - - - - 884,351 884,351 Judicial administration - - 35,800 - - - - 35,800 Public safety - - - - - - -Public works - 159,314 - - - - - 159,314 Health and welfare - - - - - - -Transportation - - - - - 2,045,390 - 2,045,390 Parks, recreation, and cultural - - - - 114,854 - - 114,854
Community development - - - - - - -Total expenditures - 159,314 35,800 - 114,854 2,045,390 884,351 3,239,709
Excess (deficiency) of revenues over (under) expenditures - 27,473 (9,727) 2,051,432 (71,327) 246,872 92,490 2,337,213
Other financing sources (uses):
Transfers in - - - - - 1,008,200 112,815 1,121,015
Transfers out - - - (398,460) - (840,033) (98,544) (1,337,037)
Total other financing sources (uses), net - - - (398,460) - 168,167 14,271 (216,022)
Net changes in fund balances - 27,473 (9,727) 1,652,972 (71,327) 415,039 106,761 2,121,191
Fund balances at July 1 (10,819) 272,241 209,835 5,082,263 1,008,581 2,156,913 665,563 9,384,577
Fund balances at June 30 (10,819) $ 299,714 $ 200,108 $ 6,735,235 $ 937,254 $ 2,571,952 $ 772,324 $ 11,505,768 $
EXHIBIT 30
REVENUES 126
REVENUES
CITY OF SUFFOLK, VIRGINIA
STATEMENT OF REVENUES, EXPENDITURES, AND CHANGES IN FUND BALANCES –BUDGET AND ACTUAL - BUDGETARY BASIS DEBT SERVICE FUND
Year Ended June 30, 2022
Budgeted Amounts
Actual Variance with Original Final Amounts Final Budget
Revenue from use of money and property - $ - $ 300,581 $ 300,581 $ Total revenues - - 300,581 300,581
EXPENDITURES
Current: Principal 19,053,142 19,074,488 19,074,488Bond issuance costs - 506,361 506,360 1 Interest and other fiscal charges 10,343,518 9,815,811 8,801,914 1,013,897
Total expenditures 29,396,660 29,396,660 28,382,762 1,013,898
Deficiency of revenues under expenditures (29,396,660) (29,396,660) (28,082,181) 1,314,479
Refunding bonds issued
Premium on bonds issued
OTHER FINANCING SOURCES (USES) - - 18,258,122 18,258,122 - - -- - (17,754,699) (17,754,699)
Payment to escrow agent
Transfers in 29,396,660 29,396,660 27,578,758 (1,817,902)
Total other financing sources, net 29,396,660 29,396,660 28,082,181 (1,314,479)
Net change in fund balances - $ - $ - $ - $
EXHIBIT 31
127
REVENUES
CITY OF SUFFOLK, VIRGINIA
STATEMENT OF REVENUES, EXPENDITURES, AND CHANGES IN FUND BALANCES - BUDGET AND ACTUAL - BUDGETARY BASIS SPECIAL REVENUE FUNDS
For the Year Ended June 30, 2022
Downtown Business Overlay District
Actual Variance with Actual Variance with Original Final Amounts Final Budget Original Final Amounts Final Budget
Budgeted Amounts Budgeted Amounts
Real estate taxes - $ - $ - $ - $ 174,091 $ 174,091 $ 186,738 $ 12,647 $ Revenue from use of money and property - - 532 532 - - 49 49 Charges for services 35,000 35,000 25,541 (9,459) - - -Miscellaneous - - - - - - -Fund balance (rollover/appropriations) 13,847 1,387 - (1,387) - - - -
Total revenues 48,847 36,387 26,073 (10,314) 174,091 174,091 186,787 12,696
EXPENDITURES
Current: Judicial administration 48,847 48,847 35,800 13,047 - - -Public works - - - - 174,091 174,091 159,314 14,777 Total expenditures 48,847 48,847 35,800 13,047 174,091 174,091 159,314 14,777 Excess (deficiency) of revenues over (under) expenditures - (12,460) (9,727) 2,733 - - 27,473 27,473
OTHER FINANCING SOURCES (USES)
Transfers in - - - - - - - -
Net change in fund balances - $ (12,460) $ (9,727) $ 2,733 $ - $ - $ 27,473 $ 27,473 $
Reconciliation to Governmental Fund Statement:
Total net change in fund balance (9,727) $ 27,473 $ Encumbrances -(9,727) $ 27,473 $
Total net change in fund balance per Statement of Revenues, Expenditures and Changes in Fund Balance (Exhibit 30)
(continued)
EXHIBIT 32
Law Library
128
CITY OF SUFFOLK, VIRGINIA
STATEMENT OF REVENUES, EXPENDITURES, AND CHANGES IN FUND BALANCES - BUDGET AND ACTUAL - BUDGETARY BASIS SPECIAL REVENUE FUNDS
For the Year Ended June 30, 2022
Route 17 Taxing District Aviation
REVENUES
Real estate taxes
Actual Variance with Actual Variance with Original Final Amounts Final Budget Original Final Amounts Final Budget
Budgeted Amounts Budgeted Amounts
1,989,160 $ 1,989,160 $ 2,042,667 $ 53,507 $ - $ - $ Revenue from use of money and property - - 8,765 8,765 273,480 273,480 277,524 4,044 Charges for services - - - - 695,000 695,000 695,897 897
Intergovernmental: Revenue from the Commonwealth - - - - - 9,027 3,420 (5,607) Fund balance (rollover/appropriations) - - - - - 245,438 - (245,438) Total revenues 1,989,160 1,989,160 2,051,432 62,272 968,480 1,222,945 976,841 (246,104)
EXPENDITURES
Current: General government administration 1,590,700 1,590,700 - 1,590,700 988,868 1,237,216 909,319 327,897 Total expenditures 1,590,700 1,590,700 - - 988,868 1,237,216 909,319 327,897
Excess (deficiency) of revenues over (under) expenditures 398,460 398,460 2,051,432 1,652,972 (20,388) (14,271) 67,522 81,793
OTHER FINANCING SOURCES (USES)
Transfers in - - - - 109,717 112,815 112,815Transfers out (398,460) (398,460) (398,460) - (89,329) (98,544) (98,544) -
Total other financing sources (uses), net (398,460) (398,460) (398,460) - 20,388 14,271 14,271 -
Net change in fund balances - $ - $ 1,652,972 $ 1,652,972 $ - $ - $ 81,793 $ 81,793 $
Reconciliation to Governmental Fund Statement:
Total net change in fund balance 1,652,972 $ 81,793 $ Encumbrances - 24,968 1,652,972 $ 106,761 $
Total net change in fund balance per Statement of Revenues, Expenditures and Changes in Fund Balance (Exhibit 30)
(continued)
EXHIBIT 32
129
REVENUES
CITY OF SUFFOLK, VIRGINIA
STATEMENT OF REVENUES, EXPENDITURES, AND CHANGES IN FUND BALANCESBUDGET AND ACTUAL - BUDGETARY BASIS SPECIAL REVENUE FUNDS
For the Year Ended June 30, 2022
Transit
Actual Variance with Original Final Amounts Final Budget
Budgeted Amounts
Revenue from use of money and property - $ - $ 5,678 $ 5,678 $ Charges for services 43,000 43,000 64,817 21,817 4,500 4,500 9,986 5,486
Miscellaneous
Intergovernmental: Revenue from the commonwealth 373,414 1,004,425 523,027 (481,398) Revenue from the federal government 836,117 4,899,936 1,688,754 (3,211,182) Grants to be anticipated 76,060 - (76,060) Fund balance (rollover/appropriations) 167,720 233,557 - (233,557) Total revenues 1,424,751 6,261,478 2,292,262 (3,969,216)
EXPENDITURES
Current: Transportation 2,191,127 6,429,645 2,064,644 4,365,001 Total expenditures 2,191,127 6,429,645 2,064,644 4,365,001
Deficiency of revenues under expenditures (766,376) (168,167) 227,618 395,785
OTHER FINANCING SOURCES (USES)
Transfers in 1,006,409 1,008,200 1,008,200Transfers out (240,033) (840,033) (840,033)Total other financing sources, net 766,376 168,167 168,167 -
Net change in fund balances - $ - $ 395,785 $ 395,785 $
Reconciliation to Governmental Fund Statement:
Total net change in fund balance 395,785 $ Encumbrances 19,254 415,039 $
Total net change in fund balance per Statement of Revenues, Expenditures and Changes in Fund Balance (Exhibit 30)
EXHIBIT 32
130
OTHER SUPPLEMENTARY INFORMATION: NON-MAJOR PROPRIETARY FUNDS
Enterprise Funds are used to account for:
Stormwater Utility Fund accounts for the maintenance and improvements to the City’s stormwater infrastructure. All activities necessary to provide such services are funded by charges to citizens and are accounted for in this fund.
Refuse Fund accounts for the provision of refuse and waste management services. All activities necessary to provide such services are accounted for in this fund, including, but not limited to, administration, operation, billing, and collections.
ASSETS
Current assets:
CITY OF SUFFOLK, VIRGINIA
COMBINING STATEMENT OF NET POSITION NON-MAJOR PROPRIETARY FUNDS
June 30, 2022
Business-type Activities - Enterprise Funds
Stormwater Utility Refuse Total
Cash and cash equivalents 10,188,371 $ 5,326,781 $ 15,515,152 $
Cash and cash equivalents, restricted 379,623 - 379,623 Receivables, net 208,268 576,544 784,812
Total current assets 10,776,262 5,903,325 16,679,587
Noncurrent assets:
Land and construction in progress 2,447,121 - 2,447,121
Capital assets, net 174,123 - 174,123
Right to use leased assets, net of amortization 21,040 4,209 25,249
Total noncurrent assets 2,642,284 4,209 2,646,493 Total assets 13,418,546 5,907,534 19,326,080
DEFERRED OUTFLOWS OF RESOURCES
Deferred outflows related to pension plan
Deferred outflows related to OPEB City trust
Deferred outflows related to OPEB state plans
799,120 434,113 1,233,233 239,031 199,194 438,225 41,527 22,803 64,330
Total deferred outflows of resources 1,079,678 656,110 1,735,788
LIABILITIES
Current liabilities:
Accounts payable and accrued liabilities 339,684 288,093 627,777
Accrued payroll and related liabilities 113,510 66,344 179,854
Accrued interest payable 5,568 3,333 8,901
Compensated absences 150,028 75,014 225,042
Bonds and leases payable 24,928 172,391 197,319
Total current liabilities 633,718 605,175 1,238,893
Noncurrent liabilities:
Compensated absences 65,776 42,009 107,785
Net pension liability 721,114 406,806 1,127,920
Net OPEB liability City trust 8,347 6,956 15,303
Net OPEB liability state plans 143,307 80,210 223,517
Bonds and leases payable 383,671 2,643 386,314
Total noncurrent liabilities 1,322,215 538,624 1,860,839
Total liabilities 1,955,933 1,143,799 3,099,732
DEFERRED INFLOWS OF RESOURCES
Deferred inflows related to pension plan
Deferred inflows related to OPEB City trust
Deferred inflows related to OPEB state plans
1,392,239 785,411 2,177,650 225,716 188,097 413,813 59,294 33,187 92,481
Total deferred inflows of resources 1,677,249 1,006,695 2,683,944
NET POSITION
Net investment in capital assets 2,606,259 - 2,606,259 Unrestricted 8,258,783 4,413,150 12,671,933
Total net position 10,865,042 $ 4,413,150 $ 15,278,192 $
EXHIBIT 33
131
CITY OF SUFFOLK, VIRGINIA
COMBINING STATEMENT OF REVENUES, EXPENSES, AND CHANGES IN NET POSITION NON-MAJOR PROPRIETARY FUNDS
Year Ended June 30, 2022
Business-type Activities - Enterprise Funds
Stormwater Utility Refuse Total
OPERATING REVENUES
Charges for services 8,868,561 $ 10,168,181 $ 19,036,742 $ Other 173,127 595,896 769,023
Total operating revenues 9,041,688 10,764,077 19,805,765
OPERATING EXPENSES
Personnel services 3,327,591 1,681,259 5,008,850
Contractual services 678,877 5,067,993 5,746,870 Administration 683,039 2,433,005 3,116,044 Supplies 98,943 145,356 244,299
Repairs and maintenance 3,279 8,201 11,480 Utilities 45,381 23,437 68,818 Depreciation and amortization 107,116 1,578 108,694
Building and equipment rental 89,628 - 89,628 Other charges 42,383 56,669 99,052
Total operating expenses 5,076,237 9,417,498 14,493,735 Operating income 3,965,451 1,346,579 5,312,030
NONOPERATING REVENUES (EXPENSES)
Interest income 25,905 10,246 36,151 Interest expense (11,695) (1,584) (13,279)
Net nonoperating revenues, net 14,210 8,662 22,872
Income before transfers 3,979,661 1,355,241 5,334,902
Transfers in 331,654 36,227 367,881 Transfers out (474,609) (302,897) (777,506)
Change in net position 3,836,706 1,088,571 4,925,277
Net position at July 1, as restated 7,028,336 3,324,579 10,352,915 Net position at June 30 10,865,042 $ 4,413,150 $ 15,278,192 $
EXHIBIT 34
132
OPERATING ACTIVITIES
CITY OF SUFFOLK, VIRGINIA
COMBINING STATEMENT OF CASH FLOWS NON-MAJOR PROPRIETARY FUNDS
Year Ended June 30, 2022
Business-type Activities - Enterprise Funds
Stormwater Utility Refuse Total
Receipts from customers 8,991,194 $ 10,659,938 $ 19,651,132 $
Payments to employees (3,345,568) (1,776,330) (5,121,898) Payments to suppliers (1,429,164) (7,739,337) (9,168,501)
Net cash provided by operating activities 4,216,462 1,144,271 5,360,733
NONCAPITAL FINANCING ACTIVITIES
Transfers from other funds 1,281,953 36,227 1,318,180
Transfers to other funds (1,424,909) (302,897) (1,727,806)
Net cash used in noncapital financing activities (142,956) (266,670) (409,626)
CAPITAL AND RELATED FINANCING ACTIVITIES
Acquisition of capital assets (2,551,017) - (2,551,017)
Bond issuance costs - - -
Principal paid on capital debt (17,882) (151,568) (169,450)
Interest paid on capital debt (13,990) (15,524) (29,514)
Net cash used in capital and related financing activities (2,582,889) (167,092) (2,749,981)
INVESTING ACTIVITIES
Interest received 25,905 10,246 36,151
Net cash provided by investing activities 25,905 10,246 36,151 Net increase in cash and cash equivalents 1,516,522 720,755 2,237,277
CASH AND CASH EQUIVALENTS
Beginning, July 1 9,051,472 4,606,026 13,657,498
Ending, June 30 10,567,994 $ 5,326,781 $ 15,894,775 $
RECONCILIATION OF OPERATING INCOME TO NET CASH PROVIDED BY OPERATING ACTIVITIES
Operating income 3,965,451 $ 1,346,579 $ 5,312,030 $
Adjustments to reconcile operating income to net cash provided by operating activities:
Depreciation 107,116 1,578 108,694 Decrease in allowance for uncollectible accounts (54,995) (85,336) (140,331)
Changes in assets and liabilities: (Increase) decrease in:
Receivables 4,502 (18,803) (14,301)
Increase (Decrease) in: Accounts payable and accrued liabilities 212,365 (4,676) 207,689 Accrued payroll and related liabilities (17,977) (95,071) (113,048) Net cash provided by operating activities 4,216,462 $ 1,144,271 $ 5,360,733 $
EXHIBIT 35
133
OTHER SUPPLEMENTARY INFORMATION: INTERNAL SERVICE FUNDS
Internal Service Funds are used to account for:
Information Technology Fund – account for technology infrastructure and allocates costs to the various departments or agencies using the service.
Fleet Management Fund – accounts for, on a cost-reimbursement basis, the financing of vehicles and the related maintenance, repairs, and fuel costs and allocates those costs to the various departments or agencies using the equipment.
Risk Management Fund accounts for the funding and payment of auto, personal liability, general liability, health insurance, and workers’ compensation claims against the City exclusive of the School Board employees. Charges to other funds are based on estimated claims for the year.
CITY OF SUFFOLK, VIRGINIA COMBINING STATEMENT OF NET POSITION INTERNAL SERVICE FUNDS June 30, 2022
Information Fleet Risk Technology Management Management Total
ASSETS
Current assets:
Cash and cash equivalents 2,951,132 $ 17,148,495 $ 14,381,523 $ 34,481,150 $
Cash and cash equivalents, restricted 1,594,908 3,818 - 1,598,726
Receivables other, net 61,000 156,262 - 217,262
Inventories - 439,893 - 439,893
Total current assets 4,607,040 17,748,468 14,381,523 36,737,031
Noncurrent assets:
Land and construction in progress 885,777 298,000 - 1,183,777
Other capital assets, net 2,986,762 12,024,832 459,989 15,471,583
Right to use leased assets, net of amortization 299,243 113,541 - 412,784
Total noncurrent assets 4,171,782 12,436,373 459,989 17,068,144
Total assets 8,778,822 30,184,841 14,841,512 53,805,175
DEFERRED OUFLOWS OF RESOURCES
Deferred outflows related to pension plan
Deferred outflows related to OPEB City trust
Deferred outflows related to OPEB state plans
479,838 329,066 116,532 925,436 144,416 104,577 39,839 288,832 25,069 17,343 5,992 48,404
Total deferred outflows of resources 649,323 450,986 162,363 1,262,672
LIABILITIES
Current liabilities:
Accounts payable and accrued liabilities 688,096 383,441 47,046 1,118,583
Accrued payroll and related liabilities 71,266 48,479 58,710 178,455
Claims payable - - 2,384,806 2,384,806
Accrued interest 103,646 10,521 - 114,167
Compensated absences 10,111 2,492 158 12,761
Bonds and leases payable -- current 1,157,668 578,664 - 1,736,332
Total current liabilities 2,030,787 1,023,597 2,490,720 5,545,104
Noncurrent liabilities:
Compensated absences 136,439 116,367 48,119 300,925
Net pension liability 459,691 295,046 90,487 845,224
Net OPEB liability City trust 5,043 3,652 1,391 10,086
Net OPEB liability state plans 90,429 59,338 18,958 168,725
Claims payable - - 1,650,939 1,650,939
Bonds and Leases payable 4,823,694 84,451 - 4,908,145
Total noncurrent liabilities 5,515,296 558,854 1,809,894 7,884,044
Total liabilities 7,546,083 1,582,451 4,300,614 13,429,148
DEFERRED INFLOWS OF RESOURCES
Deferred inflows related to pension plan
Deferred inflows related to OPEB City trust
Deferred inflows related to OPEB state plans
887,514 569,639 174,702 1,631,855 136,371 98,751 37,618 272,740 37,415 24,554 7,844 69,813
Total deferred inflows of resources 1,061,300 692,944 220,164 1,974,408
NET POSITION
Net investment in capital assets - 11,773,258 459,989 12,233,247
Unrestricted 820,762 16,587,174 10,023,108 27,431,044
Total net position 820,762 $ 28,360,432 $ 10,483,097 $ 39,664,291 $
EXHIBIT 36
134
CITY OF SUFFOLK, VIRGINIA
COMBINING STATEMENT OF REVENUES, EXPENSES, AND CHANGES IN NET POSITION INTERNAL SERVICE FUNDS
Year Ended June 30, 2022
Information Fleet Risk Technology Management Management Total
OPERATING REVENUES
Charges for services 12,244,557 $ 10,923,147 $ 15,107,992 $ 38,275,696 $ Other 775 153,032 624,935 778,742
Total operating revenues 12,245,332 11,076,179 15,732,927 39,054,438
OPERATING EXPENSES
Personnel services 1,743,699 1,345,574 587,063 3,676,336
Self-insured claims - - 13,330,401 13,330,401
Contractual services 7,054,565 3,828 78,183 7,136,576
Administration 225,232 699,012 50,547 974,791
Supplies 10,826 37,062 1,490 49,378 Repairs and maintenance 180,401 53,168 - 233,569
Vehicle and power equipment – fuel - 2,090,413 - 2,090,413
Vehicle and power equipment – supplies - 2,522,867 - 2,522,867
Computers and Equipment 678,810 - - 678,810
Utilities 178,857 32,661 12,011 223,529
Insurance - - 3,079,870 3,079,870
Depreciation and amortization 721,716 2,252,595 104,805 3,079,116
Building and equipment rental 71,389 15,177 34,150 120,716
Other charges 20,063 18,033 651,002 689,098
Total operating expenses 10,885,558 9,070,390 17,929,522 37,885,470 Operating loss 1,359,774 2,005,789 (2,196,595) 1,168,968
NONOPERATING REVENUES (EXPENSES)
Interest income 4,709 43,585 38,868 87,162
Interest expense (129,850) (63,343) - (193,193)
Loss on disposal of capital assets - (484,909) - (484,909)
Bond issuance costs - 106,070 - 106,070
Total nonoperating revenues (expenses), net (125,141) (398,597) 38,868 (484,870)
Net income (loss) before transfers 1,234,633 1,607,192 (2,157,727) 684,098
Transfers in 291,704 28,792 12,433 332,929
Capital Transfers - 389,000 - 389,000
Transfers out (290,789) (280,676) (68,350) (639,815)
Change in net position 1,235,548 1,744,308 (2,213,644) 766,212
Net position at July 1 (as restated) (414,786) 26,616,124 12,696,741 38,898,079
Net position at June 30 820,762 $ 28,360,432 $ 10,483,097 $ 39,664,291 $
EXHIBIT 37
135
CITY OF SUFFOLK, VIRGINIA COMBINING STATEMENT OF CASH FLOWS INTERNAL SERVICE FUNDS
Year Ended June 30, 2022
Information Fleet Risk Technology Management Management Total
OPERATING ACTIVITIES
Receipts from customers and users
12,292,333 $ 11,007,873 $ 15,734,928 $ 39,035,134 $ Payments to employees (1,885,293) (1,400,743) (662,999) (3,949,035) Payments to suppliers (8,067,400) (5,485,827) (17,658,628) (31,211,855)
Net cash provided by (used in) operating activities 2,339,640 4,121,303 (2,586,699) 3,874,244
NONCAPITAL FINANCING ACTIVITIES
Transfers from other funds 291,704 28,792 12,433 332,929
Transfers to other funds (290,789) (280,676) (68,350) (639,815)
Net cash provided by (used in) noncapital financing activities 915 (251,884) (55,917) (306,886)
CAPITAL AND RELATED FINANCING ACTIVITIES
Acquisition of capital assets (1,028,790) (695,547) (152,099) (1,876,436)
Proceeds from issuance of debt 215,000 - - 215,000
Proceeds from premium on debt issuance 38,857 - - 38,857
Principal paid on capital debt (941,468) (1,308,891) - (2,250,359)
Bond issuance costs (150,269) - - (150,269)
Interest paid on debt (144,225) (90,010) - (234,235)
Net cash used in capital and related financing activities (2,010,895) (2,094,448) (152,099) (4,257,442)
INVESTING ACTIVITIES
Interest earned 4,709 43,585 38,868 87,162 Net cash provided by investing activities 4,709 43,585 38,868 87,162
Net increase (decrease) in cash and cash equivalents 334,369 1,818,556 (2,755,847) (602,922)
Beginning, July 1 4,211,671 15,333,757 17,137,370 36,682,798 Ending, June 30 4,546,040 $ 17,152,313 $ 14,381,523 $ 36,079,876 $
Reconciliation of operating income (loss) to net cash provided by (used in) operating activities: Operating income (loss) 1,359,774 $ 2,005,789 $ (2,196,595) $ 1,168,968 $
Adjustments to reconcile operating income (loss) to net cash provided by (used in) operating activities: Depreciation and amortization 721,716 2,252,595 104,805 3,079,116
Changes in assets and liabilities: (Increase) decrease in:
Receivables 47,000 (68,306) 2,000 (19,306) Inventories - (162,196) - (162,196)
Increase (decrease) in:
Accounts payable and accrued liabilities 352,744 148,590 (129,999) 371,335 Accrued payroll and related liabilities (141,594) (55,169) (75,936) (272,699) Claims payable - (290,974) (290,974)
Net cash provided by (used in) operating activities 2,339,640 $ 4,121,303 $ (2,586,699) $ 3,874,244 $
EXHIBIT 38
136
OTHER SUPPLEMENTARY INFORMATION: CUSTODIAL FUNDS
Custodial Funds are used to account for assets held by the City as an agent for private organizations or other governments. Funds in this category include:
Special Welfare Fund – accounts for receipt of welfare checks and foster children support checks from the state and payments made on behalf of individuals.
Commonwealth of Virginia Fund – accounts for monies collected by the City on behalf of the Commonwealth of Virginia.
Western Tidewater Water Authority -- accounts for monies held by the City as an agent for this public or independent organization.
CITY OF SUFFOLK, VIRGINIA
COMBINING STATEMENT OF FIDUCIARY NET POSITION -CUSTODIAL FUNDS June 30, 2022
Special Welfare Fund Commonwealth of Virginia Fund Total
ASSETS
Cash and cash equivalents 33,527 $ 107,287 $ 140,814 $ Accounts receivable - 3,296 3,296 Total assets 33,527 $ 110,583 $ 144,110 $
LIABILITIES
Accounts payable 2,275 $ 21,973 $ 24,248 $ Amounts held for others 30,764 - 30,764 Total liabilities 33,039 21,973 55,012
NET POSITION
Restricted for individuals, organizations or other governments
488 88,610 89,098
Total net position 488 $ 88,610 $ 89,098 $
EXHIBIT 39
137
CITY OF SUFFOLK, VIRGINIA
COMBINING STATEMENT OF CHANGES IN FIDUCIARY NET POSITION -CUSTODIAL FUNDS
Year Ended June 30, 2022
ADDITIONS
Special Welfare Fund Commonwealth of Virginia Fund Total
Permits and Fees - $ 43,019 $ 43,019 $ Miscellaneous revenue 30,393 25,235 55,628 Total additions 30,393 68,254 98,647
DEDUCTIONS
Special welfare agency payments 30,539 - 30,539 Payments to other governments - 54,386 54,386 Total deductions 30,539 54,386 84,925
Change in net position (146) 13,868 13,722
NET POSITION AT JULY 1 634 74,742 75,376
NET POSITION AT JUNE 30 488 $ 88,610 $ 89,098 $
EXHIBIT 40
138
OTHER SUPPLEMENTARY INFORMATION:
DISCRETELY PRESENTED COMPONENT UNIT – CITY OF SUFFOLK SCHOOL BOARD
School Operating Fund – accounts for revenues and expenditures relating to the operation of the City of Suffolk Public Schools. Revenues are derived from the City’s General Fund and from state and Federal funds.
School Food Service Fund – accounts for revenues and expenditures relating to the operation of school cafeterias. Revenues are derived from state and Federal funds and cafeteria sales.
School Grants Fund – accounts for revenues and expenditures relating to grants received by the school system from Federal and state governments.
OPEB Trust Fund – accounts for the other postemployment benefits (OPEB). This fund accumulates resources for health insurance for retired employees.
Combined School Activity Funds – accounts for the various activity funds of each of the schools. Revenues are derived from school fundraisers, athletic and state event receipts, and School Board allocations.
CITY OF SUFFOLK, VIRGINIA
COMBINING BALANCE SHEET
GOVERNMENTAL FUNDS - DISCRETELY PRESENTED COMPONENT UNIT SCHOOL BOARD June 30, 2022
School School School School Food Student Total Operating Grants Service Activity School Fund Fund Fund Funds Board
ASSETS
Cash and cash equivalents
19,462,918 $ - $ 3,293,025 $ 1,199,036 $ 23,954,979 $ Receivables, net 184,542 4,358 25,716 - 214,616
Due from other funds 5,640,220 - - - 5,640,220
Due from other governments 1,954,081 7,889,311 1,745,975 - 11,589,367
Inventories 329,826 - 171,521 - 501,347
Prepaid items 95,000 - - - 95,000
Total assets 27,666,587 $ 7,893,669 $ 5,236,237 $ 1,199,036 $ 41,995,529 $
LIABILITIES
Accounts payable
2,792,465 $ 691,157 $ 31,227 $ - $ 3,514,849 $
Accrued payroll and related liabilities 16,701,097 691,094 239,854 - 17,632,045
Due to the Primary Government 397,485 - - - 397,485
Due to other funds - 5,640,220 - - 5,640,220
Total liabilities 19,891,047 7,022,471 271,081 - 27,184,599
FUND BALANCES
Nonspendable: Inventories and prepaids 424,826 - 171,521 - 596,347 Premiums held for workers' compensation claims 225,000 - - - 225,000 Premiums held for health insurance claims 380,122 - - - 380,122
Assigned: Special revenue - 871,198 - 1,199,036 2,070,234 Food service - - 4,793,635 - 4,793,635
Encumbrances 6,745,592 - - - 6,745,592
Total fund balances 7,775,540 871,198 4,965,156 1,199,036 14,810,930 Total liabilities and fund balance 27,666,587 $ 7,893,669 $ 5,236,237 $ 1,199,036 $ 41,995,529 $
Reconciliation to the Statement of Net Position (Exhibit 1)
Total fund balance 14,810,930 $
Capital assets used in governmental activities are not financial resources and, therefore, are not reported in the funds.
School Board 163,316,874
Long-term asset (liabilities) are not due and payable in the current period and, therefore, are not reported in the funds.
School Board compensated absences (3,124,121)
Net pension liability (asset) and pension and OPEB deferred inflows and outflows are not due and payable in the current period and, therefore, not reported in the governmental funds:
Net pension asset - Schools 3,901,996
Net pension liability - Schools (73,840,253)
Deferred outflows - pension 30,279,831
Deferred inflows - pension (60,648,946)
Net OPEB asset - School Trust 12,003,130
OPEB Deferred Inflows - School Trust 983,833
OPEB Deferred Outflows - School Trust (8,193,328)
Net OPEB asset - State Plans 30,600
Net OPEB liability - State Plans (17,911,008)
OPEB Deferred Inflows - State Plans (3,150,499)
OPEB Deferred Outflows - State Plans 4,252,948
Net position of governmental activities 62,711,987 $
EXHIBIT 41
139
CITY OF SUFFOLK, VIRGINIA
COMBINING STATEMENT OF REVENUES, EXPENDITURES, AND CHANGES IN FUND BALANCE
GOVERNMENTAL FUNDS - DISCRETELY PRESENTED COMPONENT UNIT SCHOOL BOARD
Year Ended June 30, 2022
School School School School Food Student Total Operating Grants Service Activity School Fund Fund Fund Funds Board
REVENUES
Revenue from use of money and property 6,600 $ 1,500 $ 4,323 $ - $ 12,423 $ Charges for services 5,914 - 9,395 - 15,309 Miscellaneous 296,049 314,142 210,369 2,242,640 3,063,200
Intergovernmental:
City contribution 64,934,716 - - - 64,934,716
Revenue from the Commonwealth 99,343,183 519,648 102,906 - 99,965,737 Revenue from the Federal Government 884,727 15,150,304 10,410,345 - 26,445,376 Total revenues 165,471,189 15,985,594 10,737,338 2,242,640 194,436,761
EXPENDITURES
Current: Education 164,843,609 16,315,133 8,571,184 2,052,173 191,782,099 Total expenditures 164,843,609 16,315,133 8,571,184 2,052,173 191,782,099
Excess (deficiency) of revenues over (under) expenditures 627,580 (329,539) 2,166,154 190,467 2,654,662
Other financing sources (uses):
Transfers in - 48,285 - - 48,285 Transfers out (48,285) - - - (48,285) Total other financing sources (uses), net (48,285) 48,285 - - -
Net changes in fund balances 579,295 (281,254) 2,166,154 190,467 2,654,662
Fund balances at July 1 (as restated) 7,196,245 1,152,452 2,799,002 1,008,569 12,156,268
Fund balances at June 30 7,775,540 $ 871,198 $ 4,965,156 $ 1,199,036 $ 14,810,930 $
Reconciliation to the Statement of Activities (Exhibit 2)
Net change in fund balance - governmental funds 2,654,662 $
Governmental funds report capital outlays as expenditures. However, in the
Statement of Activities, the cost of those assets is allocated over their estimated useful lives and reported as depreciation expense.
Depreciation expense for the School Board (11,216,673)
Capitalized expenditures 3,843,548
Record the net flow of resources in the current year related to the Pension Plan
Record the net flow of resources in the current year related to the OPEB School trust
Record the net flow of resources in the current year related to the OPEB State plans
Compensated absences and other postemployment benefits
13,185,277 1,930,392 493,915 are not due and payable at June 30, and, therefore, are not reported in the fund statements. (318,153)
Change in net position of governmental activities (Exhibit 2) 10,572,968 $ This amount represents the current year change in those items for the School Board - compensated absences
EXHIBIT 42
140
CITY OF SUFFOLK, VIRGINIA
BUDGETARY RECONCILIATION SCHEDULE
GOVERNMENTAL FUNDS – DISCRETELY PRESENTED COMPONENT UNIT – SCHOOL BOARD Year Ended June 30, 2022
Total Exhibit 44 Budget Based Items Total Exhibit 42 Total Exhibit 44 Budget Based Items Total Exhibit 42 Total Exhibit 44 Budget Based Items Total Exhibit 42
Total revenues 165,471,189 $ - $ 165,471,189 $ 15,985,594 $ - $ 15,985,594 $ 10,737,338 $ - $ 10,737,338 $
Total other financing sources - - - 48,285 - 48,285 - - -
Total revenues 165,471,189 - 165,471,189 16,033,879 - 16,033,879 10,737,338 - 10,737,338
Total expenditures 165,429,756 586,147 164,843,609 16,315,133 - 16,315,133 8,571,184 - 8,571,184
Total other financing uses 48,285 - 48,285 - - - - - -
Total expenditures 165,478,041 586,147 164,891,894 16,315,133 - 16,315,133 8,571,184 - 8,571,184
Net changes in fund balances (6,852) $ (586,147) $ 579,295 $ (281,254) $ - $ (281,254) $ 2,166,154 $ - $ 2,166,154 $
CY encumbrance 6,752,592 $ CY encumbrance - $ CY encumbrance - $ PY encumbrance (6,166,445) PY encumbrance - PY encumbrance586,147 $ - $ - $
EXHIBIT 43
141
School Operating Fund School Grants Fund School Food Service Fund
REVENUES
CITY OF SUFFOLK, VIRGINIA SCHEDULE OF REVENUES, EXPENDITURES, AND CHANGES IN FUND BALANCES - BUDGET AND ACTUAL (Non-GAAP Budgetary Basis) DISCRETELY PRESENTED COMPONENT UNIT - SCHOOL BOARD Year Ended June 30, 2022
School Operating Fund School Grants Fund School Food Service Fund
Budgeted Amounts
Budgeted Amounts
Budgeted Amounts
Variance with Variance with Variance with Original Final Actual Final Budget - Original Final Actual Final Budget - Original Final Actual Final Budget -
Revenue from use of money and property 35,000 $ 35,000 $ 6,600 $ (28,400) $ -$ 1,500 $ 1,500 $ -$ 8,800 $ 8,800 $ 4,323 $ (4,477) $
Charges for services 130,000 130,000 5,914 (124,086) - - - - 1,000,000 1,625,500 9,395 (1,616,105) Miscellaneous 681,880 641,880 296,049 (345,831) - 1,555,084 314,142 (1,240,942) 1,203,048 577,548 210,369 (367,179)
Intergovernmental: Contribution from the City of Suffolk 65,332,201 65,332,201 64,934,716 (397,485) - - - - - - - -
Revenue from the Commonwealth 98,388,855 98,388,855 99,343,183 954,328 - 2,366,272 519,648 (1,846,624) 216,000 216,000 102,906 (113,094)
Revenue from the Federal Government 1,194,000 1,092,000 884,727 (207,273) 22,775,000 55,334,196 15,150,304 (40,183,892) 5,519,100 5,519,100 10,410,345 4,891,245
Total revenues 165,761,936 165,619,936 165,471,189 (148,747) 22,775,000 59,257,052 15,985,594 (43,271,458) 7,946,948 7,946,948 10,737,338 2,790,390
EXPENDITURES
Current: Education 165,761,936 171,875,687 165,429,756 6,445,931 - - - - - - -Grant expenditures - - - - 22,775,000 59,305,337 16,315,133 42,990,204 - - -Food Services - - - - - - - - 7,946,948 7,946,948 8,571,184 (624,236)
Total expenditures 165,761,936 171,875,687 165,429,756 6,445,931 22,775,000 59,305,337 16,315,133 42,990,204 7,946,948 7,946,948 8,571,184 (624,236)
Excess (deficiency) of revenues over (under) - (6,255,751) 41,433 6,297,184 - (48,285) (329,539) (281,254) - - 2,166,154 2,166,154 expenditures
OTHER FINANCING SOURCES (USES)
Transfers in - - - - - 48,285 48,285 - - - - -
Transfers out - - (48,285) (48,285) - - - - - - - -
Total other financing sources (uses), net - - (48,285) (48,285) - 48,285 48,285 - - - - -
Net change in fund balances - $ (6,255,751) $ (6,852) $ 6,248,899 $ -$ -$ (281,254) $ (281,254) $ -$ -$ 2,166,154 $ 2,166,154 $
EXHIBIT 44
142
CITY OF SUFFOLK, VIRGINIA
STATEMENT OF NET POSITION
OPEB FUND – DISCRETELY PRESENTED COMPONENT UNIT – SCHOOL BOARD June 30, 2022
OPEB Trust Fund
ASSETS
Cash and cash equivalents 19,990,989 $ Total assets 19,990,989
Net Position
Held in trust for OPEB benefits 19,990,989 Net position 19,990,989 $
EXHIBIT 45
143
CITY OF SUFFOLK, VIRGINIA
STATEMENT OF CHANGES IN NET
POSITION
OPEB TRUST FUND – DISCRETELY PRESENTED COMPONENT UNIT – SCHOOL BOARD Year Ended June 30, 2022
School Board
Additions:
Gain on investments (2,033,794) $
Total additions (2,033,794)
Deductions: Administrative fees 19,188
Total deductions 19,188
Change in net position (2,052,982)
Net position - beginning of year 22,043,971
Net position - end of year 19,990,989 $
EXHIBIT 46
144
STATISTICAL SECTION
This section of the City’s Annual Comprehensive Financial Report presents detailed information as a context for understanding what the information in the financial statements, note to financial statements, and required supplementary information says about the City’s overall financial health.
Contents Table
Financial Trends 1-4
These tables contain trend information to help the reader understand how the City’s financial performance and well-being have changed over time.
Revenue Capacity 5-12
These tables contain information to help the reader assess the factors affecting the City’s ability to generate its property and sales taxes, as well as revenues from its water and sewer operations.
Debt Capacity 13-15
These tables present information to help the reader assess the affordability of the City’s current levels of outstanding debt and the City’s ability to issue additional debt in the future.
Demographic and Economic Information 16-17
These tables offer demographic and economic indicators to help the reader understand the environment in which the City’s financial activities take place and to help make comparison over time and with other governments.
Operating Information 18-20
These schedules contain information about the City’s operations and resources to help the reader understand how the City’s financial information relates to the services the City provides and the activities it performs.
Sources: Unless otherwise noted, the information in these schedules is derived from the Comprehensive Annual Financial Reports for the relevant year.
NET POSITION BY COMPONENT LAST TEN FISCAL YEARS
Governmental Activities
2013 2014 2015 2016 2017 2018 2019 2020 2021 2022
Net investment in capital assets 287,319,247 $ 290,323,371 $ 294,142,955 $ 323,431,229 $ 318,746,466 $ 335,967,276 $ 301,764,919 $ 312,862,208 $ 318,301,547 $ 325,875,876 $ Restricted: Capital Projects - 1,162,771 1,270,512 1,626,277 1,934,672 618,062 - - -Debt Service 392,219 392,259 392,299 392,424 393,352 397,267 - - -Other Purposes 6,658,293 8,023,744 3,374,719 2,514,171 6,554,243 1,071,735 1,638,228 9,549,799 12,168,525 28,450,136 Unrestricted 87,103,333 46,588,610 46,662,695 41,928,355 61,188,152 66,603,036 76,528,512 83,422,805 86,760,259 118,098,831
Total Net Position
Governmental Activities 381,473,092 $ 346,490,755 $ 345,843,180 $ 369,892,456 $ 388,816,885 $ 404,657,376 $ 379,931,659 $ 405,834,812 $ 417,230,331 $ 472,424,843 $
Business-type Activities
Net investment in capital assets 153,147,421 $ 145,111,492 $ 125,468,343 $ 116,807,623 $ 108,816,928 $ 108,549,474 $ 104,233,265 $ 107,008,077 $ 111,034,005 $ 128,990,591 $ Restricted: Other Purposes 2,079,370 2,144,619 2,195,062 2,299,048 2,911,089 2,501,238 2,527,027 2,583,899 2,559,990 2,651,628 Unrestricted 8,888,398 7,422,809 20,915,542 28,611,789 38,601,383 43,538,079 46,309,138 45,555,329 54,713,620 51,720,022 Total Net Position
Business-type Activities 164,115,189 $ 154,678,920 $ 148,578,947 $ 147,718,460 $ 150,329,400 $ 154,588,791 $ 153,069,430 $ 155,147,305 $ 168,307,615 $ 183,362,241 $
Primary Government
Net investment in capital assets 440,466,668 $ 435,434,863 $ 419,611,298 $ 440,238,852 $ 427,563,394 $ 444,516,750 $ 405,998,184 $ 419,870,285 $ 429,335,552 $ 454,866,467 $ Restricted:
Capital Projects - 1,162,771 1,270,512 1,626,277 1,934,672 618,062 - - -Debt Service 392,219 392,259 392,299 392,424 393,352 397,267 - - -Other Purposes 8,737,663 10,168,363 5,569,781 4,813,219 9,465,332 3,572,973 4,165,255 12,133,698 14,728,515 31,101,764 Unrestricted 95,991,731 54,011,419 67,578,237 70,540,144 99,789,535 110,141,115 122,837,650 128,978,134 141,473,879 169,818,853
Total Net Position
Primary Government 545,588,281 $ 501,169,675 $ 494,422,127 $ 517,610,916 $ 539,146,285 $ 559,246,167 $ 533,001,089 $ 560,982,117 $ 585,537,946 $ 655,787,084 $ (1) (2) (3) (4)
(1) This includes a restatement of Net Position in both the Governmental of $1,979,398 and Business-type Activities of $2,791,275 due to implementation of GASB 65
(2) This includes a restatement of Net Position in both the Governmental of $40,382,530 and Business-type Activities of $5,988,738 due to implementation of GASB No.'s 68 and 71
(3) This includes a restatement of Net Position in the Governmental Activities of $16,444,391 due to a correction of an error and a change in accounting treatment.
(4) Previous years not restated related to the implementation of GASB 75.
Table 1
CITY OF SUFFOLK, VIRGINIA
145
Expenses
Governmental Activities: General Government 17,558,767 $ 18,904,150 $ 18,757,768 $ 22,013,103 $ 23,932,608 $ 17,264,292 $ 18,671,840 $ 24,148,299 $ 39,918,523 $ 27,864,340 $ Judicial 8,138,225 7,994,313 8,031,886 8,153,863 8,867,642 8,806,323 9,323,342 10,446,204 10,860,585 10,536,210 Public Safety 49,413,603 52,439,287 48,708,228 49,908,535 58,213,081 63,472,949 63,195,836 66,848,213 69,025,111 72,861,636 Public Works 32,943,383 35,491,175 36,760,229 38,037,370 40,501,580 37,224,174 39,080,373 42,200,323 44,417,911 61,008,906 Health and Welfare 12,972,806 12,941,699 12,536,910 11,901,139 13,162,760 13,044,274 13,260,821 15,192,043 15,114,251 14,673,123
Transportation 888,933 619,876 908,293 960,983 1,005,429 997,267 1,300,636 1,511,098 1,426,778 1,631,135 Education 49,386,060 49,180,560 51,093,179 53,440,550 54,983,835 57,818,350 60,358,348 58,464,243 65,531,837 65,382,786 Parks, Recreation and Cultural 8,456,643 8,817,413 9,750,157 10,318,851 12,111,876 11,737,262 12,621,117 12,333,012 12,100,733 12,265,195 Community Development 8,099,788 8,665,119 9,933,559 8,621,160 10,563,461 7,323,375 6,472,008 8,481,703 8,205,329 9,261,924 Interest on Long-Term Debt 8,998,878 9,858,244 10,065,468 9,419,498 8,849,091 9,765,103 9,663,773 9,095,957 8,047,611 8,570,572 Total Governmental Activities Expenses 196,857,086 204,911,837 206,545,676 212,775,052 232,191,363 227,453,369 233,948,094 248,721,095 274,648,669 284,055,827
Business-type Activities: Utilities 40,101,617 45,108,820 49,334,155 51,423,536 49,295,373 52,035,621 55,186,848 56,508,083 56,442,957 53,977,360 Refuse collection 5,204,255 5,198,550 5,772,239 5,718,442 5,320,570 6,713,015 8,458,504 9,194,200 5,044,152 9,419,082 Stormwater management 3,249,640 3,413,963 3,734,024 4,450,559 4,749,518 4,912,097 4,830,797 4,989,456 9,566,700 5,087,932
Total Business-type Activities Expenses 48,555,512 53,721,333 58,840,418 61,592,537 59,365,461 63,660,733 68,476,149 70,691,739 71,053,809 68,484,374
Total Primary Government Expenses 245,412,598 $ 258,633,169 $ 265,386,094 $ 274,367,589 $ 291,556,824 $ 291,114,102 $ 302,424,243 $ 319,412,834 $ 345,702,478 $ 352,540,201 $
Program Revenues
Governmental activities: Charges for Services:
General Government Administration 4,800,759 $ 4,977,004 $ 5,044,744 $ 4,887,432 $ 4,659,243 $ 4,880,782 $ 5,035,626 $ 4,478,205 $ 4,100,866 $ 4,527,721 $
Judicial Administration 361,926 275,113 286,398 304,129 272,141 313,092 274,208 288,709 323,618 352,911 Public Safety 3,130,972 - 1,864,675 1,885,914 1,948,166 1,836,661 2,199,385 2,272,912 2,337,613 2,716,979 Public Works 1,469,668 1,460,003 1,479,054 899,794 990,045 988,507 1,288,947 1,243,877 1,318,980 1,877,344 Transportation 47,971 46,870 53,055 67,759 76,099 71,652 87,229 68,430 5 64,817 Parks, Recreation and Cultural 774,237 824,628 982,354 1,108,862 1,056,185 1,020,013 1,009,068 727,136 284,721 759,552 Community Development 100,172 287 85 70 107 16,447 24,742 40,069 - -
Total Charges for Services 10,685,705 7,583,905 9,710,365 9,153,960 9,001,986 9,127,154 9,919,205 9,119,338 8,365,803 10,299,324
Operating Grants and Contributions:
General Government Administration 467,086 1,433,125 636,628 1,503,473 1,477,767 450,386 456,759 2,355,721 12,928,654 9,474,000 Judicial Administration 2,826,315 2,102,897 3,017,272 2,047,647 2,170,053 3,410,191 3,318,391 2,209,983 2,424,511 2,437,198 Public Safety 3,414,088 1,563,382 818,251 1,057,389 1,347,604 1,145,864 1,271,752 1,218,376 1,416,529 4,803,818 Public Works 20,157,859 20,799,365 21,534,701 22,758,708 23,496,157 23,395,546 24,220,184 24,434,363 25,076,636 28,013,220 Health and Welfare 8,198,767 7,682,494 7,557,634 7,598,958 8,088,860 7,452,411 9,237,862 8,984,117 9,379,042 9,481,473 Transportation 116,122 142,793 152,565 141,002 188,364 186,942 984,425 1,571,026 1,501,150 2,146,421 Education 140,879 62,308 20,000 - - - - 3,724 -Parks, Recreation and Cultural 261,267 266,774 521,608 287,351 295,998 275,996 377,344 310,848 292,180 287,343 Community Development 1,522,630 1,153,383 1,128,636 1,032,855 2,725,076 1,209,289 1,116,646 719,004 984,074 878,525
Total Operating Grants and Contributions 37,105,013 35,206,521 35,387,295 36,427,383 39,789,879 37,526,625 40,983,363 41,807,162 54,002,776 57,521,998
Capital Grants and Contributions: General Government 2,299,245 506,228 973,634 3,077,758 2,548,273 4,248,322 1,407,912 376,848 543,372 433,763 Public Works 4,080,584 1,321,424 2,869,669 5,006,683 6,800,136 10,824,821 6,101,699 8,725,657 2,469,464 24,728,332 Transportation 159,005 1,561 206,665 49,422 50,259 59,508 40,683 62,052 324 65,360 Parks, Recreation and Cultural 157,231 42,882 474,341 1,028,457 1,660 414,599 23,647 - 774,910Community Development - - - - - 93,400 - - -Total Capital Grants and Contributions 6,696,065 1,872,095 4,524,309 9,162,320 9,400,328 15,640,650 7,573,941 9,164,557 3,788,070 25,227,455
Total Governmental Activities Program Revenues 54,486,783 44,662,521 49,621,969 54,743,663 58,192,193 62,294,429 58,476,509 60,091,057 66,156,649 93,048,777
CITY OF SUFFOLK, VIRGINIA Table 2 Page 1 of 2 CHANGES IN NET POSITION
2013 2014 2015 2016 2017 2018 2019 2020 2021 2022
(Continued) LAST TEN FISCAL YEARS 146
2013 2014 2015 2016 2017 2018 2019 2020 2021 2022
Program Revenues: (Continued)
Business-type Activities: Charges for Services: Utility 37,884,451 39,013,878 41,209,347 46,876,297 47,818,262 48,999,436 51,703,463 51,378,596 61,760,354 58,898,742 Non-major 10,765,864 10,570,683 12,012,686 11,877,376 12,288,034 13,765,024 13,972,060 15,157,707 17,077,913 19,036,742
Total Charges for Services 48,650,315 49,584,561 53,222,033 58,753,673 60,106,296 62,764,460 65,675,523 66,536,303 78,838,267 77,935,484
Operating Grants and Contributions: Utility - - - - 88,315 - - - - -
Total Operating Grants and Contributions - - - - 88,315 - - - - -
Capital Grants and Contributions: Utility 2,363,664 456,001 565,595 3,682,628 1,870,646 5,483,390 579,166 4,990,101 5,457,474 5,269,223 Total Capital Grants and Contributions 2,363,664 456,001 565,595 3,682,628 1,870,646 5,483,390 579,166 4,990,101 5,457,474 5,269,223
Total Business-type Activities Program Revenues 51,013,979 50,040,562 53,787,628 62,436,301 62,065,257 68,247,850 66,254,689 71,526,404 84,295,741 83,204,707
Total Primary Government Program Revenues 105,500,762 $ 94,703,083 $ 103,409,597 $ 117,179,964 $ 120,257,450 $ 130,542,279 $ 124,731,198 $ 131,617,461 $ 150,452,390 $ 176,253,484 $
Net (Expense)/Revenue
Governmental Activities (142,370,304) $ (160,249,316) $ (156,923,707) $ (158,031,389) $ (173,999,170) $ (165,158,940) $ (175,471,585) $ (188,630,038) $ (208,492,020) $ (191,007,050) $ Business-type Activities 2,458,467 (3,680,771) (5,052,790) 843,764 2,699,796 4,587,117 (2,221,460) 834,665 13,241,932 14,720,333
Total Primary Government Net Expense (139,911,837) $ (163,930,086) $ (161,976,497) $ (157,187,625) $ (171,299,374) $ (160,571,823) $ (177,693,045) $ (187,795,373) $ (195,250,088) $ (176,286,717) $
General Revenues and Other Changes in Net Position
Governmental Activities: Taxes 141,004,777 $ 146,247,763 $ 152,576,375 $ 160,158,953 $ 166,579,230 $ 173,015,098 $ 182,439,367 $ 187,808,386 $ 199,820,382 $ 222,616,258 $ Grants and Contributions Not Restricted to Specific Programs 13,624,485 13,609,376 13,385,064 13,545,057 13,589,564 13,726,367 14,011,120 14,094,789 14,530,452 14,422,449 Revenue from use of money and property 1,257,594 1,230,251 1,167,212 1,374,395 1,837,341 2,892,413 5,524,760 4,067,125 1,702,489 1,735,694 GGain (Loss) on disposal of capital assets - - 242,375 (1,904,854) - - - - (2,905,626) (484,909) Capital assets donated to Component Unit (4,528,560) - (18,234,608) (185,632) - - (57,874,651) - -Transfers/Miscellaneous 6,460,944 4,562,119 7,139,716 9,092,746 10,917,464 7,742,293 6,645,272 8,562,891 6,739,842 6,801,975
Total Governmental Activities 157,819,240 165,649,509 156,276,134 182,080,665 192,923,599 197,376,171 150,745,868 214,533,191 219,887,539 245,091,467
Business-type Activities:
Investment Earnings 741,640 571,581 562,699 983,001 935,690 970,727 2,020,795 1,128,542 210,580 150,244 Transfers/Miscellaneous (1,950,430) (338,342) (1,609,882) (2,687,252) (1,024,546) 121,844 (1,318,696) 114,668 (292,202) (218,278) Total Business-type Activities (1,208,790) 233,239 (1,047,183) (1,704,251) (88,856) 1,092,571 702,099 1,243,210 (81,622) (68,034)
Total Primary Government 156,610,450 $ 165,882,748 $ 155,228,951 $ 180,376,414 $ 192,834,743 $ 198,468,742 $ 151,447,967 $ 215,776,401 $ 219,805,917 $ 245,023,433 $
Change in Net Position
Governmental Activities 15,448,936 $ 5,400,193 $ (647,573) $ 24,049,276 $ 18,924,429 $ 32,217,231 $ (24,725,717) $ 25,903,153 $ 11,395,519 $ 54,084,417 $ Business-type Activities 1,249,677 (3,447,532) (6,099,973) (860,487) 2,610,940 5,679,688 (1,519,361) 2,077,875 13,160,310 14,652,299
Total Primary Government 16,698,613 $ 1,952,662 $ (6,747,546) $ 23,188,789 $ 21,535,369 $ 37,896,919 $ (26,245,078) $ 27,981,028 $ 24,555,829 $ 68,736,716 $ (1)
(1) In FY2016, prior period adjustments were made that impacted FY2015. Therefore, FY2015 values for Governmental activities were decreased by $16,444,391.
CITY OF
VIRGINIA Table 2 Page 2 of 2 CHANGES IN NET POSITION
SUFFOLK,
LAST EIGHT FISCAL YEARS 147
FUND BALANCES, GOVERNMENTAL FUNDS
General Fund
Non-Spendable 9,794 $ 3,920 $ 42,454 $ 24,905 $ 47,669 $ 37,908 $ 64,993 $ 73,373 $ 95,434 $ 100,474 $ Restricted 565,969 580,948 668,506 1,162,069 1,528,879 1,552,547 1,614,632 1,455,994 1,401,576 1,324,839 Committed 9,909,530 8,792,595 6,285,381 4,472,517 5,920,555 6,633,215 4,237,613 9,022,280 25,260,455 38,290,681 Assigned 1,646,157 2,348,576 701,393 425,008 2,609,232 426,564 748,518 526,269 1,500,527 1,862,146 Unassigned 43,938,132 45,575,368 48,647,116 56,491,224 58,392,937 65,326,008 73,858,094 86,344,490 81,006,638 93,931,500 Total General Fund 56,069,582 $ 57,301,407 $ 56,344,850 $ 62,575,723 $ 68,499,272 $ 73,976,242 $ 80,523,850 $ 97,422,406 $ 109,264,630 $ 135,509,640 $
All Other Governmental Funds
Nonspendable - $ 88,383 $ 38,309 $ 30,776 $ 45,654 $ 45,654 $ 45,654 $ 45,654 $ 45,654 $ 164,694 $ Restricted 14,353,521 35,666,062 60,045,985 67,568,640 63,765,980 56,841,100 56,027,201 65,409,783 67,810,242 85,261,656 Committed, reported in:
Capital Projects Funds 34,504,114 6,469,155 1,972,667 5,914,066 7,319,905 10,890,140 9,448,361 6,777,753 10,232,234 9,966,324
Nonmajor Governmental Funds 2,839,333 2,125,879 2,170,497 2,516,047 3,498,144 2,599,519 3,240,732 4,436,654 5,974,413 7,642,579
Other Governmental Funds 10,890,830 13,337,889 2,822,872 2,148,460 99,368 95,453 492,720 492,720 492,720 492,720 Assigned, reported in:
Special Revenue Funds 2,864,515 1,941,868 - - - - - - -Unassigned (10,938) (10,909) (10,951) (10,945) (10,818) (10,819) (10,819) (10,819) (10,819) (10,819)
Total all other Governmental Funds 65,441,375 $ 59,618,327 $ 67,039,379 $ 78,167,044 $ 74,718,233 $ 70,461,047 $ 69,243,849 $ 77,151,745 $ 84,544,444 $ 103,517,154 $
Component Unit (School Board)
Nonspendable 1,397,417 $ 1,549,179 $ 1,563,699 $ 1,134,919 $ 1,125,204 $ 1,118,041 $ 1,222,261 $ 1,206,139 $ 1,179,061 $ 1,201,469 $ Committed 357,600 504,320 477,237 417,309 433,862 420,990 490,778 721,628 -Assigned 5,558,243 7,016,812 9,091,818 7,125,361 7,682,280 9,170,789 10,150,397 9,978,500 10,977,207 11,863,486 Unassigned (149,539) - - 154,815 - - - -7,163,721 $ 9,070,311 $ 11,132,754 $ 8,832,404 $ 9,241,346 $ 10,709,820 $ 11,863,436 $ 11,906,267 $ 12,156,268 $ 13,064,955 $ (1)
(1) FY2015 includes a restatement of fund balance between the General Fund and the other special revenue funds of $763,185
CITY OF
VIRGINIA Table 3
SUFFOLK,
LAST TEN FISCAL YEARS 2013 2014 2015 2016 2017 2018 2019 2020 2021 2022
148
CHANGES IN FUND BALANCES, GOVERNMENTAL FUNDS
Revenues
General Property Taxes 104,577,439 $ 110,069,867 $ 112,558,761 $ 118,076,619 $ 123,457,208 $ 127,047,858 $ 135,696,638 $ 141,959,059 $ 146,642,458 $ 158,483,622 $ Other Local Taxes 36,379,136 36,077,720 39,723,172 42,544,952 43,202,375 45,768,255 46,261,507 48,737,290 53,092,031 61,403,956 Licenses, Permits and Fees 1,284,823 1,282,637 1,436,613 1,589,474 1,678,881 1,825,728 1,723,958 2,141,327 2,484,061 2,811,187 Fines and Forfeitures 1,048,276 1,067,296 1,254,627 1,042,219 983,988 1,142,491 1,179,110 1,012,104 1,068,804 1,013,613 Use of Money and Property 1,199,549 1,180,391 1,118,245 1,289,414 1,775,226 2,708,976 3,965,689 3,516,133 1,610,402 1,648,532 Intergovernmental 55,743,813 50,170,399 52,623,910 58,698,660 62,362,464 66,206,954 62,089,557 64,516,765 71,603,311 96,690,342 Charges for Services 6,999,252 5,354,741 5,344,154 5,018,523 4,827,273 4,770,834 5,508,401 5,104,191 4,743,554 6,501,353 Miscellaneous 2,229,766 1,385,847 1,981,761 2,482,439 1,983,706 3,794,081 2,076,460 3,331,856 1,269,900 1,252,595
Total Revenues 209,462,054 206,588,898 216,041,243 230,742,300 240,271,121 253,265,177 258,501,320 270,318,725 282,514,521 329,805,200
Expenditures
General Government Administration 15,171,035 15,045,173 15,717,849 15,511,299 16,302,909 17,074,074 17,062,724 18,200,342 28,646,499 27,772,839 Judicial Administration 8,086,574 7,978,377 8,308,093 8,467,689 8,896,483 9,051,250 9,624,709 10,133,068 10,430,783 10,917,499 Public Safety 48,435,845 48,997,652 49,275,180 50,488,261 57,115,046 60,265,740 62,900,211 63,883,434 64,154,020 72,428,273 Public Works 19,465,040 21,231,887 22,352,347 23,038,899 25,102,596 23,998,099 22,333,618 24,421,117 24,658,890 25,772,021 Health and Welfare 12,920,565 12,933,567 12,813,152 12,219,597 13,256,252 13,319,870 13,634,568 14,670,632 14,580,535 14,961,450 Transportation 888,337 672,274 1,209,090 1,033,663 1,079,339 1,090,607 1,592,193 1,898,154 1,420,397 2,045,390 Education 49,386,060 49,170,847 51,134,708 53,435,459 54,900,377 56,467,515 60,353,258 58,106,679 65,526,746 65,377,695 Parks, Recreation and Cultural 7,650,996 7,857,639 9,382,259 9,835,503 10,576,486 11,147,634 12,281,589 11,331,545 10,854,151 11,558,710 Community Development 8,062,809 8,238,220 9,355,031 7,948,520 9,844,679 6,686,201 5,846,241 7,305,136 6,752,880 8,302,351 Non-Departmental 474,540 531,079 1,848,130 466,002 323,725 226,481 675,842 594,989 759,119 673,338 Capital Outlay 20,951,351 46,949,925 32,536,679 28,950,011 46,189,812 56,107,239 37,532,944 30,648,655 33,190,478 48,026,860 Debt Service: Other 168,343 521,661 497,736 446,658 720,840 323,069 245,499 582,569 409,738 506,360 Interest 9,702,110 10,206,705 10,334,731 10,346,003 9,388,267 10,319,538 10,535,818 9,579,925 9,519,802 8,801,914 Principal 15,512,377 17,233,990 16,435,462 17,015,462 16,781,132 15,767,400 17,815,620 18,118,620 18,774,488 19,074,488
Total Expenditures 216,875,982 247,568,997 241,200,447 239,203,026 270,477,943 281,844,717 272,434,834 269,474,865 289,678,526 316,219,188
Excess (Deficiency) of Revenues Over (Under) Expenditures (7,413,928) (40,980,099) (25,159,204) (8,460,726) (30,206,822) (28,579,540) (13,933,514) 843,860 (7,164,005) 13,586,012
Other Financing Sources (Uses)
Proceeds of Refunding Bonds 11,520,000 5,370,000 20,160,000 20,176,111 47,215,000 3,395,000 575,000 31,345,000 36,855,000 17,990,000 Proceeds of Bonds Issued 9,890,000 33,105,000 28,820,000 20,360,000 26,380,000 26,665,000 17,370,000 18,965,000 22,000,000 27,090,000 Premiums on Debt 3,322,503 4,248,968 6,695,020 3,955,535 7,912,562 2,313,366 1,182,718 2,323,802 2,163,968 2,928,122 Transfers to other governments - (304,763) - - - - - - -Transfers In 35,363,768 34,821,649 38,022,629 37,593,204 36,594,695 37,425,621 39,252,347 37,704,027 40,940,955 39,721,127 Payment to Refunded Bonds Escrow Agent (13,568,249) (4,844,006) (23,830,555) (22,362,261) (51,298,280) (3,734,892) (600,000) (31,033,899) (36,743,990) (17,754,699) Transfers Out (33,177,405) (36,007,972) (38,243,395) (33,903,324) (34,122,417) (36,264,770) (38,516,141) (35,341,338) (38,817,005) (38,342,842)
Total Other Financing Sources, net 13,350,617 36,388,876 31,623,699 25,819,265 32,681,560 29,799,325 19,263,924 23,962,592 26,398,928 31,631,708 Net Change in Fund Balance 5,936,689 $ (4,591,223) $ 6,464,495 $ 17,358,539 $ 2,474,738 $ 1,219,785 $ 5,330,410 $ 24,806,452 $ 19,234,923 $ 45,217,720 $
Capital outlay (1) 23,029,711 $ 44,465,715 $ 36,911,941 $ 31,474,338 $ 48,309,227 $ 58,064,359 $ 39,808,562 $ 32,231,862 $ 34,373,563 $ 52,498,272 $ Debt Service as a percentage of 13.01% 13.49% 13.10% 13.17% 11.78% 11.66% 12.19% 11.68% 11.08% 10.57% non-capital expenditures (1)
Add'l School Operating & Food Service Expenditures (2) 86,707,523 $ 80,056,924 $ 82,309,125 $ 88,999,257 $ 88,031,891 $ 90,729,115 $ 96,781,541 $ 99,580,517 $ 102,129,429 $ 108,480,077 $ Debt Service as a percentage of 8.99% 9.68% 9.34% 9.22% 8.44% 8.29% 8.61% 8.22% 7.92% 7.49% non-capital plus school expenditures (2)
(1) Calculated as the Principal plus Interest shown above divided by the Total Expenditures less Capital Outlay as shown in the Exhibit 4 reconciliation schedule, as defined by GFOA. This ratio may have changed from previous years' presentations. (2) Additional School expenditures are found in the Component Unit section of the ACFR (School Operating and School Food Service Fund expenditures less Contribution revenue from the City). The related ratio is part of bond continuing disclosure requirements.
CITY OF SUFFOLK, VIRGINIA Table 4
LAST TEN FISCAL YEARS 2013 2014 2015 2016 2017 2018 2019 2020 2021 2022
149
TAX REVENUES BY SOURCE, GOVERNMENTAL FUNDS LAST TEN FISCAL YEARS
General Property Tax 104,577,439 $ 110,069,867 $ 112,558,761 $ 117,651,210 $ 123,411,724 $ 127,047,858 $ 135,696,638 $ 141,959,059 $ 146,689,685 $ 161,212,302 $ 54%
Other Local Taxes:
Sales and Use 8,050,485 8,473,872 9,397,170 9,904,693 10,399,254 10,977,388 10,421,185 12,626,601 15,618,307 16,370,461 103%
Utility Tax 4,390,438 4,430,346 4,509,480 4,478,378 4,447,778 4,839,131 4,799,814 4,755,918 4,864,689 5,024,008 14%
Communication Taxes 3,602,321 3,535,356 3,492,721 3,115,672 3,311,375 3,212,841 3,001,565 2,890,793 2,627,477 2,499,745 -31%
Business and Occupational License 6,277,297 5,158,825 6,928,327 7,680,254 6,891,756 7,552,220 8,095,262 8,412,262 9,212,742 10,964,624 75%
Motor Vehicle License 2,247,870 2,240,157 2,301,259 2,449,544 2,436,079 2,354,440 2,472,521 2,624,213 2,682,701 2,709,174 21% Bank Stock 486,092 505,550 529,855 564,037 629,727 675,738 691,626 582,250 706,211 747,889 54% Recordation 1,165,979 1,269,043 1,456,395 1,466,044 1,477,475 1,866,957 1,697,180 2,513,189 2,448,497 3,279,397 181% Tobacco 1,313,533 1,354,757 1,391,263 2,050,259 2,069,356 1,971,283 1,955,756 1,920,427 2,028,076 1,831,481 39%
Lodging 1,071,900 1,119,678 1,172,193 1,484,031 1,706,709 1,787,927 1,762,778 1,470,419 1,657,435 2,206,627 106% Meals 7,452,212 7,646,834 8,329,490 8,996,483 9,432,240 10,111,438 10,996,828 10,749,762 11,278,549 15,592,762 109%
Admission 237,060 243,203 215,019 318,348 365,757 418,892 366,992 191,456 6,013 177,788 -25%
Public Facility Tax Rebate 83,949 100,099 - - - - - - -
Total 140,956,575 $ 146,147,587 $ 152,281,933 $ 160,158,953 $ 166,579,230 $ 172,816,113 $ 181,958,145 $ 190,696,349 $ 199,820,382 $ 222,616,258 $
CITY OF
VIRGINIA Table 5
SUFFOLK,
Change 2013 2014 2015 2016 2017 2018 2019 2020 2021 2022 2013-2022
150
ASSESSED VALUE AND ESTIMATED ACTUAL VALUE OF TAXABLE PROPERTY LAST TEN FISCAL YEARS
Personal Property Real Property
Total
Estimated City
Assessed Value Assessed Value
Citizens Public Actual Wide Citizens Public Tax Assessed Property (1) Service (2) Total Value Rate Property (3) Service (2) Total Rate Value
2013 8,776,025,000 $ 29,254,047 $ 8,805,279,047 $ 9,371,181,700 $ 0.97$ 839,643,073 $ 299,930,734 $ 1,139,573,807 $ 4$ 9,944,852,854 $
2014 8,612,541,300 28,707,851 8,641,249,151 9,132,641,100 1.03 864,971,340 297,602,714 1,162,574,054 4.25 9,803,823,205
2015 8,802,263,400 28,123,794 8,830,387,194 9,266,762,600 1.03 885,552,076 308,852,863 1,194,404,939 4.25 10,024,792,133
2016 9,012,246,300 30,898,516 9,043,144,816 9,423,596,600 1.07 941,845,500 329,961,909 1,271,807,409 4.25 10,314,952,225
2017 9,234,719,500 37,249,670 9,271,969,170 9,591,955,500 1.07 985,809,155 346,169,603 1,331,978,758 4.25 10,603,947,928
2018 9,536,521,300 44,371,412 9,580,892,712 9,874,324,100 1.07 1,002,785,230 360,467,216 1,363,252,446 4.25 10,944,145,158
2019 9,758,914,800 43,055,984 9,801,970,784 10,211,179,800 1.11 1,074,774,050 370,951,482 1,445,725,532 4.25 11,247,696,316
2020 10,041,879,300 43,414,519 10,085,293,819 10,513,127,400 1.11 1,178,762,000 370,348,948 1,549,110,948 4.25 11,634,404,767
2021 10,550,088,600 46,398,554 10,596,487,154 11,024,342,300 1.11 1,237,467,530 388,395,491 1,625,863,021 4.25 12,222,350,175
2022 11,389,979,300 44,111,509 11,434,090,809 11,865,794,500 1.11 1,390,991,290 390,958,029 1,781,949,319 4.25 13,216,040,128
(1) Real property is assessed at 100% of estimated actual value except land use property which approximates 30%. Source: City Assessor's Office
(2) Determined by the State Corporation Commission of Virginia.
(3) Vehicles are assessed at 100% of clean loan value: recreation vehicles are assessed at 100% of lowest NADA value; and machinery and tools are assessed at 20% of original cost for the first five years and 10% thereafter. Source: City Commissioner of the Revenue's Office.
CITY OF SUFFOLK, VIRGINIA Table 6
Year
Fiscal
151
DIRECT PROPERTY TAX RATES (PER HUNDRED) (1) LAST TEN FISCAL YEARS
Real Property (2)
Downtown Route 17 Business
Machinery Minimum Fiscal City Taxing Overlay Personal and Total Direct Year Wide District District Property (3) Tools (4) Rate (5)
2013 0.97$ 0.25$ 0.115 $ 4.25 $ 3.15$ 5.22 $
2014 1.03 0.25 0.105 4.25 3.15 5.28
2015 1.03 0.24 0.105 4.25 3.15 5.28
2016 1.07 0.24 0.105 4.25 3.15 5.28
2017 1.07 0.24 0.105 4.25 3.15 5.28
2018 1.07 0.24 0.105 4.25 3.15 5.28
2019 1.11 0.24 0.105 4.25 3.15 5.28
2020 1.11 0.24 0.105 4.25 3.15 5.28
2021 1.11 0.24 0.105 4.25 3.15 5.28
2022 1.11 0.24 0.105 4.25 3.15 5.28
(1) The City is not a component of any overlapping governments; therefore, it does not share any overlapping tax rates nor debt.
(2) Real property is assessed at 100% of estimated actual value, except land use property which approximates 30%.
(3) Vehicles are assessed at 100% of average loan value.
(4) Assessed at 20% of original cost during the first five years of life; 10% thereafter.
(5) The district tax rates include the City-wide rate. Additionally, districts overlap some properties, resulting in those properties being taxed at the City rate plus the additional rate for each applicable district. Therefore, only the City-wide rate is used with the person property rate to calculate the Minimum Total Direct Rate.
CITY OF SUFFOLK, VIRGINIA Table 7
152
PRINCIPAL PROPERTY TAX PAYERS
CURRENT YEAR AND NINE YEARS AGO
Real Property
Percentage Percentage of Total City of Total City Taxable Taxable Taxable Taxable Assessed Assessed Assessed Assessed
Type of Business Value Value (1) Value Value (1)
Amazon.com Services Inc Retail Merchandise 174,241,500 $ 1.53% - $ 0.00%
SE VA Suffolk Property Owner LLC Real Estate Holding Company 76,664,100 0.67% - $ 0.00% Target Corporation Distribution Warehouse 63,833,800 0.56% 39,245,000 $ 0.45%
EGP 116 Suffolk LLC /116 Lakeview Parkway, LLC Joint Military Training Facility 53,232,400 0.47% 54,180,500 0.62% 2152 LLC Apartment Complex 45,924,400 0.40%
QVC of Suffolk Inc. / CVN Distribution Distribution Warehouse 42,817,400 0.38% 44,294,900 0.50%
The Pergola Group Apartment Complex 42,190,100 0.37%
GGT Hampton Roads VA Venture Apartment Complex 40,371,100 0.35%
TowneBank Financial Institution 39,606,100 0.35% 36,527,400 Park 216 LLC Apartment Complex 36,896,600 0.32% 36,527,400
Lake Prince Center, Inc. Retirement Community 30,023,000 0.34%
Sysco Food Services of Hampton Roads Food Service Distribution 42,381,300 0.48% City of Norfolk Municipal Water System 55,690,600 0.63% Centerpoint Properties Trust Real Property Management 42,655,700 0.49%
Belleville Widow & Orphans Counseling Services 27,313,400 0.31%
Walmart Retail Merchandise 31,868,600 0.36%
Source: City of Suffolk Assessor's Office
Taxpayer
Personal Property
$ 615,777,500 4.48% 440,707,800 $ 5.02%
(1) Total Assessed Value (does not include public service corporations) $ 11,389,979,300 8,776,025,000 $
2022 2022
2013 2013
Percentage Percentage of Total City of Total City Taxable Taxable Taxable Taxable Assessed Assessed Assessed Assessed
Type of Business Value Value (2) Value Value (2)
Unilever/Lipton, Inc. Beverage Company $ 16,293,970 1.17% 10,581,750 $ 1.26%
Target Corporation Distribution Warehouse 11,262,880 0.81% 3,675,260 0.44% Planters/Kraft Foods Food Processing 11,023,370 0.79% 8,191,380 0.98%
QVC of Suffolk Inc. / CVN Distribution Distribution Warehouse 7,767,380 0.56% 7,411,720 0.88% Solenis LLC/BASF Corporation/CIBA Chemical Plant
6,775,780 0.49% 10,027,460 1.19%
Massimo Zanetti Beverage USA Beverage Company 6,169,270 0.44% 4,072,510 0.49%
Lockheed Martin Corporation Technology Company 6,036,830 0.43% 4,869,500 0.58%
JM Smucker Company Beverage Company 4,022,420 0.29% 5,311,820
Spectrum Southesast LLC/Charter Communications Cable Products 3,765,060 0.27% 2,631,190 0.31% Sysco Food Services of Hampton Roads Food Service Distribution 3,604,220 0.26% 3,840,920 0.46%
$ 76,721,180 5.52% 60,613,510 $ 7.22%
(2) Total Assessed Value (does not include public service corporations) $ 1,390,991,290 839,643,073 $
Source: City of Suffolk, Commissioner of Revenue's Office
CITY OF SUFFOLK, VIRGINIA Table 8
Taxpayer 153
CITY OF SUFFOLK, VIRGINIA
PROPERTY TAX LEVIES AND COLLECTIONS
LAST TEN FISCAL YEARS
Total Delinquent 2019 2020
2013 2017 2018 2021
Outstanding
As Total Delinquent Percent of Collections Taxes
Current Percent Delinquent Outstanding as a At End
Total Tax Tax of Levy Tax Delinquent Total Tax Percent of Fiscal Levy (1) Collections Collected Collections Taxes Collections (2) of the Levy Year (2)
116,106,208 $ 113,620,442 $ 97.86% 2,307,092 $ 55.20% 115,927,534 $ 99.85% 4,179,156 $ 121,016,827 118,482,416 97.91% 1,818,928 42.55% 120,301,344 99.41% 4,275,281 123,326,675 120,807,937 97.96% 1,919,984 45.51% 122,727,921 99.51% 4,218,636 131,208,221 128,655,899 98.05% 1,880,684 44.26% 130,536,583 99.49% 4,249,557 134,647,214 132,124,360 98.13% 1,856,687 43.57% 133,981,047 99.51% 4,261,779 137,308,853 134,243,292 97.77% 1,639,344 32.58% 135,882,636 98.96% 5,032,040 146,769,909 143,637,167 97.87% 2,796,009 60.97% 146,433,176 99.77% 4,585,660 150,738,427 147,518,704 97.86% 1,920,465 41.63% 149,439,169 99.14% 4,612,663 157,939,087 154,394,883 97.76% 3,010,123 59.28% 157,405,006 99.66% 5,077,608 170,525,879 166,849,227 97.84% 3,563,113 60.15% 170,412,340 99.93% 5,923,453
2022
Note A: Delinquent real property taxes not collected within three years, a lien is recorded on the property of the collection thereof. Collecitons in subsequent years represent delinquent accounts collected during the course of that fiscal year for all prior fiscal years.
Source: City Treasurer
2016 $-
(1) Beginning in the year ended June 30, 2000, the tax levy includes the Commonwealth's reimbursement. (2) Adjusted for collections through August 15.
Property Tax Levies and Collections
$160,000,000
$140,000,000
$120,000,000
$100,000,000
$80,000,000
$60,000,000
2014 2015 $20,000,000
$180,000,000 2013 2014 2015 2016 2017 2018 2019 2020 2021 2022
$40,000,000
Total Tax Levy Current Tax Collections 154
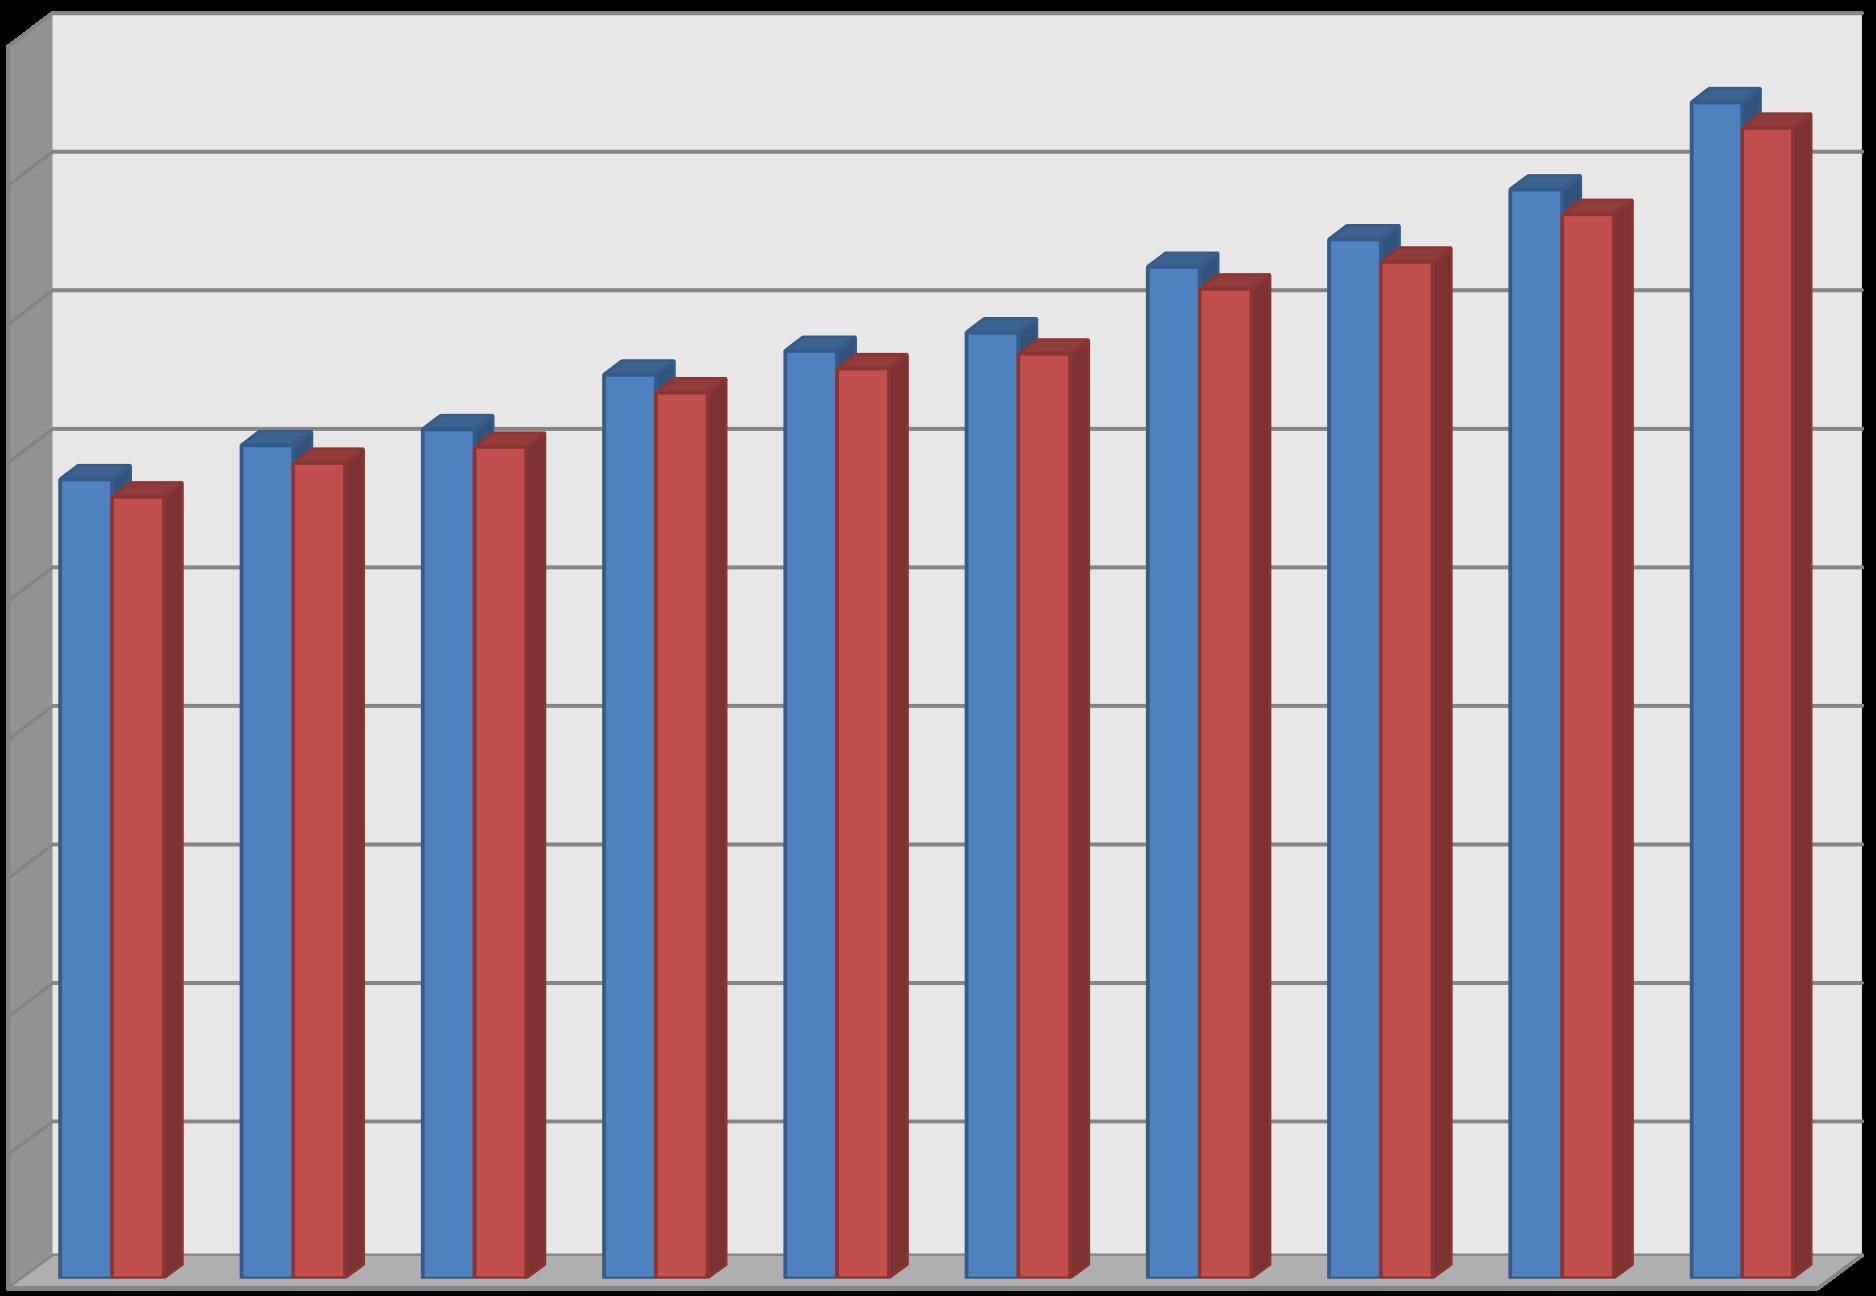
Table 9
Tax Collections Fiscal Year
PROPERTY VALUE AND CONSTRUCTION
LAST TEN FISCAL YEARS
Fiscal Number Number
Year of Permits Value of Permits Value Residential Commercial Agricultural Nontaxable Total
2013 146 75,601,465 $ 832 179,774,238 $ 6,813,160,700 $ 1,760,322,100 $ 797,698,900 $ 990,739,800 $ 10,361,921,500 $
2014 149 66,694,893 750 84,679,157 6,685,327,800 1,726,979,800 720,333,500 1,022,171,600 10,154,812,700
2015 173 75,494,303 694 86,837,291 6,649,577,300 1,938,055,900 679,129,400 1,016,443,600 10,283,206,200
2016 152 58,345,994 691 79,256,973 6,739,083,100 2,023,675,300 660,838,200 1,026,465,000 10,450,061,600
2017 158 160,651,157 914 95,043,903 6,868,962,400 2,065,945,200 657,047,900 1,077,730,700 10,669,686,200
2018 295 739,050,509 894 106,647,685 7,067,095,400 2,158,117,900 667,451,000 1,106,232,700 10,998,897,000
2019 256 58,233,219 866 108,747,841 7,337,983,600 2,203,841,700 669,354,500 1,107,389,400 11,318,569,200
2020 192 318,398,197 1,067 119,255,504 7,537,092,200 2,239,871,900 736,163,300 1,117,665,100 11,630,792,500
2021 166 79,712,825 1,644 359,505,429 7,912,235,000 2,387,318,000 724,789,300 1,103,723,400 12,128,065,700
2022 246 170,488,979 1,760 345,748,542 8,528,616,800 2,651,573,500 685,604,200 1,107,563,400 12,973,357,900
(1) Department of Planning and Community Development
(2) City Assessor's Office, estimated actual value (only residential, commercial, and Agricultural are reflected in Table 6) .
CITY OF SUFFOLK, VIRGINIA Table 10
Construction (1) Construction (1)
Real Property Value (2)
155
Commercial Residential Single Family Multi-Family $43,667,311 $
PRINCIPAL COMMERCIAL/INDUSTRIAL WATER AND SEWER CONSUMERS
YEAR ENDED JUNE 30, 2022
Annual % of Total Consumption Annual Water Consumers Type of Business (Hundred Cubic Feet) Consumption (1)
Western Tidewater Water Authority Regional Water Supply
280,106 10.56%
Sentara/Obici Hospital Hospital 33,107 1.25% Suffolk Public Schools Education 26,826 1.01%
JM Smucker Company Beverage Company 23,819 0.90% Wanchese Fish Company Seafood Processing 22,356 0.84%
Western Tidewater Regional Jail Jail-Regional Facility 18,862 0.71%
Harbour Breeze Apartments Real Property Management 16,964 0.64% Planters/Kraft Foods Food Processing 14,809 0.56% Unilvever/Lipton, Inc. Beverage Company 13,610 0.51% Suffolk Operations LLC Assisted Living 11,447 0.43% 461,906 17.41%
(1) Total annual consumption (all water customers) 2,652,990
Annual % of Total Consumption Annual Sewer Consumers
Type of Business (Hundred Cubic Feet) Consumption (2)
Sentara/Obici Hospital Hospital 33,107 1.54% City of Suffolk Water Production 27,264 1.27% Suffolk Public Schools Education 26,826 1.25% Wanchese Fish Company Seafood Processing 22,356 1.04% JM Smucker Company Beverage Company 20,491 0.95%
Western Tidewater Regional Jail Jail-Regional Facility 18,862 0.88%
Harbour Breeze Apartments Real Property Management 16,964 0.79% Unilever Best Foods Beverage Company 16,413 0.76% Suffolk Operations, LLC Assisted Living 11,447 0.53% Green Clean Auto Wash Car Wash 10,277 0.48% 204,007 9.49%
(2) Total annual consumption (all sewer customers) 2,149,600
Source: Department of Public Utilities
CITY OF SUFFOLK,
Table 11
VIRGINIA
156
WATER AND SEWER RATE SCHEDULE
LAST TEN FISCAL YEARS
WATER
Water Rate per 100 cubic feet
2013 2014 2015 2016 2017 2018 2019 2020 2021 2022
7.13 $ 7.84 $ 8.29 $ 8.86 $ 9.03 $ 9.20 $ 9.71 $ 9.71 $ 9.71 $ 10.31 $
Minimum Bi-monthly Charge (5 ccf) 33.65 - - - - - - - - -
Meter Service Charge (per month)
5/8 inch meter
Water Connection Charge (installed by city)
5/8 inch meter
2.40 5.35 6.40 7.00 8.40 8.40 10.00 11.25 11.25 12.75
1,100 1,100 1,100 1,100 2,000 2,000 2,000 2,000 2,000 2,000
Water Connection Charge (installed by developer) 50 50 50 50 50 50 50 50 50 50
Water Availability Charge (residential)
Single Family 5,520 5,520 5,520 5,520 5,520 5,520 5,520 5,520 5,520 5,520
Water Availability Charge (commercial)
5/8 inch meter 5,520 5,520 5,520 5,520 5,520 5,520 5,520 5,520 5,520 5,520
3/4 inch meter 8,180 8,180 5,520 5,520 5,520 5,520 5,520 5,520 5,520 5,520
1 inch meter 13,520 13,520 13,520 13,520 13,520 13,520 13,250 13,250 13,250 13,250
1½ inch meter 26,950 26,950 26,950 26,950 26,950 26,950 26,950 26,950 26,950 26,950
2 inch meter 43,120 43,120 43,120 43,120 43,120 43,120 43,120 43,120 43,120 43,120
3 inch meter 80,850 80,850 80,850 80,850 80,850 80,850 80,850 80,850 80,850 80,850
4 inch meter 134,750 134,750 134,750 134,750 134,750 134,750 134,750 134,750 134,750 134,750
WTWA Wholesale Water Rate
Water Rate (CCF) 4.13 $ 4.36 $ 4.46 $ 4.67 $ 4.56 $ 4.55 $ 4.76 $ 4.84 $ 4.84 $ 4.84 $
Fixed Capacity Charge (Per Month) 193,496 $ 204,641 $ 210,994 $ 204,959 $ 222,995 $ 202,454 $ 197,983 $ 199,026 $ 200,470 $ 200,470 $
SEWER
Sewer Collection (per 100 cubic feet) 5.35 5.82 6.47 6.74 6.97 7.21 7.27 7.27 7.27 7.27 Minimum Bi-monthly period (5 ccf) 26.75 - - - - - - - - -
Sewer Connection Charge (installed by city)
4 inch lateral size 1,450 1,450 1,450 1,450 1,800 1,800 1,800 1,800 1,800 1,800
6 inch lateral size 2,650 2,650 2,650 2,650 3,000 3,000 3,000 3,000 3,000 3,000
Sewer Connection Charge (installed by developer) 50 50 50 50 50 50 50 50 50 50
Sewer Availability Charge (residential)
Single Family 6,000 6,000 6,000 6,000 6,000 6,000 6,000 6,000 6,000 6,000
Sewer Availability Charge (commercial)
5/8 inch meter 6,000 6,000 6,000 6,000 6,000 6,000 6,000 6,000 6,000 6,000
3/4 inch meter 9,000 9,000 6,000 6,000 6,000 6,000 6,000 6,000 6,000 6,000
1 inch meter 14,800 14,800 14,800 14,800 14,800 14,800 14,800 14,800 14,800 14,800
1½ inch meter 29,500 29,500 29,500 29,500 29,500 29,500 29,500 29,500 29,500 29,500
2 inch meter 47,100 47,100 47,100 47,100 47,100 47,100 47,100 47,100 47,100 47,100
3 inch meter 88,100 88,100 88,100 88,100 88,100 88,100 88,100 88,100 88,100 88,100
4 inch meter 146,800 146,800 146,800 146,800 146,800 146,800 146,800 146,800 146,800 146,800
Source: Department of Public Utilities
CITY OF SUFFOLK, VIRGINIA Table 12
157
RATIO OF OUTSTANDING DEBT BY TYPE LAST TEN FISCAL YEARS*
General Bonded Debt (1) Fiscal Year **
a b c a+b+c+d e f General
Percentage of General Obligation Bonds Estimated Actual Section Obligation Bonds Business-type Literary Total General Taxable Value Per Lease 108 Loan General Gov't (2) activities Bonds Bonded Debt of Property (3) Capita (4) Liabilities (6) Payable
2016 2020 2019 2021
2017
214,236,652 $ 152,015,340 $ - $ 366,251,992 $ 3.91% 4,236 $ 5,388,859 $ 2,687,000 $ 234,108,838 182,234,124 - 416,342,962 4.56% 4,740 10,738,856 2,494,000 249,478,100 259,509,734 - 508,987,834 5.49% 5,795 11,537,472 2,301,000 259,928,278 253,567,653 - 513,495,931 5.45% 5,679 9,183,208 2,108,000 276,109,544 194,329,673 - 470,439,217 4.90% 5,129 6,163,199 1,915,000 286,010,859 191,436,465 - 477,447,324 4.84% 5,205 3,537,987 1,722,000 284,948,761 182,347,200 - 467,295,961 4.58% 5,050 2,057,108287,124,014 177,851,721 - 464,975,735 4.42% 5,015 1,487,534293,516,607 174,674,835 - 468,191,442 4.25% 4,930 1,283,236295,763,843 163,989,241 - 459,753,084 3.87% 4,783 21,644,960 -
2015 2015
Year**
(1) 2017
Business-Type Activities
2016 2021 2020 2019
Details regarding the City's outstanding debt can be found in the notes to the financial statements.
2013 2014 2022 GO Bonds include Utility GO Bonds (with or without an additional revenue pledge). They exclude the unamortized premiums and deferred amounts for advance refunding. This change required restating previous years' balances.
See Table 16 for personal income and population data. The most recent personal income data available from the Bureau of Economic Analysis is 2011 and is used to analyze years 2011 through 2013.
The subordinate GO bonds are "double-barreled", they have a revenue pledge, but are backed by the City's general obligation. They are presented under Business-type activities, but are actually included in the General Bonded Debt total.
*Previous years restated to include Utility GO bond debt in General bonded debt. ** Previous years restated to include the related premiums, discounts and adjustments.
2022 Fiscal 158
2,337,275 $ 151,375,536 $ 26,395,000 $ 222,312,511 $ 305,728,151 $ 528,040,662 $ 14.75% 6,107 $ 1,767,419 141,572,222 25,780,000 247,341,694 325,573,765 572,915,459 14.54% 6,523 1,432,958 81,143,931 25,150,000 263,316,572 342,086,622 605,403,195 14.45% 6,758 1,166,659 117,709,923 24,505,000 271,219,486 372,444,235 643,663,721 14.88% 7,118 987,740 199,345,172 23,840,000 284,187,743 394,662,585 678,850,327 15.11% 7,401 785,452 213,022,740 700,000 291,270,846 405,244,657 696,515,503 14.75% 7,527 562,671 210,667,350 - 287,005,869 393,577,221 680,583,090 13.75% 7,341 454,908 207,712,784 - 288,611,548 386,019,413 674,630,961 13.63% 7,190 411,085 223,268,539 - 294,799,843 398,354,459 693,154,302 14.68% 7,299 4,133,310 219,099,622 - 317,408,803 387,222,173 704,630,976 14.24% 7,330 (1) (2) (3) See Table 6 for estimated actual taxable value of property data. (4) (5) (6)
CITY OF SUFFOLK, VIRGINIA Table 13
g h i a+c+d+e+f
Senior Presentation only Total Total Percentage of Total Lease Revenue Subordinate: Governmental Business-type Grand Personal Per Liabilities (6) Bonds GO Bonds (5) Activities Activities Total Income (4) Capita (4)
b+g+h
Other Governmental Activities Debt 2018 2018 2013 2014
GASB 87 was implemented for leases in FY2022
LEGAL DEBT MARGIN
LAST TEN FISCAL YEARS
City's City's Commonwealth's
Legal Debt Margin Calculation Financial Policy Legal Legal Goal Debt Limit Debt Limit (1)
Assessed value (as of July 1 ) - taxable real 11,434,090,809 $ 11,434,090,809 $ 11,434,090,809 $ property, including public service corporations (2)
Adopted and Legal debt limits: 4% of assessed value (authorized limit adopted by City Council 2010) 457,363,632 $ 7% of assessed value (authorized limit imposed by City Charter) 800,386,357 $ 10% of assessed value (authorized by the Commonwealth for all cities) 1,143,409,081 $
Deduct amount of debt applicable to debt limit: Gross general bonded debt (includes bonds and notes payable) (4) 304,104,432 441,510,000 441,510,000 153,259,200 $ 358,876,357 $ 701,899,081 $ 2013 2014* 2015 2016 2017 2018 2019 2020 2021 2022
City's Legal Debt Margin
Debt Limit 616,369,533 $ 604,887,441 $ 618,127,104 $ 633,020,137 $ 649,037,842 $ 670,662,490 $ 686,137,955 $ 705,970,567 $ 741,754,101 $ 800,386,357 $
Total Net Debt Applicable to Limit* ** 351,784,115 ** 299,613,810 452,589,444 456,621,633 413,420,487 442,666,000 434,875,002 436,105,000 446,880,000 441,510,000 Legal Debt Margin 264,585,418 $ 305,273,631 $ 165,537,660 $ 176,398,504 $ 235,617,355 $ 227,996,490 $ 251,262,953 $ 269,865,567 $ 294,874,101 $ 358,876,357 $
Total Net Debt Applicable to Limit as percentage of Debt Limit 57.1% 49.5% 73.2% 72.1% 63.7% 66.0% 63.4% 61.8% 60.2% 55.2%
Commonwealth's Legal Debt Margin
Debt Limit 880,527,905 $ 864,124,915 $ 883,038,719 $ 904,314,482 $ 927,196,917 $ 958,089,271 $ 980,197,078 $ 1,008,529,382 $ 1,059,648,715 $ 1,143,409,081 $
Total Net Debt Applicable to Limit* ** 351,784,115 ** 299,613,810 ** 452,589,444 ** 456,621,633 ** 413,420,487 ** 442,666,000 ** 434,875,002 ** 436,105,000 ** 446,880,000 ** 441,510,000
Legal Debt Margin 528,743,790 $ 564,511,105 $ 430,449,275 $ 447,692,849 $ 513,776,430 $ 515,423,271 $ 545,322,076 $ 572,424,382 $ 612,768,715 $ 701,899,081 $
Total Net Debt Applicable to Limit as percentage of Debt Limit 40.0% 34.7% 51.3% 50.5% 44.6% 46.2% 44.4% 43.2% 42.2% 38.6%
Notes:
(1) (2) See Table 6 for assessed value of real property data. (3) There are no overlapping or underlying tax jurisdictions. (4)
Virginia state statute limits bond issuing authority of Virginia cities to 10% of the assessed real estate value. The above calculation includes all debt secured by the full faith and credit of the City (including Utility GO Bonds--with or without an additional revenue pledge, see table 13). Prior fiscal years have been restated in order to accommodate this determination. The calculation excludes the unamortized premiums and deferred amounts for advance refunding, installment purchase contracts, accrued sick and annual leave, landfill liability, and net pension and OPEB obligations.
The debt applicable to the City's financial policy limit is only the General Obligation bonds and leases that are payable with general government funds, Stormwater and Refuse funds (excluding Utility fund debt) and the General Obligation debt of the City's Economic Development Authority issued to fund the Health and Human Services Building.
*Previous years' general bonded debt has been restated to include Utility General Obligation debt. ** Previous years' Net debt applicable to the Limit has been restated to include the guarantee of SPSA debt for FY2011 - 2013.
CITY OF SUFFOLK, VIRGINIA Table 14
Fiscal Year
159
PLEDGE-REVENUE COVERAGE LAST TEN FISCAL YEARS
Net Revenue Direct Available
Fiscal Debt Service Requirements (3) Year 2015 2016 2017
Gross Operating For Debt Revenues (1) Expenses (2) Service Principal Interest Total Coverage (4)
UTILITY REVENUE BONDS (WATER AND SEWER) 38,796,061 $ 18,491,436 $ 20,304,625 $ 2,010,000 $ 8,814,174 $ 10,824,174 $ 1.88 39,711,399 19,718,299 19,993,100 2,070,000 8,317,701 10,387,701 1.92 41,928,618 19,255,373 22,673,245 2,135,000 5,385,232 7,520,232 3.01 48,200,503 23,090,668 25,109,835 1,135,000 5,158,290 6,293,290 3.99 49,516,030 21,945,068 27,570,962 1,240,000 6,226,515 7,466,515 3.69 50,195,913 21,952,124 28,243,789 1,820,000 8,398,014 10,218,014 2.76 54,500,177 25,205,851 29,294,326 2,230,000 9,061,412 11,291,412 2.59 53,256,705 25,665,502 27,591,203 2,001,000 8,043,368 10,044,368 2.75 62,511,014 25,746,183 36,764,831 4,597,000 7,853,326 12,450,326 2.95 59,243,844 23,752,023 35,491,821 5,725,000 7,282,489 13,007,489 2.73
2013 2022
2020 2019 2018
2014 2021
(1) Gross revenues include operating revenues, miscellaneous revenues, transfers in, interest income and BAB interest subsidy.
(2) Operating expenses are exclusive of depreciation, amortization, interest expense, debt issuance costs and loss on disposal of capital assets.
(3) Includes principal and interest of revenue debt that falls under the debt covenant requirements of the master indenture and other agreements. (Capitalized interest paid by bond proceeds is excluded from the interest) There were significant changes in debt service requirements from previous years because they now exclude GO-bonded debt.
(4) The debt service coverage ratio is calculated as Net Revenue Available for Debt Service divided by Total Debt Service Requirements (For the Utility fund the coverage must be over 1.15; since 2009, Suffolk's financial policy has recommended a target of 1.30, including all non-parity debt which has not been included in this analysis)
CITY OF SUFFOLK, VIRGINIA Table 15
160
DEMOGRAPHIC AND ECONOMIC STATISTICS
LAST TEN FISCAL YEARS
Unemployment Rate (4) Fiscal Year
2022
Personal Schools: Income (2) Per Capita Average Daily City of State of United Population (1) In Thousands Income (2)* Membership (3) Suffolk Virginia States 86,463 3,579,047 $ 41,749 $ 13,844 6.5% 5.8% 7.7% 87,831 3,940,083 45,390 13,739 6.4% 5.4% 6.3% 89,586 4,190,597 47,533 13,762 5.3% 5.0% 5.3% 90,426 4,326,809 48,467 13,837 4.3% 4.0% 5.1% 91,722 4,491,916 49,779 13,760 4.1% 3.6% 4.1% 92,533 4,723,202 51,798 13,630 3.1% 2.9% 3.6% 92,714 4,949,924 53,740 13,543 3.2% 2.9% 3.7% 93,825 5,217,894 55,561 13,308 8.8% 8.5% 11.2% 94,960 not available not available 13,357 5.0% 4.5% 5.9% 96,130 not available not available 12,934 4.4% 3.9% 5.3%
Sources: (1) Weldon Cooper Center for Public Service (2) Bureau of Economic Analysis based on calendar year (3) City of Suffolk Public Schools (4) Virginia Employment Commission - Area Unemployment Statistics, based on calendar year. 2021 rate as of June 2021
CITY OF SUFFOLK, VIRGINIA Table 16
2017 2015 2018 2019 2013 2016 2020 2021 2014
0.0% 2.0% 4.0% 6.0% 8.0% 10.0% 12.0% FY13 FY14 FY15 FY16 FY17 FY18 FY19 FY20 FY21 FY22
United
161
Comparative Unemployment Rates FY 2013 - FY 2022 City of Suffolk State of Virginia
States
PRINCIPAL EMPLOYERS
CURRENT YEAR AND NINE YEARS AGO
Employer
Percentage of Total City
Type of Business Employees Employment
Navy Information Dominance Forces Commands (Cyber Force) ModSim & Technology 2,250 6.54% Sentara Health Systems Medical 1,500 4.36% Target Warehousing & Distribution 1,500 4.36% CVN Distribution / QVC, Inc Warehousing & Distribution 700 2.04% Towne Bank Banking 600 1.74% J-7 Joint Staff ModSim & Techololgy 600 1.74% Wal-Mart Stores Retail 525 1.53% Hormel/Planters/Kraft Foods Food Processing 380 1.11% Massimo Zanetti Beverage USA Beverage Company 315 0.92% Sysco Food Services of Hampton Roads Food Service Distribution 300 0.87%
8,670 25.22%
Total Employment by Industry in City of Suffolk for fiscal year 34,384
2022 2013
Percentage of Total City Employer
Type of Business Employees Employment
U.S. Joint Forces Command ModSim & Technology
1,300 4.87% Obici Memorial Hospital Healthcare 1,200 4.50% CVN Distribution / QVC, Inc Distribution Warehouse 1,000 3.75%
Wal-Mart Stores Retail 900 3.37% SYSCO Food Services of Hampton Roads Education 500 1.87% Planters/Kraft Foods Food Processing 340 1.27% Unilever/Lipton Inc. Beverage Company 300 1.12% Lakeview Medical Center Health Care 270 1.01% Bon Secours Health System Health Care 270 1.01% Towne Bank Banking 230 0.86%
6,310 23.65%
Total Employment by Industry in City of Suffolk for fiscal year 26,681
The Suffolk Public Schools (2,300 employees) and the City of Suffolk (1,479 employees) have not been included to give a clearer reflection of community activity.
CITY OF SUFFOLK, VIRGINIA Table 17
Source: Economic Development Department and Virginia Employment Commission 162
FULL-TIME EQUIVALENT CITY GOVERNMENT EMPLOYEES BY FUNCTION/PROGRAM
FISCAL YEARS (2)
General Fund:
General Government: City Council 10 2 2 2 2 2 2 2 2 3 City Manager 7 7 7 7 7 7 7 7 7 8 Budget and Strategic Planning 3 4 4 3 3 3 3 3 3 3 City Attorney 9 9 9 9 9 9 9 9 9 9 Human Resources 10 10 10 7 7 7 7 7 7 10
Commissioner of the Revenue 12 12 12 12 12 12 12 12 12 13 City Assessor 15 16 17 17 18 17 17 19 19 21 Treasurer 15 15 15 16 16 16 16 17 17 17
Finance - Administration and Accounting 12 14 16 17 15 16 15 15 15 16 Finance - Purchasing 3 4 4 4 4 4 4 4 4 4 Registrar 2 2 2 2 3 3 3 3 3 3 Total 98 95 98 96 96 96 95 98 98 107
Judicial: Circuit Court 2 2 2 2 2 2 2 2 2 2 Circuit Court - Clerk's Office 14 14 14 14 14 14 14 15 15 15 Sheriff 24 25 25 25 25 25 25 25 25 27 Commonwealth's Attorney 24 24 24 24 24 24 25 26 26 26 Total 64 65 65 65 65 65 66 68 68 70
Public Safety:
Police Administration and Officers 196 214 213 213 213 215 216 227 227 229 Emergency Communications 24 27 27 27 27 28 27 29 29 29 Animal Shelter and Management 8 10 10 10 10 10 10 10 10 10 Fire Fire and Rescue 238 253 252 252 252 255 274 274 279 297 Community Development (5) 26 26 26 26 26 26 - - -Total 492 530 528 528 528 534 527 540 545 565
Public Works: Public Works Administration 2 2 2 2 2 2 2 3 3 3 Maintenance Building and Grounds (3) 4 4 - - - - - - -Capital Programs and Facilities 23 24 24 24 24 24 24 25 25 25 Total 29 30 26 26 26 26 26 28 28 28
CITY OF SUFFOLK, VIRGINIA TABLE 18
LAST TEN
2013 2014 2015 2016 2017 2018 2019 2020 2021 2022
(continued) Function/Program 163
General Fund: Health and Welfare: Social Services 100 103 103 103 103 103 102 102 102 102 Comprehensive Services Act 2 2 2 2 2 2 2 2 2 2 Total 102 105 105 105 105 105 104 104 104 104
Parks, Recreation and Cultural: Parks and Recreation Administration 5 5 4 4 4 4 13 13 13 13 Office on Youth (4) - - 2 2 1 1 - - -Support Services (4) 6 6 6 6 7 7 - - -Parks, Gateway and Facility Maintenance 19 19 19 19 19 18 22 22 22 22 Grounds Maintenance (3) (4) - - 4 4 4 4 - - -Recreation 16 22 21 21 21 22 22 22 22 29 Library 28 31 31 31 32 32 32 32 32 33 Total 74 83 87 87 88 88 89 89 89 97
Community Development: Planning 13 14 14 14 15 15 41 44 44 46 Geographic Information Systems - - - - - - - - -Economic Development 5 5 5 5 5 5 5 6 6 6 Tourism 3 3 3 3 3 3 3 3 3 3 Media and Community Relations 6 6 6 6 6 6 6 6 6 6 Total 27 28 28 28 29 29 55 59 59 61
Total General Fund 886 936 937 935 937 943 962 986 991 1,032
Special Revenue Fund: Transit - - - - - 1 1 1 1 1 Road Maintenance Road Maintenance 84 101 99 100 101 102 102 102 102 105 Traffic Engineering 21 23 23 24 25 25 25 25 25 26 Aviation Facilities 3 3 3 3 3 3 3 3 2 2
Total Special Revenue Fund 108 127 125 127 129 131 131 131 130 134
Enterprise Fund: Public Utilities Administration 7 8 9 9 9 8 8 8 8 7 Customer Service 18 18 18 20 22 23 23 23 23 23 Line Maintenance 25 26 27 28 28 28 29 29 29 30 Maintenance 24 26 25 25 25 25 25 26 26 26 Water Production 30 30 30 28 28 28 28 28 28 28 Engineering 15 15 15 15 14 14 14 14 14 14
Stormwater Utility Stormwater Utility 27 31 38 38 41 40 40 41 41 41 Mosquito Control 6 7 7 7 7 7 7 7 7 7 Refuse 36 41 40 40 40 42 42 40 40 40
Total Enterprise Fund 188 202 209 210 214 215 216 216 216 216
Internal Service Funds: Fleet Management 20 21 21 21 21 21 21 21 21 21 Information Technology 22 25 25 25 26 26 26 27 28 29 Risk Management 4 4 4 6 6 6 6 6 6 8
Total Risk Management 46 50 50 52 53 53 53 54 55 58
Total 1,228 1,315 1,321 1,324 1,333 1,342 1,362 1,387 1,392 1,440
1. Change in methodology of calculating full time employees in this department.
2. 2013 actual data furnished by Human Resources. 2014 - 2019 provided by Budget Office.
3. In 2015 The grounds maintenance function was moved out of Public Works and placed in Parks and Recreation.
4. In 2019 The divisions within Parks and Recreation were consolidated into 3 divisions.
5. In 2019 Community Development was combined with the Planning department.
CITY OF SUFFOLK, VIRGINIA
Table 18 (continued) LAST TEN FISCAL YEARS
FULL-TIME EQUIVALENT CITY GOVERNMENT EMPLOYEES BY FUNCTION/PROGRAM
2013 2014 2015 2016 2017 2018 2019 2020 2021 2022
Function/Program 164
OPERATING INDICATORS BY FUNCTION/PROGRAM
LAST TEN FISCAL YEARS
Function/Program 2013 2014 2015 2016 2017 2018 2019 2020 2021 2022
General Government:
Building permits issued 978 899 867 843 1,072 1,189 1,122 1,259 1,810 2,006
Value of permits issued (millions) 255.4$ 151.4$ 162.3$ 137.6$ 255.7$ 845.7$ 167.0$ 437.7$ 439.2$ 516.2$
Number of registered voters 57,067 57,280 56,268 58,141 60,652 62,458 62,334 64,780 67,706 69,886
Taxable retail sales (millions) 729.6$ 759.9$ 821.3$ 873.0$ 895.5$ 956.9$ 976.1$ 1,033.1$ 1,154.8$ **Not Available
Taxable retail sales per capita 8,307$ 8,404$ 9,083$ 9,654$ 9,763$ 10,341$ 10,404$ 10,879$ 12,013$ **Not Available
Parks, Recreation and Cultural:
Library volumes in collection (thousands) 222.1 224.9 286.8 827.1 291.2 178.0 168.3 133.2 133.2 143.4 Circulation (thousands) 313 320 335 339 322 303.5 304.0 223.0 216.0 345.7
Transit
Number of Service days (not including ADA service) 254 252 253 257 257 252 305 308 306 305
Number of Routes (not including ADA service) 3 4 6 6 6 6 7 7 6 6
Vehicle Trips (not including ADA service) 7,221 8,885 13,004 13,856 13,825 13,589 18,602 18,791 18,663 19,979 (1)
Passenger Trips (not including ADA service) 57,814 64,563 77,631 101,616 113,084 110,569 128,845 111,114 106,739 73,369 (2)
Vehicle Trips (ADA Service) 693 757 1,081 1,271 1,450 1,025 1,565 1,919 1,605 1,738 (1)
Passenger Trips (ADA Serivce) 1,198 1,152 1,353 1,537 1,917 1,247 1,565 1,919 1,919 1,897 (2)
Enterprise Fund:
Public Utilities
Customers - Water 24,380 24,836 24,912 24,868 25,237 25,576 25,936 25,952 27,037 27,550 Customers - Sewer 20,692 21,010 21,486 21,770 22,160 22,506 22,851 23,272 23,865 24,350
Average daily production (mgd) 5.96 6.71 6.82 6.77 6.88 6.86 6.58 6.84 7 7.26
Treatment Capacity daily (mgd) 17.45 17.45 17.45 17.45 17.45 17.45 17.45 17.45 17.45 17.45
Stormwater
Billed customers 30,508 30,791 31,395 31,470 31,752 32,126 32,866 33,179 33,652 34,188
Refuse collection
Customers 27,675 27,982 28,046 28,311 28,618 28,895 29,409 29,720 30,040 30,493 Recycled (tons) 5,408 5,767 5,534 5,878 5,821 5,511 5,842 6,075 6,085 5,472
Sources: Various City Departments ** Data is not availabe as this is shown on a calendar year basis
(1) A vehicle trip is defined as a bus completing the route one time.
(2) A Passenger trip is defined as a passenger boarding a bus at one point and disembarking at another. A passenger taking a trip with a transfer in the middle would count as two passenger trips.
CITY OF SUFFOLK, VIRGINIA Table 19
165
CAPITAL ASSET STATISTICS BY FUNCTION/PROGRAM
LAST TEN FISCAL YEARS
Function/Program 2013 2014 2015 2016 2017 2018 2019 2020 2021 2022
Public Safety: Police Stations 5 5 5 5 5 5 5 5 5 5 Fire and Rescue Stations 10 10 10 10 10 10 10 10 10 9
Public Works:
State maintained road miles 18 18 18 18 18 18 18 18 18 18 City maintained road miles 1,600 1,626 1,626 1,596 1,621 1,632 1,650 1,660 1,660 1,669 Streetlights 8,113 8,425 8,593 8,657 8,913 8,988 9,136 9,217 9,288 9,571 Bridges and Culverts 155 147 150 149 151 151 151 152 151 151 Traffic Signals 93 98 96 98 99 99 100 100 101 102
Education:
Elementary Schools 12 12 12 12 11 11 11 11 11 11 Middle Schools 4 4 4 4 4 4 4 4 4 4 High Schools 3 3 3 3 3 3 3 3 3 3 Alternative Schools 1 1 1 1 1 1 1 1 1 1
Number of Teachers, Principals, and Assistants 1,402 1,398 1,345 1,383 1,380 1,380 1,464 1,410 1,422 1,444 Average Daily Membership 13,844 13,739 13,762 13,837 13,760 13,630 13,543 13,308 13,357 12,934 Capacity of Schools 14,352 14,352 14,590 14,590 14,205 14,205 16,005 16,005 16,005 16,005
Enterprise Fund: Public Utilities
Miles of Water Main 454 462 467 475 482 486 487 490 497 501 Miles of Sanitary Sewers 330 334 344 352 355 361 363 367 375 378 Pump Stations 140 140 144 146 147 150 150 152 154 154 Storage Tanks 9 10 10 10 10 10 10 11 11 11 Stormwater Utility Miles of Storm Sewers 266 246 294 333 396 407 412 420 428 433
Parks, Recreation and Cultural: Parks and Recreation
Number of major parks and recreation facilties 43 43 50 50 50 52 52 52 54 56 Acreage of major parks and recreation facilties 1,928 1,879 2,031 2,042 2,092 2,118 2,118 2,118 2,111 2,216 Library
Number of libraries 1 1 1 1 1 1 1 1 1 1
Number of branch libraries 2 2 3 3 3 3 3 3 3 3 Number of bookmobiles 1 1 1 1 1 1 1 1 1 1
Transit (1)
Buses 4 4 6 8 9 9 10 14 14 12 Bus Stops with Shelters 4 6 8 8 8 10 11 11 10 16
Sources: Various City Departments
1. In Fiscal year 2015 The City added a route serving the northern end of the City and one that connects the north and south routes, as well as to HRT in Chesapeake.
CITY OF SUFFOLK, VIRGINIA Table 20
166
COMPLIANCE SECTION
Report of Independent Auditor on Internal Control over Financial Reporting and on Compliance and Other Matters Based on an Audit of Financial Statements Performed in Accordance with Government Auditing Standards
To the City Council City of Suffolk, Virginia
We have audited, in accordance with the auditing standards generally accepted in the United States of America, the standards applicable to financial audits contained in Government Auditing Standards issued by the Comptroller General of the United States, and the Specifications for Audits of Counties, Cities, and Towns issued by the Auditor of Public Accounts of the Commonwealth of Virginia (the “Specifications”), the financial statements of the governmental activities, the business-type activities, the aggregate discretely presented component units, each major fund, and the aggregate remaining fund information of the City of Suffolk, Virginia (the “City”), as of and for the year ended June 30, 2022, and the related notes to the financial statements, which collectively comprise the City’s basic financial statements, and have issued our report thereon dated November 23, 2022. That report recognizes that the City restated certain net position, capital assets, and liability amounts due to the implementation of a new accounting standard, effective July 1, 2021.
Report on Internal Control over Financial Reporting
In planning and performing our audit of the financial statements, we considered the City’s internal control over financial reporting (“internal control”) as a basis for designing audit procedures that are appropriate in the circumstances for the purpose of expressing our opinions on the financial statements, but not for the purpose of expressing an opinion on the effectiveness of the City’s internal control. Accordingly, we do not express an opinion on the effectiveness of the City’s internal control.
A deficiency in internal control exists when the design or operation of a control does not allow management or employees, in the normal course of performing their assigned functions, to prevent, or detect and correct, misstatements on a timely basis. A material weakness is a deficiency, or a combination of deficiencies, in internal control such that there is a reasonable possibility that a material misstatement of the entity’s financial statements will not be prevented, or detected and corrected, on a timely basis. A significant deficiency is a deficiency, or a combination of deficiencies, in internal control that is less severe than a material weakness, yet important enough to merit attention by those charged with governance.
Our consideration of internal control was for the limited purpose described in the first paragraph of this section and was not designed to identify all deficiencies in internal control that might be material weaknesses, or significant deficiencies. Given these limitations, during our audit we did not identify any deficiencies in internal control that we consider to be material weaknesses. However, material weaknesses or significant deficiencies may exist that were not identified.
Report on Compliance and Other Matters
As part of obtaining reasonable assurance about whether the City’s financial statements are free from material misstatement, we performed tests of its compliance with certain provisions of laws, regulations, contracts, and grant agreements, noncompliance with which could have a direct and material effect on the financial statements. However, providing an opinion on compliance with those provisions was not an objective of our audit and, accordingly, we do not express such an opinion. The results of our tests disclosed no instances of noncompliance or other matters that are required to be reported under Government Auditing Standards. and two instances of noncompliance that are required to be reported under the Specifications, which are described in the accompanying schedule of findings and questioned costs as items 2022-001 and 2022-002.
cbh.com
167
City’s Response to Findings
Government Auditing Standards requires the auditor to perform limited procedures on the City’s response to findings identified in our audit and described in the accompanying schedule of findings and questioned costs. The City’s responses were not subjected to the other auditing procedures applied in the audit of the financial statements and, accordingly, we express no opinion on the responses.
Purpose of this Report
The purpose of this report is solely to describe the scope of our testing of internal control and compliance and the results of that testing, and not to provide an opinion on the effectiveness of the entity’s internal control or on compliance. This report is an integral part of an audit performed in accordance with Government Auditing Standards in considering the entity’s internal control and compliance. Accordingly, this communication is not suitable for any other purpose.
Virginia Beach, Virginia
November 23, 2022
168
Report of Independent Auditor on Compliance for Each Major Federal Program and on Internal Control over Compliance Required by the Uniform Guidance
To the City Council City of Suffolk, Virginia
Report on Compliance for Each Major Federal Program
Opinion on Each Major Federal Program
We have audited the City of Suffolk, Virginia’s (the “City”) compliance with the types of compliance requirements identified as subject to audit in the OMB Compliance Supplement that could have a direct and material effect on each of the City’s major federal programs for the year ended June 30, 2022. The City’s major federal programs are identified in the summary of auditor’s results section of the accompanying Schedule of Findings and Questioned Costs.
In our opinion, the City complied, in all material respects, with the types of compliance requirements referred to above that could have a direct and material effect on each of its major federal programs for the year ended June 30, 2022.
Basis for Opinion on Each Major Federal Program
We conducted our audit of compliance in accordance with auditing standards generally accepted in the United States of America; the standards applicable to financial audits contained in Government Auditing Standards, issued by the Comptroller General of the United States; and the audit requirements of Title 2 U.S. Code of Federal Regulations Part 200, Uniform Administrative Requirements, Cost Principles, and Audit Requirements for Federal Awards (“Uniform Guidance”). Our responsibilities under those standards and the Uniform Guidance are further described in the Auditor’s Responsibilities for the Audit of Compliance section of our report.
We are required to be independent of the City and to meet our other ethical responsibilities, in accordance with relevant ethical requirements relating to our audit. We believe that the audit evidence we have obtained is sufficient and appropriate to provide a basis for our opinion on compliance for each major federal program. Our audit does not provide a legal determination of the City’s compliance with the compliance requirements referred to above.
Responsibilities of Management for Compliance
Management is responsible for compliance with the requirements referred to above and for the design, implementation, and maintenance of effective internal control over compliance with the requirements of laws, statutes, regulations, rules, and provisions of contracts or grant agreements applicable to City’s federal programs.
Auditor’s Responsibilities for the Audit of Compliance
Our objectives are to obtain reasonable assurance about whether material noncompliance with the compliance requirements referred to above occurred, whether due to fraud or error, and express an opinion on City’s compliance based on our audit. Reasonable assurance is a high level of assurance but is not absolute assurance and, therefore, is not a guarantee that an audit conducted in accordance with generally accepted auditing standards, Government Auditing Standards, and the Uniform Guidance will always detect material noncompliance when it exists. The risk of not detecting material noncompliance resulting from fraud is higher than for that resulting from error, as fraud may involve collusion, forgery, intentional omissions, misrepresentations, or the override of internal control. Noncompliance with the compliance requirements referred to above is considered material if there is a substantial likelihood that, individually or in the aggregate, it would influence the judgment made by a reasonable user of the report on compliance about City’s compliance with the requirements of each major federal program as a whole.
cbh.com
169
In performing an audit in accordance with generally accepted auditing standards, Government Auditing Standards, and the Uniform Guidance, we:
Exercise professional judgment and maintain professional skepticism throughout the audit.
Identify and assess the risks of material noncompliance, whether due to fraud or error, and design and perform audit procedures responsive to those risks. Such procedures include examining, on a test basis, evidence regarding City’s compliance with the compliance requirements referred to above and performing such other procedures as we considered necessary in the circumstances.
Obtain an understanding of City’s internal control over compliance relevant to the audit in order to design audit procedures that are appropriate in the circumstances and to test and report on internal control over compliance in accordance with the Uniform Guidance, but not for the purpose of expressing an opinion on the effectiveness of City’s internal control over compliance. Accordingly, no such opinion is expressed.
We are required to communicate with those charged with governance regarding, among other matters, the planned scope and timing of the audit and any significant deficiencies and material weaknesses in internal control over compliance that we identified during the audit.
Report on Internal Control over Compliance
A deficiency in internal control over compliance exists when the design or operation of a control over compliance does not allow management or employees, in the normal course of performing their assigned functions, to prevent, or detect and correct, noncompliance with a type of compliance requirement of a federal program on a timely basis. A material weakness in internal control over compliance is a deficiency, or combination of deficiencies, in internal control over compliance, such that there is a reasonable possibility that material noncompliance with a type of compliance requirement of a federal program will not be prevented, or detected and corrected, on a timely basis. A significant deficiency in internal control over compliance is a deficiency, or a combination of deficiencies, in internal control over compliance with a type of compliance requirement of a federal program that is less severe than a material weakness in internal control over compliance, yet important enough to merit attention by those charged with governance.
Our consideration of internal control over compliance was for the limited purpose described in the Auditor’s Responsibilities for the Audit of Compliance section above and was not designed to identify all deficiencies in internal control over compliance that might be material weaknesses or significant deficiencies in internal control over compliance. Given these limitations, during our audit we did not identify any deficiencies in internal control over compliance that we consider to be material weaknesses, as defined above. However, material weaknesses or significant deficiencies in internal control over compliance may exist that were not identified.
Our audit was not designed for the purpose of expressing an opinion on the effectiveness of internal control over compliance. Accordingly, no such opinion is expressed.
The purposed of this report on internal control over compliance is solely to describe the scope of our testing of internal control over compliance and the results of that testing based on the requirements of the Uniform Guidance. Accordingly, this report is not suitable for any other purpose.
Virginia Beach, Virginia
November 23, 2022
170
CITY OF SUFFOLK, VIRGINIA SCHEDULE OF EXPENDITURES OF FEDERAL AWARDS Year Period Ending June 30, 2022
Assistance Passed Listing Through To Cluster ALN Federal Department
Grant Numbers Number (ALN) Sub-Recipients Total Total Expenditures Totals
Federal Grantor/Pass-Through Grantor/Grant Program
U.S. Department of Agriculture
Passed Through Commonwealth of Virginia: Department of Agriculture and Department of Education Child Nutrition Cluster
School Breakfast Program (SBP) 10.553 2,561,840 $ 2,561,840 $ National School Lunch Program (NSLP) 10.555 6,822,663 6,822,663 59047
Summer Food Service Program for Children (SFSP) 10.559 197,224 197,224 Total Child Nutrition Cluster 9,581,727 $
Child & Adult Food Program 10.558 66,256 66,256
Pandemic EBT Administrative Costs 10.649 5,814 5,814
Department of Social Services
SNAP Cluster
State Administrative Matching Grants for Supplemental Nutrition Assistance 10.561 1,702,666 1,702,666 Total SNAP Cluster 1,702,666 Total U.S. Department of Agriculture 11,356,463 $
U.S. Department of Defense Direct Program: JROTC Instruction 12.000 119,402 $ 119,402 $ Total U.S. Department of Defense 119,402 $
U.S. Department of Housing and Urban Development Direct Program: CDBG - Entitlement Grants Cluster
B11MC510024, B12MC510024, B13MC510024, B14MC510024, B15MC510024, B16MC510024
Community Development Block Grants/Entitlement Grants 14.218 487,439 $ 487,439 $ Total CDBG - Entitlement Grants Cluster 487,439 $ B17MC510024
ForKids 259,497 $ SRHA Emergency Repair 156,180
The Genieve Shelter 35,762
Western Tidewater Clinic 22,000 Boys & Girls Club of Southeastern VA 14,000 M11DC510213, M12DC510213, M13DC510213, M14DC510213, M15MC510024, M16DC510216, M07DC512013, M08DC510213, M09DC510213, M10DC51010206, M17DC510216
Home Investment Partnerships Program 14.239 269,322 269,322 City of Franklin 37,551
Isle of Wight County 68,624 Southampton County 44,133 CHDO 119,014
Total U.S. Department of Housing and Urban Development 756,761 $
U.S. Department of Justice Direct Program: Bullet Proof Vest Partnership Program 16.607 15,765 $ 15,765 $
Passed Through Department of Criminal Justice Services
Crime Victim Assistance 16.575 322,183 322,183 16-R9824VA15, 17-R9824VA16, 18-U9824VA17,
17-V8580VW16, 19-Y8580VW17
Violence Against Women Formula Grants 16.588 111,509 111,509 COPs Grant 16.710 167,724 167,724 2016-DJ-BX-0413, 2017-DJ-BX-0141, 17-A6095AD13, 17-B3197AD13, 16A3276BY11, 18-C3197AD11, 18-A4241AD11, 18-B6905AD15, 18A4497AD12, 2018-DJ-BX-0411, 19-B4241AD15, 20-DJ-BX-0482, 20A4932AD16
Edward Byrne Memorial Justice Assistance Grant Program 16.738 62,981 62,981
Equitable Sharing Program 16.922 5,748 5,748 COVD19 Emergency Supplemental Funding Program
2020 COVID-19 Emergency Suppmental Funding Program 16.034 4,414 4,414
Total U.S. Department of Justice 690,324 $
171
CITY OF SUFFOLK, VIRGINIA SCHEDULE OF EXPENDITURES OF FEDERAL AWARDS Year Period Ending June 30, 2022
Assistance Passed
Listing Through To Cluster ALN Federal Department Grant Numbers Number (ALN) Sub-Recipients Total Total Expenditures Totals
3-51-0050-024-2015, 3-51-0050-022-2015, 3-51-0050-025-0216, 3-51-005026-2016
Federal Grantor/Pass-Through Grantor/Grant Program
U.S. Department of Transportation Direct Program:
Airport Improvement Program 20.106 69,862 $ 69,862 $ 154AL-2016-56196-6396, 154AL-2016-56425-6630, 15AL-2017-570876736, 15AL-2017-57146-6795, 154AL-2018-58207-8207
M2HVE-2017-56206-6745, M2HVE-2018-58205-8205
Hghway Safety Grant - Selective Enforcement - Alcohol 20.607 10,157
Hghway Safety Grant - Selective Enforcement - Speed 20.607 21,547 11,390 Highway Safety Cluster
Hghway Safety Grant - Selective Enforcement - Occupant Protec 20.616 1,721 1,721 Highway Safety Grant Cluster Total 1,721 $
Federal Transit Cluster
Federal Transit - Capital Investment Grants 20.507 1,634,574 $ 1,634,574 $ State of Good Repair Grants Program 20.526 144,171 144,171
Total Federal Transit Cluster 1,778,745 $
Metropolitan Transportation Planning and State and 20.505 9,000 9,000 Non-Metropolitan Planning and Research
Highway Planning and Construction Cluster
Passed Through Commonwealth of Virginia: Highway Planning and Construction 0017-133-350
U000-133-S22
U000-133-S23
U000-133-S24
U000-133-351
U000-133-427
S041B-2015-5303
V048A150046
S367A150044
S010A150046
H027A150107
H173A150112
CMAQ Bridge Road Traffic Signal Upgrades UPC #102991 20.205 543,554
Elwood Road Over Kingsdale Swamp 20.205 90,035
HSIP Portsmouth Boulevard Sidewalk, Phase I UPC #1109 20.205 84,620
HSIP Portsmouth Boulevard Sidewalk, Phase II UPC #1109 20.205 351,715
HSIP Portsmouth Boulevard Sidewalk, Phase III UPC #111 20.205 107,443
CMAQ Nansemond Pkwy Traffic Signal Upgrades #102990 20.205 1,766
CMAQ Emergency Vehicle Preemption Deployment #11382 20.205
CMAQ Nansemond Pkwy/Wilroy Road Overpass UPC #110 20.205 1,854,746
Suffolk Bypass ITS UPC 102994 Project 2200 20.205 7,183
Shoulders Hill Road UPC 102992 Project 2222 20.205 60,782
West End Suffolk UPC 107057 20.205 3,103,464 1,620
Highway Planning and Construction Cluster 3,103,464
Total U.S. Department of Transportation 4,984,339 $
U.S. Department of Treasury
Passed Through Virginia Department of Accounts CARES Act 21.019 6,176,643 $ 6,176,643 $ AARPA 21.027 6,768,336 HVAC ARP CSLFRF 21.027 7,768,336 1,000,000
Total U.S. Department of Treasury 13,944,979 $
National Foundation on the Arts and Humanities
Pass Through Commonwealth of Virginia-Library Grants to States 45.310 23,331 $ 23,331 $
Total National Foundation on the Arts and Humanities 23,331 $
U.S. Department of Education
Direct Program:
Impact Aid Award #S041B-2015-5303 84.041 336,594 $ 336,594 $
Passed Through Commonwealth of Virginia:
Career and Technical-Basic Grants to States #V048A150046 84.048 202,518 202,518
Title II-A #S367A150044 84.367 523,621 523,621
Title IV-A Grant 84.424 284,982 284,982
Title IV-B Grant 84.287 47,813 47,813
Cares Act 84.425 163,560
Cares Act II 84.425D 2,380,014
Cares Act III 84.425U 3,208,649
ESSER/GEER 84.425 6,081,963 329,740
School Based Mental Health Grant 84.184 15,518 15,518
Title I Grants to Local Educational Agencies #S010A150046 84.010 3,767,241 3,767,241
Special Education Cluster (IDEA)
Special Education - Grants to States #H027A150107 84.027 2,927,796 2,927,796
Special Education - Preschool Grants #H173A150112 84.173 64,620 64,620 Special Education Cluster Total 2,992,416 $
School Improvement Grants Cluster School Improvement Grants 84.377 7,733 7,733
Total U.S. Department of Education 14,260,399 $
172
CITY OF SUFFOLK, VIRGINIA SCHEDULE OF EXPENDITURES OF FEDERAL AWARDS Year Period Ending June 30, 2022
Assistance Passed Listing Through To Cluster ALN Federal Department
Grant Numbers Number (ALN) Sub-Recipients Total Total Expenditures Totals
1003996083
Federal Grantor/Pass-Through Grantor/Grant Program
U.S. Department of Health and Human Services
Direct Payments:
Medical Assistance Program #1003996083 93.778 423,731 $ Epidemiology 93.323 15,657 $ 15,657
Passed Through Commonwealth of Virginia: Medicaid Cluster
Medical Assistance Program 93.778 1,306,816 883,085
Medicaid Cluster Total 1,306,816 $
Guardianship Assistance 93.090 422 422
Title IV -E Precention Program 93.472 12,677 12,677
Promoting Safe and Stable Families 93.556 10,433 10,433
Temporary Assistance for Needy Families 93.558 693,045 693,045
Refugee & Entrant Assistance 93.566 3,517 3,517
Low-Income Home Energy Assistance 93.568 129,929 129,929
Community-Based Child Abuse Prevention Grants 93.590 931 931
Child Welfare Services 93.645 1,575 1,575
Foster Care - Title IV-E 93.658 698,358 698,358
Adoption Assistance 93.659 259,413 259,413
Social Service Block Grant 93.667 690,463 690,463
Foster Care Independent Living 93.674 8,363 8,363
Children's Health Insurance Program 93.767 9,157 9,157
CCDF Cluster
Child Care and Development Block Grant 93.575 (3,961) (3,961)
Child Care Mandatory & Matching Funds for Child Care Dev Fun 93.596 158,930 158,930
CCDF Cluster Total 154,969
Total U.S. Department of Health and Human Services 3,995,725 $
Executive Office of the President
Passed Through Virginia HIDTA:
High Intensity Drug Trafficking Areas Program 95.001 14,170 $ 14,170 $
Total Executive Office of the President 14,170 $
U.S. Department of Homeland Security
Passed Through Department of Criminal Justice: EMW-2015-PU-00181, EMV-2016-PU-00147
Port Security Grant Program 97.056 345,126 $ 345,126 $
Passed Through Department of Emergency Services: 2017LEMPG, 2018 Radiological Prepardness Program, VDEM VDEM Emergency Mgmt Program Grant 97.042 21,781 21,781
Total U.S. Department of Homeland Security 366,907 $
Grand Total 50,512,800 $ 50,512,800 $
Note 1: Basis of Accounting
This Schedule was prepared on the modified accrual basis of accounting.
Note 2: Nonmonetary Assistance:
Nonmonetary assistance is reported in the Schedule of Federal Awards at the fair market value of the food commodities.
At June 30, 2022, the School Board had USDA food commodities totaling $149,261 in inventory.
Note 3: Reporting Entity:
The Schedule of Expenditures of Federal Awards reports the expenditures for the City of Suffolk, Virginia and it's component unit the School Board.
Note 4: De minimis cost rate:
The City did not elect to use the 10% de minimis cost rate.
173
CITY OF SUFFOLK, VIRGINIA
Schedule of Findings and Questioned Costs
Year ended June 30, 2022
A. Summary of Auditor’s Results
1. The type of report issued on the basic financial statements: Unmodified
2. Significant deficiencies in internal control over financial reporting: None reported
3. Material weaknesses in internal control over financial reporting: No
4. Noncompliance, which is material to the financial statements: No
5. Significant deficiencies in internal control over major programs: None reported
6. Material weaknesses in internal control over major programs: No
7. The type of report issued on compliance for major programs: Unmodified
8. Any audit findings which are required to be reported under Uniform Grant Guidance: No
9. The programs tested as major programs were:
CFDA Number Name of Federal Program or Cluster 84.425 Education Stabilization Fund 21.027 Coronavirus State and Local Fiscal Recovery Funds 10.553/10.555/10.559 Child Nutrition Cluster 20.205-1CL Highway Planning and Construction Cluster 20.507/20.526 Federal Transit Cluster
10. Dollar threshold used to distinguish between type A and type B programs: $1,515,384
11. City of Suffolk, Virginia (the “City”) qualified as a low-risk auditee under Uniform Grant Guidance: Yes
B. Findings Relating to Financial Statements Reported in Accordance with Government Auditing Standards
None reported
C. Findings and Questioned Costs Relating to Federal Awards
None reported
D. Findings and Questioned Costs Relating to Compliance with Commonwealth of Virginia Laws, Regulations, Contracts, and Grants
Finding: 2022-001
Department: Suffolk Department of Social Services (“DSS”)
Compliance Requirement: Section 3-15 of the Specifications for Audits of Counties, Cities, and Towns (the “Specifications”), issued by the Auditor of Public Accounts of the Commonwealth of Virginia.
Type of Finding: Non-material Noncompliance
Criteria: Section 63.2 of the Code of Virginia requires that the Local Department of Social Services remove access privileges for terminated users from all systems they were authorized to use within three (3) working days of employment termination.
Condition: While performing our audit procedures to ensure compliance with Section 3-15 of the Specifications, we identified two (2) employees in our sample of five (5) that did not have their access removed within three (3) working days.
174
CITY OF SUFFOLK,
VIRGINIA
Schedule of Findings and Questioned Costs
Year ended June 30, 2022
Cause: The DSS is responsible for communicating all employee terminations to the IT Department to ensure that all system access is promptly removed. They did not properly communicate employee terminations within the required timeframe to remove system access compliantly.
Effect: The City is not in compliance with Section 63.2 of the Code of Virginia and is potentially at risk of terminated employees having access to DSS systems. Additionally, noncompliance may result in action by the Commonwealth of Virginia.
Auditor’s Recommendation: We recommend the City ensure that the IT Department be notified of an employee's termination immediately upon the termination to ensure that access is removed in accordance with the prescribed requirements.
Management’s Response: Management agrees with this finding. DSS, the Finance Department, Information Technology Department and Human Resources Management Department will review and strengthen the notification process to the IT Department of an employee's termination immediately upon the employee's termination to ensure that access is removed in accordance with the prescribed requirements.
Finding: 2022-002
Department: Suffolk Department of Social Services (DSS)
Compliance Requirement: Section 3-15 of the Specifications for Audits of Counties, Cities, and Towns (the “Specifications”), issued by the Auditor of Public Accounts of the Commonwealth of Virginia.
Type of Finding: Non-material Noncompliance
Criteria: Section 63.2 of the Code of Virginia requires that all users complete at least one (1) hour of Information Security and Privacy Awareness training annually within 365 days of the last training.
Condition: While performing our audit procedures to ensure compliance with Section 3-15 of the Specifications, we identified two (2) employees in our sample of twelve (12) that did not receive their annual Information Security and Privacy Awareness training within a 365 day period.
Cause: The DSS is responsible for ensuring all personnel receive their Information Security and Privacy Awareness training on an annual basis. They did not properly monitor and ensure this was completed by all employees within the required timeframe.
Effect: The City is not in compliance with Section 63.2 of the Code of Virginia and is potentially at risk for misuse or mishandling of confidential information. Additionally, noncompliance may result in action by the Commonwealth of Virginia.
Auditor’s Recommendation: We recommend the City ensure that the IT Department be notified of an employee noncompliance immediately upon the employee's training expiration date to ensure that access is unavailable until the required training is completed.
Management’s Response: Management agrees with this finding. DSS, the Finance Department, Information Technology Department and Human Resources Management Department will review and strengthen the notification process to the IT Department of an employee's noncompliance immediately upon the employee's required date to complete their training to ensure that access information is protected in accordance with the prescribed requirements.
175
CITY OF SUFFOLK, VIRGINIA
Schedule of Findings and Questioned Costs
Year ended June 30, 2022
E. Status of Prior Year Findings:
None reported in the prior year.
176


Department of Finance 442 W. Washington St. Suffolk, Virginia 23434 (757) 514-7500 www.suffolkva.us CITY of SUFFOLK

