
SF-23-20 Attachment 1
City of Oshawa – Corporate Energy Management Plan i
PAGE #
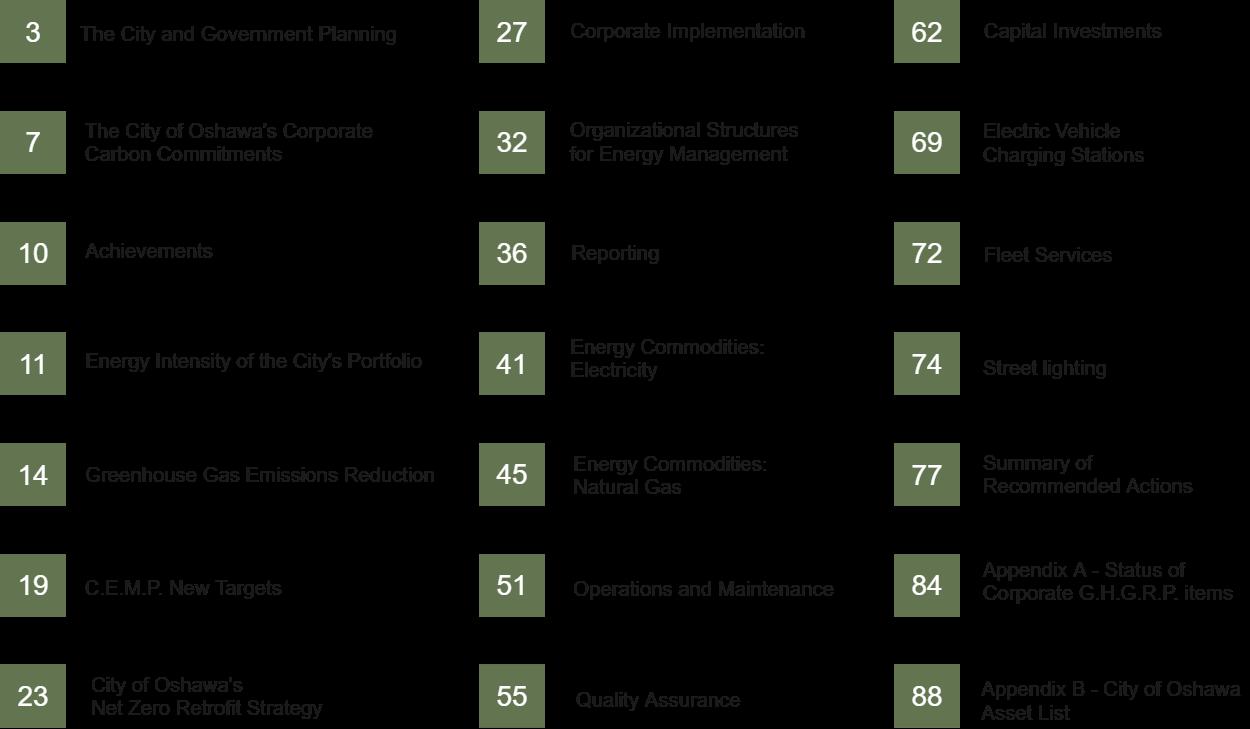
Table of Contents
C.E.M.P. Introduction
The City of Oshawa established the first Corporate Facilities Energy Management Plan (C.F.E.M.P.) in 2014, with the mission of outlining facility based actions for energy conservation and greenhouse gas reduction. This current plan is the third iteration since the original plan and continues to advance the City of Oshawa’s understanding of our carbon footprint, and creation of our path to sustainable asset management.
The Corporate Greenhouse Gas Reduction Plan was established in 2016 to satisfy Milestone 3 of the Federation of Canadian Municipalities’ Partners for Climate Protection Program. This plan outlined contributions for greenhouse gas reductions corporately.
The 2024-2028 Corporate Energy Management Plan (C.E.M.P.) has amalgamated these two existing corporate plans, marrying the corporate efforts towards decarbonization with the goal of accountability and meaningful forward action.
The targets and measures defined in this plan bring the City of Oshawa in compliance with the Electricity Act 1998, Ontario Regulation 25/23 and fulfills the Partners for Climate Protection Program’s commitment for a corporate action plan to reduce greenhouse gas emissions.
Objectives
This plan outlines the current status of energy conservation within the City of Oshawa, seeks endorsement for action on identified areas of opportunity, and sets targets to guide future trajectory.
The objectives of this plan are to:
1. Successfully position the City with an energy management strategy that fulfills corporate targets to align with federally and internationally establishedlevelsof greenhousegasreductionand maintains relevance within the energy sector.
2. Support the corporate goals of sustainability, positive environmental impact and financial responsibility.
3. Investigate the progress for energy conservation and demand management within the City of Oshawa’s corporate assets, and propose new measures to advance goals.
4. Develop an updated C.E.M.P. that meets requirements for Ontario Regulation 25/23: Energy Reporting and Conservation and Demand Management Plans.
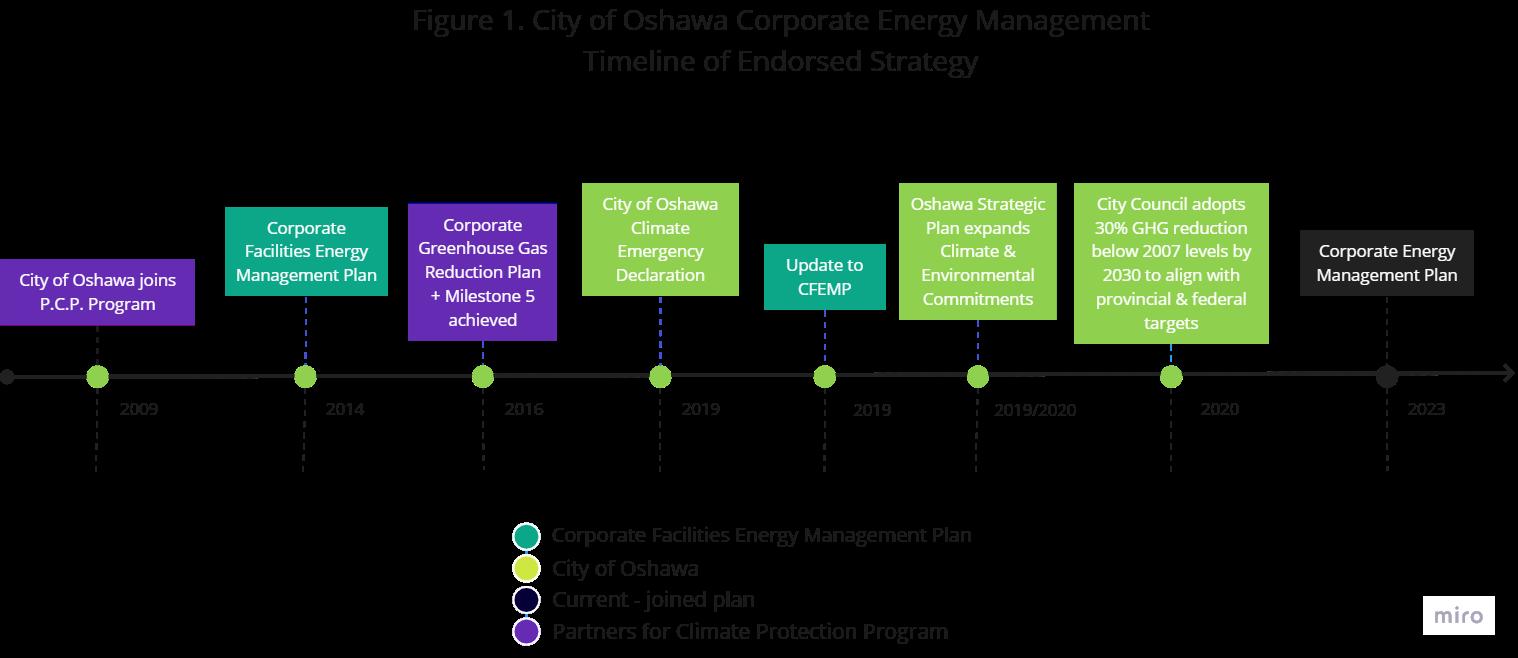
The C.E.M.P. is a working document driven by the goal of continual improvement. As the City of Oshawa’s strategy develops, the boundaries of energy management within the corporation are expected to evolve. Figure 1 outlines the history of the C.E.M.P.
1 City of Oshawa – Corporate Energy Management Plan
2 City of Oshawa – Corporate Energy Management Plan
The City and Government Planning
The C.E.M.P. is coordinated with consideration of government, regional and City of Oshawa planning. (Figure 2).

The Paris Agreement
The Paris Agreement is an international agreement adopted by members at the United Nations Framework Convention on Climate Change. Canada played an active and constructive role in securing international consensus on the Paris Agreement, which entered into force on November 4, 2016.
Pan Canadian Framework for Clean Growth and Climate Change
The Pan-Canadian Framework (P.C.F.) for Clean Growth and Climate Change was adopted in 2016, intended to decouple economic growth in the Canadian economy from carbon emissions. Canada's emissions were projected to be 19% below 2005 levels by 2030. This represents the single-largest projected drop in emissions in Canadian history.
3 City of Oshawa – Corporate Energy Management Plan
Figure 2. City of Oshawa and Government Planning
A Healthy Environment and a Healthy Economy Canada’s Strengthened Climate Plan
A Healthy Environment and a Healthy EconomyCanada’s strengthened climate plan was introduced in 2020, building on the P.C.F. with the intention of reducing pollution, creating more good jobs, and to support a healthier economy and environment. The update projected a 31% drop in Canada’s emissions by 2030.
Canadian Net-Zero Emissions Accountability Act
The Canadian Net-Zero Emissions Accountability Act, which became law on June 29, 2021, enshrines in legislation Canada’s commitment to achieve net-zero emissions by 2050. The Act ensures transparency and accountability as the government works to deliver on its targets. The Act requires public participation and independent advice to guide the Government of Canada’s efforts.
2030 Emissions Reduction Plan (E.R.P.)
The Government of Canada published the country’s 2030 Emissions Reduction Plan in March 2022. The plan reflects input from provinces, territories, Indigenous Peoples, the Net-Zero Advisory Body, and interested Canadians on what is needed to reach Canada’s more ambitious climate target of 40-45% emissions reductions by 2030. The 2030 Emission Reduction Plan is an interim deliverable under the Canadian Net-Zero Emissions
Accountability Act. Canada’s 2030 Emissions Reduction Plan.
Provincial - Ontario Regulation 25/23
The Ontario Regulation 25/23 is made under the Electricity Act, 1998 which requires public agencies to prepare and submit to the Ministry an energy conservation and demand management plan and a summary of the annual energy consumption for each of the public agency’s prescribed operations.
Federation of Canadian Municipalities (F.C.M.)
The F.C.M. represents more than 2,100 municipalities Canada wide. The F.C.M. advocates for these municipalities to ensure federal policies and programs reflect local needs.
Partners for Climate Change Protection (P.C.P.) Program
The P.C.P. program is a voluntary program established by the F.C.M. in 1994. This program was created to help municipalities take action against climate change by achieving 5 milestones:
• Milestone 1 establishes a baseline year for emissions inventories
• Milestone 2 sets emissions reduction targets
• Milestone 3 requires the development of a local action plan (corporate and community plans)
• Milestone 4 is the implementation of the plan
• Milestone 5 involves monitoring and reporting on the success of the plan
City of Oshawa – Corporate Energy Management Plan 4
Community Greenhouse Gas Reduction Plan
The City of Oshawa Community Greenhouse Gas Reduction Plan was endorsed by Council in November 2020 and subsequently approved by the F.C.M. This plan achieves Milestone 3 by outlining the goal, objectives, scope and community stakeholder engagement strategy for citywide greenhouse gas (G.H.G.) reduction targets.
Oshawa Strategic Plan
The current Oshawa Strategic Plan 2020-2023 is the City’s highest level policy document and is guided by the two principles of sustainability and financial stewardship. The plan identifies five goals that will guide decisions made by the City. Despite this plan being due for update this year, it is expected that the strong directive for sustainable leadership in Oshawa will remain. The goal of Environmental Responsibility outlines “Proactive Environmental Management and Combat Climate Change” as a current theme in the plan. The recommendations of this updated C.E.M.P. help to deliver two principles contained in this theme:
1.Identify, evaluate and implement adaptation measures to strengthen the City’s resilience to a changing climate, invasive species and other stressors
2.Implement corporate and community plans, targets and benchmarking aligned with federally and internationally recognized targets to reduce greenhouse gas emissions and energy use
Oshawa Official Plan
The Oshawa Official Plan sets out the land use policy directions for long-term growth and development in the city. Coordination of this plan ensures compliance with the Durham Regional Official Plan and provincial policies.
The Oshawa Official Plan outlines the following policies for local development which help to inform this plan:
• The City shall encourage sustainable building design by:
(a) Being responsive to new technologies in building construction; and
(b) Encouraging energy conservation and identifying opportunities for clean energy generation (e.g. geothermal, photovoltaic panels).
• The use of green building design, such as green roofs, is encouraged to reduce emissions and achieve energy efficiencies.
• It is encouraged that construction designs be responsive to new technologies in energy conservation.
• The City supports incremental reduction of overall greenhouse gas emissions and other air pollutants generated by the municipality’s own corporate activities and functions. Monitoring of the City’s greenhouse gas emissions shall be undertaken.
• Promote more energy efficient buildings and infrastructure including retrofitting existing development to higher energy efficient standards.
City of Oshawa – Corporate Energy Management Plan 5
Durham Community Energy Plan
The Durham Community Energy Plan (D.C.E.P.) aims to accelerate the transition to a clean energy economy in Durham while simultaneously achieving economic, environmental and social benefits. It presents a low carbon pathway up to 2050 that lays out a set of long-term strategies.
Having the highest population in Durham Region, it is essential that the City of Oshawa rise as a leader in supporting the outlined best case low carbon scenario, through planning and action.
Oshawa Corporate Facilities Green Building Standard
The Oshawa Corporate Facilities Green Building Standard is a set of construction, retrofit and maintenance minimum specifications that are proposed to be developed as part of this plan. This standard aims to progress the City of Oshawa’s decarbonization strategy and recognizes that time is of the essence when advancing zero carbon timelines. This standard will be designed to complement existing corporate standards.
City of Oshawa – Corporate Energy Management Plan 6
The City of Oshawa’s Corporate Carbon Commitments
On September 7, 2010, Oshawa City Council adopted the following corporate Greenhouse Gas emission targets which have been supported by the Corporate G.H.G.R.P., and past iterations of the C.F.E.M.P.:
5% reduction by 2015 from 2007 baseline

20% reduction by 2020 from 2007 baseline
80% reduction by 2050 from 2007 baseline
On January 27, 2020, Oshawa City Council endorsed an interim greenhouse gas reduction target of 30% below the 2007 baseline levels by 2030. This target generally aligned with the Federal and Provincial Government’s targets at time of adoption, under the 2020 strengthened climate plan.

The 2019-2023 C.F.E.M.P. set the potential of reducing energy consumption in corporate facilities by 10% by 2023. It stipulates this reduction is based on the current energy efficiency opportunities that were identified in the plan.
The status of these commitments are found in the following sections of this plan.
7 City of Oshawa – Corporate Energy Management Plan
Corporate Operational Greenhouse Gas Emissions
The Corporate G.H.G.R.P. outlined the following corporate sources of G.H.G. emissions to be reported to the Federation of Canadian Municipalities.
• Owned and Operated Facilities;
• Street Lighting;
• Fleet and Fire Services;
• Corporate Waste; and
• Water and Wastewater.
Since Oshawa does not operate a landfill, the City’s G.H.G. emissions from waste were calculated as percentage of total corporate G.H.G. emissions.
The City is not required to report on G.H.G. emissions associated with the processing and delivery of water and wastewater. These services are provided by the Region of Durham.
The P.C.P. Milestone 3 Corporate Plan (DS-16-25) report to Council quantifies the greenhouse gas emissions at the time of achieving Milestone 3 under the Partners for Climate Change Program (Table 1). On March 8, 2016 the City received acknowledgement that Milestone 4, and 5 were also achieved upon the acceptance of this plan. A 33% reduction from 2007 baseline G.H.G. emissions were reported, exceeding the 2020 reduction goal of 20% for corporate emissions.
Reportable Energy, Costs and G.H.G. Emissions
(Table 1 – Reportable Energy, Costs and G.H.G. Emissions as reported in DS-16-25 report to council)
City of Oshawa – Corporate Energy Management Plan 8
Year Energy used (GJ) Energy Costs Tonnes of Carbon Dioxide equivalent (t CO2 e) 2007 291,007 $6,141,895 16,757 2014 286,375 $6,811,832 11,157 Difference -4,632 $669,937 -5600 % Change -2% 11% -33%
Defining City of Oshawa’s Consumption Portfolio
The 2019-2023 C.F.E.M.P. references facility energy consumption of 48.723 GWh from January 2017 – December 2017. The discrepancy, between this total and 2017 totals outlined in this plan, is due to reporting inclusions. The energy consumption of previous energy reporting metrics did not isolate which data sets were being used to compare year over year energy use.
The annual totals in the current iteration of the C.E.M.P. include the prescribed operations required by the Electricity Act 1998, Ontario Regulation 25/23 for consistency and to ensure a complete dataset for annual comparisons. By clearly defining the parameters of which buildings are being monitored, the City of Oshawa aims to reduce error in communicating our progress over time, develop accurate trends for analysis and target the buildings that are within our operational control.
The facilities that are not captured in this report will benefit from the energy conservation strategies recommended through this plan, as they continue to be included in capital planning, projects and operational procedures. Challenges in collecting and tracking for the complete city portfolio are addressed in the Quality Assurance recommendations of this plan.
Current Corporate Energy Emissions
The 2030 Emissions Reduction Plan indicates building and transportation sector emission reductions need to be prioritized at this time In following suit, facility and fleet G.H.G impacts have been detailed in this plan. A more comprehensive method of tracking all components of corporate G.H.G. footprint is under development.
City of Oshawa – Corporate Energy Management Plan 9
*Total normalized consumption values with gas expressed as kWh equivalents.
Partners for Climate Change


Protection - Corporate Milestone 5

CUSUM of 2018-2022 savings
3,857,162 ekWh*
9.8% cumulative total of savings when compared to the 2017 values.
22 % Reduction in Energy Use
City of
– Corporate Energy Management Plan 10
Oshawa
Achievements
2017 Energy Consumption 39,248,960 ekWh* 2022 Energy Consumption 37,736,100 ekWh* 3.85% Overall Annual Reduction
8.6 4.4 -4.2 2007 2022 48% decrease in corporate facility G.H.G. emission intensity since 2007
16 Electric Vehicle charging stations installed City of Oshawa was selected to receive the esteemed international award of AEE’s Canada Region Institutional Energy Management Award for 2020. (kgCO2e/ft2)
Intensity of
buildings since 2007.
Energy Intensity of the City’s Portfolio
The prescribed operations reported here-in align with the July 1st annual publication of energy consumption reporting under the Ontario Regulation 25/23. These facilities comprise the vertical assets for which the City of Oshawa pays utility and operational bills, of which also fall into the categories defined by the regulation. The additional facilities in the City of Oshawa’s portfolio can be found in Appendix B.
Table 2 outlines the Energy Use Intensity (EUI) of the City’s facilities, rather than comparing year over year consumption. EUI allows for more accuracy in yearly comparisons, automatically accommodating for when renovations change the size of conditioned space. This method also allows similar property uses to be grouped and investigated for outliers. The energy intensity of each facility can be benchmarked against the provincial, national or regional averages to identify how the City’s portfolio is performing, and furthermore where better intensities can be achieved.
Source EUI is a measure of the total energy required to operate your building (including energy losses from generation/transmission/distribution). Weather normalization corrects for any changes in temperature that would affect operation, in order to accurately compare year over year. When weather has been adjusted for, there are valuable lessons to be gained by identifying low use periods and defining operational trends in order to replicate the energy savings. The implementation section of this plan will give more detail on how the City of Oshawa will aim to define and action necessary analysis of the EUI data shown here.
The total reduction in source energy use intensity (EUI) that the City of Oshawa has achieved since the baseline year of 2007 is - 46.7 kBtu/ ft²) or a 22% reduction in energy use.
When compared to 2017 Energy Use Intensity of 182.60 kBtu/ ft² there has been a decrease of – 14.4 kBtu/ ft². This demonstrates the reduction over the past 2019-2023 C.F.E.M.P. term where the goal for energy use reduction was set as 10%. The average reduction when comparing building EUI is approx. 8%.
The Energy Use Intensity trend over the course of the past C.F.E.M.P. allows for a more detailed analysis of facility use in recent years as seen in Table 2.
City of Oshawa – Corporate Energy Management Plan 11
Table 2 - Weather Normalized Source Energy Use Intensity of City of Oshawa Facilities
City of Oshawa – Corporate Energy Management Plan 12
Groups Property Name Square Footage (ft²) 2007 Source EUI (kBtu/ft²) ( A ) 2017 Source EUI (kBtu/ft²) ( B ) 2022 Source EUI (kBtu/ft²) ( C ) National Benchmark EUI Change (kBtu/ft²) 2007 D (C - A) Change (kBtu/ft²) 2017 E (C - B) Arts Resource Centre 11,500 162.7 95.4 100214.1-62.7 4.6 Bathe Park Community Centre 3,500 54.4 54.4 36.2214.1-18.2-18.2 Columbus Community Centre 2,000 174.4 171 164.3214.1-10.1 -6.7 Connaught Community Centre 2,000 97 97 112.2214.1 N/A 15.2 Cordova Community Centre 1,200 58.8 58.8 125.7214.1 N/A 66.9 Fernhill Community Centre 1,800 164.4 164.4 126.8214.1-37.6-37.6 Glen Stewart Community Centre 7,000 64.5 64.5 59.5214.1 -5-5 Harman Park Community Centre 2,500 84.1 84.1 79214.1 -5.1-5.1 Kingside Community Centre 4,000 85.2 85.2 61.3214.1 N/A -23.9 Lake Vista Community Centre 3,500 125.8 118.3 131.8214.1 6 13.5 Mackenzie Park Community Centre 1,600 57.8 64 79.4214.121.615.4 North Oshawa Community Centre 3,000 76.5 52 37.1214.1-39.4-14.9 Northview Community Centre 15,000 272.4 233.4 248.3214.1-24.114.9 Rundle Community Centre 3,500 77.8 62.9 75.8214.1 -2 12.9 Southmead Community Centre 2,500 69.1 68.7 62.9214.1 -6.2-5.8 Storie Park Community Centre 2,500 167.7 112.7 95.9214.1-71.8-16.8 Sunnyside Community Centre 3,800 52.7 35.3 32.6214.1-20.1 -2.7 Thornton/Dundee Community Centre 3,500 95.8 87.7 91.5214.1 -4.33.8 Valleyview Community Centre 3,500 127.7 104.7 73.7214.1 -54-31 Woodview Community Centre 15,000 82.7 61.3 48.5214.1-34.2-12.8 Fire Hall 1 24,000 155.8 135.6 138.8139.6 -17 3.2 Fire Hall 2 6,500 189 176.3 179.6139.6 -9.43.3 Fire Hall 3 9,000 251.5 200.6 189.9139.6-61.6-10.7 Fire Hall 4 6,500 180 158.9 185139.6 5 26.1 Fire Hall 5 17,890 201 194 192.6139.6 -8.4-1.4 Fire Hall 6 10,675 N/A 125.7 134.5139.6 N/A 8.8 City Hall 128,105 190.5 122.9 118.1144.9-72.4 -4.8 Municipal Law Enforcement 6,800 N/A 141.9 Animal Services 16,500 114 172 190.8132.276.818.8 Community Centres Fire Stations Office no longer an asset
1kBtu/ft2 = 0.293071 kWh/ft2
2 ”The Change” columns show how the 2022 EUI compares to 2007, and 2017 EUI respectively. The cells highlighted in blue display increased EUI, demonstrating areas of opportunity for energy conservation measures and auditing.
3Civic is separated due to separation of physical buildings in the complex, and separation of meters.
Annual Facility Source Energy Use
Groups Property Name Square Footage (ft²) 2007 Source EUI (kBtu/ft²) ( A ) 2017 Source EUI (kBtu/ft²) ( B ) 2022 Source EUI (kBtu/ft²) ( C ) National Benchmark EUI Change (kBtu/ft²) 2007 D (C - A) Change (kBtu/ft²) 2017 E (C -B) Operations Consolidated Operations Depot 88,000 150.5 151 171.3 125 N/A 20.3 Howden Road Operations Depot 7,100 43.7 43.7 62.5 125 N/A 18.8 Recreation Centres Children's Arena 30,000 164.3 115.8 116.3 171.8 -480.5 Civic - Centennial Pool 149,037 136.2 104.4 105.9 161.1 -30.31.5 Civic - Dome & Squash Courts 51,000 274.2 177.5 154 166.3 -120.2-23.5 Civic - Stadium 11,001 294.9 214.7 246.8 161.1 -48.132.1 Delpark Homes Centre 202,051 340.7 324 252.2 161.1 -88.5-71.8 Donevan Recreation Complex 40,000 362.9 298.9 275.3 161.1 -87.6-23.6 Harman Park Arena 64,000 140.6 113.5 117.4 145.1 -23.23.9 South Oshawa Community Centre 45,361 307.4 266.3 283.8 161.1 -23.617.5 Totals 988,945 214.9 182.60 168.2 N/A -46.7-14.40
13
City of Oshawa – Corporate Energy Management Plan
0 50 100 150 200 250 2016 2017 2018 2019 2020 2021 2022 2023 2024
Intensity (kBtu/ft²)
Figure 3. Weather Normalized Source EUI for City of Oshawa Facilities (2017-2022)
Buildings with significant reduction in Source EUI within this period:
• City Hall
• Fire Hall 3
• Civic Dome and Courts
• Delpark Homes Centre
• Donevan Recreation Centre
• Storie Park/Woodview/North
Oshawa/Kingside/Fernhill/Bathe Park Community Centres
Buildings with significant increase in Source EUI within this period:
• Fire Hall 4, Fire Hall 6
• Consolidated Operations Depot
• Howden Road Operations Depot
• Civic Stadium
• Animal Services
Many buildings with significant reduction in source EUI can be linked to capital energy projects, such as City Hall, Delpark, Civic and Donevan. Other trends such as community centre reduced loads may be attributed to change in resident’s behaviour during the COVID-19 pandemic. The increase in operations depot EUI trends alongside community growth and recent consolidation of resources. Individual investigation is required to determine the details of each facilities’ specific changes, replicate successes and make action plans accordingly.
Greenhouse Gas Emissions Reduction
The notable change in G.H.G. reduction from 2007 baselines shows the City of Oshawa’s success in developing long term strategies to reduce energy consumption. Comparing Greenhouse Gas emissions intensity of the previously defined 2007 baseline and current G.H.G. emissions from 2022 (as seen in Table 3) indicates sustained reduction of 48%, which surpasses the 2020 goal of 20%.
Table
City of Oshawa – Corporate Energy Management Plan 14
Portfolio Measure Emissions Intensity Baseline (2007) 8.6 Current (2022) 4.4 Change (kgCO2e/ft²) -4.2
3. Portfolio Average G.H.G. Emissions Intensity (2007-2022)
Exceeding Our Targets
The Government of Canada published the 2030 Emissions Reduction Plan in 2022. This plan addresses the Paris Agreement targets to reduce emissions by 40%-45% from 2005 levels by 2030. This defines 2030 as an intermediate goal in the trajectory of achieving Net Zero by 2050. Figure 4 shows the progress of government projected reductions.

The City of Oshawa has exceeded the 2030 target, achieving 48% reduction in our corporate facility emissions.
The Emission Reductions Plan defines transportation and buildings as key areas where the largest G.H.G. reductions will occur between now and 2030. The City of Oshawa aims to focus our corporate strategy where we can achieve the largest impact as defined by the overarching national goals.
Recognizing the gap in other corporate emissions data, the City aims to develop accountability for these impacts through this new combined plan.
Efforts to minimize carbon emissions during energy production have created the majority of the Greenhouse Gas reductions associated with building operations today (Fig.7 below)1. Although the City portfolio’s EUI has decreased
15 City of Oshawa – Corporate Energy Management Plan
Figure 4. Projected G.H.G. emissions outlined in the 2030 Emissions Reduction Plan.
since 2017, according to the National Inventory report, emission factors related to the use of gas and electrical commodities have now increased since 2017. An increase in total G.H.G. emissions since 2017 can be seen in Table 4. Increased percentage of natural gas use also impacted these values, with natural gas constituting 59% of and 62% of the total energy use respectively for 2017, and 2022 (Fig.5.). Energy use reductions for the city’s average building has helped to maintain the similar values in G.H.G. emissions when comparing 2022 to 2017 values.
16 City of Oshawa – Corporate Energy Management Plan
Asset Group 2007 2017 2022 Community Centres 476 245 267 Fire Stations 508 311 358 Office 1055 413 493 Operations 334 356 430 Recreation Centres 6278 2939 2867 Annual Totals 8650 4264 4415
Table 4: Annual Totals of G.H.G. Emissions by Asset Group (Tonnes CO2e)
electricity 41% natural gas 59% 2017 FACILITY ENERGY CONSUMPTION electricity 38% natural gas 62% 2022 FACILITY ENERGY CONSUMPTION
Figure 5. Portfolio Percentage Use of Electricity and Gas in 2017 vs. 2022
G.H.G. EMISSION IMPACT OF FACILITY TYPES
Fig. 6 shows the G.H.G. emissions apportioned to each facility type in the City of Oshawa portfolio.

Recreation centres and community centres combine to produce 71% of the G.H.G. emissions. Operations accounts for 10%, Offices for 11% and Fire Stations account for 8% of overall facility G.H.G. emissions.
Energy Sector impacts on G.H.G. Reduction
By 2035, the electrical grid could be significantly less reliant on natural gas powered generation, reducing emissions with a fully decarbonized grid possible by 2050. 2 According to the Government of Canada targets stipulated in the 2030 ERP, a carbon neutral electrical grid by the year 2035 is the idea scenario. 3 l
1 Environment Canada. Greenhouse Gas Division., 2021
2 Independent Electricity System Operator, 2022
3 Environment and Climate Change Canada, 2022
17 City of Oshawa – Corporate Energy Management Plan
Recreation Centres 65% Community Centres 6% 10% 71% Office Operations Fire Stations 8% 11%
Figure 6. G.H.G. emission percentage of 2022 portfolio by asset
Fig.7. Emission intensity of electricity generation in Ontario from 1990 to 2020.
Although there is opportunity for electricity to be supplied in Ontario as a decarbonized commodity, a large shortfall of electrical supply is predicted in Ontario due to demands of electrification and population growth (Figure 8). 4
The forecasted demand reinforces the need for large reductions in electrical consumption, and renewable distributed energy production as key elements in the City’s Net Zero emission planning strategy, regardless of the low carbon future of electricity. Ensuring the City of Oshawa maintains a strong position against the unpredictable energy markets of the future is essential while planning for fuel switching away from gas. In order to prepare for this shift, the facilities with the highest gas consumption and their associated G.H.G. emission impact are highlighted in Table 5 (p.24).

18 City of Oshawa – Corporate Energy Management Plan
Figure 8. The Future of Electricity Demand in Ontario, Independent Electricity System Operator (I.E.S.O.).4
4 Independent Electricity System Operator, 2022
C.E.M.P. New Targets
The following targets are recommended through this plan:
Alignment with federal and regional goals to have Net Zero Emissions by 2050. This Net Zero Emissions target for 2050 will be supported by three tiers of action.
1. Net Zero Retrofit Strategy targeting 80% of the 2007 greenhouse gas emission levels by 2045.
2. Development of the Oshawa Corporate Facilities Green Building Standard.
3.Continue tackling the remaining 20% of emission through energy efficiency measures as defined in the implementation section of this plan.
Financial Implications
There are no expenditures directly associated with endorsing the recommendations in this plan. As seen historically, the energy management practices outlined in this plan are anticipated to have financial benefits.
The following future capital investments will require Council approval through formal budget requests, in support of this plan.
• Detailed engineering studies as outlined in the Net Zero Strategy section of this plan.
• Capital Projects will follow to deliver Net Zero Retrofits.
• Capital investments in monitoring and verification technology may be required to utilize grants and funding opportunities.
Financial benefits of these targets include:
• Future operational energy cost reduction
• Resiliency to changes in energy sector, through reduced demand and onsite generation
• Reduction of carbon tax associated with operational use
• Shovel ready designs allowing the city to leverage grants and funding opportunities
19 City of Oshawa – Corporate Energy Management Plan
Corporate Vision for Energy Management
It is recommended that City Council adopt the new vision statement for energy management to establish strong sustainable leadership across corporate culture, and support the joining of the Corporate G.H.G.R.P. and the Corporate Facilities Energy Management Plan.
Proposed Vision
Energy management will be considered a priority in corporate asset management activities, including capital, operations and maintenance decisions; and financial management and procurement decisions.
Current Vision
Energy management will be incorporated into all of facilities management’s activities, including capital, operations and maintenance decisions; and financial management and procurement decisions.
Corporate Facilities Energy Management Vision, as previously endorsed by Council (C.F.E.M.P. 2019-2023).
20 City of Oshawa – Corporate Energy Management Plan
The Reduce – Improve – Switch model for Durham Region

21 City of Oshawa – Corporate Energy Management Plan
Fig. 9. Reduce – Improve – Switch framework for transitioning the Energy System (as presented in the D.C.E.P.). 5
The Durham Community Energy Plan (D.C.E.P.) depicts a Reduce-Improve-Switch model (Figure 9.) as a methodology for low carbon fuel switching. The transition to zero carbon renewable sources of energy requires an evaluation of the entire system, and is not isolated to each granular retrofit within a facility.
It is best practice to evaluate envelope and load reduction strategies prior to mechanical retrofits, as these upgrades contribute to avoided capacity and allow for right-sizing of mechanical systems when lifecycle replacements come due. This provides more fiscally responsible investments and a critical reduction in demand, constituting “strategic fuel switching”. Strategic fuel switching describes fuel-switching that saves the consumer money, reduces the total system wide energy consumption and lowers total greenhouse gas emissions in comparison to the previously replaced technologies. 6 Waste heat recovery solutions also have a large impact in reducing demand to mechanical systems and whole facility boundary.
The Reduce-Improve-Switch approach also optimizes future capital expenditures on renewable and distributed energy systems by right sizing local energy generation to lower loads, and leaving potential for expansion where possible (i.e. Photo-voltaic arrays can be limited by availability of open horizontal space).
Reducing demand and limiting conversion losses through local production is essential for Ontario’s low carbon growth. Considering the limitations of the changing energy system provides insight on how a proactive energy position can help future proof the City’s assets while also contributing to energy security for our community.
The overarching requirement for whole system planning demonstrated in the Reduce-Improve-Switch model has been used to inform our Net Zero Retrofit Strategy, implementing a long term plan for the City’s carbon reduction goals.
22 City of Oshawa – Corporate Energy Management Plan
5 Durham Region, 2018
6 Sievers, 2019
TOP 8 NATURAL GAS USERS IN 2022
City of Oshawa’s Net Zero Retrofit Strategy
Goal Develop a meaningful plan to target greenhouse gas reduction while increasing the resiliency of high priority assets that will serve the City of Oshawa for years to come.
Action Upon adoption of this plan, the Corporation of the City of Oshawa will advance a detailed Net Zero retrofit engineering study. The engineering study will model, and quantify a path to achieve 80% reduction in corporate greenhouse gas emissions by targeting top gas consuming facilities (shown in Fig.10) for fuel switching, and providing detailed design specifications for project delivery.
The evolving low carbon future provides a unique opportunity to mitigate commodity market vulnerability through future planning that can best be implemented the sooner we begin. These detailed studies will constitute the first step in achieving the new corporate target of 100% Net Zero emissions by 2050.
23 City of Oshawa – Corporate Energy Management Plan
Others 21% Children's Arena 3% Civic - Dome & Squash Courts 5% Donevan Recreation Complex 5% South Oshawa Community Centre 7% City Hall 8% Consolidated Operations Depot 10% Civic - Admin, Fieldhouse and Pool 11% Delpark Homes Centre 30%
Figure 10. Top Gas Consuming Facilities for the City of Oshawa’s Portfolio
Table 5. Net Zero Building Studies: Impact of Net Zero Carbon Emissions at Top Natural Gas Consuming Facilities
Table 5 outlines the G.H.G. emissions that correspond with the top 8 natural gas consuming facilities in the City of Oshawa’s building portfolio. By targeting a select number of these facilities in the Net Zero Retrofit Strategy, we can reduce the entire emissions baseline substantially. The table shows the top five gas consuming facilities’ G.H.G. footprint being equivalent of 80% of the 2007 baseline emissions.
24 City of Oshawa – Corporate Energy Management Plan
Top Candidates Facility / Measure of G.H.G. Total G.H.G. Impact (Tonnes CO2e) 1 Delpark Homes Centre 1286.9 2 Civic Recreation Complex 457.1 3 City Hall 383.2 4 Consolidated Operations Depot 428.2 5 Donevan Recreation Complex 249.5 6 South Oshawa Community Centre 326.9 7 Civic Dome 451 8 Children's Arena 130.3 Top 5 Total G.H.G. 2804.9 Total 2007 G.H.G. (100%) 8650.1 Total 2022 G.H.G. (52%) 4415.1 (4415.1 – 2804.9) Tonnes CO2e G.H.G. remaining from 2007 baseline (19%) 1610.2
Detailed Engineering Studies
The proposed engineering study will involve the following stages:
1.Define the top consumers that best suit fuel switching and achieving 80% Net Zero emission reductions.
2.Complete Net Zero Retrofit designs, with options provided.
3. Create a roadmap for delivery, defining technologies that need to be converted in tandem, and aligning with the capital plan by establishing timelines for action that is the best fit with projected asset renewal.
• Waste heat recovery systems
• Lighting upgrades
• Envelope improvements
• Defined operational set points to maintain predictable loading Methods of Load Reduction
Fuel Switching
Electrifiication
• Specification of systems
• Schedule of staging for linked systems, capital budget alignment etc.
• General pricing
• Carbon offset requirements
• Redundancy requirements or backup compatibility
Limitations of Fuel Switching
Energy Generation and Renewables
• On-site renewable generation technology options
• Required size of proposed systems
• Feasibility for implementation and location
25 City of Oshawa – Corporate Energy Management Plan
Figure 11. Net Zero Retrofit Design Breakdown
Considerations for implementation of Net Zero strategy:
• An approach that considers the most economically efficient pathway
• Critical Asset Infrastructure would be prioritized for community resiliency

• Technological feasibility
• Emerging technologies that may further impact carbon reduction between now and 2050
26 City of Oshawa – Corporate Energy Management Plan
Corporate Implementation

27 City of Oshawa – Corporate Energy Management Plan
Figure 12. Energy Management Plan Implementation Work Breakdown Structure
Corporate Implementation Subsections
The implementation of energy management practices at the City of Oshawa can be categorized into the four key areas of governance, reporting, third party relationships, and asset management. Figure 12 further breaks down these areas as do the following sections of this plan.
• Governance
• Departmental energy conservation measures
• Corporate Energy Culture and Staff Awareness
• Organizational Structure for Energy Management
• Reporting
• Internal Reporting
• External Reporting
• Third Party Relationships
• Energy Commodities and Services
• Agreements
• Grants/ Incentives
• Community Partners
• Asset Management
• Operations and Maintenance
• Quality Assurance
• Capital Investments
• Streetlights and Parking
• Fleet Services
28 City of Oshawa – Corporate Energy Management Plan
Governance
The responsibilities contained in this plan are governed by City Council, the Corporate Leadership Team and the Energy Management Steering Team. City Council is responsible for plan approval, ensuring the plan meets the best interests of the public. Council approval is also required on an annual basis for budget requests which allow the goals of this plan to become active projects.
The Oshawa City Council has defined the goals of environmental responsibility and financial stewardship as pillars of the Oshawa Strategic Plan.
The Facilities Energy Management Steering Team and other departmental leadership enact the responsibilities that are outlined in the plan. The steering team and department interactions that make this possible are discussed further below when breaking down the organizational structure within facilities energy management.
This plan is prepared by Facilities Management Services and goes into detail regarding the facility energy consumption accounting for the majority of the City of Oshawa’s corporate footprint. Details from other departments are included as needed to comment on the greenhouse gas reduction strategies that are being amalgamated by this Corporate Energy Management Plan. For this reason, there may be further strategies and opportunities within other departments that are not included in this plan. Future iterations of this plan will aim to capture these strategies and opportunities as the City’s energy use and greenhouse gas reduction targets expand.
29 City of Oshawa – Corporate Energy Management Plan
Departmental Energy Conservation Measures
Departments that have contributions from the previous Corporate G.H.G.R.P. plan are listed in Table 6. Community Support Services and Operations have further contributions in the plan touching on street lighting and parking, and municipal fleet services respectively. Appendix A lists the completed initiatives from the Corporate G.H.G.R.P. since adoption in 2016, as well as ongoing projects that are not covered elsewhere in this plan.
Department Contributions
Facilities Management Services (Safety and Facilities Services)
Community Support Services (Community and Operations Services)
Operations (Community and Operations Services)
Finance Services (Corporate and Finance Services)
Planning Services (Economic and Economic and Development Services)
Appendix A and C.E.M.P.
Appendix A and Street lighting /Parking
Appendix A and Fleet Services
Appendix A
Appendix A and inclusions from Corporate G.H.G.R.P.
Human Resource Services (Corporate and Finance Services)
Corporate Energy Culture and Staff Awareness
Appendix A
Extending educational opportunities with the goal of increased climate literacy can influence corporate culture and promotes an energy team mentality.
30 City of Oshawa – Corporate Energy Management Plan
Table 6. Department Contributions to the C.E.M.P.
A study by the “Carbon Trust” demonstrated the impact of technological improvements compared to incorporating human resources and education to produce successful, lasting energy impacts. 7 By testing four different combinations of technology and educational awareness strategies, in four different buildings, it was found that engaging with the users and operators in the building was the most essential factor for increasing conservation. Two buildings only used technology and the resulting energy savings were significantly reduced, or completely absent as shown in Figure 13.
Education and employee awareness will be promoted in the corporate culture by implementing training and awareness initiatives, reaching staff through i-Connect and i-Learn corporate portals. The use of conservation challenges and technological advances that make energy information available to staff will also be explored. Effective energy data management will be integral in re-enforcing energy messaging to all staff, providing the opportunity to give accurate feedback on measures taken to control energy use.

31 City of Oshawa – Corporate Energy Management Plan
Figure 13. Technology and People Engagement Study by The Carbon Trust.7
7 The Carbon Trust
Organizational Structures for Energy Management

Please be advised this is not a comprehensive organizational chart as it pertains specifically to the energy management strategy of facility projects and excludes security and parks planning roles.
The expansion of the Corporate Energy Management Plan beyond a facility specific scope presents the opportunity for internal collaboration within City Departments. Initiatives that promote energy efficiency and fiscal responsibility will encourage staff collaboration, while continuing the momentum of the City’s sustainable principles. Communication and organizational change is needed to achieve the level of integration desired in the proposed corporate energy vision. Figure 14 highlights the organizational structure of FMS, and energy management for facilities.
32 City of Oshawa – Corporate Energy Management Plan
Figure 14. Facilities Management Services (FMS) Organizational Structure at the City of Oshawa
Three categories of energy focus teams are proposed to achieve this.
City of Oshawa Corporate Energy Advisory Team
This is a visionary and planning team intended to unite the City of Oshawa’s stakeholders in concept collaboration, and future ideation for the City of Oshawa’s corporate energy strategies. The dynamic and evolving energy sector requires a forward planning approach to ensure excellence in energy management and carbon reduction. The term of this C.E.M.P. will be used to establish and implement this Energy Advisory Team, laying the groundwork for years to come. With focus on the feasibility and impact of larger scale initiatives, this group will allow meaningful conversations with community partners where symbiotic energy opportunities exist. NRCan suggests that an Energy Team is comprised of representatives from each operational area that significantly affects energy use. 8 It is proposed that this team will include, but not be limited to representatives from; engineering, purchasing, operations and maintenance, buildings and facilities management, environmental health and safety, corporate real estate and leasing, construction management, and when relevant community partners such as utilities, contractors and suppliers.
Facilities Energy Management Steering Team
The Facilities Energy Management Steering Team is comprised of the Project and Energy Manager, Energy Management Coordinator, and individuals who directly manage operations and maintenance within City facilities.
The focus for this group will be to support energy initiatives for mechanical optimization, O&M and staff competencies. The group will develop robust energy conservation practices by unifying stakeholder direction, identifying education opportunities for appropriate staff, and developing a path for meaningful feedback from the Staff Working Group to the Project and Energy Manager. This group will be the core of the City of Oshawa corporate Energy Advisory Team.
Energy Staff Working Group
The formation of an Energy Staff Working Group is pivotal to produce sustainable, energy efficient operational measures in our facilities. A staff working group acts as a necessary channel of communication to develop corporate buy-in and promote energy conscious actions. The City of Oshawa’s renewed commitment for developing this critical staff engagement is outlined below.
8 Energy Star, 2019
33 City of Oshawa – Corporate Energy Management Plan
Staff Working Group Priority Steps
Identify internal roles – who is involved and what are their responsibilities
Identify training opportunities – create implementation plan
Identify potential to impact energy use – initial development of operational energy objectives
The operating and maintenance provisions, outlined in the Asset Management portion of this plan, rely heavily on the education, skills, and behavioural perspectives of those operating the facility. By giving energy performance responsibilities to City of Oshawa’s daily operating staff, their specific expertise will be utilized as well as gain valuable input on where limitations currently reside.
Establish performance metrics - define performance indicators for operations and maintenance that are relevant to each facility type and priority systems
The Energy Staff Working Group (S.W.G.) priority steps are adapted from the NRCan Energy Management Guidelines 2019 for determining roles and resources.8
Identify external roles – what support is needed to implement energy measures in operations and maintenance
The S.W.G. has been identified by The Facilities Energy Management Steering Team to include:
• Operators
• Lead hands
• Skilled Trades
Define resource needs – identify dedicated human resource and funding requirements to achieve success
• Project and Energy Manager
• Energy Management Coordinator
Define schedule – standing commitment for progress
34 City of Oshawa – Corporate Energy Management Plan
Table 7. Summary of City of Oshawa Energy Management Organizational Structure
Role / Team Description
Task a Qualified Staff Member
In 2021, City Council approved the Energy Management Coordinator to be a permanent role.
Assign Energy Management Function
In 2023, the FMS team adopted an energy specific Project & Energy Manager role. The function of this role is to develop and implement programs and projects that support and evolve the Corporate Energy Management Plan.
Energy Staff Working Group (S.W.G)
This iteration of the plan evaluates the roadblocks that have slowed progress toward the creation of this group, and re-commits to a S.W .G. as essential. The S.W.G. is re-defined as operational personnel, with an on-site mechanical and electrical focus. Priority first steps for initiation have been established to facilitate immediate adoption.
Facilities Energy Management Steering Team
The creation of this steering team enables support and delivery of the S.W.G.’s scope to be identified through facility management. This will identify and troubleshoot barriers which may exist in operational energy conservation initiatives, as well as ensure support from management throughout the organization.
Collaborative group to support energy projects requiring planning and implementation beyond the purview of FMS & daily operational teams. The impact of this team will grow as the Corporation of the City of Oshawa sets more ambitious energy conservation targets.
35 City of Oshawa – Corporate Energy Management Plan
City of Oshawa Energy Advisory Team
Reporting
City of Oshawa Energy Management - Internal Reporting
Table 8. City of Oshawa Energy Management Summary of Internal Reporting
Progress
Project approval Annually
Recommended updates to the Corporate Energy Management Plan are published in the form of written report, supported by data analysis and historic progress.
Description of energy project scope with business case provided. Submitted through standard budgetary approval process.
Ad hoc As needed N/A
Benchmarking
*Monthly / Quarterly / Annually
M&V On Project Basis
CLT Progress Annually
Comparison of facility baseline metrics and historic use. This includes each facility or for facilities relevant to current projects.
As laid out for each measurement and verification plan established at the onset of project.
Update of C.E.M.P. measures and planned projects, with business case provided.
36 City of Oshawa – Corporate Energy Management Plan
Internal
Content
Council
Report Purpose Frequency
and Method of Reporting
C.E.M.P. update Max. of 5 years
Internal Report Purpose Frequency
Content and Method of Reporting
Revolving Energy Fund Reserve contributions
Annually
Anticipated savings of energy conservation measures, followed by verification of savings delivered, as confirmed through measurement and verification plan.
Summary of incentives that have been paid to city for energy project implementation.
Financial
Federal Gas Tax Reporting
Utility performance and planning
Commodity
Procurement
Annually Q1
Update on progress of energy projects, and quantified savings.
TBD
Summary of utility expenditures, rate class recommendations, changes in demand and planning considerations.
Audit of EM Progress and Performance
Monthly/Bi-annual review of hedging
Project approval Annual budget approval process
Assessment of Energy Management Implementation
Annually
Delivered through third party procurement service. Reviewed with additional reporting as pertinent to hedging strategy.
Follows typical budget process.
Evaluation of KPIs to be defined for the implementation of this plan and assess need for redirection where appropriate.
*This monthly frequency is an ideal reporting frequency based on the goals of FMS to adopt data management software that can present and compare energy information while optimizing human resource potential.
37 City of Oshawa – Corporate Energy Management Plan
External Reporting Province
On February 23, 2023 the province revoked the Ontario Regulation 507/18, replacing it with Ontario Regulation 25/23: Broader Public Sector: Energy Reporting and Demand Management Plans. Although some methods of reporting details have been adjusted the intention of the plan remains unchanged.
The plan fulfills the Government of Ontario’s Regulation 25/23 Electricity Act, 1998, under Broader Public Sector: Energy Reporting and Conservation and Demand Management Plans. This regulation requires all public agencies such as the City of Oshawa to prepare an energy conservation and demand management plan. Once approved by senior management and City Council, the plan is to be published on its website and made available to the public in printed form before July 1 of 2024 including:
1. A summary of annual energy consumption for each of the public agency’s prescribed operations.
2. A description and a forecast of the expected results of current and proposed activities and measures to conserve the energy consumed by the public agency’s prescribed operations and to otherwise reduce the amount of energy consumed by the public agency, including by employing such energy conservation and demand management methods as may be prescribed.
3. A summary of the progress and achievements in energy conservation and other reductions described in paragraph 2 since the previous plan.
4. Such additional information as may be prescribed by regulation. 2018, c. 16, s. 2.
Additional information the energy conservation and demand management plan must include:
1. A summary of annual greenhouse gas emissions for each of the public agency’s prescribed operations, which shall be included in the summary of the public agency’s annual energy consumption required under paragraph 1 of subsection 25.35.2 (3) of the Act.
2. A description of the results of previous activities and measures to conserve the energy consumed by the public agency’s prescribed operations and to otherwise reduce the amount of energy consumed by the public agency, including by employing such energy conservation and demand management methods as may be prescribed.
City of Oshawa – Corporate Energy Management Plan 38
3. The cost and saving estimates for the public agency’s current and proposed activities and measures referred to in paragraph 2 of subsection 25.35.2 (3) of the Act.
4. A description of any renewable energy generation facility operated by the public agency and the amount of energy produced on an annual basis by the facility.
5. A description of,
i. the ground source energy utilized, if any, by ground source heat pump technology operated by the public agency,
ii. the solar energy utilized, if any, by thermal air technology or thermal water technology operated by the public agency, and
iii. the proposed plan, if any, to operate heat pump technology, thermal air technology or thermal water technology in the future.
6. The estimated length of time the public agency’s current and proposed activities and measures referred to in paragraph 2 of subsection 25.35.2 (3) of the Act will be in place.
7. A confirmation that the energy conservation and demand management plan has been approved by the public agency’s senior management.
39 City of Oshawa – Corporate Energy Management Plan
Federation of Canadian Municipalities
There are no reporting requirements under the Partners for Climate Change Program once Milestone 5 is achieved. In order to meet ambitious federal and international recommendations, the Milestone Framework encourages members to continue to set midterm target and long-term targets. Figure 15 shows the 5 Milestones under P.C.P. Framework. This recommendation aligns with the Intergovernmental Panel on Climate Change’s (I.P.C.C.) scientific targets of a 45% reduction by 2030 and net-zero by 2050. 9
It is recommended that after achieving Milestone 5 the corporate action plan be treated as a living document that can be revised as information, ideas and circumstances evolve.

40 City of Oshawa – Corporate Energy Management Plan
Figure 15. Five Milestones of the Partners for Climate Change Program.9
9 Federation of Canadian Municipalities, 2021
Third Party Relationships Energy Commodities
The procurement of energy is equally as important to the conservation of energy. Responsible energy procurement involves rate optimization, utility account management, supply reliability and quality, demand and supply optimization and risk management. In 2007, the City of Oshawa developed a corporate hedging policy to allow for the price hedging of electricity and natural gas.
Electricity
10
The Corporation of the City of Oshawa procures electricity through the local utility, Oshawa Power.
Recently the City renewed our contract for electrical commodity consulting services with WattsW orth Analysis Inc. Currently the City does not engage in hedging contracts for electricity. This option is currently under review due to current changes in electrical markets, rate structures and commodity pricing trends.
The electricity data for Oshawa’s portfolio reveals a distinct seasonal pattern, with lower consumption during the spring months (April, May, and June) compared to other seasons. Additionally, the slight reduction in kWh usage over time is depicted in Figure 16. The year 2020 stands out as having a dip in usage, due to the COVID-19 pandemic and resulting changes in occupancy and behaviour.
41 City of Oshawa – Corporate Energy Management Plan
200,000 400,000 600,000 800,000 1,000,000 1,200,000 1,400,000 1,600,000 2017 2018 2019 2020 2021 2022
Figure 16. Electrical Use from 2017-2022 (kWh)
10
City of Thunder Bay, 2019
Electrical rates for Oshawa’s facilities have fluctuated between 0.07 and 0.17 cents per kWh over the 20172022 term, as shown in Figure 17. The highest rates occurred during the spring and summer months, while the lowest rates occurred during the fall and winter months.
In the past Global Adjustment (GA) opportunities for demand response were not accessible to the City’s prescribed operations based on rate class limitations. Industry trends are changing from past years with a shift toward reduced GA and increasing Hourly Ontario Energy Pricing (Figure.18). 11

42 City of Oshawa – Corporate Energy Management Plan 0.00 0.02 0.04 0.06 0.08 0.10 0.12 0.14 0.16 0.18 2017 2018 2019 2020 2021 2022
Fig. 17. Oshawa's Electricity Commodity Rate ($/kWh)
Years $/kWh 2017 0.1132 2018 0.1124 2019 0.1237 2020 0.1376 2021 0.1092 2022 0.1054 Average 0.1169
11 Independent Electricity Service Operator, 2023
Figure 18. Hourly Ontario Energy Price and Global Adjustment Distribution
Close attention will be paid to market changes and opportunities to procure electrical hedging contracts similar to what is done with natural gas.
Figure 19 shows the seven facilities where we have access to hourly data, allowing us to accurately calculate demand values. Note that the two high consumption accounts excluded from this chart are Consolidated Operations Depot and Civic Dome, as they lack interval reads. These facilities are flagged as potential candidates for metering technologies to be implemented.

43 City of Oshawa – Corporate Energy Management Plan
Figure 19. Comparison of kW Demand for Top 7 Interval Facilities
44
City of Oshawa – Corporate Energy Management Plan
Facility 2017 2018 2019 2020 2021 2022 Delpark Homes Centre 1,095 1,125 1,079 847 791 859 City Hall 319 325 314 302 294 282 Civic Recreation Complex 310 299 298 237 261 288 Donevan Recreation Complex 212 206 205 215 180 201 South Oshawa Community Centre 229 224 205 157 159 215 Harman Park Arena 200 190 192 214 177 213 Northview Community Centre 76 78 77 66 72 70
Table 9. Average Demand of Top Electricity Consuming Facilities (kW)
Facility 2017 2018 2019 2020 2021 2022 Delpark Homes Centre 1,187 1,268 1,218 1,029 1,043 1,030 City Hall 420 417 401 383 377 359 Civic Recreation Complex 402 391 388 319 366 352 Donevan Recreation Complex 278 276 276 270 259 247 South Oshawa Community Centre 265 272 256 192 220 259 Harman Park Arena 319 312 301 300 314 313 Northview Community Centre 90 95 88 92 101 81
Table 10: Peak Demand of Top Electricity Consuming Facilities (kW)
Overall, the prescribed facilities in this plan spent approx. $2,187,289 on demand-based charges, this is 15.92% of the total electricity cost for these facilities. The average demand of the buildings (Table 9) has been shown alongside the peak demand (Table 10) to demonstrate the variable loading that can be analyzed for load shifting and savings.
The Corporation of the City of Oshawa procures natural gas through the local Enbridge utility as well as through hedging contracts delivered through consulting services.
The City maintains our contract for consulting services with Blackstone Energy Services Inc.
Table 11: Natural Gas Commodity Cost Jan 2020 to Mar 2023
Table 11 outlines the cost savings that the Corporation of the City of Oshawa has achieved through natural gas hedging contracts since initiation in 2020.
In 2022 carbon tax comprised 26% total of the Corporation of the City of Oshawa’s natural gas costs, with commodity price (44%) and utility costs (30%) constituting the remaining breakdown. The facilities reported in this plan saw an increase in gas consumption of 12% between 2021 and 2022. As outlined in Table 12, the natural gas carbon levy will continue to climb at rates that have been pre-defined until 2030 by the Greenhouse Gas Pollution Pricing Act (GGPPA) in order to establish market certainty and carbon de-intensification. 12
12 Government of Canada, 2018
45 City of Oshawa – Corporate Energy Management Plan
Natural Gas
Gas Procurement Method Amount Blackstone $678,877.75 Enbridge System Gas $994,947.76 Savings with Blackstone $316,070.01
Table 12: Projected Natural Gas Carbon Levy Expenditures for
This table describes the carbon levy the City of Oshawa incurs at the current daily delivery volume of 188 GJ/day. This daily delivery volume constitutes the natural gas delivery to buildings included in our natural gas hedging contract.

46 City of Oshawa – Corporate Energy Management Plan
City of Oshawa
Renewable Energy Resources and Distributed Generation
Multiple opportunities for renewable and distributed energy are available to the City of Oshawa. These measures require additional investigation to determine feasibility, but have large potential for decarbonization.
Renewable option Description
Investigate renewable energy generation on site including solar, wind geothermal and biomass solutions.
On-site generation
Inventory potential future solar housing locations and available capacities.
Indoor recreation centres have high potential for heat recovery.
Community Partnership Opportunities
Energy Storage
Explore technological advances / engage community partners for more cost effective capture of excess biogas from neighbouring wastewater treatment plants, for use in space heating and domestic hot water. Past investigation led to insufficient business case.
Joint district heating and cooling applications for waste heat to energy capture.
Pursue new technological growth in local tech and energy sectors to create partnerships and support community growth. Exploring the transition to fuels such as hydrogen and ammonia could provide opportunities for collaboration.
Investigate energy storage solutions to shift demand, as well as optimize pricing structure changes for EV charging.
47 City of Oshawa – Corporate Energy Management Plan
Agreements
The City holds agreements of the following nature, in promotion of energy conservation and community impact.
Oshawa Power
Combined Heat and Power
The installation at the Delpark Homes Centre in Oshawa allowed for use of existing infrastructure and facilitates local generation for use in emergency situations. The active agreement has provisions for islanding of essential services, adding resiliency to the facility’s designation as an emergency evacuation center.
Solar Panel Housing
The agreement between the City of Oshawa and Oshawa Power contributes to municipal renewable energy generation by housing PV solar arrays that are owned and operated by Oshawa Power on City of Oshawa’s roof structures. These PV systems are located at Civic Recreation Complex, Delpark Homes Centre, Tribute Community Centre, Donevan Recreation Centre, and the Oshawa Power Admin buildings that are owned by the City of Oshawa.
Toronto Atmospheric Fund – EV Charging Funding
Toronto Atmospheric Fund (T.A.F.) invests in urban solutions to reduce greenhouse gas emissions and air pollution. In 2022 through partnership with regional municipalities the City of Oshawa and other regional
partners entered into agreement with TAF to receive federal funding for public use EV Charging installations.
Consultants
WattsW orth Analysis Inc.
Oshawa uses WattsW orth’s services for electrical consumption monitoring and trend analysis.
Blackstone Energy Services Inc.
The City’s agreement with Blackstone is two-fold, including natural gas procurement management and analysis services for those accounts included in the gas procurement pool.
Technical Advisory Contracts
The City of Oshawa holds agreements to gain technical expertise on the following energy related items, on an as needed basis:
• Energy Auditing
• Feasibility Studies
• Contract Scope definition for Energy Conservation Measures
• Energy Saving Projections
• Detailed Engineering Studies
48 City of Oshawa – Corporate Energy Management Plan
Results of Grants and Incentives (2018-2022)
The City of Oshawa aims to improve our readiness to pursue energy related grants and incentives, through implementation of our measurement, verification and metering strategies.
+
$103,480 in incentives in addition to consumption savings of 2,587 MWh/year.
Community Partners
The City of Oshawa is committed to creating positive impact within the community, through sustainable leadership and responsible collaboration. A low carbon future for our community requires ambitious restructuring of priorities and shared ownership of the goals. The City is fortunate to have community partners who are pro-active in developing energy conservation in their culture and pursuits. This plan’s Net Zero targets will promote innovation and continue to invite exciting partnerships.
Oshawa Power
Oshawa Power is rooted in the history of Oshawa’s progress as a city. As leaders in distributed energy resources, Oshawa Power has shared their expertise to support the City of Oshawa’s energy projects over the years. As outlined briefly in the agreements section of this plan, recent projects have included the installation of a combined heat and power (CHP) plant, and photo-voltaic installations on five City of Oshawa’s buildings.
Recent commissioning of the CHP plant has confirmed the islanding ability for the Delpark Homes Centre. Local generation of electricity creates sources of energy redundancy at this facility, allowing for the added resiliency of the facility as an
49 City of Oshawa – Corporate Energy Management Plan
Electric Vehicle Charging Funding
$88,000 Energy Incentive Totals $219,217
IESO Energy Manager Program
emergency evacuation centre. When operational, the waste heat from the CHP is used to reduce loads for the facility’s domestic hot water.
Educational Institutions
Oshawa is home to Durham College, Ontario Tech University, and Trent University’s Durham GTA. The City of Oshawa currently partners with Durham College, Ontario Tech University, Trent University Durham GTA and the University of Toronto, Department of Civil and Mineral Engineering through the TeachingCity program. As a TeachingCity, collaboration with these educational institutions to develop new technologies, share access to facilities, resources and equipment and become a recognized community of research and learning. Past programming has focused on corporate energy management planning, helping to deliver the past C.F.E.M.P.
Recognizing tech and power generation as pillars in both Oshawa’s community and education sectors, the City of Oshawa aims to expand these partnerships as our decarbonization strategy continues to develop.
Durham Region
The Regional Municipality of Durham is a two-tiered municipal government, and is comprised of eight lower-tiered local municipalities; Uxbridge, Brock, Scugog, Clarington, Oshawa, Whitby, Ajax and Pickering (Figure 20) 13 . These neighboring cities and towns form a valuable team, exhibiting a strong energy conscious direction that the the City of Oshawa is proud to play a role in.

Durham Region has built a robust low carbon strategy through community and corporate standards, which help to inform the direction of our local municipal efforts.
• The Durham Community Energy Plan
• The Durham Standard (Corporate Construction)
• Electrification of Regional Transportation
• District Energy Studies
13 UReach Toronto, 2023
50 City of Oshawa – Corporate Energy Management Plan
Figure 20. Map of Durham Region’s local municipalities.
Asset Management Operations and Maintenance
The City of Oshawa relies on internal staff as well as independently organized operators to maintain and operate it’s public facilities. These teams work together to organize resources, best practices and procedures to ensure City facilities remain in excellent quality. Understanding energy efficiency and how it can best be delivered through maintenance and operational protocols requires awareness, training and access to functional relevant data. Energy efficiency involves using technology and tools that require less energy to perform the same functions, and understanding where opportunities exist in M&E systems. Energy conservation similarly requires education, but can be achieved through behavioural awareness and habit changes. 14
Often new technologies come with secondary advantages to energy efficiency and payback benefits such as reduced maintenance needs, more user friendly interfaces, and automation. Operator and skilled trades’ recommendations will help to dictate how these technologies can best be integrated for success. Ideally having the staff working group help define and implement energy efficiency measures (EEMs), will result in a strongly engaged team. A continual line of communication with the energy team will help these operators turn information into action, and can optimize operational tools that are available to staff and contractors.
Operators are tasked with balancing the functional needs of the occupants, while also looking for maintenance and energy efficiencies. Applicable ASHRAE standards such as “Standard 180 – Standard Practice for Inspection and Maintenance of Commercial Building HVAC Systems” establish minimum requirements to preserve a system’s ability to achieve energy efficiency while maintaining indoor air quality and thermal comfort. The coordinator of these elements requires planning, education and adequate technical support. 15
The priority measures for O&M energy efficiency and conservation recommended under this plan are;
• Energy skills training;
• Building automation systems (BAS);
• Re-commissioning; and
• Automated optimization.
14 Martin, 2019, p. 35
15 American Society of Heating, Refrigerating and Air-Conditioning Engineers, 2018
51 City of Oshawa – Corporate Energy Management Plan
O&M Considerations Impact of implementation Plan for delivery
•Review/confirm current training and qualifications of staff
Energy Skills Training
•Building Environmental Systems (BES) Operator Training / Refresher
•BAS specific training
•Energy Efficiency Maintenance courses
•Resources to help inform operators
Good energy efficiency practices require an understanding of how systems are integrated and respond dependently. Technology specific training allows the complexities of BAS and integrated systems to be an asset rather than a barrier to good energy performance.
1. Use the Staff Working Group meetings to determine key areas of opportunity for learning.
2.Identify training that best suits gaps in knowledge for the operations staff. Implement training with staff working group, and define any other relevant staff.
3.Develop procedure for continued training to be integrated into maintenance contract schedules of select systems and BAS.
4.Isolate qualified individuals for specific technical training, and/or resources.
5.Annual review of skills and opportunities for future training.
Building Automation Systems
•Integrate analytics into BAS performance
•Combine BAS platforms for one integrated approach
•BAS specific training
•Standardize and streamline future
Disparate BAS systems increase the amount of time and effort it takes for operators and users to build their knowledge, especially when looking across multiple systems for energy trends. Building in compatibility between the existing and new BAS systems will increase operator response time and the
1.Reference capital assessments for progress on BAS technologies and integration tools.
2.Investigate compatibility of BAS technologies with metering, utility greenbutton outputs, and IoT devices. Ideally developing one system that makes energy data accessible to operational staff, as well as allowing for streamlined energy auditing and planning.
52 City of Oshawa – Corporate Energy Management Plan
O&M Considerations Impact of implementation Plan for delivery
BAS specifications ability to make informed energy
3.Investigate BAS upgrades to provide
Recommissioning
•Integrate BAS with decisions. Data analysis and analytics on existing systems. (to be energy metering energy management go hand in coordinated with #2) and energy software goals hand. Currently there is no link between operational data and energy data, proving to be a limiting element in achieving our energy management potential in operations and planning.
•Re-commissioning built into maintenance every 3-5 years
•Establish energy standards for commissioning procedures
•Ensure maintenance involves KPI to indicate need for commissioning
•Training of operators
Proper commissioning is a building management best practice. Critical energy savings can be realized by undergoing the re-commissioning process, sometimes correcting operational inefficiencies that were not caught in the original installation. Accredited building commissioning providers will identify energy conservation measures and train operators to engage in ongoing commissioning. Benefits include reduce maintenance and energy costs, and increased lifespan.
4 .Detail and integrate BAS energy efficiency consideration into design specifications.
5.Identify energy focused BAS training, for the operators, as a critical success factor in new system installations and include BAS training in routine service contracts with BAS providers.
1.Review current re-commissioning procedures with Staff Working Group, collect feedback.
2.Investigate logistics and funding for including a re-commissioning element into the energy audit program.
3.Investigate use of re-commissioning grants and incentive programs that are offered for existing buildings.
53 City of Oshawa – Corporate Energy Management Plan
O&M Considerations Impact of implementation Plan for delivery
•Standardize set points
•Utilize photocells for ambient lighting minimums, and occupancy sensors
Automated Optimization
•Free cooling optimization
•Optimizing through operational analytics
•HVAC optimization
•Review scheduling of systems
Building automation systems provide automation, however standardizing and analyzing the results can produce more efficient delivery. This also helps to predict energy baselines. Optimizing automation is a continual process, with specific considerations needed to the type of system, use of the environment, as well as impact on comfort. The considerations listed here indicate a starting point for general application to most facilities.
1.Review current automation settings with Staff Working Group, collect feedback.
2.Establish where standards apply.
3.Identify where no-cost measures can be implemented, and review BAS logs to identify priorities.
4.Review cost-benefit of measures that would require operational and capital investment.
54 City of Oshawa – Corporate Energy Management Plan
Quality Assurance
The quality assurance measures described in this section provide the framework for how we will achieve our energy targets, and maintain confidence in our results.
The top priorities for progressing the City of Oshawa’s energy management strategy are outlined below;
- Obtain consistent, accurate energy consumption and expense data;
- Automate energy data collection to optimize people resources for analysis and action of energy initiatives; (provide effective energy tools)
- Better utilize building automation systems for energy data collection, energy efficient programing, real-time monitoring, and operator awareness;
- Track significant energy users specific to each facility;
- Develop and maintain baseline energy profiles for each facility, to monitor and log energy trends;
- Systematic identification and quantification of energy efficiency measures (EEMs); and
- Integrate qualifying parameters for energy specifications into capital planning and project contracts.
Energy Management as a System
The importance of effective energy management has evolved drastically over the past decade since the development of the first Corporate Facilities Energy Management Plan. Many systematic approaches to effectively evaluate and improve energy performance have standardized industry expertise, and are available to guide energy conscious operations. According to the Clean Energy Ministerial (CEM) Energy Management Working Group, energy management systems have the potential to save up to 40% of the total energy use in commercial buildings. 16 Natural Resources Canada recognizes ISO 50001 as an effective approach, and in the past has offered funding associated with adoption of this program.
16
55 City of Oshawa – Corporate Energy Management Plan
Natural Resources Canada, 2023
“The ISO 50001 Energy Management Systems Standard is an internationally recognized voluntary standard that gives organizations a structured framework to manage energy. ISO 50001 integrates energy efficiency into management practices to increase awareness of energy use, reinforce good energy management behaviours and make better use of existing energy-consuming assets and processes. It also helps organizations to evaluate and prioritize the implementation of new energy-efficient technologies”.16
The ISO 50001 Ready Program has been developed by Natural Resources Canada to assist organizations in implementing energy management systems for their vertical assets, without full adoption of the ISO50001 requirements. The program provides the opportunity for recognition by completing 25 tasks. These tasks include checklists, considerations of risk, and best practices. Recognizing that not all elements of the 25 point program directly align with the City of Oshawa’s current priorities, the relevant tasks in this program will be identified and used as a resources in delivering the listed quality assurance measures. As the energy management system within the City of Oshawa develops, satisfying either ISO 50001 Standard requirements, or all ISO 50001 Ready Program steps will be reviewed for added benefits.
Quality Assurance Measures
Energy Audit Program
Historically, the City of Oshawa has utilized external energy audits intermittently to identify the strength of specific energy opportunities. The adoption of a facility audit schedule, and energy audit standard is a suggestion carried forward from the past plan. This addresses the missed energy opportunities when a systematic approach is not implemented. Audit programs improve tracking of building specific performance, and are a component of establishing baseline operation. 17 The facilities energy team will select the appropriate audit standard with consideration given to the c, and Standard 211-2018 - Standard for Commercial Building Energy Audits. The audit program will define where level 1, 2, or 3 energy audits are assigned. Audits will be used to identify critical energy consumers, analyze consumption profiles, trends in peak demand operation, and will investigate energy rates for financial opportunities. Significant end uses (SEUs) will be targeted for energy performance evaluation.
Outcomes associated with building energy audits include:
• Optimization of set points, dead bands and standard seasonal automation settings
• Understanding the load profiles of key end use mechanicals
17 American Society of Heating, Refrigerating and Air-Conditioning Engineers, 2011
56 City of Oshawa – Corporate Energy Management Plan
• Load shifting off of peak demand timing
• Identifying right size specifications for future capital planning
• Generate capital improvement projects for energy conservation
• Reduce energy costs through operational changes, energy commodity contract changes, or behavioural changes
• Encourage communication with operators and end users to understand operational trends
QA Measure Inclusions Impact of implementation
Plan for delivery
Energy Audit Program to be initiated in 2023/2024. Audits will operate on a An energy audit program will rotating schedule of phases, with
Energy Audit Program
•Audit Schedule
•Audit Standard
•Internal audits
•External audits (delivered by others)
•Documentation and discussion with operators
deliver consistent evaluation of the state of energy efficiency for each facility asset, and build a reference of energy related documentation for each facility. Energy conservation opportunities for immediate action where possible, or alignment with capital budget.
priority and redundancy given to the following types of assets as needed.
1.Critical Infrastructure (Emergency Evacuation Centre, Fire Halls, City Hall, Operations Depots)
2.Buildings with increasing Energy Use Intensity
3.Buildings with specific capital interest for upcoming years
57 City of Oshawa – Corporate Energy Management Plan
Measurement and Verification
Energy savings in a facility are not easily quantifiable, because savings represent the absence of consumption or demand. Quantifying savings based on measurements in energy use, before and after implementing a project is the most accurate way to measure the real impacts of an energy project. The process of doing this is referred to as measurement and verification (M&V). M&V is fundamental to energy efficiency financing, energy performance contracting, energy performance management, GHG accounting efforts, and many government and utility programs. 18
The International Performance Measurement and Verification Protocol (IPMVP) is recognized as a best practice methodology to ensure that the savings and impact of energy efficiency and sustainability projects are accurately measured and verified. The protocol is mostly non-prescriptive, and allows adaptation to suit each energy project’s needs.
IPMVP provides a framework that is used to verify that a project has the potential to perform and save energy, and quantify site-level energy and cost impacts from a targeted project. Both of these components are essential to the measurement and verification (M&V) of savings.
Furthermore, without proper M&V the following challenges have been identified;
• Insufficient data is available to make informed decisions on energy efficiency measures and how they will impact the operational loads in the City of Oshawa’s facilities.
• Inability to pursue funding and grant opportunities that would significantly advance the City of Oshawa’s ambitious greenhouse gas reduction targets, and optimize on federal infrastructure investments for our community.
• Lack of clarity on actual savings achieved, necessitates systematic approach to capturing consumption metrics prior to project initiation.
Training offered through the Canadian Institute for Energy Technology (CIET) for the Certified Measurement and Verification Professional (CMVP) or comparable training is recommended for qualified energy staff. This training will ensure proper considerations are made when developing and facilitating M&V plans.
Energy metering is a critical element of proper measurement and verification. The City of Oshawa does not currently meter any energy consumption in addition to the facility installed utility meter. A portable electrical clamp monitor is used for 18 Efficiency Valuation Organization, 2023
58 City of Oshawa – Corporate Energy Management Plan
electrical consumption monitoring of pre/post project loads, although this approach has limitations in accuracy and does not provide certified results required for funding opportunities. A metering strategy is recommended to clearly define the types of meters that may be utilized, (sub-meters, power meters on significant projects, or hourly interval meters) and when to do so. Other municipalities have implemented thresholds to include metering with retrofit projects. For example, the City of Markham installs a power meter with retrofit projects where anticipated electrical cost savings exceed $10,000.19
M&V procedures for many energy incentive and grant programs require an “approved meter” to be used to define the project boundaries. Meters that meet Measurement Canada requirements for revenue billing, that have been tested and sealed and had a Measurement Canada S-E-04 inspection are typically required.
Measurement and Verification Standards
•Measurement and
Metering Technologies
•Formal M&V plans for significant energy projects
•Design M&V plans according to IPVMP
•Energy Metering Strategy
•Training of Qualified Staff
Supporting energy management with measurement and verification practices reduces risk in energy
planning, allows for informed decision making, while encouraging duplication of successful projects. Metering technologies measure energy consumption of a defined project boundary or sub-meter at the facility level when energy data is not available at the required interval or accuracy from the utility. M&V plans with metered consumption are required for many incentive and grant applications, with the potential to provide ongoing funding for future energy conservation measures.
1.Standardize an M&V protocol for energy projects, following IPVMP standard.
2.Develop energy metering strategy that incorporates estimated costs, metering types, thresholds for installation and compatibility with the City’s planned method for energy data presentation.
3.Have qualified energy staff take measurement and verification training.
QA Measure Inclusions Impact of implementation Plan for delivery
59
City of Oshawa – Corporate Energy Management Plan
19 Martin, 2019, p.20
Processes and Procedures
QA Measure Inclusions
Impact of implementation
Plan for delivery
Processes and Procedures
Data Analysis
• Life Cycle and Capital Planning
• Specification Standards
• Budgetary Inclusions
• Energy Related Project Delivery Processes
• Procurement Processes
Integrating an energy management component alongside existing processes and procedures will help to elevate decarbonization efforts. Processes should include responsibilities for all relevant staff, encouraging repeatability and creating strong engagement across the organization.
1. Collaborate with respective teams to align existing processes and procedures with energy management.
2. Create an implementation timeline, with hierarchy of focus. Start small and build out the processes to be more involved.
QA Measure Inclusions
• Maintain baseline database for each facility
• Routine and systematic review of billing
•Routine analysis with consultants
Data Analysis
• Benchmarking with regional and provincial municipalities
•Automate where possible
Impact of implementation Plan for delivery
Data analysis supports capital decision making and development of energy efficiency measures to reduce consumption. A current limitation is a lack of regular assessment and data trend collection. This limitation is mostly due to lack of automation in the City’s data collection and analysis systems. Energy management software will play a key role in optimizing data analysis and expanding the potential of the City’s energy team.
1.Establish baseline data sets and systematic review of measured parameters.
2. Establish Key Performance Indicators (KPI) for each facility.
3. Define opportunities for data sharing and make data available to all identified staff.
60 City of Oshawa – Corporate Energy Management Plan
Energy Management Software
QA Measure Inclusions
Impact of implementation
Plan for delivery
Energy Management Software
• Integrate multiple forms of data collection into one system
• Allow for automation
• Real time optimization
• Efficient Reporting
• Link BAS data to consumption data
Eliminates the need to compile data from multiple locations before performing analysis. Reduces the maintenance required to upkeep various databases of energy information. Energy management software will allow staff to better understand consumption data, and spend time looking for efficiencies rather than on tedious inputs. Energy management software encourages the operational staff and the energy team to share access and provides transparency between how similar facilities compare.
Investigate software technologies including the option for a BAS analytic layer described in operational measures. Solutions should accommodate the presentation of utility data, IoT devices, interval metered data, as well as BAS outputs and provide configurable data analytics.
61 City of Oshawa – Corporate Energy Management Plan
Capital Investments
Aligning capital investments with the long-term energy strategy maximizes resources and benefits of all projects delivered. Three types of capital investment are necessary to advance decarbonization within the Corporation of City of Oshawa;
1. Decarbonizing through defined energy standards applied to all capital projects at design and delivery levels;
2. Investments in energy technologies for auditing, measurement and verification, automation and analysis; and
3. Capital investments in energy specific projects to advance corporate goals of decarbonization.
Corporate Facilities Green Building Standard
Green Building Standards are being developed globally at all levels of oversight including federally, regionally and for both municipalities and corporations. These standards provide a prescriptive framework for building design, construction, renovation and maintenance procedures that reduce non-renewable energy consumption.
It is recommended that the Oshawa Corporate Facilities Green Building Standard be created to prescribe guidelines in the following areas:
• New construction
• Retrofit to existing construction
• Maintenance replacements
The 2030 Energy Reduction Plan defines the carbon footprint of buildings requiring a “whole-of-government and whole-ofeconomy effort focusing on regulatory, policy, investment, and innovation levers” in order to drive decarbonization. 20 The Canada Green Building Strategy was developed in July 2022 in accordance to the 2030 E.R.P., defining various areas of support that the federal government is extending to transform Canada’s built environment. The Corporation of City of Oshawa will aim to develop our Corporate Facilities Green Building Standard to utilize the programs made available. Development of the Corporate Facilities Green Building Standard will include, but not be limited to, reference of the following standards;
• Durham Region Design Standard 2023; 20
62 City of Oshawa – Corporate Energy Management Plan
Environment
and Climate Change Canada, 2022
• National Energy Code for Buildings 2020;
• LEED BD+C New Construction v4.1;
• LEED O+M Existing Buildings v4;
• Canada Green Building Council Zero Carbon Building Standard v2;
• Available municipal Green standards (i.e. Whitby, Toronto, Mississauga, Vancouver);
• American Society for Heating, Refrigeration and Air-Conditioning Engineers (ASHRAE)Standard for The Design of High-Performance Green Buildings Except Low-Rise Residential Buildings (ASHRAE 189.1 – 2017)(ASHRAE);and
• Canadian Green Building Council’s Zero Energy Performance Index (zEPI).
Funding
Responsible allocation of municipal resources is of the utmost importance and remains a priority consideration for energy management expenditures. Advancing the City’s greenhouse gas reduction targets, and energy conservation measures is an endeavor that returns on investment through energy cost avoidances, and transforms the City’s assets to avoid future financial risk. Energy related projects are normally funded by the Revolving Energy Fund (R.E.F.) Reserve and the Canada Community Building Fund. In future, it is recommended that an increase in funding be considered, to ensure the progress indicated in this plan is achieved, and the financial benefits of energy efficiency are realized to their full potential.
Revolving Energy Fund Reserve
In 2018, the City’s R.E.F. Reserve was approved as a method to financially support energy conservation projects and initiatives. The reserve is populated by 100% of the energy efficiency project incentives received, as well as 100% of the utility and maintenance cost avoidances realized during the first year following project implementation. Utility savings deemed to be associated with energy projects, and avoidances through management of rate structures are also contributed to the fund. Future reductions are then absorbed in the second year of operation as savings to the operating budget.
Energy projects that support the goals of the C.E.M.P., and meet simple payback criteria of 10 years or less, can be submitted for approval through the annual capital budget process. At this time, withdrawals from the reserve may not exceed
63 City of Oshawa – Corporate Energy Management Plan
10% of the uncommitted balance, which has encouraged the accumulation of funds since the creation of this reserve. The balance of the reserve as of December 31st, 2022, is $1,343,592. This total amounted from the savings and incentives delivered by energy projects between 2018 and 2022.
Approval for appropriate measures outlined in this plan will be submitted as capital funding requests from the R.E.F. Reserve for Council approval through the annual budget process.
Canada Community Building Fund
The Canada Community Building Fund was previously known as the Federal Gas Tax Fund. It provides a source of funding to provinces and territories, who in turn flow this funding to their municipalities to support local infrastructure priorities. 21 The delivery of this fund is facilitated through the Association of Municipalities of Ontario. Energy projects fall into the community energy systems, fire hall, recreation, or capacity building categories for funding, depending on project scopes.
Capital Projects
Capital investment in energy projects from 2018-2022 contributed to reduced energy intensity of 14.4(kBtu/ft²), compared to the 2017 baseline.
Capital alignment with energy investments has allowed coordination between equipment at end of useful life, with energy upgrades to serve a dual purpose of advancing energy conservation measures while investing in scheduled asset renewals.
64 City of Oshawa – Corporate Energy Management Plan
21 Association of Municipalities of Ontario, 2023
Table
Project Type Locations Annual Energy Reduction LED Lighting Upgrades and De-lamping PG1 Centre St Parkade PG3 Mary St Parkade Northview Community Centre Delpark Homes Centre Fire Hall 1 Fire Hall 3 Fire Hall 4 Animal Services Civic Recreation Complex Tribute Communities Centre Harman Park Arena Donevan Recreation Complex South Oshawa Community Centre TBD TBD TBD 1232 MWh 34 MWh 27 MWh 5 MWh 4 MWh 26 MWh 383 MWh TBD TBD TBD BAS Upgrades / Lighting Controls Delpark Homes Centre Harman Park Arena Consolidated Operations Depot 200 MWh 36 MWh 35 MWh HVAC Retrofits HVAC System Retrofit Boiler Replacement Animal Services 5 MWh 18 MWh 103 MWh 19 MWh 51 MWh 31MWh TBD VFDs /scheduling City Hall HVAC Efficiency Upgrades Chiller Replacement Civic Recreation Complex Dehumidification Units Upgrade Delpark Homes Centre RTU Upgrade Airport HVAC Redesign/ Building Envelope Fire Hall 1 Ice Plant Optimization Tribute Communities Centre 439 MWh Waste Heat Recovery Donevan Recreation Complex Delpark Homes Centre 25 MWh 24 MWh
65
City of Oshawa – Corporate Energy Management Plan
13. Capital Energy Projects delivered (2018-2022)
Summary of cost avoidances delivered to the City of Oshawa by facility projects in Table 13, are indicated below:
66 City of Oshawa – Corporate Energy Management Plan
LED Lighting and Upgrades $ 1,728,760 HVAC Retrofits $ 531,402 BAS / Control Upgrades $ 51,045 Boiler Upgrades $ 39,964 Heat Recovery Units $ 12,596
LED HVAC Retrofits Boiler Upgrades Heat Recovery
Figure 21. Summary of cost avoidances from facility capital projects (2018-2022)
Table 14. Current Energy Related Capital Investments
Fire Hall 4 HVAC Replacement
Fire Hall 1 HVAC Retrofit
Fire Hall 1 Building Envelope Improvements
Lighting Replacement Program
Replacement of original HVAC infrastructure from 1981.
Upgrade to boiler and retrofit of HVAC and air distribution system.
Replace select aluminum windows, and door system.
Rolling program with the 2023 budget allocated for retrofit of the select lighting at City Hall. $50,000
cost avoidances of $4,000/year, plus reduced maintenance
cost avoidances of $5,300/year (34,500 KWh)
cost avoidances of $4,500/year (30,000 KWh)
cost avoidances of $1,650/year (15,000 KWh)
Northview Library Lighting Upgrades
Upgrade of original facility lighting from 1986. Fixtures are obsolete and inefficient. $200,000 (Phase One)
cost avoidances estimated at $4,250/year (35,000 KWh)
Mary Street Leasehold Improvements
HVAC Upgrades
Retrofit of original electrical heating and cooling system. New air to air heat pumps installed with remote condensing units.
$300,000
cost avoidances estimated at $22,478/year (112 MWh)
Electric Vehicle Charging Stations
Installation of one dual charger at the City Hall west parking lot.
Carbon emissions reduction of approx. 6,250 KgCO2e/year. Promotes EV conversion through corporate culture.
67 City of Oshawa – Corporate Energy Management Plan
Investments Description Project Budget Anticipated Energy $ / Impact
Capital
$1,200,000
$1,600,000
$200,000
$100,000
Building Condition Audits (assessments)
Ongoing program that delivers life cycle analysis of facilities, incorporating each vertical asset within a two year phased approach. Potential energy savings identified as a secondary benefit of this program.
$150,000
TBD - Items with energy conservation opportunities are flagged for further assessment
Energy Audits (assessments)
Internal/external audits to be performed this year, initiating the energy audit process described in the QA section of this plan.
approx. $50,000 TBD by results of audits
68 City of Oshawa – Corporate Energy Management Plan Capital Investments Description Project Budget Anticipated Energy $ / Impact
Electric Vehicle Charging Stations
The Energy Reduction Plan (E.R.P.) for 2030 has developed a “light duty vehicle (LDV) zero emission vehicle (ZEV) mandate, which will set annually increasing requirements towards achieving 100% LDV ZEV sales by 2035, including mandatory interim targets of at least 20% of all new LDVs offered for sale by 2026 and at least 60% by 2030”. 22 The impact of transforming the light duty transportation sector alone is noted to have potential for 48% reduction of transportation sector emissions. Infrastructure to support charging of these vehicles is essential to this transition for residents and the City of Oshawa alike.

The figure demonstrates 88 Mt CO2e reduction of Canada’s transportation sector emissions that would be achieved in the full transition to light duty new zero emission vehicles.
The City of Oshawa installed 16 level two charging stations (14 of which are public facing) as a capital project in 2022.
$88,000 of funding was received through Canada’s Zero Emission Vehicle Infrastructure Program, facilitated through TAF as outlined in the agreements section of this plan.
69 City of Oshawa – Corporate Energy Management Plan
Figure 22. Emissions of Canada’s transportation sector by vehicle type, 2019 (Mt CO2e)
22 Environment and Climate Change Canada, 2022
Table 15.
and Use of City of Oshawa's Public EV Charging Stations
The totals shown in this figure represent charging data from the time City of Oshawa chargers were made operational in August 2022, until the end of Q1 2023 (March 31, 2023).
According to 2022 review of electric vehicle charging station municipal data, the City of Oshawa has seen the highest total number of sessions per EV charger made available by a municipality in the region. 23 The total amount of kWh charged is also the second highest per charger (following Clarington) despite only being operational for half the amount of time when compared to the other chargers in the Region. These numbers are in reference to the chargers installed by the City of Oshawa and do not include other EV chargers installed throughout the city.
70 City of Oshawa – Corporate Energy Management Plan
Parking Location Station ID Average Session (Minutes) Total Session (Minutes) Total Energy (kWh) Civic Recreation Complex AAB-21780 210 25,337 1260.301 Civic Recreation Complex AAB-21767 161 13,759 950.629 Consolidated Operations Depot AAB-21768 387 14,704 968.593 Consolidated Operations Depot AAB-21772 436 29,196 2342.32 Delpark Homes Centre AAB-21770 239 50,273 3538.736 Delpark Homes Centre AAB-21777 171 46,318 3180.252 Parking Garage 1 - Centre St AAB-21764 181 35,356 2163.225 Parking Garage 1 - Centre St AAB-21754 174 15,050 970.369 Parking Garage 2 - McMillan AAB-21774 291 10,240 758.278 Parking Garage 2 - McMillan AAB-21776 150 1,585 64.924 Parking Garage 3 - Mary St AAB-21762 319 26,021 2017.844 Parking Garage 3 - Mary St AAB-21759 262 24,9851466.801 South Oshawa Community Centre AAB-21775 161 14,778 853.318 South Oshawa Community Centre AAB-21781 194 14,752 1002.009 Totals 209 322,354 21,537.60 423 Total Sessions 279 175 77 169 195 185 151 2990 546 392 152 62 22 162
Location
23 Town of Whitby, 2023
This may be explained by the City of Oshawa being the only municipality which is operating without charging fees.
As the initial phase of this EV charging pilot program appears successful, review of charging fees is recommended. It is suggested that a portion of potential future fees be considered for re-investment in the Revolving Energy Fund Reserve, advancing the Net Zero strategy of the City. This strategy is currently modelled in other municipalities, where session charges are made to exceed electricity costs.
Limitations of continuing not to charge a fee include:
- No offset of operation and maintenance costs incurred by the City
- Individuals using the City’s chargers as personal chargers, occupying for the duration of the day and reducing community availability
- Current EV owners are typically able to afford the cost of fueling (issue of equity for municipal investment)
The City of Oshawa will rely on industry expertise and continued analysis of local charging data to determine appropriate thresholds for when rates may be proposed.
It is understood that EV ownership and demand for municipal chargers will increase as EV supply and market uptake change. In the interim it is recommended that the City of Oshawa explore sponsorship opportunities to cover operational and maintenance deficits that are incurred. Similar sponsorships have been received by utility partners in other communities.
71 City of Oshawa – Corporate Energy Management Plan
Fleet Services
The following items were set out as G.H.G. reduction measures for Fleet Services in the Corporate G.H.G.R.P.
Table 16: Fleet Services - Corporate Greenhouse Gas Reduction Initiatives
Item Description Status
Updated on #3 – Fleet Optimization
(#3) Fleet optimization
Determine optimal routes for fleet vehicles and undertake corrective maintenance
Ongoing as we continue to leverage new data captured from our GPS system.
(#10) Use of renewable fuels
Ongoing
Updated on #10 – Use of renewable fuels
Returning to the use of B10 this spring.
Updated on #12 – Fleet Upgrades
Use renewable fuels where feasible
Returning to lower emission fuel B10
(#12) Fleet upgrades
Vehicles replaced and right sized with more energy efficient models. Purchased hybrids where feasible
Procurement of Electric Vehicles and EV charging stations in progress
(#31) Fuel cells and alternatives fuels
Investigate fuel cell technology for City fleet vehicles, propane, natural gas, ethanol, biodiesel and electricity
Conversion kits purchase and installed in 10 vehicles. 10 hybrid drive MLE vehicles employed.
In the fall of 2022, the City submitted EV charging infrastructure project details to NRCan in hopes of obtaining subsidy funding totaling an additional $400,000 on top of the already approved project funding of $500,000 in the 2022 capital budget. Should this project gain federal support, Fleet Services plans to install 20 dual head level 2 chargers (40 charge plugs) and 2x 100amp level 3 chargers at the COD. Fleet Services has also issued purchase orders for its first 9 fully electric vehicles for receipt in the summer of 2023.
Updated on #31 – Fuel cells and alternative fuels
Beyond increasing our biodiesel content in warmer months and the upcoming adoption of fully electric vehicles, Fleet Services employed 10 hybrid drive special service vehicles in MLE (class 00) and 10 varied vehicles which were converted to run on propane autogas. Since Jan 1, 2021 until Feb 28, 2023, G.H.G. reductions have totaled 169.88 Tonnes CO2e from those 20 vehicles alone.
72 City of Oshawa – Corporate Energy Management Plan
Table 17. Fleet Fuel Emissions by Fuel Source
73 City of Oshawa – Corporate Energy Management Plan
Cle con Ga con Pro CO Year Type of Fuel Consumption (L) Cost GHG Emissions (Tonnes CO2e) 2022 Unleaded 263,379.56 $373,966.74 605.45 2022 Diesel 664,829.26 $1,092,223.48 1,816.49 2022 Propane 89,796.12 $82,127.19 137.58 2022 Total 1,018,004.94 $1,548,317.41 2,559.52 2021 Unleaded 302,700.23 $316,339.02 695.84 2021 Diesel 586,979.36 $624,175.69 1,603.79 2021 Propane 31,681.52 $28,013.49 48.54 2021 Total 921,361.11 $968,528.20 2,348.17 2020 Unleaded 325,238.03 $263,894.73 747.64 2020 Diesel 601,392.57 $507,065.35 1,643.17 2020 Total 926,630.60 $770,960.08 2,390.81 2019 Unleaded 314,147.11 $291,339.65 722.15 2019 Diesel 609,889.58 $588,472.70 1666.38 2019 Total 924,036.69 $879,812.35 2388.53 2018 Unleaded 455,024.32 $461,629.67 1045.99 2018 Diesel 568,252.99 $601,476.30 1552.62 2018 Total 1,023,277.31 $1,063,105.97 2598.61 Grand Total 4,813,310.65 $5,230,724.01 12,285.64 l Source ar ULSD – 2.7kg of CO2/L sumed soline – 2.3kg of CO2/L sumed pane Autogas – 1.5kg of 2/L consumed
Fleet Fuel Emissions by Fue
Street lighting
As part of an investment grade audit performed in 2016 by Realterm Energy, the City of Oshawa investigated the inventory of high pressure sodium (HPS) street lighting and upgrade options. The results of the audit recommended appropriate lightemitting diode (LED) replacement fixtures for LED conversion, and implemented the conversion of existing HPS lightings in 2016 and 2017. The electrical savings associated with this change are detailed in Fig. 23 below, showing an annual reduction to the kWh load of 52%. The annual peak demand was also reduced by over 50%. The approximate cost avoidance in the year following conversion was $825,000. This avoided consumption has been consistent since the conversion in 2017. Despite adding 1437 streetlights between 2016 and 2023, the cost for streetlight operation was approximately $950,000 lower in 2022 than 2016 billing, with the majority of these savings attributed to the LED upgrades. The annual inventory for streetlights in 2007 is estimated to be similar to last recorded inventory in 2009, apportioning the 92% of the 2016 load according to fixture counts, estimates 4,191,278 kWh of reduced consumption since 2007.
STREETLIGHT ELECTRICAL CONSUMPTION


74 City of Oshawa – Corporate Energy Management Plan
0 500 1,000 1,500 2,000 2,500 0 200,000 400,000 600,000 800,000 1,000,000 1,200,000 2016 2017 2018 2019 2020 2021 2022 2023
Usage (kWh) Demand (kW)
Figure 23. Streetlight Electrical Consumption (2016-2022)
Maintenance advantages
In general there are less maintenance costs associated with LED technology compared to the older HPS streetlights. LED streetlights last up to 20 years, require no routine maintenance, and have less components that can breakdown compared to HPS technology. Our LED streetlights installed during the City’s conversion also came with a 10 year replacement warranty. In general, our streetlight maintenance calls were greatly reduced after converting to LED. Our LED warranty claims have remained within the range we expected, with no significant increase in LED failures.
HPS fixtures require routine maintenance including bulb re-lamping and lens washing every 4 yrs. Over a 20 year period, they would likely require a replacement ballast and/or starter.
The City is waiting for guidance on dimming regulation under the RP8 Street lighting Guide before exploring dimming strategies. Oshawa Power will also need to be consulted if guidance changes to allow dimming, as they approve the hydro metering utilized to calculate electrical consumption with dimming. This has been a roadblock for other municipalities as there is limited metering equipment that has been approved by utilities in Canada. It can be noted that all the City’s streetlights are equipped with a 7-pin photocontrol receptacles which will allow them to accept dimming/adaptive control equipment in the future.
Solar Street Lighting
The City opted for the installation of a solar powered streetlight at the intersection of Given Road and Winchester Road East, in order to avoid costly install and potentially prohibitive review process that would be involved with extending Oshawa Power distribution lines at this location. Solar street lights are a green technology which are powered by batteries which are charged during the daytime by solar panels. The output from solar collection of this panel maintains performance during winter months, and allows the light to operate independently from the grid. As outlined by committee report CS-19-36, the investment by the City was approximately $20,000, estimated to be a minimum of $15,000 less expensive than the electrical grid powered alternative in this situation. The success of this installation encourages the exploration of solar lighting for future installations, as well as pilot projects to investigate solar lighting of trails.
75 City of Oshawa – Corporate Energy Management Plan
Solar Parking Meters
Solar parking meters have replaced existing meters and been installed for all new meters since 2015. The option for remote pay through the “Honk” parking application is being utilized to reduce the carbon footprint of new parking meter installations in select locations. Parking pay stations in parking garages remain hardwired.
Parking meter inventory:
• Total number of pay by plate units with solar panel – 100
• Hardwired parking garage pay stations – 5
• Coin style city parking meters (no electrical) – 197
76 City of Oshawa – Corporate Energy Management Plan
Summary of Recommended Actions
Focus Area Action Objective
Remain in line with 2030 federal and regional goals for 40-45% G.H.G. emission reduction from 2007 baseline.
To meet the goal of federal and regional alignment stated in the Oshawa Strategic Plan.
Corporate Targets
Align with federal and regional goals to have Net Zero Emissions by 2050.
Establish tracking of full corporate emissions footprint.
To meet the goal of federal and regional alignment stated in the Oshawa Strategic Plan.
To provide an accurate and complete assessment of corporate carbon footprint.
77 City of Oshawa – Corporate Energy Management Plan
Focus Area Action Objective
The City of Oshawa Corporate Energy Advisory Team
Use the 2024-2028 term to establish a corporate energy team with the appropriate stakeholders to advance long term energy initiatives. This will support community collaboration on energy projects and future ideation of what is possible for the City of Oshawa.
Organizational Structure
Establish energy focused teams to support corporate carbon reduction activities and promote energy related partnerships, inclusive of:
Facilities Energy Management Steering Team
Management level team to support energy projects for mechanical optimization of facilities.
Energy Staff Working Group
Combining the efforts of energy management team and the operational personnel with an on-site focus for energy efficiency measures.
Focus Area Action Objective
Awareness and Education
Engage staff in energy awareness and education through i-Learn and i-Connect, and other educational means as relevant to their involvement in the City.
Strengthen the corporate culture of sustainability and produce energy conservation awareness.
78 City of Oshawa – Corporate Energy Management Plan
Focus Area Action Objective
Develop a Net Zero Retrofit Strategy targeting 80% of 2007 baseline emissions.
To create a strategy for active long term planning toward the targets that are proposed.
Define top consumers best suited for fuel switching.
Ensure the buildings with the highest potential for success, and least amount of risk are pursued for the Net Zero Retrofit designs.
Net Zero Retrofit Strategy
Complete Net Zero Retrofit designs through detailed engineering studies.
Complete shovel ready designs allow for confidence in future compatibility of systems, which will require a staged approach for implementation, when making fuel switching decisions. Increased ability for planning, successful grant applications and capital asset renewal alignment.
Create roadmap for delivery. Define technologies and key coordination requirements to align with mechanical functionality and project asset renewal.
Focus Area Action Objective
Capital Investments
Development of the Corporate Facilities Green Building Standard.
Reduce energy consumption and environmental impact by prescribing guidelines for new construction, retrofit construction and maintenance replacements.
79 City of Oshawa – Corporate Energy Management Plan
Focus Area Action Objective
Explore implementation of Electric Vehicle (EV) Charging rates and/or potential sponsorship.
To ensure the City is able to support EV uptake for the public, while not incurring maintenance deficits or large operational costs.
Capital Investments
Investigate contributions to the Revolving Energy Fund Reserve from Electric Vehicle rates.
Contribute to future EV infrastructure or load reduction in facilities that can support the additional electrical load incurred to the facilities by the charging stations.
Focus Area Action Objective
Investigate financial benefits for hedging of electricity.
As market changes unfold, the way electricity is purchased is anticipated to change. The City of Oshawa should assess opportunity hedging provides for savings.
Assess methods of load reduction for demand cost savings.
Reduce the peak loading of facilities for fiscal benefit, grid reduction and increased capacity for facility operation within electrical service.
Energy Commodities
Fuel switching and natural gas load reduction.
Reducing dependence on natural gas aims to advance decarbonization goals, as well as prepare for future gas levies.
Assess renewable energy opportunities.
Assess renewable energy opportunities to support Net Zero Retrofit targets. Provide local energy generation, reducing grid consumption, source energy intensity and bills.
80 City of Oshawa – Corporate Energy Management Plan
Focus Area Action Objective
Automated optimization review and standards.
Review of current automation settings for optimized performance. Assess applicability of standards development for facility mechanical set points.
Integrate building automation systems with energy data.
Review methods to link data analysis with energy trends, providing energy staff and operators ability to analyze effectively.
Operations and Maintenance
Provide energy skills training for mechanical efficiencies.
Define gaps in knowledge for operational staff to support energy efficient practices. Invest in education and training.
Assess use of re-commissioning in maintenance plans.
Ensure maintenance of design conditions for efficient operation. Assess operational changes from design intent and adjust to promote efficient performance of mechanical equipment. Leverage funding opportunities available.
81 City of Oshawa – Corporate Energy Management Plan
Focus Area Action Objective
Develop an Energy Audit Program to deliver consistent evaluation of energy efficiency opportunities.
Standardize measurement and verification procedure to support energy monitoring of facilities and projects.
Provide measurement and verification training for qualified energy management staff.
Identify energy conservation opportunities for immediate action or alignment with capital budget.
Ensures quality of measurement and verification procedures delivered.
Ensures quality of measurement and verification procedures delivered.
Quality Assurance
Develop a metering strategy that defines cost of metering technologies, presentation methods and thresholds to prescribe installation.
Integrate energy management into project delivery processes to have baseline energy prescriptions for projects.
Establish baseline data sets and a systematic review of measured parameters for each facility.
Create access to energy data for operational staff.
Allows for essential information to be collected about the impact of energy efficiency measures, increases repeatability of successful projects and allows the city to qualify for grants.
To support the energy standards set in the Corporate Facilities Green Building Standard, as well as ensure grants and incentives are obtained.
Establish KPI for each facility's operation to ensure energy efficiency opportunities are identified.
To inform and empower those individuals making mechanical decisions of the direct impacts on energy use.
82 City of Oshawa – Corporate Energy Management Plan
Focus Area Action Objective
Determine optimal routes for fleet vehicles.
Use renewable fuels where feasible.
Corporate Fleet Vehicles replaced and right sized with more energy efficient models.
To reduce the emissions associated with the operation of City of Oshawa's fleet vehicles.
Electric Vehicle infrastructure installation at Consolidated Operations Depot. Support the electrification of fleet vehicles.
83 City of Oshawa – Corporate Energy Management Plan
Appendix A – Status of Corporate G.H.G.R.P. items
A. Capital Projects and System Retrofits
84 City of Oshawa – Corporate Energy Management Plan
Item Lead Department Description Status Solar-powered parking meters Community and Operations Services Installed solar-powered parking meters Completed 2010 Ameresco projects (and other identified energy efficiency projects) Safety and Facilities Services, Economic and Development Services Replaced heating, lighting, windows, ventilation and heating ventilation and air-conditioning (HVAC) systems at City Hall, the Arts Resources Centre, McLaughlin Library and Robert McLaughlin Art Gallery Completed 2011 City Hall Revitalization Project (CHRP) LEED or comparable green building standard Safety and Facilities Services, Economic and Development Services CHRP built to LEED standard Completed 2011 White rooftops Safety and Facilities Services installed white rooftops on certain existing buildings to reduce urban heat island effect (CHRP) Completed 2011 Boiler replacement Safety and Facilities Services Boiler replacement at Seniors Centres Completed 2012 Solar panel installation Safety and Facilities Services Community and Operations Services Delpark Homes Centre, Donevan, GM Centre and Civic Complex (Oanels owned by the OPUS) - roof space is rented from the City Completed 2013 Lighting upgrades Safety and Facilities Services Lights upgraded in buildings City-wide Completed 2013 Rink upgrades Safety and Facilities Services Community and Operations Services Upgraded and replaced rink equipment, controls and condenser units at Harman Park Arena Completed 2013 Convert oil furnaces to gas Safety and Facilities Services Converted furnaces at Bathe Park and Sunnyside Community Centres Completed 2014
85 City of Oshawa – Corporate Energy Management Plan Item Lead Department Description Status Ultra-violet (UV) systems Safety and Facilities Services Community and Operations Services Installed of UV systems for pools at Donevan, Delpark Homes Centre, Civic and South Oshawa Completed 2015 Lighting upgrades Community and Operations Services Lights upgraded at Alexandra Park Tennis Court Completed 2015 Combined Heat and Power (CHP) Safety and Facilities Services Community and Operations Services Install CHP project at Delpark Homes Centre Centre Completed 2022 LED conversion Community and Operations Services Convert all older street lighting to LEDs - Continue to investigate converting all of City street lights to LED Completed in 2017 (CS-17-48) LED conversion and controls Safety and Facilities Services Investigate converting lights in the parking garages to LEDs and add motion and photocell sensors to lights Completed in 2017 Boiler upgrades Safety and Facilities Services Community and Operations Services Investigate and install instant hot water heaters at Northview Community Centre and Civic Complex Completed 2018 LED conversion Safety and Facilities Services Gradually replace LED lighting at Delpark Homes Centre parking lot Completed 2017 LED conversion Safety and Facilities Services Convert old existing exit signs to the new LED signs Mary Street completed 2016, McMillan Garage completed 2017 Pool waste heat recovery system Safety and Facilities Services Community and Operations Services Install waste heat recovery system controls to preheat the pool water Completed 2018
B. Technical Measures
Item Lead Department Description Status
Install occupancy sensors in City Hall parking garage
Safety and Facilities Services
Printer and photocopier conversion Safety and Facilities Services
Ensured that light levels are adequate for safety and security Completed 2013 to 2014
Replaced printers and photocopiers with "smarter" more efficient models. Reduced paper consumption by more than 50%
Upgrade computers
Corporate and Finance Services
C. Organizational Objectives and Measures
Replaced existing stock with models that are 50% more efficient
Item Lead Department Description
Switch to recycled paper
Adopt greenhouse gas (GHG) and energy emission targets
Corporate and Finance Services (Purchasing)
Economic and Development Services
Reduced energy impact new paper of processing and printing Completed 2008
Completed the Milestone 2 of Partners Protection program for Climate
Explore development of a savings reinvestment mechanism whereby savings (at least 50%) from energy efficiency projects can be re-invested into Energy savings
Completed 2010
Corporate and Finance proposed energy efficiency improvements. Explore Completed 2018 reinvestment fund Services the possibility of creating a fund from: documented (FIN-18-28) energy savings, incentive payments received for completed projects and energy commodity purchase price savings
Business travel policy
Corporate and Finance Services (Human Resources)
Promote more efficient travel modes for travel outside city (no-cost, quick win)
Completed 2018 Remote Work
Telecommuting policy
Corporate and Finance Services (Human Resources)
Explore a policy for staff telecommuting. for local travel and Policy
86 City of Oshawa – Corporate Energy Management Plan
Completed 2015
Completed
January 2014 to December 2015
Status
Implemented 2022
D. Behavioural Measures - Implementation of Energy Conservation and Efficiency Awareness
Staff review of Corporate Facilities Energy Management Plan Safety and Facilities Services
Provide an opportunity for staff to: understand the goals and objectives of this plan and the need for this plan, review and obtain buy-in to the plan
E. Ongoing items delivered through Corporation of City of Oshawa Departments
Review green purchasing policies Corporate and Finance Services (Purchasing)
Ensure purchasing policies and guidelines incorporate cost-effective energy efficiency requirements.
Business travel - carbon offsetting Corporate and Finance Services (Human Resources)
When travelling by plane, City purchases carbon offset
To be considered at the next update of Business Travel Policy
Waste Audit of City Facilities Community and Operations Services
Increase diversion rates from 70% to 90% at City Hall by providing blue boxes, green bins, removing garbage cans - provided staff education throughout the process. Undertake audits at other City facilities.
Budget alignment
Corporate and Finance Services Safety and Facilities Services
Coordinate City Facility Energy Management Plan (C.F.E.M.P.) with City's budgeting planning process
87 City of Oshawa – Corporate Energy Management Plan
Item Lead
Description Status
Department
Completed 2014 Sustainable Meeting Guidelines Economic and Development Services Prepare Sustainable Meeting Guidelines to guide staff in hosting sustainable meetings Completed 2016
Item Lead Department Description Status Tree Canopy Community and Operations Services Inventory and increase tree canopy Ongoing
Ongoing
Ongoing
Ongoing
Appendix B – City of Oshawa Asset List
88
City of Oshawa – Corporate Energy Management Plan
Facility Asset Category Year Constructed Airport - Field Electrical Bldg / Eqpt Government 1996 Airport - Airport Terminal Building Government 1997 Airport - Oshawa Aeronautical, Military and Industrial Museum Government 1940 Airport – Former Robert Stuart Museum Government 1940 Airport – Former Robert Stuart Museum Storage Building Government 1940 Hangar 1 Government 1997 Hangar 2 Government 2001 Arts Resource Centre Government 1952 Bathe Park Community Centre OCCNA 1941 Centre St. Parking Garage and Bus Terminal (G1) Parking Facilities 1974 Children's Arena Arenas 1956 City Hall - B Wing Government 1967 City Hall - C Wing Government 2010 City Hall - Parking Garage Government 1967 City Hall - Rundle Tower Government 1967 Civic Complex - Admin/Pool/Fieldhouse Recreation 1967 Civic Complex - Civic Dome Recreation 1974 Civic Complex - Civic Stadium Recreation 1971 Civic Fields Change / Rooms Recreation 1980 Civic Shed 1 Recreation 2011 Civic Shed 2 Recreation 2011 Civic Shed 3 Recreation 2011 Columbus Park Community Centre Community 1859 Connaught Park Community Centre OCCNA 1967 Consolidated Operations Depot - Garage Government 1989 Consolidated Operations Depot - Offices Government 1989 Consolidated Operations Depot - Salt Shed Government 2014 Consolidated Operations Depot - Vehicle Cover Storage Government 2015 Cordova Valley Park Community Centre Community 1975
89
Facility Asset Category Year Constructed Donevan Recreation Complex Recreation 1975 Fernhill - Nipigon Community Centre OCCNA 1960 Fire Hall 1 Fire Services 1981 Fire Hall 2 Fire Services 1982 Fire Hall 3 Fire Services 1976 Fire Hall 4 Fire Services 1981 Fire Hall 5 Fire Services 2006 Fire Hall 6 Fire Services 2016 Glen Stewart Community Centre OCCNA 1970 Harman / Cordova Community Centre OCCNA 1948 Harman Park Arena Arenas 1970 Howden Rd - Offices and Garage Government 1991 Howden Rd - Sand Dome Government 1991 Jubilee Pavilion Community 1920 Kingside Community Centre OCCNA 1950 Kinsmen Park - Announcers Booth Community 1982 Kinsmen Park - Concession Stand Community 1947 Kinsmen Park - Office-Change Rooms Community 1947 Lake Vista Change House (Storage) OCCNA 1973 Lake Vista Community Centre OCCNA 1973 Lakeview Park - Northside Change/Washrooms Community 1990 Lakeview Park - Simcoe Street Lifeguard Community 1982 Lakeview Park - Southside Office/Washrooms Community 1990 Laval Community Centre Community 1978 Delpark Homes Centre Recreation 2005 MacKenzie Park Community Centre OCCNA 2003 Mary Street Parkade (G3) Parking Facilities 1992 McMillan Parkade (G2) Parking Facilities 1982 Memorial Park Bandshell Community 1942 North Oshawa Community Centre OCCNA 1965
City of Oshawa – Corporate Energy Management Plan
90
Facility Asset Category Year Constructed Northview Branch Library Libraries 1987 Northview Community Centre Community 1989 Northview Community Centre - Lawn Bowling Building Community 1989 Oshawa Power - Administration Partners 1931 Oshawa Power - Distribution and Trades Partners 1949 Oshawa Power - Garage Partners 1946 Oshawa Power Meters, Technical Services and Warehouse Partners 1949 Oshawa Museum - Guy House Government 1835 Oshawa Museum - Henry House Government 1849 Oshawa Museum - Robinson House Government 1846 Oshawa Senior Citizen Centre Partners 1968 Oshawa Tourist Information Centre Government 1984 Oshawa Union Cemetery - Columbarium (Double) Government 2005 Oshawa Union Cemetery - Columbarium (Single) Government 2005 Oshawa Union Cemetery - Garage Government 1970 Oshawa Union Cemetery - Mausoleum Government 1924 Oshawa Union Cemetery - Offices Government 1920 Oshawa Union Cemetery - Storage Building Government 1960 Parks and Animal Services Centre - Greenhouse Government 1961 Parks and Animal Services Centre - Hoop House Government 1995 Parks and Animal Services Centre - Main Building Government 1961 Parks and Animal Services Centre - Potting / Boiler Room Government 1961 Parks and Animal Services Centre - Storage Building #1 (East) Government 1961 Parks and Animal Services Centre - Storage Building #2 (Southwest) Government 1970 Parks and Animal Services Centre - Storage Building #3 (Northwest) Government 1980 Parks and Animal Services Centre - Storage Building #4 (IPM) Government 2006 Parks and Animal Services Centre - Storage Shed Government 1970 Pump House Government 2010 Radio Park - Restrooms Community 2002 Radio Park - Storage Community 2006
City of Oshawa – Corporate Energy Management Plan
1 Blue highlight indicates the energy use is included in the Prescribed Operations under Broader Public Sector Reporting
91
Facility Asset Category Year Constructed Radio Park - Storage and Canopy Community 2002 Robert McLaughlin Gallery Government 1967 Robert McLaughlin Library Libraries 1953 Rotary Hall Community 1950 Rundle Community Centre OCCNA 1986 South Oshawa Community Centre Recreation 2005 Southmead Community Centre OCCNA 1968 Storie Community Centre OCCNA 1948 Sunnyside Park Community Centre OCCNA 1968 Thornton / Dundee Community Centre OCCNA 1880 Tribute Community Centre Partners 2006 Valleyview Community Centre OCCNA 1970 Woodview Community Centre OCCNA 1958
City of Oshawa – Corporate Energy Management Plan
References
1 Environment Canada. Greenhouse Gas Division. (2021). Greenhouse gas sources and sinks in Canada. Environment and Climate Change Canada - National Inventory Report, (1910-7064). https://www.cer-rec.gc.ca/en/data-analysis/energy-markets/provincialterritorial-energy-profiles/provincial-territorial-energy-profiles-ontario.html
2 Independent Electricity System Operator (2022). Pathways to Decarbonization.
3 Environment and Climate Change Canada (2022). 2030 Emissions Reduction Plan. https://www.canada.ca/content/da m/eccc/documents/pdf/climate-change/erp/Canada-2030-Emissions-Reduction-Plan-eng.pdf
4 Independent Electricity System Operator (2021, December 2). The Future of Electricity Demand in Ontario. Grid Evolution. Retrieved February 16, 2023, from www.ieso.ca/en/Powering-Tomorrow/2021/The-Future-of-Electricity-Demand-in-Ontario
5 Durham Region (2018). Durham Community Energy Plan - Part 1. Durham Low Carbon Pathway. www.durham.ca/en/livinghere/resources/Durham-Community-Energy-Plan/Duurham-Community-Energy-Plan-Part-1.pdf
6 Sievers, D. (2019, July 24). Fuel Switching. Fresh Energy. https://fresh-energy.org/fuel-switching-101-moving-towards-an-efficientand-carbon-free-future
7 The Carbon Trust. Good Practice Guide 84 Managing and Motivating Staff to Save Energy. http://www.thecarbontrust.co.uk.
8 Energy Star (2019). Guidelines for Energy Management. Natural Resources Canada. https://naturalresources.canada.ca/sites/nrcan/files/energy/pdf/EM%20Guidelines%20Eng%20Mar_ 27_2019.pdf
9 Federation of Canadian Municipalities (2021). Partners for Climate Protection. The PCP Milestone Framework. Retrieved April 6, 2023, from https://www.pcp-ppc.ca/program
10 City of Thunder Bay (2019). The Strategic Approach to Corporate Energy Management. 14.
11 Independent Electricity Service Operator (2023). Global Adjustment. Power Data Price Overview. Retrieved April 24, 2023, from https://www.ieso.ca/en/Power-Data/Price-Overview/Global-Adjustment
12 Government of Canada (2018). Greenhouse Gas Pollution Pricing Act. S.C. 2018, c. 12, s. 186, (2018-06-21). https://lawslois.justice.gc.ca/eng/acts/G-11.55/page1.html
13 UReach Toronto (2023). Area Municipalities in Durham Region. Durham Region. https://www.ureachtoronto.ca/durham-region/
92 City of Oshawa – Corporate Energy Management Plan
14 Martin, A. (2019). Corporate Energy Management Plan (p. 35). Corporate Energy Team
15 American Society of Heating, Refrigerating and Air-Conditioning Engineers (2018). ANSI/ASHRAE/ACCAStandard180-2018 Standard Practice for Inspection and Maintenance of Commercial Building HVAC Systems
16 Natural Resources Canada (2023, April 27). ISO 50001 Energy Management Systems Standard. Energy Management for Industry. https://natural-resources.canada.ca/energy-efficiency/energy-efficiency-for-industry/energy-management-industry/iso50001-energy-management-systems-standard/20405
17 American Society of Heating, Refrigerating and Air-Conditioning Engineers (2011). Procedures for Commercial Building Energy Audits (2nd ed.)
18 Efficiency Valuation Organization (2023.). International Performance Measurement and Verification Protocol (IPMVP). EVO-World. https://evo-world.org/en
19 Martin, A. (2019). Corporate Energy Management Plan (p. 20). Corporate Energy Team
20 Environment and Climate Change Canada (2022). 2030 Emissions Reduction Plan. https://www.canada.ca/content/da
m/eccc/documents/pdf/climate-change/erp/Canada-2030-Emissions-Reduction-Plan-eng.pdf
21 Association of Municipalities of Ontario (2023). Canada Community-Building Fund. www.buildingcommunities.ca
22 Environment and Climate Change Canada (2022). 2030 Emissions Reduction Plan. https://www.canada.ca/content/da
m/eccc/documents/pdf/climate-change/erp/Canada-2030-Emissions-Reduction-Plan-eng.pdf
23 Town of Whitby (2023). Data sharing conducted for review of municipal EV charging uptake.
93 City of Oshawa – Corporate Energy Management Plan
