
8 minute read
The City of Oshawa’s Corporate Carbon Commitments

On September 7, 2010, Oshawa City Council adopted the following corporate Greenhouse Gas emission targets which have been supported by the Corporate G.H.G.R.P., and past iterations of the C.F.E.M.P.:
5% reduction by 2015 from 2007 baseline
20% reduction by 2020 from 2007 baseline
80% reduction by 2050 from 2007 baseline
On January 27, 2020, Oshawa City Council endorsed an interim greenhouse gas reduction target of 30% below the 2007 baseline levels by 2030. This target generally aligned with the Federal and Provincial Government’s targets at time of adoption, under the 2020 strengthened climate plan.

The 2019-2023 C.F.E.M.P. set the potential of reducing energy consumption in corporate facilities by 10% by 2023. It stipulates this reduction is based on the current energy efficiency opportunities that were identified in the plan.
The status of these commitments are found in the following sections of this plan.
Corporate Operational Greenhouse Gas Emissions
The Corporate G.H.G.R.P. outlined the following corporate sources of G.H.G. emissions to be reported to the Federation of Canadian Municipalities.
• Owned and Operated Facilities;
• Street Lighting;
• Fleet and Fire Services;
• Corporate Waste; and
• Water and Wastewater.
Since Oshawa does not operate a landfill, the City’s G.H.G. emissions from waste were calculated as percentage of total corporate G.H.G. emissions.
The City is not required to report on G.H.G. emissions associated with the processing and delivery of water and wastewater. These services are provided by the Region of Durham.
The P.C.P. Milestone 3 Corporate Plan (DS-16-25) report to Council quantifies the greenhouse gas emissions at the time of achieving Milestone 3 under the Partners for Climate Change Program (Table 1). On March 8, 2016 the City received acknowledgement that Milestone 4, and 5 were also achieved upon the acceptance of this plan. A 33% reduction from 2007 baseline G.H.G. emissions were reported, exceeding the 2020 reduction goal of 20% for corporate emissions.
Reportable Energy, Costs and G.H.G. Emissions
(Table 1 – Reportable Energy, Costs and G.H.G. Emissions as reported in DS-16-25 report to council)
Defining City of Oshawa’s Consumption Portfolio
The 2019-2023 C.F.E.M.P. references facility energy consumption of 48.723 GWh from January 2017 – December 2017. The discrepancy, between this total and 2017 totals outlined in this plan, is due to reporting inclusions. The energy consumption of previous energy reporting metrics did not isolate which data sets were being used to compare year over year energy use.
The annual totals in the current iteration of the C.E.M.P. include the prescribed operations required by the Electricity Act 1998, Ontario Regulation 25/23 for consistency and to ensure a complete dataset for annual comparisons. By clearly defining the parameters of which buildings are being monitored, the City of Oshawa aims to reduce error in communicating our progress over time, develop accurate trends for analysis and target the buildings that are within our operational control.
The facilities that are not captured in this report will benefit from the energy conservation strategies recommended through this plan, as they continue to be included in capital planning, projects and operational procedures. Challenges in collecting and tracking for the complete city portfolio are addressed in the Quality Assurance recommendations of this plan.
Current Corporate Energy Emissions
The 2030 Emissions Reduction Plan indicates building and transportation sector emission reductions need to be prioritized at this time In following suit, facility and fleet G.H.G impacts have been detailed in this plan. A more comprehensive method of tracking all components of corporate G.H.G. footprint is under development.
*Total normalized consumption values with gas expressed as kWh equivalents.
Partners for Climate Change

Protection - Corporate Milestone 5
CUSUM of 2018-2022 savings
3,857,162 ekWh*
9.8% cumulative total of savings when compared to the 2017 values.
22 % Reduction in Energy Use
Energy Intensity of the City’s Portfolio
The prescribed operations reported here-in align with the July 1st annual publication of energy consumption reporting under the Ontario Regulation 25/23. These facilities comprise the vertical assets for which the City of Oshawa pays utility and operational bills, of which also fall into the categories defined by the regulation. The additional facilities in the City of Oshawa’s portfolio can be found in Appendix B.
Table 2 outlines the Energy Use Intensity (EUI) of the City’s facilities, rather than comparing year over year consumption. EUI allows for more accuracy in yearly comparisons, automatically accommodating for when renovations change the size of conditioned space. This method also allows similar property uses to be grouped and investigated for outliers. The energy intensity of each facility can be benchmarked against the provincial, national or regional averages to identify how the City’s portfolio is performing, and furthermore where better intensities can be achieved.
Source EUI is a measure of the total energy required to operate your building (including energy losses from generation/transmission/distribution). Weather normalization corrects for any changes in temperature that would affect operation, in order to accurately compare year over year. When weather has been adjusted for, there are valuable lessons to be gained by identifying low use periods and defining operational trends in order to replicate the energy savings. The implementation section of this plan will give more detail on how the City of Oshawa will aim to define and action necessary analysis of the EUI data shown here.
The total reduction in source energy use intensity (EUI) that the City of Oshawa has achieved since the baseline year of 2007 is - 46.7 kBtu/ ft²) or a 22% reduction in energy use.
When compared to 2017 Energy Use Intensity of 182.60 kBtu/ ft² there has been a decrease of – 14.4 kBtu/ ft². This demonstrates the reduction over the past 2019-2023 C.F.E.M.P. term where the goal for energy use reduction was set as 10%. The average reduction when comparing building EUI is approx. 8%.
The Energy Use Intensity trend over the course of the past C.F.E.M.P. allows for a more detailed analysis of facility use in recent years as seen in Table 2.
Table 2 - Weather Normalized Source Energy Use Intensity of City of Oshawa Facilities
1kBtu/ft2 = 0.293071 kWh/ft2
2 ”The Change” columns show how the 2022 EUI compares to 2007, and 2017 EUI respectively. The cells highlighted in blue display increased EUI, demonstrating areas of opportunity for energy conservation measures and auditing.
3Civic is separated due to separation of physical buildings in the complex, and separation of meters.
Annual Facility Source Energy Use
Buildings with significant reduction in Source EUI within this period:
• City Hall
• Fire Hall 3
• Civic Dome and Courts
• Delpark Homes Centre
• Donevan Recreation Centre
• Storie Park/Woodview/North
Oshawa/Kingside/Fernhill/Bathe Park Community Centres
Buildings with significant increase in Source EUI within this period:
• Fire Hall 4, Fire Hall 6
• Consolidated Operations Depot
• Howden Road Operations Depot
• Civic Stadium
• Animal Services
Many buildings with significant reduction in source EUI can be linked to capital energy projects, such as City Hall, Delpark, Civic and Donevan. Other trends such as community centre reduced loads may be attributed to change in resident’s behaviour during the COVID-19 pandemic. The increase in operations depot EUI trends alongside community growth and recent consolidation of resources. Individual investigation is required to determine the details of each facilities’ specific changes, replicate successes and make action plans accordingly.
Greenhouse Gas Emissions Reduction
The notable change in G.H.G. reduction from 2007 baselines shows the City of Oshawa’s success in developing long term strategies to reduce energy consumption. Comparing Greenhouse Gas emissions intensity of the previously defined 2007 baseline and current G.H.G. emissions from 2022 (as seen in Table 3) indicates sustained reduction of 48%, which surpasses the 2020 goal of 20%.
Table
Exceeding Our Targets
The Government of Canada published the 2030 Emissions Reduction Plan in 2022. This plan addresses the Paris Agreement targets to reduce emissions by 40%-45% from 2005 levels by 2030. This defines 2030 as an intermediate goal in the trajectory of achieving Net Zero by 2050. Figure 4 shows the progress of government projected reductions.
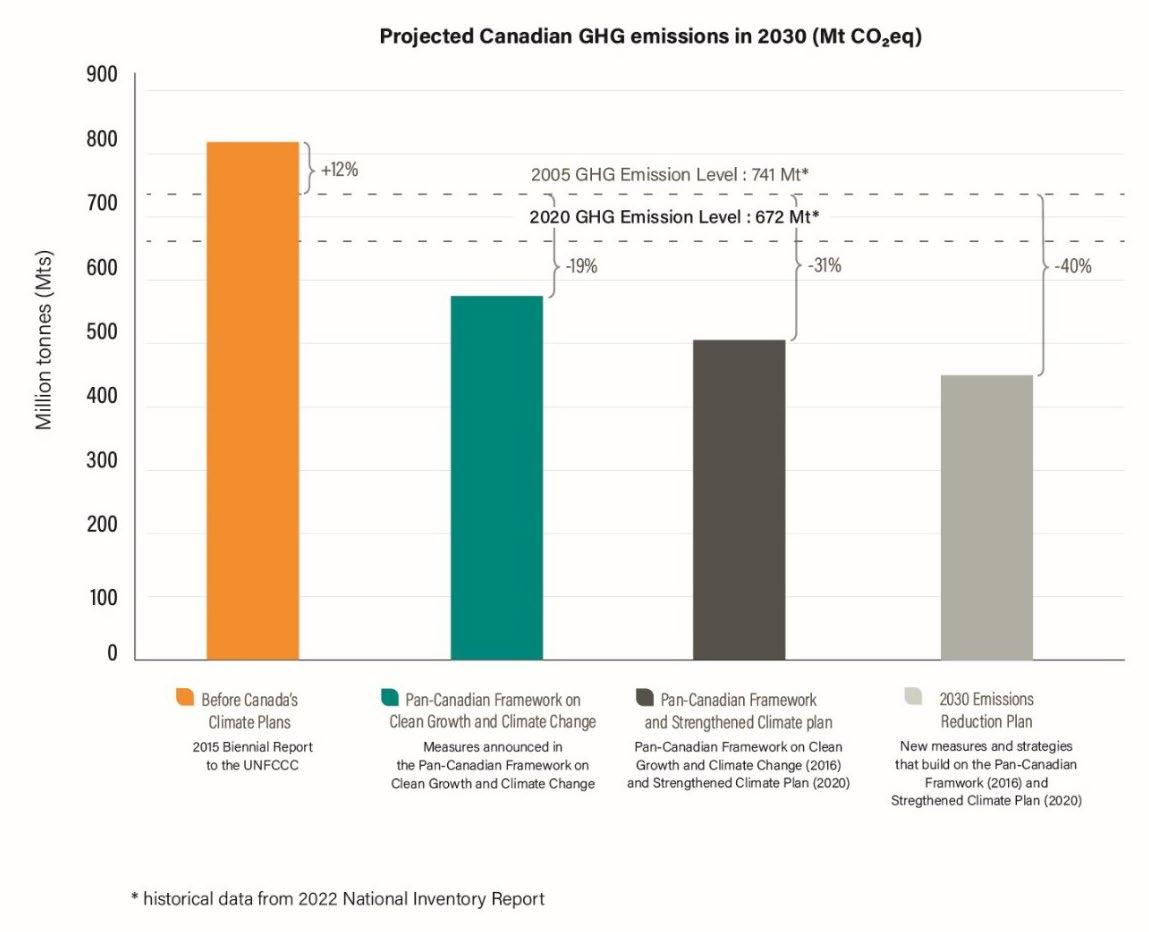
The City of Oshawa has exceeded the 2030 target, achieving 48% reduction in our corporate facility emissions.
The Emission Reductions Plan defines transportation and buildings as key areas where the largest G.H.G. reductions will occur between now and 2030. The City of Oshawa aims to focus our corporate strategy where we can achieve the largest impact as defined by the overarching national goals.
Recognizing the gap in other corporate emissions data, the City aims to develop accountability for these impacts through this new combined plan.
Efforts to minimize carbon emissions during energy production have created the majority of the Greenhouse Gas reductions associated with building operations today (Fig.7 below)1. Although the City portfolio’s EUI has decreased since 2017, according to the National Inventory report, emission factors related to the use of gas and electrical commodities have now increased since 2017. An increase in total G.H.G. emissions since 2017 can be seen in Table 4. Increased percentage of natural gas use also impacted these values, with natural gas constituting 59% of and 62% of the total energy use respectively for 2017, and 2022 (Fig.5.). Energy use reductions for the city’s average building has helped to maintain the similar values in G.H.G. emissions when comparing 2022 to 2017 values.
G.H.G. EMISSION IMPACT OF FACILITY TYPES
Fig. 6 shows the G.H.G. emissions apportioned to each facility type in the City of Oshawa portfolio.

Recreation centres and community centres combine to produce 71% of the G.H.G. emissions. Operations accounts for 10%, Offices for 11% and Fire Stations account for 8% of overall facility G.H.G. emissions.
Energy Sector impacts on G.H.G. Reduction
By 2035, the electrical grid could be significantly less reliant on natural gas powered generation, reducing emissions with a fully decarbonized grid possible by 2050. 2 According to the Government of Canada targets stipulated in the 2030 ERP, a carbon neutral electrical grid by the year 2035 is the idea scenario. 3 l
1 Environment Canada. Greenhouse Gas Division., 2021
2 Independent Electricity System Operator, 2022
3 Environment and Climate Change Canada, 2022
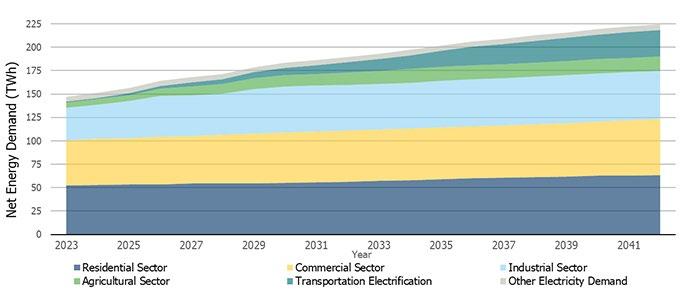
Although there is opportunity for electricity to be supplied in Ontario as a decarbonized commodity, a large shortfall of electrical supply is predicted in Ontario due to demands of electrification and population growth (Figure 8). 4
The forecasted demand reinforces the need for large reductions in electrical consumption, and renewable distributed energy production as key elements in the City’s Net Zero emission planning strategy, regardless of the low carbon future of electricity. Ensuring the City of Oshawa maintains a strong position against the unpredictable energy markets of the future is essential while planning for fuel switching away from gas. In order to prepare for this shift, the facilities with the highest gas consumption and their associated G.H.G. emission impact are highlighted in Table 5 (p.24).
C.E.M.P. New Targets
The following targets are recommended through this plan:
Alignment with federal and regional goals to have Net Zero Emissions by 2050. This Net Zero Emissions target for 2050 will be supported by three tiers of action.
1. Net Zero Retrofit Strategy targeting 80% of the 2007 greenhouse gas emission levels by 2045.
2. Development of the Oshawa Corporate Facilities Green Building Standard.
3.Continue tackling the remaining 20% of emission through energy efficiency measures as defined in the implementation section of this plan.
Financial Implications
There are no expenditures directly associated with endorsing the recommendations in this plan. As seen historically, the energy management practices outlined in this plan are anticipated to have financial benefits.
The following future capital investments will require Council approval through formal budget requests, in support of this plan.
• Detailed engineering studies as outlined in the Net Zero Strategy section of this plan.
• Capital Projects will follow to deliver Net Zero Retrofits.
• Capital investments in monitoring and verification technology may be required to utilize grants and funding opportunities.
Financial benefits of these targets include:
• Future operational energy cost reduction
• Resiliency to changes in energy sector, through reduced demand and onsite generation
• Reduction of carbon tax associated with operational use
• Shovel ready designs allowing the city to leverage grants and funding opportunities
Corporate Vision for Energy Management
It is recommended that City Council adopt the new vision statement for energy management to establish strong sustainable leadership across corporate culture, and support the joining of the Corporate G.H.G.R.P. and the Corporate Facilities Energy Management Plan.
Proposed Vision
Energy management will be considered a priority in corporate asset management activities, including capital, operations and maintenance decisions; and financial management and procurement decisions.
Current Vision
Energy management will be incorporated into all of facilities management’s activities, including capital, operations and maintenance decisions; and financial management and procurement decisions.
Corporate Facilities Energy Management Vision, as previously endorsed by Council (C.F.E.M.P. 2019-2023).
