ANNUAL COMPREHENSIVE FINANCIAL REPORT OF THE CITY OF MIRAMAR, FLORIDA FOR THE FISCAL YEAR ENDED
SEPTEMBER 30, 2023
Prepared by the Department of Financial Services
PAGE I. INTRODUCTORY SECTION (Unaudited) Letter of Transmittal i-x Organizational Chart xi List of Elected Officials xii List of Appointed Officials xiii GFOA Certificate of Achievement xiv II. FINANCIAL SECTION Independent Auditors’ Report 1-3 Management’s Discussion and Analysis (Unaudited) 4-20 Basic Financial Statements: Government-Wide Financial Statements: Statement of Net Position 21 Statement of Activities 22 Fund Financial Statements: Balance Sheet – Governmental Funds 23 Reconciliation of the Balance Sheet to the Statement of Net Position 24 Statement of Revenues, Expenditures, and Changes in Fund Balances –Governmental Funds 25 Reconciliation of the Statement of Revenues, Expenditures, and Changes in Fund Balances of Governmental Funds to the Statement of Activities 26 Statement of Net Position – Proprietary Funds 27 Statement of Revenues, Expenses, and Changes in Fund Net Position –Proprietary Funds 28 Statement of Cash Flows – Proprietary Funds 29-30 Statement of Net Position – Fiduciary Funds 31 Statement of Changes in Fiduciary Net Position – Fiduciary Funds 32 Notes to the Basic Financial Statements 33-115 Required Supplementary Information (Unaudited): Budgetary Comparison Schedule: General Fund 116 Note to Budgetary Comparison Schedule 117 Schedules of Changes in the Net Pension Liability and Related Ratios 118-121 Schedule of Contributions 122 Notes to Schedule of Contributions 123 Schedule of Proportionate Share of The Net Pension Liability 124 Schedule of City Contributions 125 Schedules of Changes in the Net OPEB Liability and Related Ratios 126 Notes to Schedule of Changes in the Net OPEB Liability 127 Schedule of Funding Progress – Other Post-Employment Benefit Obligation 128 Schedule of Annual Money Weighted Rate of Return 129 Supplementary Information (Unaudited): Combining and Individual Fund Financial Statements and Schedules: Combining Balance Sheet – Nonmajor Governmental Funds 130 CITY OF MIRAMAR, FLORIDA ANNUAL COMPREHENSIVE FINANCIAL REPORT TABLE OF CONTENTS SEPTEMBER 30, 2023
II. FINANCIAL SECTION (Continued) PAGE Combining Statement of Revenues, Expenditures, and Changes in Fund Balances – Nonmajor Governmental Funds 131 Combining Balance Sheet – Nonmajor Governmental Funds – Special Revenue Funds 132 Combining Statement of Revenues, Expenditures, and Changes in Fund Balances – Nonmajor Governmental Funds – Special Revenue Funds 133 Balance Sheet - Non-Major Governmental Fund - Debt Service Fund 134 Statement of Revenues, Expenditures, and Changes in Fund Balances –Nonmajor Governmental Funds – Debt Service Fund 135 Combining Balance Sheet – Nonmajor Governmental Funds – Capital Projects Funds 136 Combining Statement of Revenues, Expenditures, and Changes in Fund Balances – Nonmajor Governmental Funds – Capital Projects Funds 137 Schedule of Revenues, Expenditures and Changes in Fund Balance – Budget and Actual: Police Education Fund 138 Federal Grant Fund 139 State Grant Fund 140 Public Safety Outside Services Fund 141 Law Enforcement Trust Fund 142 CDBG Fund 143 S.H.I.P. Program Fund 144 Affordable Housing Trust Fund 145 Debt Service Fund 146 Street Construction and Maintenance Fund 147 Police Capital Improvement 148 Fire and EMS Capital Improvement 149 Park Development Fund 150 Capital Projects Fund 151 CIP Bonds 2013 Fund 152 CIP 2017 Loan Fund 153 CIP GRANTS FUND 154 CIP Loan 2020 Non- Taxable 155 CIP Loan 2020 Taxable 156 2021/2022 CIP Loan 157 Combining Statement of Net Position – Internal Service Funds 158 Combining Statement of Revenues, Expenses, and Changes in Fund Net Position – Internal Service Funds 159 Combining Statement of Cash Flows – Internal Service Funds 160 Combining Statement of Fiduciary Net Position – Pension Trust Funds 161 Combining Statement of Changes in Fiduciary Net Position – Pension Trust Funds 162 CITY OF MIRAMAR, FLORIDA ANNUAL COMPREHENSIVE FINANCIAL REPORT TABLE OF CONTENTS SEPTEMBER 30, 2023
III. STATISTICAL SECTION (Unaudited) PAGE Net Position by Component – Last Ten Fiscal Years 163 Changes in Net Position – Last Ten Fiscal Years 164-165 Fund Balances of Governmental Funds – Last Ten Fiscal Years 166 Changes in Fund Balances of Governmental Funds – Last Ten Fiscal Years 167 Assessed and Estimated Taxable Value of Taxable Property – Last Ten Fiscal Years 168 Direct and Overlapping Property Tax Rates – Last Ten Fiscal Years 169 Principal Property Taxpayers – Current Year and Nine Years Ago 170 Property Tax Levies and Collections – Last Ten Fiscal Years 171 Special Assessment Billings and Collections – Last Ten Fiscal Years 172 Ratios of Outstanding Debt by Type – Last Ten Fiscal Years 173 Direct and Overlapping Governmental Activities Debt 174 Demographic and Economic Statistics – Last Ten Fiscal Years 175 Principal Employers – Current Year and Nine Years Ago 176 Full-Time Equivalent City Government Employees by Function/Program – Last Ten Fiscal Years 177-181 Operating Indicators by Function/Program 182 Capital Asset Statistics by Function/Program 183
SECTION Independent Auditors’ Report on Internal Control over Financial Reporting and on Compliance and Other Matters Based on an Audit of Financial Statements Performed in Accordance with Government Auditing Standards 184 Independent Auditors’ Report on Compliance For Each Major Federal Program and State Project and Report on Internal Control Over Compliance Required by the Uniform Guidance and Chapter 10.550, Rules of the Auditor General 186 Schedule of Expenditures of Federal Awards and State Financial Assistance 189 Notes to the Schedule of Expenditures of Federal Awards and State Financial Assistance 193 Schedule of Findings and Questioned Costs 194 Management Letter in accordance with the Rules of the Auditor General of the State of Florida 196 Independent Accountants’ Report on Compliance with the Requirements of Section 218.415 Florida Statues 198 Impact Fee Affidavit 199 CITY OF MIRAMAR, FLORIDA ANNUAL COMPREHENSIVE FINANCIAL REPORT TABLE OF CONTENTS SEPTEMBER 30, 2023
IV. COMPLIANCE
INTRODUCTORY SECTION

CITY OF MIRAMAR
An Equal Opportunity Employer
May 31, 2024
The Honorable Mayor and Members of the City Commission City of Miramar 2300 Civic Center Place Miramar, FL 33025
Re: Transmittal Letter for Fiscal Year 2023 Annual Comprehensive Financial Report
To the Mayor, Commissioners and Citizens of Miramar:
Mayor
Wayne M. Messam
Vice Mayor
Alexandra P. Davis
City Commission
Winston F Barnes
Yvette Colbourne
Maxwell B Chambers
City Manager
Dr. Roy L. Virgin "We're at the Center of Everything"
Financial Services
2300 Civic Center Place
Miramar, FL 33025
Phone (954) 602-3049
Fax (954) 602-3696
We are pleased to present the City of Miramar, Florida (the “City”) Annual Comprehensive Financial Report (“ACFR”) for the fiscal year ended September 30, 2023 (“FY 2023”). The ACFR has been prepared in accordance with Generally Accepted Accounting Principles (“GAAP”) in the United States of America as promulgated by the Governmental Accounting Standards Board (“GASB”).
Responsibility for both the accuracy of the data, and the completeness and fairness of the presentation, including all disclosures, rests with the City. As management, we assert that, to the best of our knowledge and belief, this financial report is complete and reliable in all material respects and is reported in a manner designed to objectively present fairly the financial position and results of operations of the various funds and activities of the City. All disclosures necessary to enable the reader to gain an understanding of the City's financial activities have been included.
The ACFR is used to assist in making economic, social and political decisions, and to assist citizens in assessing accountability and transparency by:
• Assessing financial condition and results of operations;
• Comparing actual financial results with the legally adopted budget, where appropriate;
• Assisting in determining compliance with finance related laws, rules and regulations; and
• Assisting in evaluating the efficiency and effectiveness of City operations.
The City’s financial statements have been audited by Anthony Brunson P.A., a firm of licensed certified public accountants. The pension trust funds were audited by S. Davis & Associates, P.A. and Kabat Schertzer De La Torre Taraboulos & Company. The goal of the independent audits was to provide reasonable assurance that the financial statements of the City for FY 2023, are free of material misstatement. The audits involve examining, on a test basis, evidence supporting the amounts and disclosures in the financial statements; assessing the accounting principles used and significant estimates made by management; and evaluating the overall financial statement presentation. The independent auditors have issued an unmodified opinion on the City’s financial statements for FY 2023. Their report is located at the front of the financial section of this report.
The Management's Discussion and Analysis ("MD&A") immediately follows the independent auditor's report and provides a narrative introduction, overview, and analysis of the basic financial statements. MD&A complements this letter of transmittal and should be read in conjunction with it.
i
PROFILE OF THE CITY
The Legislature of the State of Florida created the City of Miramar in 1955. Miramar resides within Broward County, the second most populated county in the State, occupying approximately 31 square miles in the southwestern portion of the County. The population in Miramar has grown to 138,590 residents, which is an increase of 2.87% from the 2020 census count of 134,720, making Miramar the 4th largest city in Broward County after Fort Lauderdale, Pembroke Pines, and Hollywood, and 14th largest in the state of Florida.
The City operates under a Commission/Manager form of government. Policymaking and legislative authority are vested in the governing commission, which consists of a Mayor, Vice Mayor and three Commissioners (the "City Commission"). The City Commission is vested with policy-setting authority, adopting the annual budget, appointing committees and hiring the City Manager and the City Attorney. The City Manager is responsible for recommending and carrying out the policies and ordinances of the City Commission, appointing the directors of the City's departments with the concurrence of the City Commission, submitting the proposed annual budget, advising the Commission as to the financial condition of the City, and overseeing the day-to-day operations of the City.
Miramar provides a full range of services including public safety; general government; the construction and maintenance of streets and other infrastructure; recreational activities; community services and cultural events. Water services are provided by two water treatment plants located in the east and west portions of the City Wastewater services are provided by our state of the art Waste Water Reclamation Facility, which treats sewage and then recycles the used water for irrigation purposes. A franchise contractor provides the City's sanitation services.
ECONOMIC CONDITION AND OUTLOOK
The Florida Economic Estimating Conference ("Conference") reported that the state economy expanded by 4.4% in FY 2023. The Conference expects growth to decelerate to 2.8% in FY 2024 and 1.1% in FY 2025 as businesses and consumers transition from a high inflation environment to a high interest rate environment. Beginning in FY 2026 the economy is projected to grow at a more characteristic 1.9% to 2.0% per year. As the City enjoys the benefits of a steady and varied revenue source as well as an effectively managed service culture, the economic outlook and prospects for the City remain bright. The continuous growth over the past few years, in both residential and commercial development, is continuing in the City though at a much slower pace. Based on the Broward County Property Appraiser's Office July 1, 2023, Certificate of Taxable Value on Property, the City's taxable assessed value for FY 2024 is expected to be $14.059 billion, an increase of 12.43% from 2023 value of $12.505 billion. This is the eleventh consecutive year that the assessed valuations have shown steady growth.
The City is centrally located equal distance from the Miami and Fort Lauderdale metropolitan areas and is strategically positioned to benefit from the robust economic activity attracted to these major business centers. Miramar is connected to these metropolitan areas with access to major regional transportation routes, particularly Interstate 75 and the Florida Turnpike.
Due to its geographic location surrounded by the wealthy tri-county markets of Miami-Dade, Broward, and Palm Beach, the City of Miramar’s positioning for progress in the future is unquestionably ensured for periods that extend far beyond the 68 years of its existence, even despite the general slowdown of the US economy. The City has long been a preferred locale for major corporations and Fortune 500 companies to call home. The City continues to be a valuable contributor to the regional economy, with nearly 17 million square feet of commercial space in multiple office, industrial and retail developments. Some of the key industry sectors are advanced manufacturing, aviation, technology, and healthcare. Overall, there are more than 4,300 businesses employing more than 35,000 people. Companies that are a prominent part of the City include Comcast, Royal Caribbean Cruises, Memorial Hospital, Southern Wine and Spirits, Carnival Cruise Line, Spirit Airlines, NBC6/Telemundo, Publix Supermarkets, and Quest Diagnostics. For higher education and workforce training, there are several institutions that offer traditional and specialized curriculums, such as Broward College, Nova Southeastern University, and Florida International University, and this has helped lead to nearly a third of the City’s residents earning a bachelor’s degree or higher.
ii
MAJOR INITIATIVES
The management of the City's resources and expansion is conducted in a manner that shows fiscal responsibility. In FY 2023, with direction from the City Commission to find efficiencies and ways of doing more with less, the City Manager’s office tasked staff with embarking on a Strategic Planning process in order to better guide the use of the available scarce resources where they may have the biggest impact. This would help better direct the use of the limited resources where they may have the greatest impact. In order to better understand the needs and desires of our business and citizen communities, strategic planning aims to establish a methodical approach to listening to them. This will enable the City to formulate a future vision and outline a course of action or combination of tactics that will enable it to realize that vision.
The City has been able to continue providing essential services to our residents and business community while controlling the growth of the budget thanks to adherence to the Business Plan and, the continual funding of a Financial Stabilization Account. The financing sources for the plans and projects outlined in the business plan are included in the annual budget and capital improvement plan (“CIP”). The four primary areas of concentration for this year's capital improvement program continue to be capital equipment, park facilities, public buildings, and infrastructure. An essential component of the City's long-term financial planning is the CIP and the Business Plan.
CIP Accomplishments and Initiatives for FY 2023 are outlined below indicating both the challenges and opportunities related to the growth and development currently taking place within the City. These include:
• Historic Miramar Innovation & Technology Village – This project is the catalyst for the redevelopment of Historic Miramar; enhancing the neighborhood, creating smart city technology, enhancing educational opportunities and incorporating arts and entertainment. The project is comprised of workforce housing, transit hub, educational facilities, enhanced public recreational amenities, mixed use development and a technology village for new business startups and Smart City innovation. This project will improve the quality of life of the residents in the surrounding neighborhood and the City as a whole. The City will solicit proposals from master developers to plan, design and construct segments of the project. In addition, consultants will be selected to provide professional services such as preparation of site plan and other related services required for the development of the Village. Other governmental agencies, educational institutions and private entities are expected to participate in this project. The project will include a 20,000 sq. ft. innovation hub. To date the City has completed the Architectural Design of a new park, located at the Perry Middle School site and anticipates construction will start during the Summer of 2023 and anticipated completion is December 2025.
• Street Construction & Resurfacing - Various Locations - This project includes maintenance of traffic, asphalt milling and resurfacing, replacement of pavement marking, and installation of signs throughout the project's construction phase. In FY 2023 approximately 5 centerlines miles were milled and resurfaced. Pavement restorations are prioritized in accordance with the City's Pavement Management System. This project commenced in August 2022. This project is ongoing.
• Repair/Replacement of Existing Sidewalks - The Streets Maintenance Program has the responsibility of maintaining safe pedestrian circulation throughout the City. This project repairs existing sidewalks to increase pedestrian mobility, reduce tripping hazards and enhance the City's efforts at satisfying the Americans with Disabilities Act (ADA) requirements. Priority is focused on high-pedestrian usage areas and routes to schools, parks and other public facilities. Other target locations are within communities where there are identified significant sidewalk issues. The sidewalks need to be repaired in order to provide a safe pathway and prevent injuries to pedestrians. The project includes repairs to sidewalks that are cracked, sunken or raised, and those with gap openings. Approximately 11,300 linear feet of sidewalk were repaired/replaced during FY 2023. This project is ongoing.
iii
• Smart City Surveillance System and Real Time Crime Center – On November 3, 2021, the City Commission approved Resolution No. 22-30 for Phase 1 of the Real Time Crime Center security surveillance infrastructure. Phase 1 of this project included upgrading and modernizing the City’s video security surveillance Infrastructure and enhancing security at its highly critical water and wastewater facilities. Currently, Phase 1 is completed. Phase 2 is 90% completed and consists of new state-of-the-art security cameras, situational awareness software to centralize public safety applications, badge access control, panic buttons, and access control management to enhance City facilities' security.
• Reclaimed Water System Expansion/Piping - The City of Miramar owns and operates an unrestricted public access reuse water distribution system that provides reclaimed water for irrigation use within its service area currently from Palm Avenue to Dykes Road. It is in the City's best interest to expand the reclaimed water system and provide additional capacity to offset the demands placed on the local aquifer. Providing an alternative water supply meets the local and state's objectives and the City will meet the goals and objectives as defined in the City’s Comprehensive Plan by reducing dependency on a traditional water source (Biscayne aquifer) and fresh surface water. It is also aimed at addressing the City’s contractual obligations on contractual reuse. This project includes the preparation of design documents for the expansion of the City's reuse water distribution system to connect to communities, commercial areas, and public properties west of Dykes Road. The City retained the services of a local multi-disciplinary engineering consulting firm to lead the design efforts. The design phase of the project began in January 2022, and the design and permitting phases were fully completed March 2023; a competitive procurement process commenced thereafter and the construction phase commenced in September 2023. It will take 21 months to complete the project. To date, the contractor has installed 23,140 linear feet of 30,180 feet of pipes (75%). The segment of Miramar Parkway from Dykes Road to SW 184 Avenue is complete and now flowing through the process of certification to meet Broward’s Integrated Water Resource Plan grant (“IWRP”) requirement. the contractor completed two crossings on SW 184 Ave and continuously performing site restoration. Drilling operation on Pembroke Rd from SW 172 Ave to Dykes Rd had halted due to traffic concern while school is in session; however, it is scheduled to resume in June 2024 once school is out of session.
• Country Club Ranches Water Main Improvements - This project is implemented as a multi-phased and multi-year infrastructure development effort. The entire area is divided into seven (7) phases. This project will provide potable water main distribution lines, service lines, fire hydrants, fittings, valves and related appurtenances, road restoration/driveway restoration as required to serve Country Club Estates, Country Club Ranches Section II, Miramar West, and Largo at Miramar. Currently, the project area is self-served with the resident’s own private wells. A centralized water distribution is essential to ensure water quality that meets regulatory standards and protect the surficial aquifer from contaminants due to uncontrolled and unregulated water withdrawal from private wells. The provision of a centralized system will also enhance the fire-fighting capability of the community. Phase 1 (1A, 1B and 1C) construction started in May 2021 and was completed in April 2023. Phase 2 construction started on September 18, 2023, and the established contract time is 480 calendar days with an anticipated date of completion of January 10, 2025. Phase 3 design has reached 90% plans submittal. Consultant has already started the permitting process with the necessary regulatory agencies. The process to acquire necessary easement for phases 4 through 7 has started. CPH, LLC has been selected to provide professional engineering services for the acquisition of the easements.
• Supervisory Control and Data Acquisition (“SCADA”) System Cybersecurity ImprovementThe SCADA Cybersecurity Improvement plan includes the full implementation and configuration of equipment, systems, software, and IT security mechanisms. The City understands the critical nature of ensuring the security of the SCADA system that operates its water and wastewater plants and is committed to their upkeep. Most of the SCADA systems and network equipment in use are old, outdated, and not maintained for security patches or firmware. This remediation will put in place upgrades to software, SCADA, network equipment, policies, and procedures to ensure proper maintenance and security of the system. This is a multi-year project that commenced in November 2022 and is estimated to be completed in December 2026.
iv
• Historic Miramar Drainage Improvements – Phase IV - The Drainage Improvements Phase IV project is part of the Historic Miramar Infrastructure Improvements. This project provides for drainage related system improvements in part of the Historic Miramar area bounded by Miramar Parkway to the north, Florida Turnpike to the west, SW 64 Avenue to the east, and County Line Road to the south. Several areas within the public right-of-way have drainage issues. Upon successful completion of this project, stormwater runoff will dissipate in a more expedient fashion protecting property and increasing safety of mobility on city roadways. In FY 2022, the City Commission awarded a construction contract in August 2022, valued at over $12M for installation of ex-filtration trench, storm sewer piping, storm structures, driveway apron repair, sidewalk repair, milling and resurfacing, water and sanitary sewer deflections, water main construction, pervious pavement, pavement marking, swale reconstruction, irrigation system repair, sod restoration, coordination with existing utilities, and additional right-of-way restoration. The project commenced in November 2022 and is to be completed by June 2024.
• Historic Miramar Canal Improvements – The original project description was aimed at restoring eroded canal/lake embankments located east of University Drive deemed in “Poor” condition derived from the Engineering Feasibility and Needs Assessment Study completed in 2012. Since inception and during FY 2023, the City Commission approved the expansion of the project to include residents’ properties located west of University Drive and subsequently Citywide. The repairs are completed utilizing sediment-filled geotextile tubes commonly called Geotubes. Construction activities commenced in June 2016 and since inception a total of 265 properties have been restored. This project is ongoing.
ECONOMIC DEVELOPMENT
Corporate Community:
The City has over 16 million square feet of non-residential space consisting of office, warehouse, industrialflex, and community-level retail. Industry sectors represented include finance, insurance, manufacturing & distribution, medical, aviation, travel/tourism and media. Miramar continues to welcome new businesses and engage existing business as follows:
• Certificates of occupancy issued for over a 100,000 square feet of retail/industrial/warehouse space.
• Certificate of occupancy issued for 11 new Medical and Wellness facilities
• Certificate of occupancy issued for the new Aldi’s Grocery Store (over 104,000 square feet) at Miramar Parkway and Flamingo Road
• Certificate of Occupancy issued for over 12 new restaurants
• Certificate of Occupancy issued for United Technology Institute Automotive Training School
Housing:
• Certificates of occupancy issued for over 150 single family residential homes
• Certificates of occupancy issued for 260 apartment units at Miramar Station/ Miramar Central Plaza
Affordable Housing:
• Certificates of occupancy issued for Casa San Angelo, Senior Affordable Housing
• Approved Plat and Site Plan for Parc View - 66 affordable housing units on former Wellman Field
• Allocation for 42 affordable housing bonus units to Foxcroft Residence Cove-formerly known as Foxcroft Estates for a total of 84 affordable housing units
Redevelopment in Historic Miramar:
• Completed Phase 2 of the Tower Shops commercial rehabilitation project (6320 Miramar Parkway).
• Completed two small scale commercial rehabilitation projects (6238 Pembroke Road & 6448 Pembroke Road).
v
Grant Programs Opened:
• Micro-Enterprise Grant
• Small Business Grant Program
• Historic Miramar Small Business Signage Program
• Vacant Storefront Cover Program
FOR THE FUTURE
As we work to address the difficulties of the near and distant future, financial planning remains the most important aspect for the City. The City's significant initiatives have an impact on the City's financial resources in the long run. The financial burden that will be imposed on present and future citizens, as well as any potential effects on the economy and environment, are all factors that the City considers when planning projects and making choices.
Every year, the City of Miramar collaborates with outside financial specialists to develop and validate an examination of the General Fund's long-term financial viability. The 5-year fund projection will continue to be a challenge as the City adjust to the effects of the inflationary era that we are currently experiencing. The City's service demand has increased, but our schedule of fees has not kept pace with the City's rising costs. The demand for City services is growing, revenues are flattening, and inflation is rising, which will pose challenges to the City reserves in the future.
The creation of the City's annal budget and CIP has prompted the City to seek a balance between raising operating costs and bolstering service levels while maintaining reasonably priced taxes and fees for our citizens. In this regard, the primary driver of the revenue rise for the FY 2024 adopted budget has been the overall economy's recovery and the corresponding surge in the real estate market.
The General Fund budget and business plan tackle issues such as rapidly increasing inflation, growing healthcare and pension costs, a high debt service relative to nearby cities, growing labor costs, higher operating costs for newly completed capital projects, and more upkeep for aging infrastructure going forward. Notwithstanding these obstacles, The City keeps up the high standard of service by providing a wide range of programs that the locals have been accustomed to.
The City continues to be on course for the development of Miramar Town Center’s final development block, which will include 393 rental apartments and 26,500 square feet of retail in an eight-story building. The project, branded as Manor at Miramar and being developed by Related Development, LLC, will include shops and restaurants on the ground floor, a lobby, lounge and state-of-the-art amenities for the residential tenants. Planned public amenities will feature a plaza with park benches and elegant landscaping.
An art sculpture will enhance the exterior’s grounds. Parking for these uses in Block 2 would be accommodated through a new internal +/- 660 space parking garage and frontage surface parking off Red Road. The $110 million project will generate 650 jobs over the two-year construction period and a total of 323 jobs on a recurring basis. Additionally, $1.9 million will be generated annually in property taxes and $1 million in sales taxes. Construction commenced October 2021 and the project is set to open on June 15, 2024. The Manor at Miramar project will culminate the Town Center vision and will serve as the final piece that will help connect and activate all the uses at Town Center.
The City of Miramar has embarked on a new path to enhance current Smart City initiatives, as well as conduct a thorough assessment of all city processes to implement new Smart City solutions throughout the organization. The City Manager’s Office of Innovation and Technology has been established and it is responsible for the execution of innovative ideas through Smart City technology to reduce expenditures and increase revenues, while providing enhanced services and public engagement tools. These Smart City solutions will provide all stakeholders with the latest technology to implement efficiencies, increase workforce knowledge, enhance transparent engagement tools, enhance citywide security measures.
vi
BUSINESS PLAN
In order to achieve long-term financial stability for Miramar, the City's Business Plan, which was started in FY 2003, includes predictions for revenue and expenses as well as expected objectives and the measures taken to realize those outcomes. The Plan acts as a roadmap for the growth management and financial tactics that will bring Miramar to maturity. The City introduced the Comprehensive Assessment of Revenues and Expenses (“C.A.R.E.”) program in FY 2019 to encourage all staff members to contribute ideas for enhancing City operations. A ten-point budget effort from the City Manager, the C.A.R.E. Program was introduced to make the most of the City's natural, financial, and human resources. A chair and a vice-chair oversee the implementation of plans for each committee that support the goals of the City. C.A.R.E. establishes responsible, cost-effective use of public funds and excellent financial management. Support from each committee within the ten-point plan to address Citywide emphasis areas is necessary for the C.A.R.E. Program to be implemented.
Updated financial predictions and a thorough analysis of the plan's anticipated results and initiatives are part of the ongoing review process for the business plan. Currently planned projects and results include:
• Encourage annual commercial, industrial and office development
• Encourage residential and commercial redevelopment and revitalization in East Miramar
• Maintain control of labor and other operating costs
• Maintain control of pension costs – limit benefits/limit City contributions
• Leverage existing technology to create effective and efficient delivery of services
The pursuit of each of these goals is ongoing. In order to support the anticipated 140,000 residents of Miramar and create a thriving business community that offers services, employment opportunities, and educational opportunities to both local and national markets, the City is pursuing an economic development strategy that will draw in more commercial, industrial, and office space. Alongside the Business Plan, the City also approved its first Economic Development Strategic Plan (“EDSP”) in November 2012. This plan outlines the City's strategic priorities for economic development as well as the goals, objectives, and strategies the City plans to pursue from 2013 through 2024.
The "6 Pillars" of Miramar encompass a variety of interconnected initiatives meant to improve the neighborhood and assist our companies:
1. Quality of Life
2. Business Climate
3. Sports & Entertainment (Revenue Enhancement)
4. Infrastructure
5. Redevelopment/ Infill Development
6. Marketing
vii
FINANCIAL MANAGEMENT
Accounting and Internal Control
The establishment and upkeep of an internal control framework by the City's management oversees safeguarding the assets against theft, loss, or misuse as well as ensuring that sufficient accounting data is gathered to enable the preparation of financial statements that comply with GAAP. When creating and assessing the City's accounting system, the effectiveness of internal accounting controls is taken into account. In terms of (1) protecting assets from loss due to unauthorized use or disposition and (2) ensuring the accuracy of financial records for the purpose of creating financial statements and upholding asset responsibility, internal accounting controls are intended to offer a reasonable level of assurance, albeit not a 100% guarantee. The idea of reasonable certainty acknowledges that: (1) control expenses shouldn't outweigh anticipated benefits; and (2) management estimates and decisions are necessary for cost and benefit valuation. Within the aforementioned framework, all internal control reviews take place. The internal accounting controls of the City, in our opinion, sufficiently protect assets and offer an acceptable level of assurance regarding the accurate recording of financial transactions.
Single Audit
The City must make sure that sufficient internal controls are in place to guarantee compliance with applicable rules and regulations pertaining to such programs since it receives funding from the Federal, State, County, and Municipal Governments. Management is required to periodically review the internal control framework.
According to the Single Audit Act, U.S. Office of Management and Budget Uniform Guidance, Audits of States, Local Governments, and Non-Profit Organizations, and Chapter 10.550, Rules of the Auditor General of the State of Florida, the City must submit to a single audit every year. Tests were carried out to evaluate the effectiveness of the City's internal controls and compliance with relevant laws and regulations, particularly those pertaining to state and federal aid programs, as part of the City's Single Audit. The schedule of expenditures of federal awards and state financial aid, the schedule of findings and questioned expenses, the auditor's reports on the schedule, internal control, and compliance with applicable laws and regulations are all reported in the Compliance portion of the ACFR.
Budgetary Controls
The Annual Operating and Capital Improvement Budget serves as the cornerstone of the City's financial planning and management. The City Manager submits the proposed budget to the City Commission at the beginning of July every year. By September 30, the end of the City's fiscal year, the Commission must have adopted a final budget after holding public hearings on the proposed budget. The budget is appropriated by Funds, Departments (such as Human Resources, Police, Fire Rescue, etc.), and Programs. This report includes budget-to-actual comparisons for every single government fund for which an annual budget has been approved.
The City upholds budgetary controls to guarantee adherence to legal provisions included in the yearly authorized budget that is approved by the City Commission. The annual allocated budget includes the operations of the Capital Project Fund, the Debt Service Fund, the General Fund, and Special Revenue Funds. For the Enterprise Fund, a non-appropriated operating budget is approved. Departments set the budgetary control level, or the point at which spending is legally prohibited from going over the allocated sum. Additionally, to achieve financial control, the City keeps an encumbrance accounting system up to date. At year's end, unencumbered appropriations expire. Encumbrances associated with grants and capital projects, however, are typically re-appropriated as part of the budget for the subsequent year.
viii
FINANCIAL POLICIES
To ensure efficient goal-setting and decision-making, the City implemented a number of financial policies. These policies lay the groundwork for prudent financial management of the City's activities. The City's entire financial strategy includes keeping a close eye on the fund balance levels. The quantity of reserves maintained by the City can be used as a barometer to assess its financial standing and ability to successfully meet its present and future demands.
Fund Balance Policy
GASB Statement No. 54, Fund Balance Reporting and Governmental Fund Type Definition, establishes various classifications of fund balance based on a hierarchy which details constraints placed on the use of resources by creditors, grantors, contributors or laws or regulations of other governments. Fund balances classified as committed can only be used for specific purposes determined by formal action of the City Commission through an ordinance or a resolution. Commitments may be changed or lifted only by the City Commission through formal action. Assigned fund balances are amounts that the City intends to use for a specific purpose but are neither restricted nor committed. The intent to utilize these funds shall be expressed by the City Commission or may be delegated to the City Manager. Unassigned fund balance can be viewed as the net resources available at the end of the fiscal year.
The following reservations are established for the General Fund:
• Committed Fund Balance:
◦ Financial Stabilization Account - this reserve, equal to 12% of the City’s General Fund final amended budgeted expenditures, was established to ensure that the City has sufficient cash flow and available financial resources to meet future economic demands and unanticipated situations.
• Assigned Fund Balance:
◦ Emergency Preparedness - a reserve equal to 4% of the City's General Fund final amended budgeted expenditures to provide the resources necessary to ensure continued operations and maintenance of services to the pubic during an emergency situation.
◦ Subsequent years budget - to appropriate current year budgeted savings to cover next year budget.
◦ Building and Permitting Assigned Fund Balance - funds that must be used solely for carrying out the local government’s responsibilities in enforcing the Florida Building Code.
◦ Pension Trust Fund – to pay for the unfunded pension liabilities the City has accrued over the years.
◦ OPEB Trust Fund – to fund the unfunded portion of the City’s liabilities for other postemployment benefits.
◦ OPEB Trust Fund – to fund the unfunded portion of the City’s liabilities for other postemployment benefits.
ix
REPORTING ACHIEVEMENT
The City of Miramar continues to receive many awards and accolades; some of these are listed below:
• The Government Finance Officers Association (‘GFOA”) of the United States and Canada awarded a Certificate of Achievement for Excellence in Financial Reporting to the City, for its ACFR for the FY 2022. The Certificate of Achievement is the highest form of recognition in the area of governmental accounting and financial reporting. The attainment of this award represents a significant accomplishment by a government and its financial management team. This was the thirty-fifth year that the City has achieved this prestigious award. In order to be awarded a Certificate of Achievement, a government must publish an easily readable and efficiently organized ACFR. This report must satisfy both GAAP and applicable legal requirements. The certificate is valid for one year only. We believe that our current ACFR continues to meet the Certificate of Achievement Program’s requirements and we are submitting it to the GFOA to determine its eligibility for another certificate.
• The City also received the GFOA Award for Distinguished Budget Presentation for its annual budget for the fifteenth consecutive year. In order to qualify for this award, the City’s budget document was judged to be proficient in several categories including meeting program criteria as a policy document, as a financial plan, as an operational guide, and as a communications device. We expect to receive confirmation that our budget continues to conform and that we will receive the certificate for the current budget year.
• Achievement of Excellence in Procurement
• Commission on Accreditation for Law Enforcement Agencies (CALEA) and Commission for Florida Law Enforcement Accreditation (CFA)
• International Economic Development Council (IEDC)
• Five (5) 2022 Smart 50 Awards presented by Smart Cities Connect
• "2021 Local IT Innovation of the Year Award" from the LocalSmart Program presented by the media outlet State Scoop for its participation in this pilot program
• Gold Seal Quality Care Accredited - Child Care
• Florida League of Cities Spirit Award
ACKNOWLEDGMENTS
The preparation of the report would not have been possible without the skill, effort and dedication of the entire staff of the Financial Services Department. The year-end closing, the audits, and compiling and publishing the ACFR could not have been accomplished without hard work, commitment and personal sacrifice. Sincere appreciation goes to the staff for their dedication in the development and preparation of this document. We wish to thank all the City departments for their assistance in providing the data necessary to prepare this report. The guidance and cooperation of the City Commission in planning and conducting the financial affairs of the City is greatly appreciated.
Respectfully submitted,

x
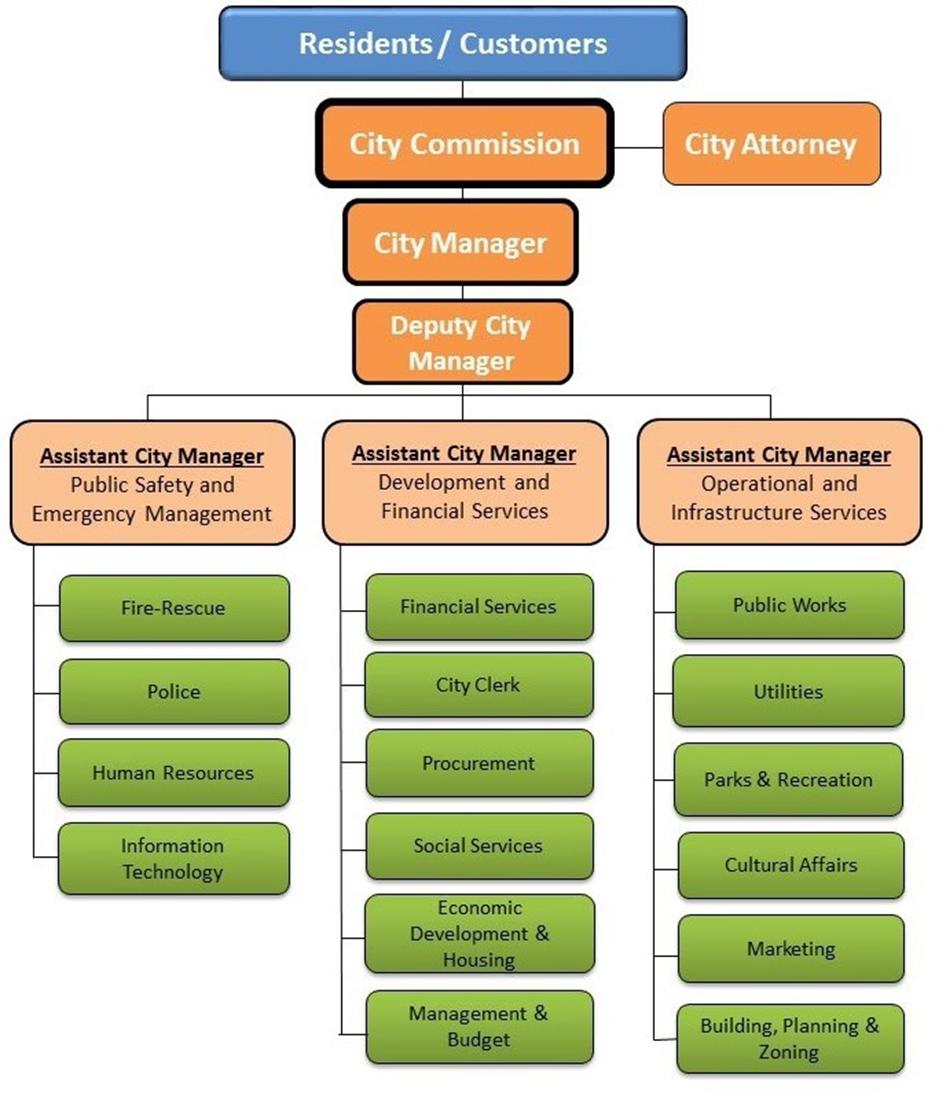
Citywide Organizational Structure
xi
Elected City Commission


Mayor Vice Mayor Wayne M. Messam


Commissioner Commissioner Commissioner Winston F. Barnes Maxwell B. Chambers Yvette Colbourne
List of Elected Officials
City of Miramar
Alexandra P. Davis
xii
Title
CITY OF MIRAMAR, FLORIDA
LIST OF APPOINTED OFFICIALS
SEPTEMBER 30, 2023
Name
City Manager Dr. Roy L. Virgin
Deputy City Manager Kelvin L. Baker
Assistant City Manager Adam Burden
Assistant City Manager / City Spokesperson
Shaun Gayle
Assistant City Manager Stephen Johnson
Director of Financial Services Kevin E. Adderley
Director of Procurement
Alicia Ayum
Police Chief Delrish Moss
Director of Cultural Affairs Camasha Cevieux
Director of Public Works
Director of Human Resources
Anthony Collins
Randy Cross
Director of Social Services Katrina Davenport
Director of Utilities Francois Domond
City Clerk Denise A. Gibbs
Director of Information Technology Clayton D. Jenkins
Director of Parks & Recreation
Billy Neal
Fire-Rescue Chief Ray Perez
Director of Management & Budget Rafael Sanmiguel
Director of Building Planning and Zoning Nixon Lebrun
Director of Economic Development & Revitalization Anita Fain-Taylor
Director of Marketing and Communications Lorna Walker
xiii

For its Comprehensive Annual Financial Report for the Fiscal Year Ended September 30, 2022
 Executive Director/CEO
Government
Certificate of Achievement
Excellence
to
Finance Officers Association
for
in Financial Reporting Presented
City of Miramar Florida
xiv
FINANCIAL SECTION
INDEPENDENT AUDITORS' REPORT

Honorable Mayor and Members of the City Commission City of Miramar, Florida
Report on the Audit of the Financial Statements
Opinions
We have audited the accompanying financial statements of the governmental activities, the business-type activities, each major fund, and the aggregate remaining fund information of the City of Miramar, Florida (the City) as of and for the year ended September 30, 2023, and the related notes to the financial statements, which collectively comprise the entity’s basic financial statements as listed in the table of contents.
In our opinion, the financial statements referred to above present fairly, in all material respects, the respective financial position of the governmental activities, the business-type activities, each major fund, and the aggregate remaining fund information of the City, as of September 30, 2023, and the respective changes in financial position, and, where applicable, cash flows thereof for the year then ended in accordance with accounting principles generally accepted in the United States of America.
We did not audit the financial statements of the Pension Trust Funds for the Consolidated Retirement Plan and Trust, Police Officers, and Firefighters (the “Pension Trust Funds”) which represent 99 percent of the total assets, total net position/fund balance and total revenues/additions of the fiduciary fund information opinion unit. Those statements were audited by other auditors whose reports have been furnished to us, and our opinion, insofar as it relates to the amounts included for the Pension Trust Funds is based solely on the report of the other auditors.
Basis for Opinions
We conducted our audit in accordance with auditing standards generally accepted in the United States of America and the standards applicable to financial audits contained in Government Auditing Standards, issued by the Comptroller General of the United States. Our responsibilities under those standards are further described in the Auditor’s Responsibilities for the Audit of the Financial Statements section of our report. We are required to be independent of the City and to meet our other ethical responsibilities, in accordance with the relevant ethical requirements relating to our audit. We believe that the audit evidence we have obtained is sufficient and appropriate to provide a basis for our audit opinions.
Responsibilities of Management for the Financial Statements
Management is responsible for the preparation and fair presentation of the financial statements in accordance with accounting principles generally accepted in the United States of America, and for the design, implementation, and maintenance of internal control relevant to the preparation and fair presentation of financial statements that are free from material misstatement, whether due to fraud or error.
Miramar Office
3350 SW 148th Ave. | Suite 110 Miramar, FL 33027
(954) 874-1721


North Miami Office 1801 NE 123rd Street | Suite 314 North Miami, FL 33181 (786) 743-7108

1
INDEPENDENT AUDITOR’S REPORT
info@abcpasolutions.com
In preparing the financial statements, management is required to evaluate whether there are conditions or events, considered in the aggregate, that raise substantial doubt about the City’s ability to continue as a going concern for twelve months beyond the financial statement date, including any currently known information that may raise substantial doubt shortly thereafter.
Auditor’s Responsibilities for the Audit of the Financial Statements
Our objectives are to obtain reasonable assurance about whether the financial statements as a whole are free from material misstatement, whether due to fraud or error, and to issue an auditor’s report that includes our opinions. Reasonable assurance is a high level of assurance but is not absolute assurance and therefore is not a guarantee that an audit conducted in accordance with generally accepted auditing standards and Government Auditing Standards will always detect a material misstatement when it exists. The risk of not detecting a material misstatement resulting from fraud is higher than for one resulting from error, as fraud may involve collusion, forgery, intentional omissions, misrepresentations, or the override of internal control. Misstatements are considered material if there is a substantial likelihood that, individually or in the aggregate, they would influence the judgment made by a reasonable user based on the financial statements.
In performing an audit in accordance with generally accepted auditing standards and Government Auditing Standards, we:
• Exercise professional judgment and maintain professional skepticism throughout the audit.
• Identify and assess the risks of material misstatement of the financial statements, whether due to fraud or error, and design and perform audit procedures responsive to those risks. Such procedures include examining, on a test basis, evidence regarding the amounts and disclosures in the financial statements.
• Obtain an understanding of internal control relevant to the audit in order to design audit procedures that are appropriate in the circumstances, but not for the purpose of expressing an opinion on the effectiveness of the City’s internal control. Accordingly, no such opinion is expressed.
• Evaluate the appropriateness of accounting policies used and the reasonableness of significant accounting estimates made by management, as well as evaluate the overall presentation of the financial statements.
• Conclude whether, in our judgment, there are conditions or events, considered in the aggregate, that raise substantial doubt about the City’s ability to continue as a going concern for a reasonable period of time.
We are required to communicate with those charged with governance regarding, among other matters, the planned scope and timing of the audit, significant audit findings, and certain internal control-related matters that we identified during the audit.
Required Supplementary Information
Accounting principles generally accepted in the United States of America require that the management’s discussion and analysis, budgetary comparison information and other post-employment benefits and pension related schedules as listed in the table of contents be presented to supplement the basic financial statements. Such information is the responsibility of management and, although not a part of the basic financial statements, is required by the Governmental Accounting Standards Board who considers it to be an essential part of financial reporting for placing the basic financial statements in an appropriate operational, economic, or historical context. We have applied certain limited procedures to the required supplementary information in accordance with auditing standards generally accepted in the United States of America, which consisted of inquiries of management about the methods of preparing the information and comparing the information for consistency with management’s responses to our inquiries, the basic financial statements, and other knowledge we obtained during our audit of the basic financial statements. We do not express an opinion or provide any assurance on the information because the limited procedures do not provide us with sufficient evidence to express an opinion or provide any assurance.
2
Supplementary Information
Our audit was conducted for the purpose of forming opinions on the financial statements that collectively comprise the City’s basic financial statements. The accompanying combining and individual nonmajor fund financial statements and schedule of expenditures of federal awards and state financial assistance, as required by Title 2 U.S. Code of Federal Regulations Part 200, Uniform Administrative Requirements, Cost Principles, and Audit Requirements for Federal Awards; and Chapter 10.550, Rules of the Auditor General are presented for purposes of additional analysis and are not a required part of the basic financial statements. Such information is the responsibility of management and was derived from and relates directly to the underlying accounting and other records used to prepare the basic financial statements. The information has been subjected to the auditing procedures applied in the audit of the basic financial statements and certain additional procedures, including comparing and reconciling such information directly to the underlying accounting and other records used to prepare the basic financial statements or to the basic financial statements themselves, and other additional procedures in accordance with auditing standards generally accepted in the United States of America. In our opinion, the combining and individual nonmajor fund financial statements and the schedule of expenditures of federal awards and state financial assistance are fairly stated, in all material respects, in relation to the basic financial statements as a whole.
Other Information
Management is responsible for the other information included in the annual comprehensive financial report. The other information comprises the introductory and statistical sections but does not include the basic financial statements and our auditor’s report thereon. Our opinions on the basic financial statements do not cover the other information, and we do not express an opinion or any form of assurance thereon.
In connection with our audit of the basic financial statements, our responsibility is to read the other information and consider whether a material inconsistency exists between the other information and the basic financial statements, or the other information otherwise appears to be materially misstated. If, based on the work performed, we conclude that an uncorrected material misstatement of the other information exists, we are required to describe it in our report.
Other Reporting Required by Government Auditing Standards
In accordance with Government Auditing Standards, we have also issued our report dated May 31, 2024 on our consideration of the City’s internal control over financial reporting and on our tests of its compliance with certain provisions of laws, regulations, contracts, and grant agreements and other matters. The purpose of that report is solely to describe the scope of our testing of internal control over financial reporting and compliance and the results of that testing, and not to provide an opinion on the effectiveness of the City’s internal control over financial reporting or on compliance. That report is an integral part of an audit performed in accordance with Government Auditing Standards in considering the City’s internal control over financial reporting and compliance.

Miramar, Florida
May 31, 2024
3
MANAGEMENT’S DISCUSSION AND ANALYSIS (Required Supplementary Information)
CITY OF MIRAMAR, FLORIDA
MANAGEMENT’S DISCUSSION AND ANALYSIS (UNAUDITED)
FISCAL YEAR ENDED SEPTEMBER 30, 2023
The purpose of financial reporting, in general, is to provide the readers of the financial statements with information that will help them make decisions or draw conclusions about an entity. As management of the City of Miramar, Florida (the City), we offer readers of the City’s financial statements this narrative overview and analysis of the financial activities of the City for the fiscal year ended September 30, 2023. We encourage readers to consider the information presented herein in conjunction with the additional information that we have furnished in our letter of transmittal, as well as the financial statements and notes to financial statements that follow. All amounts, unless otherwise indicated, are expressed in thousands of dollars.
Financial Highlights
1. The assets and deferred outflows of the City exceeded its liabilities and deferred inflows at September 30, 2023, by $423.31 million (net position).
2. During fiscal year 2023, the City’s net position increased by approximately $12.06 million resulting from current year operations.
3. The City’s governmental-type activities reported net position of $109.72 million, which is a $13.66 million increase, in comparison to the prior year net position, of $96.06 million.
4. The City’s business-type activities reported total net position of $313.59 million, which is a $(1.59) million decrease, or (0.51)%, in comparison to the prior year net position, of $315.19 million. Approximately 17.41% of the total or $54.61 million is unrestricted and may be used to meet the City’s ongoing obligations to citizens and creditors.
5. At the end of the fiscal year, the General Fund reported a fund balance of $67.75 million, or 35.64% of the General Fund expenditures. Of this balance, $27.96 million is committed and can only be used for specific purposes pursuant to constraints imposed by the City Commission through an ordinance or resolution. $24.96 million of committed fund balance has been designated as a financial stabilization account to provide for use in unforeseen, unbudgeted emergency situations. A budget amendment must be approved by the City Commission authorizing use of the stabilization funds.
6. The City’s total debt outstanding for governmental activities decreased $(11.01) million during the current fiscal year. The debt decrease was due to debt service payments throughout the year.
7. The total debt outstanding for business-type activities decreased by approximately $4.73 million which was attributable to principal payments throughout the year.
8. In fiscal year 2023, the City adopted the provision of Government Accounting Standards Board (GASB) Statement No. 96, Subscription Based Information Technology Arrangements ("SBITA")). Upon adoption of this new standard, the City recognized subscription right-of-use assets totaling $1.97 million less amortization expense and obligations under subscriptions of $1.61 million. See Notes 1, 6, and 8 for disclosures on significant accounting policies, summary description of SBITA, and information on estimated future subscription payments.
4
CITY OF MIRAMAR, FLORIDA
MANAGEMENT’S DISCUSSION AND ANALYSIS (UNAUDITED)
FISCAL YEAR ENDED SEPTEMBER 30, 2023
Overview of the Financial Statements
This discussion and analysis is intended to serve as an introduction to the City’s basic financial statements, which have the following components: 1) government-wide financial statements, 2) fund financial statements, and 3) notes to the financial statements. This report also contains other supplementary information in addition to the basic financial statements.
Government-wide Financial Statements
The government-wide financial statements are designed to provide readers with a broad overview of the City’s finances in a manner similar to that of a private-sector business. The City’s government-wide financial statements include the statement of net position and statement of activities.
The Statement of Net Position presents information on all of the assets, deferred outflows of resources, liabilities, and deferred inflows of resources of the City, with the difference between the two reported as net position. Over time, increases or decreases in net position may serve as a useful indicator of whether the financial position of the City is improving or deteriorating.
The Statement of Activities presents information showing how the City’s net position changed during the most recent fiscal year. Changes in net position are reported as soon as the underlying event giving rise to the change occurs, regardless of the timing of related cash flows. Accordingly, revenues and expenses are reported in the statement for some items that will only result in cash flows in future fiscal periods (for example, uncollected taxes and earned, but unused vacation leave).
Both of the government-wide financial statements distinguish functions of the City that are principally supported by taxes, charges for services, and intergovernmental revenues (governmental activities) from other functions that are intended to recover all or a significant portion of their costs through user fees and charges (businesstype activities). The governmental activities of the City include general government, public safety, physical environment, transportation, social services, economic environment, parks and recreation, and cultural arts. The business-type activities include water and wastewater, sanitation and stormwater, where the fee for service typically covers all or most of the cost of operations and depreciation.
Fund Financial Statements
Unlike government-wide financial statements, the focus of fund financial statements is directed to specific activities of the City rather than the City as a whole. Except for the General Fund, separate funds are established to maintain control over resources that have been segregated for specific activities or objectives. The City, like other state and local governments, uses fund accounting to ensure and demonstrate compliance with finance-related legal requirements. All of the funds of the City can be divided into three categories: governmental funds, proprietary funds, and fiduciary funds.
Governmental Funds
Governmental funds are used to account for essentially the same functions reported as governmental activities in the government-wide financial statements. Governmental fund financial statements focus on near-term inflows and outflows of spendable resources, as well as on balances of spendable resources available at the end of the fiscal year. Such information may be useful in evaluating a government’s near- term financing requirements.
Because the focus of governmental funds is narrower than that of the government-wide financial statements, it is useful to compare the information presented for the governmental funds with similar information presented for the governmental activities in the government-wide financial statements. By doing so, readers may better understand the long-term impact of the government’s near- term financing decisions. Both the governmental fund balance sheet and the governmental fund statement of revenues, expenditures and changes in fund balances provide a reconciliation to facilitate the comparison between governmental funds and governmental activities.
5
CITY OF MIRAMAR, FLORIDA
MANAGEMENT’S DISCUSSION AND ANALYSIS (UNAUDITED) FISCAL YEAR ENDED SEPTEMBER 30, 2023
Governmental Funds (Continued)
The City maintains twenty-two individual governmental funds. Information is presented separately in the governmental fund balance sheet and in the governmental fund statement of revenues, expenditures and changes in fund balance for the General Fund, which is considered to be a major fund. The City presents data from all other governmental funds in a single column (non-major funds). Individual fund data for each of these non-major governmental funds are included in the combining statements of the Annual Comprehensive Financial Report (ACFR).
The City adopts an annual appropriated budget for its governmental funds. Budgetary comparison schedules have been provided for all the governmental funds to demonstrate compliance with the funds’ budgets.
Proprietary Funds
Proprietary fund financial statements consist of a statement of net position, a statement of revenues, expenses, and changes in fund net position and a statement of cash flows. These statements are prepared on an accounting basis that is similar to the basis used to prepare the government-wide financial statements. For financial reporting purposes, proprietary funds are grouped into Enterprise Funds and Internal Service Funds.
The City uses Enterprise Funds to account for business-type activities that charge fees to customers for the use of specific goods or services. These funds are used to report the same functions presented as businesstype activities in the government-wide financial statements. Internal Service funds are used to account for services provided and billed on an internal basis. The City uses Internal Service Funds to account for its fleet of vehicles, self-insurance/benefit programs, and management information systems. Because these services predominantly benefit governmental rather than business-type functions, they have been included within governmental activities in the government-wide financial statements.
Proprietary funds provide the same type of information as the government-wide financial statements, only in more detail. The City has two Enterprise Funds; the Utility Fund, and Stormwater Fund. The Internal Service Funds are aggregated and presented in a single column. A statement of cash flows is presented at the fund financial statement level for proprietary funds.
Fiduciary Funds
Fiduciary funds are used to account for resources held for the benefit of parties outside the government. Fiduciary funds are not reflected in the government-wide financial statements because the resources of those funds are not available to support the City’s own programs. Fiduciary financial statements consist of a statement of fiduciary net position and a statement of changes in fiduciary net position.
Notes to the Financial Statements
The notes provide additional information that is essential to a full understanding of the data provided in the government-wide and fund financial statements.
Other Information
In addition to the basic financial statements and accompanying notes, this report also presents certain required supplementary information (RSI) concerning the City’s progress in funding its obligation to provide pension and other post-employment benefits to its employees. This section also includes a comparison between the adopted and final budget and actual financial results for the City’s General Fund. A Budgetary Comparison Schedule has been provided for the General Fund to demonstrate compliance with the budget. The City also adopts an annual appropriated budget for each of its other governmental funds which are presented as supplementary information.
6
CITY OF MIRAMAR, FLORIDA MANAGEMENT’S DISCUSSION AND ANALYSIS (UNAUDITED) FISCAL YEAR ENDED SEPTEMBER 30, 2023
Government-Wide Financial Analysis (Continued)
By far, the largest portion of the City’s net position, $390.67 million reflects its investment in capital assets. Net investment in capital assets is that portion of net position that relates to the City’s capital assets reduced by accumulated depreciation and by any outstanding debt incurred to acquire, construct, or improve those assets, excluding unexpended debt proceeds. Although the capital assets are shown net of debt, it should be noted that the resources needed to repay this debt must be provided from other sources, since the capital assets themselves cannot be used to liquidate and pay for these liabilities.
An additional portion of the City’s net position, 8.04% represents resources that are subject to external restrictions on how they may be used. The balance in restricted net position had a net decrease of $(1.95) million from approximately $36.00 million in 2022 to $34.05 million in 2023.
Unrestricted net position of $(1.40) million, decreased by $27.88 million or 105.30% from the prior year unrestricted amount. This is due to the results of current year operations.
The following schedule is a summary of the fiscal year 2023 Statement of Activities with comparative information to fiscal year 2022:
Governmental Activities Business-Type Activities Total 2023 2022 2023 2022 2023 2022
ChargesforServices $ 59,700 $ 63,821 $ 60,955 $ 60,019 $ 120,655 $ 123,840 OperatingGrants&Contributions 12,707 22,887 — 327 12,707 23,214 CapitalGrants&Contributions 5,747 1,162 1,812 2,630 7,559 3,792 GeneralRevenues PropertyTaxes 85,709 77,503 — — 85,709 77,503 OtherTaxes 32,316 28,638 — — 32,316 28,638 Other 26,048 21,426 3,984 589 30,032 22,015 Total Revenues 222,227 215,438 66,751 63,565 288,978 279,002 Expenses: GeneralGovernment 42,442 26,331 — — 42,442 26,331 PublicSafety 108,087 89,803 — — 108,087 89,803 PhysicalEnvironment 4,379 3,829 — — 4,379 3,829 Transportation 7,364 4,764 — — 7,364 4,764 SocialServices 7,479 7,318 — — 7,479 7,318 EconomicEnvironment 7,346 4,878 — — 7,346 4,878 Parks&Recreation 21,169 19,130 — — 21,169 19,130 CulturalArts 4,836 3,663 — — 4,836 3,663 Interest 5,469 4,010 — — 5,469 4,010 Utility — — 64,218 58,127 64,218 58,127 Stormwater — — 4,127 3,688 4,127 3,688 Total Expenses 208,570 163,727 68,345 61,815 276,915 225,541 Increaseinnetpositionbeforetransfers 13,657 51,711 (1,594) 1,750 12,063 53,461 Transfers — (2,591) — 2,591 — — Changeinnetposition 13,657 49,120 (1,594) 4,341 12,063 53,461 Netposition,beginningofyear 96,060 46,940 315,189 310,848 411,249 357,788 Netposition,ending $ 109,717 $ 96,060 $ 313,595 $ 315,189 $ 423,312 $ 411,249
Revenues: ProgramRevenues
8
Government-Wide Financial Analysis (Continued)
Governmental Activities
Governmental activities’ net position increased $13.66 million. This is a $(35.46) million decrease over the $49.12 million increase in net position in 2022.
The $13.66 million increase in net position from the prior year is due to the following:
• Governmental activities overall revenues showed an increased $6.79 million over the prior year principally due to increased property tax revenues of $8.2 million, other tax revenues of $3.68 million, and interest income of $4.40 million. These revenue increases were offset by a decrease in revenues from operating grants of ($10.18) million. The decrease in operating grant revenue was primarily due to revenue recognized in FY2022 for eligible grant expenditures of $5.99 million funded by the American Rescue Plan Act and the recovery of costs of $6.96 million funded by the 2017 Hurricane IRMA FEMA grant.
• Total expenses increased $44.84 million from the prior year. This is the net result of increased costs for salaries, benefits, and operating costs.
The following chart compares expenses and program revenues for the governmental activities during 2023.
Expenses and Program Revenues- Governmental Activities
(in
Expenses Revenues GeneralGov.PublicSafetyPhysicalEnvironmentTransportationSocialServicesEconomicEnvironmentParksandRecreation CulturalArts Interestandfiscalcharges $0 $15 $30 $45 $60 $75 $90 $105 $120
MANAGEMENT’S DISCUSSION AND ANALYSIS (UNAUDITED) FISCAL YEAR
SEPTEMBER
2023 9
Millions)
CITY OF MIRAMAR, FLORIDA
ENDED
30,
CITY OF MIRAMAR, FLORIDA
MANAGEMENT’S DISCUSSION AND ANALYSIS (UNAUDITED)
FISCAL YEAR ENDED SEPTEMBER 30, 2023
Government-Wide Financial Analysis (Continued)
Governmental Activities (Continued)
The following is a chart of revenues by source of governmental activities by percent of total revenues for fiscal year 2023:
Revenues by Source - GovernmentalActivities
Investment Earnings, 2.6% Other, 11.7%
Charges for Services, 26.9%
OtherTaxes, 14.5%
Operating Grants & Contributions, 5.7%
PropertyTaxes, 38.6%
10
CITY OF MIRAMAR, FLORIDA
MANAGEMENT’S DISCUSSION AND ANALYSIS (UNAUDITED)
FISCAL YEAR ENDED SEPTEMBER 30, 2023
Government-Wide Financial Analysis (Continued)
Governmental Activities (Continued)
The following is a comparative chart of revenues by source for governmental activities for fiscal year 2023 and 2022:
Revenues by Source - Governmental Activities (in Millions)
$90
$60 $75
$45
$30
$15
$0
ChargesforServicesOperatingGrants &ContributionsCapitalGrants &Contributions
Business-type Activities
The Business-type Activities are comprised of the Utility Fund and Stormwater Fund.
• The Utility Fund had an operating loss of ($7.54) million after depreciation in fiscal year 2023. This increased $5.96 million from the prior year's operating loss of ($1.57) million. Operating revenues decreased $(0.10) million as a result of a decrease in revenues from impact fees and permit fees which were offset by increased revenues from water sales, wastewater service, and service charges during the year. Operating expenses increased $5.87 million of which $2.15 million is attributable to an increase in personal services.
• The Stormwater Fund had operating income of $2.64 million which is a $424 thousand increase from the prior year. The increase was due to an increase in the stormwater rates per Equivalent Residential Unit (ERU) during FY2023, offset by increased costs for salaries, benefits and operating costs.
2023 2022
PropertyTaxes OtherTaxes Other
11
CITY OF MIRAMAR, FLORIDA MANAGEMENT’S DISCUSSION AND ANALYSIS (UNAUDITED) FISCAL YEAR ENDED SEPTEMBER 30, 2023
Government-Wide Financial Analysis
(Continued)
Business-type Activities (continued)
The following chart compares various operating results for 2023 and 2022, for the Utility Fund. Water
and Wastewater System (in Millions)
$60 $70
Financial Analysis of the City of Miramar’s Funds
As noted earlier, the City uses fund accounting to ensure and demonstrate compliance with finance-related legal requirements.
Governmental Funds
The focus of the City’s governmental funds is to provide information on near-term inflows, outflows, and balances of spendable resources. Such information is useful in assessing the City’s financing requirements. In particular, unassigned net position may serve as a useful measure of a government’s net resources available for spending at the end of the fiscal year.
The City’s governmental funds reported combined net fund balance of approximately $93.11 million at September 30, 2023, which consisted of $419 thousand in non-spendable, $32.42 million in restricted, $27.96 million in committed, $20.71 million in assigned and $11.61 million in unassigned fund balance. The current fund balance is a net decrease of $(2.05) million from the reported fund balance of $95.16 million in the prior year.
2023 2022 Operating Revenues Operating Expenses and Depreciation Operating Income (Loss) $-20
$-10 $0 $10 $20 $30 $40 $50
12
CITY OF MIRAMAR, FLORIDA
MANAGEMENT’S
DISCUSSION
AND ANALYSIS (UNAUDITED)
FISCAL YEAR ENDED SEPTEMBER 30, 2023
Governmental Funds (Continued)
The General Fund is the chief operating fund of the City. For the fiscal year 2023, the General Fund is the only governmental fund reported as a major fund. At the end of the current fiscal year, unassigned fund balance of the General Fund was $11.61 million, or 17.14% of the total fund balance of $67.75 million. As a measure of the General Fund’s liquidity, it may be useful to compare both unassigned fund balance and total fund balance to the total General Fund expenditures. In 2023, unassigned fund balance represents 6.11% and the total fund balance represents approximately 35.64% of the total General Fund expenditures. In comparison, in 2022, the unassigned fund balance was 4.26% and the total fund balance was 34.30% of the total General Fund expenditures.
The fund balance of the General Fund increased by $6.65 million during the current fiscal year. This represents an overall decrease of $(7.13) million as compared with the prior year’s increase to fund balance. Revenues increased approximately $11.05 million from the prior year. This increase is primarily due to an increase in tax revenues of $11.91 million. Ad-valorem taxes represent $8.21 million of the $11.91 million increase in tax revenues. Ad-valorem tax revenues increased primarily due to the increased assessed value of real and personal property for fiscal year 2023.
General Fund expenditures increased $11.91 million from the prior year due to an overall increase in salaries and benefits.
The net transfers out of the General Fund of $7.01 million include transfers of $8.91 million transferred to the Debt Service Fund to cover debt service payments; $1.95 million transferred to the Capital Projects Fund to provide funding for ongoing capital projects. Transfers into the General Fund consisted of transfers from various grant funds for eligible expenditures; and from the Street Construction and Maintenance Fund to cover the cost of street capital improvements and maintenance costs incurred in the General Fund.
The non-major governmental funds reported a combined fund balance of $25.36 million at September 30, 2023. The combined fund balance of the City’s non-major governmental funds decreased by $(8.69) million during the current fiscal year as a result of approximately $33.03 million in revenues and other financing sources which was offset by $41.73 million in expenditures and other financing uses. Expenditures include $16.43 million in capital outlay and $12.18 million in debt service costs. The net transfers in of $7.01 million include transfers to the General Fund for eligible grant reimbursed expenditures and transfers from the General and Capital Projects Funds to cover debt service payments during the year.
General
2023 2022 Revenues $ 202,905 $ 191,851 Expenditures (190,115) (178,207) Other financing sources (6,142) 138 Increase (decrease) in fund balance $ 6,648 $ 13,782
Fund:
13
Governmental Funds (Continued)
The following table compares governmental revenues by program for fiscal years 2023 and 2022. Comparison
of Governmental
(in Millions) 2023 2022 Taxes Licenses &PermitsIntergovernmental Charges forServices Fines& Forfeitures ImpactFees Special AssessmentsInvestmentIncomeMiscellaneous $0 $15 $30 $45 $60 $75 $90 $105 $120
Funds Revenues
governmental expenditures by program for fiscal years 2023
of Governmental Funds Expenditures (in Millions) 2023 2022 GeneralGov. PublicSafety Physical EnvironmentTransportation Social ServicesEconomicEnvironmentParksandrecreation CulturalArtsGrants/Aid CapitalOutlay Debt Service $0 $15 $30 $45 $60 $75 $90 $105 $120 CITY OF MIRAMAR, FLORIDA MANAGEMENT’S DISCUSSION AND ANALYSIS (UNAUDITED) FISCAL YEAR ENDED SEPTEMBER 30, 2023 14
The following table compares
and 2022. Comparison
CITY OF MIRAMAR, FLORIDA
FISCAL YEAR ENDED SEPTEMBER 30, 2023
Proprietary Funds
Enterprise funds’ net position consisted of $245.48 million in net investment in capital assets, $13.51 million in restricted and $54.61 million in unrestricted net position. Internal Service funds’ net position consisted of $5.45 million in net investment in capital assets, and $41.40 million in unrestricted net position.
The Utility Fund had an operating loss of $(7.54) million, after depreciation and amortization expenses in 2023. This is a decrease of $(5.96) million from the $(1.57) million operating loss experienced in 2022. The higher operating loss was primarily the result of higher revenues from water sales and wastewater service offset by higher operating expenses of salaries and benefits and depreciation of capital assets.
The Stormwater Fund had operating income of $2.64 million. This is a $424 thousand increase from the prior year operating income attributable to an increase in the stormwater rates per ERU offset by higher operating costs.
The Internal Service Funds had operating income of $7.59 million, after depreciation and amortization expenses in 2023. This is an increase of $0.81 million from the $6.78 million operating income experienced in 2022. The increase is attributable to increased charges to user departments for insurance costs and information technology services.
PROPRIETARY FUNDS
(in thousands)
The following is a chart of the Proprietary Funds, excluding the Utility Fund operations, for fiscal years 2023 and 2022. Proprietary Funds Excluding Utility Fund Operations (in Millions)
Operating Income (Loss) Change in Net Position 2023 2022 2023 2022 Utility $ (7,535) $ (1,571) $ (4,624) $ 2,384 Stormwater 2,645 2,220 3,030 1,956 Insurance Fund 6,013 4,969 7,567 5,189 Fleet Maintenance Fund 1,578 330 2,054 401 Management Information Systems 1 1,481 86 1,501 Total $ 2,702 $ 7,429 $ 8,113 $ 11,431
2023 2022 Operating Revenues Operating Expenses Change in Net Position $0 $10 $20 $30 $40 $50
DISCUSSION
ANALYSIS
MANAGEMENT’S
AND
(UNAUDITED)
15
CITY OF MIRAMAR, FLORIDA
General
Fund Budgetary Highlights
The difference between the original and final amended budget for 2023 was approximately $(5.88) million which represents an increase in appropriations and other financing uses in excess of revenues.
Actual revenues were more than final budgeted revenues by approximately $7.19 million. Revenues for taxes, permits, and intergovernmental revenues contributed to the positive variance.
Actual expenditures during the year were less than final budgeted expenditures by approximately $4.04 million. The City did not incur all anticipated costs related to the increase in appropriations before the end of the fiscal year which resulted in the positive variance. Cost savings were achieved primarily in the areas of general government, public safety, and non-departmental expenditures.
General Fund Budgetary Highlights (Continued)
The following chart depicts the 2023 original and amended budgets, as well as actual results for the fiscal year.
GENERAL FUND BUDGETARY COMPARISON
(in Millions)
Expenditures andTransfers Revenues andTransfers Change in Fund Balance
Original Budget Amended Budget Actual Balance $-30 $0 $30 $60 $90 $120 $150 $180 $210
MANAGEMENT’S DISCUSSION AND ANALYSIS (UNAUDITED) FISCAL YEAR ENDED SEPTEMBER 30, 2023 16
CITY OF MIRAMAR, FLORIDA
MANAGEMENT’S DISCUSSION AND ANALYSIS (UNAUDITED)
FISCAL YEAR ENDED SEPTEMBER 30, 2023
Capital Assets
As of the 2023 fiscal year-end, the City had $606.37 million invested in capital assets as reflected in the following schedule. In 2023 there was a net increase (additions less retirements and depreciation) of $7.62 million.
*Restated for GASB 96 SBITA, as of October 1, 2022.
Total capital assets in the governmental activities had a net decrease of approximately $1.68 million. Total capital assets in the business-type activities had a net increase of approximately $9.30 million. The overall net increase of $7.62 million is the result of $35.31 million in capital improvement projects and outlays for vehicles and equipment less depreciation expense of $27.61 million. Governmental and business-type activities construction in progress (CIP) had a net increase of $25.52 million. This increase was attributable to active construction projects during the year.
Additional information can be found in Note 6 Capital Assets.
Capital Assets (in thousands, net of depreciation and amortization) Governmental Activities Business-Type Activities Total 2023 2022 2023 2022 2023 2022 Land $ 45,534 $ 45,534 $ 5,754 $ 5,754 $ 51,288 $ 51,288 Buildings 147,254 151,277 61,985 63,938 209,239 215,215 Improvements other than buildings 18,513 17,192 798 826 19,311 18,018 Equipment 10,538 11,189 1,353 1,525 11,890 12,714 Fleet 4,428 5,159 1,455 1,447 5,883 6,606 Intangibles 1,978 2,163 240 310 2,218 2,473 Infrastructure 23,650 25,259 220,225 228,470 243,875 253,729 Right to use leased assets 845 1,136 — — 845 1,136 Right to Use SBITA* 1,818 3,081 151 165 1,969 3,246 Construction in Progress 17,519 11,767 42,333 22,562 59,852 34,330 Total $ 272,077 $ 273,758 $ 334,293 $ 324,998 $ 606,370 $ 598,756
17
CITY OF MIRAMAR, FLORIDA MANAGEMENT’S DISCUSSION AND ANALYSIS (UNAUDITED) FISCAL YEAR ENDED SEPTEMBER 30, 2023
Debt Administration
As of year-end, the City had $230.26 million in debt (bonds, notes, etc.) outstanding compared to $246 million in the prior year, a (6.40)% decrease. The decrease in debt of $(15.74) million is principally due to debt service payments on the outstanding issues.
The debt outstanding as of the end of fiscal year 2023 was secured by various revenue sources as disclosed in Note 8.
The debt position of the City is summarized below and is more fully explained in Note 8 Long-Term Obligations.
*Restated for GASB 96 SBITAs, as of October 1, 2022.
During fiscal year 2023, the City had the following debt activity:
• Total principal payments for governmental activities debt were approximately $11.01 million less amortized premium costs of $0.34 million.
• Total principal payments for business-type activities were approximately $4.76 million less amortized premium costs of $0.31 million.
Economic Factors and Next Year’s Budgets and Rates
The City Commission and City staff are dedicated to providing safety and security for Miramar’s citizens and businesses. The City’s mission has been to continuously improve the quality of life and economic prosperity of the residents and businesses by assuring all of our citizens a clean, safe, economically viable and progressive city that is responsive to changing needs. Each year the City’s business plan is updated to ensure that the budget strategically links the goals, objectives, core businesses, and existing obligations of the City.
• Property values in the City increased this year again. The tax base for fiscal year 2024 of approximately $14.059 billion increased by $1.473 billion, or 11.70%, from the fiscal year 2023 tax base of $12.586 billion. This increase was the result of a strong real estate market during fiscal year 2023.
• In fiscal year 2024, the millage rate remained consistent at 7.1172 which is 8.70% greater than the rolled-back rate. The amount of Ad Valorem taxes proposed to be collected in 2024 is approximately $10.100 million more than in fiscal year 2023.
• As of 2023, the unemployment rate was 2.90%.
Bonded Debt, Notes, Loans and Lease Payable (in Thousands) Governmental Activities Business-Type Activities Total 2023 2022 2023 2022 2023 2022 Revenue Bonds $ 107,350 $ 113,575 $ 34,255 $ 35,990 $ 141,605 $ 149,565 Notes Payable 19,540 21,485 — — 19,540 21,485 State Revolving Loans — — 48,660 51,287 48,660 51,287 Obligations under financing agreements 8,885 10,463 — — 8,885 10,463 Obligations under leases 875 1,144 — — 875 1,144 Obligations under SBITAs* 1,499 2,149 109 165 1,608 2,314 DeferredAmounts - Premium (discounts) 4,255 4,598 4,827 5,141 9,082 9,738 Total $ 142,404 $ 153,414 $ 87,851 $ 92,583 $ 230,255 $ 245,997
18
CITY OF MIRAMAR, FLORIDA
MANAGEMENT’S DISCUSSION AND ANALYSIS (UNAUDITED)
FISCAL YEAR ENDED SEPTEMBER 30, 2023
Economic Factors and Next Year’s Budgets and Rates (Continued)
• The City was incorporated on May 26, 1955, with a population of less than 200. The latest population estimates from the University of Florida, Bureau of Economic and Business Research, indicates that the number of residents in Miramar has increased to approximately 138,000. Residents over the years have enjoyed a high level of service and expect this to continue. The City has increased the number of facilities and programs offered to its residents and increased services to accommodate the growth in population, all of which have resulted in increased operating costs. As the population continues to grow and new businesses invest in the local economy, the City of Miramar continues to explore new strategies to meet the City’s needs.
New Initiatives
The City’s goal is to develop initiatives that will assist in achieving strategic objectives and Key Intended Outcomes. Included in the Fiscal Year 2024 budget initiatives are:
◦ The Police department’s FY 2024 budget includes funding to support training and development for new recruits and current officers. Funding is also included for five new Police Officer positions (5.0 FTEs) starting mid-year 2024, along with operating and capital outlay costs such as uniforms, protective clothing, training, ammunition, radios, computer equipment and the purchase of five new police vehicles to support the new positions. Funding is also included for the Reserve Officer Program which involves fully sworn certified officers who assist the police department on a voluntary basis, such as with training of fellow department members, community outreach events, special events and other assignments as directed by the Chief of Police. Contingency funding is included to address unforeseen needs that arise in support of public safety.
◦ During FY 2023 the Fire-Rescue department was awarded the SAFER Grant for 16 new firefighter positions (16.0 FTEs) budgeted in the Federal Grants Fund. Included in this department’s FY 2024 budget is funding for the 16 firefighter positions, such as bunker gear and uniforms, self contained breathing apparatus (SCBA) and extrication tools (Hurst Cutter, Hurst Spreader, batteryoperated saltwater submersible rescue tool, 6 batteries and 3 chargers). The budget also includes the purchase of a new F250 truck, ballistic helmets and vests for protecting personnel on active killer or violent patient incidents, Fire Life Safety Software to facilitate how documentation is gathered and stored, funds to support accreditation as a priority, Emergency Medical Services Matching Grant (six blood analyzer systems and fix airway manikins), and contingency funds to support unforeseen needs that arise in support of public safety.
◦ Funding is included in FY 2024 Utilities Department budget for repairs and maintenance to replace obsolete and aging parts and equipment at 130+ liftstations, East Wastewater Treatment Plant (WTP), West WTP and Wastewater Reclamation Facility, contractual services to replace obsolete liftstation SCADA system and landscape services for Berm clean-up and tree trimming, software license and maintenance for the enterprise asset and mobile site , purchase of machinery and equipment that is past its useful life due to age and/or wear and tear, the purchase of six new vehicles (three Ford F250s, one Flat Bed Truck with Rails F750, one valve maintenance truck Ford 350 and one Ford Escape), and overtime costs due to increased after-hours call outs and historical trends.
◦ This year’s Public Works budget includes funding for repair and maintenance of buildings, pressure cleaning of City streets, mulch replacement, janitorial services, the installation of speed humps on streets to enhance safety and reduce traffic accidents, a new UT Instrumentation/ Electrician Technician position (1.0 FTE) responsible for HVAC systems within the City, along with operating costs such as uniform and protective clothing, and the purchase of a new Ford Van to support the new position, professional services to cover the consultant administration fees for the management of the parking garage and 82 structured parking spaces, and contingency funds for unforeseen maintenance issues.
19
CITY OF MIRAMAR, FLORIDA
MANAGEMENT’S DISCUSSION AND ANALYSIS (UNAUDITED) FISCAL YEAR ENDED SEPTEMBER 30, 2023
New Initiatives
(Continued)
◦ Included in this year’s Stormwater budget is funding for guardrail installation, contract services for Right-of-Way Drainage Improvements and canal maintenance, and one new Maintenance 1 position (1.0 FTE) responsible for monitoring and inspecting the City’s canals, properties and open spaces along with uniform cost, protective clothing and the purchase of one new Ford F150 Pickup truck to support the new position.
◦ Funding is included in the Fleet Fund budget to cover the increase cost of parts and repair services for the City’s vehicle fleet, as well as for the repair and maintenance of the Fuel Maintenance System. As the City’s 15 generator fuel site facilities continue to age, repairs and replacements are needed to meet Florida fuel regulation requirements, as well as for Fleet Maintenance Assets.
The City continues to provide additional facilities and programs for its residents as well as address infrastructure needs related to the unparalleled growth and development currently taking place withing the City. The following CIP initiatives are underway:
◦ Park improvement projects include repairing/adding fencing, repairing/adding parking, adding walking path lights, renovating/replacing playgrounds, installing irrigation, pavilions, benches and receptacles, and repairing facility front counters and flooring. Additionally, funding is being provided to construct new restroom buildings at Fairway Park in Historic Miramar, Flamingo Estates Park and Sunset Lakes Community Center.
◦ The Amphitheater Noise Reduction CIP project include the implementation of various site improvements at the Amphitheater to reduce the sound penetrating into the neighboring homes.
◦ The Light and Audio Visual equipment in the Cultural Arts Theater is over 12 years old and in need of replacement. The Cultural Arts Theater Audio Visual CIP project entails replacement and upgrade of the outdated, out of warranty Audio Visual and Lighting equipment with state-of-the-art audio visual, and lighting technologies. As this is a revenue generating venue, it is critical that the equipment is reliable, well maintained, and competitive with industry standards.
◦ The Facilities Capital Improvement project includes procuring consultant services needed to evaluate existing City facilities, and prepare reports on repair and routine maintenance. The consultant will also be required to prepare cost estimates for the repair/renovation to include in the future CIP funding. This project also provides funds for repair and maintenance work on City facilities, removal and replacement of the existing flat built-up roof and parapet wall repairs at the West District Police Substation; Tile Roof Replacement, HVAC Replacement at the West Police Substation and HVAC upgrades to various facilities at the Public Works Department request.
◦ The Pembroke Road/Miramar Parkway Extension project consists of widening Pembroke Road from two to four lanes from Dykes Road to SW 196 Avenue, construct new four lanes of roadway with median, landscaping, irrigation, sidewalk, bike lanes and lighting from SW 196 Avenue to US 27, and construct a new roadway with median, landscaping, irrigation, sidewalk, bike lanes and lighting along Miramar Parkway from SW 192 Terrace to Pembroke Road, just west of SW 196 Avenue. This project will also include the construction of buffer walls along residential areas.
Contacting the City’s Financial Management
This financial report is designed to provide our citizens, taxpayers, customers, and investors and creditors with a general overview of the City’s finances and to demonstrate the City’s accountability. If you have questions about this report or need additional information, contact the Office of the Financial Services Director at the address listed below. A copy of this report will also be available on the City’s website, www.miramarfl.gov.
City of Miramar Financial Services Department
2300 Civic Center Place
City Hall, 2nd Floor Miramar, Florida 33025
20
BASIC FINANCIAL STATEMENTS
Noncurrentliabilities:
Amountsdueorpayablewithinoneyear:
GovernmentalActivities Business-TypeActivities Total ASSETS Cashandcashequivalents $ 154,752,151 $ 66,897,292 $ 221,649,443 Receivables,net 7,917,642 9,382,624 17,300,266 Duefromothergovernments 8,030,886 — 8,030,886 Inventories 417,482 — 417,482 Prepaiditems 2,943,493 500 2,943,993 InternalBalances (3,437,446) 3,437,446 — Leasereceivables 25,492,460 — 25,492,460 Restrictedassets: Cashandcashequivalents 1,869,973 19,754,250 21,624,223 Capitalassets,notbeingdepreciated 63,053,192 48,086,425 111,141,737 Capitalassets,beingdepreciated,net 209,024,149 286,206,986 495,229,015 TOTALASSETS 470,063,982 433,765,523 903,829,505
Deferredlossondebtrefunding 2,773,902 88,291 2,862,193 Pensions(Note9) 119,815,446 9,677,574 129,493,020 OPEB(Note10) 7,183,800 1,325,066 8,508,866 TOTALDEFERREDOUTFLOWOFRESOURCES 129,773,148 11,090,931 140,864,079 LIABILITIES Accountsandretainagepayable 6,300,666 6,550,990 12,851,656 Accruedliabilities 5,434,950 209,820 5,644,770 Duetoothergovernments 110,496 7,810 118,306 Unearnedrevenue 8,756,153 — 8,756,153 Otherliabilities 3,201,138 — 3,201,138
DEFERREDOUTFLOWOFRESOURCES
Bonds,notes,andfinancingagreements 9,848,484 5,139,521 14,988,005 Self-insuranceclaims 2,698,922 — 2,698,922 Leaseobligations 149,113 — 149,113 SBITAobligations 64,808 53,501 118,309 Compensatedabsences 4,690,079 900,262 5,590,341 Otherliabilities — 1,468,299 1,468,299 Amountdueorpayableinmorethanoneyear: Bonds,notes,andfinancingagreements 130,181,603 82,602,788 212,784,391 Leaseobligations 725,592 — 725,592 SBITAobligations 1,458,300 55,053 1,513,353 Self-insuranceclaims 8,037,239 — 8,037,239 Compensatedabsences 11,601,933 1,638,917 13,240,850 Otherpost-employmentbenefits 37,559,517 5,286,984 42,846,501 Totalpensionliability-excessbenefit 1,176,532 — 1,176,532 Netpensionliability 208,457,253 16,610,004 225,067,257 Unearnedrevenue — 1,770,000 1,770,000 Otherliabilities — 4,910,472 4,910,472 TOTALLIABILITIES 440,452,778 127,204,421 567,657,199 DEFERREDINFLOWOFRESOURCES Deferredgainondebtrefunding 101,719 — 101,719 Revenuesreceivedinadvance 3,531,373 — 3,531,373 Leases 24,059,970 — 24,059,970 Pensions(Note9) 9,114,504 1,095,813 10,210,317 OPEB(Note10) 12,859,311 2,961,404 15,820,715 TOTALDEFERREDINFLOWSOFRESOURCES 49,666,877 4,057,217 53,724,094 NETPOSITION Netinvestmentincapitalassets 145,188,335 245,477,099 390,665,434 Restrictedfor: Publicsafety 1,277,276 — 1,277,276 Debtservice — 10,531,990 10,531,990 Capitalprojects 8,740,414 — 8,740,414 Renewalandreplacement — 2,980,000 2,980,000 Housing 3,374,282 — 3,374,282 Buildingservices 7,057,800 — 7,057,800 Otherpurposes 89,015 — 89,015 Unrestricted (56,009,647) 54,605,727 (1,403,920) TOTALNETPOSITION $ 109,717,475 $ 313,594,816 $ 423,312,291
notes to basic financial statements.
See
NET POSITION
21
CITY OF MIRAMAR, FLORIDA STATEMENT OF
SEPTEMBER 30, 2023
CITY OF MIRAMAR, FLORIDA STATEMENT OF ACTIVITIES
FISCAL YEAR ENDED SEPTEMBER 30, 2023
ProgramRevenues Net(Expense)RevenueandChangesinNetPosition Functions/Programs Expenses Chargesfor services Operating Grantsand Contributions Capital Grantsand Contributions GovernmentalActivities Business-Type Activities Total Primary Government: General government $ 42,441,809 $ 13,697,286 $ 1,010,147 $ 29,217 $ (27,705,159) $ — $ (27,705,159) Public safety 108,086,580 40,671,725 4,290,369 — (63,124,486) — (63,124,486) Physical environment 4,378,702 366,863 636,538 325,000 (3,050,301) — (3,050,301) Transportation 7,364,048 — 351,698 4,422,191 (2,590,159) — (2,590,159) Social services 7,478,521 1,610,339 957,790 — (4,910,392) — (4,910,392) Economic environment 7,345,650 — 5,348,593 920,555 (1,076,502) — (1,076,502) Parks and recreation 21,169,029 2,188,651 93,320 50,000 (18,837,058) — (18,837,058) Cultural arts 4,836,181 1,164,666 18,850 — (3,652,665) — (3,652,665) Interest on long-term debt 5,468,925 — — — (5,468,925) — (5,468,925) Total governmental activities 208,569,445 59,699,530 12,707,305 5,746,963 (130,415,647) — (130,415,647) Business-Type Activities: Utility 64,217,699 54,373,796 — 1,812,083 — (8,031,820) (8,031,820) Stormwater 4,126,652 6,580,979 — — — 2,454,327 2,454,327 Total Business-Type Activities 68,344,352 60,954,775 — 1,812,083 — (5,577,493) (5,577,493) Total Primary Government $ 276,913,797 $ 120,654,305 $ 12,707,305 $ 7,559,046 (130,415,647) (5,577,493) (135,993,140) General revenues: Property taxes 85,708,861 — 85,708,861 Utility taxes 14,235,990 — 14,235,990 Local option gas tax 2,368,857 — 2,368,857 Communication service tax 3,901,332 — 3,901,332 Franchise fees based on gross receipts 11,809,743 — 11,809,743 Unrestricted intergovernmental revenues 18,535,141 — 18,535,141 Unrestricted investment earnings 5,745,374 3,983,881 9,729,255 Miscellaneous 1,767,591 — 1,767,591 Total general revenues 144,072,889 3,983,881 148,056,770 Change in net position 13,657,242 (1,593,612) 12,063,630 Net position – beginning of year 96,060,233 315,188,428 411,248,661 Net position – end of year $ 109,717,475 $ 313,594,816 $ 423,312,291
See notes to basic financial statements. 22
CITY OF MIRAMAR, FLORIDA BALANCE SHEET
FUNDS SEPTEMBER 30, 2023
MajorFund Nonmajor Total GeneralFund GovernmentalFund GovernmentalFunds ASSETS PooledCashandCashEquivalents $ 66,319,017 $ 34,679,707 $ 100,998,724 Receivables,net 6,769,156 670,019 7,439,175 Duefromotherfunds 5,287,687 — 5,287,687 Duefromothergovernments 2,444,638 5,586,246 8,030,884 Inventories 14,975 — 14,975 LeaseReceivable 25,492,460 — 25,492,460 PrepaidItems 404,203 — 404,203 RestrictedCashwithfiscalagent 1,782,399 — 1,782,399 TOTALASSETS 108,514,535 40,935,972 149,450,507 LIABILITIES Accountspayable 2,406,609 2,427,790 4,834,399 Retainagepayable 131,412 450,872 582,284 Accruedliabilities 2,665,083 41,634 2,706,717 Advancetootherfunds 1,097,456 — 1,097,456 Duetootherfunds 2,339,989 5,287,686 7,627,675 Duetoothergovernment 110,495 — 110,495 Unearnedrevenue 1,219,267 7,367,988 8,587,255 Otherliabilitiesanddeposits 3,201,138 — 3,201,138 TOTALLIABILITIES 13,171,449 15,575,970 28,747,419 DEFERREDINFLOWSOFRESOURCES Revenuereceivedinadvance 3,531,373 — 3,531,373 Leases 24,059,970 — 24,059,970 TOTALDEFERREDINFLOWSOFRESOURCES 27,591,343 — 27,591,343 FUNDBALANCES Non-spendable: Inventory 14,975 — 14,975 Prepaids 404,203 — 404,203 Restrictedfor: Housing — 3,374,282 3,374,282 Lawenforcement — 1,277,276 1,277,276 Streetconstructionandmaintenance — 1,412,491 1,412,491 CulturalArts 89,015 89,015 BuildingServices 7,057,800 7,057,800 Parkdevelopment — 4,047,123 4,047,123 Capitalimprovement — 15,080,760 15,080,760 Debtservice — 79,055 79,055 Committedto: Stabilizationfund 24,955,768 — 24,955,768 OPEBTrustFund 500,000 — 500,000 Economicdevelopment 2,285,036 — 2,285,036 Developercontributions-ArtinPublicPlaces 215,130 — 215,130 Assignedto: Emergencypreparedness 7,998,644 — 7,998,644 PensionTrustFund 9,880,655 — 9,880,655 SubsequentYearsBudget 1,637,498 — 1,637,498 Constructioncommitments 817,903 — 817,903 Donationsandscholarships 370,829 — 370,829 Unassigned: Generalfund 11,613,302 — 11,613,302 TOTALFUNDBALANCES 67,751,743 25,360,002 93,111,745 TOTALLIABILITIES,DEFERREDINFLOWSOF RESOURCESANDFUNDBALANCES $ 108,514,535 $ 40,935,972 $ 149,450,507
GOVERNMENTAL
See notes to basic financial statements. 23
CITY OF MIRAMAR, FLORIDA
RECONCILIATION OF THE BALANCE SHEET TO THE STATEMENT OF NET POSITION
GOVERNMENTAL FUNDS
SEPTEMBER 30, 2023
Fund balances – total governmental funds $ 93,111,745
Amounts reported for governmental activities in the statement of net position are different because:
Capital assets used in governmental activities are not financial resources and therefore are not reported in the governmental funds.
Governmental capital assets 428,253,082
Less accumulated depreciation (165,447,681) 262,805,401
Long-term liabilities, including bonds payable, are not due and payable in the current period and therefore are not reported in the governmental funds.
Revenue bonds payable (107,350,000)
Notes payable (19,540,000)
Obligations under financing agreements (6,642,002)
Obligations under leases (690,888)
SBITAobligations (132,494)
Accrued interest on long-term debt (3,669,021)
Compensated absences (14,340,932)
Other post-employment benefit obligation (36,274,805)
Net pension liability (205,222,988)
Total pension liability-excess benefit plan (1,176,532) (395,039,662)
Certain items are recognized when debt is issued in the governmental funds. These items, however, must be capitalized and amortized in the government-wide statements.
Premium on debt (4,254,673)
Deferred inflows/outflows of resources reported in the statement of net position:
Net deferred gain (loss) on refundings 2,672,182 Net deferred outflows (inflows) on pensions 109,010,022
Net deferred outflows (inflows) on OPEB (5,446,099) 106,236,105
Internal service funds are used by management to charge the costs of certain activities to individual funds. 46,858,559
Net position of governmental activities $109,717,475
See notes to basic financial statements.
24
STATEMENT
EXPENDITURES
CITY OF MIRAMAR, FLORIDA
FISCAL YEAR ENDED SEPTEMBER 30, 2023
FINANCING SOURCES (USES)
Major Fund Nonmajor Total General Fund Governmental Fund Governmental Funds REVENUES Taxes $115,655,926 $ — $115,655,926 Special assessments 22,279,037 — 22,279,037 Licenses and permits 10,254,924 — 10,254,924 Intergovernmental 24,373,327 15,961,202 40,334,529 Charges for services 22,162,708 1,586,861 23,749,569 Fines and forfeitures 417,522 605,249 1,022,771 Impact fees — 117,145 117,145 Interest Revenue 4,729,204 1,016,169 5,745,373 Developer Contributions 29,217 — 29,217 Miscellaneous Revenue 3,003,197 35,000 3,038,197 TOTAL REVENUES 202,905,062 19,321,626 222,226,688
Current: General government 40,732,377 12,069 40,744,446 Public safety 105,510,387 2,832,388 108,342,775 Physical environment 1,633,409 — 1,633,409 Transportation 4,157,530 — 4,157,530 Social Services 7,176,119 258,431 7,434,549 Economic environment 3,236,529 3,135,498 6,372,028 Parks and recreation 17,461,884 37,669 17,499,553 Cultural arts 4,439,950 875 4,440,825 Grants/aid 173,749 137,266 311,015 Capital outlay 4,757,709 16,433,110 21,190,819 Debt service: Principal 630,189 8,337,826 8,968,014 Interest Expense 204,860 3,835,221 4,040,081 Fiscal charges — 2,931 2,931 TOTAL EXPENDITURES 190,114,693 35,023,284 225,137,977 Excess (deficiency) of revenues over (under) expenditures 12,790,369 (15,701,658) (2,911,289) OTHER
Transfers in 4,222,646 13,712,257 17,934,903 Transfers out (11,229,557) (6,705,346) (17,934,903) Lease Proceeds 865,227 — 865,227 TOTAL OTHER FINANCING SOURCES (USES) (6,141,684) 7,006,911 865,227 Net changes in fund balances 6,648,685 (8,694,747) (2,046,062) Fund balances, beginning 61,103,058 34,054,749 95,157,807 Fund balances, ending $ 67,751,743 $ 25,360,002
$ 93,111,745
OF
EXPENDITURES
IN FUND
REVENUES,
AND CHANGES
BALANCES GOVERNMENTAL FUNDS
See notes to basic financial statements. 25
CITY OF MIRAMAR, FLORIDA
RECONCILIATION OF THE STATEMENT OF REVENUES, EXPENDITURES AND CHANGES IN FUND BALANCES OF GOVERNMENTAL FUNDS TO THE STATEMENT OF ACTIVITIES
Change in fund balance – total governmental funds $ (2,046,062)
Amounts reported for governmental activities in the Statement ofActivities are different because:
Governmental funds report capital outlay as expenditures. However, in the Statement ofActivities, the cost of those assets is depreciated over their estimated useful lives.
Loss
Issuance of long-term debt provides current financial resources to governmental funds, while repayment of the principal is an expenditure in the governmental funds.The issuance increases long-term liabilities in the Statement of Net Position, while the repayment reduces long-term liabilities in the Statement of Net Position.Also, governmental funds report the effect of premiums and discounts and similar items when debt is first issued whereas those amounts are deferred and amortized in the Statement ofActivities.
Lease proceeds (865,228)
Some expenses reported in the Statement ofActivities do not require the use of current financial resources and, therefore, are not reported as expenditures in the governmental funds.
Accrued interest payable (1,780,250)
Compensated absences (155,380)
Other post-employment benefit obligations (1,361,900) Pension
(479,584) (3,777,114)
Internal service funds are used by management to charge the costs of certain activities to individual funds.The net revenue (expense) of internal service funds is reported with governmental activities. 9,707,393
Change in net position of governmental activities $ 13,657,242
FISCAL YEAR ENDED SEPTEMBER 30, 2023 See notes to
Expenditures
11,989,555 Less current year depreciation (11,326,471) 663,084
for capital outlay
on disposal of capital assets
(79,915)
Bonds and notes principal payments 8,170,000 Purchase financing agreement payments 798,014 Lease obligations principal payments 94,272 SBITAobligations principal payments 732,734 Deferred amount on refunding (83,207) Amortization of debt premium 343,271 9,189,856
expense
basic
26
financial statements.
CITY OF MIRAMAR, FLORIDA STATEMENT OF NET POSITION PROPRIETARY FUNDS SEPTEMBER 30, 2023
Business-TypeActivities-EnterpriseFunds Governmental MajorFunds Activities Stormwater InternalService UtilityFund Fund Total Funds ASSETS Currentassets: Pooledcashandcashequivalents $ 63,528,275 $ 3,369,017 $ 66,897,292 $ 53,497,935 Receivables,net 9,356,261 26,363 9,382,624 478,467 Inventories — — — 402,507 Prepaiditems 500 — 500 2,539,290 Duefromotherfunds 2,339,989 — 2,339,989 — Restrictedpooledcashandcashequivalents: Pooledcashandcashequivalents 14,576,578 267,198 14,843,776 — Cashwithfiscalagent — — — 87,574 Totalcurrentassets 89,801,603 3,662,578 93,464,181 57,005,773 Non-currentassets: Restrictedpooledcashandcashequivalents 4,910,472 — 4,910,472 — Advancestootherfunds 1,097,457 — 1,097,457 — Capitalassets,notbeingdepreciated 34,553,451 13,532,974 48,086,425 — Capitalassets,beingdepreciated,net 271,124,208 15,082,777 286,206,986 9,271,940 Totalnon-currentassets 311,685,588 28,615,751 340,301,339 9,271,940 TOTALASSETS 401,487,191 32,278,329 433,765,521 66,277,713 DEFERREDOUTFLOWSOFRESOURCES Deferredlossondebtrefunding 88,291 — 88,291 — DeferredOutflow-Pensions(Note10) 8,967,920 709,654 9,677,574 2,110,756 DeferredOutflow-OPEB(Note10) 1,229,936 95,130 1,325,066 443,665 TOTALDEFERREDOUTFLOWSOFRESOURCES 10,286,147 804,784 11,090,931 2,554,421 LIABILITIES Currentliabilities: Accountspayable 5,473,620 160,143 5,633,763 981,980 Retainagepayable 325,991 591,236 917,227 — Accruedliabilities 974,773 135,308 1,110,081 344,032 Duetoothergovernment 7,810 — 7,810 — Current-Unearnedrevenue — — — 168,898 Currentportionoflong-termobligations 4,172,863 1,020,159 5,193,022 4,144,115 CurrentLiabilitiespayablefromrestrictedassets 1,553,766 — 1,553,766 — Totalcurrentliabilities 12,508,823 1,906,846 14,415,669 5,639,025 Non-currentliabilities: Bondspayable,netofdiscount 36,876,958 385,425 37,262,383 — Staterevolvingloans 35,643,243 9,697,162 45,340,405 — Capitalleases — — — 1,495,609 ObligationsUnderLeases — — — 34,704 SBITAobligations 55,053 — 55,053 842,339 Compensatedabsences 1,564,550 74,366 1,638,916 312,773 Otherpost-employmentbenefits(OPEB) 4,755,723 531,262 5,286,985 1,284,712 Netpensionliability 15,335,133 1,274,871 16,610,004 3,234,264 Estimateforself-insuredlosses — — — 8,037,240 Unearnedrevenue 1,770,000 — 1,770,000 — Liabilitiespayablefromrestrictedassets 4,825,004 — 4,825,004 — Totalnon-currentliabilities 100,825,664 11,963,086 112,788,750 15,241,641 TOTALLIABILITIES 113,334,487 13,869,932 127,204,420 20,880,666 DEFERREDINFLOWSOFRESOURCES DeferredInflow-Pensions(Note10) 1,031,925 63,888 1,095,813 419,836 DeferredInflow-OPEB(Note10) 2,748,796 212,608 2,961,404 673,077 TOTALDEFERREDINFLOWSOFRESOURCES 3,780,721 276,496 4,057,217 1,092,913 NETPOSITION Netinvestmentincapitalassets 228,555,330 16,921,769 245,477,099 5,454,095 Restrictedfordebtservice 10,264,792 267,198 10,531,990 — Restrictedforrenewalandreplacement 2,980,000 — 2,980,000 — Unrestricted 52,858,009 1,747,718 54,605,727 41,404,464 TOTALNETPOSITION $ 294,658,131 $ 18,936,685 $ 313,594,816 $ 46,858,559
See notes to basic financial statements. 27
STATEMENT
CITY OF MIRAMAR, FLORIDA
FISCAL YEAR ENDED SEPTEMBER 30, 2023
Business-TypeActivities - Enterprise Funds Governmental Activities Major Funds Nonmajor Enterprise Funds Internal Service Funds Utility Fund Total OPERATING REVENUES Water sales $ 22,911,372 $ — $ 22,911,372 $ — Wastewater service 28,393,552 — 28,393,552 — Stormwater fees — 6,580,979 6,580,979 — Impact fees 501,879 — 501,879 — Service charges 2,352,929 — 2,352,929 — Permit Fees 151,096 151,096 Charges for services — — — 41,760,368 Other 62,972 — 62,972 1,506,639 TOTALOPERATING REVENUES 54,373,800 6,580,979 60,954,779 43,267,007 OPERATING EXPENSES Personal Services 22,910,993 1,850,425 24,761,418 6,148,053 Operating Expenses 25,884,335 1,693,306 27,577,641 26,751,350 TOTALOPERATING EXPENSES 48,795,328 3,543,731 52,339,059 32,899,403 Operating income before depreciation 5,578,472 3,037,248 8,615,720 10,367,604 Depreciation and amortization 13,113,805 392,715 13,506,520 2,776,556 Operating income (loss) (7,535,333) 2,644,533 (4,890,800) 7,591,048 NONOPERATING REVENUES (EXPENSES) Investment Income 3,408,241 575,640 3,983,881 2,162,281 Interest expense (2,308,572) (190,202) (2,498,774) (45,934) TOTALNONOPERATING REVENUES (EXPENSES) 1,099,669 385,438 1,485,107 2,116,347 Income (loss) before capital contributions and transfers (6,435,664) 3,029,971 (3,405,693) 9,707,395 Capital contributions 1,812,083 — 1,812,083 — Change in net position (4,623,581) 3,029,971 (1,593,610) 9,707,395 Net position, beginning 299,281,712 15,906,714 315,188,426 37,151,164 Net position, ending $ 294,658,131 $ 18,936,685 $ 313,594,816 $ 46,858,559
OF REVENUES, EXPENDITURES AND CHANGES IN FUND NET POSITION PROPRIETARY
FUNDS
See notes to basic financial statements. 28
CITY
MIRAMAR,
FISCAL YEAR ENDED SEPTEMBER 30, 2023
Business-TypeActivities - Enterprise Funds Governmental Activities Major Funds Nonmajor Enterprise Funds Total Internal Service Funds Utility Fund
Cash received from customers $ 54,311,864 $ 6,557,186 $ 60,869,050
42,842,035 Cash paid to suppliers
(992,884) (25,933,734)
Cash paid to employees (22,270,031) (1,884,299) (24,154,330) (6,000,407) Net cash provided by operating activities 7,100,983 3,680,003 10,780,986 8,476,651
Acquisition
construction of capital assets
Issuance of debt — 24,283 24,283 — Principal paid on long-term debt (3,391,397) (994,363) (4,385,760) (779,823) Interest paid on long-term debt (2,621,700) (189,141) (2,810,841) (45,934) Net
(12,733,837) (28,164,276) (2,236,128) Cash flows from investing activities: Investment income 3,408,241 575,640 3,983,881 2,162,281 Net cash provided by investing activities 3,408,241 575,640 3,983,881 2,162,281 Net increase (decrease) in pooled cash and cash equivalents (4,921,216) (8,478,194) (13,399,409) 8,402,804 Pooled cash and cash equivalents, beginning 87,936,541 12,114,408 100,050,949 45,182,705 Pooled cash and cash equivalents, ending $ 83,015,325 $ 3,636,215 $ 86,651,540 $ 53,585,509 Pooled cash and cash equivalents per statement of net position: Unrestricted $ 63,528,275 $ 3,369,017 $ 66,897,292 $ 53,497,935 Restricted (current and noncurrent) 19,487,050 267,198 19,754,248 87,574 Net pooled cash and cash equivalents per statement of net position $ 83,015,325 $ 3,636,215 $ 86,651,540 $ 53,585,509
Cash flows from operating activities:
$
(24,940,850)
(28,364,977)
Cash flows from capital and related financing activities:
and
(9,417,342) (11,574,616) (20,991,958) (1,410,371)
cash used in capital and related financing activities (15,430,439)
OF
FLORIDA STATEMENT OF CASH FLOWS
PROPRIETARY FUNDS
See notes to basic financial statements. 29
CITY OF MIRAMAR, FLORIDA STATEMENT OF CASH FLOWS (CONTINUED) PROPRIETARY FUNDS
FISCAL YEAR ENDED SEPTEMBER 30, 2023
Reconciliation of operating income (loss) to net cash provided by operating activities:
Adjustments to reconcile operating income (loss) to net cash provided by (used in) operating activities:
Changes in operating assets and liabilities:
decrease in inventories
decrease in prepaid items
in unearned revenue
Business-TypeActivities - Enterprise Funds Governmental Activities Major Funds Nonmajor Enterprise Funds Total Internal Service Funds Utility Fund
Operating income
$ (7,535,333) $ 2,644,533 $ (4,890,800) $ 7,591,048
(loss)
Depreciation 13,113,805 392,715 13,506,520 2,776,556
(344,331) (23,791) (368,122) (424,971)
— — — (62,343)
— — — (642,438)
other funds 282,397 — 282,397 —
resources (4,523,675) (349,887) (4,873,562) (1,097,610) Increase (decrease) in accounts payable 847,123 590,324 14,374,447 25,337 Increase
— — — — Increase
974,773 110,096 1,084,869 — Increase (decrease) in due to other governments 4,059 — 4,059 — Increase (decrease) in liabilities payable from restricted assets 92,301 — 92,301 — Increase
self-insured losses — — — (12,233) Increase (decrease) in obligations under leases — — — (921,949) Increase (decrease)
compensated absences (584,514) (53,267) (637,781) 190,201 Increase
in other post-employment benefits obligation (1,771,234) (136,996) (1,908,230) (533,151) Increase (decrease) in net pension liability 10,426,809 806,470 11,233,279 1,631,871 Increase
resources (3,881,197) (300,194) (4,181,391) (43,665) Net cash provided by operating activities $ 7,100,983 $ 3,680,003 $ 10,780,986 $ 8,476,651
Contributions of capital assets from developers $
$ — $
Amortization
—
Interest
635,698 18,151
(Increase) decrease in accounts receivable
(Increase)
(Increase)
(Increase) decrease in advance to
(Increase) decrease in deferred outflows of
(decrease)
(decrease) in accrued liabilities
(decrease) in
in
(decrease)
(decrease) in deferred inflows of
Noncash investing, capital and financing activities:
1,812,083
1,812,083
premium (313,128)
(313,128)
on SRF loan
653,849
See notes to basic financial statements. 30
CITY OF MIRAMAR, FLORIDA
Pension and OPEBTrust Funds ASSETS Cash and cash equivalents $ 8,399,740 Investments: Certificates of deposit 972,172 Money market funds 26,350,119 U.S. Government securities 34,421,885 Corporate bonds 24,291,964 Bond fund 8,129,582 Equity securities 415,883,784 Collateralized mortgage obligations 21,464,758 Asset backed securities 3,015,885 Mutual funds 12,371,850 Real estate funds 83,257,207 Fixed income international funds 1,427,498 Commingled funds 5,362,494 Alternative investments 64,089,899 Receivables: Due from broker 30,395 Prepaid items 15,722 Accrued interest and dividend receivable 1,114,054 TOTALASSETS 710,599,008 LIABILITIES Accounts payable 657,341 TOTALLIABILITIES 657,341 NETPOSITION Net position restricted for pension benefits $ 709,941,667
OF NET POSITION FIDUCIARY FUNDS
See notes to basic financial statements. 31
STATEMENT
SEPTEMBER 30, 2023
OF MIRAMAR, FLORIDA
Pension and OPEBTrust Funds
Contributions: City $ 28,691,634 Employees 11,133,670 State of Florida 3,649,262 Permissive service credit 207,429 Section 457 Plan rollovers 1,866,120 Total contributions 45,548,115 Interest and dividends 15,729,463 Net appreciation in fair value of investments 43,940,593 Less investment expenses (4,863,399) Net investment income 54,806,657 Other income 21,112 Total additions 100,375,884 DEDUCTIONS Pension benefits 32,009,720 Refund of employee contributions 4,538,290 Administrative expenses 810,746 Total deductions 37,358,756 Change in net position 63,017,128 Net position restricted for pension benefits: Beginning of year 646,924,539 End of year $ 709,941,667
STATEMENT OF CHANGES IN FIDUCIARY NET POSITION FISCAL YEAR ENDED SEPTEMBER
2023 See notes to basic financial statements. 32
ADDITIONS
CITY
30,
NOTES TO BASIC FINANCIAL STATEMENTS
NOTE 1. SUMMARY OF SIGNIFICANT ACCOUNTING POLICIES
The City of Miramar (the “City”) was incorporated in 1955. It is located in the southwestern portion of Broward County, Florida, comprises approximately 31 square miles of land, and has a population of approximately 138,000 residents. The City operates under a Commission-Manager form of government and provides the following services as authorized by its Charter: general government, public safety, physical environment, transportation, community services, economic environment, parks and recreation, and cultural arts. The City also operates water, wastewater, sanitation, and stormwater enterprise funds.
The financial statements of the City have been prepared in conformity with generally accepted accounting principles (GAAP) as applied to governmental units. The Governmental Accounting Standards Board (GASB) is the accepted standard-setting body for establishing governmental accounting and financial reporting principles.
The City’s significant accounting policies are described below.
A. Financial Reporting Entity
The accounting policies of the City conform to accounting principles generally accepted in the United States of America (GAAP). The financial statements were prepared in accordance with government accounting standards, which establish standards for defining and reporting on the financial reporting entity. The definition of the financial reporting entity is based upon the concept that elected officials are accountable to their constituents for their actions. One of the objectives of financial reporting is to provide users of financial statements with a basis for assessing the accountability of the elected officials. The financial reporting entity consists of the City, organizations for which the City is financially accountable and other organizations for which the nature and significance of their relationship with the City are such that exclusion would cause the City’s financial statements to be misleading or incomplete. The City is financially accountable for a component unit if it appoints a voting majority of the organization’s governing board and it is able to impose its will on that organization or there is a potential for the organization to provide specific financial benefits to, or impose specific financial burdens on, the City. Based upon the application of these criteria, there were no organizations that met the criteria described above.
B. Government-wide and Fund Financial Statements
The government-wide financial statements (i.e., the statement of net position and the statement of activities) report information on all of the non-fiduciary activities of the City. Governmental activities, which normally are supported by charges for services, taxes and intergovernmental revenues, are reported separately from business-type activities, which rely to a significant extent on user fees and charges for support.
The statement of activities demonstrates the degree to which the direct expenses of a given function or segment is offset by program revenues. Direct expenses are those that are clearly identifiable with a specific function or segment. Program revenues include: 1) charges to customers or applicants who purchase, use, or directly benefit from goods, services, or privileges provided by a given function or segment and 2) grants and contributions that are restricted to meeting the operational or capital requirements of a particular function or segment. Taxes and other items not properly included among program revenues are reported instead as general revenues. C
NOTES TO BASIC FINANCIAL STATEMENTS SEPTEMBER
33
ITY OF MIRAMAR, FLORIDA
30, 2023
CITY OF MIRAMAR, FLORIDA
NOTES TO BASIC FINANCIAL STATEMENTS
SEPTEMBER 30, 2023
NOTE 1. SUMMARY OF SIGNIFICANT ACCOUNTING POLICIES (CONTINUED)
B. Government-wide and Fund Financial Statements (Continued)
Separate financial statements are provided for governmental funds, proprietary funds, and fiduciary funds, even though the latter are excluded from the government-wide financial statements. Major individual governmental funds and major individual enterprise funds are reported as separate columns in the fund financial statements. All remaining non-major governmental funds or enterprise funds are aggregated and reported as other governmental or other proprietary funds.
C. Measurement Focus, Basis of Accounting, and Financial Statement Presentation
The government-wide financial statements are reported using the economic resources measurement focus and the accrual basis of accounting, as are the proprietary fund and fiduciary fund financial statements. Revenues are recorded when earned and expenses are recorded when a liability is incurred, regardless of the timing of the related cash flows. Property taxes are recognized as revenues in the year for which they are levied. Grants and similar items are recognized as revenue as soon as all eligibility requirements imposed by the provider have been met.
Governmental fund financial statements are reported using the current financial resources measurement focus and the modified accrual basis of accounting. Revenues are recognized as soon as they are both measurable and available. Revenues are considered to be available when they are collectible within the current period or soon enough thereafter to pay liabilities of the current period. For this purpose, the City considers all revenues except grant revenues to be available if they are collected within 60 days of the end of the current fiscal period. Grant revenues are considered available if collected within six months of the end of the current fiscal period. Expenditures generally are recorded when a liability is incurred, as under accrual accounting. However, debt service expenditures, as well as expenditures related to compensated absences, pension costs, other post-employment benefits, and claims and judgments, are recorded only when payment is due.
Property taxes, franchise taxes, licenses, and interest associated with the current fiscal period are all considered to be susceptible to accrual and so have been recognized as revenues of the current fiscal period. Only the portion of special assessments receivable due within the current fiscal period is considered to be susceptible to accrual as revenue of the current period. All other revenue items are considered to be measurable and available only when cash is received by the government.
The City reports the following major governmental funds:
General Fund
The City’s primary operating fund. It accounts for all financial resources of the general government, except those required to be accounted for in another fund.
The City reports the following major proprietary funds:
Utility Fund
This fund is used to account for operations that are financed and operated in a manner similar to a commercial enterprise, where the intent of the governing body is that the costs of providing goods or services to the general public on a continuing basis be financed or recovered primarily through user charges, or where the governing body has decided that periodic determination of the revenue earned, expenses incurred, and/or net income is appropriate for capital maintenance, public policy, management control, accountability, or other purposes. The City accounts for the operations of providing water, wastewater and sanitation services in its enterprise fund.
34
CITY OF MIRAMAR, FLORIDA NOTES TO BASIC FINANCIAL STATEMENTS
SEPTEMBER 30, 2023
NOTE 1. SUMMARY OF SIGNIFICANT ACCOUNTING POLICIES (CONTINUED)
C. Measurement Focus, Basis of Accounting, and Financial Statement Presentation
(Continued)
Stormwater Fund
This fund is used to account for the operations of providing stormwater services to City residents and businesses.
Additionally, the City reports the following fund types:
Internal Service Funds
These funds are used to account for the financing of self-insurance activities, fleet maintenance services, and management information system services provided to other funds of the City on a cost reimbursement basis.
Pension Trust Funds and Other PostEmployment (OPEB) Trust Fund
The Pension Trust Funds account for the activities of the retirement plans for General and Management, Police Officers, and Firefighter employees, which accumulate resources for pension benefits to those qualified employees. The OPEB Trust Fund accounts for activities related to the City’s retiree health and life insurance benefits.
As a general rule, the effect of interfund activity has been eliminated from the government-wide financial statements. Exceptions to this general rule are payments-in-lieu of taxes and other charges between the City’s utilities function and various other functions of the City. Elimination of these charges would distort the direct costs and program revenues reported for the various functions concerned.
Amounts reported as program revenues include: 1) charges to customers or applicants for goods, services, or privileges provided, 2) operating grants and contributions, and 3) capital grants and contributions, including special assessments. Internally dedicated resources are reported as general revenues rather than as program revenues. Likewise, general revenues include all taxes, whose purpose has not been restricted to a specific program.
Proprietary funds distinguish operating revenues and expenses from non-operating items. Operating revenues and expenses generally result from providing services and producing and delivering goods in connection with a proprietary fund’s principal ongoing operations. The principal operating revenues of the City’s enterprise funds and internal service funds are charges to customers for sales and services.
Operating expenses for the enterprise funds and internal service funds include the cost of sales and services, administrative expenses, and depreciation on capital assets. All revenues and expenses not meeting this definition are reported as non-operating revenues and expenses.
When both restricted and unrestricted resources are available for use, it is the City’s policy to use restricted resources first, then unrestricted resources as they are needed. Unrestricted resources include committed, assigned and unassigned amounts which are available and can be used for the intended purpose. When unrestricted resources are available for use, it is the City’s policy to use committed resources first, then assigned, and then unassigned as they are needed.
35
CITY OF MIRAMAR, FLORIDA
NOTE 1. SUMMARY OF SIGNIFICANT ACCOUNTING POLICIES
D. Assets, Deferred Outflows of Resources, Liabilities, Deferred Inflows of Resources and Net Position or Fund Balance
1. Deposits and Investments - The City maintains a pooled cash and investment system that is available for use by all funds to facilitate the investment process. Each fund’s portion of pooled cash and investments are included on the statement of net position and balance sheets as “Pooled cash and cash equivalents”. Interest earnings are allocated to each fund based upon their average proportionate equity. In addition, investments are separately held by the pension and OPEB trust funds. The City’s cash and cash equivalents include cash on hand, pooled cash, demand deposits, a money market mutual fund, investments in the SBA Florida Prime and FL PALM and FL STAR and FL CLASS local government investment pools and short-term investments with original maturities of three months or less from the date of acquisition. The Pension Plans’ have established a framework to consistently measure the Plan’s assets and liabilities in accordance with applicable accounting, legal, and regulatory guidance.
Investments are recorded at fair value, which is the price that would be received to sell an asset or paid to transfer a liability in an orderly transaction between market participants at the measurement date. Certain investments are recorded at net asset value (NAV) per share. This method of determining fair value uses member units to which a proportionate share of net assets is attributed. The City’s investments in the Florida Prime and FL PALM and FL STAR and FL CLASS local government investment pools are recorded at amortized cost.
Alternative investments: The Pension Plans have investments in various real estate funds. The funds are valued using their respective net asset value (NAV) as of September 30, 2023. The most significant input into the NAV of such funds is the fair value of the investment holdings. These holdings are valued by the general partners on a quarterly or semi-annual basis, in conjunction with management and investment advisors.
Investments are categorized according to the fair value hierarchy established by GASB Statement No. 72, Fair Value Measurement and Application, which requires the City to use valuation techniques which are appropriate under the circumstances and are either a market approach, a cost approach, or income approach. The Statement establishes a hierarchy of inputs used to measure fair value consisting of three levels. Level 1 inputs are quoted prices in active markets for identical assets or liabilities. Level 2 inputs are inputs, other than quoted prices included within Level 1 that are observable for the asset or liability, either directly or indirectly. Level 3 inputs are unobservable inputs, and typically reflect management’s estimates of assumptions that market participants would use in pricing the asset or liability. The Statement also contains note disclosure requirements regarding the hierarchy of valuation inputs and valuation techniques that was used for the fair value measurements.
Unrealized gains and losses are presented as net appreciation (depreciation) in fair value of investments on the statement along with the gains and losses realized on the sales of investments. Purchases and sales of investments are recorded on a trade-date basis.
(CONTINUED)
36
NOTES TO BASIC FINANCIAL STATEMENTS SEPTEMBER 30, 2023
MIRAMAR, FLORIDA
D. Assets, Deferred Outflows of Resources, Liabilities, Deferred Inflows of Resources and Net Position or Fund Balance (Continued)
2. Interfund Receivables, Payables, and Transfers - Activities between funds that are representative of lending/borrowing arrangements outstanding at the end of the fiscal year are referred to as either “due to/from other funds” (i.e. the current portion of interfund loans) or “advances to/from other funds” (i.e. the non current portion of interfund loans). Any residual balances outstanding between the governmental activities and business-type activities are reported in the government-wide financial statements as “internal balances”.
3. Receivables - Special assessments are levied against benefited properties for the cost or a portion of the cost of special assessment improvement projects in accordance with State Statutes. These assessments are collectible by the City over a term of years usually consistent with the term of the related bond issue. Broward County handles the collection of annual installments (including interest) in the same manner as property taxes. Property owners are allowed to (and often do) prepay future installments without interest or prepayment penalties. Once a special assessment roll is adopted, the amount attributed to each parcel is a lien upon that property until full payment is made.
All trade and other receivables are shown net of an allowance for uncollectables. Long-term receivables are analyzed for their collectability based on the terms and conditions of the agreements. In addition to those receivables specifically identified as uncollectable based on management’s assessment of individual creditors’ ability to pay, a general allowance is calculated based on the City’s historic bad debt experience to ensure all receivables are recorded at their net realizable value.
Water and wastewater charges to customers are based on actual water consumption. The City recognizes revenue and a related receivable for the estimated unbilled consumption as of September 30th of each year.
4. Inventories - Inventories consisting of fuel and oil are recorded at cost, using the first-in, first-out method. The initial cost is recorded as an asset at the time the individual inventory items are purchased and are charged against operations in the period when used (i.e., the consumption method).
5. Prepaid Items - Certain payments to vendors reflect costs applicable to future accounting periods and are recorded as prepaid items in both government-wide and fund financial statements. The cost of prepaid items is recorded as expenditure/expense when consumed (i.e. the consumption method), rather than when purchased in both the governmental and proprietary funds.
6. Capital Assets - Capital assets, which include property, plant, equipment, intangibles and certain infrastructure assets (e.g., roads, bridges, sidewalks, and similar items), are reported in the applicable governmental or business-type activities columns in the government-wide financial statements. Capital assets are defined by the City as assets with an initial, individual cost of more than $5,000 for all capital assets other than intangibles, which are $15,000 for software, right to use leased assets and subscription based information technology arrangements (SBITA), and $25,000 for easements, and an estimated useful life in excess of one year. Capital assets are recorded at historical cost or estimated historical cost if purchased or constructed. Donated capital assets are recorded at acquisition cost at the date of donation.
NOTE 1. SUMMARY OF SIGNIFICANT ACCOUNTING POLICIES (CONTINUED)
37
CITY OF
NOTES TO BASIC FINANCIAL STATEMENTS SEPTEMBER 30, 2023
CITY OF MIRAMAR, FLORIDA
NOTES TO BASIC FINANCIAL STATEMENTS
SEPTEMBER 30, 2023
D. Assets, Deferred Outflows of Resources, Liabilities, Deferred Inflows of Resources and Net Position or Fund Balance (Continued)
6. Capital Assets (Continued) - The costs of normal maintenance and repairs that do not add to the value of the asset or materially extend assets lives are not capitalized. Major outlays for capital assets and improvements are capitalized as they are completed. Interest costs incurred before the end of the construction period for capital projects of business-type activities are being expensed in the period in which the cost is incurred. This is in accordance with GASB Statement No. 89, Accounting for Interest Cost Incurred before the End of a Construction Period
Capital assets are depreciated using the straight line method over the following estimated useful lives:
7. Leases - The City is a lessee for noncancellable leases of vehicles, equipment, building space, and parking spaces. The City recognizes a lease liability and an intangible right-to-use lease asset (lease asset) in the government-wide financial statements. The City recognizes lease assets and liabilities with an initial value of $15,000 or more.
At the commencement of a lease, the City initially measures the lease liability at the present value of payments expected to be made during the lease term. Subsequently, the lease liability is reduced by the principal portion of lease payments made. The lease asset is initially measured as the initial amount of the lease liability, adjusted for lease payments made at or before the lease commencement date, plus certain initial direct costs. Subsequently, the lease asset is amortized on a straight-line basis over its useful life.
Key estimates and judgments related to leases include how the City determines (1) the discount rate it uses to discount the expected lease payments to present value, (2) lease term, and (3) lease payments.
• The City uses the interest rate charged by the lessor as the discount rate. When the interest rate charged by the lessor is not provided, the City generally uses its estimated incremental borrowing rate as the discount rate for leases.
• The lease term includes the noncancellable period of the lease. Lease payments included in the measurement of the lease liability are composed of fixed payments and purchase option price that the City is reasonably certain to exercise.
NOTE 1. SUMMARY OF SIGNIFICANT ACCOUNTING POLICIES (CONTINUED)
Asset Estimated Useful Lives (Years) Buildings 50 Improvements other than buildings 20 Machinery & equipment 3 – 20 Fleet 8 Intangibles 15 – 25 Infrastructure 16 – 70 Right-to-use leased assets 2 – 30 Right-to-use SBITAs 2 – 5
38
CITY OF MIRAMAR, FLORIDA
NOTES TO BASIC FINANCIAL STATEMENTS SEPTEMBER 30, 2023
NOTE 1. SUMMARY OF SIGNIFICANT ACCOUNTING POLICIES (CONTINUED)
D. Assets, Deferred Outflows of Resources, Liabilities, Deferred Inflows of Resources and Net Position or Fund Balance (Continued)
7. Leases (Continued) - The City monitors changes in circumstances that would require a remeasurement of its lease and will remeasure the lease asset and liability if certain changes occur that are expected to significantly affect the amount of the lease liability.
Lease assets are reported with other capital assets and lease liabilities are reported with long-term debt on the statement of net position.
The City is a lessor for noncancellable leases of land, cellular towers, and building space. The City recognizes a lease receivable and a deferred inflow of resources in the government-wide and governmental fund financial statements.
At the commencement of a lease, the City initially measures the lease receivable at the present value of payments expected to be received during the lease term. Subsequently, the lease receivable is reduced by the principal portion of lease payments received. The deferred inflow of resources is initially measured as the initial amount of the lease receivable, adjusted for lease payments received at or before the lease commencement date. Subsequently, the deferred inflow of resources is recognized as revenue over the life of the lease term.
Key estimates and judgments include how the City determines the discount rate it uses to discount the expected lease receipts to present value, lease term, and lease receipts.
• The City uses its estimated incremental borrowing rate as the discount rate for leases.
• The lease term includes the noncancellable period of the lease. Lease receipts included in the measurement of the lease receivable is composed of fixed payments from the lessee.
The City monitors changes in circumstances that would require a remeasurement of its lease and will remeasure the lease receivable and deferred inflows of resources if certain changes occur that are expected to significantly affect the amount of the lease receivable.
8. SBITAs - The City has recorded subscription-based information technology arrangement (SBITA) assets and liabilities as a result of implementing GASB Statement No. 96. The SBITA assets are initially measured at an amount equal to the initial measurement of the related SBITA liability plus any SBITA payments made prior to the subscription term, less SBITA incentives, plus any ancillary charges necessary to place the SBITA into service. The SBITA assets are amortized on a straightline basis over the life of the related contract. The costs of normal maintenance and repairs that do not add to the values of the assets or materially extend the asset lives are not capitalized and are expensed as incurred. The City monitors changes in circumstances that would require a remeasurement of its SBITAs and will do so if certain changes occur that would be expected to significantly affect the amount of the lease liability. SBITA assets are reported with other capital assets and SBITA lease liabilities are reported with long-term debt on the statement of net position.
9. Deferred outflows/inflows of resources - In addition to assets, the Statement of Net Position will sometimes include a separate section for deferred outflows of resources. This represents the usage of net position applicable to future periods and will be recognized as expenditures in the future period to which it applies. The City currently reports a deferred loss on refunding of debt and deferred outflows related to pensions and other post employment benefits (OPEB) in this category.
39
CITY OF MIRAMAR, FLORIDA
D. Assets, Deferred Outflows of Resources, Liabilities, Deferred Inflows of Resources and Net Position or Fund Balance (Continued)
9. Deferred outflows/inflows of resources (Continued) - Deferred outflows on pensions arise from differences between projected and actual earnings on pension plan investments and are amortized to pension expense using a systematic and rational method over a closed five-year period. Deferred outflows on pensions and other post employment benefits (OPEB) also include the difference between expected and actual experience with regard to economic, or demographic factors; changes of assumptions about future economic, demographic, or other factors or changes in the City’s proportionate share of the net pension and OPEB liability. Employer contributions made subsequent to the measurement date are also deferred and reduce the net pension and OPEB liabilities in the subsequent year.
In addition to liabilities, the Statement of Net Position will sometimes report a separate section for deferred inflows of resources. This represents an acquisition of net assets that applies to future periods and will be recognized as revenue in the future period to which it applies. The City currently reports deferred inflows of resources related to revenues received in advance, deferred gain on refunding of debt, certain leases and deferred inflows related to pensions and OPEB in this category.
Deferred inflows on pensions are recorded when investment return on pension plan assets exceeds actuarial assumptions and are amortized using a systematic and rational method over a closed fiveyear period. Deferred inflows on pensions and other postemployment benefits (OPEB) also include the difference between expected and actual experience with regard to economic, or demographic factors; changes of assumptions about future economic, demographic, or other factors or changes in the City’s proportionate share of net pension and OPEB liabilities.
Deferred inflows related to revenues received in advance consists primarily of local business taxes and fire inspection and permit fees.
The deferred charge on refunding is the difference between the net carrying value of refunded debt and its re-acquisition price. This amount is recorded as a deferred inflow or outflow and amortized over the shorter of the life of the refunded or the refunding debt.
10. Unearned Revenues - Unearned revenue represents grants and similar items received in advance for which the City has not met all eligibility requirements imposed by the provider to allow for revenue recognition.
11. Compensated Absences - The City’s policy is to permit employees to accumulate earned but unused sick and vacation pay benefits, limited to certain maximums, based on length of service. For certain employees, the City also grants compensatory time. All vacation, sick and compensatory pay is accrued when incurred in the government-wide and proprietary fund financial statements. A liability for these amounts is reported in governmental funds only if they have matured, for example, as a result of employee resignations and retirements. For the governmental funds, compensated absences are liquidated by the General Fund.
NOTE 1. SUMMARY OF SIGNIFICANT ACCOUNTING POLICIES (CONTINUED)
BASIC
40
NOTES TO
FINANCIAL STATEMENTS SEPTEMBER 30, 2023
CITY OF MIRAMAR, FLORIDA
NOTE
D. Assets, Deferred Outflows of Resources, Liabilities, Deferred Inflows of Resources and Net Position or Fund Balance (Continued)
12. Long-Term Obligations - In the government-wide financial statements, and the proprietary fund types in the fund financial statements, long-term debt and other long-term obligations are reported as liabilities in the applicable governmental activities, business-type activities, or proprietary fund type statement of net position. Bonds payable are reported net of the applicable premium or discounts. Bond premiums, discounts, as well as deferred refunding amounts are amortized over the life of the bonds using the straight line method, which does not result in a material difference from the effective interest method. Issuance costs are expensed in the year of issuance.
In the fund financial statements, governmental fund types recognize bond premiums and discounts, as well as bond issuance costs, during the current period. The face amount of debt issued is reported as other financing sources. Premiums received on debt issuances are reported as other financing sources, while discounts on debt issuances are reported as other financing uses. Issuance costs, whether or not withheld from the actual debt proceeds received, are reported as debt service expenditures. Payments of principal and interest are also reported as expenditures.
13. Capital Contributions - Contributions from private developers representing “water and wastewater impact fees” for the future acquisition or expansion of capital improvements of City operated water and wastewater systems are recorded as capital contributions in the enterprise funds. Also recorded as capital contributions are special assessments for the construction of utility facilities and capital assets transferred from governmental funds/activities to an enterprise fund.
14. Net Position - Net position (deficit) is the result of assets and deferred outflows of resources, less liabilities and deferred inflows of resources. Net position of the government-wide activities and proprietary funds are categorized as net investment in capital assets, restricted and unrestricted. Net investment in capital assets is that portion of net position that relates to the City’s capital assets reduced by accumulated depreciation and by any outstanding debt incurred to acquire, construct or improve those assets, excluding related unexpended debt proceeds. Deferred inflow/outflow of resources attributable to the acquisition, construction, or improvement of those assets or related debt are included in this component of net position. Restricted net position is that portion of net position that has been restricted for general use by external parties (creditors, grantors, contributors, or laws or regulations of other governments) or imposed by law through constitutional provisions or enabling legislation. Unrestricted net position consists of all net position that does not meet the definition of either of the other two components.
15. Nature and Purpose of Fund Balance - In the fund financial statements, governmental funds report fund classifications that comprise a hierarchy based primarily on the extent to which the City is bound to honor constraints on the specific purposes for which amounts in those funds can be spent. Amounts that are restricted to specific purposes either by: a) constraints placed on the use of resources by creditors, grantors, contributors, or laws or regulations of other governments or b) imposed by law through constitutional provisions or enabling legislation are classified as restricted fund balances. Amounts that can only be used for specific purposes pursuant to constraints imposed by the City Commission through an ordinance or resolution, equally binding, are classified as committed fund balances. An ordinance or resolution approved by a majority vote of the City Commission is required to remove the constraint. Amounts that are constrained by the City’s intent to be used for specific purposes but are neither restricted nor committed are classified as assigned fund balances. Assignments are made by the City Manager based on Commission direction.
1. SUMMARY OF SIGNIFICANT ACCOUNTING POLICIES (CONTINUED)
BASIC
SEPTEMBER
41
NOTES TO
FINANCIAL STATEMENTS
30, 2023
CITY OF MIRAMAR, FLORIDA
D. Assets, Deferred Outflows of Resources, Liabilities, Deferred Inflows of Resources and Net Position or Fund Balance (Continued)
15. Nature and Purpose of Fund Balance (Continued) - Non spendable fund balances include amounts that cannot be spent because they are either: (a) not spendable in form or (b) legally or contractually required to be maintained intact. Unassigned fund balance represents fund balance that has not been assigned to other funds and that has not been restricted, committed, or assigned to specific purposes within the General Fund. In other funds, the unassigned classification should be used only to report a deficit balance resulting from overspending for specific purposes for which amounts had been restricted, committed or assigned.
The City Commission adopted Resolution No. 14-74 creating a committed fund balance designated as a Financial Stabilization Account equal to 12% of the General Fund’s final amended budgeted expenditures. The City’s policy is to maintain an adequate General Fund balance to provide a “rainy day” fund for use in unforeseen, unbudgeted emergency situations such as sustained declines in real estate values of more than 10% and/or property tax collections that decline by more than 5%; 1.5% decline in revenues or 1.5% increase in spending requirements imposed by the state or federal government or vital to maintaining day to day operations of the City (e.g. fuel, electricity); unreimbursable natural disaster expenditures or emergency infrastructure failures costing greater than $1,500,000; or unforeseen litigation and related legal fees in excess of $1,000,000. Stabilization funds may be used when the City Commission or City Manager recognizes a need to utilize the funds. If established by the City Manager, the specific need must be reported to the City Commission at their next meeting. A budget amendment must be approved by the City Commission authorizing use of the stabilization funds. When such a need is recognized as part of the budget process, the need and amount will be documented as part of that process and adopted as part of the budget. Should the balance drop below the targeted level of 12% of General Fund final budgeted expenditures, the City will develop a plan to replenish the account to the minimum level from net revenue surpluses in subsequent fiscal years until the balance is restored to the minimum level.
16. Use of Estimates - The financial statements and related disclosures are prepared in conformity with accounting principles generally accepted in the United States of America. Management is required to make estimates and assumptions that affect the reported amounts of assets and deferred outflows of resources and liabilities and deferred inflows of resources, the disclosure of contingent assets/deferred outflows and liabilities/deferred inflows at the date of the financial statements and revenue and expenditures/expenses during the period reported. These estimates include assessing the collectability of accounts receivable, the use and recoverability of inventory, self-insurance liability, pension liabilities and other post-employment benefit obligations, and useful lives and impairment of tangible assets, among others. Actual results could differ from these estimates.
17. Employee Benefit Plans, Pensions - The City provides separate defined benefit pension plans for general and management employees, police department personnel, and fire department personnel. The City provides retirement benefits to elected officials through the Florida Retirement System (FRS and HIS).
The City also offers an optional deferred compensation plan created in accordance with Internal Revenue Code Section 457. In 2001, the City established the Excess Benefit Plan, a qualified governmental excess benefit arrangement as defined in Section 415 (m) (3) of the Internal Revenue Code.
NOTE 1. SUMMARY OF SIGNIFICANT ACCOUNTING POLICIES (CONTINUED)
NOTES
BASIC FINANCIAL
42
TO
STATEMENTS SEPTEMBER 30, 2023
NOTES
CITY OF MIRAMAR, FLORIDA
D. Assets, Deferred Outflows of Resources, Liabilities, Deferred Inflows of Resources and Net Position or Fund Balance (Continued)
17. Employee Benefit Plans, Pensions (Continued) - For the purposes of measuring the net pension liability, deferred outflows of resources and deferred inflows of resources related to pensions, and pension expense, information about the fiduciary net position of the City’s Consolidated Retirement Plan and Trust, Police Officers’ Retirement Plan and the Firefighters’ Retirement Plan (the Plans) and additions to/deductions from the Plans’ fiduciary net position have been determined on the same basis as they are reported by the Plans. Benefit payments (including refunds of employee contributions) are recognized when due and payable in accordance with benefit terms.
For purposes of measuring the City’s proportionate share of the net pension liability, deferred outflows of resources related to pensions, deferred inflows of resources related to pensions, and pension expense, information about the fiduciary net position of the Florida Retirement System Pension Plan (FRS) and the Health Insurance Subsidy (HIS) Plan and additions to/deductions from the Plan’s fiduciary net position have been determined on the same basis as they are reported by the Florida Retirement System (FRS) and HIS plans.
18. Post-Employment Benefits Other than Pensions (OPEB) – The City of Miramar sponsors an OPEB Plan that provides Other Post-Employment Benefits (OPEB) for its eligible retirees and their dependents. The City of Miramar Plan is a single employer defined benefit OPEB plan that includes a separate trust fund. The Plan provides health-related and life insurance coverage through different insurance arrangements that also cover active employees and their dependents. In August 2019, the City Commission adopted Resolution No. 19-159 establishing an irrevocable OPEB trust to accumulate the assets necessary to fund the OPEB liability and to pay future benefits. Additional information regarding the City’s OPEB liability can be found in Note 10.
19. Risk Management - The City is exposed to various risks of loss from civil liability to other parties (automobile liability); statutory workers’ compensation benefits for injured employees; and the theft or accidental damage to City property (buildings and business contents). The City’s Insurance Fund is used to account for its risk financing activities. The Insurance Fund charges the operating funds insurance premiums. The accrued liability for estimated insurance claims represents an estimate of the ultimate cost of settling claims arising prior to year-end, including claims incurred but not yet reported. The Insurance Fund pays for all claims and judgments made against the City for accidental losses for which the City is self-insured and the premium costs for insurance policies to protect the City’s property.
Effective January 2021, the City became self-insured for employee group health benefits and has purchased stop-loss coverage for the combined group medical and pharmacy plan with a specific deductible of $250,000 per individual. Additional information regarding the City’s self-insurance fund for both risk management activities and employee group health insurance is provided in Note 11.
20. Implementation of GASB Statement No. 96 – Effective October 1, 2022, the City implemented GASB Statement No. 96, Subscription-Based Information Technology Arrangements. This Statement establishes standards of accounting and financial reporting for SBITAs by a government end user (a government). Subscription-based information technology arrangements (SBITAs) provide governments with access to/the right-to-use vendors’ IT software and associated tangible capital assets for subscription payments without granting governments perpetual license or title to the IT software and associated tangible capital assets. The implementation of GASB No. 96 required a remeasurement of right to use SBITAs and SBITA liabilities. See Notes 6, and 8 for further information on the implementation of GASB 96,SBITAs.
NOTE 1. SUMMARY OF SIGNIFICANT ACCOUNTING POLICIES (CONTINUED)
43
TO BASIC FINANCIAL STATEMENTS SEPTEMBER 30, 2023
CITY OF MIRAMAR, FLORIDA
NOTE 2. PROPERTY TAXES
Property taxes are assessed as of January 1st each year and are first billed (levied) and due the following November 1st. Under Florida law, the assessment of all properties and the collection of all county, municipal, school board and special district property taxes are consolidated in the offices of the Broward County Property Appraiser and County Tax Collector. The laws for the State regulating tax assessments are also designed to assure a consistent property valuation method statewide. State statutes permit municipalities to levy property taxes at a rate of up to 10 mills ($10 per $1,000 of assessed taxable valuation). The millage rate assessed by the City for the year ended September 30, 2023 was 7.1172 mills.
The tax levy of the City is established by the Commission prior to October 1st of each year, and the Broward County Property Appraiser incorporates the millage into the local tax levy, which includes Broward County, Broward County School Board, and special taxing districts.
All property is reassessed according to its fair market value as of January 1st of each year. Each assessment roll is submitted to the Executive Director of the State Department of Revenue for review to determine if the rolls meet all of the appropriate requirements of State Statutes.
All real and tangible personal property taxes are due and payable on November 1st each year. Broward County mails to each property owner on the assessment roll a notice of the taxes due and Broward County also collects the taxes for the City. Taxes may be paid upon receipt of such notice from Broward County, with discounts at the rate of four percent (4%) if paid in the month of November, three percent (3%) if paid in the month of December, two percent (2%) if paid in the month of January and one percent (1%) if paid in the month of February. Taxes paid during the month of March are without discount, and all unpaid taxes on real and tangible personal property become delinquent and liens are placed on April 1st of the year following the year in which taxes were assessed. Procedures for the collection of delinquent taxes by Broward County are provided for in the Laws of Florida. Due to the immaterial amount of any additional property taxes received after the 60-day period, no additional accrual is made in the government-wide financial statements, or in the fund financial statements.
NOTE 3. DEPOSITS AND INVESTMENTS
Deposits
In addition to insurance provided by the Federal Depository Insurance Corporation, deposits are held in qualified public depositories pursuant to Florida Statutes, Chapter 280, Florida Security for Public Deposits Act. Under the Act, all qualified public depositories are required to pledge eligible collateral with the treasurer or another banking institution. In the event of a failure of a qualified public depository, the remaining public depositories would be responsible for covering any resulting losses. Accordingly, all deposits are considered insured or collateralized with securities held by the entity or its agent in the entity’s name.
Investments
The nature of investments is governed by the provisions of Florida Statutes Section 218. Under this statute, authorized investments are limited, unless otherwise authorized by law or ordinance, to the State Board of Administration (SBA) Investment Pool, local government investment pools (LGIP), money market funds, direct or unconditionally guaranteed obligations of the United States Government, obligations of certain governmental agencies, interest bearing time deposits or savings accounts.
44
NOTES TO BASIC FINANCIAL STATEMENTS SEPTEMBER 30, 2023
CITY OF MIRAMAR, FLORIDA
NOTES TO BASIC FINANCIAL STATEMENTS
SEPTEMBER 30, 2023
NOTE 3. DEPOSITS AND INVESTMENTS (CONTINUED)
Investments (Continued)
The SBA administers the Florida PRIME Fund which is governed by Chapter 19-7 of the Florida Administrative Code and Chapter 218 of the Florida Statutes. These rules provide guidance and establish the policies and general operating procedures for the administration of the Florida PRIME. The Florida PRIME is not a registrant with the Securities and Exchange Commission (SEC); however, the Board has adopted operating procedures consistent with the requirements for a 2a-7 fund, which permits money market funds to use amortized cost to maintain a constant NAV of $1 per share. The fair value of the position in the Florida PRIME is equal to the value of the pool shares. The investments in the Florida PRIME are not insured by the FDIC or any other governmental agency.
The FL PALM and FL STAR and FL CLASS are local government investment pools (LGIP) that invests exclusively in high-quality money market instruments that consist of U.S. Government obligations and repurchase agreements collateralized by U.S. Government obligations, commercial paper, corporate notes and bonds and money market mutual funds pursuant to and in accordance with the investment policies adopted under Section 218.415 Florida Statutes. These investments may have fixed floating or variable rates of interest. The funds seek current income, while preserving capital and liquidity.
The Investments in the Florida PRIME and FL PALM, and FL STAR and FL CLASS are classified as cash and cash equivalents.
City of Miramar
As of September 30, 2023, the City of Miramar had the following investments:
GASB Statement No. 72, Fair Value Measurement and Application, requires that investments be categorized according to the fair value hierarchy established by this Statement. The hierarchy is based on valuation inputs used to measure the fair value of the asset. Level 1 inputs are quoted prices in active markets for identical assets; Level 2 inputs are significant other observable inputs; Level 3 inputs are significant unobservable inputs. Domestic equity securities traded on a national securities exchange are valued at the last reported sales price on the last business day of the fiscal year. Securities traded in the over-the counter market and listed securities for which no sale was reported on that date are valued at the last reported bid price. International equities are valued based on quoted foreign market prices and translated into U.S. dollars at the exchange rate in effect at September 30, 2023. Securities which are not traded on a national securities exchange are valued by the respective fund manager or other third parties based on yields currently available on comparable securities of issuers with similar credit ratings. (Level 1). This includes common stock, domestic equities, international equities, mutual fund equities and REITS. Debt securities are valued using pricing inputs that reflect the assumptions market participants would use to price an asset or liability and are developed based on market data obtained from sources independent of the reporting entity (Level 2). This includes U.S. Treasury bonds and notes, U.S. federal agencies, mortgage backed and collateralized securities, money market funds, mutual bond funds, corporate obligations, and international bond funds.
Percentage of Investments Fair Value Ratings Maturity Distribution SBA Florida PRIME $ 67,948,555 AAAm 35 days 52.77% FL PALM 60,605,486 AAAm 43 days 28.90% FL CLASS 41,927,497 AAAm 43 days 15.70% FL STAR 15,662,216 AAAm 7 days 2.63% Total Investments $186,143,754 100.00%
45
NOTE 3. DEPOSITS AND INVESTMENTS (CONTINUED)
City of Miramar (Continued)
These securities can typically be valued using the close or last traded price on a specific date (quoted prices in active markets). When quoted prices are not available, fair value is determined based on valuation models that use inputs that include market observable inputs.
These inputs include recent trades, yields, price quotes, cash flows, maturity, credit ratings, and other assumptions based on the specifics of the investment type.
The Pension Plans have investments in alternative asset classes including various real estate funds. These investments are valued at their respective net asset value (NAV) as of September 30, 2023. The fair value of the investment in the fund is valued at the net asset value of outstanding units held at the end of the period based on the fair value of the underlying investments. These holdings are valued by the general partners on a quarterly or semi-annual basis, in conjunction with management and investment advisors.
The City of Miramar investments in the SBA Florida Prime, FL PALM, FL STAR and FL CLASS local government investment pools are recorded at amortized cost.
Interest Rate Risk - Interest rate risk is the risk that changes in market interest rates will adversely affect the fair value of an investment. Generally, the longer the maturity of an investment the greater the sensitivity of its fair value to changes in market interest rates. As a means of limiting its exposure to interest rate risk, the City diversifies its investments by security type and institution. In addition, the City’s investment policy limits the maturities to five years from the date of purchase, unless matched to a specific cash flow requirement.
Credit Risk - Credit risk is the risk that a security or a portfolio will lose some or all of its value due to a real or perceived change in the ability of the issuer to repay its debt. The risk is generally measured by the assignment of a rating by a nationally recognized statistical rating organization (NRSRO). The City’s investment policy limits investments to the highest ratings issued by an NRSRO. The ratings of the investments are shown in the previous table.
Concentration of Credit Risk - In addition to describing the credit risk of investments in the portfolio, governmental entities need to disclose the concentration of any single investment type or holding per single issuer. The policy of the City is to diversify its investment portfolio. Assets held are usually diversified to reduce the risk from over concentration. The diversification risk strategies may be reviewed periodically. The percentages of the City’s investments in the portfolio are shown in the previous table.
GASB Statement No. 40 requires disclosure when the investment percentage concentration is 5% or more for any one issuer. Given the quality and the guarantee and assurance by the U.S. Treasury on U.S. Government sponsored Agency obligations, any temporary over concentration is not viewed as a risk.
Custodial Credit Risk - Custodial credit risk is the risk that, in the event of the failure of the counterparty, the City will not be able to recover the value of its investments or collateral securities that are in the possession of an outside party. Investment securities are exposed to custodial risk if the securities are uninsured, are not registered in the name of the City and are held either by the counterparty or the counterparty’s trust department or agent but not in the City’s name. All securities are required to be deposited as an asset of the City, in the City’s name and held by a third party custodial institution chartered by the U.S. Government or the State of Florida (and restrict withdrawals only to the persons on the resolution). This reduces the risk due to the failure of the counterparty to deliver the securities purchased by or pledged by the City.
All investment transactions are conducted through delivery versus payment (DVP) basis at the third party custodian to ensure that there is independence of the entities (seller and custodian).
TO BASIC FINANCIAL STATEMENTS SEPTEMBER
46
CITY OF MIRAMAR, FLORIDA NOTES
30, 2023
FINANCIAL STATEMENTS SEPTEMBER 30, 2023
NOTE 3. DEPOSITS AND INVESTMENTS (CONTINUED)
Consolidated Retirement Plan and Trust
1. Investment Authorization - The Plan’s investment policy is determined by the Board of Trustees. The policy has been identified by the Board as having the greatest expected investment return, and the resulting positive impact on asset values, funded status, and benefits, without exceeding a prudent level of risk. The Trustees are authorized to acquire and retain every kind of investment specifically including, but not by way of limitation, bonds, debentures, and other corporate obligations, and stocks, preferred or common, which persons of prudence, discretion and intelligence acquire or retain for their own account.
Investment in all equity securities shall be limited to those listed on a major U.S. stock exchange and limited to no more than 65% (at market) of the Plan’s total asset value with no more than 5% at cost of an investment manager’s equity portfolio invested in the shares of a single corporate issuer. Investments in stocks of foreign companies shall be limited to 25% of the value of the portfolio at the time of purchase.
2. Types of Investments - Florida statutes and the Plan investment policy authorize the Trustees to invest funds in various investments. The current target allocation of these investments at market follows:
Authorized Investments
Cash and cash equivalents
Target % of Portfolio
No restrictions
3. Interest Rate Risk - Interest rate risk is the risk that changes in market interest rates will adversely affect the fair value of an investment. Generally, the longer the maturity of an investment the greater the sensitivity of its fair value to changes in market interest rates. As a means of limiting its exposure to interest rate risk, the Plan diversifies its investments by security type and institution, and limits holdings in any one type of investment with any one issuer with various durations of maturities.
Information about the sensitivity of the fair values of the Plan’s investments to market interest rate fluctuations is provided by the following table, which shows the distribution of the Plan’s investments in government securities and corporate bonds by maturity, at September 30, 2023:
Investment Maturities (in years)
Investment Type Fair Value 1 to 5 6 to 10 More than 10
Domestic equities 60% Fixed income 27% Real estate 13%
U.S.
$10,646,611
795,417
7,607,781 U.S. agencies 721,390 721,390 — — U.S. mortgage backed securities 19,378,392 1,955,456 1,345,489 16,077,447 Corporate bonds 14,094,770 5,291,017 6,308,642 2,495,111 Asset backed securities 1,887,813 1,887,813 — — Total $46,728,976 $12,099,089 $ 8,449,548 $ 26,180,339
treasuries
$ 2,243,413 $
$
BASIC
47
CITY OF MIRAMAR, FLORIDA NOTES TO
CITY OF MIRAMAR, FLORIDA
NOTES TO BASIC FINANCIAL STATEMENTS SEPTEMBER 30, 2023
NOTE 3. DEPOSITS AND INVESTMENTS (CONTINUED)
Consolidated Retirement Plan and Trust (Continued)
4. Credit Risk - Credit risk is the risk that a security or a portfolio will lose some or all of its value due to a real or perceived change in the ability of the issuer to repay its debt. This risk is generally measured by the assignment of a rating by a nationally recognized statistical rating organization. The Plan’s investment policy utilizes portfolio diversification in order to control this risk.
The following table discloses credit ratings by investment type at September 30, 2023:
Quality rating of credit risk debt securities:
*Obligations of the U.S. government or obligations explicitly guaranteed by the U.S. government are not considered to have credit risk and do not have purchase limitations.
5. Concentration of Credit Risk - The Plan limits investment in the securities, of any one issuer, other than the U.S. Government and its agencies, to no more than 5% of Plan Net Position. The Plan had no investments other than government securities that exceeded 5% of Plan Net Position at September 30, 2023.
6. Custodial Credit Risk - Custodial credit risk is the risk that, in the event of the failure of the counterparty, the Plan will not be able to recover the value of its investments or collateral securities that are in the possession of an outside party. Consistent with the Plan’s investment policy, the investments are held by Plan’s custodial bank and registered in the Plan’s name.
All of the Plan’s deposits are insured and/or collateralized by a financial institution separate from the Plan’s depository financial institution.
7. Plan Investments - GASB Statement No. 72, Fair Value Measurement and Application, requires that investments be categorized according to the fair value hierarchy established by this Statement. The hierarchy is based on valuation inputs used to measure the fair value of the asset. Level 1 inputs are quoted market prices in active markets for identical assets; Level 2 inputs are significant other observable inputs; Level 3 inputs are significant unobservable inputs.
Fair Value % of Portfolio U.S. Government guaranteed securities* $ 30,746,393 65.80%
AAA 1,740,708 3.73% AA 351,752 0.75% AA- 210,231 0.45% A+ — 0.00% A 1,696,210 3.63% A- 3,250,803 6.96% BBB+ 3,690,800 7.90% BBB 4,340,542 9.29% BBB- — 0.00% Not-rated 701,537 1.50% Total credit risk debt securities 15,982,583 34.20% Total fixed income securities $ 46,728,976 100.00%
48
NOTE 3. DEPOSITS AND INVESTMENTS (CONTINUED)
Consolidated Retirement Plan and Trust (Continued)
7. Plan Investments (Continued) - The Consolidated Retirement Plan and Trusts investments are categorized according to the GASB 72 fair value hierarchy as of September 30, 2023:
Measurements Using Quoted Prices in Active Markets for Identical Assets
Fair Value
Investments Fair Value (Level 1) (Level
Fixed income: U.S. treasuries $ 10,646,611 $ — $ 10,646,611 U.S. agencies 721,390 — 721,390 U.S. mortgage backed securities 19,378,392 — 19,378,392 Corporate bonds 14,094,770 — 14,094,770 Asset backed securities 1,887,813 — 1,887,813 Domestic equities: Equity securities 44,237,062 44,237,062 — Total Investments by fair value level 90,966,038 $ 44,237,062 $ 46,728,976 Investments measured at the NetAsset Value (NAV) Commingled SMidCap equity investment trust 87,250,004 Private equity-real estate 27,402,607 DROP mutual funds-vantage mutual funds 9,841,396 Total investments measured at Net Asset Value (NAV) 124,494,007 Total Investments $ 215,460,045 Investments measured at the NAV NAV Unfunded Commitments Redemption Frequency Redemption Notice Period Commingled SMidCap equity investment trust $ 87,250,004 $ — Daily Same Day DROP mutual funds-vantage mutual funds 9,841,396 — Daily Same Day Private equity-real estate 27,402,607 — Daily Same Day Total investments measured at Net Asset Value (NAV) $124,494,007 $ — CITY OF MIRAMAR, FLORIDA NOTES TO BASIC FINANCIAL STATEMENTS SEPTEMBER 30, 2023 49
Significant Other Observable Inputs
2)
CITY OF MIRAMAR, FLORIDA
NOTES TO
NOTE 3. DEPOSITS AND INVESTMENTS (CONTINUED)
Police Officer’s Retirement Plan
2023
1. Investment Authorization - The Plan’s investment policy is determined by the Board of Trustees. The policy has been identified by the Board as preserving the purchasing power of the Plan’s assets and earns an above average real rate of return (after inflation) over the long-term while minimizing, to a reasonable extent, the short-term volatility of results. The Trustees are authorized to acquire and retain every kind of property, real, personal or mixed, and every kind of investment specifically included, but not by way of limitation, bonds, debentures, and other corporate obligations, and stocks, preferred or common, which persons of prudence, discretion and intelligence acquire or retain for their own account.
Investment in all equity securities shall be limited to those listed on a major U.S. stock exchange and limited to no more than 75% (at market) of the Plan’s total asset value with no more than 5% at cost value of an investment manager’s equity portfolio invested in the shares of a single corporate issuer. Investments in stocks of foreign companies shall be limited to 15% of the value of the portfolio at the time of purchase. No more than 25% of the equity securities are to be invested in small or mid-cap stocks and shares of stock in those corporations whose stock has been publicly traded for less than one year are limited to 15% of the equity portfolio.
The average credit quality of the bond portfolio shall be “A” or higher and the duration of the fixed income portfolio should be less than 135% of the duration of the market index defined as the Barclays Capital U.S. Intermediate Aggregate Bond Index benchmark. The fixed income portfolio rated below “BBB” shall not exceed 20% of the entire fixed income portfolio. Real estate and absolute return investments shall not exceed 20% and 10% of the market value of the portfolio, respectively.
Master limited partnerships traded on a recognized exchange are not to exceed 5% of the portfolio.
2. Types of Investments - Florida statutes and the Plan investment policy authorize the Trustees to invest funds in various investments. The current target allocation of these investments at market is as follows:
3. Alternative investments - The Plan has investments as a limited partner is various infrastructure funds. The funds are valued using their respective net asset value (NAV) as of September 30, 2023. The most significant input into the NAV of such funds is the fair value of the investment holdings. These holdings are valued by the general partners on a quarterly or semi-annual basis, in conjunction with management and investment advisors.
4. Interest Rate Risk - Interest rate risk is the risk that changes in market interest rates will adversely affect the fair value of an investment. Generally, the longer the maturity of an investment the greater the sensitivity of its fair value to changes in market interest rates. As a means of limiting its exposure to interest rate risk, the Plan diversifies its investments by security type and institution, and limits holdings in any one type of investment with any one issuer with various durations of maturities.
Authorized Investments Target % of Portfolio Authorized Investments Target % of Portfolio Domestic equities 25% to 65% Private equity funds 0% to 15% Fixed income 2% to 20% Private credit funds 0% to 15% International equities 5% to 25% Cash and cash equivalents 0% to 10% Real estate 20% to 35%
50
BASIC FINANCIAL STATEMENTS SEPTEMBER 30,
Police Officer’s Retirement Plan (Continued)
4. Interest Rate Risk (continued) - Information about the sensitivity of the fair values of the Plan’s investments to market interest rate fluctuations is provided by the following table that shows the distribution of the Plan’s investments by maturity at September 30, 2023:
Maturities (in years)
5. Credit Risk - Credit risk is the risk that a security or a portfolio will lose some or all of its value due to a real or perceived change in the ability of the issuer to repay its debt. The risk is generally measured by the assignment of a rating by a nationally recognized statistical rating organization. The Plan’s investment policy utilizes portfolio diversification in order to control this risk.
The following table discloses credit ratings by investment type at September 30, 2023:
*Obligations of the U.S. government or obligations explicitly guaranteed by the U.S. government are not considered to have credit risk and do not have purchase limitations.
6. Concentration of Credit Risk - The investment policy of the Plan contains limitations on the amount that can be invested in any one issuer as well as maximum portfolio allocation percentages. There were no individual investments that represent 5% or more of Plan net position at September 30, 2023, except for investments in U.S. government securities.
7. Foreign Currency Risk - Foreign currency risk is the risk that fluctuations in the currency exchange rate may affect transactions conducted in currencies other than U.S. Dollars and the carrying value of foreign investments. The Plan’s exposure to foreign currency risk derives from its investments in international equity mutual funds.
NOTE 3. DEPOSITS AND INVESTMENTS (CONTINUED)
Investment Type Fair Value
U.S. treasuries $ 3,381,055 $ — $ 2,364,158 $ 1,016,897 U.S. agencies 3,270,020 — — 3,270,020 Fixed income fund 8,129,582 — — 8,129,582 Corporate bonds 1,896,599 — 1,268,097 628,502 Total $ 16,677,256 $ — $ 3,632,255 $ 13,045,001
Investment
1 to 5 6 to 10 More than 10
Fair Value % of Portfolio U.S. Government guaranteed securities* $ 6,651,075 39.88% Quality rating of credit risk debt securities: Aa3 8,129,582 48.75% A1 240,629 1.44% A2 409,976 2.46% A3 617,492 3.70% Ba2 628,502 3.77% Total credit risk debt securities 10,026,181 60.12% Total fixed income securities $ 16,677,256 100.00%
BASIC FINANCIAL
51
CITY OF MIRAMAR, FLORIDA NOTES TO
STATEMENTS SEPTEMBER 30, 2023
NOTE 3. DEPOSITS AND INVESTMENTS (CONTINUED)
Police Officer’s Retirement Plan (Continued)
8. Custodial Credit Risk - Deposits are exposed to custodial credit risk if they are uninsured and uncollateralized. Custodial credit risk is the risk that, in the event of the failure of the counterparty, the Plan will not be able to recover the value of its investments or collateral securities that are in the possession of an outside party. Investment securities are exposed to custodial credit risk if the securities are uninsured, are not registered in the name of the Plan and are held either by the counterparty or the counterparty’s trust department or agent but not in the Plan’s name.
Consistent with the Plan’s investment policy, the investments are held by the Plan’s custodial bank and registered in the Plan’s name. All of the Plan’s deposits are insured or collateralized by a financial institution separate from the Plan’s depository financial institution.
9. Plan Investments - The Police Officers’ Retirement Plan investments are categorized as follows according to the GASB 72 fair value hierarchy as of September 30, 2023:
Fair Value Measurements Using Quoted Prices in Active Markets for Identical Assets Significant Other Observable Inputs
Value (Level 1) (Level 2)
Investments
Fixed income: U.S. treasuries $ 3,381,055 $ — $ 3,381,055 U.S. Agency securities 3,270,020 3,270,020 Fixed income fund 8,129,582 8,129,582 Corporate bonds 1,896,599 — 1,896,599 Equity securities: Equity securities 130,495,081 130,495,081 — Total Investments by fair value level 147,172,337 $ 130,495,081 $16,677,256 Investments measured at the NetAsset Value (NAV) Real estate funds 61,127,138 Private equity funds 23,121,873 Private credit funds 13,565,419 Total investments measured at NetAsset Value (NAV) 97,814,430 Money market funds 11,248,710
Investments $256,235,477 Investments measured at the NAV NAV Unfunded Commitments Redemption Frequency Redemption Notice Period Real estate fund $ 44,807,734 $ — Quarterly 45 Days Real estate fund 16,319,404 — Quarterly 60 Days Private equity fund 23,121,873 25,723,319 N/A N/A Private credit fund 13,565,419 3,500,538 N/A N/A Total investments measured at NAV $ 97,814,430 $ 29,223,857
NOTES TO BASIC FINANCIAL STATEMENTS SEPTEMBER 30, 2023 52
Fair
Total
CITY OF MIRAMAR, FLORIDA
NOTE 3. DEPOSITS AND INVESTMENTS (CONTINUED)
Firefighters’ Retirement Plan
1. Investment Authorization - The Plan’s investment policy is determined by the Board of Trustees. The policy has been identified by the Board as preserving the purchasing power of the Plan’s assets and earns an above average real rate of return (after inflation) over the long term while minimizing, to a reasonable extent, the short-term volatility of results. The Trustees are authorized to acquire and retain every kind of property, real, personal or mixed, and every kind of investment specifically included, but not by way of limitation, bonds, debentures, and other corporate obligations, and stocks, preferred or common, which persons of prudence, discretion and intelligence acquire or retain for their own account. International investments shall not exceed 20% of the Plan’s investment balance.
2. Types of Investments - Florida Statutes and the Plan investment policy authorize the Trustees to invest funds in various investments. The current target allocation of these investments at market is as follows:
Authorized Investments Target % of Portfolio Domestic equities
to 70% International equities
to 20% Cash and cash equivalents
to 2.5%
3. Interest Rate Risk - Interest rate risk is the risk that changes in market interest rates will adversely affect the fair value of an investment. Generally, the longer the maturity of an investment the greater the sensitivity of its fair value to changes in market interest rates. As a means of limiting its exposure to interest rate risk, the Plan diversifies its investments by security type and institution, and limits holdings in any one type of investment with any one issuer with various durations of maturities.
Information about the sensitivity of the fair values of the Plan’s investments to market interest rate fluctuations is provided by the following table that shows the distribution of the Plan’s investments by maturity at September 30, 2023:
40%
10%
5%
estate 0%
0%
to 20% Fixed income
to 20% Real
Investment Maturities (in years) Investment Type Fair Value Less than 1 1 to 5 6 to 10 More than 10 Collateralized mortgage obligations $ 2,086,367 $ — $ 124 $ — $ 2,086,243 Certificates of Deposit 972,172 — 972,172 — — U.S. treasuries 1,628,178 — 316,329 159,183 1,152,666 U.S. agencies 14,774,630 254,225 350,888 3,529,328 10,640,189 Foreign bonds 1,427,497 — 677,129 358,690 391,678 Corporate bonds 8,300,596 72,288 2,896,302 2,347,597 2,984,409 Asset backed securities 1,128,072 637,259 490,813 — — Total $ 30,317,512 $ 963,772 $ 5,703,757 $ 6,394,798 $ 17,255,185
NOTES TO BASIC FINANCIAL STATEMENTS SEPTEMBER 30,
53
CITY OF MIRAMAR, FLORIDA
2023
NOTE 3. DEPOSITS AND INVESTMENTS (CONTINUED)
Firefighters’ Retirement Plan (Continued)
4. Credit Risk - Credit risk is the risk that a security or a portfolio will lose some or all of its value due to a real or perceived change in the ability of the issuer to repay its debt. The risk is generally measured by the assignment of a rating by a nationally recognized statistical rating organization. The Plan’s investment policy utilizes portfolio diversification in order to control this risk.
The following table discloses credit ratings by investment type at September 30, 2023:
*Obligations of the U.S. government or obligations explicitly guaranteed by the U.S. government are not considered to have credit risk and do not have purchase limitations.
5. Concentration of Credit Risk - GASB Statement No. 40 requires disclosure of investments (other than those issued or guaranteed by the U.S. Government) in any one issuer that represents 5% or more of total investments or fiduciary net position. At September 30, 2023, investment in the following mutual funds represented more than 5% of the Plan’s net position: Rhumbline S&P 500 Pooled Index Fund (8.9%). Rhumbline International Pooled Index Fund (9.3%) and Invesco Oppenheimer DVD-6 (6.6%).
6. Foreign Currency Risk - Foreign currency risk is the risk that fluctuations in the currency exchange rate may affect transactions conducted in currencies other than U.S. Dollars and the carrying value of foreign investments. The investment policy limits foreign investments to no more than 20% of the Plan’s investment balance. The Plan’s exposure to foreign currency risk derives mainly from its investments in international equity funds.
Fair Value % of Portfolio U.S. Government guaranteed securities* $ 15,672,898 52.97% Quality rating of credit risk debt securities: A1 1,851,425 6.26% A2 1,617,545 5.47% A3 1,368,165 4.62% Aa1 368,981 1.25% Aa2 795,768 2.69% Aa3 523,687 1.77% Aaa 594,311 2.01% Aaa1 16,574 0.06% Aaa2 292,804 0.99% Baa1 903,777 3.05% Baa2 1,233,816 4.17% Baa3 161,239 0.54% Not rated 4,186,610 14.15% Total credit risk debt securities 13,914,702 47.03% Total fixed income securities $ 29,587,600 100.00%
54
CITY OF MIRAMAR, FLORIDA NOTES TO BASIC FINANCIAL STATEMENTS SEPTEMBER 30, 2023
NOTE 3. DEPOSITS AND INVESTMENTS (CONTINUED)
Firefighters’ Retirement Plan (Continued)
7. Custodial Credit Risk - Deposits are exposed to custodial credit risk if they are uninsured and uncollateralized. Custodial credit risk is the risk that, in the event of the failure of the counterparty, the Plan will not be able to recover the value of its investments or collateral securities that are in the possession of an outside party. Investment securities are exposed to custodial credit risk if the securities are uninsured, are not registered in the name of the Plan and are held either by the counterparty or the counterparty’s trust department or agent but not in the Plan’s name. Consistent with the Plan’s investment policy, the investments are held by the Plan’s custodial bank and are registered in the Plan’s name. All of the Plan’s deposits are insured or collateralized by a financial institution separate from the Plan’s depository financial institution.
8. Plan Investments - The Firefighters’ Retirement Plan investments are categorized as follows according to the GASB 72 fair value hierarchy as of September 30, 2023:
Fair Value Measurements Using Quoted Prices in Active Markets for Identical Assets Significant Other Observable Inputs
Investments Fair Value (Level 1) (Level 2)
Fixed income: U.S. treasuries $ 1,628,178 $ 1,628,178 $ — U.S. agencies 14,774,631 — 14,774,631 Asset backed securities 1,128,072 — 1,128,072 International bonds 1,427,498 — 1,427,498 Collateralized mortgage obligations 2,086,366 — 2,086,366 Corporate bonds 8,300,595 — 8,300,595 Equity securities: Common stocks 64,173,724 64,173,724 — Real-estate investment trust 457,133 457,133 — International funds 23,782,309 2,531,488 21,250,821 Mutual funds 65,488,471 — 65,488,471 Total Investments by fair value level 183,246,977 $ 68,790,523 $ 114,456,454 Investments measured at the net asset value (NAV) Real Estate fund 22,130,069 Timber fund 5,362,494 Total investments measured at NAV 27,492,563 Money market funds (exempt) 15,101,409 Certificates of deposit (exempt) 972,172 Total Investments $ 226,813,121 Investments measured at NAV NAV Unfunded Commitments Redemption Frequency Redemption Notice Period Real Estate fund $ 12,856,109 $ — Quarterly 45 Days Real Estate fund 9,273,960 — Quarterly 10 Days Timber fund 2,033,867 — N/A N/A Timber fund 1,897,065 — N/A N/A Timber fund 1,431,562 — N/A N/A Total investments measured at NAV $ 27,492,563 $ —
NOTES TO BASIC FINANCIAL STATEMENTS SEPTEMBER 30,
55
CITY OF MIRAMAR, FLORIDA
2023
NOTE 3. DEPOSITS AND INVESTMENTS (CONTINUED)
OPEB Trust Fund
OPEB Trust Investments
On August 21, 2019, the City Commission adopted Resolution No. 19-159 establishing an irrevocable trust with ICMA Retirement Corporation. The trust received an initial deposit of $1,000,000 on August 18, 2020 and an additional deposit of $500,000 on January 20, 2021 and November 19, 2021. The City Commission has the authority to establish and amend the funding policy of the OPEB Plan. The trust is 100% funded by City contributions. Future funding of the trust is determined on an annual basis by the City Commission during the approval of the City’s annual budget. The trust is administered by a trustee committee comprised of the City Manager, Director of Financial Services, and Director of Human Services.
Resolution No. 19-159 authorizes the trust assets to be invested in the ICMA Retirement Corporation Vantage Trust Retirement Health Savings Plan. Investments in the RHS Plan include money market funds, bond funds, equity funds, and multi-strategy funds. As authorized by the resolution, the OPEB Plan trustees have directed ICMA Retirement Corporation to invest the Plan assets in a diversified pool of money market funds, bond funds, equity funds, and multi-strategy funds.
Plan assets are allocated as follows:
For the fiscal year ended September 30, 2023, the annualized money-weighted rate of return on OPEB plan investments was 9.11%. The money-weighted rate of return is net of investment-related expenses and reflects any changes in the amounts actually invested.
As of September 30, 2023, the OPEB Trust had the following investments:
Plan Investments - The OPEB Plan investments are categorized as follows according to the GASB 72 fair value hierarchy as of September 30, 2023.
Asset Class Allocation of Assets Fixed Income and Stable Value 51.0% Equities 43.9% Multi-Strategy Funds 5.1% 100.0%
Investments Fair Value Ratings Maturity Percentage of Distribution Balanced/Asset Allocation: MSQ II Model Port Con S10 $1,573,872 N/A N/A 39.41 % MSQ II Model Port Mod S10 $ 956,582 N/A N/A 60.59 %
Investments Measured at NAV Fair Value Unfunded Commitments Redemption Frequency Redemption Notice Period Balanced/Asset Allocation: MSQ II Model Port Con S10 $1,573,872 $ — Daily Same Day MSQ II Model Port Mod S10 956,582 — Daily Same Day Total investments measured at NAV $2,530,454 $ — CITY OF MIRAMAR,
NOTES TO BASIC FINANCIAL STATEMENTS SEPTEMBER 30, 2023 56
FLORIDA
NOTE 4. RECEIVABLES AND UNEARNED REVENUES
Receivables at September 30, 2023, were as follows:
Unearned revenue is recorded for resources that have been received in advance but for which the City has not met the criteria for revenue recognition. The following are recorded as unearned revenue in the government-wide and fund statements as follows:
Revenues not yet earned (General Fund) $ 1,219,267
Revenues not yet earned (Non-major governmental funds) 7,367,988
Revenues not yet earned (Utility Fund) 1,770,000
Revenues not yet earned (Internal Service Funds) 168,898
Total unearned revenue $ 10,526,153 CITY
General Fund Nonmajor Governmental Funds Internal Service Funds Total Governmental Activities Taxes $ 1,208,263 $ — $ — $ 1,208,263 Franchise fees 1,887,063 — — 1,887,063 Accounts 2,343,331 670,019 — 3,013,350 Cost recovery 312,177 — — 312,177 Other 1,928,078 — 478,467 2,406,545 Allowance for uncollectible (909,756) — — (909,756) Total Governmental Activities $ 6,769,156 $ 670,019 $ 478,467 $ 7,917,642 Utility Fund Stormwater Fund Total Business-Type Activities Accounts $ 11,193,069 $ 97,292 $ 11,290,361 Assessment fees 3,367,135 — 3,367,135 Other 120,272 — 120,272 Allowance for uncollectible (5,324,215) (70,929) (5,395,144) Total Business-Type Activities $ 9,356,261 $ 26,363 $ 9,382,624
Unearned
Type Revenues
MIRAMAR,
NOTES TO BASIC FINANCIAL STATEMENTS
57
OF
FLORIDA
SEPTEMBER 30, 2023
NOTE 5. RESTRICTED ASSETS
Restricted assets and liabilities payable from restricted assets of the Utility Fund at September 30, 2023, represent debt proceeds designated for construction, and other monies required to be restricted for debt service, and maintenance and improvements, under the terms of the 2015 Utility System Refunding and Improvement Revenue Bonds, the 2017 Utility System Refunding Revenue Bonds, and customer deposits. Assets of the Sinking Fund and Reserve Fund are restricted for the current and future payment of debt service and for renewal and replacement.
Restricted assets of the Stormwater Fund at September 30, 2023, represent monies required to be restricted for rate stabilization by the 2015 Utility System Refunding Revenue Bond debt covenant.
All of the restricted assets in connection with the bond issues were funded through bond proceeds. The summary of restricted assets and related liabilities at September 30, 2023, is shown below:
Liabilities Payable from Restricted Restricted Purpose
Utility Fund: 2015 Utility System Refunding Revenue Bonds: Sinking Fund $ 500,000 $ — Reserve Fund 180,000 — 2017 Utility System Refunding Revenue Bonds : Reserve Fund 3,863,841 1,017,655 State Revolving Loan: Reserve Fund 2,246,376 — Contributions in aid of construction 7,335,717 — Customer deposits 5,361,115 5,361,115 Total for Utility Fund $ 19,487,049 $ 6,378,770 Stormwater Fund: Reserved for Debt Service related to the 2015 Utility System Refunding Revenue Bonds $ 267,198 $ — Total for Stormwater Fund $ 267,198 $ — Liabilities payable from restricted assets are as follows Liabilities Current Long-Term Total Accrued interest payable $ 881,142 $ — $ 881,142 Deposits payable 536,112 4,825,004 5,361,116 Retainage payable 136,512 136,512 Total $ 1,553,766 $ 4,825,004 $ 6,378,770
OF
NOTES TO BASIC FINANCIAL STATEMENTS SEPTEMBER 30,
58
Assets Assets
CITY
MIRAMAR, FLORIDA
2023
CITY OF MIRAMAR, FLORIDA
NOTES TO
FINANCIAL STATEMENTS SEPTEMBER 30, 2023
NOTE 6. CAPITAL ASSETS
Capital asset activity for the year ended September 30, 2023, follows:
*Restated for GASB 96 (SBITA), as of October 1, 2022.
Beginning Additions/ Deletions/ Ending Governmental activities: Balance Transfers Transfers Balance Capital assets not being depreciated: Land $ 45,534,171 $ — $ — $ 45,534,171 Construction in progress 11,767,441 8,957,486 3,205,906 17,519,021 Total capital assets not being depreciated/ amortized 57,301,612 8,957,486 3,205,906 63,053,192 Capital assets being depreciated/amortized: Buildings 203,901,543 229,870 343,000 203,788,413 Improvements other than buildings 31,973,407 2,918,193 — 34,891,600 Machinery and equipment 33,818,818 1,921,060 56,696 35,683,182 Fleet 23,844,088 1,006,023 606,786 24,243,325 Intangible 6,011,006 171,356 — 6,182,362 Infrastructure 78,294,035 504,619 — 78,798,654 Right to use leased assets 1,340,078 — — 1,340,078 Right to use SBITA* 3,080,969 — — 3,080,969 Total capital assets being depreciated/ amortized 382,263,944 6,751,121 1,006,482 388,008,583 Less accumulated depreciation/amortization for: Buildings 52,624,600 4,173,861 264,110 56,534,351 Improvements other than buildings 14,781,277 1,597,408 — 16,378,685 Machinery and equipment 22,629,543 2,571,706 55,670 25,145,579 Fleet 18,685,428 1,736,596 606,786 19,815,238 Intangible 3,847,896 356,586 — 4,204,482 Infrastructure 53,034,924 2,113,315 — 55,148,239 Right to use leased assets 204,302 291,067 — 495,369 Right to use SBITA — 1,262,491 — 1,262,491 Total accumulated depreciation/amortization 165,807,970 14,103,030 926,566 178,984,434 Capital assets being depreciated/ amortized, net 216,455,974 (7,351,909) 79,916 209,024,149 Governmental activities capital assets, net $ 273,757,586 $ 1,605,577 $ 3,285,822 $272,077,341
59
BASIC
CITY OF MIRAMAR, FLORIDA NOTES TO
2023
NOTE 6. CAPITAL ASSETS (CONTINUED)
depreciation/amortization for:
*Restated for GASB 96 (SBITA), as of October 1, 2022.
Beginning Additions/ Deletions/ Ending Business-type activities: Balance Transfers Transfers Balance Capital assets, not
depreciated: Land $ 5,753,859 $ — $ — $ 5,753,859 Construction in progress 22,562,450 20,079,959 309,844 42,332,565 Total capital assets not being depreciated 28,316,309 20,079,959 307,722 48,086,424 Capital assets being depreciated/amortized: Buildings 105,644,198 — — 105,644,198 Improvements other than buildings 2,167,578 53,929 — 2,221,507 Machinery and equipment 3,722,180 313,228 — 4,035,408 Fleet 6,020,137 598,768 33,413 6,585,492 Intangible 2,019,900 — — 2,019,900 Infrastructure 377,230,006 2,065,876 — 379,295,882 Right to Use SBITA* 165,204 — — 165,204 Total capital assets being depreciated/amortized 496,969,203 3,031,801 33,413 499,967,591 Less accumulated
Buildings 41,706,398 1,952,463 — 43,658,861 Improvements other than buildings 1,341,236 82,358 — 1,423,594 Machinery and equipment 2,197,469 485,132 — 2,682,601 Fleet 4,572,661 591,067 33,413 5,130,315 Intangible 1,710,089 70,181 — 1,780,270 Infrastructure 148,759,645 10,311,552 — 159,071,197 Right to Use SBITA* — 13,767 — 13,767 Total accumulated depreciation/amortization 200,287,498 13,506,520 33,413 213,760,605 Capital assets being depreciated/amortized, net 296,681,705 (10,474,720) — 286,206,986 Business-type activities capital assets, net $ 324,998,014 $ 9,605,239 $ 307,722 $334,293,410
being
BASIC
60
FINANCIAL STATEMENTS SEPTEMBER 30,
CITY OF MIRAMAR, FLORIDA
NOTES TO BASIC FINANCIAL STATEMENTS SEPTEMBER 30, 2023
NOTE 6. CAPITAL ASSETS (CONTINUED)
Depreciation/amortization expense was charged to functions/programs of the City as follows:
expense
Right-to-Use Lease Assets
expense
Lessee. The City has recorded the right-to-use lease assets as a result of implementing GASB Statement No. 87. The right-to-use lease assets are initially measured at an amount equal to the initial measurement of the related lease liability plus any lease payment made. The right-to-use lease assets are amortized on a straight-line basis over the shorter of the life of the asset or of the related lease.
Refer to Note 8 for information on the liabilities relating to the right-to-use lease assets.
Lessor. The City is a lessor for various leases of cellular towers and building space. During the year ended September 30, 2023, the City recognized $357,708 of lease revenue and $456,376 of interest income related to the leases. At September 30, 2023, the City recorded a lease receivable of $25,492,460 and a deferred inflow of resources of $24,059,970 related to the leases.
Subscription Based Information Technology Arrangements
GASB Statement No. 96, Subscription-Based Information Technology Arrangements (SBITA), became effective for the reporting period ending September 30, 2023. A SBITA is a contract that conveys control of the right to use another party’s IT software, alone or in combination with tangible capital assets, as specified in the contract for a period of time in an exchange or exchange-like transaction. The standards for SBITAs are based on the standards established for leases in GASB 87. Like leases, SBITA commitments in the government-wide and proprietary fund statements are reported as liabilities at inception. The related assets along with the amortization are also reported at that time as right-to-use assets. Right-to-use assets at inception are recorded at the present value of total SBITA payments as shown in Note 8 and these payments are discounted at the City’s incremental borrowing rate. SBITA payments are reported as reductions of the liability and accrued interest. Currently, the City is engaged in only leasee-type SBITA agreements.
Governmental activities: General government $ 4,213,591 Public safety 3,386,702 Physical environment 2,256,539 Transportation 57,653 Social services 504,040 Economic environment 242,429 Parks and recreation 2,985,977 Cultural arts 456,098
depreciation/amortization
Business-type activities: Utility $ 13,113,805 Stormwater 392,715 Total depreciation/amortization
Total
– governmental activities $ 14,103,029
– business type activities $ 13,506,520
61
CITY OF MIRAMAR, FLORIDA
NOTE 7. INTERFUND BALANCES AND TRANSFERS
Interfund balances at September 30, 2023, consisted of the following:
The balances above represent short-term loans to cover temporary negative balances in each fund’s equity in pooled cash at year end.
Advances for the year ended September 30, 2023, consisted of the following:
In 2021, the Utility Fund advanced $2,000,000 to the General Fund for land acquisition. The $2,000,000 advance is based on a Promissory Note from the Utility Fund to the General Fund and will be repaid over 7 years at an interest rate of 1.5%. The funding source for repayment is billboard revenues to be budgeted annually based on the amortization schedule.
Interfund transfers at September 30, 2023, consisted of the following:
Transfers are used to: (1) transfer revenues from the fund that the budget requires to collect them to the fund the budget requires to expend them, (2) transfer receipts restricted for debt service from funds collecting the receipts to the debt service fund as debt service payments become due, and (3) use unrestricted revenues collected in the General Fund to cover costs in other funds in accordance with budgetary authorizations. The above transfers are explained below:
1. Transfers into the General Fund consist of transfers from the various grant funds for covered expenditures; and from the Street Construction and Maintenance Fund to cover the cost of street capital improvements and maintenance costs incurred in the General Fund.
2. Transfers into the Debt Service Fund are to cover debt service payments in the current year.
3. Transfers into the Capital Projects Fund are to provide funding for ongoing capital projects.
Receivable Fund Payable Fund Amount General Non-Major Governmental $5,287,687 Utility General $2,339,989
Advance to Other Fund Advance from other fund Amount Utility Fund General Fund $ 1,097,457
Transfers In: Debt Capital Fund Transfers Out: General Service Projects Total General $ 370,400 $ 8,909,157 $ 1,950,000 $ 11,229,557 Nonmajor Governmental: Special Revenue 1,659,505 — — 1,659,505 Capital Projects 2,192,741 2,853,100 — 5,045,841 $ 4,222,646 $ 11,762,257 $ 1,950,000 $ 17,934,903
NOTES TO BASIC FINANCIAL STATEMENTS SEPTEMBER
62
30, 2023
CITY OF MIRAMAR, FLORIDA
NOTES TO BASIC FINANCIAL STATEMENTS
SEPTEMBER 30, 2023
NOTE 8. LONG-TERM OBLIGATIONS
Business-Type Activities - Direct Borrowing
The City has outstanding Revenue Bonds, Notes, and Credit Lines or Borrowing Facilities from direct borrowings related to its Business-type Activities totaling $82,914,926. The outstanding Revenue Bonds and Notes, Credit Lines or Borrowing Facilities are secured by the respective revenues from the operation of the related business-type activities.
A. Enterprise Fund Revenue Bonds
In November 2017, the City issued Utility System Refunding Revenue Bonds, Series 2017 in the principal amount of $32,315,000. The Series 2017 Bonds were issued to current refund the City’s outstanding Utility System Revenue Bonds, Series 2007 and to pay certain costs and expenses relating to the issuance of the 2017 Bonds. Principal and interest are due semi-annually on April 1 and October 1, through October 1, 2037, with a fixed interest rate of 5.00%. Repayment of the bonds is secured by a pledge of the Net Revenues and Connection Fees derived from the operation of the System.
In March 2015, the City issued $11,485,000 of the Utility System Refunding Revenue Bonds, Series 2015 to refund the then outstanding $11,520,000 Utility System Refunding and Improvement Revenue Bonds, Series 2004. The bonds are secured by the net revenues of the system and water connection fees. Principal and interest are due quarterly through October 1, 2034.
B. Enterprise Fund Loan Payable - Direct Borrowing
In 2005, the City began to participate in the Revolving Loan Fund Program administered by the State of Florida. This program allows local governments to enter into loan agreements with the Department of Environmental Protection under the State Revolving Loan Fund Program (“SRFLP”), for the construction of stormwater and wastewater management facilities. These loans have repayment terms of 10 and 20 years with a fixed interest rate of 2.09%. Principal and interest payments are due semi-annually on January 15 and July 15 related to the City’s outstanding 2005 series loans. All SRFLP agreements specify in the event of a default, the lender may increase the applicable interest rate margin to eighteen percent at the thirtieth day after default, and/or increase the applicable interest rate to 1.667 times the interest rate of the loan. The City has an outstanding loan payable of $3,658,342 at September 30, 2023.
In 2014, the City entered into a loan agreement with the State of Florida Department of Environmental Protection’s ("FDEP") Clean Water SRFLP to borrow up to $546,664 to finance the planning and design of wastewater pollution control facility improvements. In 2017, the agreement was amended, and the principal amount of the loan was reduced to $382,665. As of September 30, 2023, the City has an outstanding loan payable of $293,245. The financing rate on the unpaid principal of the loan amount is 2.56% per annum. The loan is payable in semiannual payments upon completion of the project and is calculated based on the actual amount of principal drawn under the agreement, as well as associated capitalized interest and a loan service fee.
In 2015, the City entered into a loan agreement with the State of Florida Department of Environmental Protection’s Clean Water SRFLP to borrow up to $374,000 to finance the planning, design, and construction of stormwater drainage improvements. As of September 30, 2023, the City has an outstanding loan payable of $212,985 . The financing rate on the unpaid principal of the loan amount is 1.96% per annum. The loan is payable in semiannual payments upon completion of the project and is calculated based on the actual amount of principal drawn under the agreement, as well as associated capitalized interest and a loan service fee.
63
2023
B. Enterprise Fund Loan Payable -Direct Borrowing (Continued)
In 2017, the City entered into a loan agreement with the FDEP’s Clean Water SRFLP to borrow up to $1.2 million for the planning and design of the City’s wastewater collection and stormwater best management practices (BMPs) project. In 2023, the agreement was amended, and the principal amount of the loan was reduced to $865,247. As of September 30, 2023, the City has an outstanding loan payable of $865,247. The financing rate on the unpaid principal of the loan amount is 2.15% per annum. The loan is payable in semiannual payments upon completion of the project and is calculated based on the actual amount of principal drawn under the agreement, as well as associated capitalized interest and a loan service fee.
In 2017, the City entered into a loan agreement with the FDEP’s SRFLP to borrow up to $15,540,000 for upgrades to the City’s East Water Treatment Facility. In 2018, the agreement was amended to include an additional $15,000,000 in financing for this project. In 2021, the agreement was amended to include an additional $1,600,000 in financing for this project. In 2023, the agreement was amended and the principal amount of the loan was reduced to $31,607,521. As of September 30, 2023, the City has an outstanding loan payable of $29,831,208. The financing rates on the unpaid principal of the loan amount are .23%, 1.08%, and 1.23% per annum. The loan is payable in semiannual payments upon completion of the project.
In 2017, the City entered into a loan agreement with the FDEP’s SRFLP to borrow up to $16,662,000 to finance wastewater and stormwater management upgrades. As of September 30, 2023, the amount disbursed is $15,126,165. The loan has an outstanding principal balance of $13,798,899 including capitalized interest as of September 30, 2023. The financing rate on the unpaid principal of the loan is 0.97% per annum. The loan is payable in semiannual payments upon completion of the project and is calculated on the amount of principal drawn under the agreement, as well as associated capitalized interest and a loan service fee. In the event of a default, the lender may accelerate payment immediately of the entire principal amount and other amounts due. Additionally, the lender may increase the applicable interest rate margin to eighteen percent at the thirtieth day after default, and/or increase the applicable interest rate at 1.667 times the interest rate of the loan.
Governmental Type Activities - Direct Borrowing
The City has outstanding Revenue Bonds and Notes from direct borrowings related to its governmental type activities totaling $126,890,000. The outstanding Revenue Bonds and Notes, Credit Lines or borrowing facilities are secured by the respective revenues and/or pledged revenues subject to budget and appropriation. The City’s governmental activity bonds and notes that are secured by a pledge to budget and appropriate legally available non-ad valorem revenues require that the City ensure that before any additional borrowing or debt is incurred, (a) the 2 year average of non-ad valorem revenues exceed the total annual debt service for governmental activities by a minimum of 1.2 times and (b) the total annual debt service for all governmental type debt should not exceed 20% of the 2 year average for General Fund total revenues.
NOTE 8. LONG-TERM OBLIGATIONS (CONTINUED)
64
CITY OF MIRAMAR, FLORIDA NOTES TO BASIC FINANCIAL STATEMENTS SEPTEMBER 30,
CITY OF MIRAMAR, FLORIDA
NOTES TO BASIC FINANCIAL STATEMENTS
30, 2023
C. Governmental Activities Revenue Bonds - Direct Borrowing (continued)
On June 30, 2021, the City issued $51,000,000 in Taxable Special Obligation Refunding Bonds, Series 2021, with interest rates ranging between .451% and 2.793%. The bonds were issued to advance refund $47,770,000 of the $51,780,000 in outstanding Special Obligation Refunding and Improvement Revenue Bonds, Series 2013 with interest rates ranging between 4.00% and 5.00%. The net proceeds from the issuance along with other resources were used to purchase State and Local Government Securities (SLGS) which were placed in an irrevocable trust to provide for all future debt service on the refunded portion of the 2013 series bonds. As a result, $47,770,000 of the 2013 series bonds is considered defeased. The Special Obligation Refunding and Improvement Bonds, Series 2013 was paid off in October 2022. Principal and interest on the Special Obligation Refunding Bonds, Series 2021, is due semi-annually on April 1 and October 1 through October 2038. The City’s obligation to repay the Bonds is secured by impact fees and the City’s covenant to budget and appropriate legally available non-ad valorem revenues. The outstanding balance for the Taxable Special Obligation Refunding Bonds, Series 2021 is $50,315,000.
In March 2015, the City issued $79,595,000 of the Capital Improvement Refunding Revenue Bonds, Series 2015, which was used to pay off the then outstanding $3,635,000 Public Service Tax Revenue Bonds, Series 2003 and the outstanding $83,935,000 Capital Improvement Revenue Bonds, Series 2005.The City’s obligation to repay the bonds is secured by pledges of City revenue from the sales tax and communication service tax. Principal and interest are paid semi-annually on April 1 and October 1, through October 1, 2035. The outstanding balance for the Capital Improvement Refunding Revenue Bonds, Series 2015 is $57,035,000.
D. Revenue Notes Payable - Direct Borrowing
On October 24, 2019, the City entered into a tax-exempt Loan Agreement (City of Miramar, Florida Special Obligation Revenue Note, Series 2019A) with STI Institutional & Government, Inc. in the principal amount of $5,000,000 to finance the cost of various capital improvements within the City and to pay issuance costs relating to the issuance of the Series 2019A Note. Principal and interest on the Series 2019A Note is payable quarterly, on January 1, April 1, July 1, and October 1 of each year, with a fixed interest rate of 1.92%. The Series 2019A Note is secured by a covenant to budget and appropriate Non-Ad Valorem Revenues sufficient to pay principal and interest on the Series 2019A Note when due. The final maturity date of the Note is October 1, 2039. The outstanding balance for the Special Obligation Revenue Note, Series 2019A is $4,230,000. In the event of default, the noteholder or any trustee or receiver acting for the Noteholder may either at law or in equity, by suit, action, mandamus, or other proceedings in any court of competent jurisdiction, protect and enforce any and all rights under the Laws of the State of Florida, or granted and contained in the Agreement, and may enforce and compel the performance of all duties required by the Agreement or by any applicable statutes to be performed by the City. Notwithstanding any other provision, the Noteholder does not have the right to declare the Series 2019A Note immediately due and payable.
NOTE 8. LONG-TERM OBLIGATIONS (CONTINUED)
65
SEPTEMBER
CITY OF MIRAMAR, FLORIDA
30, 2023
D. Revenue Notes Payable - Direct Borrowing
On October 24, 2019, the City entered into a taxable Loan Agreement (City of Miramar, Florida Taxable Special Obligation Revenue Note, Series 2019B) with SunTrust Bank in the principal amount of $5,000,000 to finance the cost of various capital improvements within the City and to pay issuance costs relating to the issuance of the Series 2019B Note. Principal and interest on the Series 2019B Note is payable quarterly, on January 1, April 1, July 1, and October 1 of each year, through October 1, 2039 with a fixed interest rate of 2.36%. The Series 2019B Note is secured by a covenant to budget and appropriate Non-Ad Valorem Revenues sufficient to pay principal and interest on the Series 2019B Note when due. The outstanding balance for the Special Obligation Revenue Note, Series 2019B is $4,245,000. In the event of default, the noteholder or any trustee or receiver acting for the noteholder may either at law or in equity, by suit, action, mandamus or other proceedings in any court of competent jurisdiction, protect and enforce any and all rights under the Laws of the State of Florida, or granted and contained in the Agreement, and may enforce and compel the performance of all duties required by the Agreement or by any applicable statutes to be performed by the City. Notwithstanding any other provision, the Noteholder does not have the right to declare the Series 2019B Note immediately due and payable.
On November 10, 2021, the City issued Special Obligation Revenue Notes, Series 2021B and 2021C, in the principal amount of $8,035,000 and $5,415,000 respectively. The Series 2021B Note was issued to finance the cost of various capital improvements within the City and to pay issuance costs relating to the issuance of the Series 2021B Note. The Series 2021C Note was issued to refund the City’s outstanding Special Obligation Revenue Note, Series 2017 and to pay the costs of issuance of the Series 2021C Note. Principal and interest on the Series 2021B and 2021C Notes are payable quarterly, on January 15, April 15, July 15, and October 15 of each year, through October 15, 2036 for the Series 2021B Note at a fixed interest rate of 1.887% and for the Series 2021C Note through January 15, 2027 at a fixed interest rate of .812%. The Series 2021B and 2021C Notes are secured by a covenant to budget and appropriate Non-Ad Valorem Revenues sufficient to pay principal and interest on the Notes when due. The outstanding balances for the Special Obligation Revenue Note, Series 2021B and 2021C are $7,265,000 and $3,800,000 respectively. In the event of default, the noteholder or any trustee or receiver acting for the noteholder may either at law or in equity, by suit, action, mandamus or other proceedings in any court of competent jurisdiction, protect and enforce any and all rights under the Laws of the State of Florida, or granted and contained in the loan agreement, and may enforce and compel the performance of all duties required by the loan agreement or by any applicable statutes to be performed by the City. Notwithstanding any other provision, the Noteholder does not have the right to declare the Series 2021B and 2021C Notes immediately due and payable.
E. Compensated Absences
For the governmental activities, compensated absences are generally liquidated by the General Fund. Internal service funds predominantly serve the governmental funds. Accordingly, long-term liabilities for the internal service funds are included in the totals for governmental activities.
NOTE 8. LONG-TERM OBLIGATIONS (CONTINUED)
SEPTEMBER
66
NOTES TO BASIC FINANCIAL STATEMENTS
CITY OF MIRAMAR, FLORIDA
NOTE 8. LONG-TERM OBLIGATIONS (CONTINUED)
F. Summary of Bonds, Loans and Notes Outstanding
Governmental activities bonds and notes outstanding at September 30, 2023, consist of the following:
Revenuenotes:
Maximum Annual Amount Amount Interest Debt GovernmentalActivities PurposeofIssue Issued Outstanding Rate Service Revenuebonds:
ImprovementRefunding RevenueBonds
CapitalImprovement RevenueBond $ 79,595,000 $ 57,035,000 3.00-5.00% $ 5,955,725 Series2021Special ObligationRefunding RevenueBonds Refunding Series2013 SpecialObligationRefunding andImprovementRevenue Bonds 51,000,000 50,315,000 0.45-2.79% 3,784,890 Totalrevenuebonds $ 130,595,000 $ 107,350,000
Series2015Capital
RefundingSeries2003 PublicServiceTaxRevenue BondandSeries2005
Series2019Special ObligationRevenueNoteA Variouscapitalprojects $ 5,000,000 $ 4,230,000 1.92%$ 319,368 Series2019Special ObligationRevenueNoteB Variouscapitalprojects 5,000,000 4,245,000 2.360% 328,629 Series2021Special ObligationRevenueNoteB Variouscapitalprojects 8,035,000 7,265,000 1.887% 717,596 Series2021Special ObligationRevenueNoteC
SpecialObligationRevenue Note 5,415,000 3,800,000 0.812% 1,085,000 Totalrevenuenotes 23,450,000 19,540,000 Totalforgovernmental activities $ 154,045,000 $ 126,890,000
RefundingSeries2017
TO BASIC FINANCIAL STATEMENTS
67
NOTES
SEPTEMBER 30, 2023
CITY OF MIRAMAR, FLORIDA
SEPTEMBER 30, 2023
NOTE 8. LONG-TERM OBLIGATIONS (CONTINUED)
F. Summary of Bonds, Loans and Notes Outstanding (CONTINUED)
Business-type activities bonds and loans outstanding at September 30, 2023, consist of the following:
Maximum Amount Amount Interest Annual Business-TypeActivities PurposeofIssue Issued Outstanding Rate DebtService
2015UtilitySystem RefundingRevenueBond Refunding2004Utility System $ 11,485,000 $ 7,310,000 2.64% $ 759,780 RevenueBond 2017UtilitySystem RevenueBond Refunding2007Utility SystemRev.Bond 32,315,000 26,945,000 5.00% 2,566,000 TotalRevenueBonds 43,800,000 34,255,000 Staterevolvingloans: 2005EasternMiramar infrastructure Rehabilitationof infrastructure 18,024,237 3,658,342 2.09% 1,089,386 2014HistoricMiramar ImprovementIII WastewaterPollution ControlFacilities 402,314 293,245 2.56% 25,829 2015HistoricMiramar DrainageImprovement Drainageimprovement 297,883 212,985 1.96% 18,033 2017DrinkingWater Upgrade DrinkingWaterUpgrade 32,213,491 29,831,208 .23%, 1.08%-1.23% 1,835,110 2017Wastewaterand StormwaterMgmt. Wastewaterand StormwaterUpgrades 15,333,588 13,798,899 0.97% 859,232 2018Stormwater Management StormwaterImprovements 893,177 865,247 2.15% 55,713 Totalstaterevolving loans 67,164,690 48,659,926 Totalforbusiness-type activities $ 110,964,690 $ 82,914,926
Revenuebonds:
NOTES TO BASIC FINANCIAL STATEMENTS
68
CITY OF MIRAMAR, FLORIDA
NOTES TO BASIC FINANCIAL STATEMENTS SEPTEMBER 30, 2023
NOTE 8. LONG-TERM OBLIGATIONS (CONTINUED)
G. Changes in Long-Term Obligations
Long-term liability activity for the year ended September 30, 2023, follows:
*RestatedforGASB96SBITAs,asofOctober1,2022
For governmental activities, compensated absences, pension liabilities and the other postemployment benefit (OPEB) liability are generally liquidated by the General Fund. Internal Service Funds predominately serve the governmental funds. Accordingly, their long-term liabilities for compensated absences, pension liabilities, and the other post-employment benefit (OPEB) liability are included as part of the totals for governmental activities.
Beginning Balance Additions Reductions Ending Balance DueWithin OneYear
Bonds,notes,andleasespayable: Revenuebonds $ 113,575,000 $ — $ 6,225,000 $ 107,350,000 $ 6,485,000 Revenuenotes 21,485,000 — 1,945,000 19,540,000 2,005,000 Obligationsunderfinancing agreements 10,463,252 — 1,577,836 8,885,416 1,358,485 Obligationsunderleases 1,143,731 — 269,026 874,705 192,867 ObligationsunderSBITAs* 2,173,421 — 650,313 1,523,108 650,283 Deferredcosts–premium 4,597,944 — 343,271 4,254,673 — Totalbonds,notespayableand leases 153,438,348 — 11,010,446 142,427,902 10,691,635 Otherliabilities: Self-insuranceclaims 10,708,420 382,000 354,259 10,736,161 2,698,921 Compensatedabsences 16,248,424 3,260,168 3,216,579 16,292,013 4,690,079 Otherpost-employmentbenefit obligation 44,874,891 5,518,030 12,833,404 37,559,517 — Totalpensionliability-excessbenefit 1,227,092 50,560 1,176,532 — Netpensionliability 75,553,464 132,070,719 — 207,624,183 — Netpensionliability-FRSandHIS 771,739 61,331 — 833,070 — Totalotherliabilities 149,384,030 141,292,248 16,454,802 274,221,476 7,389,000 Totalgovernmentalactivities long-termliabilities $ 302,822,378 $ 141,292,248 $ 27,465,248 $ 416,625,438 $ 18,080,635
Governmentalactivities:
69
CITY OF MIRAMAR, FLORIDA
NOTES TO BASIC FINANCIAL STATEMENTS SEPTEMBER 30, 2023
NOTE 8. LONG-TERM OBLIGATIONS (CONTINUED)
G. Changes in Long-Term Obligations (Continued)
*RestatedforGASB96SBITAs,asofOctober1,2022
H. Summary of Annual Debt Service Requirements
Beginning Balance Additions Reductions Ending Balance DueWithin OneYear Business-typeactivities: Bondsandloanspayable: Revenuebonds $ 35,990,000 $ — $ 1,735,000 $ 34,255,000 $ 1,820,000 Staterevolvingloans 51,287,464 23,222 2,650,760 48,659,926 3,319,521 Deferredcosts–premium 5,140,511 — 313,128 4,827,383 — ObligationsunderSBITAs* 165,204 — 56,650 108,554 56,650 Totalbonds,loanspayableand SBITAs 92,583,179 23,222 4,755,538 87,850,863 5,196,171 Otherliabilities: Compensatedabsences 2,267,342 276,980 5,144 2,539,178 900,262 Otherpost-employmentbenefit obligation 7,195,216 773,908 2,682,140 5,286,984 — Netpensionliability 5,376,725 11,233,279 — 16,610,004 — Totalotherliabilities 14,839,283 12,284,167 2,687,284 24,436,166 900,262 Totalbusiness-typeactivities long-termliabilities $ 107,422,462 $ 12,307,389 $ 7,442,822 $ 112,287,029 $ 6,096,433
GovernmentalActivities Revenue Bonds Revenue Notes Payable FiscalYear Ended Principal Interest Principal Interest 2024 $ 6,485,000 $ 3,239,240 $ 2,005,000 $ 338,888 2025 6,685,000 3,031,285 2,025,000 311,484 2026 6,495,000 2,815,018 2,035,000 283,727 2027 6,715,000 2,592,292 1,530,000 256,126 2028 6,935,000 2,394,551 995,000 234,660 2029-2033 37,785,000 8,749,270 5,285,000 863,312 2034-2038 32,560,000 2,714,371 4,900,000 316,929 2039-2043 3,690,000 51,531 765,000 12,429 $ 107,350,000 $ 25,587,558 $ 19,540,000 $ 2,617,555
70
CITY OF MIRAMAR, FLORIDA NOTES
NOTE 8. LONG-TERM OBLIGATIONS (CONTINUED)
H. Summary of Annual Debt Service Requirements (CONTINUED)
Business-TypeActivities Revenue Bonds Loans Payable FiscalYear Ended Principal Interest Principal * Interest 2024 $ 1,820,000 $ 1,503,242 $ 3,319,521 $ 563,780 2025 1,895,000 1,424,128 3,366,429 516,872 2026 1,965,000 1,341,434 3,414,086 469,215 2027 2,055,000 1,255,035 2,917,811 420,797 2028 2,155,000 1,164,542 2,405,176 388,740 2029-2033 12,205,000 4,316,024 12,433,230 1,536,348 2034-2038 12,160,000 1,478,782 13,075,488 828,298 2039-2043 — — 7,728,184 148,076 $ 34,255,000 $ 12,483,187 $ 48,659,926 $ 4,872,127
TO BASIC FINANCIAL STATEMENTS
71
SEPTEMBER 30, 2023
CITY OF MIRAMAR, FLORIDA
NOTES TO BASIC FINANCIAL STATEMENTS SEPTEMBER 30, 2023
I. Obligations Under Financing Agreements
The City finances the acquisition of certain equipment and vehicles through financing agreements. The principal balances owed on the governmental activities financing agreement liabilities at September 30, 2023 follows:
Seven (7) year financing agreement, payable in quarterly installments of $67,670, interest at 1.842% per annum. The financing agreement is collateralized by the mobile and portable radio equipment purchased. In the event of a default, the lender may provide a written notice to declare all amounts then due under the financing agreement, and all remaining payments due during the fiscal year in effect when the default occurs to be immediately due and payable, or request by written notice that the City promptly deliver the equipment to the lender. $ 267,592
Four (4) year financing agreement, payable in annual installments of $747,804, interest at 0% per annum. The financing agreement is collateralized by the Network Switch system purchased. In the event of a default, the lender, by written notice to the City, may declare all payments and other amounts payable by the City thereunder to the end of the then-current budget year of the City to be due, and such amounts shall thereafter bear interest at the rate of 12% per annum or the maximum rate permitted by applicable law, whichever is less. The lender may also terminate the property schedule. 2,243,413
Seventeen and One-Half (17.5) year financing agreement, payable in semi-annual installments, interest at 1.90% per annum. The financing agreement is collateralized by the Guaranteed Energy Savings Equipment. In the event of a default, the lender may terminate the property schedule, and may require the City, at the City's expense to promptly return any or all of the property to the possession of the lender. 6,292,092
Five (5) year financing agreement, payable in quarterly installments of $41,592, interest at 2.803% per annum. The financing agreement is collateralized by the FF Self-contained Breathing Apparatus. In the event of a default, the lender may terminate the property schedule, and may require the City, at the City's expense to promptly return any or all of the property to the possession of the lender. 82,318 $ 8,885,415
NOTE 8.
LONG-TERM OBLIGATIONS (CONTINUED)
72
CITY OF MIRAMAR, FLORIDA NOTES TO BASIC FINANCIAL STATEMENTS SEPTEMBER 30, 2023
I. Obligations Under Financing Agreements (Continued)
Annual finance agreement minimum payments and the present value of said minimum payments follows:
- 2038
Total minimum payments per financing agreement 9,976,737 Less amount representing interest (1,091,322) Present value of minimum required payments $ 8,885,415
The net book value of assets acquired through financing agreements as of September 30, 2023, follows: Assets: Equipment $ 6,389,545 Less accumulated depreciation (4,343,789) Total net book value $ 2,045,756
NOTE 8. LONG-TERM OBLIGATIONS (CONTINUED)
Governmental FiscalYear
Activities 2024 $
2025 1,138,414 2026 1,150,283 2027 414,703 2028 427,294
2034
2,715,477 2039 310,851
Ended
1,480,756
2029 - 2033 2,338,959
73
CITY OF MIRAMAR, FLORIDA
SEPTEMBER 30, 2023
J. Obligations Under Leases
The City has entered into agreements to lease certain equipment and building space. The lease agreements qualify as other than short term leases under GASB Statement No. 87 and have been recorded at the present value of the future minimum payments as of the date of inception. The lease liability is calculated using an implicit rate ranging from .33% to 2.66%, which represent the City's incremental borrowing rates.
The annual minimum lease payments and the present value of minimum lease payments related to the City's lease liability as of September 30, 2023 follows:
The net book value of assets acquired through leases as of September 30, 2023, follows:
1,340,078
NOTE 8. LONG-TERM OBLIGATIONS (CONTINUED)
Governmental Fiscal Year Ended Activities 2024 $ 270,988 2025 154,770 2026 128,059 2027 133,181 2028 138,508 2029 106,967 Total minimum lease payments 932,473 Less amount representing interest (57,520) Present value of minimum lease payments $ 874,953
Assets: Equipment $ 284,387 Building 1,055,691
Less
Total net book value $
accumulated amortization (495,369)
844,709
NOTES TO BASIC FINANCIAL STATEMENTS
74
CITY OF MIRAMAR, FLORIDA
SEPTEMBER 30, 2023
NOTE 8. LONG-TERM OBLIGATIONS (CONTINUED)
K. Obligation Under Subscriptions
The City entered into subscription agreements for the use of several information technology software. These agreements qualify as other than short term leases under GASB Statement No. 96, Subscription Based Information Technology Arrangements (SBITA) and have been recorded at the present value of the future minimum payments as of the date of inception. The SBITA liability is calculated using an implicit rate ranging from .33% to 2.66%, which represent the City's incremental borrowing rates.
The annual minimum SBITA payments and the present value of minimum SBITA payments related to the City's SBITA liability as of September 30, 2023 follows:
FiscalYear Ended GovernmentalType Activities BusinessType Activities 2024 $ 662,313 $ 56,650 2025 663,313 56,650 2026 144,996 — 2027 144,996 — Total SBITA payments 1,615,618 113,300 Less Interest (92,510) (4,746) Present Value of Minimum SBITAPayments $ 1,523,108 $ 108,554 Right
GovernmentalType Activities BusinessType Activities Equipment $ 3,080,969 $ 165,204 Less Accumulated Amortization (1,262,491) (13,767) Total Net Book Value $ 1,818,478 $ 151,437
to Use SBITA:
NOTES TO BASIC FINANCIAL STATEMENTS
75
CITY OF MIRAMAR, FLORIDA
NOTES TO BASIC FINANCIAL STATEMENTS SEPTEMBER 30, 2023
L. Pledged Revenues
The City issued bonds, notes and loans that are secured by a pledge of specific revenues. Total pledged revenues to repay the principal and interest of those liabilities as of September 30,2023, are as follows:
Description of debt
Pledged revenues
Purpose of debt
Governmental Activities-Direct Borrowing Revenue Bonds Revenue Notes
Special Obligation and Refunding Revenue Bonds, Series 2021 Capital Improvement Refunding Revenue Bonds, Series 2015
Impact Fees- Parks & Recreation, Police & Fire Legally available Non-Ad Valorem Revenues
Partial Refunding of Special Obligation and Refunding Bonds, Series 2013
Communication services tax
Local government 1/2 cent sales tax UtilityTax-Electricity
Refunding Public ServiceTax Revenue Bonds Series 2003 and Capital Improvement Revenue Bonds, Series 2005
Description of debt Special Obligation Revenue Note, A Series 2019 Special Obligation Revenue Note, B Series 2019
Pledged revenues
Purpose of debt
Terms of commitment
Legally available non-Ad Valorem revenues
Various Capital Projects
Legally available non-Ad Valorem revenues
Various Capital Projects
NOTE 8. LONG-TERM OBLIGATIONS (CONTINUED)
Current revenue pledged $1,678,729 $26,663,826 Current debt service 1,678,729 5,944,225 Total future revenue pledged 60,169,472 72,768,088
Terms of commitment 2021-2038 2015-2036 Percentage of debt to pledged revenues (current year) 100.00% 23.97%
Current revenue pledged $298,688 $313,221 Current debt service 298,688 313,221 Total future revenue pledged 4,931,712 5,122,625
2020-2040
of debt to pledged revenues (current year) 100.00% 100.00%
2020-2040
Percentage
76
CITY OF MIRAMAR, FLORIDA
NOTES TO BASIC FINANCIAL STATEMENTS
SEPTEMBER 30, 2023
NOTE 8. LONG-TERM OBLIGATIONS (CONTINUED)
L. Pledged Revenues (Continued)
Governmental Activities-Direct Borrowing (continued)
Description of debt Special Obligation Revenue Note B Series 2021 Special Obligation Revenue Note C, Series 2021
Pledged revenues
Purpose of debt
Legally available Non-Ad Valorem Revenues Legally available Non-Ad Valorem Revenues
Various Capital Projects Refunding of Special Obligation Revenue Note, Series 2017
Terms of commitment 2021-2037 2021-2027
of
to
Business-type Activities
Description of debt Utility System Revenue Bonds Series 2015 and 2017 and Water and Sewer State Revolving Loans, issued 2005-2017
Current revenue pledged $63,848,244
100,270,240
Pledged revenues Utility and stormwater system revenues
Purpose of debt
Various Infrastructure, Wastewater and Stormwater Management projects
Terms of commitment 2005 – 2038
Percentage of debt to pledged revenues (current year) 10.37%
Current revenue pledged $602,516 $1,096,236 Current debt service 602,516 1,096,236 Total future revenue pledged 8,245,108 3,858,109
Percentage
year) 100.00% 100.00%
debt
pledged revenues (current
Current debt
Total
pledged
service 6,570,514
future revenue
77
CITY OF MIRAMAR, FLORIDA
NOTES
A. DEFINED BENEFIT PLANS
The City maintains three separate defined benefit single-employer pension plans (Consolidated Retirement Plan and Trust, Police Officers’ Retirement Plan, and the Firefighters’ Retirement Plan) which cover substantially all of its full-time employees. The City accounts for these plans as pension trust funds.
Summary of Significant Accounting Policies
Basis of Accounting - The pension plans are accounted for on the accrual basis of accounting. For the purposes of measuring the net pension liability, deferred outflows of resources and deferred inflows of resources related to pensions, and pension expense, information about the fiduciary net position of the City’s Consolidated Retirement Plan and Trust, Police Officers’ Retirement Plan, and Firefighters ‘Retirement Plan (the Plans) and additions to/deductions from the Plans’ fiduciary net position have been determined on the same basis as they are reported by the Plans. For this purpose, benefit payments (including refunds of employee contributions) are recognized when due and payable in accordance with the benefit terms.
Consolidated Retirement Plan and Trust
1. Plan Description - The Consolidated Retirement Plan and Trust (the Plan) is a single-employer defined benefit pension plan that covers all City employees, except for police, firefighters, and certain appointed employees and elected officials. The Plan was established pursuant to City Ordinance No. 81-12 (as amended), with the most recent amendment being Ordinance No. 22-08 passed and adopted on March 1, 2022 with an effective date of February 1, 2022. Ordinance 22-08 combined the General Employees and Management Retirement Plans into a single Plan renamed the City of Miramar Consolidated Retirement Plan and Trust.. The Plan is also governed by certain provisions of Chapter 112, Florida Statutes. The Board of Trustees for the Plan administers the Plan. Plan provisions may be amended by City ordinance, as governed by guidelines of the State of Florida.
2. Benefits Provided - With the exception of those grandfathered members of the former Management Retirement Plan, retirement and death benefits are provided to Plan members and beneficiaries as follows: Normal retirement is at the earlier of attainment of age 65 and 7 years of credited service, or 20 years of credited service regardless of age. Ordinance No. 19-09 adopted on November 28, 2018, increased the benefit multiplier for employees retiring after October 1, 2018 to 3.25% for the first 20 years of service and 3% thereafter, capped at 100% of Average Monthly Earnings (AME). This formula is applied to both past and future service. Average monthly earnings are the average earnings during the three highest years of credited service.
Effective February 1, 2022, benefits previously paid by the Management Plan shall be paid by the Consolidated Plan. Grandfathered members of the Management Plan members will retain their existing Management Plan benefits. A member of the former Management Plan may retire on the first day of the month following the earlier of: the date upon which a member completes 20 years of credited service, regardless of age; or the date upon which the member attains age 55 with ten years of credited service or the date upon which the member attains age 62 with five years of credited service. Normal retirement benefits are 3% of final monthly compensation for each year of credited service plus an increase of 0.2% for every year of additional service above 5 years to a maximum of 4% of final compensation times credited service.
NOTE 9. EMPLOYEE RETIREMENT SYSTEMS AND PENSION PLANS
78
TO BASIC FINANCIAL STATEMENTS SEPTEMBER 30, 2023
CITY OF MIRAMAR, FLORIDA NOTES
NOTE 9. EMPLOYEE RETIREMENT SYSTEMS AND PENSION PLANS (CONTINUED)
A. DEFINED BENEFIT PLANS (Continued)
The Plan issues a publicly available financial report that includes financial statements and required supplementary information for the Plan. The report may be obtained by writing to the Plan administrator.
City of Miramar Pension Trust for General Employees’ 3810 Inverrary Boulevard, Suite 303 Lauderhill, Florida 33319
3. Employees Covered by Benefit Terms - As of the October 1, 2022 actuarial valuation, membership in the Consolidated Retirement Plan and Trust consisted of the following:
Retirees and beneficiaries currently receiving benefits
employees entitled to but not yet receiving benefits
(including transfers)
4. Contributions - With the exception of those grandfathered members of the former Management Retirement Plan, Plan members are required to contribute 9.5% of earnings which is defined as basic rate of pay, excluding overtime, bonuses, commissions, payments for unused leave and any other extraordinary compensation. Plan members grandfathered under the former Management Retirement Plan are required to contribute 13.515% of their compensation.
Pursuant to Florida law, the City of Miramar is ultimately responsible for the actuarial soundness of the Plan. Therefore, each year, the City must contribute an amount determined by the Trustees in conjunction with the Plan's actuary to be sufficient, along with the employee's contribution, to fund the defined benefits under the Plan. Employer contributions for the year ended September 30, 2023, determined using the actuarial valuation dated October 1, 2021, were $$9,508,735 or 25.0% of covered payroll.
5. Deferred Retirement Option Plan - The deferred retirement option plan (DROP) is available to all Plan participants who have attained their normal retirement age. Upon electing to participate in the DROP, members are considered to have retired for pension purposes of the pension plan but continue to remain in active employment with the City. The benefits accumulate in a DROP account and continue to accrue interest until they retire from the City at which time DROP benefits will be paid. Maximum duration of participation is five years and the election is irrevocable. The balance held by the Consolidated Plan at September 30, 2023 pursuant to the DROP is $9,841,098.
6. Net Pension Liability - The Consolidated Retirement Plan’s net pension liability was measured as of September 30, 2022, and the total pension liability used to calculate the net pension liability was determined by an actuarial valuation as of that date.
Consolidated Retirement Plan
346
50 Active
553 949
Inactive
Employees
BASIC
79
TO
FINANCIAL STATEMENTS SEPTEMBER 30, 2023
NOTE 9. EMPLOYEE RETIREMENT SYSTEMS AND PENSION PLANS (CONTINUED)
A. DEFINED BENEFIT PLANS (Continued)
Consolidated Retirement Plan and Trust (Continued)
7. Actuarial assumptions - The total pension liability was determined by an actuarial valuation as of September 30, 2022, using the following actuarial assumptions, applied to all prior periods included in the measurement:
Acturial Assumptions:
Assumed rate on investments 7.00% (including inflation)
Annual salary increases 4.00%-7.50% (including inflation)
Inflation rate 2.50%
Mortality: The healthy post-retirement mortality table is the PUB-2010 Headcount Weighted Mortality Tables with mortality improvements projected to all future years after 2010 using Scale MP-2018. For females, the base mortality rates are from the Headcount Weighted General Below Median Healthy Retiree Female Table. For males, the base mortality rates are from the Headcount Weighted General Below Median Healthy Retiree Male Table, set back 1 year. These are the same rates used for Regular Class members (other than K-12 School Instructional Personnel) of the Florida Retirement System (FRS) in the July 1, 2021 FRS actuarial valuation.
The long-term expected rate of return on pension plan investments was determined using a building-block method in which best-estimate ranges of expected future real rates of return (expected returns, net of pension plan investment expense and inflation) are developed for each major asset class. These ranges are combined to produce the long-term expected rate of return by weighting the expected future real rates of return by the target asset allocation percentage and by adding expected inflation. Best estimates of arithmetic real rates of return for each major asset class included in the pension plan’s target asset allocation as of September 30, 2023 are summarized in the following table:
8. Discount Rate - The discount rate used to measure the total pension liability was 7.00%. The projection of cash flows used to determine the discount rate assumed that plan member contributions will be made at the current contribution rate and that City contributions will be made at rates equal to the difference between actuarially determined contribution rates and the member rate. Based on those assumptions, the pension plan’s fiduciary net position was projected to be available to make all projected future benefit payments of current plan members. Therefore, the long-term expected rate of return on pension plan investments was applied to all periods of projected benefit payments to determine the total pension liability.
Long-term Expected Asset Class Real Rate of Return Domestic equity 10.00% International equity 11.00% Fixed Income 5.00% Real estate 7.00%
80
CITY OF MIRAMAR, FLORIDA NOTES TO BASIC FINANCIAL STATEMENTS SEPTEMBER 30, 2023
CITY OF MIRAMAR, FLORIDA NOTES TO BASIC FINANCIAL STATEMENTS
SEPTEMBER 30, 2023
NOTE 9. EMPLOYEE RETIREMENT SYSTEMS AND PENSION PLANS (CONTINUED)
A. DEFINED BENEFIT PLANS (Continued)
Consolidated Retirement Plan and Trust (Continued)
9. Changes in the Net Pension Liability (continued)
Retirement Plan and Trust Increase (Decrease)
10. Sensitivity of the Net Pension Liability to Changes in the Discount Rate - The following table illustrates the impact of interest rate sensitivity on the net pension liability as of September 30, 2023:
Consolidated
Total Pension Liability Plan Fiduciary Net Position Net Pension Liability (a) (b) (a) – (b) Balance
$239,346,044 $223,673,419 $ 15,672,625 Changes for the year: Service cost 9,056,351 — 9,056,351 Interest 17,025,267 — 17,025,267 Differences between expected and actual experience 7,126,721 — 7,126,721 Contributions – employee — 5,870,196 (5,870,196) Contributions – employer — 9,578,031 (9,578,031) Net investment losses — (25,903,530) 25,903,530 Benefit payments, including refunds of employee contributions (10,368,604) (10,368,604) — Administrative expense — (363,983) 363,983 Net changes 22,839,735 (21,187,890) 44,027,625 Balances
at October 1, 2022
at September 30, 2023 $262,185,779 $202,485,529 $ 59,700,250
Consolidated Retirement Plan
Decrease Current Rate
Increase 6.00% 7.00% 8.00% Net
and Trust 1%
1%
Pension Liability $89,957,211 $59,700,250 $34,449,024
81
CITY OF MIRAMAR, FLORIDA
NOTES TO BASIC FINANCIAL STATEMENTS
SEPTEMBER 30, 2023
NOTE
9. EMPLOYEE RETIREMENT SYSTEMS AND PENSION PLANS (CONTINUED)
A. DEFINED BENEFIT PLANS
(Continued)
Consolidated Retirement Plan and Trust (Continued)
11. Pension Expense and Deferred Outflows of Resources and Deferred Inflows of Resources Related to Pensions - For the year ended September 30, 2023, the City recognized pension expense of $10,361,471. At September 30, 2023, the City reported deferred outflows of resources and deferred inflows of resources related to pensions from the following sources:
Consolidated Retirement Plan and Trust Deferred Outflow of Resources Deferred Inflow of Resources
Differences between expected and actual experience $ 11,787,681 $ 250,595
Assumption changes — 777,440
Net difference between projected and actual earnings on pension plan investments 16,995,048 —
Employer contributions made subsequent to the measurement date 9,411,228 — Total $ 38,193,957 $ 1,028,035
The deferred outflows of resources related to the Consolidated Retirement Plan and Trust, totaling $9,411,228, resulting from City contributions to the Plan subsequent to the measurement date, will be recognized as a reduction of the net pension liability for the fiscal year ended September 30, 2024. Other amounts reported as deferred outflows of resources and as deferred inflows of resources related to pensions will be recognized in pension expense as follows:
Year ended September 30:
2024
$6,419,219
2025 5,613,190
2026 5,683,721
2027 9,898,823
2028 139,741
Thereafter
12. Investment Rate of Return - For the year ended September 30, 2023, the annual money-weighted rate of return on pension plan investments, net of pension plan investment expense, was 5.93%. The money-weighted rate of return expresses investment performance, net of investment expense, adjusted for the changing amounts actually invested.
82
NOTE 9. EMPLOYEE RETIREMENT SYSTEMS
AND PENSION PLANS (CONTINUED)
A. DEFINED BENEFIT PLANS (Continued)
Police Officers’ Retirement Plan
1. Plan Description - The Police Officers’ Retirement Plan and Trust (the Plan) is a single-employer defined benefit pension plan that covers substantially all of the City’s certified police officers. The Plan was established pursuant to City Ordinance No. 80-21 (as amended). The Plan is also governed by certain provisions of Chapter 185, Florida Statutes. The Board of Trustees for the Plan administers the Plan. Plan provisions may be amended by City ordinance, as governed by guidelines of the State of Florida.
2. Benefits Provided - The Plan provides retirement, disability, and death benefits to Plan members and beneficiaries.
In June 2008, pursuant to Ordinance No. 08-20, the City Commission approved a second tier for the Plan. Tier One members include all officers hired prior to June 20, 2008, and Tier Two members are those hired after such date. Tier One members may retire the earlier of the date on which they obtain 20 years of credited service or age 55 and completion of 10 years of credited service. Normal retirement benefits are 3.25% of average monthly earnings times credited service up to a maximum benefit of 80% for participants retiring on or after October 1, 1994. Tier Two members may retire the earlier of the date on which they obtain 20 years of credited service or age 55 and completion of 10 years of credited service. Normal retirement benefits are 3.00% of average monthly earnings times credited service subject to a maximum of 80% of average monthly earnings.
Effective October 1, 2001, an annual 2% COLA was created for all retirees and DROP participants who were active employees on or after October 1, 2001, including DROP participants who had entered the DROP prior to October 1, 2001. COLA payments shall commence five (5) years after retirement or entry into the DROP. Tier Two members are not eligible for COLA.
The Plan issues a publicly available financial report that includes financial statements and required supplementary information for the Plan. The report may be obtained by writing to the Plan administrator.
City of Miramar Police Officers’ Retirement Plan and Trust
6861 SW 196th Avenue, Suite 402 Fort Lauderdale, Florida 33332
3. Employees Covered by Benefit Terms - As of the October 1, 2022 actuarial valuation, membership in the Police Officers’ Retirement Plan consisted of the following:
Police Officers’ Retirees
beneficiaries currently receiving benefits 124 Inactive employees entitled to
yet receiving benefits 44 Active Employees 173 341
OF
NOTES TO BASIC FINANCIAL STATEMENTS SEPTEMBER 30, 2023 83
and
but not
CITY
MIRAMAR, FLORIDA
CITY
NOTE 9. EMPLOYEE RETIREMENT SYSTEMS AND PENSION PLANS
A. DEFINED BENEFIT PLANS (Continued)
Police Officers’ Retirement Plan (Continued)
4. Contributions - Both Tier One and Tier Two Plan members are required to contribute 13.40% of their basic annual compensation on a pick-up basis. Pursuant to Florida Statutes Chapter 185, premium taxes on casualty insurance contracts are collected by the State and are remitted to the Plan. This amount totaled $1,521,206 for the year ended September 30, 2023. This amount was recognized as an expenditure and revenue in the General Fund. The City is expected to contribute after offset by the allowable State contribution, such additional amounts as are necessary on an actuarial basis to fund the Plan’s current service costs and to provide for benefits under the Plan not met by member contributions. Employer contributions for the year ended September 30, 2023, determined using the actuarial valuation dated October 1, 2021, were $9,163,095 or 69.2% of covered payroll.
5. Deferred Retirement Option Plan - The deferred retirement option plan (DROP) is available to all Police officers’ who have attained their normal retirement age. Upon electing to participate in the DROP, members are considered to have retired for pension purposes of the pension plan but continue to remain in active employment with the City. The benefits accumulate in a DROP account and continue to accrue interest until they retire from the City at which time DROP benefits will be paid. Maximum duration of participation is eight years and the election is irrevocable. The balance held by the Police Officers’ Retirement Plan at September 30, 2023, pursuant to the DROP is $69,605,851.
6. Net Pension Liability - The Police Officers’ Retirement Plan’s net pension liability was measured as of September 30, 2022, and the total pension liability used to calculate the net pension liability was determined by an actuarial valuation as of that date.
7. Actuarial assumptions - The total pension liability was determined by an actuarial valuation as of September 30, 2022, using the following actuarial assumptions, applied to all prior periods included in the measurement:
Acturial Assumptions:
Assumed
Mortality rates were based on the mortality table used by FRS (Florida Retirement System) as of the July 1, 2021 actuarial valuation.
• Pre-Retirement:
• Female Non-Disabled: PUB-2010 Headcount Weighted Safety Employee Female Table, set forward 1 year, Scale MP-2018
• Male Non-Disabled: PUB-2010 Headcount Weighted Safety Below Median Employee Male Table, set forward 1 year, scale MP-2018
• Post-Retirement:
• Female Non-Disabled: PUB-2010 Headcount Weighted Safety Healthy Retiree Female Table, set forward 1 year, Scale MP-2018
• Male Non-Disabled: PUB-2010 Headcount Weighted Safety Below Median Healthy Retiree Male Table, set forward 1 year, scale MP-2018
(CONTINUED)
rate of return on investments 7.00% (including inflation) Annual salary increases command staff 3.00% (including inflation) Annual salary increases other Officers 5.25% (including inflation) Inflation rate 3.00%
84
OF MIRAMAR, FLORIDA NOTES TO BASIC FINANCIAL STATEMENTS SEPTEMBER 30, 2023
CITY OF MIRAMAR, FLORIDA
NOTES TO BASIC FINANCIAL STATEMENTS
SEPTEMBER 30, 2023
NOTE 9. EMPLOYEE RETIREMENT SYSTEMS AND PENSION PLANS (CONTINUED)
A. DEFINED BENEFIT PLANS
(Continued)
Police Officers’ Retirement Plan (Continued)
7. Actuarial assumptions (Continued)
• Pre-Retirement & Post-Retirement Retirement:
• Female Disabled: 80% PUB-2010 Headcount Weighted General Disabled Retiree Female Table; 20% PUB-2010 Headcount Weighted Safety Disabled Retiree Female Table, Scale MP-2018
• Male Disabled: 80% PUB-2010 Headcount Weighted General Disabled Retiree Male Table; 20% PUB-2010 Headcount Weighted Safety Disabled Retiree Male Table, Scale MP-2018
The long-term expected rate of return on pension plan investments was determined using a building-block method in which best-estimate ranges of expected future real rates of return (expected returns, net of pension plan investment expense and inflation) are developed for each major asset class. The ranges are combined to produce the long-term expected rate of return by weighting the expected future real rates of return by the target asset allocation percentage and by adding expected inflation.
Best estimates of arithmetic real rates of return for each major asset class included in the Plan’s target asset allocation as of September 30, 2023, are summarized in the following table:
8. Discount Rate - The discount rate used to measure the total pension liability was 7.00%. The projection of cash flows used to determine the discount rate assumed that plan member contributions will be made at the current contribution rate and that City contributions will be made at rates equal to the difference between actuarially determined contribution rates and the member rate. Based on those assumptions, the pension plan’s fiduciary net position was projected to be available to make all projected future benefit payments of current plan members. Therefore, the long-term expected rate of return on pension plan investments was applied to all periods of projected benefit payments to determine the total pension liability.
Long-term Expected Long-term Expected Asset Class Real Rate of Return Asset Class Real Rate of Return U.S. Large Cap Equity 4.91% Preferred/convertibles 3.00% U.S. Small/Mid Cap Equity 5.29% U.S. High yield 4.08% International Equity 5.32% Private equity funds 7.67% Fixed income fund 2.30% Private credit funds 5.78% Emerging markets equity 6.13% Real estate 3.79% Absolute returns 3.72% U.S. Cash and equivalent 0.77% Global infrastructure 4.60%
85
SEPTEMBER 30, 2023
NOTE 9. EMPLOYEE RETIREMENT SYSTEMS AND PENSION PLANS (CONTINUED)
A. DEFINED BENEFIT PLANS (Continued)
Police Officers’ Retirement Plan (Continued)
9. Changes in the Net Pension Liability
Officers' Plan Increase (Decrease)
10. Sensitivity of the Net Pension Liability to Changes in the Discount Rate - The following table illustrates the impact of interest rate sensitivity on the net pension liability as of September 30, 2023:
Police
Total Pension Liability Plan Fiduciary Net Position Net Pension Liability (a) (b) (a) – (b) Balance at October
$300,736,506 $256,959,885 $ 43,776,621 Changes for the year: Service cost 4,872,499 — 4,872,499 Interest 21,688,098 18,077,352 3,610,746 Differences between expected and actual experience 9,641,202 — 9,641,202 Changes of assumptions — — — Contributions – employee — 3,232,165 (3,232,165) Contributions – employer — 10,452,728 (10,452,728) Net investment losses — (39,300,032) 39,300,032 Benefit payments, including refunds of employee contributions (10,840,461) (10,840,461) — Administrative expense — (268,392) 268,392 Net changes 25,361,338 (18,646,640) 44,007,978 Balances
$326,097,844 $238,313,245 $ 87,784,599
1, 2022
at September 30, 2023
Police Officers' Plan 1% Decrease Current Rate 1% Increase 6.00% 7.00% 8.00% Net Pension Liability $124,368,541 $87,784,599 $58,363,574
BASIC
CITY OF MIRAMAR, FLORIDA NOTES TO
FINANCIAL STATEMENTS
86
CITY OF MIRAMAR, FLORIDA
SEPTEMBER 30, 2023
NOTE 9. EMPLOYEE RETIREMENT SYSTEMS AND PENSION PLANS (CONTINUED)
A. DEFINED BENEFIT PLANS
(Continued)
Police Officers’ Retirement Plan (Continued)
11. Pension Expense and Deferred Outflows of Resources and Deferred Inflows of Resources Related to Pensions - For the year ended September 30, 2023, the City recognized a pension expense of $11,198,884. At September 30, 2023, the City reported deferred outflows of resources and deferred inflows of resources related to pensions from the following sources:
Police Officers’ Plan
Differences between expected and actual experience $ 15,339,069 $ 302,162
changes — 3,414,596 Net difference between projected and actual earnings on pension plan investments 14,144,217 —
Employer contributions made subsequent to the measurement date 9,163,095 —
The deferred outflows of resources related to the Police Officers’ Retirement Plan, totaling $9,163,095, resulting from City contributions to the Plan subsequent to the measurement date, will be recognized as a reduction of the net pension liability for the fiscal year ended September 30, 2024. Other amounts reported as deferred outflows of resources and as deferred inflows of resources related to pensions will be recognized in pension expense as follows:
Year ended September 30: 2024
$5,876,243 2025 4,529,775
2026 2,932,329
2027 9,288,101 2028 1,762,769
Thereafter 1,377,311
12. Investment Rate of Return - For the year ended September 30, 2023, the annual money-weighted rate of return on pension plan investments, net of pension plan investment expense was 8.30%. The money-weighted rate of return expresses investments performance, net of investment expense, adjusted for the changing amounts actually invested.
Deferred Outflow of Resources Deferred Inflow of Resources
Assumption
Total $ 38,646,381 $ 3,716,758
NOTES TO BASIC FINANCIAL STATEMENTS
87
CITY OF MIRAMAR, FLORIDA
2023
NOTE 9. EMPLOYEE RETIREMENT SYSTEMS AND PENSION PLANS (CONTINUED)
A. DEFINED BENEFIT PLANS (Continued)
Firefighters’ Retirement Plan
1. Plan Description - The Firefighters’ Retirement Plan (the Plan) is a single-employer defined benefit pension plan that covers substantially all of the City’s certified firefighters. The Plan was established pursuant to City Ordinance No. 81-32 (as amended) which became effective July 7, 1981. The Plan is also governed by certain provisions of Chapter 175, Florida Statutes. The Plan is administered by the Board of Trustees for the Plan. Plan provisions may be amended by City ordinance, as governed by guidelines of the State of Florida.
2. Benefits Provided - The Plan provides retirement, disability, and death benefits to Plan members and beneficiaries. Participants who have completed 25 years of service or attained age 55 with 10 years of credited service are eligible for normal retirement benefits. The normal retirement benefit multiplier is 3% of the final monthly compensation. Immediate payments are calculated in the same manner as the normal retirement benefit reduced by 3% for each year by which their age at retirement precedes their normal retirement age. Deferred payments are payable at age 55 and calculated in the same manner as the normal retirement benefit.
The Plan issues a publicly available financial report that includes financial statements and required supplementary information for the Plan. The report may be obtained by writing to the Plan administrator.
City of Miramar Firefighters’ Retirement Plan
4360 Northlake Boulevard, Suite 206 Palm Beach Gardens, Florida 33410
3. Employees Covered by Benefit Terms - As of the October 1, 2022 actuarial valuation, membership in the Firefighters’ Retirement Plan consisted of the following:
and beneficiaries currently receiving benefits
to but not yet receiving
4. Contributions - Plan members are required to contribute 8.47% of their base salaries or wages on a monthly basis. If a member terminates their employment before accumulating aggregate time of 10 years toward retirement, the accumulated contributions will be returned to the members with 5.5% interest. Pursuant to Florida Statutes Chapter 175, contributions from the State of Florida Department of Insurance consist of 1.85% excise tax imposed upon certain property insurance companies on the gross amount of premiums from policy holders on all premiums collected on property insurance policies covering property within the City. This amount totaled $2,128,056 for the year ended September 30, 2023. This amount was recognized as an expenditure and revenue in the General Fund. The City is required to make annual contributions in the amount of the difference between allowable State contributions and the total cost for the plan year as shown by an actuarial valuation report. The total cost is equal to the normal cost plus the amount required to amortize unfunded actuarial liabilities over 15 years as a level percentage of payroll. Employer contributions for the year ended September 30, 2023, determined using the actuarial valuation dated October 1, 2021, were $9,519,804 or 91.13% of covered payroll.
Retirees
70 Inactive employees
43 Active Employees 111 224
Firefighters’
entitled
benefits
88
NOTES TO BASIC FINANCIAL STATEMENTS SEPTEMBER 30,
CITY
NOTE
9.
30, 2023
EMPLOYEE RETIREMENT SYSTEMS AND PENSION PLANS (CONTINUED)
A. DEFINED BENEFIT PLANS (Continued)
Firefighters’ Retirement Plan (Continued)
5. Deferred Retirement Option Plan - The deferred retirement option plan (DROP) is available to all Firefighters’ who have attained their normal retirement age. Upon electing to participate in the DROP, members are considered to have retired for pension purposes of the pension plan but continue to remain in active employment with the City. The benefits accumulate in a DROP account and continue to accrue interest until they retire from the City at which time DROP benefits will be paid. Maximum duration of participation is five years and the election is irrevocable. The balance held by the Firefighters’ Retirement Plan at September 30, 2023, pursuant to the DROP is $41,974,035.
6. Net Pension Liability - The Firefighters’ Retirement Plan’s net pension liability was measured as of September 30, 2022, and the total pension liability used to calculate the net pension liability was determined by an actuarial valuation as of that date.
7. Actuarial assumptions - The total pension liability was determined by an actuarial valuation as of September 30, 2022, using the following actuarial assumptions, applied to all prior periods included in the measurement:
Acturial
Assumptions:
Mortality rates were based on the mortality table used by FRS (Florida Retirement System) as of the July 1, 2021 actuarial valuation.
• Pre-Retirement:
◦ Female Non-Disabled: PUB-2010 Headcount Weighted Safety Employee Female Table, set forward 1 year, Scale MP-2018
◦ Male Non-Disabled: PUB-2010 Headcount Weighted Safety Below Median Employee Male Table, set forward 1 year, scale MP-2018
• Post-Retirement:
◦ Female Non-Disabled: PUB-2010 Headcount Weighted Safety Healthy Retiree Female Table, set forward 1 year, Scale MP-2018
◦ Male Non-Disabled: PUB-2010 Headcount Weighted Safety Below Median Healthy Retiree Male Table, set forward 1 year, scale MP-2018
• Pre- Retirement & Post Retirement
◦ Female Disabled: 80% PUB-2010 Headcount Weighted General Disabled Retiree Female Table; 20% PUB-2010 Headcount Weighted Safety Disabled Retiree Female Table, Scale MP-2018
◦ Male Disabled: 80% PUB-2010 Headcount Weighted General Disabled Retiree Male Table; 20% PUB-2010 Headcount Weighted Safety Disabled Retiree Male Table, Scale MP-2018
Assumed rate of return on investments 7.00% Annual salary increases 5.00% Inflation rate 3.00%
SEPTEMBER
89
OF MIRAMAR, FLORIDA NOTES TO BASIC FINANCIAL STATEMENTS
CITY OF MIRAMAR, FLORIDA
NOTES TO BASIC FINANCIAL STATEMENTS SEPTEMBER 30, 2023
PENSION PLANS (CONTINUED)
A. DEFINED BENEFIT PLANS (Continued)
Firefighters’ Retirement Plan (Continued)
7. Actuarial assumptions (continued) - The long-term expected rate of return on pension plan investments was determined using a building-block method in which best-estimate ranges of expected future real rates of return (expected returns, net of pension plan investment expense and inflation) are developed for each major asset class. These ranges are combined to produce the long-term expected rate of return by weighting the expected future real rates of return by the target asset allocation percentage and by adding expected inflation. Best estimates of arithmetic real rates of return for each major asset class included in the pension plan’s target asset allocation as of September 30, 2023, are summarized in the following table:
8. Discount Rate - The discount rate used to measure the total pension liability was 7.00%. The projection of cash flows used to determine the discount rate assumed that plan member contributions will be made at the current contribution rate and that City contributions will be made at statutorily required rates, actuarially determined. Based on those assumptions, the pension plan’s fiduciary net position was projected to be available to make all projected future benefit payments of current plan members. Therefore, the long-term expected rate of return on pension plan investments was applied to all periods of projected benefit payments to determine the total pension liability.
NOTE 9. EMPLOYEE RETIREMENT SYSTEMS AND
Long-term Expected Asset Class Real Rate of Return Large Cap Equity 8.00% Mid Cap Equity 8.30% Small Cap Equity 8.50% International developed markets 4.70% Emerging markets 7.10% Real Estate 5.00% Fixed Income 0.40%
90
CITY OF MIRAMAR, FLORIDA NOTES
SEPTEMBER 30, 2023
A. DEFINED BENEFIT PLANS (Continued)
Firefighters’ Retirement Plan (Continued)
9. Changes in the Net Pension Liability Firefighters' Plan Increase (Decrease)
10. Sensitivity of the Net Pension Liability to Changes in the Discount Rate - The following table illustrates the impact of interest rate sensitivity on the net pension liability as of September 30, 2023
NOTE 9. EMPLOYEE RETIREMENT SYSTEMS AND PENSION PLANS (CONTINUED)
Total Pension Liability Plan Fiduciary Net Position Net Pension Liability (a) (b) (a) – (b) Balance at October 1, 2022 $ 257,304,335 $ 235,823,392 $ 21,480,943 Changes for the year: Service cost 3,504,612 — 3,504,612 Interest 18,687,637 16,682,332 2,005,305 Differences between expected and actual experience 10,025,102 — 10,025,102 Contributions – employee — 1,876,799 (1,876,799) Contributions – employer — 11,037,505 (11,037,505) Net investment losses — (52,460,247) 52,460,247 Benefit payments, including refunds of employee contributions (7,735,608) (7,735,608) — Administrative expense — (187,434) 187,434 Net changes 24,481,743 (30,786,653) 55,268,396 Balances at September
$ 281,786,078 $ 205,036,739 $ 76,749,339
30, 2023
Firefighters' Plan 1% Decrease Current Rate 1% Increase 6.00% 7.00% 8.00% Net Pension Liability $109,014,949 $76,749,339 $50,767,108
TO BASIC FINANCIAL
STATEMENTS
91
CITY OF MIRAMAR, FLORIDA
NOTES TO BASIC FINANCIAL STATEMENTS
SEPTEMBER 30, 2023
NOTE 9. EMPLOYEE RETIREMENT SYSTEMS AND PENSION PLANS (CONTINUED)
A. DEFINED BENEFIT PLANS
(Continued)
Firefighters’ Retirement Plan (Continued)
11. Pension Expense and Deferred Outflows of Resources and Deferred Inflows of Resources Related to Pensions - For the year ended September 30, 2023, the City recognized a pension expense of $10,267,202. At September 30, 2023, the City reported deferred outflows of resources and deferred inflows of resources related to pensions from the following sources:
Firefighters’ Plan
Differences between expected and actual experience $
Net difference between projected and actual earnings on pension plan investments 24,419,457 —
Employer contributions made subsequent to the measurement date 9,519,804 — Total $ 52,356,964 $ 5,282,460
The deferred outflows of resources related to the Firefighters’ Retirement Plan, totaling $9,519,804, resulting from City contributions to the Plan subsequent to the measurement date, will be recognized as a reduction of the net pension liability for the fiscal year ended September 30, 2024. Other amounts reported as deferred outflows and as deferred inflows of resources related to pensions will be recognized in pension expense as follows:
Year ended September 30:
2024 $ 7,327,732
2025 6,180,756
2026 5,671,909
2027 11,386,611
2028 1,019,718
Thereafter 5,967,974
12. Investment Rate of Return - For the year ended September 30, 2023, the annual money-weighted rate of return on pension plan investments, net of pension plan investment expense, was 10.21%. The money-weighted rate of return expresses investments performance, net of investment expense, adjusted for the changing amounts actually invested.
Deferred
Deferred Outflow of Resources
Inflow of Resources
18,248,404 $ 653,933 Assumption changes 169,299 4,628,527
92
NOTE 9. EMPLOYEE RETIREMENT SYSTEMS AND PENSION PLANS (CONTINUED)
A. DEFINED BENEFIT PLANS (Continued)
City of Miramar Excess Benefit Plan
1. Plan Description - The City established, under Ordinance No. 01-43, effective date September 5, 2001, the Excess Benefit Plan as a separate plan to be a separate, unfunded, non-qualified excess benefit plan, containing the terms and provisions set forth in the subpart (Sec. 15-341) and intended to be a qualified governmental excess benefit arrangement as defined in Section 415 (m) (3) of the Internal Revenue Code.
2. Basis of Accounting - The City implemented GASB Statement No. 73, Accounting and Financial Reporting for Pensions and Related Assets That Are Not within the Scope of GASB Statement 68 and Amendments to Certain Provisions of GASB 67 and 68, as it relates to the Excess Benefit Plan. The objective of this statement is to improve financial reporting by establishing a single framework for the presentation of information about pensions which will enhance the comparability of pension-related information reported by state and local government pension plans. The following disclosures related to the Excess Benefit Plan are in accordance with the requirements of GASB Statement No. 73.
3. Excess Benefit Participants - Any member whose retirement benefit, as determined on the basis of all qualified plans maintained by the City without regard to the limitations set forth in the Code and comparable provisions of other qualified plans of the City, exceeds the maximum benefit under Section 415 of the Code. As of the September 30, 2022 measurement date, there were six members in pay status participating in the Excess Benefit Plan.
4. Benefits Provided - An employee benefit participant shall be eligible to receive benefits from the excess benefit plan after termination of employment, as an unrestricted benefit on a monthly basis as would be received under the terms of all qualified plans of the City, that otherwise would have been paid in the absence of IRS Code Section 415 limits.
5. Funding Policy - The City’s Excess Benefit Plan is not funded in a GASB-qualifying trust. The City cannot advance fund assets, or any benefit currently payable under the Plan, and any assets held by the plan during any period can only pay benefits coming due or the expenses of the plan during the period. Contributions by the City are not allowed to accumulate from year to year for purposes of advance funding of any of the Excess Plan liabilities. The City has recorded a liability in the amount of $1,176,532 in the government-wide financial statements that represents the Total Pension Liability of the Plan as of the September 30, 2022 measurement date. The City cannot restrict any assets, including cash for the purpose of providing funding for these benefits. However, the City has in the past and will continue to stand by its obligation to pay these benefits from its annual budgeted funds, as the liability becomes payable under this plan.
6. Plan Membership Information - As of the September 30, 2022 actuarial valuation, membership in the Excess Benefit Plan consisted of the following:
Excess
8 Inactive
Active
8
Benefit Retirees and beneficiaries currently receiving benefits
nonretired members
Employees (including transfers)
TO BASIC
93
CITY OF MIRAMAR, FLORIDA NOTES
FINANCIAL STATEMENTS SEPTEMBER 30, 2023
NOTE 9. EMPLOYEE RETIREMENT SYSTEMS AND PENSION PLANS (CONTINUED)
A. DEFINED BENEFIT PLANS
(Continued)
City of Miramar Excess Benefit Plan (Continued)
7. Total Pension Liability - The Excess Benefit Plan’s total pension liability was measured as of September 30, 2022 and determined by an actuarial valuation as of that date.
8. Actuarial Assumptions - The total pension liability was determined by an actuarial valuation as of September 30, 2022 using the following actuarial assumptions, applied to all prior periods included in the measurement. The valuation of the Excess Benefit Plan liability is based upon calculations of the split between the members’ qualified and non-qualified distributions and assumes a 2.5% increase for annual increases in the IRC Section 415(b)dollar limit to anticipate future changes in the split.
Actuarial Assumptions:
Actuarial cost method Entry Age Normal
Inflation rate
2.5% (also used for assumed future annual increases in the IRC Section 415 (b) dollar limit) Annual
Mortality
The healthy post-retirement mortality table is the PUB-2010 Headcount Weighted Mortality Tables with mortality improvements For females, the base mortality rates are from the Headcount Weighted General Below Median Healthy Retiree Female Table. For males, the base mortality rates are from the Headcount Weighted General Below Median Healthy Retiree Male Table, set back 1 year. These are the same rates used for the Regular Class members (other than K-12 School Instructional Personnel) of the Florida Retirement System (FRS) in the July 1, 2021 FRS actuarial valuation.
Projected benefit payments are discounted to their actuarial present values using a tax-exempt municipal bond rate based on an index of 20-year general obligation bonds with an average AA credit rating (which is published by the Bond Buyer) as of the measurement date. The discount rate used to measure the total pension liability was 4.40%
salary increases
Discount rate 4.40% Retirement age
N/A
N/A
SEPTEMBER
94
CITY OF MIRAMAR, FLORIDA NOTES TO BASIC FINANCIAL STATEMENTS
30, 2023
CITY OF MIRAMAR, FLORIDA
NOTES TO BASIC FINANCIAL STATEMENTS
SEPTEMBER 30, 2023
A. DEFINED BENEFIT PLANS
(Continued)
City of Miramar Excess Benefit Plan (Continued)
9. Changes in the Total Pension Liability
Excess Benefit Plan
Increase (Decrease) Total Pension Liability
Balance at October 1, 2022 $ 1,227,092
Changes for the year: Service cost
Changes in benefit terms
Differences between expected and actual experience 180,280
Changes of assumptions (125,811)
Benefit payments, including refunds of Benefit payments, including refunds of employee contributions (130,474)
Other — Net changes (50,560)
Balances at September 30, 2023 $ 1,176,532
Covered Payroll N/A
Total Pension Liability as a Percentage of Covered Payroll N/A
10. Sensitivity of the Total Pension Liability to Changes in the Discount Rate - The following table illustrates the sensitivity of the total pension liability to changes in the discount rate as of September 30, 2023:
NOTE 9. EMPLOYEE RETIREMENT SYSTEMS AND PENSION PLANS (CONTINUED)
—
Interest 25,445
—
Excess Benefit Plan 1% Decrease Current Rate 1% Increase 3.40% 4.40% 5.40% Total Pension Liability $1,230,539 $1,176,532 $1,126,812
95
CITY OF MIRAMAR, FLORIDA
NOTES TO BASIC FINANCIAL STATEMENTS SEPTEMBER 30, 2023
NOTE 9. EMPLOYEE RETIREMENT SYSTEMS AND PENSION PLANS (CONTINUED)
A. DEFINED BENEFIT PLANS (Continued)
City of Miramar Excess Benefit Plan (Continued)
11. Pension Expense and Deferred Outflows of Resources and Deferred Inflows of Resources Related to Pensions - For the year ended September 30, 2023, the City recognized pension expense of $366,425. At September 30, 2023, the City reported deferred outflows of resources and deferred inflows of resources related to the excess benefit plan from the following sources.
Excess Benefit Plan
Deferred Outflow of Resources
Deferred Inflow of Resources
Differences between expected and actual experience $ — $ —
Changes in assumptions — —
Employer contributions made subsequent to the measurement date 161,653 —
Total $ 161,653 $ —
The deferred outflow of resources related to the Excess Benefit Plan, totaling $161,653 resulting from City contributions to the Plan subsequent to the measurement date, will be recognized as a reduction of the total pension liability for the fiscal year ended September 30, 2024.
B. FLORIDA RETIREMENT SYSTEM (FRS and HIS)
The City provides retirement benefits to elected officials through the Florida Retirement System (FRS and HIS).
The FRS was created in Chapter 121, Florida Statutes, to provide a defined benefit pension plan for participating public employees. The FRS was amended in 1998 to add the Deferred Retirement Option Program under the defined benefit plan and amended in 2000 to provide a defined contribution plan alternative to the defined benefit plan for FRS members effective July 1, 2002. This integrated defined contribution pension plan is the FRS Investment Plan. Chapter 112, Florida Statutes, established the Retiree Health Insurance Subsidy (HIS) Program, a cost-sharing multipleemployer defined benefit pension plan, to assist retired members of any state administered retirement system in paying the costs of health insurance.
The FRS is a single retirement system administered by the Florida Department of Management Services, Division of Retirement, and consists of the two cost-sharing, multiple-employer defined benefit plans and other nonintegrated programs. A annual comprehensive financial report of the FRS, which includes its financial statements, required supplementary information, actuarial report, and other relevant information, is available from the Florida Department of Management Services’ Web site (www.dms.myflorida.com).
The City’s pension expense for FRS and HIS totaled $127,817 for the fiscal year ended September 30, 2023
96
NOTE 9. EMPLOYEE RETIREMENT SYSTEMS AND PENSION PLANS (CONTINUED)
B. FLORIDA RETIREMENT SYSTEM (FRS and HIS) (CONTINUED)
Florida Retirement System (FRS)
1. Plan Description - The FRS Pension Plan (Plan) is a cost-sharing multiple-employer defined benefit pension plan, with a Deferred Retirement Option Program (DROP) for eligible employees.
Elected Local Officers Class – Members who hold specified elective offices in local government
Employees enrolled in the Plan prior to July 1, 2011, vest at six years of creditable service and employees enrolled in the Plan on or after July 1, 2011, vest at eight years of creditable service. All vested members, enrolled prior to July 1, 2011, are eligible for normal retirement benefits at age 62 or at any age after 30 years of service. All members enrolled in the Plan on or after July 1, 2011, once vested, are eligible for normal retirement benefits at age 65 or any time after 33 years of service. Members of the Plan may include up to four years of credit for military service toward creditable service. The Plan also includes an early retirement provision; however, there is a benefit reduction for each year a member retires before his or her normal retirement date. The Plan provides retirement, disability, death benefits, and annual cost-of-living adjustments to eligible participants.
DROP, subject to provisions of Section 121.091, Florida Statutes, permits employees eligible for normal retirement under the Plan to defer receipt of monthly benefit payments while continuing employment with an FRS employer. An employee may participate in DROP for a period not to exceed 60 months after electing to participate. During the period of DROP participation, deferred monthly benefits are held in the FRS Trust Fund and accrue interest. The net pension liability does not include amounts for DROP participants, as these members are considered retired and are not accruing additional pension benefits.
2. Benefits Provided - Benefits under the Plan are computed on the basis of age and/or years of service, average final compensation, and service credit. Credit for each year of service is expressed as a percentage of the average final compensation (AFC). For members initially enrolled before July 1, 2011, the AFC is the average of the five highest fiscal years’ earnings; for members initially enrolled on or after July 1, 2011, the AFC is the average of the eight highest fiscal years’ earnings. The total percentage value of the benefit received is determined by calculating the total value of all service, which is based on the retirement class to which the member belonged when the service credit was earned. Members are eligible for in-line-of-duty or regular disability and survivors’ benefits.
The following chart shows the percentage value for each year of service credit earned:
Per Section 121.101, Florida Statutes, if the member is initially enrolled in the FRS before July 1, 2011, and all service credit was accrued before July 1, 2011, the annual cost-of-living adjustment is 3% per year. If the member is initially enrolled before July 1, 2011, and has service credit on or after July 1, 2011, there is an individually calculated cost-of-living adjustment. The annual cost-ofliving adjustment is a proportion of 3% determined by dividing the sum of the pre-July 2011 service credit by the total service credit at retirement multiplied by 3%. Plan members initially enrolled on or after July 1, 2011, will not have a cost-of-living adjustment after retirement.
Class, Initial Enrollment and Retirement Age/Years of Service % Value Elected Local Officers 3.00
SEPTEMBER
97
CITY OF MIRAMAR, FLORIDA NOTES TO BASIC FINANCIAL STATEMENTS
30, 2023
CITY OF MIRAMAR, FLORIDA
NOTES TO BASIC FINANCIAL STATEMENTS
SEPTEMBER 30, 2023
NOTE 9. EMPLOYEE RETIREMENT SYSTEMS AND PENSION PLANS (CONTINUED)
B. FLORIDA RETIREMENT SYSTEM
(FRS and HIS) (CONTINUED)
Florida Retirement System (FRS)
3. Contributions - The Florida Legislature establishes contribution rates for participating employers and employees. Contribution rates during the 2023 fiscal year were as follows: Percent of Gross Salary
October 1, 2022 to June 30, 2023 July 1, 2023 to September 30, 2023
(1) Employer rates include a post employment HIS contribution rate of 1.66% through June 30, 2023 and 1.66% from July 1 to September 30, 2023. Also, employer rates include .06% for administrative costs of the Investment plan through June 30, 2023 and .06% from July 1 to September 30, 2023.
The City’s contributions to the Plan totals $96,006 for the fiscal year ended September 30, 2023. This excludes the HIS defined benefit pension plan contributions.
4. Pension Liabilities, Pension Expense, and Deferred Outflows of Resources and Deferred Inflows of Resources Related to Pensions - At September 30, 2023, the City reported a liability of $760,865 for its proportionate share of the Plan’s net pension liability. The net pension liability was measured as of June 30, 2023, and the total pension liability used to calculate the net pension liability was determined by an actuarial valuation as of July 1, 2023. The City’s proportionate share of the net pension liability was based on the City’s contributions for the year ended June 30, 2023 relative to the contributions made during the year ended June 30, 2023 of all participating members. At June 30, 2023, the City’s proportionate share was .001909475% percent, which was a decrease of .000023950% from its proportionate share measured as of June 30, 2022.
Percent
of Gross Salary
Employee Employer
Employee Employer(1) FRS, Elected Local Officers 3.00 57.00 3.00 58.68 FRS,
Local RetiredOfficers Reemployed on
after July 1, 2010 45.64 46.23
(1)
Elected
or
98
NOTE 9. EMPLOYEE RETIREMENT SYSTEMS AND PENSION PLANS (CONTINUED)
B. FLORIDA RETIREMENT SYSTEM (FRS and HIS) (CONTINUED)
Florida
Retirement System (FRS) (Continued)
For the fiscal year ended September 30, 2023 the City recognized pension expense of $97,223 related to the Pension Plan. In addition, the City reported deferred outflows of resources and deferred inflows of resources related to pensions from the following sources:
of Resources Differences between expected and actual experience
difference between projected and actual earnings on FRS pension plan investments
Changes in proportion and differences between City FRS contributions and proportionate share of FRS contributions
Employer contributions made subsequent to the measurement date
The deferred outflows of resources related to pensions, totaling $23,382 resulting from City contributions to the Plan subsequent to the measurement date, will be recognized as a reduction of the net pension liability in the fiscal year ended September 30, 2024. Other amounts reported as deferred outflows of resources and deferred inflows of resources related to pensions will be recognized in pension expense as follows:
Year ended September 30:
FRS
Deferred
$ 71,439 $ —
49,600 — Net
31,776 —
Plan Deferred Outflow of Resources
Inflow
Assumption changes
1,198 112,838
23,382 — Total $ 177,395
112,838
$
2024
2025
2026
2027
NOTES
99
$ 2,035
8,379
16,952
6,598 2028 (442) Thereafter 7,652 CITY OF MIRAMAR, FLORIDA
TO BASIC FINANCIAL STATEMENTS SEPTEMBER 30, 2023
CITY OF MIRAMAR, FLORIDA
NOTES TO BASIC FINANCIAL STATEMENTS SEPTEMBER 30, 2023
NOTE 9. EMPLOYEE RETIREMENT SYSTEMS AND PENSION PLANS (CONTINUED)
B. FLORIDA RETIREMENT SYSTEM (FRS and HIS) (CONTINUED)
Florida Retirement System (FRS) (Continued)
5. Actuarial Assumptions
The total pension liability in the July 1, 2023 actuarial valuation was determined using the following actuarial assumptions, applied to all periods included in the measurement:
Inflation rate 2.40%
Annual salary increases 3.25%, average ,including inflation
Investment rate of return 6.70%, net of pension plan expense, including inflation
Mortality
PUB-2010 base table, projected generationally with Scale MP-2018
The long-term expected rate of return on pension plan investments was not based on historical returns, but instead is based on a forward-looking capital market economic model. The allocation policy’s description of each asset class was used to map the target allocation to the asset classes shown below. Each asset class assumption is based on a consistent set of underlying assumptions and includes an adjustment for the inflation assumption. The target allocation and best estimates of arithmetic and geometric real rates of return for each major asset class are summarized in the following table:
(1) As outlined in the Plan's investment policy
6. Discount Rate - The discount rate used to measure the total pension liability was 6.70% percent. The Plan’s fiduciary net position was projected to be available to make all projected future benefit payments of current active and inactive employees. Therefore, the discount rate for calculating the total pension liability is equal to the long-term expected rate of return.
Target Arithmetic Geometric Standard Asset Class Allocation(1) Return Return Deviation Cash 1.0% 2.9% 2.9% 1.1% Fixed Income 19.8% 4.5% 4.4% 3.4% Global Equity 54.0% 8.7% 7.1% 18.1% Real Estate 10.3% 7.6% 6.6% 14.8% Private equity 11.1% 11.9% 8.8% 26.3% Strategic Investments 3.8% 6.3% 6.1% 7.7% 100.00% Assumed Inflation -Mean 2.4% 1.4%
100
B. FLORIDA RETIREMENT SYSTEM (FRS and HIS) (CONTINUED)
Florida Retirement System (FRS) (Continued)
7. Sensitivity of the City’s Proportionate Share of the Net Pension Liability to Changes in the Discount Rate - The following presents the City’s proportionate share of the net pension liability calculated using the discount rate of 6.70%, as well as what the City’s proportionate share of the net pension liability would be if it were calculated using a discount rate that is 1-percentage-point lower (5.70%) or 1-percentage-point higher (7.70%) than the current rate:
FRS Plan
8. Pension Plan Fiduciary Net Position - Detailed information about the Plan’s fiduciary net position is available in the FRS Pension Plan and Other State Administered Systems Annual Comprehensive Financial Report.
9. Payables to the Pension Plan - At September 30, 2023, the City reported a payable to the Plan of $8,236.
HIS Pension Plan
1. Plan Description - The HIS Pension Plan (HIS Plan) is a cost-sharing multiple-employer defined benefit pension plan established under section 112.363, Florida Statutes, and may be amended by the Florida Legislature at any time. The benefit is a monthly payment to assist retirees of State- administered retirement systems in paying their health insurance costs and is administered by the Division of Retirement within the Florida Department of Management Services.
2. Benefits Provided - For the fiscal year ended September 30, 2023, eligible retirees and beneficiaries received a monthly HIS payment of $7.50 for each year of creditable service completed at the time of retirement, with a minimum HIS payment of $45 and a maximum HIS payment of $225 per month, pursuant to Section 112.363, Florida Statutes. To be eligible to receive a HIS Plan benefit, a retiree under a State-administered retirement system must provide proof of health insurance coverage, which may include Medicare.
3. Contributions - The HIS Plan is funded by required contributions from FRS participating employers as set by the Florida Legislature. Employer contributions are a percentage of gross compensation for all active FRS members. For the fiscal year ended September 30, 2023, the contribution rate was 1.66% of payroll from October 1, 2022 through June 30, 2023 and 1.66% of payroll for July 1, 2023 through September 30, 2023 pursuant to section 112.363, Florida Statues. The City contributed 100 percent of its statutorily required contributions for the current and preceding three years. HIS Plan contributions are deposited in a separate trust fund from which payments are authorized. HIS Plan benefits are not guaranteed and are subject to annual legislative appropriation. In the event the legislative appropriation or available funds fail to provide full subsidy benefits to all participants, benefits may be reduced or canceled.
The City’s contributions to the HIS Plan totaled $2,990 for the fiscal year ended September 30, 2023. CITY OF
NOTE 9. EMPLOYEE RETIREMENT SYSTEMS AND PENSION PLANS (CONTINUED)
1% Decrease Current Rate 1% Increase 5.70% 6.70% 7.70% Net Pension Liability $1,299,712 $760,865 $310,055
NOTES TO BASIC FINANCIAL STATEMENTS SEPTEMBER
101
MIRAMAR, FLORIDA
30, 2023
B. FLORIDA RETIREMENT SYSTEM (FRS and HIS)
(CONTINUED)
HIS Pension Plan (Continued)
4. Pension Liabilities, Pension Expense, and Deferred Outflows of Resources and Deferred Inflows of Resources Related to Pensions - At September 30, 2023, the City reported a net pension liability of $72,205 for its proportionate share of the HIS Plan’s net pension liability. The net pension liability was measured as of June 30, 2023, and the total pension liability used to calculate the net pension liability was determined by an actuarial valuation as of June 1, 2023. The City’s proportionate share of the net pension liability was based on the year ended June 30, 2022 contributions relative to the year ended June 30, 2023 contributions of all participating members. At June 30, 2023, the City’s proportionate share was .000454655%, which was a decrease of .000039604% from its proportionate share measured as of June 30, 2022.
For the fiscal year ended September 30, 2023, the City recognized pension expense of $27,594 related to the HIS Plan. In addition, the City reported deferred outflows of resources and deferred inflows of resources related to pensions from the following sources:
The deferred outflows of resources related to pensions, totaling $901, resulting from City contributions to the HIS Plan subsequent to the measurement date will be recognized as a reduction of the net pension liability in the fiscal year ended September 30,2024. Other amounts reported as deferred outflows of resources and deferred inflows of resources related to pensions will be recognized in pension expense as follows:
Year ended September 30:
$ (4,771)
(1,438) 2026 (760) 2027 (1,878) 2028 (48)
NOTE 9. EMPLOYEE RETIREMENT SYSTEMS AND PENSION PLANS (CONTINUED)
HIS PLAN Deferred Outflow of Resources Deferred Inflow of Resources Differences between expected and actual experience $ 1,057 $ 169 Assumption changes 1,898 6,257 Net difference between projected and actual earnings on HIS pension plan investments 37 — Changes in proportion and differences between City HIS contributions and proportionate share of HIS contributions 1,776 14,801 Employer contributions made subsequent to the measurement date 901 — Total $ 5,669 $ 21,227
2024
2025
Thereafter (7,564)
NOTES TO BASIC FINANCIAL STATEMENTS SEPTEMBER
102
CITY OF MIRAMAR, FLORIDA
30, 2023
CITY OF MIRAMAR, FLORIDA
NOTES TO BASIC FINANCIAL STATEMENTS SEPTEMBER 30, 2023
NOTE 9. EMPLOYEE RETIREMENT SYSTEMS AND PENSION PLANS (CONTINUED)
B. FLORIDA RETIREMENT SYSTEM (FRS and HIS) (CONTINUED)
HIS Pension Plan (Continued)
5. Actuarial Assumptions - The total pension liability was determined as of June 30, 2023, measurement date based on an actuarial valuation of June 30, 2023.
Inflation rate 2.40%
Annual salary increases 3.25%, average ,including inflation
Investment rate of return 3.65%
Mortality
PUB-2010 base table, projected generationally with Scale MP-2018
6. Discount Rate - The discount rate used to measure the total pension liability was 3.65%. In general, the discount rate for calculating the total pension liability is equal to the single rate equivalent to discounting at the long-term expected rate of return for benefit payments prior to the projected depletion date. Because the HIS benefit is essentially funded on a pay-as-you-go basis, the depletion date is considered to be immediate, and the single equivalent discount rate is equal to the municipal bond rate selected by the HIS Plan sponsor. The Bond Buyer General Obligation 20- Bond Municipal Bond Index was adopted as the applicable municipal bond index.
7. Sensitivity of the City’s Proportionate Share of the Net Pension Liability to Changes in the Discount Rate - The following presents the City’s proportionate share of the net pension liability calculated using the discount rate of 3.65%, as well as what the City’s proportionate share of the net pension liability would be if it were calculated using a discount rate that is 1-percentage-point lower (2.65%) or 1-percentage-point higher (4.65%) than the current rate:
8. Pension Plan Fiduciary Net Position - Detailed information about the HIS Plan’s fiduciary net position is available in the FRS Pension Plan and Other State Administered Systems Annual Comprehensive Financial Report.
Payables to the Pension Plan – At September 30, 2023, the City reported a payable to the HIS Plan of $142.
HIS
1% Decrease Current Rate 1% Increase 2.65% 3.65% 4.65% Net Pension Liability $82,375 $72,205 $63,775
Plan
103
CITY OF MIRAMAR, FLORIDA
NOTES TO BASIC FINANCIAL STATEMENTS SEPTEMBER 30, 2023
NOTE 9. EMPLOYEE RETIREMENT SYSTEMS AND PENSION PLANS (CONTINUED)
Net Pension Liability, Total Pension Liability, Deferred Inflow of Resources, and Deferred Outflow of Resources
The following table summarizes the net pension liability, total pension liability, deferred inflow of resources, and deferred outflow of resources as previously disclosed in Note 9 for each Plan:
The schedule of changes in the net pension liability, total pension liability, and related ratios and the schedule of contributions, presented as Required Supplementary Information (RSI) following the notes to the financial statements, provide additional information about the net pension liability, total pension liability, plan assets, and contributions for each of the City’s pension plans.
C. DEFINED CONTRIBUTION PLAN
Money Purchase Plan
(ICMA)
1. Plan Description - The City provides pension benefits for certain appointed employees through a money purchase plan (a defined contribution plan). The Plan is a tax qualified plan under Section 401(a) of the Internal Revenue Code and all contributions by or on behalf of employees are tax deferred until the time of withdrawal. The Plan is administered by International City Managers Association (ICMA). The ICMA contribution plan was established pursuant to Resolution No. 88104 adopted May 16, 1988, by the City Commission.
In September 2022, the City opened a new 401(a) money purchase plan for Senior Executive staff. The Plan is a tax qualified plan under Section 401(a) of the Internal Revenue Code and all contributions by or on behalf of employees are tax deferred until the time of withdrawal. The Plan is administered by MissionSquare Retirement.
2. Benefit Provisions and Contribution Rates - 401(a)
401(a) - Plan benefits depend solely on amounts contributed to the Plan, plus investment earnings, less administrative expenses. The City’s contribution for these employees is 11% of covered payroll and vesting in the Plan is immediate. There are no unfunded liabilities of this Plan at the end of the year, as all contributions are remitted biweekly to MissionSquare and Nationwide. During fiscal year 2023, the City contributed $109,630 to the Plan. The City’s contributions were calculated using a covered base payroll of $475,645 for the fiscal year. At September 30, 2023, there were 6 participants in the Plans. Of those participants, 5 are in the MissionSquare 401(a) plan and 1 participant is in the Nationwide 401(a) plan.
401(a) Senior Executive Plan - As of September 30, 2023, there were 8 participants in the 401(a) Senior Executive Money Purchase Plan. The City’s contribution is 5% of covered payroll with $146,919 in city contributions remitted for the fiscal year. The City’s contribution was based on a covered payroll of $2,938,380. All contributions are remitted biweekly to MissionSquare.
Net Pension Total Pension Deferred Inflow Deferred Outflow Pension Plan Liability Liability of Resources of Resources Expense PoliceOfficers’ $ 87,784,599 $ — $ 3,716,758 $ 38,646,381 $ 11,198,884 Firefighters’ 76,749,339 — 5,282,460 52,356,964 10,267,202 Consolidated 59,700,250 — 1,028,035 38,193,957 10,361,471 FloridaRetirementSystem(FRSandHIS) 833,070 — 183,064 134,065 124,817 Excessbenefit — 1,176,532 — 161,653 79,914 Total $ 225,067,258 $ 1,176,532 $ 10,210,317 $ 129,493,020 $ 32,032,288
104
CITY
2023
NOTE 10. OTHER POST EMPLOYMENT BENEFITS (OPEB)
Plan Description- The City of Miramar sponsors an OPEB Plan that provides Other Post-Employment Benefits (OPEB) for its eligible retirees and their dependents. The City of Miramar Other PostEmployment Benefit Plan is a single employer defined benefit OPEB plan that includes a separate trust fund. The OPEB Plan provides health-related and life insurance coverage through different insurance arrangements that also cover active employees and their dependents. The City Commission has the authority to establish and amend the terms of the benefits provided to retirees and their dependents through the OPEB Plan. The City retains overall administrative duties for the OPEB Plan, while engaging and delegating various administrative functions to different entities. Trustees of the associated trust are the City Manager, the Director of Financial Services, and the Director of Human Resources, which also constitute the City Trust Committee with its administrative duties.
Benefits Provided - The benefits provided under the OPEB Plan vary according to the category of employees and whether they are represented and covered by a collective bargaining agreement (CBA). These benefit terms equal or exceed the minimum required of Florida government employers per Ch. 112.0801, Florida Statutes.
General Employees – Retirees are eligible for a monthly health benefit stipend in the amount of $10 for each year of credited service to a maximum of $250 per month until attaining age 62. If the retiree is covered under the City-managed health program, the City will begin paying full medical/prescription premiums for the retiree (not dependent) coverage from age 62 until attaining age 65. During this period, each retiree has the option, at their (own) expense, to carry dependent group coverage at the City’s group rates. After attaining age 65 the retirees and their dependents are permitted to remain covered under the City-managed health program as long as they pay the full blended premium applicable to the coverage elected at the same group rates charged for the City’s active employees. Other than the minimum coverage provisions mandated by the State, these benefit terms may be amended through negotiations between the City and the general employees’ bargaining unit.
Unrepresented Employees - Retirees are eligible for a monthly health benefit stipend in the amount of $10 for each year of credited service to a maximum of $250 per month. This stipend will cease at the 65th birthday of the retiree. For retiree coverage under the same City-managed health program that also covers active employees, any portion of the blended premium required that is not covered by the stipend is required to be paid by the retiree.
Unrepresented employees who are considered executive staff: For each 1.75 years of service with the City, rendered through June 6, 2008, such retirees would receive a year of health insurance at no cost for retiree’s coverage and with 50% discount for dependent coverage. To be eligible for this benefit, retirees needs to have accrued at least three years of service with the City as of June 6, 2008 and be covered under the City’s health benefits program at the time of retirement. Periodic cash equivalent payments in lieu of the free/discounted coverage under the City-managed health program are also available with proof of other coverage. After expiration of this benefit, but not beyond the participant’s 65th birthday, a retiree will be eligible for a stipend as described above for Unrepresented Employees.
Police Officers – Retirees are eligible for a monthly stipend in the amount of $20 for each year of credited service to a maximum of $400 per month. For retiree coverage under the same Citymanaged health program that also covers active employees, any portion of the blended premium required that is not covered by the stipend is required to be paid by the retiree. Other than the minimum coverage provisions mandated by the State, these benefit terms may be amended through negotiations between the City and the police officers’ bargaining unit.
BASIC FINANCIAL
105
OF MIRAMAR, FLORIDA NOTES TO
STATEMENTS SEPTEMBER 30,
30, 2023
NOTE 10. OTHER POST EMPLOYMENT BENEFITS (OPEB) (CONTINUED)
Benefits Provided (Continued)
Firefighters - Prior to January 1, 2020, after retiring, firefighters were eligible to retain insurance coverage under the City’s health benefits program for medical, prescription, visions, and dental insurance, provided they pay the blended average premium applicable for actives and retirees. On or after January 1, 2020, all firefighters terminated their coverage under the City’s health benefits program and became covered under a health benefits program offered through the Miramar Local 2820 Firefighters Health Insurance Trust Fund. For retiree coverage under either of these health benefit programs, the retiree is required to pay the average blended premium applicable to actives and retirees. Other than the minimum coverage provisions mandated by the State, these benefit terms may be amended through negotiations between the City and the firefighters’ bargaining unit and through the Miramar Local 2820 Firefighters Health Insurance Trust Fund.
Plan Membership- As of the most recent actuarial valuation date (September 30, 2022 for firefighters and for all other plan members), the following plan members were covered by the benefit terms:
OPEB Trust Account and Contributions
On August 21, 2019, the City Commission adopted Resolution No. 19-159 establishing an irrevocable trust. The trust received an initial deposit of $1,000,000 on August 18, 2020, and additional deposits of $500,000 on January 20,2021, November 19,2021, and December 29, 2022 from the City. The trust assets are irrevocable and may not be used for any purpose other than funding post-retirement healthcare benefits to eligible members of the OPEB Plan.
The City Commission has the authority to establish and amend the funding policy of the OPEB Plan. The trust is 100% funded by City contributions. There is no formal prefunding policy, except that future funding of the trust is determined on an annual basis by the City Commission during the approval of the City's annual budget. There is no statutory requirement for the City to prefund its OPEB obligation. The OPEB Trust does not issue a separate financial report.
Inactive plan members currently receiving benefits 220 Inactive plan members entitled to but not yet receiving benefits 12 Active plan members 943 Total plan members 1,175
BASIC FINANCIAL
SEPTEMBER
106
CITY OF MIRAMAR, FLORIDA NOTES TO
STATEMENTS
CITY OF MIRAMAR, FLORIDA
NOTES TO BASIC FINANCIAL STATEMENTS SEPTEMBER 30, 2023
NOTE 10. OTHER POST EMPLOYMENT BENEFITS (OPEB) (CONTINUED)
OPEB Trust Account and Contributions
(Continued)
The OPEB Trust does not issue a separate financial report. Therefore, included below is the Statement of Fiduciary Net Position and the Statement of Changes in Fiduciary Net Position Fund for the fiscal year ended September 30, 2023.
OTHER POST-EMPLOYMENT BENEFITS (OPEB) TRUST FUND STATEMENT OF FIDUCIARY NET POSITION SEPTEMBER 30, 2023
ASSETS
NETPOSITION
ADDITIONS Contributions:
OTHER POST-EMPLOYMENT BENEFITS (OPEB) STATEMENT OF CHANGES IN FIDUCIARY NET POSITION FOR THE YEAR ENDED SEPTEMBER 30, 2023
Investments: Mutual Funds $ 2,530,454 TotalAssets $2,530,454
Net position restricted
2,530,454
for OPEB $
City $ 500,000 Total contributions 500,000 Investment Income Net appreciation in the fair value of investments 202,948 Less Investment Expense (2,241) Net investment income 200,707 Total additions 700,707 DEDUCTIONS Benefit payments — Administrative expenses — Total deductions — Net increase 700,707 Net position restricted
Beginning of year 1,829,747 End of year $ 2,530,454
for OPEB
107
NOTE 10. OTHER POST EMPLOYMENT BENEFITS
(OPEB) (CONTINUED)
OPEB Trust Investments
The City Commission retains the authority to establish and amend investment policy decisions. The OPEB Plan trustees may establish or amend the asset allocation. As authorized by the resolution, the OPEB Plan trustees have directed the Plan assets to be invested in a diversified pool of funds including money market funds, bond funds, equity funds and multi-strategy funds. As of September 30, 2023, the composite of all trust assets is allocated as follows:
The annualized money-weighted rate of return on OPEB plan investments for the portion of the year in which there were plan assets was 9.11%. The money-weighted rate of return is net of investment-related expenses, reflects any changes in amounts actually invested and reflects investment performance.
Net OPEB Liability of the City
The components of the net OPEB Liability of the City as of the September 30, 2023 fiscal year end are presented below. This liability differs from what is reported in the City’s Statement of Net Position, which is calculated as of the September 30, 2022 measurement date.
Asset Class Allocation of Assets Fixed Income and Stable Value 51.0 % Equities 43.9 % Multi-Strategy Fund 5.1 % 100.00 %
Investments measured at the Net Asset Value (NAV) Fair Value MSQ II Model Port Con S10 $ 1,573,872 MSQ II Model Port Mod S10 956,582 Total investments measured at the NAV $ 2,530,454
Total OPEB Liability $ 46,302,014 Plan Fiduciary Net Position 2,530,454 Net OPEB Liability $ 43,771,560 Plan's fiduciary net position as a percentage of the total OPEB liability 5.47%
NOTES TO BASIC FINANCIAL STATEMENTS
108
CITY OF MIRAMAR, FLORIDA
SEPTEMBER 30, 2023
NOTE 10. OTHER POST EMPLOYMENT BENEFITS (OPEB)
Net OPEB Liability of the City (Continued)
Actuarial Assumptions (Continued)
Actuarial assumptions -The total OPEB liability ($46,302,014) presented above as of September 30, 2023 was determined by an actuarial valuation as of September 30, 2022 for firefighters and for all other plan members. Appropriate actuarial update procedures were employed to roll forward the total liabilities to the September 30, 2023 fiscal year end. The calculations used the following actuarial assumptions, applied to all periods included in the measurement, unless otherwise specified:
General price inflation 2.50% per annum
Salary increases Salary increase rates are those used in the actuarial valuations of the City's respective retirement plans for General and Management Employees, Police Officers, and Firefighters.
Investment rate of return 4.0% per annum.
Healthcare cost trend rates For non-firefighters: Based on the Getzen Model, with trend starting at 4.92% on January 1, 2023, followed by 6.50% on January 1, 2024, and then gradually decreasing to an ultimate trend rate of 4.00%. For Firefighters: Based on the Getzen Model, with trend starting at 3.00% starting at January 1, 2023 followed by 6.00% on January 1, 2024 and then gradually decreasing to an ultimate trend rate of 4.00%.
Mortality tables are those used in the July 1, 2022, actuarial valuation of the Florida Retirement System. They are based on the results of a statewide experience study covering the period 2013 through 2018. These rates were taken from adjusted Pub-2010 mortality tables published by the Society of Actuaries with generational mortality improvements using Scale MP-2018. The assumed rates of disability, turnover, retirement, and salary increases are those used in the actuarial valuations of the City’s respective retirement plans. These decrement estimates are generally based on past experience and modified for projected changes in conditions, as measured in each retirement plan's experience study.
The long-term expected rate of return on OPEB plan investments (4.0% per annum) was determined by deriving net arithmetic expectations of the trust’s portfolio by applying the capital market assumptions of national investment forecasters for each asset class to the trust’s current asset allocation and netting out expected investment expenses. These forecasters’ arithmetic return assumptions for the portfolio were converted to 50th percentile expectations. The consensus average of these forecasters’ 50th percentile expectations was 4% per annum. The consensus average best estimates of arithmetic real rates of return for each major asset class included in the asset allocations as of September 30, 2023, are summarized in the following table:
(CONTINUED)
Long Term Expected Asset Class Real Rate of Return Fixed Income and Stable Value 1.8% Equities 6.6% Multi-Strategy Funds 3.3%
OF
NOTES TO BASIC FINANCIAL STATEMENTS SEPTEMBER
109
CITY
MIRAMAR, FLORIDA
30, 2023
CITY OF MIRAMAR, FLORIDA
NOTES TO BASIC FINANCIAL STATEMENTS SEPTEMBER 30, 2023
NOTE 10. OTHER POST EMPLOYMENT BENEFITS
Net OPEB Liability of the City (Continued)
Discount rate - The discount rate used to measure the total OPEB liability as of September 30, 2023, is 4.63%. A qualifying OPEB trust was established for the purpose of paying and funding the City’s post-employment benefits. In the absence of a formal funding policy that ensures the build-up of sound actuarial reserves, for the September 30, 2023 fiscal year end, the single discount rate reflects the municipal bond rate of 4.63% (based on the daily rate closest to but not later than September 30, 2023 of Fidelity Investments’ “20-Year Municipal GO AA Index”). The similarly developed discount rate was 4.40% as of the beginning of the fiscal year (the measurement date).
Benefit Change - For Firefighters, the MFITF subsidy in the retiree contributions was updated to 6% of gross premiums effective January 1, 2023, as determined by the MFITF Board of Trustees.
Sensitivity of the net OPEB liability to changes in the discount rate.
The following presents the net OPEB liability of the City as of the September 30, 2022 measurement date, as well as what the City’s net OPEB liability would be if it were calculated using a discount rate that is 1-percentage-point lower (3.40% percent) or 1-percentage-point higher (5.40% percent) than the current discount rate:
Sensitivity of Net OPEB Liability to the Discount Rate Assumption
Sensitivity of the net OPEB Liability to the Healthcare cost trend rates
The following presents the net OPEB liability of the City as of the September 30, 2022 measurement date, as well as what the City’s net OPEB liability would be if it were calculated using healthcare cost trend rates that are 1-percentage-point lower (3.40 percent) or 1percentage-point higher (5.40 percent) than the current healthcare cost trend rates:
Sensitivity of Net OPEB Liability to the Healthcare Cost Trend Rate Assumption 1% Decrease Current Healthcare Cost 1% Increase Trend Rate Assumption
$39,549,914 $42,846,502 $46,801,684
(CONTINUED)
(OPEB)
Current Discount 1% Decrease Rate Assumption 1% Increase 3.40% 4.40% 5.40% $48,079,021 $42,846,502 $38,433,118
110
CITY OF MIRAMAR, FLORIDA
NOTES TO BASIC FINANCIAL STATEMENTS SEPTEMBER 30, 2023
NOTE 10. OTHER POST EMPLOYMENT BENEFITS (OPEB) (CONTINUED)
Changes in the Net OPEB Liability
The net OPEB Liability as of the current measurement date below (September 30,2022) is reflected in the City’s Statement of Net Position for the fiscal year ended September 30, 2023.
Schedule of Changes in the Net OPEB Liability Increase (Decrease)
Total OPEB Plan Fiduciary Net OPEB Liability Net Position Liability
1, 2021
for the year:
Employer contributions
Benefit payments From the OPEB
Assumption Changes: The following assumption changes have been reflected for the September 30, 2022 measurement date as compared to the September 30, 2021 measurement date: (a) The discount rate was changed from 2.19% to 4.40% and (b) the medical/Rx claims costs and premiums were updated based on actual 2022 premiums information provided, (c) the long-term health trend assumption was revised based on the updated November 2021 Getzen Model, and (d) changes reflected in the September 30, 2022 City of Miramar Firefighters’ OPEB Actuarial Valuation Report dated January 5, 2024 include an update to the retiree medical coverage acceptance assumption from 60% (30% for single enrollment and 30% for dual enrollment) to 70% (35% for single enrollment and 35% for dual enrollment).
Benefit changes: The following benefit change has been reflected for the September 30, 2022 measurement date as compared to the September 30, 2021 measurement date: For Firefighters, the retiree contributions were updated to reflect the MFITF subsidy of approximately 3% of gross premiums effective January 1, 2022, as determined by the MFITF board of trustees.
(a) (b) (a)
(b)
Changes
Service Cost 3,290,174 — 3,290,174 Interest 1,239,910 — 1,239,910 Changes in benefit terms 600,006 — 600,006 Differences between expected and actual experience 831,541 — 831,541
—
-
Balance at October
$ 53,730,162 $ 1,660,055 $ 52,070,107
Changes in Assumptions (13,008,716)
(13,008,716)
To
— 500,000
Not deposited in the OPEB Trust Fund — 2,006,828 (2,006,828) Net investment income — (330,308) 330,308
Trust Fund — — — Not reimbursed by the
Trust Fund (2,006,828) (2,006,828) — Net Changes (9,053,913) 169,692 (9,223,605)
$ 44,676,249 $ 1,829,747 $ 42,846,502
the OPEB Trust Fund
(500,000)
OPEB
Balances at September 30, 2022
111
CITY OF MIRAMAR, FLORIDA
NOTES TO BASIC FINANCIAL STATEMENTS
SEPTEMBER 30, 2023
NOTE 10. OTHER POST EMPLOYMENT BENEFITS (OPEB) (CONTINUED)
OPEB Expense and Deferred Outflows of Resources and Deferred Inflows of Resources Related to OPEB
The net OPEB liability reflected in the City’s Statement of Net Position as of its reporting date of September 30, 2023 is determined as of the measurement date of September 30, 2022. That net OPEB liability is $42,846,502.
For the fiscal year ended September 30, 2023, the City recognized OPEB expense of $3,061,371. At September 30, 2023, the City reported deferred outflows of resources and deferred inflows of resources related to OPEB from the following sources:
Differences between expected and actual experience $2,577,588 $851,128
Changes in assumptions or other inputs 3,509,091 14,969,587
Net difference between projected and actual earnings on OPEB plan investments
Employer contributions to the OPEB trust and benefits paid outside the trust subsequent to the measurement date
The deferred outflow of resources related to OPEB totaling $2,422,187 resulting from City contributions subsequent to the measurement date will be included as a reduction of the total OPEB liability for the fiscal year ended September 30, 2024.
Amounts reported above as deferred outflows of resources and deferred inflows of resources related to OPEB will be recognized in future OPEB expenses as follows:
Year Ended
September 30:
2024 $(2,047,529)
2025 $(2,047,529)
2026 $(1,374,125)
2027 $(1,580,418)
2028 $(1,588,424) Thereafter $(1,096,011)
Deferred Outflow Deferred Inflow of Resources of Resources
2,422,187 Total $8,508,866 $15,820,715
112
CITY OF MIRAMAR, FLORIDA
SEPTEMBER 30, 2023
NOTE 11. RISK MANAGEMENT
The City is exposed to various risks of loss related to torts, theft of, damage to, and destruction of assets; errors and omissions; injuries to employees and natural disasters. Liability claims in the State of Florida are limited to some extent by Chapter 768.28 of the Florida Statutes under the Doctrine of Sovereign Immunity. The City has a comprehensive risk management program to account for and finance its uninsured risk of loss.
The self-insured internal service fund for risk management provides coverage for up to a maximum of $500,000 for each workers’ compensation claim, $100,000 for each general liability claim, and $75,000 for each property claim. The City purchases commercial insurance for claims in excess of coverage provided by the fund and for all other risk of loss. There were no significant changes in insurance coverage from coverage in prior years. Settled claims have not exceeded the commercial coverage in any of the past three fiscal years.
Effective January 2021, the City became self-insured for employee group health insurance and also has purchased stop-loss coverage for the combined group medical and pharmacy plan with a specific deductible of $250,000 per individual.
The estimated liabilities for self-insured losses were determined by independent actuarial valuations performed as of September 30, 2023. Liabilities include an amount for claims that have been incurred but not reported (IBNR). The estimate for incurred but not reported (IBNR) claims is based on historical experience, recent claim settlement trends (including frequency and amounts of payouts) and other economic and social factors. The claims liability estimates also include an amount for incremental adjustment expense as well as estimated recoveries from salvage or subrogation.
Changes in the claims liability balance for fiscal years 2023 and 2022, for the City’s two programs are as follows:
Note: Effective January 2021 the City became self-insured for employee group health.
Current Year Claims Balance, and Changes in Claim Balance, Beginning of Year Estimates Payments End of Year General: Year 2023 $ 9,001,000 $ 3,544,913 $ 3,162,913 $ 9,383,000 Year 2022 8,608,000 4,199,785 3,806,785 9,001,000 Dental Health: Year 2023 $ 1,707,420 $ 10,803,017 $ 11,157,276 $ 1,353,161 Year 2022 1,490,935 11,967,343 11,750,858 1,707,420
BASIC FINANCIAL
NOTES TO
STATEMENTS
113
CITY OF MIRAMAR, FLORIDA
NOTES TO BASIC FINANCIAL STATEMENTS SEPTEMBER 30, 2023
NOTE 12. COMMITMENTS AND CONTINGENCIES
Commitments
In 1974, the City entered into a “Large User Wastewater Agreement” with the City of Hollywood, Florida (Hollywood). The agreement provides for the connection of the City’s collection system to Hollywood’s treatment and disposal facility for a period of 40 years, at which time it will be extended to the maturity date of any bond issues or other indebtedness incurred by Hollywood subsequent to the date of this agreement if the proceeds from such bonds or other indebtedness incurred are used to improve existing service or provide new service to the City. The City is being charged based on average daily wastewater flow. The charges to operations of the Utility Fund under this agreement were $132,684 during the year ended September 30, 2023 and are included in wastewater plant operations expense on the Statement of Revenues, Expenses and Changes in Fund Net Position.
Construction and Other Significant Commitments
The City has active construction projects as of September 30, 2023. The projects include park facilities improvements, infrastructure redevelopment and improvement, various water, wastewater and drainage projects, as well as the construction of new Historic Miramar Innovation and Technology Village comprised of workforce housing, transit hub, educational facilities, enhanced public recreational amenities, mixed use development and a technology village for new business startups and smart city innovation. At year end, the City’s outstanding commitments related to these projects follows:
The projects listed above are being financed through the issuance of revenue bonds, revenue notes, state revolving fund loans, and from existing City resources.
Project Spent to Date Remaining Commitment Ansin Sports Complex Phase IV $ 1,113,733 $ 1,408,417 Vizcaya Park Enhancements 29,705 395,296 Miramar Regional ParkAquatics Complex Renovations 18,750 381,250 Street Construction & Resurfacing-Various Locations 8,915,990 3,809,610 Landscaping and Beautification along Miramar Pkwy, Miramar Blvd 1,260,249 1,387,293 Reclaimed Water Sys. Expansion/Piping 1-75 Crossing 7,113,404 7,567,796 Pembroke Road LandAcquisition/Planning, Design, Engineering 3,690,807 4,901,382 Historic Miramar Drainage Improvements 15,334,638 1,970,019 LED Streetlight Installation and Upgrade 277,287 96,859 Country Club Ranches Water Main Improvements 2,274,665 4,525,335 SCADACybersecurity Improvement 1,017,088 959,369 Sustainable Renewable Energy & Conservation Initiatives — 1,540,380 West WaterTreatment Plant Capacity Improvements & Upgrades 3,225,362 10,959,638 Wastewater Reclamation Facility Capacity Impr. & Re-Rating 2,134,529 6,565,471 Vicki Coceano Childcare Facility Replacement with 206,609 1,443,391 Facilities Capital Improvement - Construction 1,925,475 2,245,525 Historic Miramar Innovation & Technology Village 2,191,309 9,153,691 Smart City Surveillance System & RealTime Crime Cntr. 1,271,895 972,082 Audio Visual Upgrades for CulturalArtsTheater 25,300 2,133,302 $ 52,026,795 $ 62,416,106
114
CITY OF MIRAMAR, FLORIDA
NOTES TO BASIC FINANCIAL STATEMENTS
30, 2023
NOTE 12. COMMITMENTS AND CONTINGENCIES
(continued)
Contingencies
Various claims and lawsuits incidental to the City’s operations are pending against the City. Although the outcome of these claims and lawsuits are not presently determinable, in the opinion of the City’s management, any claims or lawsuits not covered by insurance would not have a material adverse effect on the financial condition of the City.
Amounts received or receivable from grant agencies are subject to audit and adjustment by grantor agencies. Any disallowed claims, including amounts already collected, may constitute a liability of the applicable funds. The amounts, if any, of expenditures which may be disallowed by the grantor cannot be determined at this time although the City expects such amounts, if any, to not be material.
NOTE 13. SUBSEQUENT EVENT
Pursuant to an agreement between the City of Miramar and Pinnacle at La Cabana, LLLP, in December 2023, the City provided subordinate “Local Government Area of Opportunity (LGAO)” financing in the Principal amount of $656,000 for the development of a 110-unit multi-family elderly rental development named “Pinnacle at La Cabana”. The loan commitment, evidenced by a Promissory Note, is a non-amortizing zero percent (0%) simple interest loan for 3 years during the Construction Period, and (5.03%) simple interest beginning on the day after the construction period ends, through June 13, 2043 (Maturity Date). Payment of the Note is secured by a mortgage with assignment of leases and rents from Pinnacle to the City encumbering Pinnacle ‘s leasehold interest in certain real property located in Broward County, Florida.
There are no payments due on the Note prior to maturity, and all interest and outstanding Principal, if not paid sooner, is due and payable on June 13, 2043 (Maturity Date) as a balloon payment. All amounts due on the Maturity Date may be forgiven at the discretion of the City.
The development is the culmination of a years-long strategic partnership between Pinnacle and the City of Miramar and aligns with the City’s strategic vision of affordable housing for seniors.
115
SEPTEMBER
REQUIRED SUPPLEMENTARY INFORMATION
OriginalBudget FinalBudget ActualAmounts Variancefrom FinalBudget Revenues: Taxes $ 113,269,507 $ 113,269,507 $ 115,644,157 $ 2,374,650 Specialassessments 22,400,000 22,400,000 22,279,037 (120,963) Licensesandpermits 10,927,000 10,927,000 10,252,289 (674,711) Intergovernmental 20,308,780 21,136,780 24,373,327 3,236,547 Chargesforservices 21,878,414 21,878,414 21,290,532 (587,882) Finesandforfeitures 652,900 652,900 417,522 (235,378) InterestRevenue 1,145,760 1,145,760 4,309,433 3,163,673 MiscellaneousRevenue 2,513,535 2,569,535 2,604,643 35,108 Totalrevenues 193,095,896 193,979,896 201,170,940 7,191,044 Expenditures: Current: Generalgovernment Citycommission 1,907,925 1,907,925 1,777,824 130,101 Citymanager 4,383,450 4,980,250 4,978,452 1,799 Humanresource 3,774,700 3,774,700 3,715,047 59,653 Legal 960,000 960,000 891,905 68,095 Cityclerk 1,372,855 1,372,855 1,356,278 16,577 MarketingandCommunications 2,586,500 2,717,500 2,678,528 38,972 Financialservices 5,929,800 5,929,800 5,893,044 36,756 Management&budget 2,133,800 1,921,200 1,831,941 89,259 Procurement 1,506,350 1,583,250 1,579,313 3,937 Totalgeneralgovernment 24,555,380 25,147,480 24,702,332 445,149 Publicsafety Police 59,558,752 59,862,895 59,716,075 146,820 Firerescue 43,086,220 43,403,197 43,091,653 311,544 Totalpublicsafety 102,644,972 103,266,092 102,807,728 458,364 Physicalenvironment Publicworks 11,351,900 11,866,955 11,565,264 301,691 Totalphysicalenvironment 11,351,900 11,866,955 11,565,264 301,691 Economicenvironment Communityandeconomicdevelopment 7,350,318 7,840,618 7,550,404 290,214 Economicandbusinessdevelopment 2,362,295 2,455,170 2,293,879 161,291 Totaleconomicenvironment 9,712,613 10,295,788 9,844,284 451,505 Communityservices Socialservices 8,597,118 8,438,018 8,208,333 229,685 TotalCommunityServices 8,597,118 8,438,018 8,208,333 229,685 Culturalarts 4,407,789 4,499,589 4,446,350 53,239 Parksandrecreation 17,097,114 17,657,956 17,595,215 62,741 Non-departmental 7,849,286 11,734,770 9,739,562 1,995,208 Debtservice: Principal 665,300 665,300 630,189 35,111 InterestExpense 208,100 208,100 204,860 3,240 Totalexpenditures 187,089,572 193,780,048 189,744,117 4,035,933 Excessofrevenuesoverexpenditures 6,006,324 199,848 11,426,823 11,226,977 Otherfinancingsources(uses) Transfersin 5,701,000 6,081,437 4,212,646 (1,868,791) Transfersout (13,176,472) (13,630,872) (10,367,071) 3,263,802 Leaseproceeds — — 865,227 865,227 Totalotherfinancingsources(uses) (7,475,472) (7,549,435) (5,289,198) 2,260,238 Netchangeinfundbalance $ (1,469,148) $ (7,349,587) 6,137,625 $ 13,487,215 Fundbalances,beginning 57,212,215 Fundbalance,ending $ 63,349,840
116
CITY OF MIRAMAR, FLORIDA REQUIRED SUPPLEMENTARYINFORMATION BUDGETARYCOMPARISON SCHEDULE (UNAUDITED) GENERALFUND FISCALYEAR ENDED SEPTEMBER 30, 2023
CITY OF MIRAMAR, FLORIDA
SEPTEMBER 30, 2023
NOTE 1. BUDGETS AND BUDGETARY ACCOUNTING
Annual budgets are adopted for the General, Special Revenue, Capital Projects and Debt Service Funds on a basis consistent with accounting principles generally accepted in the United States of America.
1. Prior to July 10, the City Manager submits to the City Commission a proposed operating budget for the fiscal year commencing the following October 1st. The operating budget includes proposed expenditures and the means of financing them.
2. Public hearings as required by State statute are conducted to obtain taxpayer comments.
3. Prior to October 1, the budget is legally enacted through passage of an Ordinance.
4. All budget amendments require approval by the City Commission when operating expenditures exceed budgeted appropriations at the department level, which is the legal level of control. In addition, a budget amendment approved by the City Commission is required when capital outlay expenditures exceed budgeted appropriations at the department level.
5. Appropriations lapse at year-end, except for grants, capital improvements and shared revenues from other governmental units which do not lapse at year-end and are only reported to the extent of revenues recognized, and expenditures incurred for the current year.
6. Budgets are prepared on the same basis of accounting as required for governmental fund types and are presented in the financial statements inclusive of all amendments to the original appropriation as approved by the City Commission during the fiscal year.
NOTE 2. RECONCILIATION OF BUDGETED AND ACTUAL RESULTS
1. The net change in fund balance presented on a budgetary basis differs from the net change in fund balance as presented on the Statement of Revenues, Expenditures, and Changes in Fund Balance- governmental funds due to the exclusion of a multi-year governmental fund type that does not have a legally adopted budget. An appropriation is established in the operating budget during the fiscal year as funds are received.
Net change in fund balance -budgetary basis $ 6,137,625 Multi-year fund without legally adopted budget 77,194 Billboard Revenue Fund (subfund) 401,744 Economic Development Fund (subfund) 32,122 Net change in fund balance-GAAP basis $ 6,648,685 General
Fund
$ 63,349,840 Multi-year
306,529 Billboard
Economic Development Fund
General Fund
Fund
balance, ending -budgetary basis
fund without legally adopted budget
Revenue Fund (subfund) 1,810,337
(subfund) 2,285,037 Fund balance, ending-GAAP basis $ 67,751,743
TO BUDGETARY
NOTES
COMPARISON SCHEDULE
117
Planfiduciarynetposition
CITY OF MIRAMAR, FLORIDA REQUIRED SUPPLEMENTARYINFORMATION SCHEDULE OF CHANGES IN NETPENSION LIABILITYAND RELATED RATIOS LASTNINE FISCALYEARS
NotestoSchedule:
(1)Scheduleisintendedtoshowinformationfor10years.Informationisnotavailableforyearspriorto2015.Asinformationisavailableitwillbepresented.
(2)OnMarch1,2022theCityCommissionadoptedOrdinanceNo.22-08whichcombinedtheGeneralEmployeesandManagementRetirementPlansintoasinglePlanwithaneffectivedateof February1,2022.ThissinglePlanwasrenamedTheCityofMiramarConsolidatedRetirementPlanandTrust.TheinformationpresentedhereinisinformationconsolidatedfromtheGeneral EmployeesandManagementRetirementPlansforallyearspresented.
Consolidated Consolidated Consolidated Consolidated Consolidated Consolidated Consolidated Consolidated Consolidated RetirementPlan RetirementPlan RetirementPlan RetirementPlan RetirementPlan RetirementPlan RetirementPlan RetirementPlan RetirementPlan 2023 2022(2) 2021 2020 2019 2018 2017 2016 2015 Totalpensionliability Servicecost $ 9,056,351 $ 4,540,217 $ 4,694,202 $ 3,768,682 $ 3,769,297 $ 3,570,879 $ 3,032,270 $ 3,077,703 $ 2,802,948 Interestonthetotalpensionliability 17,025,267 10,096,033 9,512,261 8,244,878 7,845,693 7,337,963 6,599,459 6,427,977 6,096,343 Changesofbenefitterms — 85,937,363 — 8,486,542 — — — (656,561) — Differencebetweenexpectedand actualexperience 7,126,721 2,116,741 (202,006) 3,630,739 (1,136,863) 682,375 3,361,773 (2,048,722) (1,256,259) Changesofassumptions — — — (2,119,386) — — 1,693,006 — — Benefitpayments,includingrefunds ofemployeecontributions (10,368,604) (6,066,260) (4,955,507) (4,707,485) (4,842,247) (4,230,461) (5,119,659) (3,490,795) (2,869,503) Netchangeintotalpensionliability 22,839,735 96,624,094 9,048,950 17,303,970 5,635,880 7,360,756 9,566,849 3,309,602 4,773,529 Totalpensionliability-beginning 239,346,044 142,721,950 133,673,000 116,369,030 110,733,150 103,372,394 93,805,545 90,495,943 85,722,414 Totalpensionliability-ending(a) 262,185,779 239,346,044 142,721,950 133,673,000 116,369,030 110,733,150 103,372,394 93,805,545 90,495,943
Contributions-employer 9,578,031 5,487,932 5,220,546 4,563,783 4,379,929 3,792,128 3,767,869 3,745,727 3,594,261 Contributions-employee 5,870,196 2,130,353 2,067,252 2,176,302 1,749,136 1,812,841 1,966,498 1,213,840 1,192,804 Netinvestmentincome (25,903,530) 27,603,129 8,607,773 4,954,431 10,247,911 9,374,839 7,507,462 1,233,954 7,245,995
ofmembercontributions (10,368,604) (6,066,260) (4,955,507) (4,707,485) (4,842,247) (4,230,461) (5,119,659) (3,490,795) (2,869,503) Administrativeexpense (363,983) (168,671) (143,598) (154,221) (151,103) (144,690) (181,082) (159,433) (125,266) Other — 71,817,997 — — — — — — — Netchangeinplanfiduciarynetposition (21,187,890) 100,804,480 10,796,466 6,832,810 11,383,626 10,604,657 7,941,088 2,543,293 9,038,291 Planfiduciarynetposition-beginning 223,673,419 122,868,939 112,072,473 105,239,663 93,856,037 83,251,380 75,310,292 72,766,999 63,728,708 Planfiduciarynetposition-ending(b) 202,485,529 223,673,419 122,868,939 112,072,473 105,239,663 93,856,037 83,251,380 75,310,292 72,766,999 City'snetpensionliability-ending(a)-(b) $ 59,700,250 $ 15,672,625 $ 19,853,011 $ 21,600,527 $ 11,129,367 $ 16,877,113 $ 20,121,014 $ 18,495,253 $ 17,728,944 PlanFiduciaryNetpositionasapercentage ofthetotalpensionliability 77.23% 93.45% 86.09% 83.84% 90.44% 84.76% 80.54% 80.28% 80.41% Coveredpayroll $ 35,922,271 $ 20,083,064 $ 20,519,929 $ 18,912,658 $ 19,188,218 $ 18,367,256 $ 15,909,213 $ 15,938,891 $ 14,844,382 Netpensionliabilityasapercentageof coveredpayroll 166.19% 78.04% 96.75% 114.21% 58.00% 91.89% 126.47% 116.04% 119.43%
Benefitpayments,includingrefund
118
Planfiduciarynetposition
CITY OF MIRAMAR, FLORIDA REQUIRED SUPPLEMENTARYINFORMATION SCHEDULE OF CHANGES IN NETPENSION LIABILITYAND RELATED RATIOS LASTNINE FISCALYEARS
NotestoSchedule:
(1)Scheduleisintendedtoshowinformationfor10years.Informationisnotavailableforyearspriorto2015.Asinformationisavailableitwillbepresented.
(2)CoveredpayrollforfiscalyearsendingSeptember30,2015throughSeptember30,2016reflecttotalpayroll. Allotheryearsshowpensionableearnings.
PoliceOfficers’ PoliceOfficers’ PoliceOfficers’ PoliceOfficers’ PoliceOfficers’ PoliceOfficers’ PoliceOfficers’ PoliceOfficers’ PoliceOfficers’ RetirementPlan RetirementPlan RetirementPlan RetirementPlan RetirementPlan RetirementPlan RetirementPlan RetirementPlan RetirementPlan 2023 2022 2021 2020 2019 2018 2017 2016 2015 Totalpensionliability Servicecost $ 4,872,499 $ 4,536,932 $ 4,855,800 $ 4,753,171 $ 4,712,293 $ 4,638,937 $ 4,289,372 $ 4,802,698 $ 4,796,591 Interestonthetotalpensionliability 21,688,098 19,988,134 18,779,132 17,765,393 17,007,515 15,723,277 14,283,076 13,608,605 12,670,142 Differencebetweenexpectedand actualexperience 9,641,202 2,698,177 (528,782) 3,429,985 4,426,169 7,549,752 (4,524,095) (52,170) 583,516 Changesofassumptions — — — (7,316,988) — — 1,484,086 — — Benefitpayments,includingrefunds ofemployeecontributions (10,840,461) (9,592,808) (7,892,762) (7,328,077) (6,765,640) (6,265,313) (5,529,606) (4,915,739) (4,279,408) Netchangeintotalpensionliability 25,361,338 17,630,435 15,213,388 11,303,484 19,380,337 21,646,653 10,002,833 13,443,394 13,770,841 Totalpensionliability-beginning 300,736,506 283,106,071 267,892,683 256,589,199 237,208,862 215,562,209 205,559,376 192,115,982 178,345,141 Totalpensionliability-ending(a) 326,097,844 300,736,506 283,106,071 267,892,683 256,589,199 237,208,862 215,562,209 205,559,376 192,115,982
Contributions-employer 10,452,728 10,558,472 10,676,953 10,031,170 9,943,770 8,671,513 8,154,753 8,126,541 8,245,372 Contributions-employee 3,232,165 3,468,020 3,163,877 2,531,825 2,808,627 2,817,974 2,475,797 2,466,122 2,137,015 Netinvestmentincome(loss) (21,222,680) 47,746,433 10,169,884 5,916,882 12,387,268 18,534,179 11,010,659 (2,535,420) 8,789,423
(10,840,461) (9,592,808) (7,892,762) (7,328,077) (6,765,640) (6,265,313) (5,529,606) (4,915,739) (4,279,408) Administrativeexpense (268,392) (203,548) (278,535) (187,532) (205,140) (179,210) (273,577) (188,604) (161,863) Netchangeinplanfiduciarynetposition (18,646,640) 51,976,569 15,839,417 10,964,268 18,168,885 23,579,143 15,838,026 2,952,900 14,730,539 Planfiduciarynetposition-beginning 256,959,885 204,983,316 189,143,899 178,179,631 160,010,746 136,431,603 120,593,577 117,640,677 102,910,138 Planfiduciarynetposition-ending(b) $ 238,313,245 $ 256,959,885 $ 204,983,316 $ 189,143,899 $ 178,179,631 $ 160,010,746 $ 136,431,603 $ 120,593,577 $ 117,640,677 City'snetpensionliability-ending(a)-(b) $ 87,784,599 $ 43,776,621 $ 78,122,755 $ 78,748,784 $ 78,409,568 $ 77,198,116 $ 79,130,606 $ 84,965,799 $ 74,475,305 PlanFiduciaryNetpositionasapercentage ofthetotalpensionliability 73.08% 85.44% 72.41% 70.60% 69.44% 67.46% 63.29% 58.67% 61.23% Coveredpayroll(2) $ 15,443,392 $ 15,242,242 $ 13,454,800 $ 14,543,779 $ 14,289,472 $ 12,476,703 $ 13,104,019 $ 19,489,816 $ 19,072,327 Netpensionliabilityasapercentageof coveredpayroll 568.43% 287.21% 580.63% 541.46% 548.72% 618.74% 603.87% 435.95% 390.49%
Benefitpayments,includingrefund ofmembercontributions
119
Planfiduciarynetposition
Benefitpayments,includingrefund ofmembercontributions
CITY OF MIRAMAR, FLORIDA REQUIRED SUPPLEMENTARYINFORMATION SCHEDULE OF CHANGES IN NETPENSION LIABILITYAND RELATED RATIOS LASTNINE FISCALYEARS
NotestoSchedule:
(1)Scheduleisintendedtoshowinformationfor10years.Informationisnotavailableforyearspriorto2015.Asinformationisavailableitwillbepresented.
(2)CoveredpayrollforfiscalyearsendingSeptember30,2015throughSeptember30,2016reflecttotalpayroll. Allotheryearsshowpensionableearnings.
Firefighters’ Firefighters’ Firefighters’ Firefighters’ Firefighters’ Firefighters’ Firefighters’ Firefighters’ Firefighters’ RetirementPlan RetirementPlan RetirementPlan RetirementPlan RetirementPlan RetirementPlan RetirementPlan RetirementPlan RetirementPlan 2023 2022 2021 2020 2019 2018 2017 2016 2015 Totalpensionliability Servicecost $ 3,504,612 $ 3,468,086 $ 3,762,244 $ 4,084,422 $ 3,955,543 $ 3,771,029 $ 3,646,542 $ 3,798,658 $ 3,725,711 Interestonthetotalpensionliability 18,687,637 17,046,502 15,764,581 14,871,566 14,174,095 13,003,307 12,041,077 11,144,885 10,418,341 Differencebetweenexpectedand actualexperience 10,025,102 5,053,705 (944,968) 4,938,169 4,918,614 2,323,495 (63,099) (933,871) 233,686 Changesofassumptions — — — (8,567,703) — — 1,354,378 — — Benefitpayments,includingrefunds ofemployeecontributions (7,735,608) (6,527,261) (5,419,170) (4,443,793) (4,886,434) (5,417,407) (3,361,511) (3,198,410) (3,076,805) Netchangeintotalpensionliability 24,481,743 19,041,032 13,162,687 10,882,661 18,161,818 13,680,424 13,617,387 10,811,262 11,300,933 Totalpensionliability-beginning 257,304,335 238,263,303 225,100,616 214,217,955 196,056,137 182,375,713 168,758,326 157,947,064 146,646,131 Totalpensionliability-ending(a) 281,786,078 257,304,335 238,263,303 225,100,616 214,217,955 196,056,137 182,375,713 168,758,326 157,947,064
Contributions-employer 11,037,505 10,756,732 10,447,773 7,360,286 7,877,780 6,838,126 5,935,050 5,891,097 5,761,839 Contributions-employee 1,876,799 1,798,133 2,191,003 1,336,596 2,777,837 3,724,060 1,268,018 1,158,659 1,068,264 Netinvestmentincome(loss) (35,777,915) 44,813,984 10,860,080 6,129,591 13,833,470 15,252,940 9,476,199 246,290 10,211,465
(7,735,608) (6,527,261) (5,419,170) (4,443,793) (4,886,434) (5,417,407) (3,361,511) (3,198,410) (3,076,805) Administrativeexpense (187,434) (190,233) (184,049) (180,930) (174,259) (199,195) (191,933) (165,198) (151,048) Netchangeinplanfiduciarynetposition (30,786,653) 50,651,355 17,895,637 10,201,750 19,428,394 20,198,524 13,125,823 3,932,438 13,813,715 Planfiduciarynetposition-beginning 235,823,392 185,172,037 167,276,400 157,074,650 137,646,256 117,447,732 104,321,909 100,389,471 86,575,756 Planfiduciarynetposition-ending(b) 205,036,739 235,823,392 185,172,037 167,276,400 157,074,650 137,646,256 117,447,732 104,321,909 100,389,471 City'snetpensionliability-ending(a)-(b) $ 76,749,339 $ 21,480,943 $ 53,091,266 $ 57,824,216 $ 57,143,305 $ 58,409,881 $ 64,927,981 $ 64,436,417 $ 57,557,593 PlanFiduciaryNetpositionasapercentage ofthetotalpensionliability 72.76% 91.65% 77.72% 74.31% 73.32% 70.21% 64.40% 61.82% 63.56% Coveredpayroll(2) $ 10,446,087 $ 9,581,898 $ 9,322,096 $ 10,246,842 $ 11,034,456 $ 11,648,795 $ 11,443,779 $ 14,719,328 $ 12,671,151 Netpensionliabilityasapercentageof coveredpayroll 734.72% 224.18% 569.52% 564.31% 517.86% 501.42% 567.36% 437.77% 454.24%
120
NotestoSchedule:
(1)ThisscheduleispresentedtoillustratetherequirementofGASB73.
(2)TheCity'sExcessBenefitPlanisnotfundedinaGASB-qualifyingtrust.
(3)CurrentlyonlydataforthefiscalyearendingSeptember30,2017throughSeptember30,2023isavailable.
ExcessBenefitPlan 2023 2022 2021 2020 2019 2018 2017 Totalpensionliability Servicecost $ — $ — $ — $ — $ — $ — $ — Interestonthetotalpensionliability 25,445 22,270 26,819 37,624 42,405 30,915 38,186 Changesofbenefitterms — — — — — — — Differencebetweenexpectedand actualexperience 180,280 328,891 30,257 25,344 (111,014) 342,859 — Changesofassumptions (125,811) 15,264 19,443 62,425 (20,574) (36,698) 47,096 Benefitpayments,includingrefundsof employeecontributions (130,474) (126,798) (128,581) (136,410) (143,691) (127,924) (80,569) Other — — — — — — — Netchangeintotalpensionliability (50,560) 239,627 (52,062) (11,017) (232,874) 209,152 4,713 Totalpensionliability-beginning 1,227,092 987,465 1,039,527 1,050,544 1,283,418 1,074,266 1,069,553 Totalpensionliability-ending $ 1,176,532 $ 1,227,092 $ 987,465 $ 1,039,527 $ 1,050,544 $ 1,283,418 $ 1,074,266 CoveredPayroll N/A N/A N/A N/A N/A N/A N/A Totalpensionliabilityasapercentage ofcoveredpayroll N/A N/A N/A N/A N/A N/A N/A
121
CITY OF MIRAMAR, FLORIDA REQUIRED SUPPLEMENTARYINFORMATION SCHEDULE OF CHANGES INTHETOTALPENSION LIABILITYAND RELATED RATIOS (AS REQUIRED BYGASB 73) SEVEN LASTFISCALYEARS
CITY OF MIRAMAR, FLORIDA REQUIRED SUPPLEMENTARYINFORMATION SCHEDULE OF CONTRIBUTIONS LASTTEN FISCALYEARS
Firefighters’RetirementPlan
ConsolidatedRetirementPlan(4)
Notestoschedule:
(1)Reflectstotalpensionablepayrollstartingwithfiscalyearending2015.
(2)FiscalYear2014and2015reflecttotalpayroll.
(3)IncludesCityandStatecontributions.
(4)OnMarch1,2022theCityCommissionadoptedOrdinanceNo.22-08whichcombinedtheGeneralEmployeesandManagementRetirementPlansintoasinglePlan. ThesinglePlanwasrenamedTheCityofMiramarConsolidatedRetirementPlanandTrust.Forcomparativepurposestheinformationpresentedhereinforfiscalyears endingSeptember30,2014throughSeptember30,2021hasbeenrestatedtoincludetheformerGeneralEmployeesandManagementRetirementPlansinformation.
2023 2022 2021 2020 2019 2018 2017 2016 2015 2014 Actuariallydeterminedcontribution(3) $10,684,301 $10,452,727 $10,558,280 $10,573,892 $9,846,084 $9,786,304 $8,521,420 $8,056,136 $8,042,692 $8,120,568 Contributionmadeinrelationtotheactuariallydetermined contribution 10,684,301 10,452,727 10,558,280 10,573,892 9,846,084 9,786,304 8,521,420 8,056,136 8,042,692 8,120,568 Contributiondeficiency(excess) $ — $ — $ — $ — $ — $ — $ — $ — $ — $ — Coveredemployeepayroll(2) $15,443,392 $15,242,242 $15,242,242 $13,454,800 $14,543,779 $14,289,472 $12,476,703 $13,104,019 $19,489,816 $19,072,327 Contributionsasapercentageofcoveredemployeepayroll 69.2% 68.6% 69.3% 78.6% 67.7% 68.5% 68.3% 61.5% 41.3% 42.6%
PoliceOfficers’RetirementPlan
2023 2022 2021 2020 2019 2018 2017 2016 2015 2014 Actuariallydeterminedcontribution(3) $11,647,860 $11,037,505 $10,543,582 $9,176,563 $7,063,958 $6,575,065 $6,040,012 $5,150,913 $5,107,415 $4,843,956 Contributionmadeinrelationtotheactuariallydetermined contribution 11,647,880 11,037,505 10,543,582 9,176,563 7,063,958 6,575,065 6,040,012 5,150,913 5,115,693 4,843,956 Contributiondeficiency(excess) $ — $ — $ — $ — $ — $ — $ — $ — $ (8,278) $ — Coveredemployeepayroll(2) $10,446,087 $9,581,898 $9,327,254 $9,236,428 $10,246,842 $11,034,456 $11,648,795 $11,443,779 $14,719,328 $12,671,151 Contributionsasapercentageofcoveredemployeepayroll 111.5% 115.2% 113.0% 99.4% 68.9% 59.6% 51.9% 45.0% 34.8% 38.2%
2023 2022(4) 2021 2020 2019 2018 2017 2016 2015 2014 Actuariallydeterminedcontribution $9,508,735 $9,578,031 $9,265,238 $8,505,956 $7,660,577 $7,490,994 $6,288,284 $5,860,729 $5,386,065 $5,008,582 Contributionmadeinrelationtotheactuariallydetermined contribution 9,508,735 9,578,031 9,265,238 8,505,956 7,660,577 7,490,994 6,288,284 5,867,339 5,386,065 5,008,582 Contributiondeficiency(excess) $ — $ — $ — $ — $ — $ — $ — $ (6,610) $ — $ — Coveredemployeepayroll(1) $38,084,738 $35,922,271 $35,334,437 $35,331,501 $31,395,196 $30,241,307 $29,329,546 $25,494,844 $24,283,084 $20,820,506 Contributionsasapercentageofcoveredemployeepayroll 25.0% 26.6% 26.2% 24.1% 24.4% 24.8% 21.4% 23.0% 22.2% 24.1%
122
CITY OF MIRAMAR, FLORIDA REQUIRED SUPPLEMENTARYINFORMATION NOTESTO SCHEDULE OF CONTRIBUTIONS SEPTEMBER 30, 2023
NotestoSchedule:
ValuationDate:October1,2021
Notes:ActuariallydeterminedcontributionsarecalculatedasofOctober1,whichistwoyearspriortotheendofthefiscalyearinwhichcontributionsarereported.
Thefollowingactuarialmethodsandassumptionswereusedtodeterminecontributionratesreportedinthecontributionschedulefor2023.
ActuarialMethod: Actuarialcostmethod
Actuarialassumptions:
Assumedannualsalaryincreases*
Retirementage Experience-basedtableofrates Experience-basedtableofrates Experience-basedtableofrates
Mortalityrates PUB-2010Headcount-WeightedMortality TablesasusedbytheFloridaRetirement System(FRS)intheirJuly1,2021 actuarialvaluation(withmortality improvementsprojectedtoallfutureyears after2010usingScaleMP-2018).Florida StatutesChapter112.63(1)(f)mandates theuseofmortalitytablesfromoneofthe twomostrecentlypublishedFRSactuarial valuationreports.
Pre-Retirement:FemaleNonDisabled:PUB-2010HeadcountWeighted SafetyEmployeeFemaleTable,set forward1year,ScaleMP-2018
Pre-Retirement:MaleNon-Disabled: PUB-2010HeadcountWeightedSafety BelowMedianEmployeeMaleTable,set forward1year,scaleMP-2018
Post-Retirement:FemaleNon-Disabled: PUB-2010HeadcountWeightedSafety HealthyRetireeFemaleTable,set forward1year,ScaleMP-2018
Post-Retirement:MaleNon-Disabled: PUB-2010HeadcountWeightedSafety BelowMedianHealthyRetireeMale Table,setforward1year,ScaleMP-2018
Pre-RetirementandPost-Retirement: FemaleDisabled:80%PUB-2010 HeadcountWeightedGeneralDisabled RetireeFemaleTable;20%PUB-2010 HeadcountWeightedSafetyDisabled RetireeFemaleTable,ScaleMP-2018
MaleDisabled:80%PUB-2010
HeadcountWeightedGeneralDisabled RetireeMaleTable;20%PUB-2010
HeadcountWeightedSafetyDisabled RetireeMaleTable,ScaleMP-2018
Pre-Retirement:FemaleNonDisabled:PUB-2010HeadcountWeightedSafety EmployeeFemaleTable,setforward1year, ScaleMP-2018
Pre-Retirement:MaleNon-Disabled:PUB-2010 HeadcountWeightedSafetyBelowMedian EmployeeMaleTable,setforward1year,scale MP-2018
Post-Retirement:FemaleNon-Disabled: PUB-2010HeadcountWeightedSafetyHealthy RetireeFemaleTable,setforward1year,Scale MP-2018
Post-Retirement:MaleNon-Disabled:PUB-2010 HeadcountWeightedSafetyBelowMedian HealthyRetireeMaleTable,setforward1year, ScaleMP-2018
Pre-RetirementandPost-Retirement:Female Disabled:80%PUB-2010HeadcountWeighted GeneralDisabledRetireeFemaleTable;20% PUB-2010HeadcountWeightedSafetyDisabled RetireeFemaleTable,ScaleMP-2018
MaleDisabled:80%PUB-2010Headcount WeightedGeneralDisabledRetireeMaleTable; 20%PUB-2010HeadcountWeightedSafety DisabledRetireeMaleTable,ScaleMP-2018
*includesinflation
NotestoSchedule:
(1)OnMarch1,2022theCityCommissionadoptedOrdinanceNo.22-08whichcombinedtheGeneralEmployeesandManagementRetirementPlansintoasinglePlan. ThesinglePlanwasrenamedTheCityofMiramarConsolidatedRetirementPlanandTrust
Consolidated RetirementPlan
PoliceOfficers’ RetirementPlan
Firefighters’ RetirementPlan
2023(1)
2023
2023
Entryagenormal
20years 30years 15years
Entryagenormal
Entryagenormal Amortizationmethod LevelPercent,closed Leveldollar,closed Levelpercentofpayroll,closed Remainingamortizationperiod
Assetvaluationmethod 5yearsmoothedmarket 5yearsmoothedmarket 5yearsmoothedmarket
Investmentrateofreturn 7.00% 7.00% 7.25%
4.00%-7.50% 5.25% 0 Inflation 2.50% 3.00% 3.00%
123
CITY OF MIRAMAR, FLORIDA REQUIRED SUPPLEMENTARYINFORMATION SCHEDULE OFTHE CITY'S PROPORTIONATE SHARE OFTHE NETPENSION LIABILITY FLORIDARETIREMENTSYSTEM PENSION PLAN (FRS)AND (HIS) LASTNINE FISCALYEARS (1) (2)
HealthInsuranceSubsidyPensionPlan(HIS)
Notes to schedule:
(1) The amounts presented for each year were determined as of the measurement date, June 30
(2) Schedule is intended to show information for 10 years. Information is not available for years prior to 2015. As information is available it will be presented.
2023 2022 2021 2020 2019 2018 2017 2016 2015 City'sproportionoftheFRSnetpensionliability 0.0019095% 0.0019334% 0.0020635% 0.0023740% 0.0025920% 0.0025648% 0.0044265% 0.0018596% 0.0024391% City'sproportionateshareoftheFRSnetpensionliability $ 760,865 $ 719,389 $ 155,875 $ 1,028,912 $ 892,650 $ 772,534 $ 1,309,339 $ 469,540 $ 315,044 City'scoveredemployeepayroll $ 180,111 $ 180,111 $ 180,111 $ 180,111 $ 181,179 $ 180,111 $ 180,111 $ 180,111 $ 174,368 422% 399% 87% 571% 493% 429% 727% 261% 181% FRSplanfiduciarynetpositionasapercentageofthetotalpensionliability 82.38% 82.89% 96.40% 78.85% 82.61% 84.26% 83.89% 84.88% 92.00%
FloridaRetirementSystemPlan(FRS)
2023 2022 2021 2020 2019 2018 2017 2016 2015 City'sproportionoftheHISnetpensionliability 0.0004547% 0.0004943% 0.0005088% 0.0005190% 0.0005503% 0.0005515% 0.0010112% 0.0003620% 0.0004735% City'sproportionateshareoftheHISnetpensionliability $ 72,205 $ 52,350 $ 62,411 $ 63,367 $ 61,571 $ 58,369 $ 108,123 $ 42,195 $ 48,292 City'scoveredemployeepayroll $ 180,111 $ 180,111 $ 180,111 $ 180,111 $ 181,179 $ 180,111 $ 180,111 $ 180,111 $ 174,368 City'sproportionateshareoftheHISnetpensionliability asapercentageofcoveredemployeepayroll 40% 29% 35% 35% 34% 32% 60% 23% 28% HISplanfiduciarynetpositionasapercentageofthetotalpensionliability 4.12% 4.81% 3.56% 3.00% 2.63% 2.15% 1.64% 0.97% 0.50%
124
CITY OF MIRAMAR, FLORIDA REQUIRED SUPPLEMENTARY INFORMATION SCHEDULE OF CITY CONTRIBUTIONS FLORIDA RETIREMENT SYSTEM PENSION PLAN (FRS AND HIS) LAST NINE FISCAL YEARS (1)
Florida Retirement System Plan (FRS)
Health Insurance Subsidy Plan (HIS)
Notes to Schedule: (1) Schedule is intended to show information for 10 years. Information is not available for years prior to 2015. As information is available it will be presented.
2023 2022 2021 2020 2019 2018 2017 2016 2015 Contractually required FRS contribution $ 96,006 $ 92,802 $ 79,638 $ 78,943 $ 75,906 $ 76,775 $ 72,466 $ 70,748 $ 71,095 FRS contributions in relation to the contractually required contribution (96,006) (92,802) (79,671) (78,888) (76,537) (76,258) (70,885) (98,583) (53,332) Contribution deficiency (excess) $ — $ — $ (33) $ 55 $ (631) $ 517 $ 1,581 $ (27,835) $ 17,763 City's covered payroll $ 180,111 $ 180,111 $ 180,111 $ 180,111 $ 181,179 $ 180,111 $ 180,111 $ 180,111 $ 174,368 FRS contributions as a percentage of covered payroll 57.00 % 51.52 % 44.22 % 43.83 % 41.90 % 42.34 % 39.36 % 54.73 % 30.59 %
2023 2022 2021 2020 2019 2018 2017 2016 2015 Contractually required HIS contribution $ 2,990 $ 2,989 $ 2,990 $ 2,990 $ 3,008 $ 2,989 $ 2,989 $ 2,989 $ 2,894 HIS contributions in relation to the contractually required contribution (2,990) (2,989) (2,990) (2,990) (3,008) (2,989) (2,989) (2,989) (2,894) Contribution deficiency (excess) $ — $ — $ — $ — $ — $ — $ — $ — $ — City's covered payroll $ 180,111 $ 180,111 $ 180,111 $ 180,111 $ 181,179 $ 180,111 $ 180,111 $ 180,111 $ 174,368 HIS contributions as a percentage of covered payroll 1.66 % 1.66 % 1.66 % 1.66 % 1.66 % 1.66 % 1.66 % 1.66 % 1.66 %
125
CITY OF MIRAMAR, FLORIDA
MeasurementDateasofSeptember30 2022 2021 2020 2019 2018 2017 ReportingDateasofSeptember30 2023 2022 2021 2020 2019 2018 TotalOPEBliability Servicecost $ 3,290,174 $ 2,963,469 $ 2,671,684 $ 1,985,639 $2,437,784 $2,328,296 InterestonthetotalOPEBliability 1,239,910 1,230,644 1,358,507 1,592,005 1,661,617 1,569,089 Changesofbenefitterms 600,006 — — 30,047 213,958 — Differencebetweenexpectedand actualexperienceofthetotalOPEBliability 831,541 632,866 2,481,210 — (2,624,313) — Changesofassumptions (13,008,716) 1,634,477 (3,433,225) 5,125,750 (5,680,947) — Benefitpayments (2,006,828) (1,663,767) (1,748,590) (1,423,229) (1,504,835) (1,221,556) NetchangeintotalOPEBliability (9,053,913) 4,797,689 1,329,586 7,310,212 (5,496,736) 2,675,829 TotalOPEBliability-beginning 53,730,162 48,932,473 47,602,887 40,292,675 45,789,411 43,113,582 TotalOPEBliability-ending 44,676,249 53,730,162 48,932,473 47,602,887 40,292,675 45,789,411 Planfiduciarynetposition EmployercontributionstotheOPEBTrustFund 500,000 500,000 1,000,000 — — — EmployercontributionsnotdepositedintheOPEBTrustFund 2,006,828 1,663,767 1,748,590 — — — OPEBplannetinvestment(loss)income (330,308) 163,793 (3,738) — — — BenefitpaymentsfromtheOPEBTrustFund — — — — — — BenefitpaymentsnotreimbursedbytheOPEBTrustFund (2,006,828) (1,663,767) (1,748,590) — — — OPEBplanadministrativeexpense — — — — — — Netchangeinplanfiduciarynetpositon 169,692 663,793 996,262 — — — Planfiduciarynetposition-beginning 1,660,055 996,262 — — — — Planfiduciarynetposition-ending 1,829,747 1,660,055 996,262 — — — NetOPEBliability-ending $ 42,846,502 $ 52,070,107 $ 47,936,211 $ 47,602,887 $40,292,675$45,789,411 PlanfiduciarynetpositionasapercentageofTotalOPEBLiability 4.10% 3.09% 2.04% —% —% —% CoveredPayroll $ 92,176,666 $ 94,449,414 $ 84,695,713 $ 82,571,170 $80,016,127$73,812,507 TotalOPEBliabilityasapercentage ofcoveredpayroll 46.48% 55.13% 56.60% 57.65% 50.36% 62.03% Schedule
intended to
is
show information for 10 years. Additional years will be presented as they become available.
126
REQUIRED SUPPLEMENTARY INFORMATION SCHEDULE OF CHANGES IN THE CITY'S NET OPEB LIABILITY AND RELATED RATIOS
CITY OF MIRAMAR, FLORIDA
REQUIRED SUPPLEMENTARY INFORMATION
NOTES TO THE SCHEDULE OF CHANGES IN THE CITY'S NET OPEB LIABILITY AND RELATED RATIOS
The net OPEB liability of $42,846,502 is determined as of the September 30, 2022 measurement date and is reflected in the City’s Statement of Net Position as of September 30, 2023. For the reporting dates in 2018-2020 presented on the previous page, there were no trust assets to offset the total OPEB liability as of the measurement date one year prior.
The following assumption changes have been reflected for the September 30, 2022 measurement date as compared to the September 30, 2021 measurement date:
1. The discount rate was changed from 2.19% to 4.40%.
2. The medical/Rx claims costs and premiums were updated based on actual 2022 premiums information provided.
3. The long-term health trend assumption was revised based on the updated November 2021 Getzen Model.
4. Changes reflected in the September 30, 2022 City of Miramar Firefighters’ OPEB Actuarial Valuation Report dated January 5, 2024 include an update to the retiree medical coverage acceptance assumption from 60% (30% for single enrollment and 30% for dual enrollment) to 70% (35% for single enrollment and 35% for dual enrollment).
The following benefit change has been reflected for the September 30, 2022 measurement date as compared to the September 30, 2021 measurement date:
1. For Firefighters, the retiree contributions were updated to reflect the MFITF subsidy of approximately 3% of gross premiums effective January 1, 2022, as determined by the MFITF board of trustees.
For Firefighters, the MFITF subsidy in the retiree contributions was updated from 3% to 6% of gross premiums by the MFITF board of trustees effective January 1, 2023 (between the measurement date and the reporting date). While this may have a significant effect on the net OPEB liability, the amount of the resultant change on the net OPEB liability is not known.
127
SCHEDULE
CITY OF MIRAMAR, FLORIDA
Date as of September 30 2023 2022 2021 2020 Reporting Date as of September 30 2023 2022 2021 2020 Total OPEB liability Service cost $ 2,201,641 $ 3,223,148 $ 3,144,153 $ 2,651,329 Interest on the total OPEB liability 1,997,768 1,221,241 1,311,490 1,357,948 Changes of benefit terms 1,158,018 — — (1,954,764) Difference between expected and actual experience of the total OPEB liability 676,072 641,362 3,605,927 1,618,138 Changes of assumptions (1,296,491) (12,495,049) (1,994,958) (1,026,474) Benefit payments (1,922,187) (2,006,828) (1,663,767) (1,748,590) Net change in total OPEB liability 2,814,821 (9,416,126) 4,402,845 897,587 Total OPEB liability-beginning 43,487,193 52,903,319 48,500,474 47,602,887 Total OPEB liability-ending 46,302,014 43,487,193 52,903,319 48,500,474 Plan fiduciary net position Employer contributions to the OPEBTrust Fund 500,000 500,000 500,000 1,000,000 Employer contributions not deposited in the OPEBTrust Fund 1,922,187 2,006,828 1,663,767 1,748,590 Net investment income 200,707 (330,308) 163,793 (3,738) Benefit payments from the OPEBTrust Fund — — — — Benefit payments not reimbursed by the OPEBTrust Fund (1,922,187) (2,006,828) (1,663,767) (1,748,590) Administrative expense — — — — Net change in plan fiduciary net positon 700,707 169,692 663,793 996,262 Plan fiduciary net position- beginning 1,829,747 1,660,055 996,262 — Plan fiduciary net position- ending $ 2,530,454 $ 1,829,747 $ 1,660,055 $ 996,262 City's net OPEB liability- ending $ 43,771,560 $ 41,657,446 $ 51,243,264 $ 47,504,212 Plan fiduciary net position as a percentage ofTotal OPEB Liability 5.47 % 4.21 % 3.14 % 2.05 % Covered Payroll $100,317,149 $ 92,176,666 $ 94,449,414 $ 84,695,713 Net OPEB liability as a percentage of covered payroll 43.63 % 45.19 % 54.25 % 56.09 % Notes to Schedule: Covered employee payroll presented above are estimates based on data submitted for valuation purposes. GASB Statement 74 defines Covered-employee payroll as the payroll of employees that are provided with OPEB Benefits through the OPEB Plan, including employees terminating during the reporting period. Schedule is intended to show information for 10 years. Additional years will be presented as they become available.
Measurement
REQUIRED SUPPLEMENTARY INFORMATION OTHER POST EMPLOYMENT BENEFIT PLAN
OF CHANGES IN THE CITY'S NET OPEB LIABILITYAND RELATED RATIOS 128
CITY OF MIRAMAR, FLORIDA
REQUIRED SUPPLEMENTARY INFORMATION
SCHEDULE OF ANNUAL MONEY WEIGHTED RATE OF RETURN
Police Officers’ Retirement Plan
Firefighters’ Retirement Plan
Consolidated Retirement Plan*
Former Management Retirement Plan
OPEB Trust Fund**
Note: Estimated annual-money-weighted rate of return, net of investment expenses.
* On March 1, 2022 the City Commission adopted Ordinance No. 22-08 which combined the General Employees and Management Retirement Plans into a single Plan. This single Plan was renamedThe City of Miramar Consolidated Retirement Plan andTrust.
** The OPEBTrust Fund was established onAugust 21, 2019. Additional information will be provided as it becomes available.
2023 2022 2021 2020 2019 2018 2017 2016 2015 2014 8.30% (7.60)% 23.20% 6.60% 3.00% 8.10% 13.60% 9.40% (1.80)% 9.50%
2022 2021 2020 2019 2018 2017 2016 2015 2014 10.21% (15.00)% 24.10% 6.10% 3.80% 9.90% 12.50% 9.10% 0.40% 11.90%
2023
2023 2022 2021 2020 2019 2018 2017 2016 2015 2014 5.93% (11.79)% 22.89% 7.62% 4.61% 10.88% 11.25% 10.27% 1.78% 11.11%
2023 2022 2021 2020 2019 2018 2017 2016 2015 2014 — — 22.97 % 8.20 % 4.52 % 10.88 % 11.10 % 9.90 % 1.57 % 11.41 %
2023 2022 2021 9.11% (15.76)% 12.25%
129
COMBINING FINANCIAL STATEMENTS
NON-MAJOR GOVERNMENTAL FUNDS
SPECIAL REVENUE FUNDS
Special revenue funds are used to account for specific revenues that are restricted or committed to expenditures for particular purposes other than debt service or capital projects.
Police Education Fund – This fund was established to pay certain training costs of law enforcement officers.
Federal Grant Fund – This fund was established to account for revenues and expenditures associated with funding from Federal granting agencies which is not recorded in a separate special revenue fund.
State Grant Fund – This fund was established to account for revenues and expenditures associated with funding from State granting agencies which is not recorded in a separate special revenue fund.
Neighborhood Stabilization Program Fund – This fund was established to account for revenues and expenditures associated with the Neighborhood Stabilization Program in order to develop viable urban communities by providing decent housing and a suitable living environment.
Public Safety Outside Service Fund – This fund was established to account for revenues and expenditures associated with services provided by off-duty police officers in private customer details to the various businesses and homeowner associations.
Law Enforcement Trust Fund – This fund was established to account for revenues generated by police department confiscations.
Community Development Block Grant (CDBG) Fund – This fund was established to award money to eligible applicants for minor home repair/weatherization, commercial rehabilitation, and to provide for the cost of equipment and renovations for community parks.
State Housing Initiatives Partnership (S.H.I.P.) Program – This fund was established to award money for deferred loan grants to eligible applicants for minor home repair/weatherization and for purchase assistance programs.
Affordable Housing Trust Fund –This fund was established to address the need for workforce housing in the City. Funding may be comprised of the sale of City owned property, Broward County Affordable Housing Trust Funds, grants, or donations and mandatory or voluntary payments by developers.
DEBT SERVICE FUNDS
Debt Service Fund – This fund was established to account for the accumulation of transfers from other funds and payment of principal and interest and fiscal charges on the City’s debt which are payable from non- ad valorem taxes.
CAPITAL PROJECTS FUNDS
Street Construction and Maintenance Fund – In accordance with State Statute 336.59, this fund was established to account for the City’s proportional share of state revenue sharing and local option gas tax funds. Funds are limited to be used for the purchase of transportation facilities and the improvement and maintenance of roads and streets within the City.
Police Capital Improvement Fund – This fund was established to collect police impact fees to be used for the acquisition and development of police facilities.
Fire and EMS Capital Improvement Fund – This fund was established to collect fire impact fees to be used for the acquisition and development of fire facilities.
Park Development Fund – This fund was established to account for the collections of park and recreation impact fees to be used for the acquisition and development of park and recreational facilities and sites.
Capital Projects Fund – This fund was established to account for financial resources used for the acquisition and/or construction of major capital assets within the City, except for those financed by proprietary funds.
CIP Revenue Bonds 2013 Fund – This fund was established to account for the proceeds of the Special Obligation Refunding and Improvement Revenue Bonds, Series 2013. Funds are limited in use on construction of various projects within the City.
CIP Loan 2017 Fund – This fund was established to account for the proceeds of the Special Obligation Revenue Note, Series 2017, to finance the cost of various capital improvements within the City.
CIP Grants Fund – This fund was established to account for capital improvements funded through grant proceeds.
CIP Loan 2020 Fund (non taxable) – This fund was established to account for the proceeds of the Special Obligation Revenue Note, Series 2019A to finance the cost of various capital improvements within the City.
CIP Loan 2020 Fund (taxable) – This fund was established to account for the proceeds of the Special Obligation Revenue Note, Series 2019B to finance the cost of various capital improvement within the City.
CIP Loan 2021 Fund (taxable) – This fund was established to account for the proceeds of the Special Obligation Revenue Note, Series 2021 to finance the cost of various capital improvement within the City and the refunding of certain outstanding indebtedness of the City.
SEPTEMBER 30, 2023
Special Revenue Debt Service Capital Projects Total Non-Major Governmental Funds
Pooled cash and cash equivalents $ 10,288,591 $ 1,689,087 $ 22,702,029 $ 34,679,707 Receivables, net 670,019 — — 670,019 Due from other governments 2,304,763 — 3,281,483 5,586,246 TOTALASSETS $ 13,263,373 $ 1,689,087 $ 25,983,512 $ 40,935,972
Accounts payable $ 327,006 $ — $ 2,100,784 $ 2,427,790 Retainage payable 40,000 — 410,872 450,872 Accrued liabilities 41,634 — — 41,634 Due to other funds 1,253,284 1,610,032 2,424,370 5,287,686 Unearned revenue 6,860,876 — 507,112 7,367,988 TOTALLIABILITIES 8,522,800 1,610,032 5,443,138 15,575,970 FUND
Restricted for: Housing 3,374,282 — — 3,374,282 Law enforcement 1,277,276 — — 1,277,276 CulturalArts 89,015 89,015 Street construction and maintenance — — 1,412,491 1,412,491 Park development — — 4,047,123 4,047,123 Capital improvement — — 15,080,760 15,080,760 Debt Service — 79,055 — 79,055 TOTALFUND BALANCES 4,740,573 79,055 20,540,374 25,360,002 TOTALLIABILITIESAND FUND BALANCES $ 13,263,373 $ 1,689,087 $ 25,983,512 $ 40,935,972 CITY OF MIRAMAR, FLORIDA COMBINING BALANCE SHEET NON-MAJOR GOVERNMENTAL FUNDS
ASSETS
LIABILITIES
BALANCES
130
CITY OF MIRAMAR, FLORIDA
COMBINING STATEMENT OF REVENUES, EXPENDITURES AND CHANGES IN FUND BALANCES
FISCAL YEAR ENDED SEPTEMBER 30, 2023
Special Revenue Debt Service Capital Projects Total Non-Major Governmental Funds REVENUES Intergovernmental $ 6,523,872 $ — $ 9,437,331 $ 15,961,203 Charges for services 1,586,861 — — 1,586,861 Fines and forfeitures 605,249 — — 605,249 Impact fees — — 117,145 117,145 Investment income 215,235 11,419 789,514 1,016,168 Miscellaneous 35,000 — — 35,000 TOTALREVENUES 8,966,216 11,419 10,343,990 19,321,626 EXPENDITURES Current: General government 1,023 — 11,047 12,070 Public safety 2,832,388 — — 2,832,388 Social Services 258,430 — — 258,430 Parks and Recreation 37,669 — — 37,669 CulturalArts 875 — — 875 Economic environment 3,135,498 — — 3,135,498 Grants/aid 137,266 — — 137,266 Capital outlay 335,982 — 16,097,127 16,433,109 Debt Service: Principal — 8,337,826 — 8,337,826 Interest — 3,835,221 — 3,835,221 Fiscal charges — 2,931 — 2,931 TOTALEXPENDITURES 6,739,131 12,175,978 16,108,174 35,023,284 Excess (deficiency) of revenues over (under) expenditures 2,227,085 (12,164,559) (5,764,184) (15,701,658) OTHER FINANCING SOURCES (USES) Transfers in — 11,762,257 1,950,000 13,712,257 Transfers out (1,659,505) — (5,045,841) (6,705,346) TOTALOTHER FINANCING SOURCES (USES) (1,659,505) 11,762,257 (3,095,841) 7,006,911 Net changes in fund balances 567,580 (402,302) (8,860,025) (8,694,747) Fund balances, beginning 4,172,993 481,357 29,400,399 34,054,749 Fund balances, ending $ 4,740,573 $ 79,055 $ 20,540,374 $ 25,360,002
NON-MAJOR GOVERNMENTAL FUNDS
131
CITY OF MIRAMAR, FLORIDA COMBINING BALANCE SHEET
NON-MAJOR GOVERNMENTAL FUNDS
SPECIAL REVENUE FUNDS
SEPTEMBER 30, 2023
Police Education Fund FederalGrant Fund StateGrant Fund Neighborhood Stabilization ProgramFund PublicSafety OutsideService Fund Law Enforcement TrustFund CDBGFund SHIP Program Fund Affordable Housing TrustFund TotalNonMajorSpecial Revenue Funds ASSETS Pooledcashandcashequivalents $ 159,125 $ 150,172 $ 147,792 $ 328,844 $ 497,838 $1,077,851 $ — $1,627,952 $6,299,016 $10,288,591 Receivables,net — — — — 660,119 9,900 — — — 670,019 Duefromothergovernments — 1,993,208 79,247 — — 10,416 178,393 43,500 — 2,304,765 TOTALASSETS $ 159,125 $ 2,143,380 $ 227,039 $ 328,844 $ 1,157,957 $1,098,167 $ 178,393 $1,671,452 $6,299,016 $13,263,373 LIABILITIES Accountspayable $ — $ 77,866 $ 31,756 $ — $ 11,151 $ 18,957 $ 32,821 $ 154,455 $ — $ 327,006 Retainagepayable — — 40,000 — — — — — — 40,000 Accruedliabilities — 41,634 — — — — — — — 41,634 Duetootherfunds — — — — 1,107,865 — 145,419 — — 1,253,284 Unearnedrevenue — 1,934,866 155,283 328,844 — — 152 1,441,731 3,000,000 6,860,876 TOTALLIABILITIES — 2,054,366 227,039 328,844 1,119,016 18,957 178,393 1,596,186 3,000,000 8,522,800 FUNDBALANCES Restrictedfor: Housing — — — — — — — 75,266 3,299,016 3,374,282 Lawenforcement 159,125 — — — 38,941 1,079,211 — — — 1,277,277 CulturalArts — 89,014 — — — — — — — 89,014 TOTALFUNDBALANCES 159,125 89,014 — — 38,941 1,079,211 — 75,266 3,299,016 4,740,573 TOTALLIABILITIESAND FUNDBALANCES $ 159,125 $ 2,143,380 $ 227,039 $ 328,844 $ 1,157,957 $1,098,167 $ 178,393 $1,671,452 $6,299,016 $13,263,373
132
EXPENDITURES
CITY OF MIRAMAR, FLORIDA
COMBINING STATEMENT OF REVENUES, EXPENDITURES AND CHANGES IN FUND BALANCES NON-MAJOR GOVERNMENTAL FUNDS SPECIAL REVENUE FUNDS
FISCAL YEAR ENDED SEPTEMBER 30, 2023
Police Education Fund FederalGrant Fund StateGrant Fund PublicSafety Outside Service Fund Law Enforcement TrustFund CDBGFund SHIPProgram Fund Affordable HousingTrust Fund TotalNonMajorSpecial Revenue Funds REVENUES Intergovernmental $ — $ 2,693,678 $ 699,752 $ — $ — $ 2,180,388 $ 950,052 $ — $ 6,523,871 Chargesforservices — — — 1,586,861 — — — — 1,586,861 Finesandforfeitures 23,773 — — — 581,476 — — — 605,249 Investmentincome 318 40,784 — — 25,484 — 52,024 96,626 215,235 Miscellaneousrevenue — — 35,000 — — — — 35,000 TOTALREVENUES 24,090 2,734,462 734,752 1,586,861 606,960 2,180,388 1,002,076 96,626 8,966,216
Current: Generalgovernment — — 1,024 — — — — — 1,024 Publicsafety 275 1,292,619 — 1,458,333 81,160 — — — 2,832,387 SocialServices — 164,343 94,087 — — — — — 258,430 CulturalArts — — 875 — — — — — 875 ParksandRecreation — — 37,669 — — — — — 37,669 Economicenvironment — 71,545 10,000 — — 2,047,791 950,052 66,110 3,135,499 Grants/aid — 4,669 — — — 132,597 — — 137,265 Capitaloutlay — 116,933 185,163 — 23,886 — — — 335,981 TOTALEXPENDITURES 275 1,650,109 328,818 1,458,333 105,046 2,180,388 950,052 66,110 6,739,131 Excess(deficiency)ofrevenuesover (under)expenditures 23,815 1,084,353 405,934 128,528 501,914 — 52,024 30,516 2,227,085 OTHERFINANCINGSOURCESUSES Transfersout — (1,043,570) (405,934) (200,000) (10,000) — — — (1,659,504) TOTALOTHERFINANCING SOURCESUSES — (1,043,570) (405,934) (200,000) (10,000) — — — (1,659,504) Netchangesinfundbalances 23,815 40,783 — (71,472) 491,914 — 52,024 30,516 567,581 Fundbalance,beginning 135,310 48,231 — 110,413 587,297 — 23,242 3,268,500 4,172,993 Fundbalances,ending $ 159,125 $ 89,014 $ — $ 38,941 $ 1,079,211 $ — $ 75,266 $ 3,299,016 $ 4,740,573
133
ASSETS
CITY
BALANCE SHEET
NON-MAJOR GOVERNMENTAL FUND
DEBT SERVICE FUND
SEPTEMBER 30, 2023
Debt Service Fund
Pooled cash and cash equivalents $ 1,689,087
TOTALASSETS $ 1,689,087
LIABILITIES
Due to other funds $ 1,610,032
TOTAL LIABILITIES 1,610,032
FUND BALANCES
Restricted for: Debt service 79,055
TOTAL FUND BALANCES 79,055
TOTAL LIABILITIES AND FUND BALANCE $ 1,689,087
OF MIRAMAR, FLORIDA
134
CITY OF MIRAMAR, FLORIDA
STATEMENT OF REVENUES,
FISCAL YEAR ENDED SEPTEMBER 30, 2023
SOURCES (USES)
Debt Service Fund REVENUES Investment income $ 11,419 TOTAL REVENUES 11,419 EXPENDITURES Principal 8,337,826 Interest 3,835,221 Fiscal charges
TOTAL EXPENDITURES
Transfers in 11,762,257 TOTAL OTHER FINANCING SOURCES 11,762,257 Net change in fund balance (402,302) Fund balance, beginning 481,357 Fund balance, ending $ 79,055
2,931
12,175,978 Deficiency of revenues over expenditures (12,164,559) OTHER FINANCING
EXPENDITURES
DEBT
AND CHANGES IN FUND BALANCES - NON-MAJOR GOVERNMENTAL FUND
SERVICE FUND
135
CITY OF MIRAMAR, FLORIDA COMBINING STATEMENT OF REVENUES, EXPENDITURES AND CHANGES IN FUND BALANCE NON-MAJOR
GOVERNMENTAL FUNDS
CAPITAL PROJECT FUNDS
SEPTEMBER 30, 2023
Street Construction and Maintenance Fund Police Capital Improvement Fund FireandEMS Capital Improvement Fund Park Development Fund Capital Projects Fund CIP Revenue Bond 2013 CIP Loan 2017 CIPGrants Fund CIPLoanNonTaxable2020 CIPLoan Taxable2020 CIPLoan 2021/2022 TotalNonMajor CapitalProjects Funds ASSETS Pooledcashandcashequivalents $ 1,336,534 $ 350,355 $ 242,801 $ 4,265,784 $ 3,520,634 $ 390,080 $ 613,008 $ 507,111 $ 3,020,341 $ 3,671,478 $ 4,783,902 $ 22,702,029 Duefromothergovernments 378,889 — — — — — — 2,902,594 — — — 3,281,483 TOTALASSETS $ 1,715,423 $ 350,355 $ 242,801 $ 4,265,784 $ 3,520,634 $ 390,080 $ 613,008 $ 3,409,705 $ 3,020,341 $ 3,671,478 $ 4,783,902 $ 25,983,512 LIABILITIES Accountspayable $ 302,932 $ — $ — $ 87,261 $ 483,313 $ — $ 9,252 $ 653,184 $ 62,636 $ 415,166 $ 87,041 $ 2,100,784 Retainagepayable — — — 131,400 49,678 20,012 19,999 125,040 2,331 55,141 7,271 410,872 Duetootherfunds — 300,000 — — — — — 2,124,370 — — — 2,424,370 UnearnedRevenue — — — — — — — 507,112 — — — 507,112 TOTALLIABILITIES 302,932 300,000 — 218,661 532,991 20,012 29,251 3,409,706 64,967 470,307 94,312 5,443,138 FUNDBALANCES Restrictedfor: Streetconstructionandmaintenance 1,412,491 — — — — — — — — — — 1,412,491 Parkdevelopment — — — 4,047,123 — — — — — — — 4,047,123 Capitalimprovement — 50,355 242,801 — 2,987,643 370,068 583,758 — 2,955,373 3,201,171 4,689,590 15,080,760 TOTALFUNDBALANCES 1,412,491 50,355 242,801 4,047,123 2,987,643 370,068 583,758 — 2,955,373 3,201,171 4,689,590 20,540,374 TOTALLIABILITIESAND FUNDBALANCES $ 1,715,423 $ 350,355 $ 242,801 $ 4,265,784 $ 3,520,634 $ 390,080 $ 613,009 $ 3,409,706 $ 3,020,340 $ 3,671,478 $ 4,783,902 $ 25,983,512
136
CITY OF MIRAMAR, FLORIDA
COMBINING STATEMENT OF REVENUES, EXPENDITURES AND CHANGES IN FUND BALANCE NON-MAJOR GOVERNMENTAL FUNDS
CAPITAL PROJECT FUNDS
SEPTEMBER 30, 2023
Street Construction and Maintenance Fund Police Capital Improvement Fund Fireand EMS Capital Improvement Fund Park Development Fund Capital Projects Fund CIP Revenue Bond2013 CIP Loan 2017 CIPGrants Fund CIPLoan Non-Taxable 2020 CIPLoan Taxable2020 CIPLoan 2021/2022 TotalNonMajor Capital Projects Funds REVENUES Intergovernmental $ 3,719,586 $ — $ — $ — $ — $ — $ — $ 5,717,746 $ — $ — $ — $ 9,437,331 Impactfees — 27,788 29,788 59,569 — — — — — — — 117,145 InvestmentIncome 26,582 555 517 226,381 179,169 17,005 34,774 — 6,003 189,082 109,448 789,515 TOTALREVENUES 3,746,168 28,343 30,305 285,949 179,169 17,005 34,774 5,717,746 6,003 189,082 109,448 10,343,991 EXPENDITURES Current: Generalgovernment 1,287 481 448 545 1,323 398 163 — 5,669 732 — 11,045 Capitaloutlay 821,954 — — 969,574 3,293,923 161,507 223,467 5,713,705 532,080 1,453,513 2,927,407 16,097,128 TOTALEXPENDITURES 823,241 481 448 970,119 3,295,246 161,905 223,630 5,713,705 537,749 1,454,245 2,927,407 16,108,173 Excess(deficiency)of revenuesover (under)expenditures 2,922,927 27,862 29,857 (684,169) (3,116,077) (144,899) (188,856) 4,041 (531,746) (1,265,163) (2,817,959) (5,764,182) OTHERFINANCING SOURCES(USES) Transfersin — — — — 1,950,000 — — — — — — 1,950,000 Transfersout (3,148,700) (27,500) — (1,865,600) — — — (4,041) — — — (5,045,841) TOTALOTHERFINANCING SOURCES(USES) (3,148,700) (27,500) — (1,865,600) 1,950,000 — — (4,041) — — — (3,095,841) Netchangesinfundbalance (225,773) 362 29,857 (2,549,769) (1,166,077) (144,899) (188,856) — (531,746) (1,265,163) (2,817,959) (8,860,023) Fundbalance,beginning 1,638,263 49,994 212,944 6,596,893 4,153,720 514,967 772,614 — 3,487,120 4,466,335 7,507,550 29,400,399 Fundbalances,ending $ 1,412,490 $ 50,355 $ 242,801 $ 4,047,123 $ 2,987,643 $ 370,068 $ 583,758 $ — $ 2,955,373 $ 3,201,171 $ 4,689,591 $20,540,376
137
Original Budget Final Budget Actual Amounts Variance from Final Budget REVENUES Fines and forfeitures $ 10,400 $ 10,400 $ 23,773 $ 13,373 Investment income 200 200 318 118 TOTAL REVENUES 10,600 10,600 24,090 13,490 EXPENDITURES Public safety 10,600 10,600 275 10,325 TOTAL EXPENDITURES 10,600 10,600 275 10,325 Excess of revenues over expenditures $ — $ — 23,815 $ 23,815 Fund balance, beginning 135,310 Fund balance, ending $ 159,125
BUDGETARY COMPARISON SCHEDULE POLICE EDUCATION FUND FISCAL YEAR ENDED SEPTEMBER 30, 2023 138
CITY OF MIRAMAR, FLORIDA
CITY OF MIRAMAR, FLORIDA
BUDGETARY COMPARISON SCHEDULE
FEDERAL GRANT FUND
FISCAL YEAR ENDED SEPTEMBER 30, 2023
Original Budget Final Budget Actual Amounts Variance from Final Budget REVENUES Intergovernmental $ 2,630,655 $ 12,098,477 $ 2,693,678 $ (9,404,799) Investment income — — 40,784 40,784 TOTAL REVENUES 2,630,655 12,098,477 2,734,462 (9,364,016) EXPENDITURES Current: Public safety — 7,342,824 1,292,619 6,050,205 Social services — 331,838 164,343 167,495 Economic environment — 1,389,009 71,545 1,317,464 Grants/Aid — 125,000 4,669 120,331 Capital outlay — 468,296 116,933 351,363 TOTAL EXPENDITURES — 9,656,967 1,650,109 8,006,858 Excess (deficiency) of revenues over expenditures 2,630,655 2,441,509 1,084,353 (1,357,156) OTHER FINANCING
Transfers out (2,630,655) (2,441,509) (1,043,570) 1,397,939 TOTAL OTHER FINANCING USES (2,630,655) (2,441,509) (1,043,570) 1,397,939 Net change in fund balance $ — $ — 40,783 $ 40,783 Fund balance, beginning 48,231 Fund balance, ending $ 89,014
SOURCES (USES)
139
CITY OF MIRAMAR, FLORIDA
FISCAL YEAR ENDED SEPTEMBER 30, 2023
OTHER FINANCING SOURCES (USES)
Original Budget Final Budget Actual Amounts Variance from Final Budget REVENUES Intergovernmental $ 311,245 $ 1,975,434 $ 699,752 $ (1,275,681) Miscellaneous revenue — 55,000 35,000 (20,000) TOTAL REVENUES 311,245 2,030,434 734,752 (1,295,681)
General government — 2,000 1,024 976 Cultural arts — 3,000 875 2,125 Public safety — 500,000 — 500,000 Social services — 350,000 94,087 255,913 Economic environment — 10,000 10,000 — Parks and recreation — 40,672 37,669 3,002 Capital outlay — 301,626 185,163 116,463 TOTAL EXPENDITURES — 1,207,298 328,818 878,480 Excess (deficiency) of revenues over expenditures 311,245 823,136 405,934 (417,201)
Transfers out (311,245) (823,136) (405,934) 417,201 TOTAL OTHER FINANCING USES (311,245) (823,136) (405,934) 417,201 Net change in fund balance $ — $ — — $ — Fund balance, beginning — Fund balance, ending $ —
EXPENDITURES
BUDGETARY COMPARISON SCHEDULE STATE GRANT FUND
140
CITY OF MIRAMAR, FLORIDA
BUDGETARY COMPARISON SCHEDULE
FINANCING SOURCES (USES)
Original Budget Final Budget Actual Amounts Variance from Final Budget REVENUES Charges for services $ 1,669,500 $ 1,669,500 $ 1,586,861 $ (82,639) TOTAL REVENUES 1,669,500 1,669,500 1,586,861 (82,639)
Public safety 1,469,500 1,469,500 1,458,333 11,166 TOTAL EXPENDITURES 1,469,500 1,469,500 1,458,333 11,166 Excess (deficiency) of revenues over expenditures 200,000 200,000 128,528 (71,472) OTHER
(200,000)
(200,000) — TOTAL OTHER
(200,000) (200,000) (200,000)
Net change in fund balance $ — $ — (71,472) $ (71,472) Fund balance, beginning 110,413 Fund balance, ending $ 38,941
EXPENDITURES
Transfers out
(200,000)
FINANCING USES
—
PUBLIC SAFETY OUTSIDE SERVICE FUND
141
FISCAL YEAR ENDED SEPTEMBER 30, 2023
CITY OF MIRAMAR, FLORIDA
BUDGETARY COMPARISON SCHEDULE
FISCAL YEAR ENDED SEPTEMBER 30, 2023
FINANCING SOURCES (USES)
OTHER FINANCING USES
Original Budget Final Budget Actual Amounts Variance from Final Budget REVENUES Fines and forfeitures $ — $ 581,476 $ 581,476 $ — Investment Income — 25,484 25,484 — TOTAL REVENUES — 606,960 606,960 — EXPENDITURES Public safety — 192,303 81,160 111,143 Grants/aid — — — — Capital outlay — 24,500 23,886 614 TOTAL EXPENDITURES — 216,803 105,046 111,757 Excess (deficiency) of revenues over expenditures — 390,157 501,914 111,757 OTHER
Transfers out — (10,000) (10,000) $ — TOTAL
Net change in fund balance $ — $ — 491,914 $ — Fund balance, beginning 587,297 Fund balance, ending $ 1,079,211
LAW ENFORCEMENT
TRUST FUND
142
CITY OF MIRAMAR,FLORIDA
BUDGETARY COMPARISON SCHEDULE
CDBG FUND
FISCAL YEAR ENDED SEPTEMBER 30, 2023
Original Budget Final Budget Actual Amounts Variance from Final Budget REVENUES Intergovernmental $ 710,030 $ 3,058,429 $ 2,180,388 $ (878,041) TOTAL REVENUES 710,030 3,058,429 2,180,388 (878,041)
Economic environment — 2,638,686 2,047,791 590,895 Grants/aid — 299,743 132,597 167,145 TOTAL EXPENDITURES — 3,058,429 2,180,388 878,041
$ 710,030 $ — — $ —
—
$ —
EXPENDITURES
Excess (deficiency) of revenues over expenditures
Fund balance, beginning
Fund balance, ending
143
Original Budget Final Budget Actual Amounts Variance from Final Budget REVENUES Intergovernmental $ — $ 3,480,247 $ 950,052 $ (2,530,196) Investment income — — 52,024 52,024 TOTAL REVENUES — 3,480,247 1,002,076 (2,478,172) EXPENDITURES Economic environment — 3,480,247 950,052 2,530,196 TOTAL EXPENDITURES — 3,480,247 950,052 2,530,196 Excess (deficiency) of revenues over expenditures $ — $ — 52,024 $ 52,024 Fund balance, beginning 23,242 Fund balance, ending $ 75,266 CITY
BUDGETARY COMPARISON SCHEDULE S.H.I.P. PROGRAM FUND
30,
144
OF MIRAMAR, FLORIDA
FISCAL YEAR ENDED SEPTEMBER
2023
CITY OF MIRAMAR, FLORIDA
BUDGETARY COMPARISON SCHEDULE AFFORDABLE HOUSING TRUST FUND FISCAL YEAR ENDED SEPTEMBER 30, 2023
Original Budget Final Budget Actual Amounts Variance from Final Budget REVENUES Investment Income $ — $ — $ 96,626 $ 96,626 TOTAL REVENUES — — 96,626 96,626 EXPENDITURES Economic environment — 70,000 66,110 3,891 TOTAL EXPENDITURES — 70,000 66,110 3,891 OTHER
Grants/Aid — 6,000,000 — 6,000,000 TOTAL OTHER FINANCING SOURCES — 6,000,000 — 6,000,000 Net change in fund balance $ — $ 6,070,000 30,516 $ 6,096,626 Fund balance, beginning 3,268,500 Fund balance, ending $
FINANCING SOURCES
3,299,016
145
CITY OF MIRAMAR, FLORIDA
BUDGETARY COMPARISON SCHEDULE
DEBT SERVICE FUND
FISCAL YEAR ENDED SEPTEMBER 30, 2023
Original Budget Final Budget Actual Amounts Variance from Final Budget REVENUES Investment income $ 5,830 $ 5,830 $ 11,419 $ 5,589 TOTAL REVENUES 5,830 5,830 11,419 5,589 EXPENDITURES Principal 8,337,900 8,337,900 8,337,826 74 Interest expense 3,837,100 3,837,100 3,835,221 1,879 Fiscal charges 2,800 2,800 2,931 (131) TOTAL EXPENDITURES 12,177,800 12,177,800 12,175,978 1,822 Excess (deficiency) of revenues over expenditures (12,171,970) (12,171,970) (12,164,559) 7,411 OTHER FINANCING
Transfers in 11,724,870 11,724,870 11,762,257 37,387 Revenue notes issued — — — — Payment to escrow agent — — — — TOTAL OTHER FINANCING SOURCES 11,724,870 11,724,870 11,762,257 37,387 Net change in fund balance $ (447,100) $ (447,100) (402,302) $ 44,798 Fund balance, beginning 481,357 Fund balance, ending $ 79,055
SOURCES (USES)
146
CITY OF MIRAMAR, FLORIDA
BUDGETARY COMPARISON SCHEDULE
FISCAL YEAR ENDED SEPTEMBER 30, 2023
Original Budget Final Budget Actual Amounts Variance from Final Budget REVENUES Intergovernmental $ 3,793,000 $ 3,793,000 $ 3,719,586 $ (73,414) Investment income 1,000 1,000 26,582 25,582 TOTAL REVENUES 3,794,000 3,794,000 3,746,168 (47,832) EXPENDITURES General government 1,000 1,000 1,287 (287) Capital outlay 1,400,000 1,866,724 821,954 1,044,770 TOTAL EXPENDITURES 1,401,000 1,867,724 823,241 1,044,483 Excess (deficiency) of revenues over expenditures 2,393,000 1,926,276 2,922,927 996,651 OTHER FINANCING
Transfers out (3,148,700) (3,148,700) (3,148,700) — TOTAL OTHER FINANCING USES (3,148,700) (3,148,700) (3,148,700) — Net change in fund balance $ (755,700) $ (1,222,424) (225,773) $ 996,651 Fund balance, beginning 1,638,263 Fund balance, ending $ 1,412,490
SOURCES (USES)
STREET CONSTRUCTION AND MAINTENANCE FUND
147
CITY OF MIRAMAR, FLORIDA
BUDGETARY
FISCAL
FINANCING SOURCES (USES)
Original Budget Final Budget Actual Amounts Variance from Final Budget REVENUES Impact fees $ 126,100 $ 27,700 $ 27,788 $ 88 Investment income 100 100 555 455 TOTAL REVENUES 126,200 27,800 28,343 543 EXPENDITURES General government 100 100 481 (381) TOTAL EXPENDITURES 100 100 481 (381) Excess (deficiency) of revenues over expenditures 126,100 27,700 27,862 162
Transfers out (125,900) (27,500) (27,500) — TOTAL OTHER FINANCING USES (125,900) (27,500) (27,500) — Net change in fund balance $ 200 $ 200 362 $ 162 Fund balance, beginning 49,994 Fund balance, ending $ 50,355
OTHER
CAPITAL IMPROVEMENT FUND
COMPARISON SCHEDULE POLICE
148
YEAR ENDED SEPTEMBER 30, 2023
FISCAL YEAR ENDED SEPTEMBER 30, 2023
Original Budget Final Budget Actual Amounts Variance from Final Budget REVENUES Impact fees $ 101,000 $ 101,000 $ 29,788 $ (71,212) Investment income 200 200 517 317 TOTAL REVENUES 101,200 101,200 30,305 (70,895) EXPENDITURES General government 100 100 448 (348) Capital outlay — 200,000 — 200,000 TOTAL EXPENDITURES 100 200,100 448 199,652 Excess (deficiency) of revenues over expenditures 101,100 (98,900) 29,857 128,757 Net change in fund balance $ 101,100 $ (98,900) 29,857 $ 128,757 Fund
Fund
FIRE AND EMS CAPITAL
FUND
149
balance, beginning 212,944
balance, ending $ 242,801 CITY OF MIRAMAR, FLORIDA BUDGETARY COMPARISON SCHEDULE
IMPROVEMENT
CITY OF MIRAMAR, FLORIDA
BUDGETARY COMPARISON SCHEDULE PARK DEVELOPMENT FUND
FISCAL YEAR ENDED SEPTEMBER 30, 2023
OTHER FINANCING SOURCES (USES)
Original Budget Final Budget Actual Amounts Variance from Final Budget REVENUES Impact fees $ 413,600 $ 413,600 $ 59,569 $ (354,032) Investment income 102,410 102,410 226,381 123,971 TOTAL REVENUES 516,010 516,010 285,949 (230,061) EXPENDITURES General government 1,000 1,000 545 455 Capital outlay — 3,185,531 969,574 2,215,957 TOTAL EXPENDITURES 1,000 3,186,531 970,119 2,216,412 Excess (deficiency) of revenues over expenditures 515,010 (2,670,521) (684,169) 1,986,352
Transfers out (1,865,600) (1,865,600) (1,865,600) — TOTAL OTHER FINANCING USES (1,865,600) (1,865,600) (1,865,600) — Net change in fund balance $ (1,350,590) $ (4,536,121) (2,549,769) $ 1,986,352 Fund
balance, beginning 6,596,893 Fund balance, ending $ 4,047,123
150
CITY OF MIRAMAR, FLORIDA
FISCAL YEAR ENDED SEPTEMBER 30, 2023
SOURCES (USES)
Original Budget Final Budget Actual Amounts Variance from Final Budget REVENUES Investment income $ 42,200 $ 42,200 $ 179,169 $ 136,969 TOTAL REVENUES 42,200 42,200 179,169 136,969 EXPENDITURES General government 2,000 2,000 1,323 677 Capital outlay 4,573,932 9,278,474 3,293,923 5,984,551 TOTAL EXPENDITURES 4,575,932 9,280,474 3,295,246 5,985,228 Excess (deficiency) of revenues over expenditures (4,533,732) (9,238,274) (3,116,077) 6,122,197 OTHER
Transfers in 4,579,602 4,935,602 1,950,000 (2,985,602) TOTAL OTHER FINANCING SOURCES 4,579,602 4,935,602 1,950,000 — Net change in fund balance $ 45,870 $ (4,302,672) (1,166,077) $ 6,122,197 Fund balance, beginning 4,153,720 Fund balance, ending $ 2,987,643
FINANCING
BUDGETARY COMPARISON SCHEDULE CAPITAL PROJECTS FUND
151
CITY OF MIRAMAR, FLORIDA
BUDGETARY COMPARISON SCHEDULE CIP BONDS 2013 FUND FISCAL YEAR ENDED SEPTEMBER 30, 2023
Original Budget Final Budget Actual Amounts Variance from Final Budget REVENUES Investment income $ 5,300 $ 5,300 $ 17,005 $ 11,705 TOTAL REVENUES 5,300 5,300 17,005 11,705
General government 300 300 398 (98) Capital outlay — 280,645 161,507 119,139 TOTAL EXPENDITURES 300 280,945 161,905 119,041 Excess (deficiency) of revenues over expenditures 5,000 (275,645) (144,899) 130,746 Net change in fund balance $ 5,000 $ (275,645) (144,899) $ 130,746 Fund balance, beginning 514,967 Fund balance, ending $ 370,068
EXPENDITURES
152
CITY OF MIRAMAR, FLORIDA
BUDGETARY COMPARISON SCHEDULE
FISCAL YEAR ENDED SEPTEMBER 30, 2023
Original Budget Final Budget Actual Amounts Variance from Final Budget REVENUES Investment income $ 11,400 $ 11,400 $ 34,774 $ 23,374 TOTAL REVENUES 11,400 11,400 34,774 23,374 EXPENDITURES General government 700 700 163 537 Capital Outlay — 539,638 223,467 316,171 TOTAL EXPENDITURES 700 540,338 223,630 316,708 Excess (deficiency) of revenues over expenditures 10,700 (528,938) (188,856) 340,082 Net change in fund balance $ 10,700 $ (528,938) (188,856) $ 340,082 Fund
Fund balance, ending $
balance, beginning 772,614
583,758
CIP 2017 LOAN FUND
153
CITY OF MIRAMAR, FLORIDA
BUDGETARY COMPARISON SCHEDULE
FISCAL YEAR ENDED SEPTEMBER 30, 2023
Original Budget Final Budget Actual Amounts Variance from Final Budget REVENUES Intergovernmental $ — $ 16,788,409 $ 5,717,746 $ (11,070,662) TOTAL REVENUES — 16,788,409 5,717,746 (11,070,662) EXPENDITURES Capital outlay — 16,773,831 5,713,705 11,060,127 TOTAL EXPENDITURES — 16,773,831 5,713,705 11,060,127 Excess (deficiency) of revenues over expenditures — 14,578 4,041 (10,536) OTHER
(USES) Transfers Out — (14,578) (4,041) (10,537) TOTAL OTHER FINANCING USES — (14,578) (4,041) (10,537) Net change in fund balance $ — $ — — $ — Fund balance, beginning — Fund balance, ending $ —
FINANCING SOURCES
CIP GRANTS FUND
154
CITY OF MIRAMAR, FLORIDA
BUDGETARY COMPARISON SCHEDULE
CIP LOAN 2020 NON TAXABLE
FISCAL YEAR ENDED SEPTEMBER 30, 2023
Original Budget Final Budget Actual Amounts Variance from Final Budget REVENUES Interest Revenue $ 56,600 $ 56,600 $ 6,003 $ (50,597) TOTAL REVENUES 56,600 56,600 6,003 (50,597)
General government 500 500 5,669 (5,169) Capital outlay — 3,436,965 532,080 2,904,885 TOTAL EXPENDITURES 500 3,437,465 537,749 2,899,716 Excess (deficiency) of revenues over expenditures 56,100 (3,380,865) (531,746) 2,849,119 Net change in fund balance $ 56,100 $ (3,380,865) (531,746) $ 2,849,119 Fund balance, beginning
Fund balance, ending $ 2,955,373
EXPENDITURES
3,487,120
155
CITY OF MIRAMAR, FLORIDA
BUDGETARY COMPARISON SCHEDULE
CIP
FISCAL YEAR ENDED SEPTEMBER 30, 2023
Original Budget Final Budget Actual Amounts Variance from Final Budget REVENUES Investment Income $ 62,500 $ 62,500 $ 189,082 $ 126,582 TOTAL REVENUES 62,500 62,500 189,082 126,582 EXPENDITURES General government 600 600 732 (132) Capital outlay — 4,391,687 1,453,513 2,938,175 TOTAL EXPENDITURES 600 4,392,287 1,454,245 2,938,042 Excess (deficiency) of revenues over expenditures 61,900 (4,329,787) (1,265,163) 3,064,624 Net change in fund balance $ 61,900 $ (4,329,787) (1,265,163) $ 3,064,624 Fund balance, beginning 4,466,335 Fund balance, ending $ 3,201,171
LOAN 2020 TAXABLE
156
CITY OF MIRAMAR, FLORIDA
BUDGETARY COMPARISON SCHEDULE
CIP LOAN 2021/2022
FISCAL YEAR ENDED SEPTEMBER 30, 2023
Original Budget Final Budget Actual Amounts Variance from Final Budget REVENUES Investment Income $ 45,500 $ 45,500 $ 109,448 $ 63,948 TOTAL REVENUES 45,500 45,500 109,448 63,948
Capital outlay — 7,470,832 2,927,407 4,543,424 TOTAL EXPENDITURES — 7,470,832 2,927,407 4,543,424 Excess (deficiency) of revenues over expenditures 45,500 (7,425,332) (2,817,959) 4,607,372 Net change in fund balance $ 45,500 $ (7,425,332) (2,817,959) $ 4,607,372 Fund
Fund balance, ending $ 4,689,591
EXPENDITURES
balance, beginning 7,507,550
157
INTERNAL SERVICE FUNDS
Insurance Fund – To account for the City’s health and dental plans and self-funded insurance program for automobile liability, general liability, worker’s compensation and property coverages.
Fleet Maintenance Fund – To account for the revenues and expenses of the City’s maintenance garage facility used to maintain the City’s various vehicle fleets.
Management Information Systems Fund – To account for the City’s information resources and related information technology services.
CITY OF MIRAMAR, FLORIDA
COMBINING STATEMENT OF NET POSITION INTERNAL SERVICE FUNDS
SEPTEMBER 30, 2023
DEFERREDOUTFLOWSOFRESOURCES
InsuranceFund Fleet Maintenance Fund Management Information Systems Total
Currentassets: Pooledcashandcashequivalents $ 38,427,364 $ 11,524,011 $ 3,546,560 $ 53,497,935 Receivables,net 478,467 — — 478,467 Inventories — 402,507 — 402,507 Prepaiditems 2,165,241 — 374,049 2,539,290 Restrictedassets: Cashwithfiscalagent — — 87,574 87,574 Totalcurrentassets 41,071,072 11,926,518 4,008,183 57,005,773 Non-currentassets: Capitalassets,beingdepreciated/amortized,net 101,953 3,551,533 5,618,454 9,271,940 TOTALASSETS 41,173,025 15,478,051 9,626,637 66,277,713
ASSETS
DeferredOutflow-Pensions(Note10) 404,078 636,363 1,070,315 2,110,756 DeferredOutflow-OPEB(Note10) 203,885 81,896 157,884 443,665 TOTALDEFERREDOUTFLOWS OFRESOURCES 607,963 718,259 1,228,199 2,554,421 LIABILITIES Currentliabilities: Accountspayable 100,957 288,380 592,644 981,980 Accruedliabilities 70,843 58,673 214,516 344,032 Unearnedrevenue 168,898 — — 168,898 Currentportionoflong-termobligations 2,770,284 — 1,373,830 4,144,115 Totalcurrentliabilities 3,110,982 347,053 2,180,990 5,639,025 Non-currentliabilities: Obligationsunderfinancingagreements — — 1,495,609 1,495,609 Obligationsunderleases 34,704 — — 34,704 SBITAS — — 842,339 842,339 Compensatedabsences 73,434 110,305 129,034 312,773 Otherpost-employmentbenefits(OPEB) 175,257 507,334 602,121 1,284,712 Netpensionliability 832,236 979,696 1,422,332 3,234,264 Estimateforself-insuredlosses 8,037,240 — — 8,037,240 Totalnon-currentliabilities 9,152,871 1,597,335 4,491,435 15,241,641 TOTALLIABILITIES 12,263,853 1,944,388 6,672,425 20,880,666 DEFERREDINFLOWSOFRESOURCES DeferredInflow-Pensions(Note10) 143,158 156,678 120,000 419,836 DeferredInflow-OPEB(Note10) 137,189 183,031 352,857 673,077 TOTALDEFERREDINFLOWS OFRESOURCES 280,347 339,709 472,857 1,092,913 NETPOSITION Netinvestmentincapitalassets (4,114) 3,551,533 1,906,676 5,454,095 Unrestricted 29,240,904 10,360,680 1,802,880 41,404,464 TOTALNETPOSITION $ 29,236,790 $ 13,912,213 $ 3,709,556 $ 46,858,559
158
CITY OF MIRAMAR, FLORIDA
COMBINING STATEMENT OF REVENUES, EXPENSES AND CHANGES IN FUND NET POSITION
INTERNAL SERVICE FUNDS
FISCAL YEAR ENDED SEPTEMBER 30, 2023
REVENUES(EXPENSES)
Insurance Fund Fleet Maintenance Fund Management Information Systems Total OPERATING REVENUES Charges for services $ 26,624,646 $ 6,387,522 $ 8,748,200 $ 41,760,368 Other 1,506,639 — — 1,506,639 TOTAL OPERATING REVENUES 28,131,285 6,387,522 8,748,200 43,267,007 OPERATING EXPENSES Personal Services 1,176,452 1,748,460 3,223,141 6,148,053 Operating Expenditures 20,869,898 1,721,532 4,159,920 26,751,350 Depreciation and amortization 71,967 1,340,009 1,364,580 2,776,556 TOTAL OPERATING EXPENSES 22,118,317 4,810,001 8,747,641 35,675,959 OPERATING INCOME (LOSS) 6,012,968 1,577,521 559 7,591,048 NONOPERATING
Investment Income 1,554,467 476,915 130,899 2,162,281 Interest expense (456) — (45,478) (45,934) TOTAL NONOPERATING REVENUES (EXPENSES) 1,554,011 476,915 85,421 2,116,347 Changes in net position 7,566,979 2,054,436 85,980 9,707,395 Net position, beginning of year 21,669,811 11,857,777 3,623,576 37,151,164 Net position ending $ 29,236,790 $ 13,912,213 $ 3,709,556 $ 46,858,559
159
CITY OF MIRAMAR, FLORIDA
COMBINING STATEMENT OF CASH FLOWS
INTERNAL SERVICE FUNDS
FISCAL YEAR ENDED SEPTEMBER 30, 2023
Adjustmentstoreconcileoperatingincometo netcash providedby(usedin)operatingactivities:
Fleet Management Insurance Maintenance Information Fund Fund Systems Total Cashflowsfromoperatingactivities: Cashreceivedfromcustomers $ 27,661,832 $ 6,387,522 $ 8,792,681 $ 42,842,035 Cashpaidtosuppliers (21,609,411) (1,884,964) (4,870,602) (28,364,977) Cashpaidtoemployees (1,064,459) (1,718,943) (3,217,005) (6,000,407) Netcashprovidedby(usedin)operatingactivities 4,987,963 2,783,616 705,072 8,476,651 Cashflowsfromcapitalandrelatedfinancingactivities: Acquisitionandconstructionofcapitalassets — (1,166,916) (243,455) (1,410,371) Principalpaidonlong-termdebt — — (779,823) (779,823) Interestpaidonlong-termdebt (456) — (45,478) (45,934) Netcashusedincapitalandrelatedfinancing activities (456) (1,166,916) (1,068,756) (2,236,128) Cashflowsfrominvestingactivities: Investmentincome 1,554,467 476,915 130,899 2,162,281 Netcashprovidedbyinvestingactivities 1,554,467 476,915 130,899 2,162,281 Netincrease(decrease)inpooledcashandcash equivalents 6,541,973 2,093,614 (232,784) 8,402,804 Pooledcashandcashequivalents,beginning 31,885,391 9,430,397 3,866,918 45,182,705 Pooledcashandcashequivalents,ending $ 38,427,364 $ 11,524,011 $ 3,634,134 $ 53,585,509
Operatingincome $ 6,012,968 $ 1,577,521 $ 559 $ 7,591,048
Reconciliationofoperatingincome(loss)tonetcash providedby(usedin)operatingactivities:
Depreciationandamortization 71,967 1,340,009 1,364,580 2,776,556
(Increase)decreaseininventory — (62,343) — (62,343) (Increase)decreaseinaccountsreceivable (469,452) — 44,481 (424,971) (Increase)decreaseinprepaiditems (642,362) — (76) (642,438) (Increase)decreaseindeferred outflowsofresources (215,704) (301,213) (580,693) (1,097,610) Increase(decrease)inaccountspayable (13,534) (101,087) 139,959 25,337 Increase(decrease)incompensatedabsences 100,040 116,208 (26,047) 190,201 Increase(decrease)inobligationsunderleases (71,383) — (850,566) (921,949) Increase(decrease)inotherpost-employmentbenefit (OPEB) (84,458) (221,324) (227,369) (533,151) Increase(decrease)innetpensionliability 227,183 694,279 710,409 1,631,871 Increase(decrease)inself-insuredlosses/liability (12,233) — — (12,233) Increase(decrease)indeferredinflowsofresources 84,932 (258,433) 129,836 (43,665) Netcashprovidedby(usedin)operatingactivities
4,987,963 $ 2,783,616 $ 705,072 $ 8,476,651
Changesinoperatingassetsandliabilities:
$
160
PENSION AND OPEB TRUST FUNDS
PENSION TRUST FUNDS
Consolidated Retirement Plan and Trust – This fund was established to collect City and employee pension contributions to be used for retirement benefit payments.(1)
Police Officers’ Retirement Plan – This fund was established to collect City, employee, and State of Florida pension contributions to be used for retirement benefit payments.
Firefighters’ Retirement Plan – This fund was established to collect City, employee, and State of Florida pension contributions to be used for retirement benefit payments.
OPEB Trust Fund – This fund was established to accumulate the assets necessary to fund the OPEB liability and to pay future benefits.
CITY OF MIRAMAR, FLORIDA COMBINING STATEMENT OF FIDUCIARY NET POSITION PENSION AND OPEB TRUST FUNDS
SEPTEMBER 30,2023
Consolidated RetirementPlan andTrust Police Officers' Retirement Plan Firefighters' Retirement Plan OPEBTRUST Total ASSETS Cashandcashequivalents $ 6,847,534 $ — $ 1,552,206 $ — $ 8,399,740 Investments: Certificatesofdeposit — — 972,172 — 972,172 Moneymarketfunds — 11,248,710 15,101,409 — 26,350,119 U.S.Governmentsecurities 11,368,001 6,651,075 16,402,809 — 34,421,885 Corporatebonds 14,094,770 1,896,599 8,300,595 — 24,291,964 Bondfund — 8,129,582 — — 8,129,582 Equitysecurities 131,487,066 130,495,081 153,901,637 — 415,883,784 Collateralizedmortgageobligations 19,378,392 — 2,086,366 — 21,464,758 Assetbackedsecurities 1,887,813 — 1,128,072 — 3,015,885 Mutualfunds 9,841,396 — — 2,530,454 12,371,850 Realestatefunds — 61,127,138 22,130,069 — 83,257,207 Fixedincomeinternational funds — — 1,427,498 — 1,427,498 Commingledfunds — — 5,362,494 — 5,362,494 Alternativeinvestment 27,402,607 36,687,292 — — 64,089,899 Receivables: Duefrombroker — 30,395 — — 30,395 Prepaiditems — — 15,722 — 15,722 Accruedinvestmentincome 689,554 98,460 326,040 — 1,114,054 TOTALASSETS 222,997,133 256,364,332 228,707,089 2,530,454 710,599,008 LIABILITIES Accountspayable 391,507 94,849 170,985 — 657,341 TOTALLIABILITIES 391,507 94,849 170,985 — 657,341 NETPOSITION Netpositionrestrictedforbenefits $ 222,605,626 $ 256,269,483 $ 228,536,104 $ 2,530,454 $ 709,941,667
161
Netpositionrestrictedforpensionbenefits:
CITY OF MIRAMAR, FLORIDA
STATEMENT OF CHANGES IN FIDUCIARY NET POSITION PENSION AND OPEB TRUST FUNDS FISCAL YEAR ENDED SEPTEMBER 30, 2023
Consolidated RetirementPlan andTrust Police Officers' Retirement Plan Firefighters' Retirement Plan OPEBTrust Total ADDITIONS Contributions: City $ 9,508,735 $ 9,163,095 $ 9,519,804 $ 500,000 $ 28,691,634 Employees 6,186,095 3,254,125 1,693,450 — 11,133,670 StateofFlorida — 1,521,206 2,128,056 — 3,649,262 Permissiveservicecredit — — 207,429 — 207,429 Section457Planrollovers — 1,866,120 — — 1,866,120 Totalcontributions 15,694,830 15,804,546 13,548,739 500,000 45,548,115 Interestanddividends 4,992,938 4,722,536 6,013,989 — 15,172,198 Netdepreciationinfairvalueof investments 12,468,486 15,358,941 15,910,218 202,948 43,940,593 Lessinvestmentexpenses (934,596) (3,116,659) (809,903) (2,241) (4,863,399) Netinvestmentincome 16,526,828 16,964,818 21,114,304 200,707 54,806,657 Otherincome 2,076 18,542 494 — 21,112 Totaladditions 32,223,734 32,787,906 34,663,537 700,707 100,375,884 DEDUCTIONS Pensionbenefits 10,732,559 14,259,014 7,018,147 — 32,009,720 Refundofemployeecontributions 278,352 299,467 3,960,471 — 4,538,290 Administrativeexpenses 352,005 273,187 185,554 — 810,746 Totaldeductions 11,362,916 14,831,668 11,164,172 — 37,358,756 Netincrease 20,860,818 17,956,238 23,499,365 700,707 63,017,128
Beginningofyear 201,744,808 238,313,245 205,036,739 1,829,747 646,924,539 Endofyear $ 222,605,626 $ 256,269,483 $ 228,536,104 $ 2,530,454 $ 709,941,667
162
STATISTICAL SECTION
STATISTICAL SECTION
This part of the City of Miramar’s Annual Comprehensive Financial Report presents detailed information as a context for understanding what the information in the financial statements, note disclosures, and required supplementary information says about the City’s overall financial health.
Contents
Financial Trends
Pages
These schedules contain trend information to help the reader understand how the City’s financial performance and well-being have changed over time. 163-167
Revenue Capacity
These schedules contain information to help the reader assess the City’s most significant local revenue source, their property taxes. 168-171
Debt Capacity
These schedules present information to help the reader assess the affordability of the City’s current levels of outstanding debt and the City’s ability to issue additional debt in the future. 172-174
Demographic and Economic Information
These schedules offer demographic and economic indicators to help the reader understand the environment within which the City’s financial activities take place. 175-176
Operating Information
These schedules contain service and infrastructure data to help the reader understand how the information in the City’s financial report relates to the services the City provides and the activities it performs. 177-183
Sources: Unless otherwise noted, the information in these schedules is derived from the Annual Comprehensive Financial Report for the relevant year.
FINANCIAL TRENDS
The information presented in this section is intended to assist users in understanding and assessing how a government’s financial position has changed over time.
Business-typeactivities:
CITY OF MIRAMAR, FLORIDA SCHEDULE 1 - NET POSITION BY COMPONENT (UNAUDITED) LAST TEN FISCAL YEARS (ACCRUAL BASIS OF ACCOUNTING ) (AMOUNTS EXPRESSED IN THOUSANDS)
(1) In fiscal year 2015, the City implemented GASB Statement No. 68 Accounting and Financial Reporting for Pensions and GASB Statement No. 71, Pension Transition for Contributions Made Subsequent to the Measurement Date
(2) In fiscal year 2018, the City implemented GASB Statement No. 75, Accounting and Financial Reporting for.Postemployment Benefits Other Than Pensions.
(3) In fiscal year 2022, the City implemented GASB Statement No. 87 Leases.
(4) In fiscal year 2023, the City implemented GASB Statement No. 96 Leases.
2014 2015 2016 2017 2018 2019 2020 2021 2022 2023 Governmentalactivities: Netinvestmentincapitalassets $ 112,125 $ 108,146 $ 127,446 $ 132,029 $ 132,717 $ 134,848 $ 136,953 $ 138,373 $ 117,899 $ 145,188 Restricted 25,768 23,797 21,088 16,145 12,927 8,155 8,421 13,041 23,138 20,539 Unrestricted(deficit) 10,837 (128,207) (126,334) (130,798) (141,040) (128,436) (127,499) (104,473) (44,977) (56,010) Totalgovernmentalactivities netposition 148,730 3,736 22,200 17,376 4,604 14,567 17,875 46,941 96,060 109,717
Netinvestmentincapitalassets 256,194 252,570 229,158 231,706 234,964 236,949 237,386 227,190 230,872 245,477 Restricted 6,228 3,726 4,469 4,804 5,427 7,447 9,104 12,571 12,866 13,512 Unrestricted(deficit) 31,640 31,794 38,952 45,529 43,086 47,274 52,532 71,087 71,450 54,606 Totalbusiness-typeactivities 294,062 288,090 272,579 282,039 283,477 291,670 299,022 310,848 315,188 313,595 Primarygovernment: Netinvestmentincapitalassets 368,319 360,716 356,604 363,735 367,681 371,797 374,339 365,563 348,771 363,376 Restricted 31,996 27,523 25,557 20,949 18,354 15,602 17,525 25,612 36,005 34,050 Unrestricted(deficit) 42,477 (96,413) (87,382) (85,269) (97,954) (81,162) (74,967) (33,386) 26,473 25,885 Totalprimarygovernment netposition $ 442,792 $ 291,826 $ 294,779 $ 299,415 $ 288,081 $ 306,237 $ 316,897 $ 357,789 $ 411,249 $ 423,312
163
CITY OF MIRAMAR, FLORIDA
Programrevenues: Governmentalactivities:
(1)Beginninginfiscalyear2013,revenuesandexpensespreviouslyclassifiedundercommunityserviceswerereclassedtoparksandrecreation,economicenvironment,and publicsafety.
(2)Beginninginfiscalyear2013,revenuesandexpensespreviouslyclassifiedunderphysicalenvironmentwerereclassedtotransportation.
(3)Priortofiscalyear2013,stormwaterwasincludedwithutility.
(4)Beginning in fiscal year 2016, CulturalArts and Early Childhood operations were transferred to the General Fund and are included under the functional classifications of culturalartsandsocialservices,respectively,ingovernmentalactivities.
(5)Beginninginfiscalyear2020,revenueandexpenditurespreviouslyclassifiedunderthefunctionsocialservicesareincludedunderthefunctioncommunityservices.
2014 2015 2016 2017 2018 2019 2020 2021 2022 2023 Expenses: Governmentalactivities: Generalgovernment $ 20,588 $ 21,190 $ 21,421 $ 24,841 $ 23,326 $ 24,546 $ 25,824 $ 28,243 $ 26,331 $ 42,442 Publicsafety(1) 74,403 76,121 81,507 90,343 87,302 92,686 99,126 101,359 89,803 108,087 Physicalenvironment(2) 3,068 3,061 3,407 5,679 8,240 6,952 3,835 3,111 3,829 4,379 Transportation(2) 4,526 3,769 4,022 4,425 4,168 6,541 5,451 3,839 4,765 7,364 Culturalarts(4) — — 3,651 3,723 3,933 4,213 3,991 3,162 3,663 4,836 Communityservices(1) — — — — — — 7,711 6,319 — 7,479 Socialservices(4) 2,613 2,869 5,844 6,390 6,807 6,990 — — 7,318 — Economicenvironment(1) 3,189 3,114 3,584 2,363 2,867 3,446 5,931 5,034 4,878 7,346 Parksandrecreation(1) 10,934 12,559 13,429 16,158 16,477 16,923 17,301 16,469 19,130 21,169 Interestonlong-termdebt 7,085 7,506 5,726 5,883 5,759 5,502 5,369 4,560 4,010 5,469 Totalgovernmental activitiesexpenses 126,406 130,189 142,591 159,805 158,879 167,799 174,539 172,096 163,727 208,569 Business-typeactivities: Utility 37,630 37,627 38,830 38,513 41,131 43,441 50,432 50,534 58,127 64,218 CulturalArts(4) 4,084 4,200 — — — — — — — — EarlyChildhood(4) 1,979 2,201 — — — — — — — — Stormwater(3) 1,917 2,186 2,191 2,367 2,732 3,029 3,406 3,328 3,688 4,127 Totalbusiness-typeactivities 46,214 41,021 40,880 43,863 46,470 53,838 53,862 53,862 61,815 68,344 Totalprimarygovernmentexpenses 172,620 171,210 183,471 203,668 205,349 221,637 228,401 225,958 225,542 276,914
Chargesforservices: Generalgovernment 7,824 8,059 8,521 10,129 10,609 10,969 11,742 12,185 12,744 13,697 Publicsafety(1) 22,873 24,776 28,755 31,621 34,299 34,900 40,044 38,109 43,063 40,672 Physicalenvironment(2) 278 392 399 1,003 1,041 216 234 127 146 367 Culturalarts(4) — — 1,093 1,224 1,549 1,139 576 463 899 1,165 Communityservices(1) — — — — — — 882 838 1,368 1,610 Socialservices(4) — 179 1,925 1,788 1,757 1,543 — — — — Parksandrecreation(1) 2,842 1,689 1,858 3,039 1,898 3,721 4,534 6,402 5,602 2,189 Operatinggrantsandcontributions 5,829 5,380 6,732 7,523 9,886 12,673 7,563 23,011 22,887 12,707 Capitalgrantsandcontributions — — — 35 982 — 124 177 1,162 5,747 Totalgovernmentalactivitiesprogram revenues 39,646 40,475 49,283 56,362 62,021 65,161 65,699 81,312 87,871 78,154 Business-typeactivities: Chargesforservices: Utility 35,947 39,835 40,428 43,300 42,080 47,078 50,862 52,185 54,471 54,374 CulturalArts(4) 1,048 1,143 — — — — — — — — EarlyChildhood(4) 1,522 1,692 — — — — — — — — Stormwater(3) 2,871 3,181 3,206 4,525 4,593 4,592 5,479 5,453 5,548 6,581 Operatinggrantsandcontributions — 100 190 — — — 262 — 327 — Capitalgrantsandcontributions 1,351 1,738 388 1,972 666 1,497 3,800 7,872 2,630 1,812 Totalbusiness-typeactivitiesprogram revenues 42,739 47,689 44,212 49,797 47,339 53,167 60,403 65,510 62,976 62,767 Totalprimarygovernmentprogram revenues 82,385 88,164 93,495 106,159 109,360 118,328 126,102 146,822 150,847 140,921 Net(expense)/revenue Governmentalactivities (89,714) (93,308) (103,443) (96,858) (102,638) (108,840) (90,784) (90,784) (75,856) (130,416) Business-typeactivities 6,668 3,332 5,934 869 (671) 6,541 11,648 11,648 1,161 (5,577) Totalprimarygovernmentnet expenses $ (83,046) $ (89,976) $ (97,509) $ (95,989) $ (103,309) $ (102,299) $ (79,136) $ (79,136) $ (74,695) $ (135,993)
CITY OF MIRAMAR, FLORIDA SCHEDULE2-CHANGESINNETPOSITION(UNAUDITED) LASTTENFISCALYEARS (ACCRUALBASISOFACCOUNTING)
164
(AMOUNTSEXPRESSEDINTHOUSANDS
CITY OF MIRAMAR, FLORIDA
SCHEDULE2-CHANGESINNETPOSITION(UNAUDITED)(CONTINUED) LASTTENFISCALYEARS (ACCRUALBASISOFACCOUNTING) (AMOUNTSEXPRESSEDINTHOUSANDS)
(1) Beginning in fiscal year 2016, Cultural Arts and Early Childhood operations, previously accounted for as business-type activities, were transferred to governmental activities.
2014 2015 2016 2017 2018 2019 2020 2021 2022 2023 Generalrevenuesandotherchangesinnetposition
Taxes: Propertytaxes $ 43,293 $ 47,874 $ 51,747 $ 56,236 $ 59,978 $ 67,062 $ 70,278 $ 74,092 $ 77,503 $ 85,709 Utilityandlocaloptiongastax 11,704 12,161 12,411 12,845 13,237 13,472 13,360 13,682 14,227 16,605 Communicationservicetax 4,986 5,005 4,535 4,381 4,353 3,872 3,625 3,539 3,782 3,901 Franchisefeesbasedongrossreceipts 8,487 8,708 8,580 8,910 8,654 9,107 9,116 9,361 10,630 11,810 Unrestrictedintergovernmentalrevenues 11,060 12,128 12,571 13,213 14,046 14,296 12,881 15,467 18,268 18,535 Unrestrictedinvestmentearnings 389 674 535 940 1,500 2,380 1,114 151 1,277 5,745 Miscellaneous 2,765 4,999 2,436 2,003 1,928 2,411 1,774 2,070 1,881 1,768 Transfers (3,698) (3,396) 1,894 — — — — — (2,591) — Gainonsaleofcapitalassets — — — 91 — — — 1,488 — — SpecialItem(Note14) — — 17,063 — — — — — — — Totalgovernmentalactivities $ 78,986 $ 88,153 $ 111,772 $ 98,619 $ 103,696 $ 112,600 $ 112,148 $ 119,850 $ 124,976 $ 144,073 Business-typeactivities: Unrestrictedinvestmentearnings $ 112 $ 301 $ 255 $ 543 $ 1,008 $ 1,497 $ 786 $ 178 $ 588 $ 3,984 Transfers 3,698 3,396 (1,894) — — — — — 2,591 — SpecialItem(Note14) — — (17,063) — — — — — — — Totalbusiness-typeactivities 3,810 3,697 (18,702) 543 1,008 1,497 786 178 3,180 3,984 Totalprimarygovernment $ 82,796 $ 91,850 $ 93,070 $ 99,162 $ 104,704 $ 114,097 $ 112,934 $ 120,028 $ 128,155 $ 148,057 Changesinnetposition Governmentalactivities $ (5,155)$ 8,329 $ 1,761 $ 1,058 $ 3,760 $ 21,364 $ 29,066 $ 29,065 $ 45,082 $ 13,657 Business-typeactivities 7,029 (12,768) 1,412 337 8,038 12,434 11,826 11,826 (58,635) (1,594) Totalprimarygovernment $ 1,874 $ (4,439)$ 3,173 $ 1,395 $ 11,798 $ 33,798 $ 40,892 $ 40,891 $ (13,554)$ 12,064
Governmentalactivities:
165
CITY OF MIRAMAR, FLORIDA
SCHEDULE 3 - FUND BALANCES, GOVERNMENTALFUNDS (UNAUDITED) LASTTEN FISCALYEARS (MODIFIEDACCRUALBASIS OFACCOUNTING) (AMOUNTS EXPRESS INTHOUSANDS)
2014 2015 2016 2017 2018 2019 2020 2021 2022 2023 GeneralFund Non-spendable $ 99 $ 210 $ 153 $ 123 $ 1,824 $ 1,713 $ 1,878 $ 75 $ 191 $ 419 Restricted — — — — — — — 1,014 6,314 7,058 Committed 14,620 15,115 16,309 18,340 19,070 20,383 23,252 24,715 27,426 27,956 Assigned 5,092 4,993 9,527 6,922 6,479 9,567 9,927 15,831 19,586 20,706 Unassigned 5,075 8,923 12,026 10,684 7,976 8,585 — 5,686 7,586 11,613 TotalGeneralFund 24,886 29,241 38,015 36,069 35,349 40,248 35,057 47,321 61,103 67,752 Allothergovernmentalfunds Reserved — — — — — — — — — — Unreserved,reportedin: Specialrevenuefunds — — — — — — — — — — Capitalprojectsfunds — — — — — — — — — — Non-spendable 4 1 — 3,895 3,312 — — — — — Restricted 79,999 65,819 44,214 38,009 28,967 22,091 24,403 23,976 34,055 25,360 Assigned — — — — — — — — — — Unassigned,reportedin: Specialrevenuefunds (4) (1) — (1,853) (1,673) (948) (451) (451) — — Capitalprojectsfunds — — — — — — — — — — Totalallothergovernmentalfunds 79,999 65,819 44,214 40,051 30,606 21,143 23,952 23,525 34,055 25,360 Totalgovernmentalfunds $ 104,885 $ 95,060 $ 82,229 $ 76,120 $ 65,955 $ 61,391 $ 59,009 $ 70,846 $ 95,158 $ 93,112
166
(1)Beginninginfiscalyear2013,revenuesandexpenditurespreviouslyclassifiedundercommunityserviceswerereclassedtoparksandrecreation,economicenvironment, andpublicsafety.
(2)Beginninginfiscalyear2013,revenuesandexpenditurespreviouslyclassifiedunderphysicalenvironmentwerereclassedtotransportation.
(3)InFY15,$79.6millioninCapitalImprovementRefundingRevenueBonds,Series2015wereissuedtocurrentrefund$3.6millionand$83.9millioninthenoutstandingPublic ServiceTaxRevenueBonds,Series2003,andCapitalImprovement RevenueBonds,Series2005,respectively.
(4)Beginning in fiscal year 2016, CulturalArts and Early Childhood operations were transferred to the General Fund and are included under the functional classification of culturalartsandsocialservices,respectively.
(5)Beginninginfiscalyear2020,revenueandexpenditurespreviouslyclassifiedunderthefunctionsocialservicesareincludedunderthefunctioncommunityservices.
(6)In Fy21, $51 million in Taxable Special Obligation Refunding Bonds, Series 2021, were issued to advance refund $47.7 million Special Obligation Refunding and ImprovementRevenueBonds,Series2013.
2014 2015 2016 2017 2018 2019 2020 2021 2022 2023
Taxes $ 62,920 $ 66,325 $ 71,479 $ 74,942 $ 79,924 $ 83,779 $ 91,021 $ 94,203 $103,744 $115,656 Specialassessments 15,955 15,714 16,321 19,150 20,577 20,764 21,169 21,441 22,158 22,279 Licensesandpermits 6,261 4,161 5,090 5,062 6,934 8,623 8,589 11,845 14,756 10,255 Intergovernmentalrevenues 29,935 19,711 20,545 22,174 23,468 27,460 29,739 23,355 43,708 40,335 Chargesforservices 9,773 10,328 10,877 15,497 17,120 18,866 18,203 17,140 20,980 23,750 Finesandforfeitures 1,301 952 1,017 1,058 1,080 1,199 1,033 601 378 1,023 Impactfees 1,959 1,769 910 737 2,210 689 2,462 5,519 4,531 117 Interestincome 198 388 674 535 939 1,500 2,380 1,114 1,277 5,745 Developercontributions — — — — 35 232 — 124 1,162 29 Miscellaneousrevenues 3,472 2,937 5,112 2,943 2,628 2,605 3,165 2,505 2,743 3,038 Totalrevenues 131,774 122,285 132,025 142,098 154,915 165,717 177,761 177,847 215,438 222,227
Generalgovernment 19,107 20,063 20,218 21,641 26,555 28,042 28,268 30,205 35,604 40,744 Publicsafety(1) 68,500 71,272 71,211 73,336 81,083 86,677 90,213 94,762 104,537 108,343 Physicalenvironment(2) 2,111 1,198 1,321 1,391 3,581 6,206 4,899 1,546 1,472 1,633 Transportation(2) 3,355 4,159 3,285 3,205 3,568 3,426 3,671 3,831 4,157 4,158 Economicenvironment(1) 1,944 2,673 2,914 3,267 2,043 2,594 3,126 3,785 5,558 6,372 Communityservices(1)(5) — — — — — — — 6,499 6,555 7,435 Socialservices(4)(5) 1,540 2,057 2,414 5,196 5,794 6,187 6,490 — — — Culturalarts(4) — — — 3,133 3,173 3,356 3,821 3,346 3,918 4,441 Parksandrecreation(1) 8,022 8,516 10,326 11,086 13,126 13,461 13,775 13,083 15,479 17,500 Non-departmental — — — — — — — — — — Grantsandaid 11,129 123 230 105 119 169 356 1,812 322 311 Capitaloutlay 7,992 8,716 14,733 28,207 22,910 12,635 15,211 17,536 13,758 21,191 Debtservice: Principal(3) 13,156 3,634 91,130 2,139 4,266 6,852 7,222 7,905 8,146 8,968 Interest 5,066 5,648 6,996 6,346 6,237 6,275 6,043 5,917 4,376 4,040 IssuanceCosts — — 474 — 44 — — — — — Fiscalcharges 1,196 167 5 3 2 2 3 2 19 3 Totalexpenditures 143,118 128,226 225,257 159,055 172,501 175,882 183,098 190,229 203,901 225,138 Excess(deficiency)ofrevenuesover expenditures (11,344) (5,941) (93,232) (16,957) (17,586) (10,165) (5,337) (12,382) 11,537 (2,911) Otherfinancingsources(uses): Transfersin 27,987 12,686 11,276 15,511 13,006 14,625 16,326 17,359 26,188 17,935 Transfersout (30,398) (16,402) (14,673) (13,617) (13,713) (14,625) (16,326) (17,359) (28,779) (17,935) Issuanceofdebt(3)(6) 59,815 — 79,595 2,232 11,999 — 773 10,000 20,758 865 Premiumonissuanceofdebt(3) 190 — 7,209 — — — — — — — Saleofcapitalassets — — — — 185 — — — — — Totalotherfinancingsources(uses) 57,594 (3,716) 83,407 4,126 11,477 — 773 10,000 12,775 865 Netchangeinfundbalances $ 46,250 $ (9,657) $ (9,825) $(12,831) $ (6,109) $(10,165) $ (4,564) $ (2,382) $ 24,312 $ (2,046) Debtserviceasapercentageofnoncapitalexpenditures 13.19% 7.72% 45.80% 6.32% 6.82% 7.85% 7.62% 7.72% 7.77% 7.77%
Revenues
Expenditures
CITY OF MIRAMAR, FLORIDA SCHEDULE4-CHANGESINFUNDBALANCESOFGOVERNMENTALFUNDS(UNAUDITED) LASTTENFISCALYEARS
167
(MODIFIEDACCRUALBASISOFACCOUNTING) (AMOUNTSEXPRESSEDINTHOUSANDS)
REVENUE CAPACITY
This section is intended to assist users in understanding and assessing the factors affecting a government’s ability to generate its own-source revenues.
CITY OF MIRAMAR, FLORIDA
SCHEDULE 5 - ASSESSED AND ESTIMATED ACTUAL VALUE OF TAXABLE PROPERTY (UNAUDITED) LAST TEN FISCAL YEARS
Source: Broward County PropertyAppraiser
FiscalYear TaxYear Real Property Personal Property Less:Tax Exempt Property TotalTaxable Assessed Value Total Direct Rate Estimated Actual Taxable Value (1) Taxable Assessed Value as a Percentage of Estimated Actual Taxable Value (1) 2014 2013 $ 8,619,600,040 $ 427,650,646 $ 2,093,194,689 $ 6,954,055,997 6.4654 $ 7,707,457,008 90% 2015 2014 9,098,857,180 439,650,107 2,111,708,413 7,426,798,874 6.7654 8,251,998,749 90% 2016 2015 9,772,152,930 470,714,004 2,283,275,830 7,959,591,104 6.7654 8,843,990,116 90% 2017 2016 10,469,255,890 491,033,890 2,318,042,464 8,642,247,316 6.7654 9,602,497,018 90% 2018 2017 11,144,032,560 480,944,321 2,363,066,082 9,261,910,799 6.7654 10,291,011,999 90% 2019 2018 11,777,020,790 467,502,653 2,409,992,529 9,834,530,914 7.1172 10,927,256,571 90% 2020 2019 12,272,865,580 487,172,600 2,451,005,696 10,309,032,484 7.1172 11,454,480,538 90% 2021 2020 12,869,859,830 479,163,984 2,497,334,586 10,851,689,228 7.1172 12,057,432,476 90% 2022 2021 12,415,600,020 477,150,336 2,548,584,664 11,344,165,692 7.1172 11,344,165,692 100% 2023 2022 14,727,307,220 499,019,588 2,644,665,948 12,581,660,860 7.1172 12,581,660,860 100% (1) Property in Broward County is reassessed once every year, on average. The County assesses property at approximately 85-100% of actual value for commercial and industrial property and 85-100% for residential property, as required by Florida law. Estimated actual taxable value is calculated by dividing taxable value by those percentages. Tax rates are per $1,000 of assessed value.
168
CITY OF MIRAMAR, FLORIDA
SCHEDULE 6 - DIRECTAND OVERLAPPING PROPERTY TAX RATES (UNAUDITED) LAST TEN FISCAL YEARS
Overlapping Rates
(1) The City of Miramar's direct tax rate is only comprised of an operating millage.
Note: Property tax rates are based on each $1,000 of net assessed value.
Source: Broward County, Florida PropertyAppraiser
Fiscal Year Tax Year City of Miramar (1) Broward County Operating Broward County Debt Broward County School District South Broward Hospital District Other Total Direct & Overlapping Rates 2014 2013 6.47% 5.44% 0.28% 7.48% 0.40% 0.93% 21.00% 2015 2014 6.76% 5.46% 0.26% 7.44% 0.19% 0.91% 21.02% 2016 2015 6.76% 5.47% 0.25% 7.27% 0.18% 0.88% 20.81% 2017 2016 6.76% 5.45% 0.22% 6.91% 0.16% 0.85% 20.35% 2018 2017 6.76% 5.46% 0.21% 6.54% 0.15% 0.83% 19.95% 2019 2018 7.12% 5.48% 0.19% 6.40% 0.14% 0.81% 20.14% 2020 2019 7.12% 5.49% 0.18% 6.74% 0.13% 0.79% 20.45% 2021 2020 7.12% 5.50% 0.17% 6.51% 0.12% 0.79% 20.21% 2022 2021 7.12% 5.53% 0.14% 6.14% 0.10% 0.48% 19.51% 2023 2022 7.12% 5.55% 0.12% 6.43% 0.09% 0.48% 19.79%
169
CITY OF MIRAMAR, FLORIDA SCHEDULE 7 - PRINCIPAL PROPERTY TAXPAYERS (UNAUDITED) CURRENT YEAR AND NINE YEARS AGO
CITY OF MIRAMAR, FLORIDA SCHEDULE 7 - PRINCIPAL PROPERTY TAXPAYERS (UNAUDITED) CURRENT
AND NINE YEARS AGO
Source: Broward County, Florida, Department of Revenue
YEAR
2023 2014 Taxpayer Taxable Assessed Value Rank Percentage of Total Taxable Assessed Value (1) Taxable Assessed Value Rank Percentage of Total Taxable Assessed Value Sunbeam Properties Inc $ 544,280,910 1 4.33 % $ 98,881,160 1 1.42 % FC Miramar Phase I LLC 183,769,955 2 1.46 % OE Solano at Miramar LLC 157,658,820 3 1.25 % Florida Power & Light CO 133,137,362 4 1.06 % 65,031,432 — Mosaic at Miramar LP 119,849,720 5 0.95 % South Broward Hospital District 118,360,410 6 0.94 % 69,824,820 — Avalon Miramar LLC 110,519,021 7 0.88 % Mainstay Miramar LLC 79,005,370 8 0.63 % BPPAlphabet MF Miramar LLC 73,569,617 9 0.58 % Bel Miramar LLC 70,466,222 10 0.56 % 11700 Southwest 26 St. Apartment Investors LLC — — 72,651,480 2 1.04 % Sunbeam Development Corp — — 59,028,160 5 0.85 % Liberty Property Ltd. — — 57,371,960 6 0.83 % Sunbeam Properties — — 56,805,540 7 0.82 % Red Road Residences LLC — — 52,687,750 8 0.76 % Inland Diversified Miramar — — 52,205,030 9 0.75 % Metropolitan Life Insurance Co. — — 45,939,620 10 0.66 % $ 1,590,617,407 12.64 % $ 630,426,952 9.07 %
170
CITY OF MIRAMAR, FLORIDA
SCHEDULE 8 - PROPERTY TAX LEVIES AND COLLECTION (UNAUDITED) LAST TEN FISCAL YEARS
Fiscal Year Taxes Levied for the Fiscal Year Collected within the Fiscal Year of the Levy Delinquent Tax Collections in Subsequent Years Total Collections to Date Amount Percentage of Levy Amount Percentage of Levy 2014 $ 44,985,950 $ 43,231,304 96.10% $ 1,332,063 $ 44,563,367 99.06% 2015 50,266,100 48,049,334 95.59% 26,107 48,075,441 95.64% 2016 53,868,885 51,631,178 95.85% 24,702 51,655,880 95.89% 2017 58,501,360 56,146,772 95.98% 44,202 56,190,974 96.05% 2018 62,689,618 59,967,326 95.66% 33,959 60,001,285 95.71% 2019 70,019,480 67,034,330 95.74% 32,413 67,066,743 95.78% 2020 73,390,469 70,240,360 95.71% 246,893 70,487,253 96.04% 2021 77,277,141 73,923,436 95.66% — 73,923,436 95.66% 2022 80,764,780 77,399,719 95.83% — 77,399,719 95.83% 2023 89,577,762 85,779,706 95.76% 1,208,990 86,988,696 97.11%
171
DEBT CAPACITY
The information presented in this section is intended to assist users in understanding and assessing a government’s debt burden and its ability to issue additional debt.
CITY OF MIRAMAR, FLORIDA
(1)Anallowancehasbeensetupintheamountof$3,484,207.
Fiscal Year Assessments Due Assessments Collected Ratio of Collection to Amounts Due (1) Total Outstanding Assessments 2014 $ 8,328 $ 8,328 (2) 100.0 % $ 3,891,183 2015 230,114 230,114 (3) 100.0 % 3,661,070 2016 2,832 2,832 (4) 100.0 % 3,658,238 2017 202,905 202,905 (5) 100.0 % 3,455,333 2018 (60,690) (60,690) (6) 100.0 % 3,516,023 2019 129,502 129,502 (7) 100.0 % 3,386,521 2020 10,384 10,384 (8) 100.0 % 3,376,137 2021 1,888 1,888 (9) 100.0 % 3,374,249 2022 3,398 3,398 (10) 100.0 % 3,370,851 2023 3,716 3,716 10 100.0 % 3,367,135
172
SCHEDULE 9 - SPECIALASSESSMENT BILLINGS AND COLLECTIONS (UNAUDITED) LAST TEN FISCAL YEARS
CITY OF MIRAMAR, FLORIDA SCHEDULE 10 - RATIOS OF OUTSTANDING DEBT BY TYPE (UNAUDITED) LAST TEN FISCAL YEARS (1) (AMOUNTS EXPRESSED IN THOUSANDS, EXCEPT PER CAPITAAMOUNT)
(1) See Schedule 12, Demographic and Economic Statistics, for personal income and population data.
Note: Details regarding the City's outstanding debt can be found in the notes to the financial statements.
Source: City of Miramar, Florida, Finance Department
GovernmentalActivities Business-typeActivities Percentage ofPersonal Income Fiscal Year Revenue Bonds Special Assessments NotesPayable CapitalLeases Revenue Bonds Specials Assessment Notes Payable Revolving Loan Capital Leases Total Primary Government Percapital 2014 $ 151,265 $ — $ 5,407 $ 445 $ 54,507 $ — $ — $ 12,151 $ — $ 223,775 7.00%$ 1,742 2015 146,594 — 4,711 286 53,377 — — 11,329 — 216,297 7.04% 1,637 2016 145,128 — 4,000 2,204 51,799 — — 10,660 — 213,791 5.97% 1,595 2017 142,077 — 12,864 5,437 50,191 — — 10,028 — 220,597 6.63% 1,619 2018 137,081 — 11,235 4,665 48,618 — — 22,693 — 224,292 5.71% 1,636 2019 131,840 — 9,566 4,366 46,875 — — 35,387 — 228,034 6.02% 1,642 2020 126,324 — 17,575 3,257 45,017 — — 45,899 — 238,072 6.16% 1,767 2021 123,854 — 15,391 2,160 43,099 — — 53,741 — 238,245 5.79% 1,752 2022 118,173 — 21,485 10,463 35,007 — — 51,287 — 236,415 5.24% 1,648 2023 111,597 — 19,540 8,885 39,082 — — 48,660 — 227,764 4.63% 1,644
173
CITY OF MIRAMAR, FLORIDA SCHEDULE 11 - DIRECT AND OVERLAPPING GOVERNMENTALACTIVITIES DEBT (UNAUDITED)
SEPTEMBER 30, 2023
Note: The percentage of overlapping debt is estimated using taxable assessed property values. Value that is within the City boundaries are divided by the County’s and School Board’s total taxable assessed value.
Net Debt Outstanding September 30, 2023 Percentage Applicable to City of Miramar Amount Applicable to City of Miramar Debt repaid with property taxes: Broward County $ 40,974,000 (1) 5.12 % $ 2,100,379 Broward County School Board 861,969,000 (2) 4.79 % 40,568,294 Other debt: Broward County Special Obligation Bonds 1,174,687,000 5.12 % 60,215,944 Broward County Capital Leases — 5.12 % — Broward County Loans Payable and Other Obligations 65,015,000 5.12 % 3,332,751 Broward County School Board Capital Outlay Bonds 2,650,000 4.79 % 125 Broward County School Board Certificates of Participation 1,419,940,000 4.79 % 66,829 Broward County School Board Capital Leases — 4.79 % — Subtotal, overlapping debt 106,284,322 City direct debt: City of Miramar 140,030,089 100.00 % 140,030,089 Total direct and overlapping debt $ 246,314,411 (1) Source: Broward County, Florida (2) Source: School Board of Broward County, Florida
Governmental Unit
174
DEMOGRAPHIC/ECONOMIC
This section is intended (1) to assist users in understanding the socioeconomic environment within which a government operates and (2) to provide information that facilitates comparisons of financial statement information over time and among governments.
Fiscal Year (1) Median Household Income(4) PerCapita PersonalIncome (4) MedianAge (4) School Enrollment (2) Unemployment Rate(3) Population 2014 128,432 $ 62,649 $ 24,901 35 23,718 6.30% 2015 132,096 67,291 23,269 35 23,589 4.70% 2016 134,037 70,133 26,723 37 23,093 4.60% 2017 136,246 61,767 24,408 39 22,675 3.80% 2018 137,107 70,381 28,656 36 22,781 2.70% 2019 138,837 68,293 27,275 36 21,574 2.80% 2020 134,721 70,669 28,697 37 20,927 7.80% 2021 136,007 75,079 30,237 36 19,990 4.20% 2022 138,237 79,282 32,637 40 19,573 4.10% 2023 138,590 80,661 35,530 41 19,202 2.90% (1) Source: From 2012 to 2019 and 2021, University of Florida, Bureau of Economic and Business Research. Fiscal year 2020 restated per U.S. Census (2) Source: School Board of Broward County (3) Source: State of Florida LAUS (4) Source: American Fact Finder ACS, U.S. Bureau of Census
SCHEDULE 12
DEMOGRAPHIC
ECONOMIC STATISTICS
LAST TEN
175
CITY OF MIRAMAR, FLORIDA
-
AND
(UNAUDITED)
FISCAL YEARS
CITY OF MIRAMAR, FLORIDA
SCHEDULE 13 - PRINCIPAL EMPLOYERS (UNAUDITED)
CURRENT YEAR AND NINE YEARS AGO
2023 2014 Employer Full-time Employees Rank Percentageof TotalCity Employment (1) Full-time Employees Rank Percentageof TotalCity Employment (1) Comcast of South Florida 1,857 1 2.43 % 800 2 1.73 % Memorial Hospital Miramar 1,461 2 1.92 % Royal Caribbean Cruises Ltd. 1,400 3 1.84 % 650 3 1.41 % Interactive ResponseTechnologies, LLC 1,247 4 1.63 % City of Miramar 1,188 5 1.56 % 1,073 1 2.32 % Southern Glazer's Wine and Spirits, LLC 1,130 6 1.48 % 320 10 0.69 % Carnival Corporation 1,115 7 1.46 % 583 5 1.26 % SpiritAirlines, INC 976 8 1.28 % 440 9 0.95 % Publix Supermarkets 940 9 1.23 % Premier Beverage Co, LLC 578 10 0.76 % 473 7 1.02 % Quest Diagnostic Inc. 469 8 1.01 % Humana Medical Plan INC 594 4 1.29 % Univita Healthcare Solutions LLC 476 6 1.03 % Totals 11,892 15.59 % 5,078 10.98 %
City of Miramar business tax division
Percentage of total full-time employees for all major employers in the City of Miramar
Source:
(1)
176
OPERATING INFORMATION
This section is intended to provide contextual information about a government’s operations and resources to assist readers in using financial statement information to understand and assess a government’s economic condition
CITY OF MIRAMAR, FLORIDA
SCHEDULE 14- FULL TIME EQUIVALENT CITY GOVERNMENT EMPLOYEES BY FUNCTION/PROGRAM (UNAUDITED) LAST SIX FISCAL YEARS
City Commission 7.5 10.0 10.0 10.0 10.0 10.0 10.0 10.0 10.0 10.0 City Manager's Office 9.0 10.0 10.0 10.0 10.0 11.0 10.0 6.0 5.0 4.0 BusinessInclusionDiversity 5.0 ExecutiveAdministration 7.5 7.0 11.0 MarketingandCustomerServices 8.0 8.0 10.0 9.0 10.0 8.0 9.0 13.0 Office of the City Clerk Administration 2.2 3.2 3.2 2.2 2.2 2.8 3.8 3.8 3.8 3.8 PassportServices 1.4 1.4 1.4 1.3 1.3 0.8 0.8 0.8 0.8 0.8 MunicipalElection 0.4 0.5 0.5 0.5 0.5 0.5 0.5 0.5 0.5 0.5 Financial Services Administration 7.0 3.0 3.0 3.0 3.0 3.0 3.0 3.0 3.0 4.0 Accounting&RevenueEnhancement 31.0 29.0 29.0 29.0 28.5 28.0 29.0 29.0 28.0 28.0 ReportingandTraining 2.0 2.0 1.0 1.0 1.0 1.0 1.0 1.0 1.0 GrantsAdministration 3.0 3.0 3.0 2.5 2.5 2.5 2.5 2.5 3.0 UtilityBilling 9.5 Management & Budget Budget&CapitalProjectManagement 6.0 4.7 4.7 5.7 5.65 5.65 5.65 5.65 5.7 5.7 StrategicPlanning&PerformanceManagement 1.8 1.8 1.8 1.6 1.6 1.6 1.6 1.55 1.55 Fiscal&StructuralInnovation 1.6 1.6 1.6 1.80 2.80 2.80 1.80 1.8 1.8 Procurement ProcurementOperations 8.0 7.0 7.0 8.0 8.0 8.0 8.5 7.0 8.0 8.0 MailroomOperations 2.0 2.0 2.0 2.0 2.0 2.0 2.5 2.0 2.0 2.0 Human Resources Administration 5.5 3.5 3.5 6.5 2.5 3.0 5.0 3.0 4.0 4.0 HROperations 6.5 8.5 8.5 7.5 11.5 11.0 10.0 9.0 8.5 11.0 TrainingandDevelopment 2.0 2.5 3.0 2.0 DivofCivilRights&EmployeeLaborRelations 3.0 2.0 2.0 RetirementAdministration 2.0 Wellness 1.0 1.0 1.00 1.00 Function/Program 2014 2015 2016 2017 2018 2019 2020 2021 2022 2023
177
CITY OF
MIRAMAR, FLORIDA
SCHEDULE 14- FULL TIME EQUIVALENT CITY GOVERNMENT EMPLOYEES BY FUNCTION/PROGRAM (UNAUDITED) LAST SIX FISCAL YEARS
Human Resources - Risk Management RiskManagement 2.0 2.5 3.0 3.0 3.5 3.0 Liability-RiskManagement 3.0 3.0 2.0 BenefitsAdministration 3.00 2.50 4.00 3.00 3.0 3.0 Cultural Arts 3.0 3.0 Administration 6.50 4.50 4.50 2.25 2.25 3.50 4.0 3.0 3.0 3.0 ClientManagementServices 8.4 4.5 4.5 Marketing&Sales 2.0 1.0 1.0 1.0 1.3 Education&Gallery 3.5 3.0 3.0 3.3 3.5 5.5 6.0 5.0 4.5 4.5 Food&Beverage 4.7 1.6 1.6 2.8 2.5 2.0 2.5 2.5 2.50 3.00 TheaterProduction 5.0 4.75 4.50 4.50 4.50 7.00 8.50 TheaterFacilities 0.8 0.75 Community Development 36.5 Administration 5.0 5.0 5.0 6.0 7.0 6.0 5.0 5.50 6.00 PlanningandZoning 4.75 4.75 13.00 12.25 13.00 12.00 14.00 9.50 6.00 SustainablePlanning 2.3 2.3 GeographicInformationSystems 1.00 1.00 BuildingPermits&Inspections 24.50 24.50 25.50 25.0 31.5 32.00 31.50 33.00 35.00 SisterCitiesInitiative 0.3 Economic Development & Revitalization 12.50 Housing and Community Development 2.00 2.00 3.00 BusinessDevelopment 2.50 2.50 3.00 7.00 7.00 7.00 Business Inclusion Diversity 5.00 1.00 1.00 1.00 MIS Administration 3.00 3.00 3.00 3.00 3.00 3.00 3.00 3.00 3.00 DataServices 7.25 4.00 4.00 5.00 4.00 4.00 4.00 4.00 5.00 5.00 NetworkServices 3.75 3.00 3.00 3.00 3.00 3.00 3.00 3.00 3.00 3.00 Helpdesk 4.95 4.00 4.00 4.00 4.00 4.00 5.00 5.50 4.50 5.50 AudioVisualEventManagement 0.55 1.00 CyberSecurity 3.00 3.00 3.00 3.00 3.00 3.00 3.00 3.00 3.50 PublicSafetyIT 4.00 4.00 4.00 4.00 5.50 Function/Program 2014 2015 2016 2017 2018 2019 2020 2021 2022 2023
178
CITY OF MIRAMAR, FLORIDA
SCHEDULE 14- FULL TIME EQUIVALENT CITY GOVERNMENT EMPLOYEES BY FUNCTION/PROGRAM (UNAUDITED) LAST SIX FISCAL YEARS
Parks and Recreation Administration 19.00 15.00 15.00 7.00 7.00 8.00 8.50 9.50 8.50 9.00 ParkMaintenance 4.00 19.00 19.00 19.00 19.00 20.00 16.00 16.00 16.00 18.00 Recreation SpecialEvents 2.50 2.50 2.50 10.50 10.50 10.50 3.00 4.00 4.00 4.00 MiramarYouthEnrichmentCenter 11.50 11.50 11.50 12.00 11.50 12.00 8.00 7.00 7.00 11.00 Athletics 2.00 2.00 2.00 2.00 2.00 1.00 2.00 SunsetLakes 12.50 11.00 11.00 11.50 10.50 11.00 9.00 7.50 7.50 9.00 MiramarRegionalPark 18.00 18.00 18.00 17.50 17.50 16.50 15.00 12.50 12.50 12.50 Aquatics 24.00 27.50 27.50 27.50 28.50 27.50 27.50 23.50 23.50 26.00 AnsinSportsComplex 9.00 7.00 7.00 6.00 8.00 9.00 11.50 9.50 9.00 7.50 VizcayaPark 6.00 7.00 7.00 8.00 6.50 5.50 9.00 8.00 6.50 8.00 Community Services Administration 2.00 4.00 4.00 5.00 5.00 7.00 6.00 5.00 4.00 4.00 SeniorTransportation 11.50 SeniorServices 14.50 17.00 17.00 17.50 19.00 17.00 19.00 28.00 26.50 28.00 FairwayChildcare 10.00 CommunityOutreach(CDBG) 2.00 2.00 2.00 2.00 2.00 2.00 2.00 2.00 AdultDaycareCenter 6.50 6.50 6.50 5.50 6.50 6.50 6.50 6.50 9.50 ChildcareServices 35.00 43.00 43.00 39.00 39.00 39.00 40.50 38.50 37.50 35.50 Public Works Administration 6.00 4.20 4.20 4.20 3.45 1.95 1.95 1.95 2.45 3.45 BuildingMaintenance 15.00 18.00 18.00 19.50 18.50 18.50 19.00 19.00 19.00 19.50 FieldOperations 16.50 17.50 StreetsRepair&Maintenance 18.50 12.00 12.00 9.25 9.25 9.25 9.25 8.25 8.25 8.00 StreetRowMaintenance 11.00 11.00 12.25 LandscapeMaintenance 17.00 16.40 11.25 10.25 20.25 14.75 11.25 10.00 CommunityShuttleService 16.40 16.40 18.40 9.40 8.90 5.50 TransitOperations 8.00 17.00 6.00 5.00 SolidWasteManagement 6.00 6.00 14.40 13.50 6.25 5.15 5.15 6.15 5.65 7.65 FleetMaintenance 10.00 8.50 8.50 8.50 13.50 14.60 14.60 13.10 13.10 15.10 Function/Program 2014 2015 2016 2017 2018 2019 2020 2021 2022 2023
179
CITY OF MIRAMAR, FLORIDA
SCHEDULE 14- FULL TIME EQUIVALENT CITY GOVERNMENT EMPLOYEES BY FUNCTION/PROGRAM (UNAUDITED) LAST SIX FISCAL YEARS
Utilities Administration 13.00 13.00 14.00 14.00 15.00 15.00 20.50 21.50 19.50 18.00 OfficeofOperationalServices 11.50 12.50 12.50 12.00 13.00 13.00 14.00 14.00 16.00 15.00 UtilityBilling 8.50 9.00 10.00 10.00 10.00 10.00 Public Works- Stormwater Management 13.50 13.40 13.40 13.90 14.90 14.90 14.90 14.90 15.80 WaterTreatment/QualityControl ElectricalInstrumentation&Control 6.00 5.00 5.00 5.00 5.00 5.00 6.00 6.00 6.00 6.00 WastewaterTreatment/Collection 22.00 26.00 25.00 25.00 25.00 25.00 24.00 24.00 24.00 24.00 PlantMaintenance 8.00 7.00 7.00 7.00 7.00 7.00 11.00 11.00 11.00 11.00 Water&WastewaterQualityControl 7.00 7.00 7.00 7.00 7.00 7.00 8.00 8.00 8.00 7.00 WaterTreatment&Supply 23.00 23.00 23.00 23.00 23.00 25.00 24.00 24.00 24.00 28.00 WastewaterTreatment&Disposal 14.00 14.00 14.00 14.00 14.00 16.00 15.00 15.00 15.00 17.00 WaterAccountability 7.00 9.00 9.00 8.00 8.00 8.00 8.00 8.00 7.00 7.00 TransmissionandDistribution 10.00 10.00 10.00 11.00 10.00 Maintenance 10.00 10.00 14.00 14.00 14.00 SupportServices 6.50 5.50 5.50 5.50 Engineering&StrategicDevelopment 15.00 14.00 13.00 16.50 Facilities&PropertyManagement 4.00 Construction & Facilities Management Administration 5.50 5.50 6.50 5.50 7.50 DevelopmentEngineering 6.00 7.00 7.00 7.00 7.00 8.50 Construction&FacilitiesManagement 12.00 8.00 8.00 5.00 5.00 Police PoliceLawEnforcementTrust 1.00 CodeCompliance 15.00 15.00 15.00 15.00 15.00 15.00 15.00 17.00 16.00 17.00 OfficeoftheChief 13.00 10.00 10.00 11.00 16.00 17.50 18.50 18.50 22.50 22.50 CommunityOrientedPolicing 123.50 138.50 138.50 146.00 148.00 151.00 153.00 151.00 150.00 151.00 SpecializedSupport 37.00 31.00 31.00 30.00 34.00 39.00 39.00 41.00 41.00 42.00 CriminalInvestigations 30.00 31.00 31.00 32.00 30.00 30.00 30.00 30.00 30.00 30.00 Property&Evidence 7.00 8.00 8.00 8.00 8.00 8.00 8.00 8.00 8.0 8.0 StrategicInvestigations 18.0 21.0 21.0 23.0 18.0 18.0 18.0 17.0 17.0 17.0 SupportServices 27.0 29.0 29.0 30.5 28.5 26.0 25.0 26.0 26.0 26.0 Function/Program 2014 2015 2016 2017 2018 2019 2020 2021 2022 2023
180
Source: Budget Division
CITY OF MIRAMAR, FLORIDA
SCHEDULE 14- FULL TIME EQUIVALENT CITY GOVERNMENT EMPLOYEES BY FUNCTION/PROGRAM (UNAUDITED) LAST SIX FISCAL YEARS
Fire FireRescueSAFERGrant 12 Civilians 9 10 Administration 7 9 6 6 10 9 8 8 8.00 9.00 Logistics 6.00 6.00 7.00 7.00 6.00 6.00 5.00 5.00 5.00 6.00 LifeSafety 6 7 64 71 7 7 8 7 8 9 FireProtection 60 64 4 3 71 71 71 71 70 68 Fire-RescueTraining 4 4 3 4 3 3 4 6 6 6 EmergencyManagement 3 3 59 66 4 4 4 3 4 4 EmergencyMedicalServices 55 59 66 66 66 66 65 63 Total 1037 1022 1058 1101 1082 1100 1142 1124 1114 1154 Function/Program 2014 2015 2016 2017 2018 2019 2020 2021 2022 2023
181
CITY OF MIRAMAR, FLORIDA SCHEDULE 15 - OPERATING INDICATORS BY FUNCTION/PROGRAM (UNAUDITED)
TEN FISCAL YEARS
(1) Athletic and recreation program activities decreased for the fiscal years ended September 30,2020 and 2021 due to the impact of Covid-19.
Source: City Departments
Function/Program 2014 2015 2016 2017 2018 2019 2020 2021 2022 2023 GeneralGovernment Occupationallicensesissued 2,479 2,375 2,405 2,763 2,824 3,039 3,211 3,323 3,438 3,438 Newaccountsoccupational licenses 236 267 267 545 468 468 431 317 399 399 Numberofpassportsprocessed 1,696 1,585 2,176 3,082 2,514 2,747 1,727 878 545 545 Publicsafety Police: Callsforservice 78,295 72,305 74,606 77,517 88,233 85,930 82,362 65,904 56,109 56,109 Physicalarrests 2,408 2,087 2,288 2,352 2,054 1,895 1,854 1,420 1,108 1,108 Parkingviolations 718 756 679 620 873 723 466 171 168 168 Trafficviolations 18,883 20,370 11,967 11,944 12,292 12,271 11,757 5,736 5,107 5,107 Fire: Callsforservice 10,916 11,475 11,298 13,977 12,145 12,645 12,444 12,710 13,736 13,736 UnitResponses(2) 16,492 19,623 20,442 22,338 20,956 20,268 19,449 19,836 21,120 21,120 Inspections 3,040 4,306 4,690 10,434 6,735 5,654 4,682 5,145 4,440 4,440 Numberoffirealarms 432 1,327 3,098 940 756 1,353 1,309 1,499 1,546 1,546 Communitydevelopment Residentialpermitsissued 5,189 5,764 4,329 4,182 4,413 5,248 5,235 5,026 6,001 6,001 Commercialpermitsissued 1,271 1,547 1,448 1,226 1,565 1,489 1,782 1,878 1,045 1,045 Miscellaneouspermitsissued 586 145 444 333 275 1,077 852 154 1,555 1,555 Cultureandrecreation Athleticprograms 36 33 35 35 35 37 39 22 15 15 Athleticprogramparticipants 21,000 15,500 15,550 19,248 20,210 20,313 20,940 10,200 6,950 6,950 Facilityrentals 700 652 687 1,064 1,229 1,612 1,502 488 318 318 Recreationprogram 36 24 26 26 26 26 42 25 38 38 Recreationprogramparticipants (1) 2,955 3,200 3,250 3,330 3,255 5,290 5,860 3,100 4,700 4,700 Summercampparticipants 190 200 200 200 226 445 1,422 — 442 442 Water Metersinstalled 204 243 164 89 66 27 36 103 330 330 TotalCitymeters 33,364 33,618 33,790 33,908 34,025 34,058 34,097 34,174 34,328 34,328 Watermainbreaks 11 5 3 10 27 20 24 16 14 14 Averagedailyconsumption (millionsofgallons) 13 14 13 13 12 16 13 8 8 8
182
LAST
CITY OF MIRAMAR, FLORIDA SCHEDULE 16 - CAPITALASSET STATISTICS BY FUNCTION/PROGRAM (UNAUDITED)
LAST TEN FISCAL YEARS (1)
Source: City Department
Function/Program 2014 2015 2016 2017 2018 2019 2020 2021 2022 2023 Generalgovernment Highschools 2 2 2 2 2 2 2 2 2 2 Middleschools 3 3 3 3 3 3 3 3 3 3 Elementaryschools 11 11 11 11 11 11 11 11 11 11 Specialeducationprograms 1 1 1 1 1 1 1 1 1 1 Publicsafety Police: Policeofficers(totalbudgeted sworn) 202 205 205 211 216 217 226 229 228 227 Stations 2 2 2 2 2 2 2 2 3 3 Patrolunitsandmotorcycleunits 177 180 180 133 148 148 154 157 155 154 Fire: Firefighters 138 140 138 138 151 151 151 151 150 151 Firecivilians 12 13 13 13 15 15 14 14 15 14 Stations 5 5 5 5 5 5 5 5 5 5 Trucks 8 8 8 8 8 10 10 10 10 10 ALSRescueUnits 8 8 8 8 8 9 9 9 9 9 Streets Streets(miles) 401 402 402 410 408 408 408 408 408 408 Streetlights 3,736 3,736 3,736 4,332 4,332 4,332 4,390 4,390 4,390 4,563 Cultureandrecreation Baseball/softballdiamonds 11 11 11 11 11 11 11 11 11 11 Basketballcourts 22 22 22 22 22 21 21 21 21 21 Communitycenters 4 4 4 4 4 4 4 4 4 4 Libraries 1 1 1 1 1 1 1 1 1 1 Parks 45 40 40 45 45 42 42 42 42 42 Parksacreage 405 405 405 405 405 458 458 458 458 458 Pavilions 21 21 21 23 24 24 25 26 26 27 Playgrounds 23 23 23 23 24 25 26 26 26 27 Soccer/footballfields 18 18 18 18 19 21 21 21 21 21 Swimmingpools 2 2 2 29 29 29 29 29 29 29 Tenniscourts Water Waterplants 2 2 2 2 2 2 2 2 2 2 Watermains(miles) 428 442 455 457 457 457 442 441 441 441 Waterwellsites 15 15 15 15 15 15 15 10 10 10 Waterstoragetanks 4 4 4 4 4 4 4 4 4 4 Firehydrants 4,396 4,432 4,522 4,538 4,541 4,522 4,432 4,524 4,525 4,605 Storagecapacity(thousandsof gallons) 10 10 10 10 10 10 10 11 11 11 Wastewater Wastewatertreatmentplant 1 1 1 1 1 1 1 1 1 1 Sanitarysewers(miles) 261 261 262 263 263 263 261 263 270 270 Forcemainsewers(miles) 81 80 80 81 82 81 80 81 81 81 Sewermanholes 6,536 6,534 6,570 6,736 6,739 6,604 6,534 6,625 6,875 7,062 Boosterstations 1 1 1 1 1 1 1 1 1 1 Citylakesandcanals(acres) 102 102 102 102 102 102 102 102 102 102 Treatmentcapacity(thousandsof gallons) 13 13 13 13 10 10 13 13 13 13
183
COMPLIANCE SECTION
INDEPENDENT AUDITOR’S REPORT ON INTERNAL CONTROL OVER FINANCIAL REPORTING AND ON COMPLIANCE AND OTHER MATTERS BASED ON AN AUDIT OF FINANCIAL STATEMENTS PERFORMED IN ACCORDANCE WITH GOVERNMENT AUDITING STANDARDS
To the Honorable Mayor and Members of the City Commission City of Miramar, Florida
We have audited, in accordance with the auditing standards generally accepted in the United States of America and the standards applicable to financial audits contained in Government Auditing Standards issued by the Comptroller General of the United States, the financial statements of the governmental activities, the business-type activities, each major fund, and the aggregate remaining fund information of the City of Miramar, Florida (the City), as of and for the year ended September 30, 2023 and the related notes to the financial statements, which collectively comprise the City’s basic financial statements and have issued our report thereon dated May 31, 2024.
Report on Internal Control over Financial Reporting
In planning and performing our audit of the financial statements, we considered the City’s internal control over financial reporting (internal control) as a basis for designing audit procedures that are appropriate in the circumstances for the purpose of expressing our opinions on the financial statements, but not for the purpose of expressing an opinion on the effectiveness of the City’s internal control. Accordingly, we do not express an opinion on the effectiveness of the City’s internal control.
A deficiency in internal control exists when the design or operation of a control does not allow management or employees, in the normal course of performing their assigned functions, to prevent, or detect and correct, misstatements, on a timely basis. A material weakness is a deficiency, or a combination of deficiencies, in internal control, such that there is a reasonable possibility that a material misstatement of the entity’s financial statements will not be prevented, or detected and corrected, on a timely basis. A significant deficiency is a deficiency, or a combination of deficiencies, in internal control that is less severe than a material weakness, yet important enough to merit attention by those charged with governance.
Our consideration of internal control was for the limited purpose described in the first paragraph of this section and was not designed to identify all deficiencies in internal control that might be material weaknesses or significant deficiencies. Given these limitations, during our audit we did not identify any deficiencies in internal control that we consider to be material weaknesses. However, material weaknesses or significant deficiencies may exist that were not identified.
Miramar Office
3350 SW 148th Ave. | Suite 110
Miramar, FL 33027 (954) 874-1721
North Miami Office 1801 NE 123rd Street | Suite 314 North Miami, FL 33181 (786) 743-7108
184
info@abcpasolutions.com
Report on Compliance and Other Matters
As part of obtaining reasonable assurance about whether the City’s financial statements are free from material misstatement, we performed tests of its compliance with certain provisions of laws, regulations, contracts, and grant agreements, noncompliance with which could have a direct and material effect on the financial statements. However, providing an opinion on compliance with those provisions was not an objective of our audit, and accordingly, we do not express such an opinion. The results of our tests disclosed no instances of noncompliance or other matters that are required to be reported under Government Auditing Standards.
Purpose of This Report
The purpose of this report is solely to describe the scope of our testing of internal control and compliance and the results of that testing, and not to provide an opinion on the effectiveness of the entity’s internal control or on compliance. This report is an integral part of an audit performed in accordance with Government Auditing Standards in considering the entity’s internal control and compliance. Accordingly, this communication is not suitable for any other purpose.
Miramar, Florida May 31, 2024
185
INDEPENDENT AUDITOR’S REPORT ON COMPLIANCE FOR EACH MAJOR FEDERAL PROGRAM AND STATE PROJECT AND REPORT ON INTERNAL CONTROL OVER COMPLIANCE IN ACCORDANCE WITH THE UNIFORM GUIDANCE AND CHAPTER 10.550, RULES OF THE AUDITOR GENERAL
To the Honorable Mayor and Members of the City Commission City of Miramar, Florida
Report on Compliance for Each Major Federal Program and State Project
Opinion on Each Major Federal Program and State Project
We have audited City of Miramar, Florida’s (the “City”) compliance with the types of compliance requirements described in the U.S. Office of Management and Budget (“OMB”) Compliance Supplement and the requirements described in the Department of Financial Services State Projects Compliance Supplement that could have a direct and material effect on each of the City’s major federal programs and state projects for the year ended September 30, 2023. The City’s major federal programs and state projects are identified in the summary of auditor’s results section of the accompanying schedule of findings and questioned costs
In our opinion, the City complied, in all material respects, with the types of compliance requirements referred to above that could have a direct and material effect on each of its major federal programs and State projects for the year ended September 30, 2023.
Basis for Opinion on Each Major Federal Program
We conducted our audit of compliance in accordance with auditing standards generally accepted in the United States of America; the standards applicable to financial audits contained in Government Auditing Standards, issued by the Comptroller General of the United States; and the audit requirements of Title 2 U.S. Code of Federal Regulations Part 200, Uniform Administrative Requirements, Cost Principles, and Audit Requirements for Federal Awards (Uniform Guidance) and Chapter 10.550, Rules of the Auditor General. Our responsibilities under those standards and the Uniform Guidance and Chapter 10.550, Rules of the Auditor General are further described in the Auditor’s Responsibilities for the Audit of Compliance section of our report.
We are required to be independent of the City and to meet our other ethical responsibilities, in accordance with relevant ethical requirements relating to our audit. We believe that the audit evidence we have obtained is sufficient and appropriate to provide a basis for our opinion on compliance for each major federal program. Our audit does not provide a legal determination of the City’s compliance with the compliance requirements referred to above. Miramar Office
3350 SW 148th Ave. | Suite 110 Miramar, FL 33027
(954) 874-1721
North Miami Office 1801 NE 123rd Street | Suite 314 North Miami, FL 33181 (786) 743-7108
186
info@abcpasolutions.com
Responsibilities of Management for Compliance
Management is responsible for compliance with the requirements referred to above and for the design, implementation, and maintenance of effective internal control over compliance with the requirements of laws, statutes, regulations, rules, and provisions of contracts or grant agreements applicable to City’s federal programs and State projects.
Auditor’s Responsibilities for the Audit of Compliance
Our objectives are to obtain reasonable assurance about whether material noncompliance with the compliance requirements referred to above occurred, whether due to fraud or error, and express an opinion on the City’s compliance based on our audit. Reasonable assurance is a high level of assurance but is not absolute assurance and therefore is not a guarantee that an audit conducted in accordance with generally accepted auditing standards, Government Auditing Standards, the Uniform Guidance and Chapter 10.550, Rules of the Auditor General will always detect material noncompliance when it exists. The risk of not detecting material noncompliance resulting from fraud is higher than for that resulting from error, as fraud may involve collusion, forgery, intentional omissions, misrepresentations, or the override of internal control. Noncompliance with the compliance requirements referred to above is considered material if there is a substantial likelihood that, individually or in the aggregate, it would influence the judgment made by a reasonable user of the report on compliance about City’s compliance with the requirements of each major federal program and State project as a whole.
In performing an audit in accordance with generally accepted auditing standards, Government Auditing Standards, the Uniform Guidance, and Chapter 10.550, Rules of the Auditor General we:
• Exercise professional judgment and maintain professional skepticism throughout the audit.
• Identify and assess the risks of material noncompliance, whether due to fraud or error, and design and perform audit procedures responsive to those risks. Such procedures include examining, on a test basis, evidence regarding the City’s compliance with the compliance requirements referred to above and performing such other procedures as we considered necessary in the circumstances.
• Obtain an understanding of the City’s internal control over compliance relevant to the audit in order to design audit procedures that are appropriate in the circumstances and to test and report on internal control over compliance in accordance with the Uniform Guidance and Chapter 10.550, Rules of the Auditor General, but not for the purpose of expressing an opinion on the effectiveness of City’s internal control over compliance. Accordingly, no such opinion is expressed.
We are required to communicate with those charged with governance regarding, among other matters, the planned scope and timing of the audit and any significant deficiencies and material weaknesses in internal control over compliance that we identified during the audit.
Report on Internal Control over Compliance
A deficiency in internal control over compliance exists when the design or operation of a control over compliance does not allow management or employees, in the normal course of performing their assigned functions, to prevent, or detect and correct, noncompliance with a type of compliance requirement of a federal program on a timely basis. A material weakness in internal control over compliance is a deficiency, or a combination of deficiencies, in internal control over compliance, such that there is a reasonable possibility that material noncompliance with a type of compliance requirement of a federal program will not be prevented, or detected and corrected, on a timely basis. A significant deficiency in internal control over compliance is a deficiency, or a combination of deficiencies, in internal control over compliance with a type of compliance requirement of a federal program that is less severe than a material weakness in
187
internal control over compliance, yet important enough to merit attention by those charged with governance.
Our consideration of internal control over compliance was for the limited purpose described in the Auditor’s Responsibilities for the Audit of Compliance section above and was not designed to identify all deficiencies in internal control over compliance that might be material weaknesses or significant deficiencies in internal control over compliance. Given these limitations, during our audit we did not identify any deficiencies in internal control over compliance that we consider to be material weaknesses, as defined above. However, material weaknesses or significant deficiencies in internal control over compliance may exist that were not identified.
Our audit was not designed for the purpose of expressing an opinion on the effectiveness of internal control over compliance. Accordingly, no such opinion is expressed.
The purpose of this report on internal control over compliance is solely to describe the scope of our testing of internal control over compliance and the results of that testing based on the requirements of the Uniform Guidance and Chapter 10.550, Rules of the Auditor General. Accordingly, this report is not suitable for any other purpose.
Miramar, Florida May 31, 2024
188
Aging Cluster - Cluster
U.SDepartmentofHealthandHumanServices
Pass-ThroughStateofFloridaDepartmentofHealthandRehabilitationServices
Pass-ThroughArea-wideCouncilonAgingofBrowardCounty,Inc
SpecialProgramfortheAging,TitleIII,PartB,GrantsforSupportive ServicesandSeniorCenters
SpecialProgramfortheAging,TitleIII,PartB,GrantsforSupportive
- Entitlement Grants - Cluster
U.S. Department of Housing and Urban Development CommunityDevelopmentBlockGrants/EntitlementGrants
93.044 JA122-05-2022 $ 108,876
ServicesandSeniorCenters 93.044 JA123-05-2023 299,244 TotalSpecialProgramfortheAging,TitleIII,PartB 408,121 TotalU.S.DepartmentofHealthandHumanServices 408,121 Total Aging Cluster - Cluster 408,121
CDBG
CommunityDevelopmentBlockGrants/EntitlementGrants 14.218 B19MC120047 360 CommunityDevelopmentBlockGrants/EntitlementGrants 14.218 B20MC120047 464,355 CommunityDevelopmentBlockGrants/EntitlementGrants 14.218 B21MC120047 747,124 CommunityDevelopmentBlockGrants/EntitlementGrants 14.218 B22MC120047 633,259 CommunityDevelopmentBlockGrants/EntitlementGrants 14.218 B20MW120047 335,290 TotalCommunityDevelopmentBlockGrants/EntitlementGrants 2,180,388 TotalU.S.DepartmentofHealthandHumanServices 2,180,388 Total CDBG - Entitlement Grants Cluster 2,180,388 Highway Planning and Construction Cluster - Cluster Department of Transportation PassedthroughFloridaDepartmentofTransportation 20.205 G2678 495,775 PassedthroughFloridaDepartmentofTransportation 20.205 G2B97 219,979 PassedthroughUniversityofNorthFlorida-HighVisibilityEnforcement 20.205 G2A92 8,732 TotalDepartmentofTransportation 724,486 Total Highway Planning and Construction Cluster - Cluster 724,486 Highway Safety Cluster Department of Transportation StateandCommunityHighwaySafety Passed through Florida Department of Transportation - Work Zone Safety 20.600 G2D91 64,677 TotalHighwaySafety 64,677 TotalDepartmentofTransportation 64,677 Total Highway Safety Cluster 64,677 Other Programs U.S.DepartmentofHomelandSecurity Staffing for Adequate Fire and Emergency Response (SAFER) 97.083 EMW-2021FF-01740 1,090,243 TotalSAFERGrant 1,090,243 FederalAgency/Pass-ThroughEntity/ProgramTitle ALN Grant/Contract Number
CITY OF MIRAMAR,
SCHEDULE OF EXPENDITURES OF FEDERALAWARDS AND STATE FINANCIALASSISTANCE FISCAL
SEPTEMBER 30,
See notes to schedule of expenditures of federal awards and state financial assistance 189
Expenditures
FLORIDA
YEAR ENDED
2023
Other Programs (continued)
Pass-ThroughFloridaDepartmentofEmergencyManagement HazardMitigationGrantProgram
Pass-ThroughCityofMiami,Florida UrbanAreaSecurityInitiative
U.S.DepartmentofJustice Pass-ThroughOfficeoftheAttorneyGeneral CrimeVictimAssistance
Pass-ThroughFloridaDivisionofEmergencyManagement DisasterGrants-PublicAssistance-HurricaneIrma 97.036 Z0797 163,557 DisasterGrants-PublicAssistance-HurricaneDorian 97.036 Z1666 313,638 DisasterGrants-PublicAssistance- COVID-19 97.036 Z1858 585,629
1,062,823
TotalDisasterGrants-PublicAssistance(PresidentiallyDeclaredDisaster)
HazardMitigationGrantProgram 97.039 H0267 4,041 HazardMitigationGrantProgram 97.039 H0302 461,899 HazardMitigationGrantProgram 97.039 H0303 389,691 HazardMitigationGrantProgram 97.039 H0523 64,923 TotalHazardMitigationProgram 920,555
UrbanAreaSecurityInitiative 97.067 R0232 115,380 UrbanAreaSecurityInitiative 97.067 R0521 78,995 TotalUrbanAreaSecurityInitiative 194,374 TotalU.S.DepartmentofHomelandSecurity 3,267,995
CrimeVictimAssistance 16.575 VOCA-2022-913CityofMiramar 65,983 TotalCrimeVictimAssistance 65,983 PublicSafetyPartnershipandCommunityPolicingGrants CommunityOrientedPolicingServices(COPS) 16.710 15JCOPS-21GC-02433-SPPS 929 LawEnforcementMentalHealth&WellnessAct 16.710 16JCOPS-22GG-04079-LEMH 6,890 TotalEdwardByrneMemorialJusticeAssistanceGrantProgram 7,819 EdwardByrneMemorialJusticeAssistanceGrantProgram EdwardByrneMemorialJusticeAssistanceGrantProgram 16.738 2019-DJ-BX-0432 25,809 TotalEdwardByrneMemorialJusticeAssistanceGrantProgram 25,809 BodyWornCameraProgram BodyWornCameraProgram 16.835 15PBBJA-21GG-04428-BWCX 57,000 TotalBodyWornCameraProgram 57,000 EquitableSharingProgram EquitableSharingProgram 16.922 FL0062200 75,302 TotalEquitableSharingProgram 75,302 Total U.S. Department of Justice 231,913 FederalAgency/Pass-ThroughEntity/ProgramTitle ALN Grant/Contract Number
CITY OF MIRAMAR, FLORIDA SCHEDULE OF EXPENDITURES OF FEDERALAWARDS AND STATE FINANCIALASSISTANCE FISCAL YEAR
SEPTEMBER 30, 2023 See notes to schedule of expenditures of federal awards and state financial assistance 190
Expenditures
ENDED
Other Programs (continued)
U.SDepartmentofHealthandHumanServices
Pass-ThroughStateofFloridaDepartmentofHealthandRehabilitationServices
Pass-ThroughArea-wideCouncilonAgingofBrowardCounty,Inc
SpecialProgramfortheAging,TitleIII,PartD,DiseasePrevention
SpecialProgramfortheAging,TitleIII,PartD,DiseasePrevention
U.S.DepartmentofTreasury CoronavirusState&LocalFiscalRecoveryFunds
andHealthPromotionServices 93.043 JA122-05-2022 7,173
andHealthPromotionServices 93.043 JA123-05-2023 26,161 Total Special Program for the Aging, Title III, Part D, Disease Prevention and Health Promotion Services 33,333 NationalFamilyCaregiverSupport,TitleIIIPartE NationalFamilyCaregiverSupport,TitleIII,PartE 93.052 JA122-05-2022 6,569 NationalFamilyCaregiverSupport,TitleIII,PartE 93.052 JA123-05-2023 21,958 TotalNationalFamilyCaregiverSupport,TitleIIIPartE 28,527 Low-Income Home Energy Assistance Low-IncomeHomeEnergyAssistance 93.568 JPP-22-05-2022 304 Low-IncomeHomeEnergyAssistance 93.568 JP022-05-2023 1,800 Low-IncomeHomeEnergyAssistance 93.568 JP023-05-2023 1,900 Low-IncomeHomeEnergyAssistance 93.568 JP023-05-2024 10,213 TotalLow-IncomeHomeEnergyAssistance 14,217
CoronavirusState&LocalFiscalRecoveryFunds 21.027 1505-0271 97,292 Pass-ThroughFloridaDepartmentofEnvironmentalProtection 21.027 22FRP26 75,000 Pass-ThroughEarlyLearningCoalitionofBroward 21.027 ROUND#1 123,738 Pass-ThroughEarlyLearningCoalitionofBroward 21.027 ROUND#2 426,639 TotalCoronavirusState&LocalRecoveryFunds 722,669 TotalU.S.DepartmentofTreasury 722,669 Total Other Programs 4,298,655 Total Expenditure of Federal Awards $ 7,676,326 FederalAgency/Pass-ThroughEntity/ProgramTitle ALN Grant/Contract Number
CITY OF MIRAMAR, FLORIDA SCHEDULE OF EXPENDITURES OF FEDERALAWARDS AND STATE FINANCIALASSISTANCE FISCAL YEAR
SEPTEMBER
See notes to schedule of expenditures of federal awards and state financial assistance 191
Expenditures
ENDED
30, 2023
SCHEDULE
CITY OF MIRAMAR, FLORIDA
YEAR ENDED
30, 2023
Notes:
N/A-notavailableornotapplicable.
StateAgency/Pass-ThroughEntity/StateProject CSFA Number Grant/Contract Number Expenditures Florida Housing Finance Corporation State Housing Initiatives Partnership Program 2021/2022 40.901 NA $ 507,998 State Housing Initiatives Partnership Program 2022/2023 40.901 NA 427,539 State Housing Initiatives Partnership Program 2023/2024 40.901 NA 14,515 Total Florida Housing Finance Corporation 950,052 State of Florida Department of Elder Affairs Pass-Through Area wide Council on Aging of Broward County, Inc. Local Services Program 2022-2023 65.009 JL022-05-2023 52,014 Local Services Program - Local Funding Initiative 65.009 JL033-05-2023 LFI 12,514 Local Services Program 2023-2024 65.009 JL023-05-2024 37,571 Total State of Florida Department of Elder Affairs 102,099 State of Florida Department of Environmental Protection Florida Recreation Development Assistance Program (FRDAP) 37.017 A2018 50,000 Statewide Water Quality Restoration Projects 37.039 LPA0195 250,000 Clean Water SRF Loan 37.077 SW060841 10,971,755 Total State of Florida Department of Environmental Protection 11,271,755 State of Florida Department of Health Emergency Medical Services (EMS) Matching Grant 64.003 M0001 99,372 Emergency Medical Services (EMS) Matching Grant 64.003 M0002 85,291 Emergency Medical Services (EMS) Matching Grant 64.003 M230607 500 Total State of Florida Department of Health 185,163 Total State Financial Assistance $ 12,509,069
STATE
OF EXPENDITURES OF FEDERALAWARDS AND
FINANCIALASSISTANCE
192
FISCAL
SEPTEMBER
See notes to schedule of expenditures of federal awards and state financial assistance
CITY OF MIRAMAR, FLORIDA
NOTES TO SCHEDULE OF EXPENDITURES OF FEDERALAWARDS AND STATE FINANCIALASSISTANCE FOR THE FISCAL YEAR ENDED SEPTEMBER 30, 2023
NOTE 1 - BASIS OF PRESENTATION
The accompanying Schedule of Expenditures of Federal Awards and State Financial Assistance (the Schedule) includes the federal and state grant activity of the City of Miramar for the fiscal year ended September 30, 2023. The information in this Schedule is presented in accordance with the requirements of Title 2 U.S. Code of Federal Regulations, Part 200, Uniform Administrative Requirements, Cost Principles, and Audit Requirements for Federal Awards (Uniform Guidance), and Chapter 10.550, Rules of the Auditor General. Because the Schedule presents only a selected portion of the operations of the City of Miramar, it’s not intended to and does not present the financial position, changes in net position/fund balance or cash flows of the City of Miramar.
NOTE 2 - SUMMARY OF SIGNIFICANT ACCOUNTING POLICIES
Expenditures reported on the Schedule are reported on the modified accrual basis of accounting for grants which are accounted for in the governmental fund types and on the accrual basis of accounting for grants which are accounted for in the proprietary fund types. Such expenditures are recognized following the cost principles contained in the Rules of the Department of Financial Services of the State of Florida and Uniform Guidance, wherein certain types of expenditures are not allowable or are limited as to reimbursement Pass-through entity identifying numbers are presented where available.
NOTE 3 - CONTINGENCY
The grant revenue amounts received are subject to audit and adjustment. If any expenditures are disallowed by grantor agency as a result of such an audit, any claim for reimbursement to the grantor agencies would become a liability of the City. In the opinion of management, all grant expenditures are in compliance with the terms of the grant agreements and applicable federal and state laws and regulations.
NOTE 4 - INDIRECT COST RECOVERY
The City has elected not to use the 10 percent de minimis indirect cost rate allowed under the Uniform Guidance.
193
CITY OF MIRAMAR, FLORIDA
SCHEDULE OF FINDINGS AND QUESTIONED COSTS FOR THE FISCAL YEAR ENDED SEPTEMBER 30, 2023
SECTION I - SUMMARY OF INDEPENDENT AUDITORS' RESULTS
Financial Statements
Type of auditors' report issued: Unmodified
Internal control over financial reporting:
• Material weakness(es) identified? Yes X No
• Significant deficiency(ies) identified that are not considered to be material weakness? Yes X None Reported
• Non-compliance material to financial statements noted? Yes X No
Federal Awards and State Financial Assistance
Internal control over major Federal programs State projects:
• Material weakness(es) identified? Yes X No
• Significant deficiency(ies) identified that are not considered to be material weakness? Yes X None Reported
Type of Auditors' Report issued on Compliance for Major Federal Programs and State projects: Unmodified
Any audit findings disclosed that are required to be reported in accordance with Uniform Guidance? Yes X No
Identification of Major Federal Programs and State Projects:
Assistance Listing Number (ALN)
21.027
97.039
97.083
CFSA Number
Name of Federal Programs
Coronavirus State and Local Fiscal Recovery Funds
Hazard Mitigation Grant Program
Staffing for Adequate Fire and Emergency Response (SAFER)
Name of State Projects 37.039
Statewide Water Quality Restoration Projects 37.077
Dollar threshold used to distinguish between Type A and Type B programs:
Wastewater Treatment Facility Construction
Auditee qualified as low risk auditee? X Yes No
Federal
State
$750,000
$750,000
194
CITY OF MIRAMAR, FLORIDA
SCHEDULE OF FINDINGS AND QUESTIONED COSTS FOR THE FISCAL YEAR ENDED SEPTEMBER 30, 2023
Section II - Financial Statement - Current Year Findings and Questioned Costs
There were no findings and questioned costs noted during the current year.
Section III - Prior Year Findings - Financial Statement Audit
None reported.
Section IV - Federal Award Current Year Findings and Questioned Costs
None reported.
Section V - Federal Award Prior Year Findings and Questioned Costs
None reported.
Section VI State Financial Assistance Findings and Questioned Costs
None reported.
195
MANAGEMENT LETTER IN ACCORDANCE WITH CHAPTER 10.550, RULES OF THE AUDITOR GENERAL OF THE STATE OF FLORIDA
To the Honorable Mayor and Member of the City Commission City of Miramar, Florida
Report on the Financial Statements
We have audited the financial statements of the City of Miramar, Florida (the City), as of and for the fiscal year ended September 30, 2023, and have issued our report thereon dated May 31, 2024.
Auditor’s Responsibility
We conducted our audit in accordance with auditing standards generally accepted in the United States of America; the standards applicable to financial audits contained in Government Auditing Standards, issued by the Comptroller General of the United States; the audit requirements of Title 2 U.S. Code of Federal Regulations Part 200, Uniform Administrative Requirements, Cost Principles, and Audit Requirements for Federal Awards (Uniform Guidance); and Chapter 10.550, Rules of the Auditor General.
Other Reporting Requirements
We have issued our Independent Auditor’s Report on Internal Control over Financial Reporting and on Compliance and Other Matters Based on an Audit of the Financial Statements Performed in Accordance with Government Auditing Standards; Independent Auditor’s Report on Compliance for Each Major Federal Program and State project Report on Internal Control over Compliance; Schedule of Findings and Questioned Costs; and Independent Accountant’s Report(s) on an examination conducted in accordance with AICPA Professional Standards, AT-C Section 315, regarding compliance requirements in accordance with Chapter 10.550, Rules of the Auditor General. Disclosures in those reports and schedule, which are dated May 31, 2024, should be considered in conjunction with this management letter
Prior Audit Findings
Section 10.554(1)(i)1., Rules of the Auditor General, requires that we determine whether or not corrective actions have been taken to address findings and recommendations made in the preceding financial audit report. There were no prior audit findings.
Official Title and Legal Authority
Section 10.554(1)(i)4., Rules of the Auditor General, requires that the name or official title and legal authority for the primary government and each component unit of the reporting entity be disclosed in this management letter, unless disclosed in the notes to the financial statements. The name or official title and legal authority of the Primary government and component units are disclosed in Note 1 to the financial statements.
Miramar Office 3350 SW 148th Ave. | Suite 110 Miramar, FL 33027 (954) 874-1721
North Miami Office 1801 NE 123rd Street | Suite 314 North Miami, FL 33181 (786) 743-7108
196
info@abcpasolutions.com
Financial Condition and Management
Sections 10.554(1)(i)5.a. and 10.556(7), Rules of the Auditor General, require us to apply appropriate procedures and communicate the results of our determination as to whether or not the City met one or more of the conditions described in Section 218.503(1), Florida Statutes, and to identify the specific condition(s) met. In connection with our audit, we determined that the City did not meet any of the conditions described in Section 218.503(1), Florida Statutes.
Pursuant to Sections 10.554(1)(i)5.b. and 10.556(8), Rules of the Auditor General, we applied financial condition assessment procedures for the City. It is management’s responsibility to monitor the City’s financial condition, and our financial condition assessment was based in part on representations made by management and review of financial information provided by same.
Section 10.554(1)(i)2., Rules of the Auditor General, requires that we communicate any recommendations to improve financial management. In connection with our audit, we did not have any such recommendations
Special District Component Units
Section 10.554(1)(i)5.c., Rules of the Auditor General, requires, if appropriate, that we communicate the failure of a special district that is a component unit of a county, municipality, or special district, to provide the financial information necessary for proper reporting of the component unit within the audited financial statements of the county, municipality, or special district in accordance with Section 218.39(3)(b), Florida Statutes. In connection with our audit, we did not note any special district component units that failed to provide the necessary information for proper reporting in accordance with Section 218.39(3)(b), Florida Statutes.
Additional Matters
Section 10.554(1)(i)3., Rules of the Auditor General, requires us to communicate noncompliance with provisions of contracts or grant agreements, or abuse, that have occurred, or are likely to have occurred, that have an effect on the financial statements that is less than material but warrants the attention of those charged with governance. In connection with our audit, we did not note any such findings.
Purpose of this Letter
Our management letter is intended solely for the information and use of the Legislative Auditing Committee, members of the Florida Senate and the Florida House of Representatives, the Florida Auditor General, Federal and other granting agencies the Mayor, members of the City Commission and applicable management, and is not intended to be and should not be used by anyone other than these specified parties.
Miramar, Florida May 31, 2024
197
INDEPENDENT ACCOUNTANTS’ REPORT ON COMPLIANCE WITH SECTION 218.415 FLORIDA STATUTES, LOCAL GOVERNMENT INVESTMENT POLICIES
To the Honorable Mayor and Member of the City Commission City of Miramar, Florida
We have examined the City of Miramar (the “City”) compliance with Section 218.415, Florida Statutes, Local Government Investment Policies for the year ended September 30, 2023. Management of the City is responsible for the City’s compliance with the specified requirements. Our responsibility is to express an opinion on the City’s compliance with the specified requirements based on our examination.
Our examination was conducted in accordance with attestation standards established by the American Institute of Certified Public Accountants. Those standards require that we plan and perform the examination to obtain reasonable assurance about whether the City complied, in all material respects, with the specified requirements referenced above. An examination involves performing procedures to obtain evidence about whether the City complied with the specified requirements. The nature, timing and extent of the procedures selected depend on our judgment, including an assessment of the risks of material noncompliance, whether due to fraud or error. We believe that the evidence we obtained is sufficient and appropriate to provide a reasonable basis for our opinion.
Our examination does not provide a legal determination on the City’s compliance with specified requirements.
In our opinion, the City complied, in all material respects, with Section 218.415, Florida Statutes, Local Government Investment Policies during the period October 1, 2022 to September 30, 2023
This report is intended solely for the information and use of the Florida Auditor General, the Honorable Mayor, Members of the City Commission, the City Manager, and applicable management, and is not intended to be and should not be used by anyone other than these specified parties.
Miramar, Florida May 31, 2024
Miramar Office
3350 SW 148th Ave. | Suite 110
Miramar, FL 33027
(954) 874-1721
North Miami Office 1801 NE 123rd Street | Suite 314 North Miami, FL 33181 (786) 743-7108
198
info@abcpasolutions.com
199
