Presented to the City of High Point, North Carolina February 2025


Presented to the City of High Point, North Carolina February 2025
ETC Institute administered the DirectionFinder® survey for the City of High Point between November 2024 and January 2025. The first survey was administered in 2007 and has been conducted approximately every two years. The surveys were administered as part of the City’s on-going effort to assess citizen satisfaction with the quality of city services.
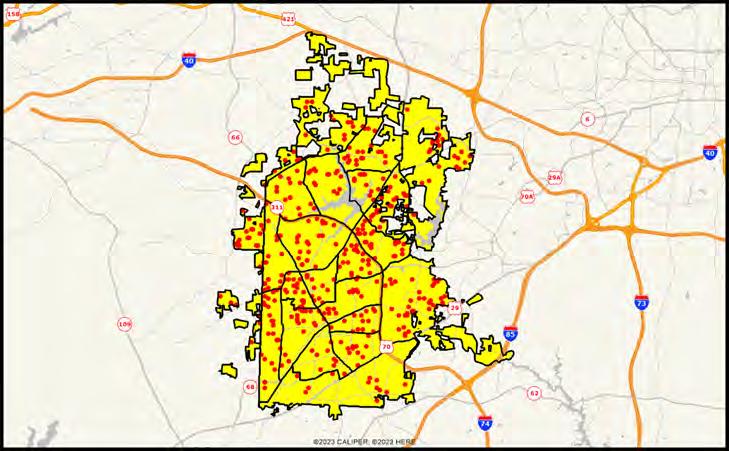
A seven-page survey and cover letter were mailed to a random sample of households in the City of High Point. Respondents were also provided a link to take the survey online. Approximately ten days after the surveys were mailed, residents who received the survey were contacted by text message to encourage participation. A total of 420 households completed the survey. The results for the random sample of 420 households have a 95% level of confidence with a precision of at least +/-4.8%. There were no statistically significant differences in the results of the survey based on the method of administration (mail vs. online). In order to better understand how well services are being delivered by the City, ETC Institute geocoded the home address of respondents to the survey. The map to the right shows the physical distribution of survey respondents based on the location of their home.
The percentage of “don’t know” responses has been excluded from many of the graphs shown in this report to facilitate valid comparisons of the results from High Point with the results from other communities in the DirectionFinder® database. Since the number of “don’t know” responses often reflects the utilization and awareness of city services, the percentage of “don’t know” responses has been provided in the tabular data section of this report. When the “don’t know” responses have been excluded, the text of this report will indicate that the responses have been excluded with the phrase “who had an opinion ”
This report contains:
• a summary of the methodology for administering the survey and major findings
• charts showing the overall results for questions on the survey with trend comparisons
• benchmarking data that show how the results for High Point compare to other cities
• Importance-Satisfaction analysis
• tables that show the results for each question on the survey
• a copy of the survey instrument
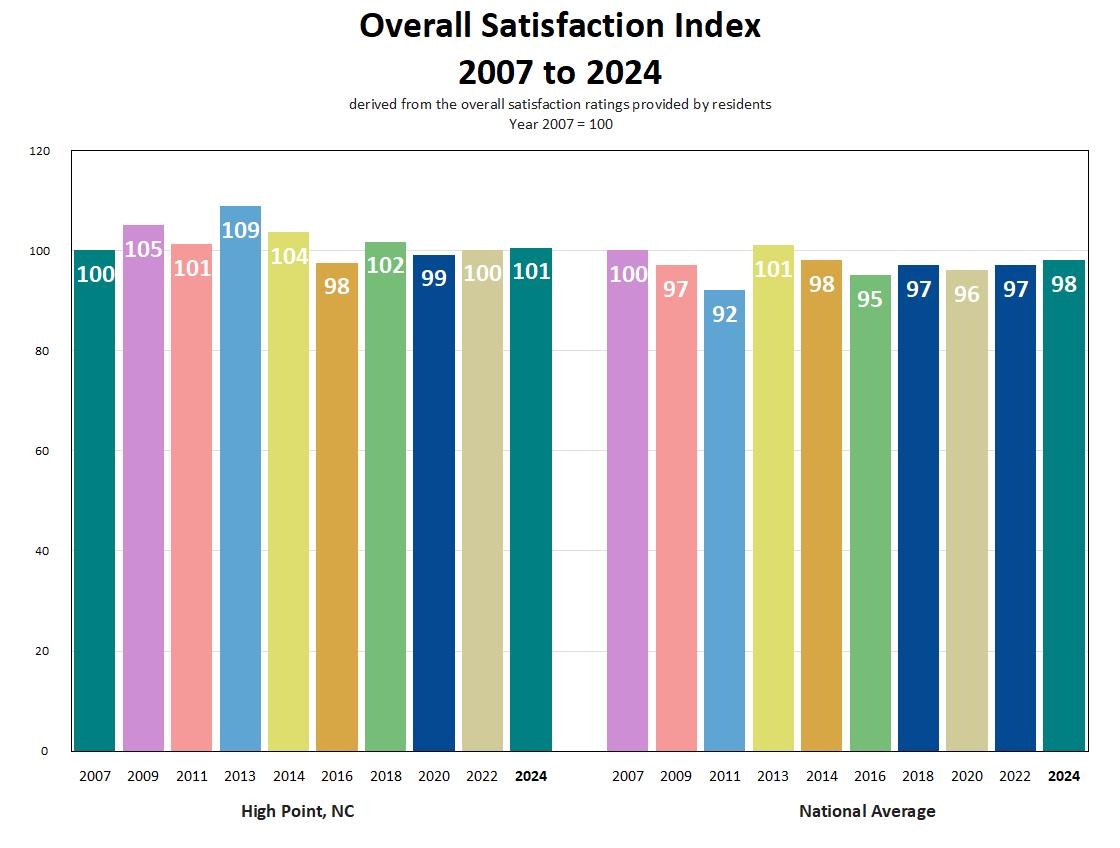
The Composite Customer Satisfaction Index for High Point. The Composite Customer Satisfaction Index is derived from the mean rating given by residents for all major city services that were rated between 2007and 2024. The index is calculated by dividing the mean rating from the current year by the mean rating for the base-year (year 2007) and then multiplying the result by 100. The chart below shows that the Composite Customer Satisfaction Index for High Point has increased since the last survey in 2022, and shows that the City consistently outperforms other communities across the U.S. In 2024, the City’s Customer Satisfaction Index rating was 3 points higher than the U.S. average.
Most of the residents surveyed were satisfied with City services. Ninety percent (90%) of the residents surveyed who had an opinion were satisfied (rating of 4 or 5 on a 5-point scale) with the quality of fire department services and response to medical emergencies; 85% were satisfied with the quality of library services, 79% were satisfied with the quality of parks and recreation programs and facilities, and 79% were satisfied with the quality of City electrical utility services
Services that residents thought should receive the most increase in emphasis over the next two years. The areas that residents thought should receive the most emphasis from the City leaders over the next two years were: (1) maintenance of streets, sidewalks, and infrastructure, (2) quality of economic development, and (3) quality of police services
Perceptions of the City. Seventy percent (70%) of the residents surveyed who had an opinion rated the overall quality of City services as “excellent” or “good;” 21% rated them as “neutral” and 10% rated them as “below average/poor”. Nearly two-thirds (65%) also rated High Point as an “excellent” or “good” place for quality of life
Public Safety. Eighty-nine percent (89%) of the residents surveyed who had an opinion were satisfied (rating of 4 or 5 on a 5-point scale) with the professionalism of fire personnel; 89% were satisfied with how quickly fire personnel respond to emergencies, 80% were satisfied with the adequacy of fire protection for their property, 78% were satisfied with the adequacy of the City’s 911 center, and 76% were satisfied with how quickly police respond to emergencies.
The public safety services that residents thought should receive the most emphasis over the next two years were: (1) efforts to reduce neighborhood street level drugs, prostitution, and other crimes (2) visibility of police in neighborhoods, and (3) City efforts to ensure the community is prepared for a natural disaster or crisis.
Neighborhood Services. Seventy-one percent (71%) of the residents surveyed who had an opinion were satisfied (rating of 4 or 5 on a 5-point scale) with the appearance of their neighborhood; 44% were satisfied with the enforcement of sign regulations, and 43% were satisfied with the enforcement of mowing and cutting of weeds on private property.
The neighborhood services that residents thought should receive the most emphasis over the next two years were: (1) enforcement of clean-up of junk cars and debris on private property, (2) availability of affordable rental housing, and (3) enforcement of removal of dilapidated housing.
Transportation and Roadway Services. Eighty-one percent (81%) of the residents surveyed who had an opinion were satisfied (rating of 4 or 5 on a 5-point scale) with the ease of travel from their home to regional roadways; 72% were satisfied with the maintenance of street signs, and 70% were satisfied with the ease of getting across town in High Point.
The transportation and roadway services that residents thought should receive the most emphasis over the next two years were: 1) the condition and maintenance of major City streets, 2) availability of pedestrian walkways and sidewalks, and 3) traffic signal coordination on major City streets
Environmental and Utility Services. Eighty-five percent (85%) of the residents surveyed who had an opinion were satisfied (rating of 4 or 5 on a 5-point scale) with residential trash collection; 82% were satisfied with the courtesy of field employees, and 81% were satisfied with the reliability of water service.
The environmental and utility services that residents thought should receive the most emphasis over the next two years were: (1) taste/odor of drinking water, (2) leaf, yard waste and brush removal services, and (3) value received for electrical utility rates.
Cultural and Recreation Services. Eighty percent (80%) of the residents surveyed who had an opinion were satisfied (rating of 4 or 5 on a 5-point scale) with the appearance and maintenance of City parks; 74% were satisfied with the amount and variety of books and other library materials, and 70% were satisfied with the hours of operation/services at public libraries
The cultural and recreation services that residents thought should receive the most emphasis over the next two years were: (1) recreation centers and programs for adults/seniors, (2) receiving information on parks and recreation programs, and (3) special events and festivals in the City,
Eighty-nine percent (89%) of residents who had an opinion feel safe in their neighborhood during the day, and 73% feel safe in their neighborhood at night.
Fifty-two percent (52%) of residents have contacted the City during the past year. Of the 52% who have contacted the City, 91% who had an opinion felt that City employees were “always” or “usually” courteous and polite.
Fifty-nine percent (59%) of residents go outside of High Point to shop at least once a week; 26% shop outside the City a few times a month; 9% shop outside the City a few times a year, and 6% seldom or never go outside the City to shop.
The most important reasons for residents’ decision to live in High Point were: (1) safety and security, (2) quality of housing, and (3) quality health care
The City issues that residents felt were most important were: (1) providing incentives to attract/retain businesses and industries, (2) incentives to attract full-time private sector jobs, and (3) providing incentives to attract/retain new retail development/restaurants.
High Point rated at or above the Atlantic Regional average in 31 of the 54 areas that were assessed. The states that make up the Atlantic Region are North Carolina, Virginia, West Virginia, Delaware, Maryland, and the District of Columbia. High Point rated significantly higher than the Atlantic Regional average (5% or more above) in 20 of these areas The tables below and on the following page show how the City of High Point compares to the Atlantic regional average.
High Point rated above the U.S. average in 29 of the 54 areas that were assessed. High Point rated significantly higher than the U.S. average (5% or more above) in 25 of these areas The tables below and on the following page show how the City of High Point compares to the U.S. average.
Overall
Overall
Satisfaction ratings for the City of High Point stayed the same or increased in 75 of the 107 areas assessed since 2022. The areas that showed significant increases (5% or more) are listed below.
Recommended Priorities for the Next Two Years. In order to help the City identify investment priorities for the next two years, ETC Institute conducted an Importance-Satisfaction (I-S) analysis. This analysis examined the importance that residents placed on each City service and the level of satisfaction with each service.
By identifying services of high importance and low satisfaction, the analysis identified which services will have the most impact on overall satisfaction with City services over the next two years. If the City wants to improve its overall satisfaction rating, the City should prioritize investments in services with the highest Importance Satisfaction (I-S) ratings. Details regarding the methodology for the analysis are provided in the Section 3 of this report.
Overall Priorities for the City by Major Category. The first level of analysis reviewed the importance of and satisfaction with major categories of City services. This analysis was conducted to help set the overall priorities for the City. Based on the results of this analysis, the major services that are recommended as the top priorities for investment over the next two years in order to raise the City’s overall satisfaction rating are:
o Maintenance of streets, sidewalks, and infrastructure (I-S Rating = 0.3548)
o Quality of economic development (I-S Rating = 0.1573)
o Enforcement of City codes and ordinances (I-S Rating = 0.1145)
o Effectiveness of City communication with the public (I-S Rating = 0.1056)
o Flow of traffic and ease of getting around the City (I-S Rating = 0.1023)
A table showing the I-S ratings for all fifteen major City services in High Point is provided below.
Major City Services
City of High Point, North Carolina

by percentage of respondents using a 5-po int scale, where 5 means “very satisfied” and 1 means “very dissatisfied”(excluding “d on’t know”)
by percentage of respondents who rated the item as a 4 or 5 on a 5-point scale (excluding “don’t know”)
Quality of fire services/fire dept. response
Quality of library services
Quality of City parks & rec programs/facilities
Quality of City electrical utility services
Quality of customer service from City employees
Quality of police services
Quality of trash/recycling/yard waste services
Quality of City water and sewer utilities
Appearance of City facilities
Quality of City's stormwater management system
Flow of traffic/ease of getting around City
Quality of economic development
Effectiveness of City communication with public
Enforcement of City codes and ordinances
Maintenance of City streets/sidewalks/infrastructure
Maintenance of City streets/sidewalks/infrastructu
by percentage of respondents who selected the items as one of their top three choices
Maintenance of City streets/sidewalks/infrastructu
Maintenance of City streets/sidewalks/infrastructure
Quality of economic development
Quality of police services
Flow of traffic/ease of getting around City
Enforcement of City codes and ordinances
Effectiveness of City communication with public
Quality of trash/recycling/yard waste services
Quality of City parks & rec programs/facilities
Quality of City water and sewer utilities
Quality of fire services/fire dept. response
Quality of City electrical utility services
management system
by percentage of respondents using a 5-point scale, where 5 means “excellent” and 1 means “poor”(excluding “don’t know”)
by percentage of respondents who rated the item as a 4 or 5 on a 5-point scale (excluding “don’t know”)
Professionalism of fire personnel
How quickly fire personnel respond to emergencies
Adequacy of fire protection for your property
Adequacy of City's 911 center
How quickly police respond to emergencies
Professionalism of police officers
Fire building inspection program
City public safety education programs
City efforts to enforce local traffic laws
Quality of animal control
Visibility of police in retail areas
City efforts to ensure community is prepared for a
City efforts to ensure community is prepared for a natural disaster or crisis
Visibility of police in neighborhoods
City efforts to reduce neighborhood street level d
City efforts to reduce neighborhood street level drugs, prostitution & other crimes
20202022 2024
by percentage of respondents who selected the items as one of their top three choices
City efforts to reduce neighborhood street level d
City efforts to reduce neighborhood street level drugs, prostitution & other crimes
Visibility of police in neighborhoods
City efforts to ensure community is prepared for a
City efforts to ensure community is prepared for a natural disaster or crisis
City efforts to enforce local traffic laws such as
Visibility of police in retail areas
City public safety education programs
How quickly police respond to emergencies
Quality of animal control
How quickly fire personnel respond to emergencies
Adequacy of City's 911 center
Professionalism of police officers
Adequacy of fire protection for your property
Fire building inspection program
of fire personnel
Overall feeling of safety in High Point
by percentage of respondents who rated the item as a 4 or 5 on a 5-point scale (excluding “don’t know”))
Your neighborhood during the day
Your neighborhood during the night
Overall feeling of safety in High Point
by percentage of respondents
by percentage of respondents using a 5-poin t scale, where 5 means “very satisfied” and 1 means “very dissatisfied” (excluding “don’t know”)
Enforcement of mowing & cutting of weeds on private property
mowing & cutting of weeds on privat
Enforcement of clean-up of junk cars & debris on private property
of clean-up of junk cars & debris on p
City's efforts to manage (plan for) growth
Availability of programs to assist with home ownership like education & down payment assistance
Availability of programs to assist with home owner
Enforcement of removal of dilapidated housing Enforcement of repair of substandard housing Quality of public housing
of affordable housing for purchase
by percentage of respondents who rated the item as a 4 or 5 on a 5-point scale (excluding “don’t know”)
Appearance of your neighborhood
Enforcement of sign regulations
Enforcement of mowing & cutting of weeds on privat
Enforcement of mowing & cutting of weeds on private property
Enforcement of clean-up of junk cars & debris on p
Enforcement of clean-up of junk cars & debris on private property
City's efforts to manage (plan for) growth
Availability of programs to assist with home ownership like education & down payment assistance
Availability of programs to assist with home owner
Enforcement of removal of dilapidated housing Enforcement of repair of substandard housing
by percentage of respondents who selected the items as one of their top three choices
Enforcement of clean-up of junk cars & debris on p
Enforcement of clean-up of junk cars & debris on private property
Availability of affordable rental housing
Enforcement of removal of dilapidated housing
Availability of affordable housing for purchase
Enforcement of repair of substandard housing
City's efforts to manage (plan for) growth
Enforcement of mowing & cutting of weeds on privat
Enforcement of mowing & cutting of weeds on private property
Availability of programs to assist with home ownership like education & down payment assistance
Availability of programs
assist with home owner
by percentage of respondents using a 5-point scale, where 5 means “very satisfied” and 1 means “very dissatisfied” (excluding “ don’t know”)
Ease of traveling from your home to regional roadways
Landscaping
by percentage of respondents who rated the item as a 4 or 5 on a 5-point scale (excluding “don’t know”)
Ease of traveling from your home to regional roadw
Ease of traveling from your home to regional roadways
Maintenance of street signs
Ease of getting across town in High Point
Adequacy of City street lighting
Traffic signal coordination on major City streets
Landscaping of medians & public areas along major
Landscaping of medians & public areas along major City streets
Condition/maintenance of neighborhood streets
Condition/maintenance of major City streets
Availability of pedestrian walkways/sidewalks
Maintenance of sidewalks
Availability of public transportation services
Availability of elderly & handicapped van service
Availability of regional transportation links
by percentage of respondents who selected the items as one of their top three choices
Condition/maintenance of major City streets
Availability of pedestrian walkways/sidewalks
Traffic signal coordination on major City streets
Condition/maintenance of streets in your neighborh
Availability of public transportation services
Maintenance of sidewalks
Landscaping of medians & public areas along major
Landscaping of medians & public areas along major City streets
Adequacy of City street lighting
Availability of elderly & handicapped van service
Ease of getting across town in High Point
Availability of regional transportation links
of street signs
Ease of traveling from your home to regional roadways
by percentage of respondents using a 5-point scale, where 5 means “very satisfied” and 1 means “very dissatisfied” (excluding “don’t know”)
How quickly City restores power after an unplanned outage
Cleanliness/maintenance
How well City keeps you informed about planned disruptions to your utility service
by percentage of respondents who rated the item as a 4 or 5 on a 5-point scale (excluding “don’t know”)
Residential trash collection service
Courtesy of field employees
Reliability of water service
How quickly City restores power after an unplanned
How quickly City restores power after an unplanned outage
Reliability of City electrical service
Curbside recycling service
Water pressure in your home
Bulk trash pickup/removal service
Leaf, yard waste & brush removal services
Cleanliness/maintenance of stormwater drains
Value received for electrical utility rates
Taste/odor of your drinking water
How well City keeps you informed about planned dis
How well City keeps you informed about planned disruptions to your utility service
Efforts to rebuild/maintain wastewater collection
Value received for water/wastewater utility rates
by percentage of respondents who selected the items as one of their top three choices
Taste/odor of your drinking water
Leaf, yard waste & brush removal services
Value received for electrical utility rates
Value received for water/wastewater utility rates
Efforts to rebuild & maintain wastewater collectio
Bulk trash pickup/removal service
How well City keeps you informed about planned disruptions to your utility service
How well City keeps you informed about planned dis
Cleanliness/maintenance of stormwater drains
How quickly City restores power after an unplanned
How quickly City restores power after an unplanned outage
Water pressure in your home
Reliability of water service
Curbside recycling service
of City electrical service
Q14. Are you aware of the City's Keep High Point Beautiful effort and the programs affiliated?
by percentage of respondents
Trends: Are you aware of the City's Keep High Point Beautiful effort and the programs affiliated? 2020 to 2024 by percentage of respondents
Q14a. Have you participated in one of these programs?
by percentage of respondents who are aware of the “Keep High Point Beautiful” programs
by percentage of respondents using a 5-point scale, where 5 means “very satisfied” and 1 means “very dissatisfied” (excluding “ don’t know”)
by percentage of respondents using a 5-point scale, where 5 mean s “very satisfied” and 1 means “very dissatisfied” (excluding “ don’t know”)
Very SatisfiedSatisfiedNeutralDissatisfiedVery Dissatisfied
by percentage of respondents who rated the item as a 4 or 5 on a 5-point scale (excluding “don’t know”)
Appearance/maintenance of City parks
Amount/variety of books/other materials
Hours of operation/services by public library
Number of City parks
High Point Museum programs & facilities
Quality & availability of outdoor athletic fields
Number of public use computers in library
Availability of walking/biking trails in City Public library programs
Variety/quality of events at High Point Theatre
Recreation centers & programs for youth
Special events & festivals in City
Life-long sport programs like golf/tennis
Aquatic based programs
Parking & access to the Theatre
Recreation centers/programs for adults/seniors
Receiving info on parks & recreation programs
by percentage of respondents who selected the items as one of their top three choices
Recreation centers/programs for adults/seniors
Receiving info on parks & recreation programs
Special events & festivals in City
Availability of walking/biking trails in City
Appearance/maintenance of City parks
Recreation centers & programs for youth
Number of City parks
Variety/quality of events at High Point Theatre
Aquatic based programs
Quality & availability of outdoor athletic fields
Parking & access to Theatre
High Point Museum programs & facilities
Life-long sport programs like golf/tennis
of books/other materials
of operation/services by public library
Public library programs
of public use computers in library
Most Emphasis2nd Choice3rd Choice
Q18. Have you contacted the City during the past year?
by percentage of respondents
Trends: Have you contacted the City during the past year? 2020 to 2024 by percentage of residents surveyed that responded “yes" (excluding “not provided”)
20202022 2024
by percentage of respondents that have contacted the City during the past year, using a 5-point scale, where 5 means “always” a nd 1 means “never” (excluding “don’t know”)
They were courteous & polite
They gave prompt, accurate, & complete answers to
They gave prompt, accurate, & complete answers to questions
They did what they said they would do in a timely
They did what they said they would do in a timely manner
They helped you resolve your issue to your satisfa
Services
They helped you resolve your issue to your satisfaction
a
Services were provided at a time that was accommodating to your schedule
that was accommod
by percentage of respondents who rated the item as a 4 or 5 on a 5-point scale (excluding “don’t know”)
They were courteous & polite
They gave prompt, accurate, & complete answers to
They gave prompt, accurate, & complete answers to questions
They did what they said they would do in a timely
They did what they said they would do in a timely manner
They helped you resolve your issue to your satisfaction
They helped you resolve your issue to your satisfa
Services were provided at a time that was accommod
Services were provided at a time that was accommodating to your schedule
It was easy to contact the person you needed
Safety & security
Quality of housing
Quality health care
Access to quality shopping
Types of housing
Availability of parks & recreation opportunities
Accessibility to airport & other communities
Sense of community
Proximity to family & friends
Educational opportunities for preschool age children
Accessibility to airport & other communities
Proximity to family & friends
Quality health care
Availability of parks & recreation opportunities
Safety & security
Quality of housing
Types of housing
Access to quality shopping
Sense of community
Educational
Employment
Accessibility to airport & other communities
Proximity to family & friends
Quality health care
Availability of parks & recreation opportunities
Safety & security
Quality of housing
Types of housing
Access to quality shopping
Sense of community
Educational opportunities for preschool age childr
Employment opportunities (proximity to job)
Opportunities and/or resources for senior citizens
by percentage of respondents using a 5-point scale, where 5 means “very important” and 1 means “very unimportant” (excluding “don’t know”)
Providing incentives to attract & retain businesse
Providing incentives to attract & retain businesses & industries
Providing incentives to attract new full-time private sector jobs
Providing incentives to attract new full-time priv Providing incentives to attract & retain new retai Public/private partnerships to encourage Core City
Providing incentives to attract & retain new retail development & restaurants
Public/private partnerships to encourage Core City revitalization
Future well-being of Furniture Market
Availability of high quality affordable housing in
Strengthening High Point's image through targeted
Strengthening High Point's image through targeted marketing Availability of high quality affordable housing in a neighborhood near you
Providing new full service senior activity center
Providing a facility for community arts programs
Future well-being of High Point University
Increasing local tax support to expand public tran
Increasing local tax support to expand public transportation bus routes & hours
by percentage of respondents who rated the item as a 4 or 5 on a 5-point scale (excluding “don’t know”)
Providing incentives to attract & retain businesse
Providing incentives to attract & retain businesses & industries
Providing incentives to attract new full-time priv
Providing incentives to attract new full-time private sector jobs
Providing incentives to attract & retain new retai
Providing incentives to attract & retain new retail development & restaurants
Public/private partnerships to encourage Core City
Public/private partnerships to encourage Core City revitalization
Future well-being of Furniture Market
of high quality affordable housing in
Availability of high quality affordable housing in a neighborhood near you
Strengthening High Point's image through targeted marketing
Strengthening High Point's image through targeted Providing new full service senior activity center
a facility for community arts programs Future well-being of High Point University
Increasing local tax support to expand public transportation bus routes & hours
Q21. How often do you typically go outside High Point City limits to shop? by percentage of respondents (excluding “not provided”)
Every day
A few times per week
At least once a week
A few times per month
A few times per year
Seldom or never
Demographics: Q22. Approximately how many years have you lived in High Point? by percentage of respondents (excluding “not provided”)
0 to 5 years
6 to 10 years
11 to 20 years
21 to 30 years
31 years or longer
Do you own or rent your current residence? by percentage of respondents (excluding
Demographics: Q24. Including yourself, how many persons in your household are in each of the following age groups?
by percentage of respondents
Under age 5
Ages 5-19
Ages 20-34
Ages 35-49
Ages 50-64
Ages 65+
by percentage of respondents (multiple choices could be selected)
by percentage of respondents (excluding “not provided”)
Demographics: Q27. Which of the following best describes your current employment status?
by percentage of respondents
0.2% are students
Employed outside home
Employed in home/have a home-based business
Retired
Not currently employed outside home
Not provided
Q28. Would you say your total annual household income is...
by percentage of respondents
Under $25K
$25K to $49,999
$50K to $74,999
$75K+
Not provided
ETC Institute’s DirectionFinder® program was originally developed in 1999 to help community leaders use statistically valid community survey data as a tool for making better decisions. Since November 1999, the survey has been administered in more than 500 cities and counties in 49 states. Most participating communities conduct the survey on an annual or biennial basis.
This report contains benchmarking data from three sources: (1) a national survey that was administered by ETC Institute during the summer of 2023 to a random sample of over 10,000 residents in the continental United States, (2) a regional survey that was administered by ETC Institute during the summer of 2023 to a random sample of residents living in the Atlantic Region of the United States. The Atlantic Region includes the states of North Carolina, Virginia, West Virginia, Delaware, Maryland, and the District of Columbia, and (3) 36 medium-sized communities with a population between 50,000 and 200,000 where ETC Institute has administered the DirectionFinder® survey since January 2023. The 36 communities included in these comparisons are listed below.
• Alexandria, VA
• Brookhaven, GA
• Chapel Hill, NC
• Columbia, MO
• Concord, NC
• Dayton, OH
• Gaithersburg, MD
• Greeley, CO
• Independence, MO
• Killeen, TX
• League City, TX
• Lee’s Summit, MO
• Lenexa, KS
• Mansfield, TX
• Margate, FL
• Meridian, ID
• Mesquite, TX
• Miami Beach, FL
• Mount Prospect, IL
• Olathe, KS
• Overland Park, KS
• Pflugerville, TX
• Plantation, FL
• Port Arthur, TX
• Pueblo, CO
• Round Rock, TX
• Shoreline, WA
• South Bend, IN
• Sparks, NV
• Springfield, MO
• Springfield, OH
• St. Joseph, MO
• Tamarac, FL
• Tempe, AZ
• West Des Moines, IA
• Wilmington, NC
National and Regional Benchmarks. The first set of charts on the following pages show how the overall results for High Point compare to the national and regional averages based on the results of an annual survey that was administered by ETC Institute to a random sample of more than 10,000 residents across the U.S. in the summer of 2023, and a regional survey that was administered to a random sample of residents living in the Atlantic Region of the U.S. during the summer of 2023.
Performance Ranges. The second set of charts show the highest, lowest, and average (mean) levels of satisfaction in medium-sized communities with a population between 50,000 and 200,000. The mean rating is shown as a vertical line, which indicates the average level of satisfaction for the individual communities. The actual ratings for High Point are listed to the right of each chart. The dot on each bar shows how the results for High Point compare to the other medium-sized communities where the DirectionFinder® survey has been administered since January 2023.
Note: The benchmarking data contained in this report is protected intellectual property. Any reproduction of the benchmarking information in this report by persons or organizations not directly affiliated with the City of High Point, NC are not authorized without written consent from ETC Institute.
National Average vs. Atlantic Region vs. High Point
by percentage of respondents who rated the item as a 4 or 5 on a 5-point scale (without "don’t know”)
Overall quality of fire services & fire department
Overall quality of fire services & fire department response to medical emergencies
Overall quality of library services
Overall quality of City parks & recreation program
Overall quality of City parks & recreation programs & facilities
Overall quality of customer service you receive from City employees
Overall quality of customer service you receive fr
Overall quality of police services
Overall quality of trash, recycling & yard waste services
Overall quality of trash, recycling & yard waste s
Overall quality of City water & sewer utilities
Overall appearance of City facilities
Overall quality of City's stormwater management system
Overall quality of City's stormwater management sy
Overall flow of traffic & ease of getting around the City
Overall flow of traffic & ease of getting around C
Overall effectiveness of City communication with the public
Overall effectiveness of City communication with t
Overall enforcement of City codes & ordinances
Overall maintenance of City streets, sidewalks, &
Overall maintenance of City streets, sidewalks, & infrastructure
National AverageAtlantic RegionHigh Point
Overall quality of City services
Overall as a place to live
Overall image of City
Overall
Overall as a place to work
How quickly fire personnel respond to emergencies
How quickly police respond to emergencies
Fire
National Average vs. Atlantic Region vs. High Point
by percentage of respondents who rated the item as a 4 or 5 on a 5-point scale (without "don’t know”)
Your neighborhood during the day
Your neighborhood during the night
Overall feeling of safety in the City
National AverageAtlantic RegionHigh Point
National Average vs. Atlantic Region vs. High Point
by percentage of respondents who rated the item as a 4 or 5 on a 5-point scale (without "don’t know”)
Enforcement of sign regulations
Enforcement of mowing & cutting of weeds on privat
Enforcement of clean-up of junk cars & debris on p
City's efforts to manage (plan for) growth
Adequacy of City street lighting
Landscaping of medians & public areas along major
Condition/maintenance of streets in your neighborhood
Condition/maintenance of streets in your neighborh
National AverageAtlantic RegionHigh Point
National Average vs. Atlantic Region vs. High Point
Availability of information about City programs &
by percentage of respondents who rated the item as a 4 or 5 on a 5-point scale (excluding “don’t know”)
Overall quality of fire services & fire department response to medical emergencies
Overall quality of fire services & fire department
Overall quality of library services
Overall quality of City parks & recreation programs & facilities
Overall quality of City parks & recreation program
Overall quality of customer service you receive from City employees
Overall quality of customer service you receive fr
Overall quality of police services
Overall quality of trash, recycling & yard waste services
Overall quality of trash, recycling & yard waste s
Overall quality of City water & sewer utilities
Overall appearance of City facilities
Overall quality of City's stormwater management system
Overall quality of City's stormwater management sy
Overall flow of traffic & ease of getting around City
Overall flow of traffic & ease of getting around C
City
effectiveness of City communication with t
& ordinances
by percentage of respondents who rated the item as a 4 or 5 on a 5-point scale (excluding “don’t know”)
How quickly fire personnel respond to emergencies
How quickly police respond to emergencies
Fire building inspection program
DirectionFinder® Communities with a Population of Approximately 50,000 to 200,000
Appearance/maintenance of City parks Number of City parks
Today, community leaders have limited resources which need to be targeted to activities that are of the most benefit to their citizens. Two of the most important criteria for decision making are (1) to target resources toward services of the highest importance to citizens; and (2) to target resources toward those services where citizens are the least satisfied.
The Importance‐Satisfaction (I‐S) rating is a unique tool that allows public officials to better understand both of these highly important decision‐making criteria for each of the services they are providing. The Importance‐Satisfaction (I‐S) rating is based on the concept that public agencies will maximize overall customer satisfaction by emphasizing improvements in those areas where the level of satisfaction is relatively low, and the perceived importance of the service is relatively high.
The rating is calculated by summing the percentage of responses for items selected as the first, second, and third most important services for the City to emphasize over the next two years. The sum is then multiplied by 1 minus the percentage of respondents who indicated they were positively satisfied with the City’s performance in the related area (the sum of the ratings of 4 and 5 on a 5‐point scale excluding “don’t know” responses). “Don’t know” responses are excluded from the calculation to ensure the satisfaction ratings among service categories are comparable.
Respondents were asked to identify the major City services that were most important to emphasize over the next two years. More than half (56.4%) of the respondent households selected “maintenance of City streets, sidewalks, and infrastructure” as one of the most important services for the City to emphasize
With regard to satisfaction, 37.1% of respondents surveyed rated “maintenance of City streets, sidewalks, and infrastructure” as a “4” or “5” on a 5‐point scale (where “5” means “Very Satisfied”) excluding “don’t know” responses. The I‐S rating was calculated by multiplying the sum of the most important percentages by one minus the sum of the satisfaction percentages. In this example, 56.4% was multiplied by 62.9% (1‐0.371). This calculation yielded an I‐S rating of 0.3548, which ranked first out of fifteen major City services analyzed.
The maximum rating is 1.00 and would be achieved when 100% of the respondents select an item as one of their top three choices of importance and 0% indicate they are positively satisfied with the delivery of the service.
The lowest rating is 0.00 and could be achieved under either of the following two situations:
• If 100% of the respondents were positively satisfied with the delivery of the service
• If none (0%) of the respondents selected the service as one of the three most important areas.
Ratings that are greater than or equal to 0.20 identify areas that should receive significantly more emphasis over the next two years. Ratings from 0.10 to 0.20 identify service areas that should receive increased emphasis. Ratings less than 0.10 should continue to receive the current level of emphasis.
• Definitely Increase Emphasis (I‐S > 0.20)
• Increase Current Emphasis (I‐S = 0.10 ‐ 0.20)
• Maintain Current Emphasis (I‐S < 0.10)
Tables showing the results for the City of High Point are provided on the following pages.
Note: The I-S Rating is calculated by multiplying the "Most Important" % by (1-'Satisfaction' %)
Most Important %:
Satisfaction %:
© 2024 DirectionFinder by ETC Institute
The "Most Important" percentage represents the sum of the first, second, and third most important responses for each item. Respondents were asked to identify the items they thought should receive the most emphasis over the next two years.
The "Satisfaction" percentage represents the sum of the ratings "4" and "5" excluding don't knows.' Respondents ranked their level of satisfaction with the each of the items on a scale of 1 to 5 with "5" being very satisfied and "1" being very dissatisfied.
The Importance-Satisfaction rating is based on the concept that public agencies will maximize overall customer satisfaction by emphasizing improvements in those areas where the level of satisfaction is relatively low, and the perceived importance of the service is relatively high. ETC Institute developed an Importance-Satisfaction Matrix to display the perceived importance of major services that were assessed on the survey against the perceived quality of service delivery. The two axes on the matrix represent Satisfaction (vertical) and relative Importance (horizontal).
The I-S (Importance-Satisfaction) matrix should be interpreted as follows.
Continued Emphasis (above average importance and above average satisfaction). This area shows where the City is meeting customer expectations. Items in this area have a significant impact on the customer’s overall level of satisfaction. The City should maintain (or slightly increase) emphasis on items in this area.
Exceeding Expectations (below average importance and above average satisfaction). This area shows where the City is performing significantly better than customers expect the City to perform. Items in this area do not significantly affect the overall level of satisfaction that residents have with City services. The City should maintain (or slightly decrease) emphasis on items in this area.
Opportunities for Improvement (above average importance and below average satisfaction). This area shows where the City is not performing as well as residents expect the City to perform. This area has a significant impact on customer satisfaction, and the City should DEFINITELY increase emphasis on items in this area.
Less Important (below average importance and below average satisfaction). This area shows where the City is not performing well relative to its performance in other areas; however, this area is generally considered to be less important to residents. This area does not significantly affect overall satisfaction with City services because the items are less important to residents. The agency should maintain current levels of emphasis on items in this area.
Matrix charts showing the results for the City of High Point are provided on the following pages.
(points on the graph show deviations from the mean emphasis and satisfaction ratings given by respondents to the survey)
Quality of fire services/fire dept. response
Quality of library services
Quality of City parks & rec programs/facilities
Quality of City electrical utility services
Quality of customer service from City employees
Quality of City water and sewer utilities
Appearance of City facilities
Quality of City's stormwater management system
Quality of police services
Quality of trash/recycling/yard waste services
Flow of traffic/ease of getting around City
Effectiveness of City communication with public
Quality of economic development
Enforcement of City codes and ordinances
Maintenance of City streets/sidewalks/infrastructure
(points on the graph show deviations from the mean emphasis and satisfaction ratings given by respondents to the survey)
Professionalism of fire personnel
How quickly fire personnel respond to emergencies
Adequacy of fire protection for your property
Adequacy of City's 911 center
How quickly police re spond to emergencies
Professionalism of police officers
Fire building inspection program
City public safety education programs
Quality of animal control
City efforts to enforce local traffic laws
Visibility of police in retail areas
City efforts to reduce neighborhood street level drugs, prostitution & other crimes
Visibility of police in neighborhoods
City efforts to ensure community is prepared for a natural disaster or crisis
(points on the graph show deviations from the mean emphasis and satisfaction ratings given by respondents to the survey)
Appearance of your neighborhood
Enforcement of sign regulations
Enforcement of mowing & cutting of weeds on private property
Availability of programs to assist with home ownership like education & down payment assistance
Quality of public housing
City's efforts to manage (plan for) growth
Enforcement of clean-up of junk cars & debris on private property
Enforcement of repair of substandard housing
Enforcement of removal of dilapidated housing
Availability of affordable housing for purchase
Availability of affordable rental housing
(points on the graph show deviations from the mean emphasis and satisfaction ratings given by respondents to the survey)
Ease of traveling from your home to regional roadways
Maintenance of street signs
Ease of getting across town in High Point
Adequacy of City street lighting
Landscaping of medians & public areas along major City streets
Traffic signal coordination on major City streets
Condition/maintenance of neighborhood streets
Condition/maintenance of major City streets
Availability of pedestrian walkways/sidewalks
Maintenance of sidewalks
Availability of elderly & handicapped van service
Availability of regional transportation links
Availability of public transportation services
(points on the graph show deviations from the mean emphasis and satisfaction ratings given by respondents to the survey) Residential trash collection service
Courtesy of field employees
Reliability of City electrical service
Curbside recycling service
Reliability of water service
How quickly City restores power after an unplanned outage
Water pressure in your home Bulk trash pickup/removal service
Cleanliness/maintenance of stormwater drains
How well City keeps you informed about planned disruptions to your utility service
Value received for electrical utility rates
Leaf, yard waste & brush removal services
Taste/odor of your drinking water
Efforts to rebuild/maintain wastewater collection system
Value received for water & wastewater utility rates
(points on the graph show deviations from the mean emphasis a nd satisfaction ratings given by respondents to the survey)
Amount/variety of books/other materials
Hours of operation/services by public library
High Point Museum programs & facilities
Quality & availability of outdoor athletic fields
Number of public use computers in library
Public library programs
Variety/quality of events at High Point Theatre
Life-long sport programs like golf/tennis
Parking & access to the Theatre
Aquatic based programs
Appearance/maintenance of City parks
Number of City parks
Availability of walking/biking trails in City
Recreation centers & programs for youth
Special events & festivals in City
Recreation centers/programs for adults/seniors
Receiving info on parks & recreation programs
Q1. Overall Satisfaction with City Services. Please rate your overall satisfaction with major services provided by the City of High Point using a scale of 1 to 5, where 5 means "very satisfied" and 1 means "very dissatisfied."
(N=420)
Q1-1. Overall quality of police services
Q1-2. Overall quality of fire services &
Q1-3. Overall enforcement of City codes & ordinances
Q1-4. Overall quality of library services
Q1-5.
Q1-6.
Q1-7.
Q1-9.
Q1-10. Overall quality of City water & sewer
Q1-11. Overall
Q1-12.
Q1-13. Overall quality of customer service you receive from City employees
Q1-14. Overall effectiveness of City communication with the public
Q1. Overall Satisfaction with City Services. Please rate your overall satisfaction with major services provided by the City of High Point using a scale of 1 to 5, where 5 means "very satisfied" and 1 means "very dissatisfied."
Q1-15. Overall
of
Q1. Overall Satisfaction with City Services. Please rate your overall satisfaction with major services provided by the City of High Point using a scale of 1 to 5, where 5 means "very satisfied" and 1 means "very dissatisfied." (without "don't know")
(N=420)
Q1-1. Overall quality of police
Q1-2. Overall quality of fire services & fire department response to medical emergencies
Q1-3. Overall enforcement of City codes & ordinances
Q1-4. Overall quality of library services
Q1-5.
Q1-6.
Q1-7. Overall flow of traffic
Q1-10.
Q1-12.
Q1-13.
Q1. Overall Satisfaction with City Services. Please rate your overall satisfaction with major services provided by the City of High Point using a scale of 1 to 5, where 5 means "very satisfied" and 1 means "very dissatisfied." (without "don't know")
Q1-14. Overall effectiveness of City communication with the public
Q1-15. Overall quality of economic
Q2. Which THREE of the Overall City Services listed in Question 1 do you think should receive the MOST EMPHASIS from City leaders over the next TWO years?
Q2. Which THREE of the Overall City Services listed in Question 1 do you think should receive the MOST EMPHASIS from City leaders over the next TWO years?
Q2. Which THREE of the Overall City Services listed in Question 1 do you think should receive the MOST EMPHASIS from City leaders over the next TWO years? Q2. 3rd
Q2. Which THREE of the Overall City Services listed in Question 1 do you think should receive the MOST EMPHASIS from City leaders
Q3. Overall Perception of the City. Several items that may influence your perception of the City of High Point are listed below. Please rate each item using a scale of 1 to 5, where 5 means "excellent" and 1 means "poor."
(N=420)
Q3-1. Overall image of City
Q3-3. Overall as a place to raise children
Q3-4. Overall as a place to work
Q3-5. Overall cultural & recreational
Q3-7. Overall quality of City services
Q3-8. Overall value that you receive for your City tax dollars & fees
Q3-9.
Q3. Overall Perception of the City. Several items that may influence your perception of the City of High Point are listed below. Please rate each item using a scale of 1 to 5, where 5 means "excellent" and 1 means "poor." (without "don't know")
(N=420)
Q3-1. Overall image of City
Q3-2.
Q3-4. Overall as a place to work
Q3-5. Overall cultural & recreational opportunities
Q3-6.
Q3-8. Overall value that you receive for your City tax dollars & fees
Q3-9. Overall appearance of City
Q4. Public Safety and Emergency Services. For each of the following, please rate your satisfaction using a scale of 1 to 5, where 5 means "very satisfied" and 1 means "very dissatisfied."
(N=420)
Q4-1. How quickly police respond to emergencies
Q4-2. City
Q4-3. Visibility of police in neighborhoods
Q4-4. Visibility of police in retail areas
Q4-5. Professionalism of police officers
Q4-6. City efforts
Q4-7. Quality
Q4-8. How quickly fire personnel respond to emergencies
Q4-9. Fire building inspection
Q4-10. Adequacy of fire protection
Q4-11. Professionalism of fire personnel
Q4-12. City efforts to ensure the community is prepared for a
Q4-13. City public safety education programs (police & fire), including school-based programs
Q4-14. Adequacy of City's 911 center
Q4. Public Safety and Emergency Services. For each of the following, please rate your satisfaction using a scale of 1 to 5, where 5 means "very satisfied" and 1 means "very dissatisfied." (without "don't know")
(N=420)
Q4-1. How quickly police respond to emergencies
Q4-2. City efforts to reduce neighborhood street level drugs, prostitution, & other crimes
Q4-3. Visibility of police in neighborhoods
Q4-4. Visibility of police in retail areas
Q4-5. Professionalism of police
Q4-6. City efforts to enforce local
Q4-7. Quality of animal control
Q4-8.
Q4-9. Fire building inspection program
Q4-10. Adequacy of fire protection for your property
Q4-11. Professionalism of
Q4-12. City efforts to
Q4-13. City public safety education programs (police & fire), including school-based programs
Q4. Public Safety and Emergency Services. For each of the following, please rate your satisfaction using a scale of 1 to 5, where 5 means "very satisfied" and 1 means "very dissatisfied." (without "don't know")
Q4-14. Adequacy of City's
Q5. Which THREE of the Public Safety and Emergency Services listed in Question 4 do you think should receive the MOST EMPHASIS from City leaders over the next TWO years?
Top choice
Q5. Which THREE of the Public Safety and Emergency Services listed in Question 4 do you think should receive the MOST EMPHASIS from City leaders over the next TWO years?
2nd choice
Q5. Which THREE of the Public Safety and Emergency Services listed in Question 4 do you think should receive the MOST EMPHASIS from City leaders over the next TWO years?
3rd
Q5. Which THREE of the Public Safety and Emergency Services listed in Question 4 do you think should receive the MOST EMPHASIS from City leaders over the next TWO years? (top 3)
Q6. Perceptions of Safety. Using a scale of 1 to 5, where 5 means "very safe" and 1 means "very unsafe," please rate how safe you feel in the following situations.
(N=420)
Q6. Perceptions of Safety. Using a scale of 1 to 5, where 5 means "very safe" and 1 means "very unsafe," please rate how safe you feel in the following situations. (without "don't know") (N=420)
Q6-3.
Q6-6.
Q7. Are there any areas of town where you do not feel safe?
Q7. Are there any areas of town where you do not feel safe
Q7. Are there any areas of town where you do not feel safe? (without "not provided")
Q7. Are there any areas of town where you do not feel safe
Q8. Neighborhood Services. For each of the following, please rate your satisfaction using a scale of 1 to 5, where 5 means "very satisfied" and 1 means "very dissatisfied."
(N=420)
Q8-1. Enforcement of cleanup of junk cars & debris on private property
Q8-2. Enforcement of mowing & cutting of weeds on private property
Q8-3. Enforcement of sign regulations
Q8-4. Enforcement of repair of substandard housing
Q8-5. Enforcement of removal of dilapidated
Q8-6. Appearance of your neighborhood
Q8-7. Availability of programs to assist with home ownership like education & down payment assistance
Q8-8. City's efforts to manage (plan for) growth
Q8-9.
Q8-10. Availability of affordable housing
Q8-11. Quality of public housing
Q8. Neighborhood Services. For each of the following, please rate your satisfaction using a scale of 1 to 5, where 5 means "very satisfied" and 1 means "very dissatisfied." (without "don't know")
(N=420)
Q8-1. Enforcement of cleanup of junk cars & debris on private property
Q8-2. Enforcement of mowing & cutting of weeds on private property
Q8-3. Enforcement of sign regulations
Q8-4. Enforcement of repair of substandard housing
Q8-5. Enforcement of removal of dilapidated
Q8-6. Appearance of your neighborhood
Q8-7. Availability of programs to assist with home ownership like education & down payment assistance
Q8-8. City's efforts to manage (plan for) growth
Q8-9. Availability of
Q8-10. Availability of
Q8-11. Quality of public housing
Q9. Which THREE of the Neighborhood Services listed in Question 8 do you think should receive the MOST EMPHASIS from City leaders over the next TWO years?
Q9. Which THREE of the Neighborhood Services listed in Question 8 do you think
Q9. Which THREE of the Neighborhood Services listed in Question 8 do you think should receive the MOST EMPHASIS from City leaders over the next TWO years?
3rd
Q9. Which THREE of the Neighborhood Services listed in Question 8 do you think should
EMPHASIS from City leaders over the next TWO years? (top 3)
Q10. Transportation and Roadway Services. For each of the following, please rate your satisfaction using a scale of 1 to 5, where 5 means "very satisfied" and 1 means "very dissatisfied."
(N=420)
Q10-1. Ease of getting across town
Q10-2. Ease
Q10-3. Traffic signal coordination on major City streets
Q10-4. Maintenance of street signs
Q10-5.
Q10-9. Landscaping of medians & public areas along major City streets
Q10-10. Adequacy of City street
Q10-12. Availability of elderly & handicapped van service
Q10-13. Availability of regional transportation links
Q10. Transportation and Roadway Services. For each of the following, please rate your satisfaction using a scale of 1 to 5, where 5 means "very satisfied" and 1 means "very dissatisfied." (without "don't know")
(N=420)
Q10-1. Ease of getting across town in High Point
Q10-2. Ease of traveling from your home to regional
Q10-3. Traffic signal coordination on major City streets
Q10-4. Maintenance of street signs
Q10-5. Availability of pedestrian walkways/ sidewalks
Q10-6. Maintenance of sidewalks
Q10-7. Condition/ maintenance of major City streets
Q10-8. Condition/ maintenance of streets
Q10-9. Landscaping of medians & public areas along major City streets
Q10-10. Adequacy of City street lighting
Q10-11. Availability of public
Q10-12. Availability of elderly & handicapped van
Q10-13. Availability of regional transportation links
Q11. Which THREE of the Transportation and Roadway Services listed in Question 10 do you think should receive the MOST EMPHASIS from City leaders over the next TWO years?
Q11. Which THREE of the Transportation and
Q11. Which THREE of the Transportation and Roadway Services listed in Question 10 do you think should receive the MOST EMPHASIS from City leaders over the next TWO years?
3rd
Q11. Which THREE of the Transportation and Roadway Services listed in Question 10 do you think should receive the MOST EMPHASIS from City leaders over the next TWO years? (top 3)
Q12. Environmental and Utility Services. For each of the following, please rate your satisfaction using a scale of 1 to 5, where 5 means "very satisfied" and 1 means "very dissatisfied."
(N=420)
Q12-2.
Q12-4. Bulk trash pickup/removal service (old furniture, appliances, etc.)
Q12-5. Efforts
&
your
Q12-8. Taste/odor of your
Q12-9.
Q12-10. Cleanliness/maintenance of stormwater drains in your neighborhood
Q12-11. Reliability of City electrical
Q12-12. How quickly City restores
Q12-13.
Q12-14. How well City keeps you informed about planned disruptions to your utility service
Q12. Environmental and Utility Services. For each of the following, please rate your satisfaction using a scale of 1 to 5, where 5 means "very satisfied" and 1 means "very dissatisfied."
Q12-15. Courtesy of field employees
Q12. Environmental and Utility Services. For each of the following, please rate your satisfaction using a scale of 1 to 5, where 5 means "very satisfied" and 1 means "very dissatisfied." (without "don't know")
(N=420)
Q12-1. Residential trash
Q12-2.
Q12-4. Bulk trash pickup/ removal service (old furniture, appliances, etc.)
Q12-5. Efforts
Q12-6.
Q12-9.
Q12-10. Cleanliness/ maintenance of stormwater drains
Q12-11.
Q12-12.
Q12-13. Overall value you receive for electrical utility rates
Q12. Environmental and Utility Services. For each of the following, please rate your satisfaction using a scale of 1 to 5, where 5 means "very satisfied" and 1 means "very dissatisfied." (without "don't know")
Q12-14. How well City keeps you informed about planned disruptions to your utility service
Q12-15. Courtesy of field employees
Q13. Which THREE of the Environmental and Utility Services listed in Question 12 do you think should receive the MOST EMPHASIS from City leaders over the next TWO years?
Q13. Which THREE of the Environmental and Utility Services listed in Question 12 do you think should receive the MOST EMPHASIS from City leaders over the next TWO
Q13. Which THREE of the Environmental and Utility Services listed in Question 12 do you think should receive the MOST EMPHASIS from City leaders over the next TWO years?
Q13. Which THREE of the Environmental and Utility Services listed in Question 12 do you think should receive the MOST EMPHASIS from
Q14. Are you aware of these programs?
Q14. Are you aware of these programs
PROVIDED”
Q14. Are you aware of these programs? (without "not provided")
Q14. Are you aware of these programs
Q14a. Have you participated in one of these programs?
Q14a.
Q14a. Have you participated in one of these programs? (without "not provided")
Q14a. Have you participated in one of these programs
Q15. City Communication. For each of the following, please rate your satisfaction using a scale of 1 to 5, where 5 means "very satisfied" and 1 means "very dissatisfied."
(N=420)
Q15-1. City efforts to keep you informed about local issues
Q15-2. Quality of City's government activities channel (TW
Q15-3. Quality of online subscription services
Q15-4. Quality of City's website
Q15-5. Quality of utility bill inserts
Q15-6. Quality of printed materials
Q15-7. General availability of information about City programs & services
Q15. City Communication. For each of the following, please rate your satisfaction using a scale of 1 to 5, where 5 means "very satisfied" and 1 means "very dissatisfied." (without "don't know")
(N=420)
Q15-1. City efforts to keep you informed about local issues
Q15-2. Quality of City's government activities
Q15-3. Quality of online subscription services
Q15-4. Quality of City's website
Q15-5. Quality of utility bill inserts
Q15-6. Quality of printed materials
Q15-7. General availability of information about City programs & services
Q16. Culture and Recreation Services. For each of the following, please rate your satisfaction using a scale of 1 to 5, where 5 means "very satisfied" and 1 means "very dissatisfied."
(N=420)
Q16-1. Appearance/maintenance of City parks
Q16-2.
Q16-3. Availability of walking/ biking
Q16-4. Quality & availability of outdoor athletic fields (e.g., baseball, soccer, softball)
Q16-5. Recreation centers &
Q16-6. Recreation centers & programs for adults including seniors
Q16-7. Life-long sport programs
Q16-8. Aquatic based programs like fishing, boating, swimming pools, splash pads
Q16-9. Special events & festivals in City
Q16-10. Receiving information on parks & recreation programs
Q16-11. Hours of operation & services provided by public library
Q16-12. Amount & variety of books & other materials in public library
Q16-13. Number of public use computers in library
Q16-14. Public library programs like story time, book clubs or genealogy services
Q16. Culture and Recreation Services. For each of the following, please rate your satisfaction using a scale of 1 to 5, where 5 means "very satisfied" and 1 means "very dissatisfied."
Q16-15. High Point Museum programs & facilities
Q16-16. Variety & quality of
Q16-17. Parking & access to Theatre
Q16. Culture and Recreation Services. For each of the following, please rate your satisfaction using a scale of 1 to 5, where 5 means "very satisfied" and 1 means "very dissatisfied." (without "don't know")
(N=420)
Q16-1. Appearance/ maintenance of City parks
Q16-2. Number
Q16-3. Availability of walking/biking trails in City
Q16-4. Quality & availability of outdoor athletic fields (e.g., baseball, soccer, softball)
Q16-5. Recreation centers & programs
Q16-6. Recreation centers & programs for adults including seniors
Q16-7. Life-long sport programs like golf/tennis
Q16-8. Aquatic based programs like fishing, boating, swimming pools, splash pads
Q16-9. Special events & festivals in City
Q16-10. Receiving information on parks & recreation programs
Q16-11. Hours of operation & services provided by public library
Q16-12. Amount & variety of books & other materials in public library
Q16-13. Number of public use computers in library
Q16. Culture and Recreation Services. For each of the following, please rate your satisfaction using a scale of 1 to 5, where 5 means "very satisfied" and 1 means "very dissatisfied." (without "don't know")
Q16-14. Public library programs like story time, book clubs or genealogy services
Q16-15. High Point Museum
&
Q16-16. Variety & quality of events held at High Point Theatre
Q16-17. Parking & access to Theatre
Q17. Which THREE of the Cultural and Recreation Services listed in Question 16 do you think should receive the MOST EMPHASIS from City leaders over the next TWO years?
Q17. Which THREE of the Cultural and Recreation Services listed in Question 16 do you think should receive the MOST EMPHASIS from City leaders over the next TWO years?
2nd choice
Q17. Which THREE of the Cultural and Recreation Services listed in Question 16 do you think should receive the MOST EMPHASIS from City leaders over the next TWO years?
3rd choice
Q17. Which THREE of the Cultural and Recreation Services listed in Question 16 do you think should receive the MOST EMPHASIS from City leaders over the next TWO years? (top 3)
Q17. Sum of top 3 choices
Q18. Customer Service. Have you contacted the City during the past year?
Q18. Have you contacted City during past year
Q18a. Using a scale of 1 to 5, where 5 means "always" and 1 means "never," please rate how often City employees (not elected officials) display the following behaviors.
(N=220)
Q18a-1. They were courteous & polite
Q18a-2. They gave prompt, accurate, & complete answers to
Q18a-3. They did what they said they
Q18a-4. They helped you resolve your issue to your
Q18a-5. It was easy to contact the
Q18a-6. Services were provided at a time that was accommodating to your schedule
Q18a. Using a scale of 1 to 5, where 5 means "always" and 1 means "never," please rate how often City employees (not elected officials) display the following behaviors. (without "don't know")
(N=220)
Q18a-2. They gave prompt, accurate, & complete answers
Q18a-3. They did what they said they would do in a
Q18a-4. They helped you resolve your issue
Q18a-5. It was easy to contact the person you
Q18a-6. Services were provided at a time that was accommodating to your schedule
Q19. Quality of Life. Several reasons for deciding where to live are listed below. Using a scale of 1 to 4, where 4 is "very important" and 1 is "unimportant," please indicate how important was each reason in your decision to live where you live.
(N=420)
Q19-1. Sense
Q19-2.
Q19-5.
Q19-6. Access
Q19-7.
Q19-10.
Q19-11.
Q19-12.
Q19-13.
Q19-14. Opportunities and/or resources for senior citizens
Q19. Then, please indicate if your needs are being met in High Point. (N=420)
Q19-1. Sense of community
Q19-2. Quality of public education
Q19-3. Employment opportunities (proximity to job)
Q19-4.
Q19-5.
Q19-7. Availability of parks & recreation opportunities
Q19-8. Proximity to family & friends
Q19-9. Safety & security
Q19-10.
Q19-11.
Q19-12. Quality health care
Q19-13. Public transportation (bus)
Q19-14. Opportunities and/or resources for senior citizens
Q19. Then, please indicate if your needs are being met in High Point. (without "not provided")
(N=420)
Q19-1. Sense of community
Q19-2. Quality of public education
Q19-3. Employment opportunities (proximity to job)
Q19-4.
Q19-9. Safety & security
Q19-10. Accessibility to airport & other communities
Q19-11.
Q19-14. Opportunities and/or resources for senior citizens
Q20. City Issues. Please rate the importance of the following issues to the City of High Point using a scale of 1 to 5, where 5 means "very important" and 1 means "very unimportant."
(N=420)
Future well-being of High Point University
Q20-4. Providing incentives to attract & retain new retail
Q20-5.
Q20-6. Strengthening High Point's image through targeted marketing
Q20-7. Public/private partnerships to encourage Core City revitalization
Q20-8. Availability of
Q20-9. Providing a facility for community arts programs
Q20-10. Increasing local tax support to expand public transportation bus routes & hours
Q20-11. Providing a new full service senior activity center
Q20. City Issues. Please rate the importance of the following issues to the City of High Point using a scale of 1 to 5, where 5 means "very important" and 1 means "very unimportant." (without "don't know")
(N=420)
Q20-1. Future well-being of Furniture Market
Q20-2. Providing incentives to attract & retain businesses &
Q20-3. Future well-being of High Point University
Q20-4. Providing incentives to attract & retain new retail development & restaurants
Q20-5. Providing incentives to attract new full-time
Q20-6. Strengthening High Point's image through targeted marketing
Q20-7. Public/private partnerships to encourage Core City revitalization
Q20-8. Availability of high quality affordable housing in a neighborhood near you
Q20-9. Providing a facility for community
Q20-10. Increasing local tax support to expand public transportation bus routes & hours
Q20-11. Providing a new full service senior activity center
Q21. How often do you typically go outside High Point City limits to shop?
Q21. How often do you typically go outside High Point City limits to shop
Q21. How often do you typically go outside High Point City limits to shop? (without "not provided")
Q21. How often do you typically go outside High Point City limits to shop
Q22. Approximately how many years have you lived in High Point?
Q22. How many years have you lived in High Point
Q22. Approximately how many years have you lived in High Point? (without "not provided")
Q22. How many years have you lived in High Point
Q23. Do you own or rent your current residence?
Q23. Do you own or rent your current
Q23. Do you own or rent your current residence? (without "not provided")
Q23. Do you
Q24. Including yourself, how many persons in your household are in each of the following age groups?
Q25. Which of the following best describes your race/ethnicity?
Q25-7. Self-describe your race/ethnicity:
Q25-7. Self-describe your race/ethnicity
Q26. What is your gender?
Q27. Which
Q28. Would you say your total annual household income is...
Your
Q28. Would you say your total annual household income is... (without "not provided")

Please take a few minutes to complete this survey. Your input is an important part of the City's ongoing effort to identify and respond to resident priorities. If you have questions, please call Meridith Martin at 336-883-8557. You can also complete the survey online at HighPointSurvey.org. 1.

Overall Satisfaction with City Services. Please rate your overall satisfaction with major
provided by the City of High Point using a scale of 1 to 5, where 5 means "Very
and 1 means "Very Dissatisfied."
Which THREE of the Overall City Services listed above do you think should receive the MOST EMPHASIS from City leaders over the next TWO years? [Write in your answers below using the numbers from the list in Question 1.]
Overall Perception of the City. Several items that may influence your perception of the City of High Point are listed below. Please rate each item using a scale of 1 to 5, where 5 means "Excellent" and 1 means "Poor."
4. Public Safety and Emergency Services. For each of the following, please rate your satisfaction using a scale of 1 to 5, where 5 means "Very Satisfied" and 1 means "Very Dissatisfied."
5. Which THREE of the Public Safety and Emergency Services listed above do you think should receive the MOST EMPHASIS from City leaders over the next TWO years? [Write in your answers below using the numbers from the list in Question 4.]
6. Perceptions of Safety. Using a scale of 1 to 5, where 5 means "Very Safe" and 1 means "Very Unsafe," please rate how safe you feel in the following situations.
7. Are there any areas of town where you do not feel safe? ____(1) Yes ____(2) No [Skip to Q8.]
7a. If there are areas of town where you do not feel safe, where are they?
7b. If there are areas of town where you do not feel safe, why do you not feel safe there?
8. Neighborhood Services. For each of the following, please rate your satisfaction using a scale of 1 to 5, where 5 means "Very Satisfied" and 1 means "Very Dissatisfied."
9. Which THREE of the Neighborhood Services listed above do you think should receive the MOST EMPHASIS from City leaders over the next TWO years? [Write in your answers below using the numbers from the list in Question 8.]
11. Which THREE of the Transportation and Roadway Services listed above do you think should receive the MOST EMPHASIS from City leaders over the next TWO years? [Write in your answers below using the numbers from the list in Question 10.] 1st: ____ 2nd: 3rd: ____
12. Environmental and Utility Services. For each of the following, please rate your satisfaction using a scale of 1 to 5, where 5 means "Very Satisfied" and 1 means "Very
13. Which THREE of the Environmental and Utility Services listed above do you think should receive the MOST EMPHASIS from City leaders over the next TWO years? [Write in your answers below using the numbers from the list in Question 12.]
For the last four years the City has focused on citywide cleanup efforts through our Keep High Point Beautiful effort. These programs have included the High Point Big Sweep event in the spring, the Great American Cleanup effort in the fall, and Adopt-a-Street and Adopt-a-Stream programs.
14. Are you aware of these programs? ____(1) Yes ____(2) No [Skip to Q15.]
14a. Have you participated in one of these programs? ____(1) Yes ____(2) No
15. City Communication. For each of the following, please rate your satisfaction using a scale of 1 to 5, where 5 means "Very Satisfied" and 1 means "Very Dissatisfied."
16. Culture and Recreation Services. For each of the following, please rate your satisfaction using a scale of 1 to 5, where 5 means "Very Satisfied" and 1 means "Very Dissatisfied."
17. Which THREE of the Cultural and Recreation Services listed above do you think should receive the MOST EMPHASIS from City leaders over the next TWO years? [Write in your answers below using the numbers from the list in Question 16.]
[Skip
Q19.]
Using a scale of 1 to 5, where 5 means "Always" and 1 means "Never," please rate how often City employees (not elected officials) display the following behaviors.
19. Quality of Life. Several reasons for deciding where to live are listed below. Using a scale of 1 to 4, where 4 is "Very Important" and 1 is "Unimportant," how important was each reason in your decision to live where you live? Then, please indicate if your needs are being met in High Point.
21. How often do you typically go outside High Point City limits to shop?
22. Approximately how many years have you lived in High Point? ______ years
23. Do you own or rent your current residence? ____(1) Own ____(2) Rent
24. Including yourself, how many persons in your household are in each of the following age groups?
Under age 5:
Ages 5-19:
Ages 20-34: Ages 35-49: Ages 50-64: Ages 65+:
25. Which of the following best describes your race/ethnicity? [Check all that apply.]
____(01) Asian or Asian Indian
____(02) Black or African American
____(03) American Indian or Alaska Native
____(04) White or Caucasian
____(05) Native Hawaiian or other Pacific Islander ____(06) Hispanic, Spanish, or Latino/a/x ____(99) Other: ____
26. What is your gender? ____(1) Male ____(2) Female
27. Which of the following best describes your current employment status?
____(1) Employed outside the home [What is the zip code where you work? _ ]
____(2) Employed in the home/have a home-based business ____(3) Student ____(4) Retired ____(5) Not currently employed outside the home
28. Would you say your total annual household income is... ____(1) Under $25,000 ____(2) $25,000 to $49,999 ____(3) $50,000 to $74,999 ____(4) $75,000 or more
29. Would you be willing to participate in future surveys sponsored by the City of High Point? ____(1) Yes [Answer Q29a.] ____(2) No
29a. Please provide your contact information.
Mobile Phone Number: ____
Email Address: ___ _
This concludes the survey. Thank you for your time!
Please return your completed survey in the enclosed postage-paid envelope addressed to: ETC Institute, 725 W. Frontier Circle, Olathe, KS 66061
confidential.