CITY OF EDMOND, OK
PLANNING CARE
WITH
BUDGET AND FINANCIAL PLAN
FISCAL YEAR 2023–24
In preparing for the Distinguished Budget Presentation Award from the Government FinanceOfficers Association (GFOA),we created abetter budget book that provides a comprehensiveoverview of the City’s budget process, the services weprovide, the overall strategic goals ofthe City and all the issues involved with creating this FY 23/24 budget.
This book is broken into sections, and you can click on the page number and it will take you directly to that section. Our new budget book will become not only a financial plan, but it has become a policy document, a communications device and an operations guide.
The first Introductory section give you insight of who we are, where we are and a little history of our City. The City’s organizational chart can be found here as well as a list of our City Council. Edmond at a Glance page gives a quick overview of our great city. We included this year, a new section for information if youwould like to donateto our Veteran’s Memorial, our Luminance program or Art inPublic Places.
The Executive summary contains aletter from Scot Rigby, our City Manager and he highlights what is happening across the City. A summarized Budget InBrief is located here, whichgives a quick outlook of the plan, along with our city’s strategic plan, budget calendar and overall budget process.
Next are the budget summary pages. These pages detailthe entire budget in a one page document. These summaries are broken down into All Funds, the General Fund and Public Works Authority budgets. We have listed in Sections 4 through 10 each of our funds and each with theirown budget details.
It begins with the General Fund in section 4, which is where most of the services for our customers are budgeted.
The Special Revenue Funds, whichcontain our Fire and Police funds and other funds that arefinancedwith a dedicated revenue source.
The Capital Project Funds section reflects a five year plan for all of our capital projects. This plan is awork in progress and is changed as needed to accommodategrowth.
Section 7 and 8contain our Utility funds as well as Arcadia Lake and Kickingbird Golf Club.
The remaining sectionsgive details for Internal Servicefunds, our policies, our debt, our personneland our list of our upcomingplanned capital projects by fund.
We close our book witha Glossary and Acronyms section, as we understand that everyone thatmay read this document may not have the same understanding of the terminology that weuse.
Reader’s Guide
0.1
GOVERNMENT FINANCE OFFICERS ASSOCIATION
Distinguished Budget Presentation Award
PRESENTED TO
City of Edmond Oklahoma
For the Fiscal Year Beginning July 01, 2022
Executive Director

Government Finance Officers Association of the United States and Canada (GFOA) presented a Distinguished Budget Presentation Award to City of Edmond, Oklahoma, for its Annual Budget for the fiscal year beginning July 01, 2022. In order to receive this award, a governmental unit must publish a budget document that meets program criteria as a policy document, as a financial plan, as an operations guide, and as a communications device.
This award is valid for a period of one year only. We believe our current budget continues to conform to program requirements, and we are submitting it to GFOA to determine its eligibility for another award.
0.2

0.3
Section 1 -Introduction 1.1-1.10 Core Values, Trustworthy Service and Leadership Expectation 1.1 Community History 1.2-1.3 Edmond at a Glance 1.4-1.5 Mayor, City Council, and Principal Officials 1.6 Organizational Chart- City Wide 1.7 Donation Opportunity- Veterans Memorial 1.8 Donation Opportunity- Luminance 1.9 Donation Opportunity- Art In Public Places 1.10 Section 2 - Executive Summary 2.1-2.30 2.1-2.9 2.10-2.13 2.14-2.15 2.16 2.17 2.18 2.19 2.20-2.22 2.23-2.25 2.26 2.27-2.28 City Manager's Message Budget in Brief Strategic Plan General Fund Strategic Initiatives & Performance Measures Special Revenue Fund Strategic Initiatives & Performance Measures Edmond Public Works Authority (EPWA)Strategic Initiatives & Performance Measures Other Enterprise Fund Strategic Initiatives & Performance Measures Internal Services Fund Strategic Initiatives & Performance Measures Budget Process Budget Calendar Budget Resolution Major Fund and Structure 2.29-2.30 Section 3 - Budget Summaries 3.1-3.13 Budget Summary- All Funds 3.1 Summary of Revenues by Source - General Fund 3.2 Summary of Revenues by Source- Edmond Public Works (EPWA) Funds 3.3 General Fund Budget Summary 3.4 Special Revenue Fund Summary 3.5 Capital Projects Fund Summary 3.6 Public Works Fund Summary 3.7 Other Enterprise Fund Summary 3.8 Internal Services Fund Summary 3.9 Fund Balance 3.10-3.13 Section 4 - General Fund 4.1-4.37 4.1 4.2-4.3 4.4-4.5 4.6-4.7 4.8-4.9 4.10-4.11 4.12-4.13 4.14-4.15 4.16-4.17 4.18-4.19 4.20-4.21 4.22-4.23 4.24-4.25 4.26-4.27 4.28-4.29 4.30-4.31 4.32-4.33 General Fund Sub- Directory Fund Budget Summaries and Detail: General Fund General Government Senior Citizens Center Emergency Management Cemetery Festival Marketplace Building Services City Council Historical Society Parks and Recreation Street & Alley Fund Court Services/ Municipal Court Community Image Planning Community Agency Review Commission Parks and Recreation- Special Events Edmond Electric Economic Development Fund (EEEDA) 4.34-4.35 Directory 0.4
Section 5 - Special Revenue Funds Special Revenue Sub- Directory 5.1 Fund Budget Summaries and Detail: Senior Citizens Fund 5.2-5.3 Community Development (Planning) Fund 5.4-5.5 Asset Forfeiture Fund 5.6-5.7 Ambulatory Services Fund 5.8-5.9 Fire Public Safety Limited Tax Fund 5.10-5.11 Police Public Safety Limited Tax Fund 5.12-5.13 Visit Edmond 5.14-5.15 Special Tax Parks Fund 5.16-5.17 American Rescue Plan Act of 2021 (ARPA) 5.18-5.19 Opioid- Drug Settlement Revenue Fund 5.20-5.21 Real Property Fund 5.22-5.23 Tax Increment Financing (TIF) Fund 5.24-5.25 Hospital Sale Trust fund 5.26-5.27 Section 6 -Capital Project Funds Capital Project Fund Sub- Directory 6.1 Fund Budget Summaries and Detail: Parks Tax Fund 6.2-6.3 Cemetery Care Fund 6.4-6.5 Art in Public Places Fund 6.6-6.7 Cemetery Perpetual Care Fund 6.8-6.9 Capital Improvements Fund 6.10-6.11 2000 Capital Improvements Tax Fund 6.12-6.13 2017 Capital Improvements Tax Fund 6.14-6.15 Section 7 -Edmond Public Works Authority (EPWA) Utility Funds Edmond Public Works Authority (EPWA) Fund Sub- Directory 7.1 Fund Budget Summaries and Detail: Edmond Public Works Authority (EPWA) Fund 7.2-7.3 (EPWA) Revenue Bonds Fund 7.4-7.5 Edmond Electric 7.6-7.7 Water Resources Fund 7.8-7.9 Solid Waste Fund 7.10-7.11 Wastewater Resources Fund 7.12-7.13 EPWA Sewer Impact 7.14-7.15 Arcadia Lake Fund 7.16-7.17 Drainage Utility Fund 7.18-7.19 (EPWA) Economic Development 7.20-7.21 Section 8 -Other Enterprise Funds Other Enterprise Fund Sub- Directory 8.1 Fund Budget Summaries and Detail: Kickingbird Gold Club 8.2-8.3 YourGovShop Fund 8.4-8.5 CityLink- Public Transportation 8.6-8.7 0.5
Section 9 -Internal Services Funds Internal Services Fund Sub- Directory 9.1 Fund Budget Summaries and Detail: Administrative Support Services 9.2-9.3 Risk Management Services 9.4-9.5 Workers’ Compensation Reserve Fund 9.6-9.7 Employee Group Insurance Fund 9.8-9.9 Vehicle Maintenance 9.10-9.11 General Government (Internal Service) 9.12-9.13 City Clerk 9.14-9.15 City Manager 9.16-9.17 Facility Maintenance 9.18-9.19 Marketing & Public Relations 9.20-9.21 Information Technology 9.22-9.23 Legal Services 9.24-9.25 Public Works Administration 9.26-9.27 Operations Central Warehouse 9.28-9.29 Public Safety Communications 9.30-9.31 Engineering 9.32-9.33 Financial Services 9.34-9.35 Human Resources 9.36-9.37 Utility Customer Service 9.38-9.39 Fleet Management 9.40-9.41 Public Works Field Services 9.42-9.43 Section 10 -Debt Service 10.1-10.6 Debt Schedules 10.1-10.6 Section 11 -Capital Projects 11.1-11.25 Five Year Plan 11.1-11.3 Five Year Capital Improvement Program List 11.4-11.6 Five Year Capital Improvement Programs in Detail 11.7-11.25 Section 12 -Personnel 12.1-12.6 Personnel Information 12.1-12.3 Past and Future Personnel Budget 12.4 Personnel Budget with Proposed Positions and Employee Turnover Rate12.5 Position Count 12.6 Section 13 -Policies 13.1-13.7 Financial Policies 13.1-13.7 Section 14 -Glossary and Acronyms 14.1-14.10 Glossary and Acronyms 14.1-14.10 0.6
CITY OF EDMOND
CORE VALUES, TRUSTWORTHY SERVICE, AND LEADERSHIP EXPECTATION
CORE VALUES
ACCOUNTABILITY
Weareresponsibleforourwork,ourwords,andour actions.
COMMUNICATION
Wevalueeffortstocommunicatewithourcustomers inacaring,timely,professionalmanner.

CUSTOMER SERVICE
We provide service with courtesy, respect, dependability,flexibilityandtimeliness.
INCLUSION
We promote an inclusive workforce and equitable servicesforourincreasinglydiversecommunity.
INNOVATION
We value innovation, creative thought, and thecollaborationofideas.
INTEGRITY
Wevaluethespiritofintegrityinallaspectsofour workinglives.
PROFESSIONALISM
We continue to seek growth, striving to be a learningorganization.
TEAMWORK
We encourage diversity of thinking, ideas, and responsibilities.
TRUSTWORTHY SERVICE
ThroughContinuousImprovment
Passionate About- Customer Service
Best In The World- Developing our Organization to provide quality public service while balancing cost effectiveness and responsiveness
Economic Engine- Amount of sales tax revenue from one cent divided by population
LEADERSHIP EXPECTATIONS
Earn trust and respect by always speaking the truthandleadingbypositiveexample. Create an environment of openness and sharing ofideastoencourageemployeeengagementand empowerthemwithconfidence.
Present your viewpoint and disagree when needed. However, once a decision has been made,ownthefinaldecision.
Be willing to make tough decisions and deal with theissuesinatimelymanner.
Recognize the big picture of city operations beyondyourdirectareasofresponsibility.
Seek partnerships with other city departments andoutsideagencies.
Communicate with your team and ensure the water of knowledge and understanding gets to theendoftherow.
1.1 Click Here for Main Directory
Our City's History: From Indian Territory to Today
Early Exploration
First explored by Washington Irving in 1832, Edmond was part of the Unassigned Lands, territory that was not assigned to any Native American tribe living in the area. The area was open to exploration, inhabited by herds of buffalo, black bears and wild horses, and used for hunting by nearby tribes.
On July 4, 1884, Congress granted rights to railroad companies to build tracks across the territory. By 1887, railroads were running across the Unassigned Lands. That year the train station, first named Summit for being the highest point of the railway between the Cimarron and North Canadian rivers, was officially renamed Edmond. There are several theories as to why Edmond was chosen, but it is unclear exactly why our city got its name.
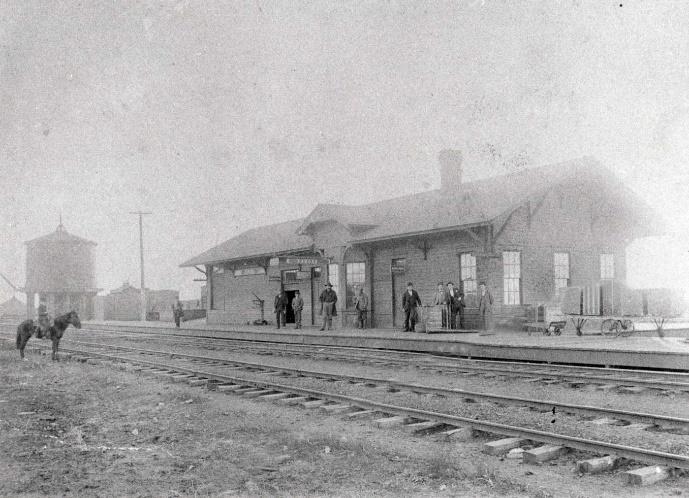
One passenger and one freight train arrived from each way daily stopping for water, coal and meals that Mrs. Steen, the wife of construction worker John M. Steen who came from New Mexico to build the well, cooked for the crews. One man said Edmond was the most important stop between Purcell and Arkansas City because crews could eat there.
History of Firsts
At noon on April 22, 1889, the land run began due to a proclamation signed by President Benjamin Harrison to open the Unassigned Lands to settlers. At 12:05 PM, surveyors were laying out the townsite.
The first legal settlers of Edmond were Colonel Eddy B. Townsend, Hardy C. Angelea, and J. Wheeler Turner. They rode their horses from 15 miles east of Edmond, at the west line of the Kickapoo Indian Reservation, to join the land run. It was the determination of settlers like these who put their stamp on Edmond and shaped its personality.
The first settlers lead to many more firsts for our great city:
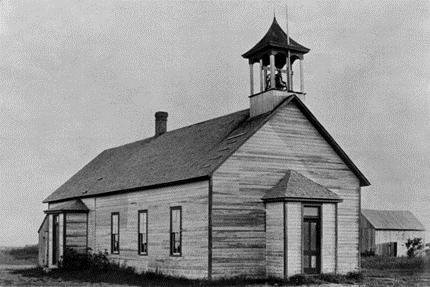
• First public school house, 1889 Territorial Schoolhouse at 2nd and Boulevard
• First flour mill in 1894, the Eagle Flouring Mill on 1st west of the railroad tracks
• First newspaper, the Edmond Sun at 2nd and Broadway
1.2 Click Here for Main Directory
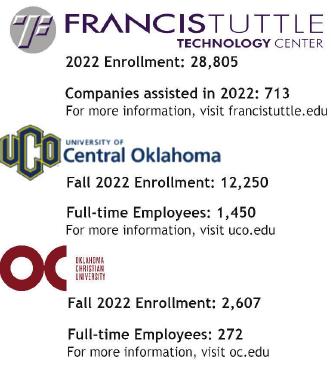
• First public institution of higher education, the Territorial Normal School, now the University of Central Oklahoma at 2nd and University
Continued Development
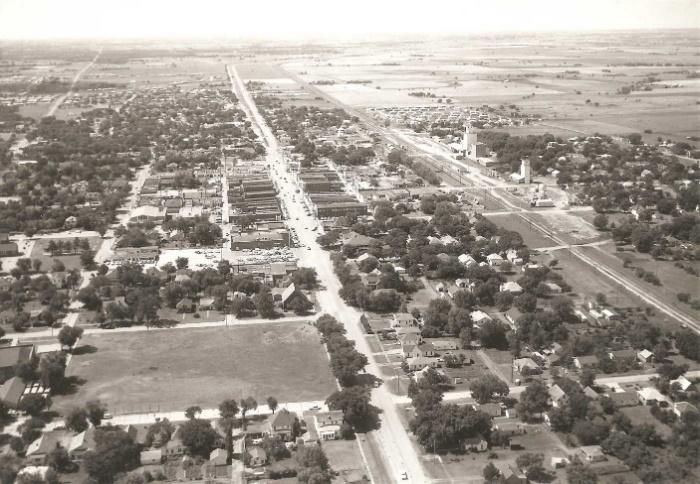
In 1907, Edmond saw many monumental achievements. Oklahoma became a state, natural gas lines were built to reach the city, a housing addition was under construction south of 2nd St. between Broadway and Boulevard, and more. The Great Depression and the Dust Bowl days struck the city in the 1920s. Citizens saw some relief from oil booms in 1922 and 1930. City development continued in the 1930s, with the establishment of Ray Deveraux's jewelry store in 1932 and the Baggerly Funeral Home's opening in 1933.
President Franklin Roosevelt's WPA program employed 93,000 people in Oklahoma in 1936. The WPA brought several projects to Edmond, including:
• Gracelawn Cemetery stone fencing at Danforth and Broadway
• The armory building, which now houses the Edmond Historical Society & Museum, at 5th and Boulevard
• Stephenson Park at 4th and Littler
• "Pre-Settlement Days" Mural at 1st and Littler
These landmarks still stand today and are available for visitation. In the 1980s, nearly 100 years after the Land Run that started the City of Edmond, Hafer Park opened, the site for Arcadia Lake was dedicated and the Oak Tree Country Club was being built.
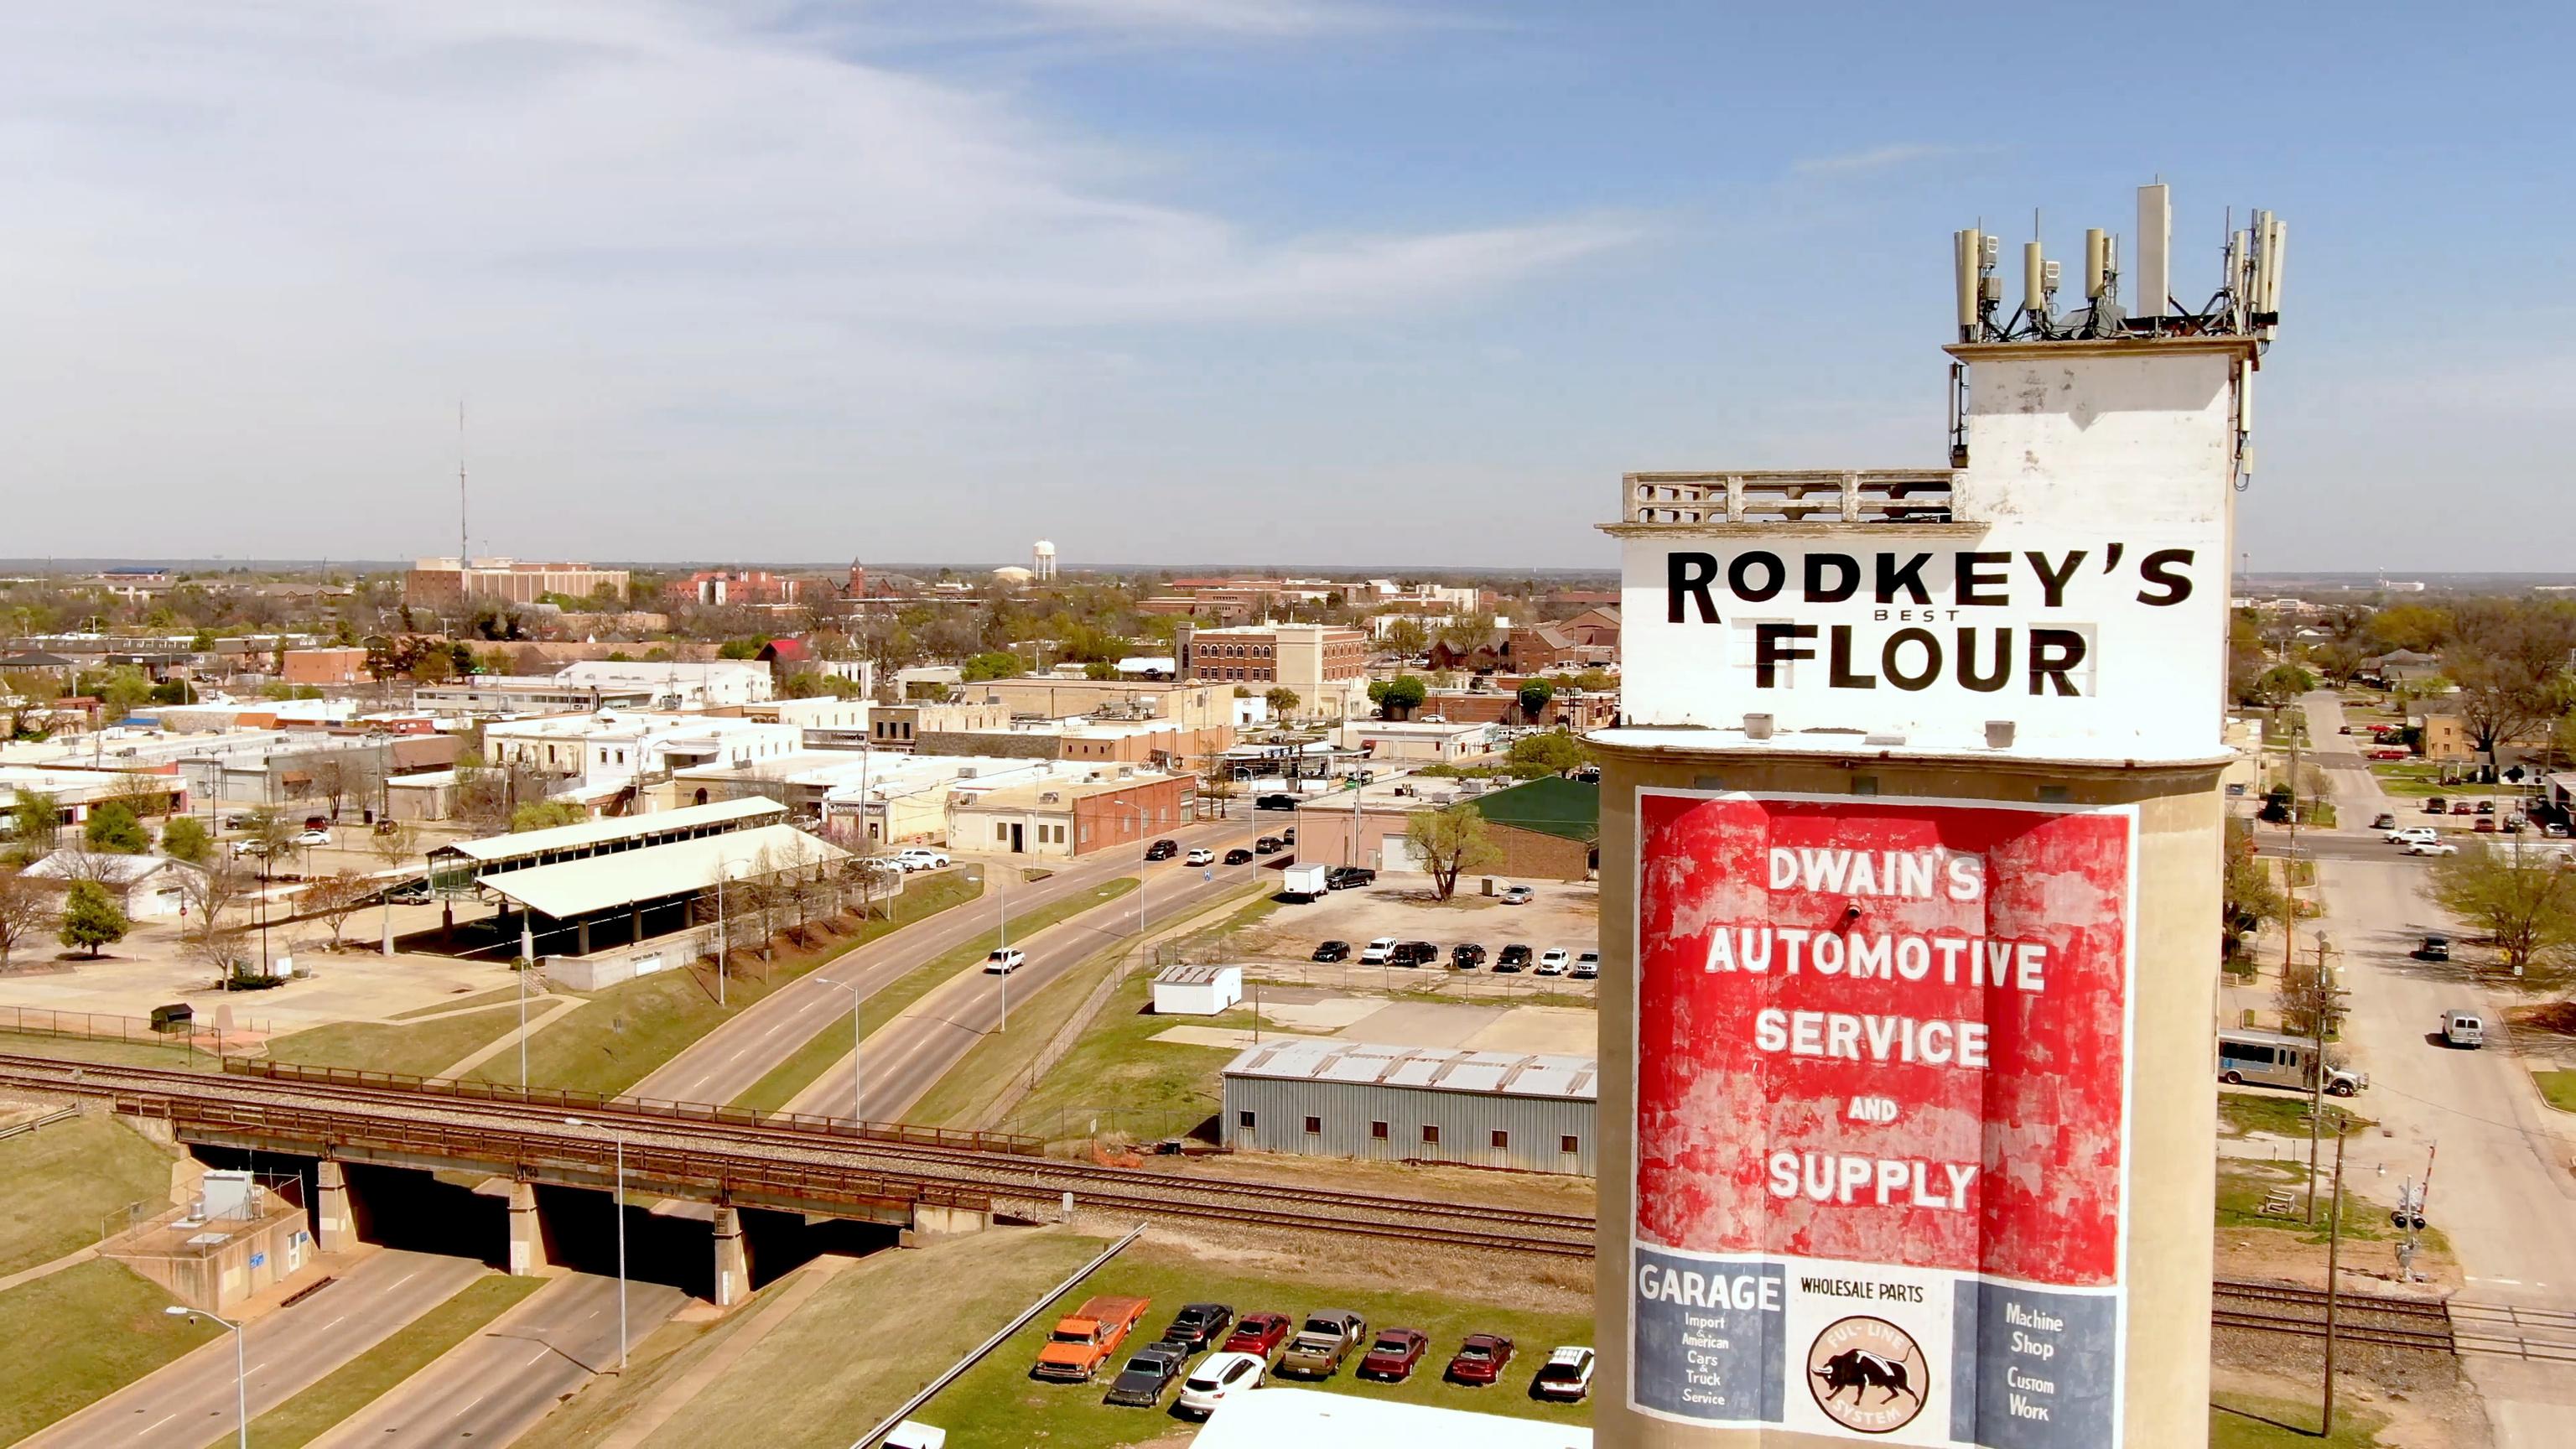
Today, Edmond boasts a population of nearly 95,000. Several historic sites built throughout our city's history remain standing, like the 1889 Territorial Schoolhouse, the Rodkey grain elevator, and the University of Central Oklahoma's Old North. Edmond has grown exceedingly well in the past 130 years, and we are still growing.
1.3 Click Here for Main Directory
Edmond at a Glance
Edmond is located just 13 miles north of Oklahoma City (OKC), the capital of Oklahoma.
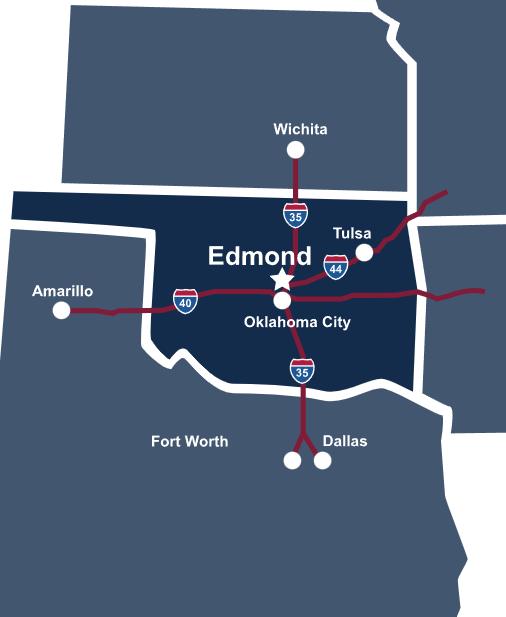
Interstate 40 (East & West), 35 (North & South), and 44 (Northeast) all run through the OKC metro area. There’s easy access from any direction, wherever you are or need to go.
Number of households: 37,123
City Limits: 90 square miles
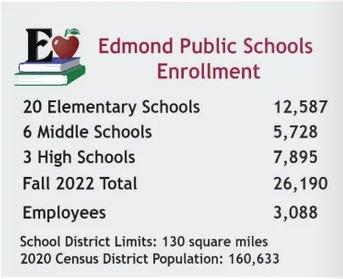
School District: 130 square miles
Population: 96,391
Source: www.EEDA.com
1.4 Click Here for Main Directory
Edmond has more than 30 parks and outdoor venues as well as 307 public art pieces. The Guthrie-Edmond Regional Airport is located seven miles North of Edmond and is operated through an intergovernmental agreement between the City of Edmond and the City of Guthrie.
Edmond’s Conference Center is located on the NW corner of I-35 and Covell. Several hundred acres of commercial development are available around this area.
1.5 Click Here for Main Directory
CITY OF EDMOND, OKLAHOMA
PRINICPAL OFFICIALS AND FINANCE COMMITTEE MEMBERS
CITY COUNCIL
DESCRIPTION
Edmond, OK operates under a Council-Manager form of government established by the 1925 Charter. The Mayor and Council are the policy-making and legisla ve body and appoint the City Manager as well as the City A orney and Municipal Judges.

MEETINGS
5:30 pm, Second and fourth Monday of each month- Council Chambers 20 S. Littler, Edmond, OK 73034
CITY COUNCIL MEMBERS
Darrell Davis Mayor Darrell.Davis@edmondok.gov
Tom Robins Ward 1 Thomas.Robins@edmondok.gov
Barry Moore Ward 2 Barry.Moore@edmondok.gov
Christin Mugg Ward 3 Christin.Mugg@edmondok.gov
Stacie A. Peterson Ward 4 Stacie.Peterson@edmondok.gov
FINANCE COMMITTEE MEMBERS
Term Expires: May 2025
Term Expires: May 2027
Term Expires: May 2027
Term Expires: May 2025
Term Expires: May 2025
Ross VanderHamm Chairperson Ross.VanderHamm@edmondok.gov
Darrell Davis Member Darrell.Davis@edmondok.gov
Christin Mugg Member Christin.Mugg@edmondok.gov
ADMINISTRATION
Scot Rigby City Manager Scot.Rigby@edmondok.gov
Steve Murdock City Attorney Steve.Murdock@edmondok.gov
Ross VanderHamm City Treasurer Ross.VanderHamm@edmondok.gov
Andy Conyers Assistant City Manager-Administration Andy.Conyers@edmondok.gov
Jim Smith Assistant City Manager-Operations Jim.Smith@edmondok.gov
Kory Atcuson City Clerk Kory.Atcuson@edmondok.gov
Chris Goodwin Fire Chief Chris.Goodwin@edmondok.gov
J.D. Younger Police Chief JD.Younger@edmondok.gov
Lisa Goodpasture Human Resource Director Lisa.Goodpasture@edmondok.gov
Diane L. Slayton Municipal Judge Diane.Slayton@edmondok.gov
FINANCE STAFF
Kathy Panas Finance Director Kathy.Panas@edmondok.gov
Sheila Briesch Controller Sheila.Briesch@edmondok.gov
Brenda Mayer Purchasing Agent Brenda.Mayer@edmondok.gov
Jared Campbell Budget Senior Manager Jared.Campbell@edmondok.gov
1.6 Click Here for Main Directory
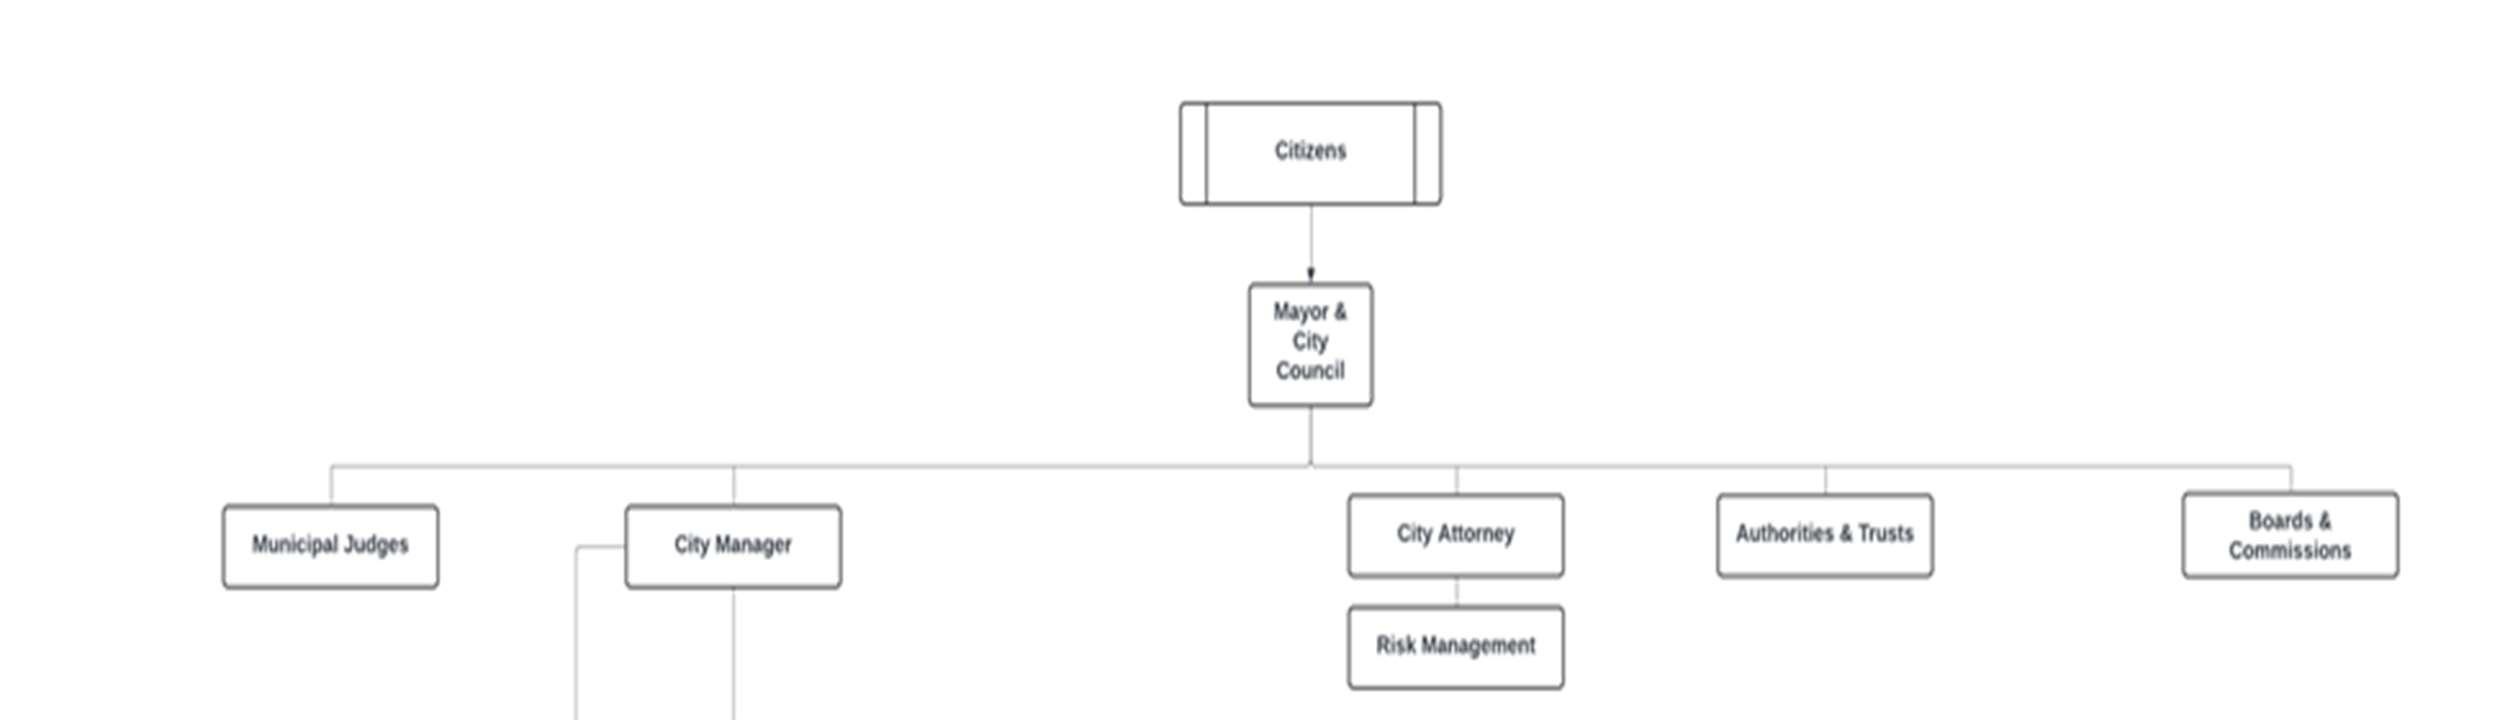
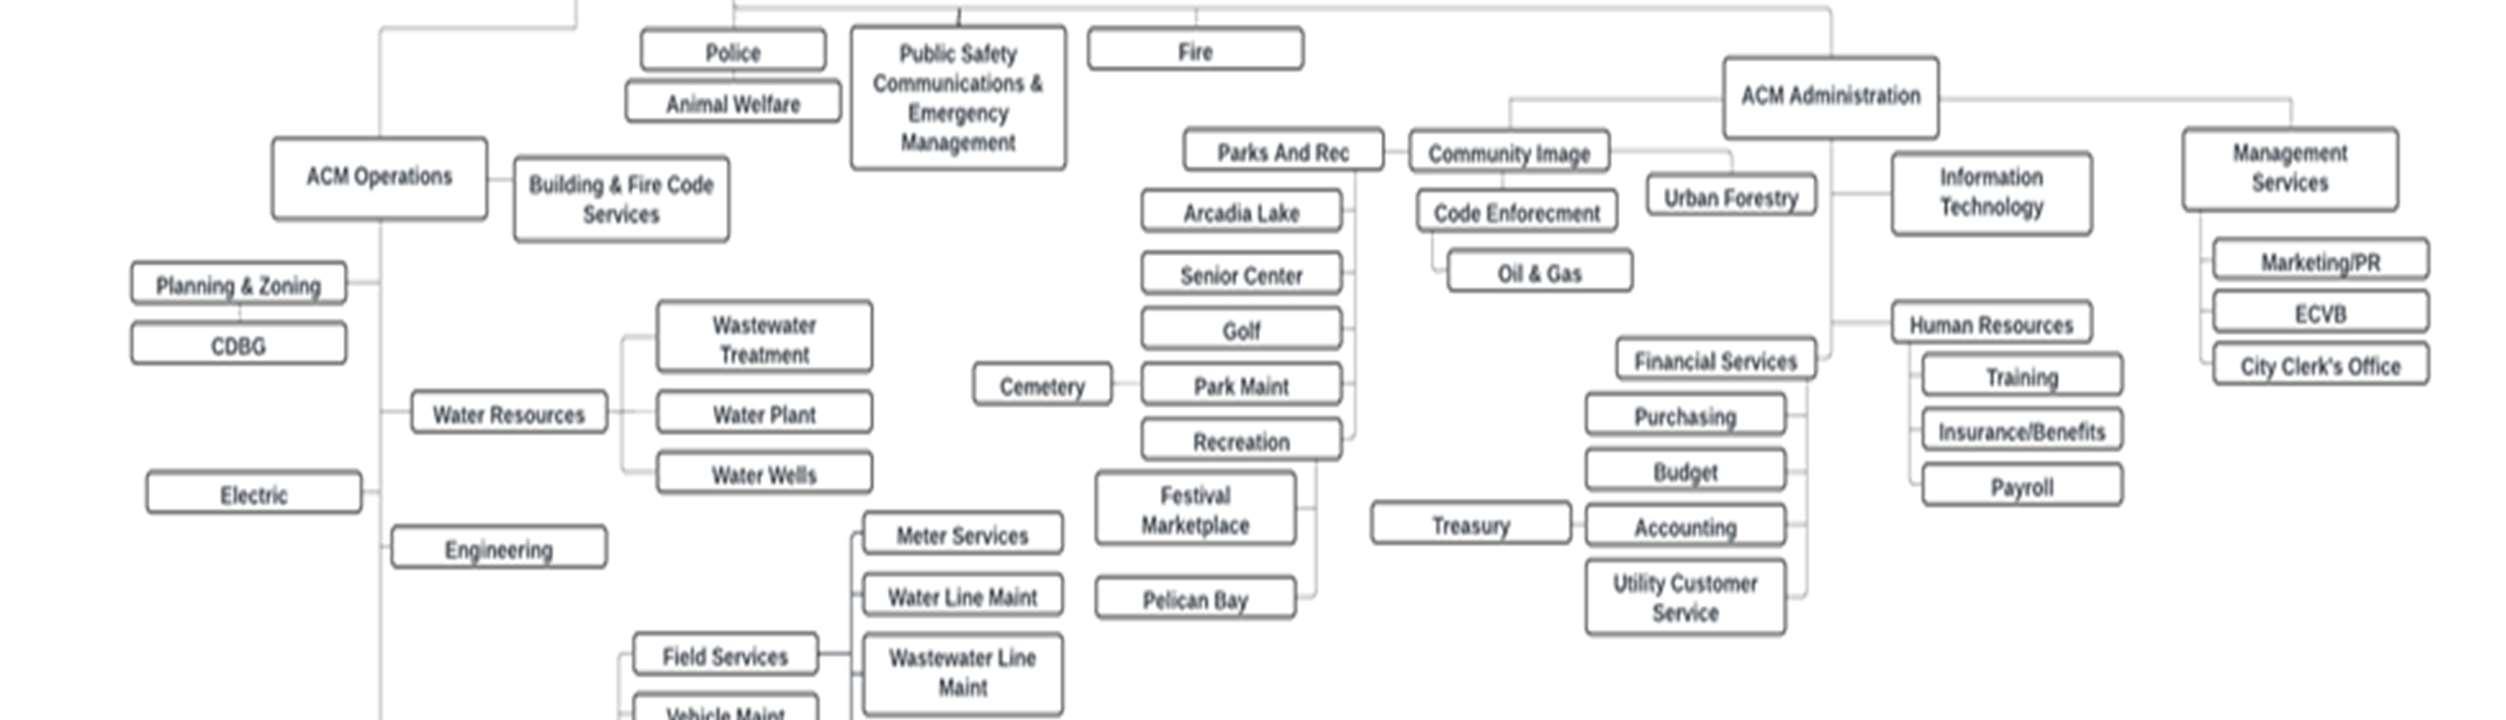

General Government Enterprise Internal Service OrganizationalChart The following shows which funds each Department/Agency is a part of: Asset Forfeiture Community Development Block Grant (CDBG) Fire Police / Animal Services Visit Edmond *No personnel budgeted under Capital Improvements Funds **Pension is not a budgeted fund of the City. Special Revenue Administrative Services City Attorney City Clerk’s Office City Manager Engineering Facility Maintenance Finance Field Services Arcadia Lake Drainage Electric Golf Solid Waste Water Resources Wastewater Resources Human Resources/Insurance/Benefits InformationTechnology (IT) Marketing Public Works Administration Risk Management Utility Customer Service Vehicle Maintenance Building & Fire Code Services Cemetery Community Image Code Enforcement Emergency Management Festival Marketplace Municipal Court Park Maintenance Parks & Recreation Pelican Bay Planning & Zoning Public Safety Communications Senior Center Urban Forestry 1.7 Click Here for Main Directory
Edmond is proud of its veterans and seeks to honor all those who are in service or who have served. The Edmond Veterans Memorial, to be located on the north end of Bickham-Rudkin Park, will pay tribute to our remarkable veterans with a place of gathering, recognition, education, and quiet reflection. The memorial will feature welcoming spaces for the community that were inspired by the park’s natural beauty. The design for the 49-acre memorial creates an interplay between architectural and native elements. The project will also expand parking for Bickham-Rudkin Park.
To help steer the project, the Edmond City Council created the Veterans Memorial Advisory Committee (VMAC). The VMAC is seeking to raise funds to cover the cost of construction for the memorial, which was last estimated to be around $5.5 million.

Central to the memorial’s concept will be plaques and tributes recognizing Edmond’s veterans. As part of its ongoing work, the VMAC will develop plans, collect veterans’ stories, and solicit inputs from Edmond residents on appropriate displays and recognition.

Total Raised as of June 2022: $2,156.00


Veteran Recognition Form
Donate Online www.edmondok.gov/vmac 1.8 Click Here for Main Directory
www.edmondok.gov/vmac
LUMINANCE: AN ENCHANTED STROLL
Donate Online:
Since 2018, Luminance: An Enchanted Stroll has brought holiday celebrations to Edmond residents and visitors. This 3D holiday light walkthrough is a one-of-a-kind experience in Oklahoma and brings in significant economic benefits to the surrounding businesses.

To fund and increase services at this joyful holiday experience, there exists a donation and sponsorship revenue fund Sponsorships or donations are both available options.
Any contributions towards Luminance: An Enchanted Stroll go towards the event directly and are used for display purchases, display maintenance and storage, and any surrounding special events available to the public.

Become a sponsor, review benefits, or visit our website:

1.9 Click Here for Main Directory
EDMOND’S ART IN PUBLIC PLACES
ABOUT THE PROGRAM

Art in Public Places began in 2002 when the Edmond City Council committed support to enrich the Edmond community by fostering the placement of public art. The program is funded with an annual award from the City and through the generous donations of supporters. Edmond's Visual Arts Commission (VAC) oversees the purchase and placement of the art. To learn more about the Public Art program please visit our website at www.edmondok.gov/evac
DONATE ONLINE:
 “Arc of Peace” by Lorri Acott
1.10 Click Here for Main Directory
City Manager’s Budget Message
FY2023-2024BudgetMessage
Mayor Davisand Members of the City Council:
The proposed annual budget for the 2023-2024 fiscal year and the Five-Year Financial Plan for the fiscal years 2023-2024 through 2027-2028 is submitted to the Edmond City Council. This budget is developed through the leadership of the Edmond City Council, coordination with various community committees, and contributions from the dedicated City staff. The City has upheld our internal mission, Trustworthy Service through Continuous Improvement, as reflected in our eight core values of Accountability, Communication, Customer Service, Inclusion, Innovation, Integrity, Professionalism and Teamwork. This proposed budget represents guidance for the delivery of City services, support of local community agencies and ongoing programming improvements for the benefit of Edmond residents. The City approaches the coming year with cautious optimism while remaining aware of and adaptable to economic challenges that may arise due to current economic forecasts.
Overview
The total 2023-2024 proposed budgeted costs are $487,531,986. Increases this budget year include additional capital outlay and improved City employee benefits and salary schedules. The approved employee compensation and benefits package will enable the City to attract new talent and retain existing employees.
The City’ssalestaxrate fell .25%to3.75% asofDecember 31, 2022, thisreductionis due to the expiration of a temporary voter approved sales tax increase of .25%. The current combined 8.25% rate remains one of the lowest rates in the Oklahoma City metro area.
2.1
Honorable Mayor Darrell Davis Members ofthe Edmond City Council
RateBreakdown State Rate 4.500% Local Rate General Fund 2.000% 2000CIP Fund 0.750% 2017CIP Fund 0.500% Fire Fund 0.250% Police Fund 0.125% Park Tax Fund 0.125% Total Rate 8.250% Click Here for Main Directory
City Manager’s Budget Message
The City is funded primarily through sales and use tax. Collections of sales and use tax during and after the pandemic have continued to grow at a steady pace. Sales tax collections increased 8.41% over the prior fiscalyear, comparedto aconservative2% revenue projection.Usetaxcollectionsincreased16.84% overthepriorfiscalyear,comparedtoaprojectedincreaseof5%.CombinedSalesandUseTaxCollections increased 5.6% over the prior fiscal year.
Special purpose sales taxes approved by voters in 2000 continue to provide critical revenue for our Fire Public Safety Fund, Police Public Safety Fund and Capital Improvement Fund. These rates include a .25% tax dedicated to Fire Public Safety, .125% tax dedicated to Police Public Safety and .75% tax dedicated to Capital Improvements. In addition to the rates specifically dedicatedabove, the City’s Fire and Police Funds receive two-thirds of all taxrevenue designatedfor General Fund use. This equates to approximately$21.4 million to Fire and $26.3 million to Police.
Financial Health
The CPA firm of Crawford & Associates P.C. prepares a financial statement analysis tool using indicators of the City’s financial health and success. This analysis is known as the “Performeter” and is based on the previous fiscal year-end audited financial statements. For fiscal year-end 6.30.22, the overall Performeter rating was 7.5 out of a possible 10. The report noted that Edmond’s overall financial health is well above satisfactory.
The Performeterevaluates the City’s financialconditionin 3 areas:
1) Financial Position: 4.8 out of 10
Financial Position Ratings illustrate a “point in time” measure of the entity’s financial status, solvency, and liquidity. Measurements of this indicator are Unrestricted Net Position, General Fund Unassigned Fund Balance, Capital Asset Condition, Pension Plan Funding Ratio, Other PostEmployment Benefits (OPEB) Plan Funding, Assets to Debt, Current Ratio and Quick Ratio. The ranking this year is lower than normal due to the General Fund Unassigned Fund Balance ending below the statement’s minimum level due to a delay in a large reimbursement expected from Federal Emergency Management Agency (FEMA). The City incurred over $12M in expenditures from a natural disaster event in 2020. As of print date of the Performeter document, the City has not received any reimbursement of these expenditures. However, in May of 2023 the City did receive $10.8M in reimbursements from the US and Oklahoma governments. Consequently, the City’s Financial Position score will improve as a result.
2) Financial Performance:9.6out of10
Financial Performance Ratings illustrate a “look back” measure as to whether the entity’s financial position has been improving, deteriorating, or remaining steady. Measurements of this indicatorare Change inNetPosition,Interperiod Equity,Business-Type Activity’sSelf- Sufficiency, Debt Service Coverage and Sales Tax Growth. The ranking this year was very strong scoring a 10 in every measurement except Change in Net Position which scored a 8.2. This measurement is the difference between total assets and deferred outflows and total liabilities and deferred inflows. The City’s net position increased $54M or 6.4% from the prior year.
2.2
Click Here for Main Directory
City Manager’s Budget Message
3) Financial Capability:7.7 out of 10 Financial Capability Ratings illustrate a “look forward” measure of the government’s ability to obtain resources in the form of revenues or borrowing in order to finance the services its constituency requires. Measurements of this indicator are Revenue Dispersion, Debt Service Load, Bonded Debt Per Capita, Legal Debt Limit Remaining, Property Taxes Per Capita and Local Sales Tax Rate. This indicator shows that approximately 11 cents of every dollar spent on noncapital itemswasusedfor debt service,there isno bonded debt outstanding,100% ofthe general bonded debt legal limit remains, no property tax is levied, and the sales tax rate is at 4.00% (after a temporary increase). The City is in a strong position to obtain additional resources looking forward.
The annual Performeter is available for review on the City website at edmondok.gov/302/BudgetReports.
Economic Outlook
Edmond’sbudgetingprocessisaffectedbylocaleconomicsbutalsobyglobaleconomicconditions.Global economic conditions have presented several challenges to the budgeting process for FY 2023- 2024. Inflation rates approaching 4% nationally and the uncertainty surrounding a possible recession have fueled a very cautionary view of budgeted expenditures.
Recent supply-chain issues have caused realized cost increases of up to 30% on everything from fuel to equipment replacement. The City has experienced new expectations from vendors where the City is not able to secure confirmed prices on large equipment purchases due to the long turnaround times and lack of supply. This uncertainty presents very real challenges for use and replacement of necessary tools and equipment needed to provide an excellent service level to City patrons.
An additional challenge the economy has presented is workforce recruitment and retention. The City continues to monitor departmental staffing levels to avoid critical staff shortages. To address these pressing issues, this budget includes a 6.0% market adjustment for all non-police/fire staff, accelerated the step promotion structure from 17 years to 10 years, and introduced significant changes to parental leave benefitsto addressthe increasingly difficult taskof recruiting and replacing qualified staff throughout the City. The parental leave benefits changed to 8 weeks of maternity leave, 4 weeks of spouse or partner leave, 8 weeks for adoption placement, and 40 hours for foster placement.
The Oklahoma State Treasurers Office notes the Current Conditions Index was at 54.5 in May of 2023. This is down from 55.3 in April, but the outlook remains positive as numbers above 50 indicate expected expansion of the Oklahoma economy during the next three to six months.
The Oklahoma unemployment rate in May was reported as 2.9% by the U.S. Bureau of Labor Statistics. The U.S. jobless rate was listed as 3.7% for that same period. The Consumer Price Index in May set the annual inflation rate at 4.0%. The energy component of the index is down 11.7% over the year.
The City will approach FY 2023-2024 with a high level of caution and review actual expenditures frequently to maintain adequate reserves to address emergencies and shortfalls. Options the City will
2.3
Click Here for Main Directory
City Manager’s Budget Message
explore to address these new economic challenges include reviewing fees and charges, decreasing expenditures and aligning priorities with current economic trends.
Possible revenue sources include seeking alternative sources such as increased grant assistance, development impact fees, and evaluation of internal departments level of self-sufficiency through rate studies. Aggressive expenditure practices include more frequent evaluationof budget (staying within the budgeted expenditures), evaluation of non-essential expenditures, timing of capital project expenditures and delay of expenditures to maintain necessary liquidity levels. Focus on staffing levels to provide essential City services and maintenance of adequate reserves to cover unexpected emergencies and shortfalls will be a priority.
Financial Plan General Fund
A major sourceof funding for the General Fund is Sales and Use tax.
Sales and Use tax revenues are budgeted conservatively due to the volatile nature of this type of tax. Historically, Edmond has seen steady growth in sales and use tax collections for decades. FY 2023-2024 sales tax growth is estimated at 2% and use tax growth is estimated at 5%. Long term sales and use tax revenues have been estimated at 2% and 5% respectively for forecasted years 2023-2024 through 20272028.
The City does not levy or receive property tax. A property tax is not available to fund operations in Oklahoma. Oklahoma law does allow cities to levy a property tax to fund capital projects, this is done through voter approved general obligation bonds. The City of Edmond currently does not use a property tax to fund general obligation bonds as a funding source.
The General Fund is used to finance many City departments. Expenditures for Park and Recreation, Street Maintenance & Construction, Municipal Court, Senior Citizens Center, Community Impact Support, Emergency Management, Community Image, Planning & Zoning, Festival Marketplace, Building Services, Downtown Community Center, Cemetery, City Council, and the Historical Society, are financed through the General Fund.
A formal policy was established several years ago that provides for a “preferred minimum” of 10% of General Fund sources be maintained in unassigned funds (Reserve for Emergencies and Shortfalls). At the end of the current budget year, this percentage is estimated to be 8.2% with a projected increase to 11.7% by the end of fiscal year 2023-2024. To keep these percentages in perspective however, it should be noted that we budget maximum expenditures with the assumption that all budgeted amounts will be spent, and we budget lower-than-expected revenues to present the most conservative budget estimates.
2.4
Click Here for Main Directory
City Manager’s Budget Message
LongTermGeneralFundFinancialPlan
Appropriated Funds
TheCitybudgetiscomposedof67funds.TheGeneralFundwhichismadeupof16differentdepartments, 12 Special Revenue Funds, 7 Capital Project Funds, 9 Utility Funds, 3 Other Enterprise Funds and 20 Internal Service Funds. These funds are presented in detail in the body of the budget book. The Utility Funds are the largest funds and represent over 55% of total revenue and over 37% of total expenditures.
Five-year forecasts are presented in the budget document for each fund. The impact of the long-range financial plan is to forecast projected revenues and expenditures over a long-term period using assumptions about economic conditions, future spending scenarios and other variables based on City Council strategic plans. The City considers long-term service objectives in conjunction with financial capacity to determine timing and volume of projects and improvements for the City. Strategies are developed to achieve long-term sustainability considering the government’s service objectives and financial challenges. The City bases long-term plans on historic activity, adjustments for anticipated economic challenges such as inflation, citizen input, programmatic changes, consultant recommendations, new projects desired, and priorities of the governing body.
A City Council strategic plan session isheld semi-annually. This is a public meeting that is open to citizens of Edmond and is in a setting conducive to public input. At the semi-annual sessions, priorities are reviewed,evaluated,and adjusted basedon detailed discussions and updated information, both financial and non-financial.
2.5 RevisedProposedProjectedProjectedProjectedProjected FY22-23FY23-24FY24-25FY25-26FY26-27FY27-28 Revenues78,406,23883,996,79386,073,65588,217,52490,431,06792,717,060 OtherSources5,240,89415,304,80713,529,89613,942,61614,537,43515,314,474 TotalResources83,647,13299,301,60099,603,551102,160,140104,968,502108,031,534 Expenditures12,396,70915,950,46814,816,89514,990,14915,194,15415,396,154 OtherUses9,902,13313,656,34914,071,87014,669,69115,449,97816,316,201 Transfers61,348,29069,694,78370,714,78672,500,30174,324,37076,319,179 TotalUses83,647,13299,301,60099,603,551102,160,140104,968,502108,031,534 NetSurplus(Deficit)4,661,239(1,648,458)541,974727,074912,5431,001,727 RevenueChange5.3%9.4%9.8%5.0%5.1%5.1% ExpenditureChange6.1%6.1%19.5%-6.0%2.5%2.7%
Click Here for Main Directory
City Manager’s Budget Message
Social Impact
The City supports local non-profit organizations financially through grants from our General Fund. The Community Agency Review Committee accepts, and reviews applications, then recommends recipients for awards of City grants. Funding recipients must provide a direct and distinct benefit to the City, include a properly chosen Board ofDirectors that meets at least quarterly, submit financial statement, statistical reports and have financials audited annually, provide a statement of budgetary needs, and submit for approvalthecontractservices application form.Thefinancialimpact tothe budget isroughly$2.1million:
Social Agencies $820,000
CommunityImpactGroups $622,500
Culture/Art $426,895
Guthrie/Edmond Airport $250,000
The City values the input from numerous community members and their commitment to assist in the community services for the benefit of our community at large.
Debt Service
The City currently utilizes loan proceedsto financeongoing utility servicecapitalimprovement projects and general City-wide projects. The City is allowed to utilize General Obligation (GO) Bonds but currently does not have outstanding GO debt.
The City maintains great focus on continuous improvement to utility infrastructure. The City Water and Wastewater capital projects are proactive for continuous provision of safe drinking water and an ample water supply to Edmond residents. Routine engineering studies, scheduled line replacement, and pump and well maintenance and repair are funded annually to ensure uninterrupted, quality service. New funding for water wells, water lines and a new water treatment plant has been secured. Projected costs for these projects are estimated to be over $265 million. The City has secured low-cost Oklahoma Water Resources Board (OWRB) funding along with Oklahoma State and Federal grant funding to cover the cost of these major improvements. Debt service for FY 2023-2024 is estimated at approximately $23 million that is secured by the City 2% sales tax.
The 2000 Capital Improvement Fund (CIP) has provided the primary financing for capital improvements inEdmondformany years.Through.75% sales taxinitially approved by thevotersin1996 and indefinitely extended in 2000. This fund provides approximately $17.9 million in tax revenue annually. The debt service secured by this tax is estimated to be $11.0 million or 61.3% of the sales tax collected.
CapitalImprovement
Capital improvements in the City are funded primarily by two dedicated sales tax sources. The 2000 CIP fund (discussed above) which is a .75% permanent sales tax, and the 2017 CIP fund which is .5% sales tax approve by voters in 2016. The 2016 vote approved a repurposing of the 2012 Public Safety Center tax for a ten-year period for capital projects that started in April of 2017. A Citizens Task Force identified many projects for consideration using these funds. The Capital Improvement Project (CIP) Advisory Board was then expanded to include members of this task force, and the Board now reviews and makes recommendations for projects for both capital improvement sales tax funds. Both funds are utilized to address City-wide capital needs.
Thesetwo fundscollect approximately $29 million annually. The City’s CIP Advisory Board meetsmonthly to review and make recommendations for spending, which are forwarded to City Council for consideration. As the City’s population continues to grow and as the age and amount of infrastructure increases, so do the demands on streets, parks and new facility needs across the City.
2.6
Click Here for Main Directory
City Manager’s Budget Message
Anticipated projects forthe 2000 CIP fund include:
Anticipated projects forthe 2017 CIP fund include:
The Edmond City Council meets semi-annually to review their Strategic Plan. The Council continuously reviews and adjusts the five-year plan to meet the needs and wants of the citizens of Edmond. The City has other dedicated sales tax revenue streams that contribute to capital improvements. The Park tax and the Public Safety Funds of Fire and Police each have dedicated revenue streams to help fund capital improvements.
2.7
2000CIP Funding Priorities 2023-2024 Millions Reconstruction and resurfacing of streets 3.81 Intersection improvements 2.75 Golf Course improvements 0.50 City Facility Construction 74.00 Street System improvements 3.60 Indoor Sports Complex 5.00 Cross Timbers Facility Expansion 6.05 Consulting Costs 0.38 Total 96.09
2017CIP Funding Priorities
Millions Intersection improvements 0.50 Trails 6.10 Sports Field improvements 9.05 Park improvements 1.75 Street improvements 1.00 Soccer Complex improvements 0.25 Police station at Arcadia Lake 0.70 Land Purchases 0.60 Consulting Costs 0.15 Total 20.10
2023-2024
Click Here for Main Directory
City Manager’s Budget Message
Other Capital Outlay
The Park Fund has a dedicated .125% sales tax that is used for capital improvements to parks. This fund has a 2023-2024 capital outlay budget of $1.1 million. Projects include Ted Anderson Play Structure at $0.2 million, Pelican Bay remodeling at $0.4 million, Service Blake Lighting improvements of $0.2 million, Tennis improvements of $0.1 million, Bickham-Rudkin Pond rehabilitation of $0.1 million, Hafer Trail Rebuild at $50.0 thousand, and improved signage at $8.0 thousand.
The Fire Public Safety Fund has a dedicated .25% sales tax that is primarily used for personnel and department needs. In addition, the Fire Fund receives 30% of all General Fund tax collections. From the General Fund contributions, for 2023-2024, the Fire department has scheduled construction of Fire Station #6 at $6.7 million, land purchase of future stations anticipated at $1.5 million, $0.9 million toward relocationofthe UCORadio Tower, acquisitionandreplacement of Audio/Visualequipment at$0.5 million, and planned building improvements of $0.4 million.
The Police Public Safety Fund has a dedicated .125% that is primarily used for personnel and department needs. In addition, the Police Fund receives 36.8% of all General Fund tax collections. From the General Fund contributions, for 2023-2024, the Police department has scheduled expansion, repair and improvement to the Police Training Facility of $3.6 million and $0.9 million toward relocation of the UCO Radio Tower.
Other Funds: The General Fund has budgeted $1.9 million for Senior Center updates, relocation of the UCO Radio Tower, street and alley improvements, emergency management and parks equipment, and improved signage.
The City’s Community Development Building Grant (CDBG) Fund has budgeted over $1 million for rehabilitation, publicservice, andpublicworks capitaloutlay.Thisfundis fundedprimarily through grants but is also supplemented by the General Fund.
The Cityhas receivedapproximately $12million inAmerican RescuePlanAct(ARPA)moneyandisinvesting in mental health, public safety, and open space improvements.
The City has committed $200,000 to support unique art in the City. City Ordinance provides for “a means to fund the acquisition of works of art by the City, which art shall become the City’s collection, to create a Visual Arts Commission (VAC), to provide a means to select works of art for the collection, to provide for the display of the collections and to provide for the maintenance and repair of the work of art in the collection”. The Art in Public Places Fund receives donations from individuals, corporations, civic clubs, and City of Edmond funds. The VAC approves private donations, and the City matches one- half of the cost of an art piece up to $30,000 per piece.
The Edmond Public Works Authority provides electric, water and solid waste services to the City. Total capital outlay for 2023-2024 for the Authority is estimated at over $35 million. Funding for these capital improvements comes from a combination of loan proceeds and utility rates.
A detailed analysis of all capital outlay by fund and a summary of total capital outlay are included in the budget book.
2.8
Click Here for Main Directory
City Manager’s Budget Message

Operating Cost Coordination
Infrastructure maintenance and improvements are continuously reviewed to maintain the qualityof- life Edmond residents expect. CIP funding capacity is leveraged to interact with the operating budget in a way that improves infrastructure conditions and reduces maintenance costs in the operating budget. The Edmond Public Works Authority performs regular rate studies to balance consumer rates while maintaining state of the art electric and water infrastructure. Regular maintenanceof streets, intersection improvements andcommunity partnershipshelp maintainthe lowest cost effect on the operating budget.
Conclusion:
The City of Edmond is experiencing lingering effects of the global pandemic and the resulting economic challenges. Due to Federal funding sources in the form of CARES funding, ARPA reimbursementsandincreasedlocalspendingfrom remoteworkplacerelocation,Edmondhasseen continued revenue growth. At the same time, City staff has remained dedicated to providing high quality services to the City while carefully considering economic sustainability. Recent economic recovery has allowed our City to continue to see growth in population and revenues. The economic outlook is cautious due to expiration of ARPA funding in 2024, escalating inflation rates, supply chain issues and the possibility of recession in the near future. However, steady growth in our normal funding sources, community support for City excellence, and perseverance to maintain transparency in operation of the City, has allowed Edmond to remain a desirable City that provides quality services to residents and the solid financial foundation necessary to continue to meet their expectations. I want to especially thank our City Council who supportedour efforts and strategy for Edmond becoming an employer of choice in enhancing our benefits for our employees. Employees are the true life blood of our City government. I also want to thank our citizens who serve on our various committees for providing excellent perspective and recommendations to Council, as well as our excellent staff who have worked tirelessly on the development of this budget.
Respectfully submitted,
2.9
Click Here for Main Directory
BUDGET IN BRIEF
FY 2024 ADOPTED OPERATING BUDGET
REVENUES
The adopted revenue total for the City in FY 2024 is $343,474,611. The following chart shows adopted revenues for each of the City’s major operating funds. Nonmajor fund revenues are also listed here as a lump sum.
The adopted expenditure total for FY 2024 is $487,531,986. The following chart shows adopted expenditure levels for each of the City’s major operating funds. Nonmajor fund expenditures are also listed here as a lump sum.
EXPENDITURES
General Government, $83,990,325 Fire Public Safety Tax Fund, $6,242,403 Police Public Safety Tax Fund, $3,707,993 2000 Cap. Improvements Tax Fund, $20,942,102 Electric Fund, $106,880,772 Water Fund, $41,094,110 Wastewater Fund, $26,517,940 Nonmajor Funds, $54,098,966 % of Total Revenues by Major Fund General Government, 85,976,830 Fire Public Safety Tax Fund, 34,962,245 Police Public Safety Tax Fund, 31,045,285 2000 Cap. Improvements Tax Fund, 106,503,231 Electric Fund, 97,085,154 Water Fund, 38,781,008 Wastewater Fund, 25,020,064 Nonmajor Funds, 68,158,169 % of Total Expenses by Major Fund % of Total Revenues by Major Fund Revenues: % of Total: General Government $83,990,325 24% Fire Public Safety Tax Fund $6,242,400 2% Police Public Safety Tax Fund $3,707,993 1% 2000 Cap. Improvements Tax Fund $20,942,102. 6% Electric Fund $106,880,772 31% Water Fund $41,094,110 12% Wastewater Fund $26,517,940 8% Nonmajor Funds $54,098,966 16% 343,474,611 100% % of Total Expenses by Major Fund Expenses: % of Total: General Government 85,976,830 18% Fire Public Safety Tax Fund 34,962,245 7% Police Public Safety Tax Fund 31,045,285 6% 2000 Cap. Improvements Tax Fund 106,503,231 22% Electric Fund 97,085,154 20% Water Fund 38,781,008 8% Wastewater Fund 25,020,064 5% Nonmajor Funds 68,158,169 14% Total Expenditures 487,531,986 100% 2.10 Click Here for Main Directory
BUDGET IN BRIEF (cont.)
FY 2024 ADOPTED GENERAL FUND REVENUES
The City collects revenue from various sources, including taxes, charges for services, and other revenue types. Taxes specifically account for 85.0% of total projected General Fund revenue Edmond does not assess any property taxes unless there is a judgment against the City per State Statute; however, the City collects sales, use, franchise, lodging and liquor taxes. In FY 2023, a thriving retail economy resulted in more sales tax being collected than was projected. In FY 2024, the City expects to collect an estimated $71,427,362 in total taxes, with $51.8 million of that coming from sales tax alone.
General Fund Sales Tax
The remaining 15% of projected revenues come from non-tax sources. Collected Charges for Services are projected to be $6,646,907, which includes services such as right of way fees, recreational programs, and other services. Permits collected by the City’s City Clerk and Building departments are another major source of revenue, and inter-governmental transfers from federal, county, and state governments provide further revenue for the City.
Sales Tax, 51,887,534 Use Tax, 17,850,914 Franchise Tax, 1,657,773 Liquor Tax, 31,141
Collections Taxes $71,427,362 Inter-governmental $1,773,907 Licenses & Permits $2,504,658 Fines & Forfeitures $1,151,094 Charges for Services $6,646,907 Interest $56,468 Miscellaneous Revenue $436,397 Other $12,569,431 % of Total Revenues
Sales Tax 51,887,534 61.8% Use Tax 17,850,914 21.3% Franchise Tax 1,657,773 2.0% Liquor Tax 31,141 0.04% Detail of Tax Collections: General Fund Sales Tax Collections % of Total Revenue: 2.11 Click Here for Main Directory
by Type -General Fund
SALES TAXES $51.9 MILLION, 61.8% OF GENERAL FUND REVENUES
The largest single revenue source for the General Fund is sales tax. In FY 2023, this revenue represents 61.8% of General Fund revenues, down from 59.8% in FY 2023 and from 60.9% in FY 2022. In FY 2023, the City exceeded its budgeted $45.9 million sales tax revenue and has budgeted $51.9 in revenue in FY 2024.
The Oklahoma state tax rate is 4.50%, and the local tax rate is 3.75%, totaling 8.25%. Collected sales tax is allocated to various funds in addition to the General Fund. Allocation percentages are listed in the chart to the right.
OTHER TAXES $19.6 MILLION, 23.3% OF GENERAL FUND REVENUES
Use tax is another large source of General Fund revenue. Use tax is collected on items purchased for use in Oklahoma from retailers who do not collect Oklahoma sales tax. It is paid by the buyer when the Oklahoma sales tax is not collected by the seller. This includes purchases made from an out-of-state retailer whether by mail order, catalog, television shopping networks, radio, internet, and so on. FY 2024 budgets $17.9 million for General Fund use taxes, up from $16.4 million budgeted in FY 2023 and $14.5 million received in FY 2022. These budgeted revenues account for 21.3% of total General Fund projected revenues.
Franchise tax and Liquor tax make up the remaining 2.04% of budgeted tax receipts for FY 2024. Franchise taxes, totaling $1.7 million, are assessed for private use of public property, and liquor tax, which is assessed on sales of alcoholic beverages sold by distributors, makes up roughly $31,000 in tax revenue.
BUDGET IN BRIEF (cont.)
REVENUE SOURCES Prior Year Actual Adopted Year Budget Current Year Revised BUDGET YEAR FY 21-22 FY 22-23 FY 22-23 FY 23-24 TAXES Sales Tax $44,081,674 $45,890,670 $46,498,762 $51,887,534 Use Tax $15,769,220 $16,450,123 $17,616,963 $17,850,914 Franchise Tax $2,009,504 $1,678,613 $2,082,384 $1,657,773 Liquor Tax $146,647 $69,109 $22,875 $31,141 Sub-Total $62,007,045 $64,088,515 $66,220,984 $71,427,362 State Rate 4.50% Local Rate 3.75% General Fund 2.000% 2000 CIP Fund .750% 2017 CIP Fund .500% Fire Fund .250% Police Fund .125% Park Tax Fund .125% 2.12 Click Here for Main Directory
BUDGET IN BRIEF (cont.)
OTHER REVENUES $12.6 MILLION, 15% OF GENERAL FUND REVENUES
Right-of-Way fees are paid by utilities for the use of public space to provide utility services. Revenues are transferred from the City’s Electric, Water, and Wastewater departments at a rate of 3.8% of the departments’ charges for services revenue. The City budgets $6.0 million for General Fund right-of-way revenues in FY 2024, up from $5.9 budgeted in FY 2023. These fees account for 7.1% of total General Fund revenues. The City expects to receive an additional $0.7 million in other charges for services, including recreational program fees, cemetery fees, emergency 911 fees, and filing fees, and more. These other charges for services make up another 0.8% of total General Fund revenues.
Fines & forfeitures collected by the City’s Court; inter-governmental transfers in the form of grants, alcohol beverage & cigarette tax transfers from Oklahoma County, and vehicle & gas tax transfers from the State of Oklahoma; licenses & permits collected by the City Clerk, Building, and Code Enforcement departments; interest; and miscellaneous revenue make up the remainder of the General Fund revenue, accounting for the final 7.0% of revenues.
OTHER FUNDS
This section provides a brief financial overview of some of the City’s other fund types for FY 2024. These funds will be discussed in more detail in the following sections.
Special Revenue Funds – including Senior Citizens, Community Development Block Grant (CDBG), Asset Forfeiture, Emergency Medical Services Authority (EMSA), Fire, Police, Visit Edmond, American Rescue Plan Act (ARPA), Real Property, and Hospital Sale Trust funds. Total estimated resources (beginning fund balances and revenues) are $70.5 million, expenditures are ($76.4) million, and net transfers are $42.2 million.
Capital Projects Funds – including Park Tax, Cemetery Care, Art in Public Places, Cemetery Perpetual Care, Capital Improvements, Roadway Improvements, 1996 Capital Improvements, 2012 Capital Improvements, and 2017 Capital Improvements funds. Total estimated resources are $154.8 million, expenditures are ($129.9) million, and net transfers are ($3.9) million.
Utility Funds – including Revenue Bonds, Electric, Water, Solid Waste, Wastewater, Public Works Authority (PWA) Sewer Impact, Lake Arcadia, Drainage, and PWA Economic Development. Total estimated resources are $190.1 million, expenditures are ($184.3) million, and net transfers are ($25.2) million.
Other Enterprise Funds – including Golf, YourGovShop, and Citylink. Total estimated resources are $4.0 million, expenditures are ($6.1) million, and net transfers are $2.1 million.
Internal Service Funds – including Risk, Workers Compensation, Employee Group Insurance, Vehicle Maintenance, Administrative Support (General Government, City Treasurer, City Manager, Central Communications, Management Information Systems, Financial Services, Human Resources, City Clerk, Facility Maintenance, Legal, Engineering, Marketing, Public Works Administration, Operations Central Warehouse, Utility Customer Service), Fleet Management, and Field Services. Total estimated resources are $15.7 million, expenditures are ($74.9) million, and net transfers are $54.6 million.
2.13 Click Here for Main Directory
Strategic Plan – Initiatives, Goals and Objectives
Strategic planning is a process for continuous improvement within the City of Edmond. A common vision for staff is identified through our strategic plan.
Our current strategic initiatives were developed leading up to the commencement of fiscal year 2018. This was the year that our current strategic planning process began to take shape. The City of Edmond has 12 key strategic initiatives that align practices of various departments. Departments take ownership in setting goals that achieve these initiatives. Each quarter, progress reports are developed to communicate success of departments on their goals. We strive to make it an inclusive process, sharing information with all employees and encouraging feedback from staff in setting departmental goals.
Strategic Initiatives are the consistent priorities identified within the City. Goals are the projects or benchmarks identified to achieve those strategic initiatives on a departmental level. Objectives are the individual steps identified to achieve departmental goals.
The following pages list the 12 key strategic initiatives and the goals that the Strategic team developed with the assistance with staff across the city departments. To find what each department is working on to achieve these city wide initiatives, review the Strategic Initiatives and Performance Matrix starting on page 2.16 and ending on page 2.22 as there is a list of goals and performance measures to let you know that each department is stepping up to the bar and working to accomplish what the City has laid out in this plan.
2.14 Click Here for Main Directory
Economic DevelopmentSupport Commercial and residential development through Improving the Review Process

Economic DevelopmentRevitalize and encourage Development of Commercial areas.
Financial ResponsibilityPromote Fiscal Stability by increasing efficiencies, mitigating costs, identifying new revenue opportunities, and exploring internal and external financial partnerships.


Environmental Stewardship- Encourage environmentally sustainable behavior through public education and outreach to support an increase in resource conservation and a decrease in land fill waste

High Performing Government – Recruit, retain, and develop a skilled, diverse, and inclusive workforce.


Environmental Stewardship– Protect our natural resources through promotion and enhancement of green infrastructure


High Performing Government- Utilize technology and software in a manner that boosts efficiency, increases transparency, and fosters innovation.
Infrastructure – Plan, design, implement, and maintain transportation infrastructure that allows easy connections throughout the city and between different modes of transportation.
High Performing Government- Improve Communication and collaboration throughout the organization.

Infrastructure – Give the same level of importance and attention to the maintenance of infrastructure as to new infrastructure.
Quality of Life – Plan, design, implement, and maintain improvements to cultural and recreational facilities, and programs to enhance resident and visitor satisfaction.
Safe Community – Support a save and inclusive environment for all Edmond employees and citizens.

2.15 Click Here for Main Directory
implement, and maintain improvements to cultural and recreational facilities, and programs to enhance resident and visitor satisfaction.
and implement a process that provides individuals an opportunity to resolve their outstanding balance prior to being submitted to the collection agency
and implement other options of communication betweenthe Court & the clientele we handle.
Increase capability and ensure that all Departments can contact employees during emergency or crisis situations by conducting an annual call down drill.
Secure Funds through the Cares Act, FEMA reimbursements and EMPG
ECONOMIC DEVELOPMENT ENVIROMENTAL STEWARDSHIP FINANCIAL RESPONSIBILITY HIGH PERFMORMING GOVERNMENT INFRASTRUCTURE QUALITY OF LIFE SAFE COMMUNITY Service Fund: General Fund Specifications 9.23. Selection of designbuilder 12/23. 100% plans by 1/24. 6/30/2024N/AN/AN/A100% Develop specificatios and conceptual plan for 1.25 miles of trail improvents at Hafer. 6/30/2024N/AN/A N/A 1.25 Install Shade at leat 4 Structures at Edmond Center Court Tennis Facility. 6/30/2024N/AN/A N/A 4 Apply for at least 2 major grants to support planned projects. 6/30/2024N/AN/A N/A 2 Complete a market analsyis for all Parks and Rec. fees to ensure fee are within market. 6/30/2024N/AN/A N/A 100% Increase ultization of the MAC with diverse programming options. Utilization to increase by 20% 6/30/2024N/AN/A N/A 20% Protect our natural resources through promotion and enhancement of green infrastructure. Complete an assessment for Sping Creek Stabilization. 6/30/2024N/AN/A N/A 100% Promote Fiscal Stability by increasing efficiencies, mitigating costs, identifying new revenue opportunities,
Create
6/30/20246/30/20216/30/20226/30/20236/30/2024
organization.
6/30/20246/30/20216/30/20226/30/20236/30/2024
organization.
End of calendar year. October 2020 October 2021December 2022December 31, 2023
and exploring internal and external financial partnerships.
Improve Communication and collaboration throughout the
Research
Improve Communication and collaboration throughout the
Complete updates on a quarterly basis. Comleted June 2021 Completed June 2022 Completed June 2023 Complete by June 2024
Grants. Cares Act and EMPG Grant Funds Received. Cares Act and EMPG Grant Funds Received. FEMA Disasater Recovery, Cares Act, and EMPG Grant Funds Received. EMPG Funds expected in fall of 2023 Plan, design,
Support a save and inclusive environment for all Edmond employees and citizens. Improve Communication and collaboration throughout the organization. Develop a limb drop-off area procedure by early June 2022. 6/30/2024N/AN/A6/30/20246/30/2024 Utilize technology and software in a manner that boosts efficiency, increases transparency, and fosters innovation. By end of FY23, use of tree management software is to have been implemented. 6/30/2024N/AN/A6/30/20246/30/2024 Continue implementation of the Downtown Master Plan N/A N/A Update CBD and DRD Ordinances (Completed 11/2022) Encourage development in TIF District by releasing RFQ for vacant City properties Encourage development in TIF District by releasing RFQ for vacant City properties Utilize recommendations from the ULI Study to enhance pedestrian safety and improve linkages across major roadways. 2025 N/AN/A Have designs underway for pedestrian improvements downtown. Have funding identified for projects. Plan, design, implement, and maintain transportation infrastructure that allows easy connections throughout the city and between different modes of transportation. Improve the safety and comfort of users of all modes of mobility. Fall 2024N/AN/A Modify Title 21 to include new road standards Adopt Changes to Title 21 via Code Update Promote Fiscal Stability by increasing efficiencies, mitigating costs, identifying new revenue opportunities, and exploring internal and external financial partnerships Increase weekly vendor participationby 35% Yearly N/A N/A N/A 35% Revitalize and encourage Development of Commercial areas. Increase the number of shoppers by 15% through strategic marketing efforts. 6/30/2024N/AN/A N/A 15% Recruit, retain, and develop a skilled, diverse, and inclusive workforce. Work with local school to create an internship program. 6/30/2024N/AN/A N/A 1 intern Support commercial and residential development through improving the review process. Improve Building and Fire Code Service’s team member communication with the site plan review team to clarify requirements and expectations for all departments involved with the site plan process OngoingOngoingOngoingOngoing Ongoing Utilize technology and software in a manner that boosts efficiency, increases transparency, and fosters innovation. Prepare and train for conversion to on-line portal site (PLL) for the submissions of plan review, permitting, inspections, and trade license process OngoingOngoingOngoingOngoing Ongoing Municipal Court Services FY 2023 Projected FY 2024 Goal Strategic Goals Core Service PERFORMANCE MEASURE TIMEFRAME FOR COMPLETION FY 2021 Actual FY 2022 Actual Parks and Recreation Plan, design, implement, and maintain improvements to cultural and recreational facilities, and programs to enhance resident and visitor satisfaction. Promote Fiscal Stability by increasing efficiencies, mitigating costs, identifying new revenue opportunities, and exploring internal and external financial partnerships. Emergency Management Community Image Planning Revitalize and encourage Development of Commercial areas. Building and Firecode Services Festival Marketplace 2.16 Click Here for Main Directory
Promote Fiscal Stability by increasing efficiencies, mitigating costs, identifying new revenue opportunities, and exploring internal and external financial partnerships.
Seek alternate funding sources for operations, special projects, and unanticipated events in an effort to mitigate direct costs to the City.
Updated planting plan was implemented in October 2022. 6/30/2024N/AN/A6/30/20246/30/2024
We will assess our personnel and equipment needs and apply for grant opportunities as often as appropriate.
We will place our second 2-person squad in service.
We will explore a public/private partnership for necessary future upgrades to our Children’s Safety Village.
We will work collaboratively with the agency selected to provide ambulance transport in our city.
We will award the contract for Fire Station #6 and begin construction.
We will seek to secure property for future fire stations.
We will replace outdated security access control systems at Fire Stations #4,#5 and Fire Administration.
We will replace the SCBA compressor systems at Station #1 and the Fire Training Center.
We will complete an architectural study to examine the feasibility and cost estimate of a future major renovation of Station #1.
EC ONOMIC DEVELOPMENT ENVIROMENTAL STEWARDSHIP FINANCIAL RESPONSIBILITY HIGH PERFMORMING GOVERNMENT INFRASTRUCTURE QUALITY OF LIFE SAFE COMMUNITY Service Fund: Special Revenue Fund Develop a plan to fund and execute the growth of the meal program. 2024 N/A N/A N/A 2024 Increase art and education programs for senior citizens. 2024 N/A N/A N/A 2024 Encourage and support sustainability efforts that preserve and protect the environment for future generations by implementing solutions to meet need identified by community mental health needs assessment. Yearly goalYearly goalYearly goalYearly goalYearly Goal Conduct an assessment of housing options available in Edmond to determine gaps. N/A N/A N/AYearly GoalYearly Goal Conduct evaluation of HCD Programming to ensure programming meet community needs,
allocate resources effectively based on the evaluation results. N/A 2021202220232024 Promote Fiscal Stability by increasing efficiencies, mitigating costs, identifying new revenue opportunities, and exploring internal and external financial partnerships. Implement grant Administration Policies with city departments N/A N/A N/A N/A 2024
and
6/30/20246/30/20216/30/20226/30/20236/30/2024
7/1/2023 N/A N/A7/1/20237/1/2023
6/30/2024 N/A N/A N/A6/30/2024
6/30/2024 N/A N/A N/A6/30/2024
9/1/2023 N/A N/A N/A9/1/2023
6/30/2024 N/A N/A N/A6/30/2024
6/30/2024 N/A N/A N/A6/30/2024
6/30/2024 N/A N/A N/A6/30/2024
10/1/2023 N/A N/A N/A6/30/2024 Recruit, retain, and develop a skilled, diverse, and inclusive workforce. Graduate Police Academy 9/1/20239/1/20209/1/20219/1/20229/1/2023 Plan, design, implement, and maintain improvements to cultural and recreational facilities, and programs to enhance resident and visitor satisfaction. Conduct
Cop events, participate in COPLC Neighbor’s Night Out, monitor social media metrics. 6/30/2024 N/A N/A 1 1 Formalize routine response plans for homeless people and engagement opportunities with people suffering with mental illness. 6/30/2024 N/A N/A Preliminary Discussions Start implementing plan Design and bid the project to construct a police facility at Arcadia Lake 6/30/2025 N/A N/A Preliminary Discussions Start design contract Promote Fiscal Stability by increasing efficiencies, mitigating costs, identifying new revenue opportunities, and exploring internal and external financial partnerships. Bring revenue to Edmond through increased lodging tax 6/30/2024 487,155 711,437 750,000 840,000 Plan, design, implement, and maintain improvements to cultural and recreational facilities, and programs to enhance resident and visitor satisfaction. Welcome Groups and Visitors to Edmond 6/30/2024 N/A N/A N/A6/30/2024 Visit Edmond Police Department Give the same level of importance and attention to the maintenance of infrastructure as to new infrastructure. Support a safe and inclusive environment for all Edmond employees and citizens. Fire Department Support a safe and inclusive environment for all Edmond employees and citizens. Promote Fiscal Stability by increasing efficiencies, mitigating costs, identifying new revenue opportunities, and exploring internal and external financial partnerships. Community Development Support a safe and inclusive environment for all Edmond employees and citizens. FY 2022 Actual FY 2023 Projected FY 2024 Goal Senior Citizen Center Plan, design, implement, and maintain improvements to cultural and recreational facilities, and programs to enhance resident and visitor satisfaction. Core Service Strategic Goals PERFORMANCE MEASURE TIMEFRAME FOR COMPLETION FY 2021 Actual 2.17 Click Here for Main Directory
at least one Citizens Police Academy, Conduct bi-monthly Coffee with a
Give the same level of importance and attention to the maintenance of infrastructure as to new infrastructure.
Plan, design, implement, and maintain transportation infrastructure that allows easy connections throughout the city and between different modes of transportation.
Promote Fiscal Stability by increasing efficiencies, mitigating costs, identifying new revenue opportunities, and exploring internal and external financial partnerships.
Recruit, retain, and develop a skilled, diverse, and inclusive workforce.
Complete electric Smart Choice meter installations.
Support city improvement road widening projects: Danforth/Kelly, Sooner/Covell, Main/Boulevard, and Covell/Coltrane.
6/30/2024N/AN/AN/A6/30/2024
Water Resources Fund
Arcadia
Recruit,
transparency, and fosters
6/30/20230%50%100%100%
Ongoing100%100%100%100%
OngoingN/AN/AN/A100%
10/1/2024N/AN/AN/A80%
6/30/202425%25%75%100%
innovation. Develop a paperless work order process 6/30/20245%5%50%100% Establish New Hire Training Program6/30/202425%50%75%100% Improvement Opportunity Program for Employees 6/30/20230%50%100%100%
Support Commercial and residential development through Improving the Review Process.
Install a new pavilion at Carl Reherman Park
Install a new playground for Carl Reherman Park
6/1/20250%0%0%75%
ECONOMIC DEVELOPMENT ENVIROMENTAL STEWARDSHIP FINANCIAL RESPONSIBILITY HIGH PERFMORMING GOVERNMENT INFRASTRUCTURE QUALITY OF LIFE SAFE COMMUNITY Service Fund: Edmond
Public Works Autority (EPWA) Utility Funds
12/30/2023N/AN/A 29,000 Installs 19,000 Installs
6/30/2025N/AN/AIn ProcessIn Process
Partner with OMPA to reduce peak demand and wholesale power cost.
Establish New Hire Training Program6/30/202425%50%75%100% Improvement Opportunity Program for Employees
Maintain existing infrastructure utilizing reliability centered maintenance through pro-active maintenance.
Regularly inform residents and organization on out website of improvements to capacity and longevity of the water and wastewater systems.
Support a save and inclusive environment for all Edmond employees and citizens.
Develop plan for new requirements from the Environmental Protection Agency (EPA) for lead service line inventory.
Give the same level of importance and attention to the maintenance of infrastructure as to new infrastructure.
Develop overarching asset management policy
Ongoing100%100%100%100%
OngoingN/AN/AN/A100%
Utilize technology and software in a manner that boosts efficiency, increases
Maintain existing infrastructure utilizing reliability centered maintenance through pro-active maintenance.
Regularly inform residents and organization on out website of improvements to capacity and longevity of the water and wastewater systems.
10/1/2024N/AN/AN/A80%
11/30/2023N/AN/A Design and Construct Complete
3/31/2024N/AN/A Design and Construct Complete Update
Construction
6/1/20250%0%0%75% Preparation
6/1/20240%0%0%75%
Support a save and inclusive environment for all Edmond employees and citizens.
Develop plan for new requirements from the Environmental Protection Agency (EPA) for lead service line inventory.
Standard Specifications for
and General Construction Drawings.
and implementation of online permit submissions for Engineering Work Orders and OKR10.
Encourage environmentally sustainable behavior through public education and outreach to support an increase in resource conservation and a decrease in land fill waste.
Drainage Utility Fund
Solid Waste Fund Wastewater Resources Fund
Digitize current records retained in paper form and implement new structure for network folders.
Lake Fund Plan, design, implement, and maintain improvements to cultural and recreational facilities, and programs to enhance resident and visitor satisfaction.
retain, and develop a skilled, diverse, and inclusive workforce.
Give the same level of importance and attention to the maintenance of infrastructure as to new infrastructure.
FY 2022 Actual FY 2023 Projected FY 2024 Goal Edmond Electric Core Service Strategic Goals PERFORMANCE MEASURE TIMEFRAME FOR COMPLETION FY 2021 Actual 2.18 Click Here for Main Directory
Give the same level of importance and attention to the maintenance of infrastructure as to new infrastructure.
Strategic Goals PERFORMANCE MEASURE TIMEFRAME FOR COMPLETION
FY 2021 Actual
KickingBird Golf Club*
Revitalize and encourage Development of Commercial areas.
Plan, design, implement, and maintain improvements to cultural and recreational facilities, and programs to enhance resident and visitor satisfaction.
City-Link
Revitalize and encourage Development of Commercial areas.
Transportation
* KickingBird Golf Club has been closed for clubhouse and green construction for the past two years, leading to the inability to track normal metrics and statistics.
ECONOMIC DEVELOPMENT ENVIROMENTAL STEWARDSHIP FINANCIAL RESPONSIBILITY HIGH PERFMORMING GOVERNMENT INFRASTRUCTURE QUALITY OF LIFE SAFE COMMUNITY Service Fund: Other Enterprise Funds Number of Paid Rounds Played 7/1/23-6/30/24 40,795022042,000 Dollar Per Paid Player Revenue 7/1/23-6/30/24 56.640066.89 Number of Range Tokes Sold 7/1/23-6/30/24 64,7310065,000 Number of Golf Tournaments Hosted Requiring Overnight Stays 7/1/23-6/30/244005 or more Increase the Number of Non-Golf Events Held Each Year that Bring in Out of Town Guests. 7/1/23-6/30/241002 or more Number of Non-Golf Community Events Hosted 6/30/20241002 or more Create One New Growth of the Game Activity 6/30/20240001 Amount of Money Raised to Benefit the Community or Non-Profits through Golf Tournaments Held. Estimate of 250,000000 More than $250,000 Explore feasibility of alternate funding for transportation project needs Yearly Goal2021202220232024 Support efforts of Regional Transit Authority’s commuter rail project. Yearly Goal2021202220232024 Support the implementation of EdmondShift Recommendations. Yearly Goal2021202220232024
FY 2022 Actual FY 2023 Projected FY 2024 Goal
Promote Fiscal Stability by increasing efficiencies, mitigating costs, identifying new revenue opportunities, and exploring internal and external financial partnerships. Core Service
Public
2.19 Click Here for Main Directory
ECONOMIC DEVELOPMENT ENVIROMENTAL STEWARDSHIP FINANCIAL RESPONSIBILITY HIGH PERFMORMING GOVERNMENT INFRASTRUCTURE QUALITY OF LIFE SAFE COMMUNITY Service Fund: Internal Services Fund Obtain multiple lines of insurance from A rated insurance companies with the lowest deductible/retention available and with the best pricing. 6/23/20246/30/20216/30/20226/30/2023 6/30/2024 Collect on 88% of eligilble Subrogation claims 6/23/2024 97% 82% 85% 88% Improve Communication and collaboration throughout the organization. Create and post Monthly safety bulletins for all employees. Send out quarterly safety reports to Department Heads 6/23/2024 12 12 24 36 Give the same level of importance and attention to the maintenance of infrastructure as to new infrastructure. Develop overarching asset management policy 6/30/2024 25% 25% 75% 100% Utilize technology and software in a manner that boosts efficiency, increases transparency, and fosters innovation. Develop a paperless work order process6/30/2024 5% 5% 50% 100% Give the same level of importance and attention to the maintenance of infrastructure as to new infrastructure. Develop overarching asset management policy 6/30/2024 25% 25% 75% 100% Utilize technology and software in a manner that boosts efficiency, increases transparency, and fosters innovation. Develop a paperless work order process6/30/2024 5% 5% 50% 100% Give the same level of importance and attention to the maintenance of infrastructure as to new infrastructure. Develop overarching asset management policy 6/30/2024 25% 25% 75% 100% Utilize technology and software in a manner that boosts efficiency, increases transparency, and fosters innovation. Develop a paperless work order process6/30/2024 5% 5% 50% 100% Promote Fiscal Stability by increasing efficiencies, mitigating costs, identifying new revenue opportunities, and exploring internal and external financial partnerships. Explore funding alternatives for transportation needs. 6/30/2024 N/A N/A Staff continues research and discussions of alternative funding sources 6/30/2024 Revitalize and encourage Development of Commercial areas. Guide and support the implementation of the ULI Adviosry Services Panel Study recommendations Ongoing – will be a 20 year process. N/A N/A Ongoing – will be a 20 year process. Ongoing – will be a 20 year process. Improve Communication and collaboration throughout the organization. Transfer City Council Agenda Management to the City Clerk’s Office 6/30/2024 N/A N/A Staff has started the collaborative planning and research efforts in preparation for transfer. 6/30/2024 Support a save and inclusive environment for all Edmond employees and citizens. Process incoming emergency calls for service and have them ready for dispatch within 30 seconds and dispatch emergency calls for servicethat are ready for dispatch within 30 seconds. Weekly Reports Call Taking: 19.61 Distatching: 19.71 Call Taking: 19.30 Dispatching: 19.42 Call Taking: 20 Dispatching: 20 Call Taking: 30 Dispatching: 30 Compliance Supervisor will evaluate 5 calls per month for each employee utilizing the departments established QA program to ensure service meets established standards. Rating of 92% is goal. Monthly N/A N/A 96% 92% Ensure Comm. Center compliance to the latest industry standards by obtaining P33 certification for the training program. Begin Process by July 1, 2023 N/A N/A N/A Begin by July 1, 2023 Utilize technology and software in a manner that boosts efficiency, increases transparency, and fosters innovation. Implement Pilot Project of Virtual Desktop Infrastructure (VDI) 6/30/2024 N/A N/A N/A Projected Completion Establish Clear Roles and Responsibilities for the Project Management Office (PMO), creating processes and procedures for the PMO to ensure consistency and accuracy in project management 6/30/2024 N/A N/A Prelminary Discussion Project Polices and Procedures in place Perform a Risk Management Assessment to include a Business Impact Analysis. 6/30/2024 N/A Preliminary Discussion Obtain QuotesProjected Completion Give the same level of importance and attention to the maintenance of infrastructure as to new infrastructure. Adding, Upgrading and Replacing Blade Servers, switches and firewalls – through lifecycle management providing reliable and secure access to the City’s enterprise technology environment. Annually Initiated identification of life cylces Added and replaced Storage Area network/ Added and Identified Switch & blade server replacement Purchased and replacing majority of blade servers and identified additional switch replacement Complete replacement of blade servers, purchase switch & firewall replacement , projected installation dependent on supply Vehicle Maintenance FY 2022 Actual FY 2023 Projected FY 2024 Goal Risk Management Services Promote Fiscal Stability by increasing efficiencies, mitigating costs, identifying new revenue opportunities, and exploring internal and external financial partnerships. Core Service Strategic Goals PERFORMANCE MEASURE TIMEFRAME FOR COMPLETION FY 2021 Actual Public Works Field Services Fleet Management Recruit, retain, and develop a skilled, diverse, and inclusive workforce. City Manager Public Safety Communications Information Technology Improve Communication and collaboration throughout the organization. 2.20 Click Here for Main Directory
ECONOMIC DEVELOPMENT ENVIROMENTAL STEWARDSHIP FINANCIAL RESPONSIBILITY HIGH PERFMORMING GOVERNMENT INFRASTRUCTURE QUALITY OF LIFE SAFE COMMUNITY Service Fund: Internal Services Fund Recruit, retain, and develop a skilled, diverse, and inclusive workforce. Promote professional development of the Finance department. 6/30/2024 N/A Training New Hires as well as cross training Training New Hires as well as cross training Training New Hires as well as cross training Promote Fiscal Stability by increasing efficiencies, mitigating costs, identifying new revenue opportunities, and exploring internal and external financial partnerships. Address efficiencies of financial business processes. 6/30/2024 N/A N/A N/A Reviewing Processes and finding new ways to make them more efficient. Improve Communication and collaboration throughout the organization. Create training materials & document policies & procedures for Finance-related processes. 6/30/2024 N/A N/A Made and revised instruction material as well as training materials Continuing to make revise instruction material as well as training material, as well as making videos to better equip users in our department and City-wide Implement Human Resource Information System (HRIS). Software includes Payroll, Benefits, Recruitment, Onboarding, Performance Management, and a Learning Management System (LMS) PAYROLL 09/17/22 Perf Mngt 05/15/23 ONBOARD 05/15/23 LMS 06/01/23 RECRUIT 07/01/23 DOCUMENT TBD Workflow TBD N/A 30% 75% 100% Automate HR Applicant and New Hire Forms after capabilities of HRIS Onboarding module is determined Timeframe will be determined after HRIS / UltiPro Recruitment module is implemented N/A N/A 85% 100% Research JD software and determine if DB Comp will be replaced DB Comp License expires 08/01/2023 N/A N/A 75% 100% Enhance Job Postings, communicate first class image of COEs culture & values 7/31/2023 N/A N/A 75% 100% Transform the hiring process through implementing HRIS/ UltiPro Recruitment module 7/31/2023 N/A N/A 75% 100% Establish & Implement Supervisor Expectations in Recruiting, Hiring, and Retaining Talent 7/31/2023 N/A N/A 75% 100% Improve the City Council agenda process as it is transferred to the City Clerk’s Office, using improved routing schemes, the development of resources and training for users, and if necessary, to research other technology solutions if AgendaQuick is not sufficiently capable. 6/30/2024 N/A N/ANot yet quantifiedNot yet quantified Improve internal processes and utilization of Laserfiche software workflows and provide access to additional departments for easier capture of records, processing of appropriate metadata, and assignment of correct disposition authority 6/30/2024 N/A N/ANot yet quantifiedNot yet quantified Give the same level of importance and attention to the maintenance of infrastructure as to new infrastructure. Develop overarching asset management policy 6/30/2024 25% 25% 75% 100% Utilize technology and software in a manner that boosts efficiency, increases transparency, and fosters innovation. Develop a paperless work order process6/30/2024 5% 5% 50% 100% At least on semi-annual basis, perform reviews with Police, Court and Planning department staff. 6/30/20242 per year2 per year2 per year 2 per year On weekly basis, ensure the requests for assistance from citizens and employees have been responded to in a thorough, efficient and professional manner. 6/30/202452 per year52 per year52 per year 52 per year 52 weekly meetings: 1 with PD, 2 training sessions with HR and monthly meetings with Planning and Court. 6/30/202452 per year52 per year52 per year 52 per year Support Commercial and residential development through Improving the Review Process. Update Standard Specifications for Construction and General Construction Drawings. 6/1/2025 0% 0% 0% 75% Utilize technology and software in a manner that boosts efficiency, increases transparency, and fosters innovation. Preparation and implementation of online permit submissions for Engineering Work Orders and OKR10. 6/1/2024 0% 0% 0% 75% Encourage environmentally sustainable behavior through public education and outreach to support an increase in resource conservation and a decrease in land fill waste. Digitize current records retained in paper form and implement new structure for network folders. 6/1/2025 0% 0% 0% 75% Plan, design, implement, and maintain improvements to cultural, historical, and recreational facilities and programs to enhance resident and visitor satisfaction. Create a new streamlined process to encourage outside entities to film within Edmond. 6/30/2024 N/A N/A N/A 6/30/2024 Improve communication and collaboration throughout the organization. Create a multipage digital style guide consisting of detailed identity content for each city-used logo. 6/30/2024 N/A N/A N/A 6/30/2024 Use technology and software in a manner that boosts efficiency, increases transparency, and fosters innovation. Transition city website, email, etc. from .com domain to .gov domain to increase security. 6/30/2024 N/A N/A N/A 6/30/2024 Engineering Marketing & Public Relations Facility Maintenance Legal Services Improve communication and collaboration throughout the organization. City Clerk Utilize technology and software in a manner that boosts efficiency, increases transparency, and fosters innovation. Recruit, retain, and develop a skilled, diverse, and inclusive workforce. FY 2022 Actual FY 2023 Projected FY 2024 Goal Financial Services Human Resources Utilize technology and software in a manner that boosts efficiency, increases transparency, and fosters innovation. Core Service Strategic Goals PERFORMANCE MEASURE TIMEFRAME FOR COMPLETION FY 2021 Actual 2.21 Click Here for Main Directory
strive to meet with other departments to stay in the loop to get materials ordered for upcoming jobs, while also keeping enough stock to meet the needs of the crews to not interfere with their work
ECONOMIC DEVELOPMENT ENVIROMENTAL STEWARDSHIP FINANCIAL RESPONSIBILITY HIGH PERFMORMING GOVERNMENT INFRASTRUCTURE QUALITY OF LIFE SAFE COMMUNITY Service Fund: Internal Services Fund Give the same level of importance and attention to the maintenance of infrastructure as to new infrastructure. Develop overarching asset management policy 6/30/2024 25% 25% 75% 100% Utilize technology and software in a manner that boosts efficiency, increases transparency, and fosters innovation. Develop a paperless work order process6/30/2024 5% 5% 50% 100% We strive to greet each customer with a smile
plenty of material on
organized
quick service to our customer’s needs. OngoingOngoingOngoing Ongoing Ongoing
OngoingOngoingOngoing Ongoing Ongoing Improve Communication and collaboration throughout the organization. Reduce “Not Ready” time during peak hours. 6/30/2024 45% 32% 25% 20% Support a safe and inclusive environment for all Edmond employees and citizens. Increase participation in the EMSA Care program. 6/30/202424,90024,806 24,900 25,000 Promote Fiscal Stability by increasing efficiencies, mitigating costs, identifying new revenue opportunities, and exploring internal and external financial partnerships. Maintain a Utility Debt rate below 3%.6/30/20240.16%0.13% 0.15% <3% Utility Customer Service Public Works Administration Operations Central Warehouse Improve Communication and collaboration throughout the organization. FY 2022 Actual FY 2023 Projected FY 2024 Goal Core Service Strategic Goals PERFORMANCE MEASURE TIMEFRAME FOR COMPLETION FY 2021 Actual 2.22 Click Here for Main Directory
while keeping
hand and
for
We
schedules
City of Edmond Budget Process
Definition of the Budget Process
The budget process consists of activities that encompass the development, implementation, and evaluation of a plan for the provision of services and capital assets
Mission of the Budget Process
Our mission of the budget process is to help our decision makers make informed choices about the provision of services and capital assets and to promote stakeholder participation in the process.
Principles of the Budget Process
The budget is the product of a thoughtful, ongoing decision-making process for allocating resources and setting priorities and direction.
Principals:
1) Establish Broad Goals to Guide Government Decision Making
Broad Goals provide overall direction for the government and serve as the basis for decision making.
2) Develop Approaches to Achieve Goals
Policies, plans, programs, and management strategies are adopted to define how long-term goals are achieved. Follow compliance requirements of State authorities.
3) Develop a Budget Consistent with Approaches to Achieve Goals
A budget and financial plan that focuses on achievement of goals, within the constraints of available resources, is prepared and adopted.
4) Evaluate Performance and Adjust
Continual evaluation of program and financial performance is ongoing throughout the fiscal year and adjustments are made to progress toward achieving goals.
Elements of the Budget Process
The elements of the budget process define achievable results. These elements help translate the guiding principles into action components, they provide structure to categorize budgetary practices.
Elements:
1) Assess community needs, priorities, challenges, and opportunities
2) Identify opportunities and challenges for government services, capital assets, and management
3) Develop and disseminate broad goals.
4) Adopt financial policies.
5) Develop programmatic, operating and capital policies and plans.
6) Develop programs and services that are consistent with policies and plans.
7) Develop management strategies.
8) Develop a process for preparing and adopting a budget.
9) Develop and evaluate financial options.
10) Make choices necessary to adopt a budget.
11) Monitor, measure and evaluate performance.
12) Adjust as needed.
2.23 Click Here for Main Directory
Budget Compliance and Practices
Municipal budgets must comply with applicable State Statutes governing the budget process. Budget practices supplement existing statutes. Budget practices are put in place to specifically contribute to the development, description, understanding, implementation and evaluation of a plan for provision of services and capital assets.
City of Edmond (the city) Compliance with State Statute:
1) Title 11 of the Oklahoma State Statues (11 O.S.) is the Municipal Budget Act for the State of Oklahoma.
2) Per O.S. §11-17-205, at least thirty (30) days prior to the beginning of each fiscal year, the chief executive officer of the city prepares a budget and submits it to the governing body, the Edmond City Council.
3) Per O.S. §11-17-206, the city budget presents a complete financial plan and presents information necessary and proper to disclose the financial position and condition of the city and the revenues and expenditures thereof, both past and anticipated The budget contains:
a. A budget summary.
b. A budget message.
c. Tabular presentation of
i. Actual revenues and expenditures for the immediate prior fiscal year.
ii. Revenues and expenditures for the current fiscal year as originally adopted and amended throughout the year.
iii. Estimates of revenues and expenditures for the budget year.
d. An estimate of revenues by source which the city is legally empowered to collect and receive at the time the budget is adopted. This estimate is based on a review and analysis of past and anticipated revenues of the city. The budget of expenditures by fund shall not exceed the estimated revenues for each fund. No more than ten percent (10%) of the total budget for any fund may be budgeted for miscellaneous purposes. Amounts transferred from or to other funds may be included in the estimates.
4) Per O.S. §11-17-207, Monies received and expended are accounted for by fund.
5) Per O.S. §11-17-208, A public hearing of the proposed budget is held no later than fifteen (15) days prior to the beginning of the budget year, published not less than five (5) days before the date of the hearing.
6) Per O.S. §11-17-209. At least seven (7) days prior to the beginning of the budget year, the budget is adopted by the governing body, the Edmond City Council. The adopted budget is transmitted to the Oklahoma State Auditor within thirty (30) days after the beginning of the fiscal year of the city. This filed budget constitutes an appropriation for each fund.
7) The city complies with O.S. §11-17-210 through §11-17-216 processes which provide for public protests, limits on expenditures of funds, establishment of funds consistent with legal and operating requirements as defined, classifications of revenues and expenditures, operating reserve funds, transfers of funds and supplemental appropriations.
2.24 Click Here for Main Directory
City of Edmond (the city) Budget Practices:
1) Broad goals are established through quarterly and annual strategic planning sessions internally and externally. City departmental strategies are set and reviewed quarterly. City-wide strategies are set and reviewed at least annually through an open public session. Edmond City Council identifies and prioritizes initiatives to move forward each year in the areas of Economic Development, Quality of Life, Community Involvement and People and Partnerships. These sessions invite public participation and are published on the city website and other social media outlets.
2) Approaches to achieve goals include policies and strategies to identify drivers and indicators to compile the annual budget. Cost allocation drivers, staffing assessments and needs, debt management analysis, revenue source evaluation, special program funding, cost control measures, and economic outlook are all reviewed, measured and evaluated to develop a sound budget.
3) The budget is developed based on extensive analysis and comparisons of past performance against forecasted estimated activity. Availability of funding sources and estimated cost needs are measured against goals set to prioritize programs and projects that can be funded and still maintain necessary reserves to keep the city in a sound fiscal position. Final review of the budget is performed at departmental, management and governing body levels. Drafts are circulated for an extended time prior to final approval by the Edmond City Council. Public participation is encouraged through the public hearing process.
4) Evaluation of performance is ongoing. The prior year budget is reviewed as the current year budget is formed. Prior year goal achievement is measured as the current year goals are reviewed. Priorities shift as patrons, staff and the governing body communicate throughout the year.
2.25 Click Here for Main Directory
BUDGET CALENDAR
October-December
• Department meetings with MGT Consulting for Allocation Drivers
• Assess /modify goals and strategies
• Review performance measurements
• Develop personnel data and presentation for staffing requests
• Discuss with Departments, Management Long Term Financial Plans
• Begin Public Stakeholder outreach
January
• Identify any structural changes in division of departments
• Personnel Review Committee will review requests
• Begin Social Agency Review Committee application process
• Start review and forecasting of revenues.
• Council Budget Workshop
February
• Revised budget spreadsheets for current year due
• One Solution Training Lab provided
• Human Resources organized recommendation and all changes
• Payroll for all departments entered by Human Resources
• Deadline for 5 year planning in One Solution’s BID (budget entry)
• Check Fleet, Vehicle Maintenance and Computer costs
March
• Cost allocation from MGT Consulting calculated and entered
• Departments finalize their budget page data as well as organizational changes and reviewed by staff
• Final Budget balancing, final forecasting, final programs and decisions
April
• Preliminary draft to City Manager
• City Manager review and changes
• Supporting documentation preparation
• Budget Draft to Council
May
• Prepare Budget Message due in May
• Post Public Notice of Budget hearings and Budget Summary
June
• Final Budget to Council for Adoption the first City Council Meeting in June
July
• Budget Begins July 1st
• Final budget document filed with State Auditor
• Reflect on Processes that need improvement
October-December Allocations Meetings Personnel Requests Long-Term Financial Plan Discussions Public Outrech January City Council Budget Workshop Budget Open for Entry Review and Forecast Budget February Training Workshops Revised Prior Year Budget Due 5-Year Budget Entry Due March Cost Allocation Entry Complete Finalize Budget Data Sheets Finalize All Budgets April Budget Draft to City Manager and City Council May City Council Public Budget Hearing June City Council Budget Adoption July Budget Filed with State Auditor Begin New Budget Year Evaluate Budget Process 2.26 Click Here for Main Directory

2.27 Click Here for Main Directory
2.28 Click Here for Main Directory
FUND STRUCTURE
*Indicates Major Fund
Governmental Funds Special Revenue Funds
• *General Fund- Gen. Gov.
• Senior Citizens Center
• Emergency Management
• Cemetery
• Festival Market
• Building & Fire Code Services
• City Council
• Historical Society
• Park Department
• Street & Alley
• Municipal Court
• Parks Special Event
• Edmond Electric Economic Development
• Urban Forestry
• Streetscape
• Planning & Zoning
• Social Agencies
•
•*Fire Public Safety Tax
•*Police Public Safety Tax
• Senior Citizen Center
• Community Development Block Grant (CDBG)
• Asset Forfeiture
• Ambulatory Services
• Visit Edmond
• Cemetery Perpetual Care
• Hospital Trust
• America Rescue Plan Act Fund
• Special Parks Tax Fund
• Opioid- Drug Settlement Fund
• TIF Fund
• Real Property
•*2000 Cap. Improvement Tax Fund
• Capital Improvement
• 2017 Cap. Improvement Tax Fund
• Park Tax Fund
• Cemetery Care
• Cemetery Perpetual Care
• Art in Public Places
Proprietary
•*Electric
•*Water
•*Wastewater
•Debt Service Fund
•Solid Waste
•Arcadia Lake
•Drainage
• PWA Economic Development
•Kickingbird Golf
•Tort/Liability
• Workers Comp. Reserve
•Employee Group
General Fund Capital Project Funds Insurance
• Vehicle Maintenance
• Fleet Maintenance
• Field Services
• Administrative Support - City Clerk - City Manager
- CM-ACM Operations
- Facility Maintenance
- Marketing
- Information Technology
- Legal Services
- Public Works Administration
- Central Operation
Whse.
•Pension Trust Fund
•CityLink **
•Sidewalk & Driveway Escrow
•C.L.E.E.T. Penalty Assessment Fund
- Central Communications - Dispatch - Engineering
- Financial Services - Human Resources - Utility Customer Services
**
Funds Enterprise Funds Internal ServiceFunds Fiduciary Funds
Pension Trust Fund Agency Funds
Fiduciary funds are not appropriated in the budget 2.29 Click Here for Main Directory
FUND STRUCTURE (cont.)
Major funds are funds whose revenues, expenditures/expenses, assets, or liabilities (excluding extraordinary items) are at least 10 percent of corresponding totals for all governmental or enterprise funds and at least 5 percent of the aggregate amount for all governmental and enterprise funds. Any other fund may be reported as a major fund if the government’s officials believe that fund is particularly important to financial statement users
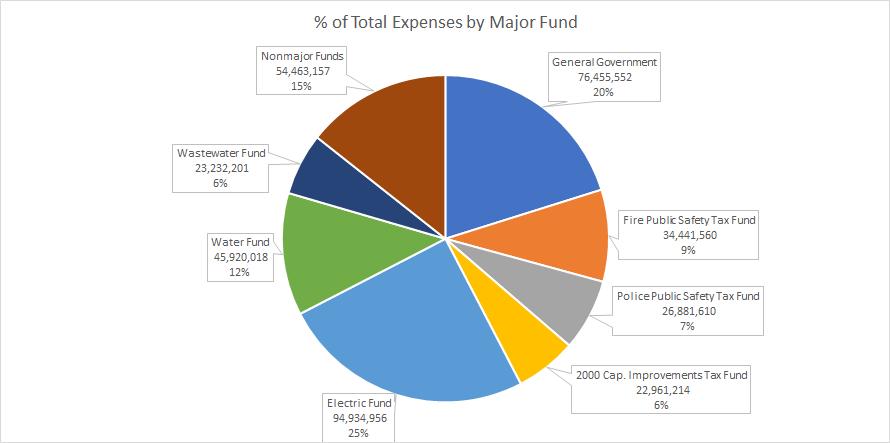
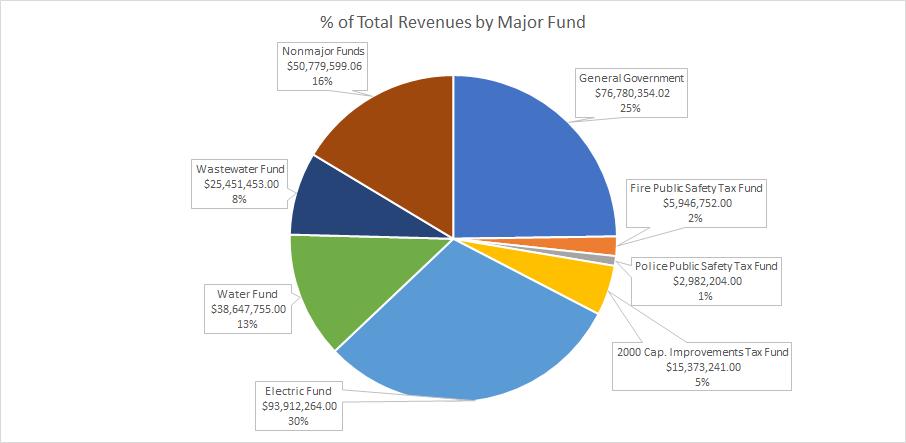
General Fund – The General fund is the primary operating fund of the City. It is used to account for all activities except those legally or administratively required to be accounted for in other funds. The General Fund is reported as a major governmental fund. The General Fund main sources of revenue include sales tax, franchise and public services taxes, and charges for services related to governmental activities.
Fire Public Safety Limited Tax Fund – used to account for restricted taxes and other dedicated revenues used to finance the operations of the City’s fire department
Police Public Safety Limited Tax Fund – used to account for restricted taxes and other dedicated revenues used to finance the operations of the City’s police department and other capital projects
2000 Capital Improvement Tax Fund – used to account for the proceeds of a voter-restricted limited purpose sales tax to be used for capital improvements
Electric Fund – used to account for the operation and maintenance of the City electric utility services
Water Fund – used to account for the operation and maintenance of the City water utility services
Wastewater Fund - used to account for the operation and maintenance of the City wastewater utility services
2.30 Click Here for Main Directory
THE CITY OF EDMOND, OKLAHOMA BUDGET SUMMARY - ALL FUNDS
FISCAL YEAR 23-24
SPECIAL CAPITAL ENTERPRISE FUNDS INTERNAL GENERAL REVENUE PROJECT UTILITY OTHER SERVICE COMBINED FUND FUNDS FUNDS FUNDS FUNDS FUNDS FUNDS ESTIMATED RESOURCES REVENUES: Taxes 71,427,362 9,811,051 32,894,033 - - - 114,132,446 Inter-governmental 1,773,907 1,653,263 - - 1,052,851 - 4,480,021 Licenses & Permits 2,504,658 - - 1,619,780 - 53,978 4,178,416 Fines & Forfeitures 1,151,094 - - - - - 1,151,094 Charges for Services 6,646,907 932,049 157,197 186,873,177 2,796,950 14,654,932 212,061,212 Interest 56,468 207,009 3,155,418 1,302,563 9,000 130,095 4,860,553 Investment Income - - - - - -CapitalLease Proceeds - - - - - -Miscellaneous Revenue 436,397 751,836 74,367 336,935 134,358 876,976 2,610,869 Subtotal - Revenues 83,996,793 13,355,208 36,281,015 190,132,455 3,993,159 15,715,981 343,474,611 OTHER RESOURCES: Debt/LoanProceeds - - - - - -Restricted Prior Year Reserves 3,194,546 56,199,064 118,557,673 1,115,953 - 47,248,212 226,315,449 Assigned Prior Year Reserves (CouncilProjects) 100,000 - - - - - 100,000 Committed Prior Year Reserves - 939,317 - - - - 939,317 Unrestricted Prior Year Reserves 12,010,261 - - 164,492,191 1,373,369 62,771 177,938,591 TOTAL ESTIMATED RESOURCES 99,301,600 70,493,589 154,838,688 355,740,599 5,366,528 63,026,964 748,767,968 ESTIMATED USES DIRECT COSTS BY FUNCTION: GeneralGovernment/ Central Services 4,132,080 7,153,223 82,745,350 - - 52,486,809 146,517,462 Public Safety 2,548,806 66,862,230 700,000 - - 5,456,813 75,567,849 Park & Recreation 4,525,393 - 20,414,213 1,622,919 2,535,168 - 29,097,693 Streets & Highways 1,550,000 - 10,661,000 - - 6,821,018 19,032,018 Health& Welfare 573,750 1,583,063 - - 3,445,519 - 5,602,332 UtilityServices - - - 153,714,219 - 10,153,307 163,867,526 Maintenance Services - - -Other Activities 2,620,439 783,375 - - 80,768 - 3,484,582 Economic Infrastructure Development - 5,000,000 390,000 - - 5,390,000 DEBT SERVICE COST:Principaland Interest - - 10,382,031 28,590,493 - - 38,972,524 Judgement Retirement - - - - - -Issuance Costs - - - - - -Debt Service Reserves - - - - -TOTAL ESTIMATED COSTS 15,950,468 76,381,891 129,902,594 184,317,631 6,061,455 74,917,947 487,531,986 TRANSFERS IN: Sales Tax 15,476,706 - - 15,476,706 - - 30,953,412 Other Transfers 4,532,780 58,022,724 4,625,000 1,390,000 2,533,699 - 71,104,203 Debt Service Transfers - - - - - -Internal Service Charges & Allocations - - - - 12,390 59,865,007 59,877,397 TOTAL TRANSFERS IN: 20,009,486 58,022,724 4,625,000 16,866,706 2,546,089 59,865,007 161,935,013 TRANSFERS OUT: Administrative Support (6,933,468) (5,833,815) (1,092,387) (9,791,705) (197,751) (3,106,117) (26,955,243) Fleet Lease Assessment Fee (148,345) (7,316,477) (11,370) (1,322,402) (171,490) (1,007,494) (9,977,578) Fleet Management Fund - (114,000) - (725,000) - - (839,000) Insurance Assessment (139,936) (1,330,124) (5,573) (503,651) (22,806) (568,517) (2,570,607) Vehicle Maintenance Fees (89,799) (1,075,000) (8,000) (1,513,681) (500) (606,900) (3,293,880) Field Services (7,961,993) (6,614) - (8,272,482) - - (16,241,089) Sales Tax (EPWA) (15,476,706) - - (15,476,706) - - (30,953,412) Arts inPublic Places Fund (200,000) - - - - - (200,000) GeneralFund - - - (4,432,780) - - (4,432,780) Revenue Bond Funds (EPWA) - - - - (25,000) - (25,000) Other Transfers (58,754,022) (150,000) (7,442,401) (100,000) - - (66,446,423) TOTAL TRANSFERS OUT: (89,704,269) (15,826,030) (8,559,731) (42,138,408) (417,547) (5,289,028) (161,935,013) TOTAL NET TRANSFERS (69,694,783) 42,196,695 (3,934,731) (25,271,702) 2,128,542 54,575,979OTHER USES: Reserve for Employee Obligations - - - - - -Reserve for CouncilSpecialProjects 100,000 - - - - - 100,000 Reserve for Capital Improvements - - 8,762,334 - - - 8,762,334 Committed for Other Purposes - 939,317 - - - - 939,317 Restricted (Reserve for Other Restricted Purposes) 2,734,946 - - 1,116,953 - 42,520,190 46,372,089 Restricted (Reserve for Specific Fund Purposes) 448,018 35,369,076 12,239,029 - - - 48,056,123 Unassigned (Res for Emergencies & Shortfalls*) 10,373,385 - - 145,034,313 1,433,614 164,807 157,006,119 TOTAL OTHER USES 13,656,349 36,308,393 21,001,363 146,151,266 1,433,614 42,684,997 261,235,982 TOTAL ESTIMATED USES 99,301,600 70,493,589 154,838,688 355,740,599 5,366,528 63,026,964 748,767,968 *LEVEL OF EMERGENCY RESERVES: - - - - - -Percentage of Total Revenue 11.72% 0.00% 0.00% 75.73% 21.96% 1.05% 37.87% Number of Days of Revenue 43 0 0 276 80 4 138 3.1 Click Here for Main Directory
GENERAL FUND FISCAL YEAR 23-24 REVENUE SOURCES Prior Year Actual Adopted Year Budget Current Year Revised BUDGET YEARProjected BudgetProjected BudgetProjected BudgetProjected Budget FY 21-22FY 22-23FY 22-23 FY 23-24 FY 24-25FY 25-26FY 26-27FY 27-28 TAXES 0.0% 2.0%2.0%2.0%2.0% Sales Tax44,081,674 45,890,670 46,498,762 51,887,534 52,925,284 53,983,790 55,063,466 56,164,735 Use Tax 15,769,220 16,450,123 17,616,963 17,850,914 18,743,459 19,680,632 20,664,664 21,697,897 Franchise Tax 2,009,504 1,678,613 2,082,384 1,657,773 1,674,350 1,691,094 1,708,005 1,725,085 Liquor Tax 146,647 69,109 22,875 31,141 31,453 31,767 32,085 32,406 Sub-Total 62,007,045 64,088,515 66,220,984 71,427,362 73,374,546 75,387,283 77,468,220 79,620,123 LICENSES & PERMITS City Clerk 51,170 56,107 21,414 23,038 23,268 23,501 23,736 23,973 Building Fees 1,873,006 1,575,451 1,668,329 2,458,963 2,490,861 2,523,228 2,556,066 2,589,383 Oil & Gas Fees 23,377 25,758 18,860 22,657 22,884 23,113 23,344 23,577 Sub-Total 1,947,553 1,657,316 1,708,603 2,504,658 2,537,013 2,569,842 2,603,146 2,636,933 FINES & FORFEITURES Court Fines 1,771,574 1,851,515 1,392,501 1,151,094 1,162,605 1,174,230 1,185,973 1,197,833 Sub-Total 1,771,574 1,851,515 1,392,501 1,151,094 1,162,605 1,174,230 1,185,973 1,197,833 INTERGOVERNMENTAL Grant Revenues 115,849 12,986 135,667 15,150 15,302 15,455 15,609 15,765 Alcoholic Beverage & Cigarette Tax 876,620 899,811 888,846 937,261 946,634 956,100 965,661 975,318 Vehicle & Gas Tax 846,393 927,577 841,246 821,496 829,711 838,008 846,388 854,852 Sub-Total 1,838,862 1,840,374 1,865,758 1,773,907 1,791,647 1,809,563 1,827,658 1,845,935 CHARGES FOR SERVICES Right of Way Fees 5,547,867 5,909,388 6,214,822 5,968,481 6,028,166 6,088,447 6,149,332 6,210,825 Right of Way Fees-True Up - - - - -Recreational Program Fees 48,811 61,206 46,472 61,818 62,436 63,061 63,691 64,328 Cemetery Fees 496,469 432,142 352,253 312,196 315,318 318,471 321,656 324,872 Emergency 911 Fees 245,661 125,000 232,456 125,000 125,000 125,000 125,000 125,000 Animal Welfare Fees 17,824 20,000 15,009 20,000 20,000 20,000 20,000 20,000 Curb Cut Fees 12,150 9,921 9,612 12,059 12,180 12,302 12,425 12,549 Filing Fees 85,934 76,027 70,451 131,339 133,205 135,101 137,027 138,984 Transportation Fees 366 - 1,010 - - - -Miscellaneous Charges 23,388 829 (49,555) 16,014 16,173 16,334 16,497 16,662 Sub-Total 6,478,468 6,634,513 6,892,530 6,646,907 6,712,478 6,778,716 6,845,628 6,913,220 INTEREST Earnings on Deposit (31,634) 50,000 37,285 50,000 50,000 50,000 50,000 50,000 Sub-Total (31,634) 50,000 37,285 50,000 50,000 50,000 50,000 50,000 MISCELLANEOUS REVENUES Miscellaneous Revenue 456,054 658,121 284,044 436,397 438,893 441,413 443,960 446,529 Sub-Total 456,054 658,121 284,044 436,397 438,893 441,413 443,960 446,529 OTHER FINANCING SOURCES Capital Lease Proceeds - - - - - - -Sub-Total - - - - - - -SUBTOTAL - REVENUES 74,467,923 76,780,354 78,401,706 83,990,325 86,067,182 88,211,047 90,424,585 92,710,573 TRANSFERS IN E.P.W.A. - - - - - - -Sales Tax In 14,875,727 15,173,241 14,875,727 15,476,706 15,786,240 16,101,964 16,101,964 16,101,964 Hospital Trust Fund - - - - - - -Convention Visitors Bureau Fund - - - - - - -Golf Course Fund 1,000,000 400,000 400,000 - - - -Schoolhouse Preservation Fund - - - - - - -Capital Improvements Fund - - - - - - -Edmond Electric Fund - - - - - - -Additional Transfers In 3,733,979 6,024,294 6,424,294 4,432,780 4,441,435 4,453,402 4,464,656 4,464,656 Sub-Total Transfers In 19,609,706 21,597,535 21,700,021 19,909,486 20,227,675 20,555,366 20,566,620 20,566,620 OTHER RESOURCES: Debt/Loan Proceeds - - - - - - -Reserve for Council Special Projects 100,000 100,000 100,000 100,000 100,000 100,000 100,000 100,000 Restricted Prior Year Reserves: - - - - - - -Street & Alley 1,789,980 1,692,340 1,692,340 1,658,493 1,624,646 1,591,477 1,558,984 1,527,154 Juvenile Court 593,540 637,678 572,371 445,867 353,261 257,177 157,414 53,739 Capital Infrastruture Improvement 629,396 629,396 629,396 629,396 629,396 629,396 629,396 629,396 Transportation Comm. Development 1,190 1,190 1,190 1,190 1,190 1,190 1,190 1,190 Employee Obligations - - - - - - -Committed Prior Year Reserves - - - - - - -Unassigned (Unrestricted) Prior Year Reserves (1,159,438) (1,528,103) 1,678,810 12,010,261 10,490,385 11,160,236 12,015,183 13,055,594 Sub-Total Other Resources 1,954,668 1,532,501 4,674,108 14,845,207 13,198,878 13,739,475 14,462,167 15,367,073 TOTAL ESTIMATED RESOURCES 96,032,296 99,910,390 104,775,834 118,745,018 119,493,735 122,505,888 125,453,372 128,644,266 3.2 Click Here for Main Directory
PUBLIC WORKS RESOURCES
REVENUE SOURCES Prior Year Actual Adopted Year Budget Current Year Revised BUDGET YEARProjected BudgetProjected BudgetProjected BudgetProjected Budget FY 21-22FY 22-23FY 22-23 FY 23-24 FY 24-25FY 25-26FY 26-27FY 27-28 LICENSES & PERMITS Electricity - - - - - - -Water 1,304,675 1,110,000 853,482 1,049,152 1,049,152 1,054,192 1,054,192 1,054,192 Solid Waste - - - - - - -Wastewater 782,861 571,208 585,059 570,628 570,628 570,628 570,628 570,628 Drainage Utility 30,138 - 17,771 - - - -Arcadia Lake - - - - - - -PWA Economic Development - - - - - - -Revenue Bond Funds - - - - - - -Sub-Total 2,117,674 1,681,208 1,456,312 1,619,780 1,619,780 1,624,820 1,624,820 1,624,820 CHARGES FOR SERVICES Electricity 98,349,157 93,485,263 109,567,986 106,518,365 107,048,027 107,580,326 108,113,282 108,644,122 Water 37,742,702 37,264,692 42,197,698 39,158,675 40,526,086 41,942,837 43,407,642 44,923,715 Solid Waste 11,039,469 11,165,618 11,107,377 11,879,132 12,103,915 12,339,306 12,574,712 12,814,826 Wastewater 24,451,345 24,760,245 26,076,484 25,725,066 26,238,267 26,761,732 27,295,667 27,840,280 Drainage Utility 1,913,540 1,934,566 1,922,522 1,956,917 1,996,055 2,035,976 2,076,695 2,118,230 Arcadia User Fees 1,341,910 1,309,104 1,316,520 1,635,022 1,565,723 1,591,036 1,622,856 1,654,033 PWA Economic Development - - - - - - -Revenue Bond Funds - - - - - - -Sub-Total 174,838,124 169,919,488 192,188,588 186,873,177 189,478,073 192,251,213 195,090,854 197,995,206 INTEREST Electricity (592,674) 200,000 361,166 200,000 200,000 200,000 200,000 200,000 Water (1,383,299) 150,000 2,156,433 760,317 685,143 705,736 687,686 668,853 Solid Waste (279,108) 68,000 99,780 68,000 68,000 68,000 68,000 68,000 Wastewater (512,032) 120,000 827,284 222,246 196,003 183,155 171,612 152,824 Drainage Utility (284,843) 50,000 109,805 50,000 50,000 50,000 50,000 50,000 Arcadia Lake (541) 1,000 (3,240) 1,000 1,000 1,000 1,000 1,000 PWA Economic Development (2,113) 1,000 15,374 1,000 1,000 1,000 1,000 1,000 Revenue Bond Funds (5,584) 20,000 12,800 - - - -Sub-Total (3,060,194) 610,000 3,579,402 1,302,563 1,201,146 1,208,891 1,179,298 1,141,677 MISCELLANEOUS REVENUE Electricity 89,025 227,001 117,652 162,407 172,407 182,407 192,407 192,407 Water 1,702,694 123,063 97,384 125,966 125,966 127,869 131,217 134,665 Solid Waste 615 - - - - - -Wastewater 1,198,424 - 1,096 - - - -Drainage Utility 79 - 123 - - - -Arcadia Lake 45,993 47,469 48,093 48,562 49,779 50,773 51,788 52,861 PWA Economic Development - - - - - - -Revenue Bond Funds - - - - - - -Sub-Total 3,036,829 397,533 264,348 336,935 348,152 361,049 375,412 379,933 SUBTOTAL - REVENUES 176,932,433 172,608,229 197,488,649 190,132,455 192,647,151 195,445,973 198,270,384 201,141,636 OTHER RESOURCES: DEBT/LOAN PROCEEDS Electricity - - - - - - -Water - - 215,110,830 - - - -Solid Waste - - - - - - -Wastewater - - 16,298,721 - - - -Drainage Utility - - - - - - -Arcadia Lake - - - - - - -PWA Economic Development - - - - - - -Revenue Bond Funds - - - - - - -Sub-Total - - 231,409,551 - - - -RESTRICTED PRIOR YEAR RESERVES Electricity 68,643,864 77,100 77,100 - - - -Water - 7,305,382 7,305,382 - - - -Solid Waste 12,628,411 - - - - - -Wastewater - 20,198,684 20,198,684 - - - -Drainage Utility 12,750,156 - - - - - -Arcadia Lake 207,205 914,506 914,506 - - - -PWA Economic Development 92,580 30,572 30,572 1,102,599 1,103,599 1,104,599 1,105,599 1,106,599 Revenue Bond Funds 2,156,460 7,407,788 7,407,788 (0) (0) (0) (0) (0) Sub-Total 96,478,677 35,934,032 35,934,032 1,102,599 1,103,599 1,104,599 1,105,599 1,106,599 ASSIGNED PRIOR YEAR RESERVES Electricity - - - - - - -Water - - - - - - -Solid Waste - - - - - - -Wastewater - - - - - - -Drainage Utility - - - - - - -Arcadia Lake - - - - - - -PWA Economic Development - - - - - - -Revenue Bond Funds - - - - - - -Sub-Total - - - - - - -COMMITTED PRIOR YEAR RESERVES Electricity - - - - - - -Water - - - - - - -Solid Waste - - - - - - -Wastewater - - - - - - -Drainage Utility - - - - - - -Arcadia Lake - - - - - - -PWA Economic Development - - - - - - -Revenue Bond Funds - - - - - - -Sub-Total - - - - - - -UNRESTRICTED PRIOR YEAR RESERVES Electricity - 52,350,534 52,350,534 47,099,946 46,803,480 48,330,630 50,391,644 54,041,697 Water 92,637,699 58,822,276 58,822,276 70,317,138 65,863,824 64,040,814 57,721,492 49,540,380 Solid Waste 12,628,411 12,919,946 12,919,946 10,696,133 10,880,215 10,859,116 10,642,152 10,197,797 Wastewater 31,516,782 2,873,561 2,873,561 24,531,162 21,635,526 19,600,328 17,181,391 15,066,108 Drainage Utility 12,750,156 12,392,610 12,392,610 12,489,218 811,505 (2,105,743) (4,633,415) (6,203,063) Arcadia Lake 207,205 (1,296,442) (1,296,442) (641,407) (960,238) (1,338,170) (1,716,723) (2,100,776) PWA Economic Development - - - - - - -Revenue Bond Funds - - - - - - -Sub-Total 149,740,254 138,062,485 138,062,485 164,492,191 145,034,313 139,386,976 129,586,540 120,542,144 TOTAL ESTIMATED RESOURCES 423,151,364 346,604,746 602,894,716 355,727,244 338,785,062 335,937,547 328,962,522 322,790,378 3.3 Click Here for Main Directory
SUMMARY BY SOURCES
GeneralFund FY 23-24 Prior Year Actual Adopted Year Budget Current Year Revised BUDGET YEARProjected BudgetProjected BudgetProjected BudgetProjected Budget FY 21-22 FY 22-23 FY 22-23 FY 23-24 FY 24-25 FY 25-26 FY 26-27 FY 27-28 ESTIMATED RESOURCES: REVENUES: Taxes 62,007,045 64,088,515 66,220,984 71,427,362 73,374,546 75,387,283 77,468,220 79,620,123 Inter-governmental 1,838,862 1,840,374 1,865,758 1,773,907 1,791,647 1,809,563 1,827,658 1,845,935 Licenses & Permits 1,947,553 1,657,316 1,708,603 2,504,658 2,537,013 2,569,842 2,603,146 2,636,933 Fines & Forfeitures 1,771,574 1,851,515 1,392,501 1,151,094 1,162,605 1,174,230 1,185,973 1,197,833 Charges for Services 6,478,635 6,634,803 6,892,529 6,646,907 6,712,478 6,778,716 6,845,628 6,913,220 Interest (43,127) 57,047 41,818 56,468 56,473 56,477 56,482 56,487 InvestmentIncome - - - - - - -CapitalLease Proceeds - - - - - - -Miscellaneous Revenue 456,898 658,803 284,044 436,397 438,893 441,413 443,960 446,529 Subtotal- Revenues 74,457,440 76,788,373 78,406,238 83,996,793 86,073,655 88,217,524 90,431,067 92,717,060 OTHER RESOURCES: Debt/Loan Proceeds - - - - - - -Restricted Prior Year Reserves 3,714,082 3,527,390 3,462,084 3,194,546 3,056,512 2,916,381 2,773,252 2,626,880 Assigned Prior Year Reserves (CouncilProjects) 100,000 100,000 100,000 100,000 100,000 100,000 100,000 100,000 Committed Prior Year Reserves - - - - - - -Unrestricted Prior Year Reserves (1,159,438) (1,528,103) 1,678,810 12,010,261 10,373,385 10,926,236 11,664,183 12,587,594 TOTAL ESTIMATED RESOURCES 77,112,084 78,887,660 83,647,132 99,301,600 99,603,551 102,160,140 104,968,502 108,031,534 ESTIMATED USES DIRECT COSTS BY FUNCTION: GeneralGovernment 259,621 576,607 441,117 571,375 404,750 404,750 404,750 404,750 Downtown CommunityCenter 166,447 191,770 175,863 - - - -Senior Citizens Center 363,483 497,528 396,768 519,306 533,775 530,027 546,260 558,262 EmergencyManagement 278,028 421,873 320,466 570,601 406,590 436,832 427,363 440,780 Cemetery 308,292 379,814 325,122 387,259 394,588 398,749 405,762 406,480 CommunityImage 1,349,489 1,686,002 1,452,748 1,724,680 1,714,022 1,764,134 1,798,560 1,826,980 FestivalMarketplace 51,412 159,965 99,448 129,975 136,543 135,965 139,040 141,885 Building Services Department 1,581,201 1,924,848 1,777,687 1,978,205 2,066,000 2,124,209 2,177,052 2,221,579 CityCouncil 339,693 531,877 448,032 566,240 606,240 608,240 606,740 606,740 HistoricalSociety 309,028 322,500 321,750 344,500 344,500 344,500 344,500 344,500 Park & Recreation 2,531,692 3,177,481 2,583,026 3,252,112 3,068,574 3,112,844 3,161,024 3,201,567 StreetMaintenance & Construction 1,125,427 1,260,000 839,092 1,550,000 965,000 1,100,000 1,100,000 1,100,000 MunicipalCourt 870,315 1,092,798 918,130 1,274,907 1,316,570 1,349,300 1,385,198 1,425,488 Outside Agencies 948,364 1,024,700 1,059,291 1,361,750 1,361,750 1,361,800 1,361,800 1,361,800 CommunityServices - - - - - - -Planning & Zoning 1,199,233 1,783,352 1,238,167 1,719,558 1,497,993 1,318,799 1,336,105 1,355,343 TOTAL ESTIMATED COSTS 11,681,725 15,031,115 12,396,709 15,950,468 14,816,895 14,990,149 15,194,154 15,396,154 TRANSFERS: Transfers In 19,709,706 21,697,535 22,257,265 20,009,486 20,327,675 20,655,366 20,666,620 20,666,620 Transfers Out(See detailbelow) (79,982,403) (80,745,959) (83,605,555) (89,704,269) (91,042,461) (93,155,667) (94,990,990) (96,985,799) NET TRANSFERS IN (OUT) (60,272,697) (59,048,424) (61,348,290) (69,694,783) (70,714,786) (72,500,301) (74,324,370) (76,319,179) OTHER USES: Reserve for Employee Obligations - - - - - - -Reserve for CouncilSpecialProjects - 100,000 100,000 100,000 100,000 100,000 100,000 100,000 Reserve for CapitalImprovements - - - - - - -Committed for Other Purposes - - - - - - -Restricted (Reserve for Other Purposes) 2,912,066 2,960,604 2,895,297 2,734,946 2,608,493 2,479,239 2,346,984 2,211,479 Restricted (Reserve for SpecialFund Purposes) 566,786 555,955 459,600 448,018 437,141 426,268 415,400 404,537 Unassigned (Res for Emergencies & Shortfalls*) 1,678,810 12,010,261 6,447,236 10,373,385 10,926,236 11,664,183 12,587,594 13,600,184 TOTAL OTHER USES 5,157,663 15,626,820 9,902,133 13,656,349 14,071,870 14,669,691 15,449,978 16,316,201 TOTAL ESTIMATED USES 77,112,085 89,706,359 83,647,132 99,301,600 99,603,551 102,160,140 104,968,502 108,031,534 * LEVEL OF EMERGENCY RESERVES: Percentage of TotalRevenue 2.25% 15.64% 8.22% 12.35% 12.69% 13.22% 13.92% 14.67% Number of Days of Revenue 8 57 30 45 46 48 51 54 Percentage of TotalExpenses 2.19% 14.90% 7.95% 11.50% 12.13% 12.67% 13.38% 14.13% Number of Days of Revenue 8 54 29 42 44 46 49 52 DETAILOFTRANSFERS OUT: Administrative Support 6,608,064 6,699,155 6,699,155 6,933,468 7,072,137 7,082,605 7,224,257 7,368,742 FleetLease AssessmentFee 134,561 138,654 138,654 148,345 155,434 162,880 170,699 178,906 FleetManagementFund - - - - - - -Insurance Assessment 109,764 132,414 132,414 139,936 146,932 154,279 161,992 170,092 Vehicle Maintenance Fees 67,575 87,999 92,960 89,799 91,479 93,243 95,095 97,040 Field Services 7,068,932 7,642,686 7,642,686 7,961,993 7,985,817 8,162,528 8,261,979 8,425,085 Sales Tax (EPWA) 14,875,727 15,173,241 14,875,727 15,476,706 15,786,240 16,101,964 16,101,964 16,101,964 Arts in Public Places Fund 468,017 250,000 67,512 200,000 100,000 100,000 100,000 100,000 GeneralFund - - - - - - -Revenue Bond Funds (EPWA) - - - - - - -Other Transfers 50,649,764 50,621,810 53,956,447 58,754,022 59,704,422 61,298,168 62,875,004 64,543,970 TotalTransfers Out: 79,982,403 80,745,959 83,605,555 89,704,269 91,042,461 93,155,667 94,990,990 96,985,799 3.4 Click Here for Main Directory
FUND BUDGET SUMMARY
Special Revenue Fund Summary FY 23-24 Prior Year Actual Adopted Year Budget Current Year Revised BUDGET YEARProjected BudgetProjected BudgetProjected BudgetProjected Budget FY 21-22 FY 22-23FY 22-23 FY 23-24 FY 24-25 FY 25-26 FY 26-27 FY 27-28 ESTIMATED RESOURCES: REVENUES: Taxes 8,976,751 8,907,085 11,144,533 9,811,051 10,007,272 10,207,417 10,411,566 10,619,797 Inter-governmental 1,183,280 2,563,648 1,927,621 1,653,263 790,000 800,000 800,000 800,000 Licenses & Permits - - - - - - -Fines & Forfeitures - - 300 - - - -Charges for Services 924,925 902,840 902,187 932,049 950,330 968,976 987,996 1,007,397 Interest (1,717,887) 318,951 396,590 207,009 207,009 207,009 207,009 207,009 Investment Income - - - - - - -Capital Lease Proceeds - - - - - - -Miscellaneous Revenue 775,180 283,920 742,928 751,836 753,894 755,991 758,131 760,314 Subtotal - Revenues 10,142,248 12,976,444 15,114,158 13,355,208 12,708,505 12,939,393 13,164,702 13,394,517 OTHER RESOURCES: Debt/Loan Proceeds - - - - - - -Restricted Prior Year Reserves 59,745,710 58,207,790 58,207,790 56,199,064 35,369,076 37,744,740 41,822,736 45,585,831 Assigned Prior Year Reserves (Council Projects) - - - - - - -Committed Prior Year Reserves - 4,310,913 4,310,913 939,317 939,317 939,317 939,317 939,317 Unrestricted Prior Year Reserves - - - - - - -TOTAL ESTIMATED RESOURCES 69,887,958 75,495,147 77,632,860 70,493,589 49,016,898 51,623,450 55,926,755 59,919,665 ESTIMATED USES DIRECT COSTS BY FUNCTION: Senior Citizens Center 71,337 143,150 124,044 159,950 159,950 159,950 159,950 159,950 CDBG Entitlement 886,036 2,409,082 2,051,924 1,583,063 931,639 741,922 748,004 751,717 Asset Forfeiture-Federal and State 28,124 218,200 223,743 90,700 90,700 90,700 90,700 90,700 Fire Public Safety Tax Fund 21,000,043 34,444,471 26,300,728 34,962,245 26,627,464 26,563,981 26,796,945 27,232,145 Police Services 22,937,605 26,895,425 24,622,438 31,045,285 27,074,681 27,208,523 28,535,455 29,410,307 Special Tax Parks - Hafer - - - - - - -American Rescue Plan Act 235,880 5,000,000 5,352,212 7,153,223 - - -Opioid & Drug Settlement - - - - - - -Hospital Sale Trust 2,200 2,000 1,100 2,000 2,000 2,000 2,000 2,000 Real Property 50 1,500 19,219 1,500 1,500 1,500 1,500 1,500 Convention & Visitors Bureau / Visit Edmond 385,147 451,551 420,318 619,925 626,703 636,210 644,347 652,102 Ambulatory Services Fund 660,135 686,020 686,020 764,000 764,000 764,000 764,000 764,000 TIF #1 Downtown 4,260,116 - 1,219,141 - - - -TOTAL ESTIMATED COSTS 50,466,672 70,251,399 61,020,887 76,381,891 56,278,637 56,168,786 57,742,901 59,064,421 TRANSFERS: Transfers In 54,511,282 48,700,614 52,123,154 58,022,724 56,957,160 58,378,547 59,846,259 61,362,155 Transfers Out (See detail below) (9,252,181) (9,638,367) (14,380,266) (15,826,030) (11,011,365) (11,071,158) (11,504,965) (11,505,197) NET TRANSFERS IN (OUT) 45,259,101 39,062,247 37,742,888 42,196,695 45,945,796 47,307,389 48,341,294 49,856,958 OTHER USES: Reserve for Employee Obligations - - - - - - -Reserve for Council Special Projects - - - - - - -Reserve for Capital Improvements - - - - - - -Committed for Other Purposes 6,469,371 2,158,458 939,317 939,317 939,317 939,317 939,317 939,317 Restricted (Reserve for Other Purposes) - - - - - - -Restricted (Reserve for Special Fund Purposes) 58,207,790 46,464,453 57,138,381 35,369,076 37,744,740 41,822,736 45,585,831 49,772,885 Unassigned (Res for Emergencies & Shortfalls* - - - - - - -TOTAL OTHER USES 64,677,161 48,622,911 58,077,698 36,308,393 38,684,057 42,762,053 46,525,148 50,712,202 TOTAL ESTIMATED USES 69,884,732 79,812,063 81,355,697 70,493,589 49,016,898 51,623,450 55,926,755 59,919,665 * LEVEL OF EMERGENCY RESERVES: Percentage of Total Revenue 0.00% 0.00% 0.00% 0.00% 0.00% 0.00% 0.00% 0.00% Number of Days of Revenue - - - - - - -Percentage of Total Expenses 0.00% 0.00% 0.00% 0.00% 0.00% 0.00% 0.00% 0.00% Number of Days of Revenue - - - - - - -DETAIL OF TRANSFERS OUT: Administrative Support 4,490,217 5,218,937 5,218,937 5,833,815 5,950,492 5,959,301 6,078,487 6,200,056 Fleet Lease Assessment Fee 2,279,269 1,870,658 1,870,658 7,316,477 2,276,396 2,363,569 2,435,114 2,356,351 Fleet Management Fund 214,320 53,000 53,000 114,000 131,250 - 144,703Insurance Assessment 1,123,349 1,489,358 1,489,358 1,330,124 1,396,631 1,466,463 1,539,785 1,616,775 Vehicle Maintenance Fees 710,210 850,000 1,156,017 1,075,000 1,100,000 1,125,000 1,150,000 1,175,000 Field Services 5,828 6,414 6,414 6,614 6,596 6,825 6,876 7,015 Sales Tax (EPWA) - - - - - - -Arts in Public Places Fund - - - - - - -General Fund - - - - - - -Revenue Bond Funds (EPWA) - - - - - - -Additional Transfers 428,988 150,000 4,585,883 150,000 150,000 150,000 150,000 150,000 Total Transfers Out 9,252,181 9,638,367 14,380,266 15,826,030 11,011,365 11,071,158 11,504,965 11,505,197 3.5 Click Here for Main Directory
FUND BUDGET SUMMARY
Capital Projects Fund Summary FY 23-24 Prior Year Actual Adopted Year Budget Current Year Revised BUDGET YEARProjected BudgetProjected BudgetProjected BudgetProjected Budget FY 21-22 FY 22-23 FY 22-23 FY 23-24 FY 24-25 FY 25-26 FY 26-27 FY 27-28 ESTIMATED RESOURCES: REVENUES: Taxes 32,908,497 28,049,429 34,777,957 32,894,033 33,551,730 34,222,765 32,112,702 22,657,959 Inter-governmental 108,500 - 11,938 - - - -Licenses & Permits - - - - - - -Fines & Forfeitures - - - - - - -Charges for Services 235,827 175,000 169,603 157,197 158,340 159,507 160,697 161,911 Interest (778,821) 289,500 1,157,108 3,155,418 877,145 407,424 380,791 272,901 Investment Income - - - - - - -CapitalLease Proceeds - - - - - - -Miscellaneous Revenue 973,637 446,958 182,109 74,367 2,601,907 2,405,527 1,407,075 1,408,653 Subtotal - Revenues 33,447,640 28,960,887 36,298,715 36,281,015 37,189,122 37,195,223 34,061,265 24,501,424 OTHER RESOURCES: Debt/Loan Proceeds 40,000,000 - 81,100,000 - - - -Restricted Prior Year Reserves 1,346,843 60,418,249 60,418,249 118,557,673 21,001,363 19,699,457 22,613,418 23,163,902 Assigned Prior Year Reserves (Council Projects) - - - - - - -Committed Prior Year Reserves - 491,943 491,943 - - - -Unrestricted Prior Year Reserves - - - - - - -TOTAL ESTIMATED RESOURCES 74,794,483 89,871,079 178,308,907 154,838,688 58,190,485 56,894,680 56,674,683 47,665,326 ESTIMATED USES DIRECT COSTS BY FUNCTION: CIP 1,733,253 400,150 3,548,360 530,150 400,150 400,150 400,150 400,150 Art in Public Places 947,041 753,525 253,793 200,000 100,000 100,000 100,000 100,000 CemeteryCare 29,980 10,300 3,459 17,500 4,000 4,000 4,000 4,000 CemeteryPerp - 600 - 100 100 100 100 100 Park Tax 5,731,665 4,108,366 2,388,925 2,546,613 3,203,185 2,526,640 1,639,559 1,528,083 2000 CIP 33,266,538 28,967,511 21,076,984 106,503,231 23,963,599 20,427,871 18,771,252 20,073,696 2012 CIP - - - - - - -2017 CIP 9,110,566 25,450,700 23,156,789 20,105,000 10,205,000 10,205,000 11,955,000 5,000 TOTAL ESTIMATED COSTS 50,819,042 59,691,152 50,428,310 129,902,594 37,876,034 33,663,761 32,870,061 22,111,029 TRANSFERS: Transfers In 46,403,417 767,500 577,598 4,625,000 525,000 525,000 525,000 525,000 Transfers Out (See detailbelow) (9,468,666) (5,407,948) (9,900,522) (8,559,731) (1,139,994) (1,142,501) (1,165,720) (1,189,428) NET TRANSFERS IN (OUT) 36,934,751 (4,640,448) (9,322,924) (3,934,731) (614,994) (617,501) (640,720) (664,428) OTHER USES: Reserve for Employee Obligations - - - - - - -Reserve for Council SpecialProjects - - - - - - -Reserve for Capital Improvements 29,719,909 13,133,996 15,034,606 8,762,334 9,486,487 13,449,070 12,891,213 14,439,678 Committed for Other Purposes 491,943 - - - - - -Restricted (Reserve for Other Purposes) - - - - - - -Restricted (Reserve for Specific Fund Purposes) 30,698,339 12,405,483 103,523,067 12,239,029 9,076,870 9,164,348 10,272,689 10,450,191 Unassigned (Res for Emergencies & Shortfalls*) - - - - - - -TOTAL OTHER USES 60,910,192 25,539,479 118,557,673 21,001,363 18,563,357 22,613,418 23,163,902 24,889,869 TOTAL ESTIMATED USES 74,794,483 89,871,079 178,308,907 154,838,688 57,054,385 56,894,680 56,674,683 47,665,326 * LEVEL OF EMERGENCY RESERVES: Percentage of Total Revenue 0.00% 0.00% 0.00% - 0.00% 0.00% 0.00% 0.00% Number of Days of Revenue - - - - - - -Percentage of Total Expenses 0.00% 0.00% 0.00% 0.00% 0.00% 0.00% 0.00% 0.00% Number of Days of Revenue - - - - - - -DETAIL OF TRANSFERS OUT: Administrative Support 540,997 906,875 906,632 1,092,387 1,114,235 1,115,884 1,138,203 1,160,966 Fleet Lease Assessment Fee 9,337 10,858 10,858 11,370 11,908 12,473 13,066 13,689 Fleet Management Fund - 80,000 - - - - -Insurance Assessment 4,464 4,715 4,715 5,573 5,851 6,144 6,451 6,773 Vehicle Maintenance Fees 1,301 8,000 9,600 8,000 8,000 8,000 8,000 8,000 Field Services - - - - - - -Sales Tax (EPWA) - - - - - - -Arts in Public Places Fund - 317,500 32,000 - - - -General Fund - - - - - - -Revenue Bond Funds (EPWA) (0) - 665,845 - - - -Transfers - EE Debt 4,080,000 4,080,000 4,080,000 - - - -Golf Course Fund 100,000 - - - - - -Arcadia Lake - - - - - - -Additional Transfers 4,732,567 - 4,190,872 7,442,401 - - -Total Transfers Out 9,468,666 5,407,948 9,900,522 8,559,731 1,139,994 1,142,501 1,165,720 1,189,428 3.6 Click Here for Main Directory
FUND BUDGET SUMMARY
FUND BUDGET SUMMARY Public Works Authority Funds FY 23-24 Prior Year ActualAdopted Year Budget Current Year Revised BUDGET YEARProjected BudgetProjected BudgetProjected BudgetProjected Budget FY 21-22 FY 22-23 FY 22-23 FY 23-24 FY 24-25 FY 25-26 FY 26-27 FY 27-28 ESTIMATED RESOURCES: REVENUES: Taxes - - - - - - -Inter-governmental - - - - - - -Licenses & Permits 2,117,674 1,681,208 1,456,312 1,619,780 1,619,780 1,624,820 1,624,820 1,624,820 Fines & Forfeitures - - - - - - -Charges for Services 174,838,124 169,919,488 192,188,588 186,873,177 189,478,073 192,251,213 195,090,854 197,995,206 Interest (3,060,658) 610,000 3,579,516 1,302,563 1,201,146 1,208,891 1,179,298 1,141,677 InvestmentIncome - - - - - - -CapitalLease Proceeds - - - - - - -Miscellaneous Revenue 3,036,829 397,533 264,348 336,935 348,152 361,049 375,412 379,933 Subtotal- Revenues 176,931,969 172,608,229 197,488,763 190,132,455 192,647,151 195,445,973 198,270,384 201,141,636 OTHER RESOURCES: Debt/Loan Proceeds - - 231,409,551 - - - -Restricted Prior Year Reserves 96,492,382 35,947,273 35,947,273 1,115,953 1,116,953 1,117,953 1,118,953 1,119,953 Assigned Prior Year Reserves (CouncilProjects) - - - - - - -Committed Prior Year Reserves - - - - - - -Unrestricted Prior Year Reserves 149,740,254 138,062,485 138,062,485 164,492,191 145,034,313 139,386,976 129,586,540 120,542,144 TOTAL ESTIMATED RESOURCES 423,164,605 346,617,986 602,908,071 355,740,599 338,798,417 335,950,902 328,975,877 322,803,733 ESTIMATED USES DIRECT COSTS BY FUNCTION: Electric Utility 103,384,345 94,979,442 109,161,583 97,085,154 94,898,430 94,605,281 93,136,649 92,836,572 Water Utility 50,596,608 46,181,598 254,535,641 38,781,008 37,519,078 43,360,558 46,556,435 51,632,793 Solid Waste Utility 6,714,109 7,668,306 7,454,252 8,137,360 8,433,424 8,735,016 9,049,784 9,377,702 Wastewater Utility 30,277,541 23,257,242 37,065,068 25,020,064 24,819,591 25,614,631 25,770,622 25,812,190 Arcadia 1,181,946 1,509,693 1,344,502 1,622,919 1,640,421 1,663,076 1,692,410 1,696,598 Drainage 995,863 3,204,259 1,583,572 13,281,126 4,551,708 4,200,450 3,274,707 2,126,380 PWA Sewer Impact - - - - - - -PWA Economic Development 323,083 390,000 4,076,919 390,000 390,000 390,000 390,000 390,000 Revenue Bond Funds payment 53,295 2,282,565 8,027,615 - - - -TOTAL ESTIMATED COSTS 193,526,790 179,473,105 423,249,151 184,317,631 172,252,652 178,569,012 179,870,607 183,872,235 TRANSFERS: Transfers In 26,632,150 21,905,806 31,375,408 16,866,706 16,176,240 16,491,964 16,491,964 16,491,964 Transfers Out(See detailbelow) (56,674,434) (45,967,190) (45,426,184) (42,138,408) (42,217,076) (43,168,361) (43,935,137) (44,829,784) NET TRANSFERS IN (OUT) (30,042,284) (24,061,384) (14,050,776) (25,271,702) (26,040,836) (26,676,397) (27,443,173) (28,337,820) OTHER USES: Reserve for Employee Obligations** - - - - - - -Reserve for CouncilSpecialProjects - - - - - - -Reserve for CapitalImprovements - - - - - - -Committed for Other Purposes 914,506 - - - - - -Reserve for Other Restricted Purposes 35,032,767 7,452,601 1,115,953 1,116,953 1,117,953 1,118,953 1,119,953 1,120,953 Restricted (Reserve for SpecialFund Purpose) - - - - - - -Unassigned (Res for Emergencies & Shortfalls*) 138,062,485 135,630,897 164,492,191 145,034,313 139,386,976 129,586,540 120,542,144 109,472,725 TOTAL OTHER USES 174,009,757 143,083,497 165,608,144 146,151,266 140,504,929 130,705,493 121,662,097 110,593,679 TOTAL ESTIMATED USES 397,578,832 346,617,986 602,908,071 355,740,599 338,798,417 335,950,902 328,975,877 322,803,733 * LEVEL OF EMERGENCY RESERVES: Percentage of TotalRevenue 78% 79% 83% 76% 72% 66% 61% 54% Number of Days of Revenue 285 287 304 278 264 242 222 199 Percentage of TotalExpenses 55% 60% 35% 64% 65% 58% 54% 48% Number of Days of Expenses 201 220 128 234 237 213 197 175 DETAILOFTRANSFERS OUT: Administrative Support 8,885,149 8,868,990 8,868,990 9,791,705 9,974,905 9,989,671 10,189,465 10,393,253 FleetLease AssessmentFee 1,207,415 1,280,049 1,280,049 1,322,402 1,387,112 1,455,057 1,526,399 1,601,307 FleetManagementFund 480,000 2,060,000 - 725,000 46,000 300,000 600,000 955,000 Insurance Assessment 317,634 461,186 461,186 503,651 528,833 555,275 583,040 612,189 Vehicle Maintenance Fees 1,298,578 1,420,089 1,551,419 1,513,681 1,566,999 1,622,637 1,680,701 1,741,297 Field Services 7,236,892 7,999,357 7,999,357 8,272,482 8,385,552 8,590,355 8,688,913 8,860,118 GeneralFund-Sales Tax 14,875,727 15,173,241 14,875,727 15,476,706 15,786,240 16,101,964 16,101,964 16,101,964 Arts in Public Places Fund - - - - - - -GeneralFund 9,010,622 6,424,294 6,824,294 4,432,780 4,441,435 4,453,402 4,464,656 4,464,656 Revenue Bond Funds (EPWA) - exp to each fund 8,361,903 2,179,984 3,421,079 - - - -Edmond Economic DevelopmentFund (EEDA) - - - - - - -Edmond Electric Economic DevelopmentFund 100,000 100,000 100,000 100,000 100,000 100,000 100,000 100,000 2000 CIP Electric LoanAdditionalTransfers 4,900,514 - 44,082 - - - -TotalTransfers Out: 56,674,434 45,967,190 45,426,184 42,138,408 42,217,076 43,168,361 43,935,137 44,829,784 3.7 Click Here for Main Directory
Other Enterprise Funds FY 23-24 Prior Year Actual Adopted Year Budget Current Year Revised BUDGET YEAR Projected Budget Projected Budget Projected Budget Projected Budget FY 21-22 FY 22-23 FY 22-23 FY 23-24 FY 24-25 FY 25-26 FY 26-27 FY 27-28 ESTIMATED RESOURCES: REVENUES: Taxes Inter-governmental 1,546,417 1,124,078 774,896 1,052,851 1,053,851 1,054,851 1,054,851 1,054,851 Licenses & Permits - - - - - - -Fines & Forfeitures - - - - - - -Charges for Services 134,426 1,353,520 816,046 2,796,950 2,851,550 2,884,700 2,908,050 2,941,200 Interest (30,726) 6,716 8,196 9,000 9,000 9,000 9,000 9,000 Investment Income - - - - - - -CapitalLease Proceeds - - - - - - -Miscellaneous Revenue 147,878 65,184 47,814 134,358 259,438 264,524 269,524 274,524 Subtotal - Revenues ,9951,797 2,549,498 1,646,953 3,993,159 4,173,839 4,213,075 4,241,425 4,279,575 OTHER RESOURCES: Debt/LoanProceeds - - - - - - -Restricted Prior Year Reserves - 1,601 1,601 - - - -Assigned Prior Year Reserves (CouncilProjects) - - - - - - -Committed Prior Year Reserves - - - - - - -Unrestricted Prior Year Reserves 1,870,464 1,611,415 1,611,415 1,373,369 1,433,614 1,447,365 1,503,561 1,541,030 TOTAL ESTIMATED RESOURCES 3,668,459 4,162,514 3,259,968 5,366,528 5,607,453 5,660,440 5,744,986 5,820,605 ESTIMATED USES DIRECT COSTS BY FUNCTION: Golf Course 909,736 2,439,455 1,850,653 2,535,168 2,753,397 2,744,140 2,781,516 2,803,523 YourGovShop 49,371 78,931 78,931 80,768 81,116 81,183 81,941 82,001 CityLink 2,004,210 2,521,159 2,479,258 3,445,519 3,015,224 3,184,353 3,289,045 3,439,016 TOTAL ESTIMATED COSTS 2,963,317 5,039,545 4,408,842 6,061,455 5,849,737 6,009,676 6,152,502 6,324,540 TRANSFERS: Transfers In 1,747,026 1,493,225 2,867,775 2,546,089 2,120,024 2,292,766 2,402,284 2,555,355 Transfers Out (See detailbelow) (839,152) (468,514) (345,533) (417,547) (430,375) (439,969) (453,738) (468,055) NET TRANSFERS IN (OUT) 74907,8 1,024,711 2,522,242 2,128,542 1,689,649 1,852,797 1,948,546 2,087,300 OTHER USES: Reserve for Employee Obligations** - - - - - - -Reserve for CouncilSpecialProjects - - - - - - -Reserve for Capital Improvements - - - - - - -Committed for Other Purposes - - - - - - -Reserve for Other Restricted Purposes 1,601 - - - - - -Restricted (Reserve for Specific Fund Purposes) - - - - - - -Unassigned (Res for Emergencies & Shortfalls*)1,611,415 147,679 1,373,369 1,433,614 1,447,365 1,503,561 1,541,030 1,583,365 TOTAL OTHER USES 1,613,016 147,679 1,373,369 1,433,614 1,447,365 1,503,561 1,541,030 1,583,365 TOTAL ESTIMATED USES 3,668,459 4,162,514 3,259,968 5,366,528 5,607,453 5,660,440 5,744,986 5,820,605 *LEVEL OF EMERGENCY RESERVES: Percentage of Total Revenue 2.11% 0.19% 1.72% 0 1.60% 1.63% 1.63% 1.63% Number of Days of Revenue 8 1 6 6 6 6 6 6 Percentage of Total Expenses 48.06% 2.83% 29.88% 22.82% 23.81% 24.07% 24.08% 24.05% Number of Days of Revenue 175 10 109 83 87 88 88 88 DETAIL OF TRANSFERS OUT: Administrative Support 223,277 198,543 198,543 197,751 201,704 202,005 206,041 210,165 Fleet Lease Assessment Fee 157,257 164,304 164,304 171,490 179,225 187,321 195,796 204,669 Fleet Management Fund 208,067 - - - - - -Insurance Assessment 23,381 22,586 22,586 22,806 23,946 25,143 26,401 27,721 Vehicle Maintenance Fees 566 500 - 500 500 500 500 500 Field Services - - - - - - -Sales Tax (EPWA) - - - - - - -Arts inPublic Places Fund - - - - - - -GeneralFund - - - - - - -Revenue Bond Funds (EPWA) - - - 25,000 25,000 25,000 25,000 25,000 Total Transfers Out: 612,549 385,933 385,433 417,547 430,375 439,969 453,738 468,055 3.8 Click Here for Main Directory
FUND BUDGET SUMMARY
Internal Service Funds FY 23-24 Prior Year Actual Adopted Year Budget Current Year Revised BUDGET YEARProjected Budget Projected Budget Projected BudgetProjected Budget FY 21-22 FY 22-23 FY 22-23 FY 23-24 FY 24-25 FY 25-26 FY 26-27 FY 27-28 ESTIMATED RESOURCES: REVENUES: Taxes - - - - - - -Inter-governmental - - 671 - - - -Licenses and Permits 67,860 67,827 40,608 53,978 55,058 56,159 57,282 58,428 Fines & Forfeitures - - - - - - -Charges for Services 14,036,503 14,851,098 15,011,863 14,654,932 15,094,438 15,539,741 16,002,092 16,478,271 Interest (946,926) 218,013 337,611 130,095 130,095 130,095 130,095 130,095 Investment Income - - - - - - -Capital Lease Proceeds - - - - - - -Miscellaneous Revenue 1,076,167 853,253 1,196,757 876,976 908,239 945,043 957,731 1,026,008 Subtotal - Revenues 14,233,605 15,990,191 16,587,510 15,715,981 16,187,830 16,671,038 17,147,200 17,692,802 OTHER RESOURCES: Debt/Loan Proceeds - - - - - - -Restricted Prior Year Reserves 34,174,334 38,839,046 38,839,046 47,248,212 42,520,190 32,975,195 23,027,821 12,306,672 Assigned Prior Year Reserves (Council Projects) - - - - - - -Committed Prior Year Reserves - - - - - - -Unrestricted Prior Year Reserves - 141,738 141,738 62,771 164,807 304,252 493,228 543,328 TOTAL ESTIMATED RESOURCES 48,407,939 54,970,975 55,568,294 63,026,964 58,872,827 49,950,485 40,668,248 30,542,802 ESTIMATED USES DIRECT COSTS BY FUNCTION: Risk Management Fund 1,773,623 2,946,079 3,880,504 3,354,597 3,501,837 3,580,828 3,663,849 3,750,815 Workers' Compensation Reserve Fund 158 - 160 - - - -Employee Group Insurance Fund 13,703,279 13,574,033 12,526,015 15,479,868 16,492,522 17,559,138 18,707,568 19,995,115 Vehicle Maintenance Fund 3,700,477 4,563,704 3,952,706 4,404,546 4,500,448 4,595,332 4,870,924 4,918,467 Fleet Management Fund 2,842,180 6,607,024 4,499,320 6,628,798 5,282,782 4,997,779 6,473,249 4,603,759 Field Services Fund 9,226,225 11,359,227 9,569,157 12,895,330 12,885,049 13,176,648 13,235,836 13,427,322 Administrative Support Funds 21,841,846 29,055,200 23,537,327 32,154,808 32,678,675 33,166,868 32,998,786 33,940,084 TOTAL ESTIMATED COSTS 53,087,787 68,105,267 57,965,189 74,917,947 75,341,313 77,076,593 79,950,212 80,635,562 TRANSFERS: Transfers In 48,014,868 52,655,865 55,411,982 59,865,007 55,194,950 56,202,287 57,851,892 59,281,000 Transfers Out (See detail below) (4,354,235) (4,992,566) (5,704,103) (5,289,028) (5,447,017) (5,555,130) (5,719,928) (5,890,290) NET TRANSFERS IN (OUT) 43,660,633 47,663,298 49,707,879 54,575,979 49,747,933 50,647,157 52,131,964 53,390,710 OTHER USES: Reserve for Employee Obligations** - - - - - - -Reserve for Council Special Projects - - - - - - -Reserve for Capital Improvements - - - - - - -Committed for Other Purposes - - - - - - -Reserve for Other Restricted Purposes 38,839,046 34,616,444 47,248,212 42,520,190 32,975,195 23,027,821 12,306,672 2,612,398 Restricted (Reserve for Specific Fund Purposes) - - - - - - -Unassigned (Res for Emergencies & Shortfalls*) 141,738 (87,437) 62,771 164,807 304,252 493,228 543,328 685,552 TOTAL OTHER USES 38,980,784 34,529,007 47,310,983 42,684,997 33,279,447 23,521,048 12,850,000 3,297,950 TOTAL ESTIMATED USES 48,407,939 54,970,975 55,568,294 63,026,964 58,872,827 49,950,485 40,668,248 30,542,802 * LEVEL OF EMERGENCY RESERVES: Percentage of Total Revenue 0.49% -0.28% 0.20% 0 0.95% 1.50% 1.63% 2.03% Number of Days of Revenue 2 (1) 1 2 3 5 6 7 Percentage of Total Expenses 0.26% -0.12% 0.10% 0.21% 0.39% 0.62% 0.66% 0.82% Number of Days of Revenue 1 (0) 0 1 1 2 2 3 DETAIL OF TRANSFERS OUT: Administrative Support 2,576,844 2,919,909 2,899,107 3,106,117 3,168,239 3,172,928 3,236,387 3,301,115 Fleet Lease Assessment Fee 889,803 939,143 939,143 1,007,494 1,060,019 1,115,705 1,174,792 1,237,542 Fleet Management Fund - 30,000 - - - - -Insurance Assessment 372,462 505,614 504,413 568,517 596,943 626,791 658,133 691,037 Vehicle Maintenance Fees 515,126 597,900 742,648 606,900 621,816 639,706 650,616 660,596 Field Services - - - - - - -Sales Tax (EPWA) - - - - - - -Arts in Public Places Fund - - - - - - -General Fund - - - - - - -Revenue Bond Funds (EPWA) - - - - - - -Additional Transfers - - 618,792 - - - -Total Transfers Out: 4,354,235 4,992,566 5,704,103 5,289,028 5,447,017 5,555,130 5,719,928 5,890,290 3.9 Click Here for Main Directory
FUND BUDGET SUMMARY
FY24 FUND BALANCE ESTIMATE
Audited June 30, 2022 ACFR Adjustments from ACFR (NonSpendable) FY2022 to Budget FY2023 Beginning Fund Balance (Budget Basis) FY2023 Estimated Resources/ Revenues/ Transfers In FY2023 Estimated Expenditures/ Transfers Out FY2023 Estimated Ending Fund Balance FY2023 Estimated Beginning Fund Balance FY2024 Estimated Revenues & Transfers In FY2024 Estimated Expenditures & Transfers Out FY2024 Estimated Ending Fund Balance FY2024 Difference GENERAL FUND* Total-General Fund 3,493,203 1,664,460 5,157,663 105,608,933 (95,461,789) 15,304,807 15,304,807 $ 104,006,279 (105,537,737) 13,773,349 $ -10.0% SPECIAL REVENUE FUNDS Fire Public Safety Limited Tax Fund* 22,717,570 1,137,088 23,854,658 30,450,513 (31,705,976) 22,599,194 22,599,194 $ 33,646,027 (44,392,589) 11,852,632 $ -47.6% Police Public Safety Limited Tax Fund* 15,421,793 1,193,023 16,614,816 31,103,438 (33,128,774) 14,589,480 14,589,480 $ 34,327,093 (37,158,439) 11,758,134 $ -19.4% Special Tax-Parks - - - 1,650,696 - 1,650,696 1,650,696 $ - - 1,650,696 $ 0.0% Senior Citizens 308,990 (468) 308,522 99,828 (124,044) 284,305 284,305 $ 97,000 (159,950) 221,355 $ -22.1% Community Development Block Grant (190,032) 4,826 (185,206) 1,747,459 (2,077,600) (515,347) (515,347) $ 1,503,263 (1,606,383) (618,467) $ 20.0% American Rescue Plan Act of 2021 (452,553) 12,506,615 12,054,062 - (5,525,901) 6,528,161 7,153,223 $ - (7,153,223) (0) $ -100.0% Opioid/Drug Settlement Revenue Fund - - - 391,406 - 391,406 391,406 $ - - 391,406 $ 0.0% Asset Forfeiture 626,182 (927) 625,255 48,691 (223,743) 450,203 450,203 $ 2,000 (90,700) 361,503 $ -19.7% Hospital Trust Fund 7,005,930 (8,930) 6,997,000 15,109 (1,100) 7,011,010 7,011,010 $ 10,000 (2,000) 7,019,010 $ 0.1% Real Property 555,771 (822) 554,949 4,755 (19,219) 540,485 540,485 $ 1,500 (1,500) 540,485 $ 0.0% Visit Edmond 319,618 27,065 346,683 814,824 (646,367) 515,139 515,139 $ 873,500 (832,432) 556,207 $ 8.0% Ambulatory Services (EMSA) 1,349,900 (1,936) 1,347,964 910,594 (729,287) 1,529,271 1,529,271 $ 917,549 (810,705) 1,636,116 $ 7.0% TIF #1 Downtown 2,161,684 (3,226) - (1,219,141) - 939,317 - - 939,317 $ 100.0% Total 49,824,853 14,852,308 64,677,161 67,237,312 (75,401,153) 56,513,319 57,138,381 $ 71,377,932 $ (92,207,921) $ 36,308,393 $ -35.8% CAPITAL PROJECTS FUNDS Capital Improvement 4,202,398 (6,597) 4,195,801 596,460 (3,548,360) 1,243,900 1,243,900 $ 402,500 (530,150) 1,116,250 $ -10.3% Art in Public Places 353,959 (421) 353,538 103,755 (256,465) 200,829 200,829 $ 201,000 (203,688) 198,141 $ -1.3% Cemetery Care 249,693 (370) 249,323 70,103 (3,459) 315,967 315,967 $ 57,697 (17,500) 356,164 $ 12.7% Cemetery Perpetual Care 270,970 (400) 270,570 104,371 - 374,941 374,941 $ 100,500 (100) 475,341 $ 26.8% Park Tax 3,454,958 18,636 3,473,594 5,804,373 (2,471,722) 6,806,245 6,806,245 $ 3,099,897 (2,610,588) 7,295,554 $ 7.2% 2000 Capital Improvement* 29,864,301 (9,767) 29,854,534 99,435,869 (26,659,149) 102,631,254 102,631,254 $ 20,942,102 (112,364,049) 11,209,307 $ -89.1% 2012 Capital Improvement 75 - 1 - - 76 $ - - 76 $ 100.0% 2017 Capital Improvement 22,545,076 (32,320) 22,512,756 11,861,382 (27,389,677) 6,984,461 6,984,461 $ 16,102,319 (22,736,250) 350,530 $ -95.0% Total 60,941,431 (31,239) 60,910,192 117,976,313 (60,328,832) 118,557,673 118,557,673 $ 40,906,015 $ (138,462,325) $ 21,001,363 $ -82.3% PUBLIC WORKS AUTHORITY FUNDS (PWA) Electric 112,159,004 (59,731,371) 52,427,634 114,126,804 (119,454,492) 47,099,946 47,099,946 $ 107,880,772 (108,177,238) 46,803,480 $ -0.6% Water Resources 199,319,127 (52,214,920) 147,104,207 281,970,636 (277,781,156) 151,293,687 70,317,138 $ 56,570,816 (61,024,129) 65,863,824 $ -56.5% Solid Waste 12,114,638 805,308 12,919,946 11,207,157 (13,430,970) 10,696,133 10,696,133 $ 11,947,132 (11,763,051) 10,880,215 $ 1.7% Wastewater 133,986,075 (70,579,028) 63,407,047 43,788,644 (42,329,727) 64,865,964 24,531,162 $ 26,517,940 (29,413,576) 21,635,526 $ -66.6% Sewer Impact 13,272 (32) 13,241 114 - 13,355 13,355 $ - - 13,355 $ 0.0% Arcadia Lake 2,419,399 (2,801,335) (381,936) 1,361,373 (1,620,844) (641,407) (641,407) $ 1,684,584 (2,003,415) (960,238) $ 49.7% Drainage 20,411,439 (8,018,829) 12,392,610 2,050,221 (1,953,613) 12,489,218 12,489,218 $ 2,006,917 (13,684,630) 811,505 $ -93.5% PWA Economic Development 27,301 3,271 30,572 5,148,946 (4,076,919) 1,102,599 1,102,599 $ 391,000 (390,000) 1,103,599 $ 0.1% Revenue Bond (417,531) 7,825,319 7,407,788 619,826 (8,027,615) (0) (0) $ - - (0) $ 0.0% Total 480,032,724 (184,711,616) 295,321,108 460,273,722 (468,675,335) 286,919,495 165,608,144 $ 206,999,161 $ (226,456,039) $ 146,151,266 $ -49.1% OTHER ENTERPRISE FUNDS Kickingbird Golf Club 1,651,592 (1,009,520) 642,072 1,758,000 (2,049,577) 350,495 350,495 $ 2,846,308 (2,794,357) 402,446 $ 14.8% YourGov Shop 426,299 24,069 450,368 141,906 (81,117) 511,157 511,157 $ 91,890 (80,768) 522,279 $ 2.2% CityLink 490,915 29,660 520,575 2,614,823 (2,623,681) 511,717 511,717 $ 3,601,050 (3,603,877) 508,890 $ -0.6% Total 2,568,807 (955,791) 1,613,016 4,514,728 (4,754,375) 1,373,369 1,373,369 $ 6,539,248 $ (6,479,002) $ 1,433,614 $ 4.4% INTERNAL SERVICE FUNDS Risk Management 561,146 1,750,016 2,311,162 6,442,058 (3,946,157) 4,807,063 4,807,063 $ 2,730,607 (3,410,707) 4,126,963 $ -14.1% Workers' Compensation Reserve 1,761,078 (4,276) 1,756,802 15,137 (160) 1,771,779 1,771,779 $ 25,000 - 1,796,779 $ 1.4% Employee Group Insurance Fund 2,315,566 1,548,457 3,864,023 14,452,190 (12,533,888) 5,782,325 5,782,325 $ 13,679,755 (15,492,613) 3,969,467 $ -31.4% Vehicle Maintenance (403,130) 544,868 141,738 4,086,766 (4,165,733) 62,771 62,771 $ 4,764,558 (4,662,523) 164,807 $ 162.6% Administrative Support- General Government 642,925 4,742,373 5,385,298 25,100,351 (23,817,181) 6,668,468 6,668,468 $ 27,052,691 (32,487,836) 1,233,323 $ -81.5% Fleet Management 38,391,678 (19,729,971) 18,661,707 5,995,104 (5,144,392) 19,512,420 19,512,420 $ 10,878,308 (6,686,237) 23,704,491 $ 21.5% Field Services 4,291,100 2,568,953 6,860,053 15,907,885 (14,061,781) 8,706,157 8,706,157 $ 16,450,069 (17,467,059) 7,689,167 $ -11.7% Total 47,560,364 (8,579,580) 38,980,784 71,999,491 (63,669,292) 47,310,983 47,310,983 $ 75,580,988 $ (80,206,975) $ 42,684,997 $ -9.8% Total Fund Balance Estimation 644,421,381 (177,761,458) 466,659,923 827,610,499 (768,290,776) 525,979,646 403,919,988 498,870,376 (642,870,996) 261,352,982 -50.3% * Major Fund
3.10 Click Here for Main Directory
Fund Balances
The fund balance table reflects the audited June 30, 2022 fund balance as shown in our Annual Comprehensive Financial Report (ACFR) which is located at www.edmondok.com under financial services/audit reports. GFOA best practice recommends we reconcile our Annual Financial Report to the Budget Basis for the FY2024. We start with the audited total by fund and adjust for any Non-Spendable items (examples could be inventory or fixed assets). This balance then becomes our beginning fund balance for FY23. We display the estimated resources/revenues and the expenditures/uses and the result is the estimate fund balance as of June 30, 2023. This total then becomes the estimated beginning balance for the current FY24, which displays the estimated resources/revenues and estimated expenditures/transfers out which creates the estimated FY24 ending fund balance as of June 30, 2024. Details of each department can be found on their individual department’s page.
Equity is classified as net position and displayed in three components:
Net investment in capital assets-Consists of capital assets including restricted capital assets and bony construction proceeds, net of accumulated depreciation and reduced by the outstanding balances of any bonds, mortgages, notes or other borrowings that are attributable to the acquisition, construction, or improvement of those assets.
Restricted net position-Consists of net position with constraints placed on the use either by 1) external groups such as creditors, grantors, contributors, or laws or regulations of other governments, or 2) law through constitutional provisions or enabling legislation.
Unrestricted net position-All other net position that does not meet the definition of “restricted” or “net investment in capital assets”.
Governmental fund equity is classified as fund balance and is further classified as non-spendable, restricted, committed, assigned and unassigned. These classifications are defined as:
Non-spendable-included amounts that cannot be spent because they are either (a) not in spendable form or (b) legally or contractually required to be maintained intact.
Restricted-consists of fund balance with constraints placed on the use of resources either by (1) external groups such as creditors, grantors, contributors, or laws or regulations of other governments, or (2) laws through constitutionalprovisions or enabling legislation.
Committed-included amounts that can only be used for specific purposed pursuant to constraints imposed by formal action of the city’s highest levelof decision-making authority. The City’s highest level of decision-making authority is made by ordinance. City Council adopts an ordinance that established this constraint.
Assigned-included amount that are constrained by the City’s intent to be used for specific purposed but are neither restricted nor committed. Assignments of fund balance may be made by city council action or management decision when the City Councilhas delegated that authority. Assignments for transfers and interest income for governmental funds are made through budgetary process.
Unassigned-represent fund balance that has not been assigned to other funds and has not been restricted, committed, or assigned to specific purposes within the general fund. The generalfund is the only fund that reports a positive unassigned fund balance.
In an effort to ensure the continuance of sound financial management of public resources, the City of Edmond’s Unassigned Fund Balance within the General Fund will be maintained to provide the City with sufficient working capital and a comfortable margin of safety to address emergencies, sudden loss of revenue or operating needs, and unexpected downturns. The City strives to maintain in the Unassigned fund balance in the GeneralFund of (10%). Other goals and limits are listed in the notes of our annual comprehensive annualreport on our website.
3.11 Click Here for Main Directory
Fund Balance increase/decrease of 10% or more
GFOA requires that any major fund or the nonmajor funds in the aggregate are anticipated to increase or decrease by more than 10%, we are required to discuss the causes of these changes. On the following chart of Fund Balance Estimation for FY24, notice that the Major funds are identified in bold font and marked with an asterisk (*). Below is a short discussion of the change estimates in these major funds as well as a few others.
General Fund – The projected 10.0% decrease in General Fund is due to reduced projected revenue compared to prior and additional expense allocations to Social Agencies and Employee Market Adjustments.
Fire Public Safety Limited Tax Fund - Is estimated to have a 47.6% decrease in fund balance. This decrease is due to routine equipment replacement and the construction of Fire Station #6 and other CIP projects. See CIP for details.
Police Public Safety Limited Tax Fund - Is estimated to have a 19.4% decrease in fund balance. This decrease is primarily due to an upgrade to access control and camera systems at the Public Safety Center along with other planned capital improvement projects. See CIP list for more details.
2000 Capital Improvement Tax Fund - Is estimated to have an 89.1% decrease in fund balance. This decrease is due to planned capital improvement projects. See CIP list for details.
Water Resources Fund - Is estimated to have a decrease of 56.5% in fund balance due to the higher cost of providing utility services.
Wastewater Fund - Is estimated to have a decrease of 66.6% in fund balance due to lower projected revenue for the upcoming year. The remaining non major funds are listed below:
The Administrative Support - General Government-Is estimated to have a decrease of 81.5% in fund balance due to higher costs of doing business.
Vehicle Maintenance-Is estimated to have an increase of 162.6% in fund balance due to higher costs of doing business.
Kickingbird Golf Club - Is estimated to have an increase of 14.8% in fund balance due to a City Council approved transfer from the Parks Tax Fund in order to maintain a 45 day reserve for the Golf Course.
Asset Forfeiture - Is estimated to have a decrease of 19.7% in fund balance due to capital expenditures for new equipment.
Sr. Citizens Fund - Is estimated to have a decrease of 22.1% in fund balance. Revenues are not enough to cover the expenditures. Participation is less than before Covid and costs are higher.
Community Development Block Grant Fund - Is estimated to have a decrease of 20.0% in fund balance.
American Rescue Plan Act Fund - Is estimated to have a decrease of 100.0% in fund balance due to a correcting entry that brought the fund back to a positive balance.
Downtown TIF Fund - Is estimated to have an increase of 100.0% in fund balance.
Capital Improvement Fund - Is estimated to decrease 10.3% due to ADA improvements.
Cemetery Care Fund & Perpetual Care Funds - Are estimated to increase 12.7% & 26.8% respectfully due to increased sale of lots.
2017 CIP Fund - Is estimated to decrease 95.0% due to $23MM in capital expenditures.
3.12 Click Here for Main Directory
The Public Works Authority Funds - The aggregate of these funds (not including Electric, Water, and Wastewater) represent a 49.9% decrease overall. This is due to the higher cost of doing business.
Risk Management Fund - Is estimated to have a decrease of 14.1% due to budgeting expenditures being less than projected revenues.
Employee Group Insurance Fund - Is estimated to have a decrease of 31.4% due to budgeting expenditures higher than prior year and reduced projected revenue.
Fleet Management Fund - Is estimated to have an increase of 21.5% due to higher projected revenue compared to prior year.
Field Services Fund - Is estimated to have a decrease of 11.7% due to higher budgeted expense for Street Maintenance in FY24.
3.13 Click Here for Main Directory
General Funds - Sub-Directory
General Fund 4.2-4.3 Summary Page 4.2 Budget Page 4.3 General Government 4.4-4.5 Summary Page 4.4 Budget Page 4.5 Senior Citizens Center 4.6-4.7 Summary Page 4.6 Budget Page 4.7 Emergency Management 4.8-4.9 Summary Page 4.8 Budget Page 4.9 Cemetery 4.10-4.11 Summary Page 4.10 Budget Page 4.11 Festival Marketplace 4.12-4.13 Summary Page 4.12 Budget Page 4.13 Building Services 4.14-4.15 Summary Page 4.14 Budget Page 4.15 City Council 4.16-4.17 Summary Page 4.16 Budget Page 4.17 Historical Society 4.18-4.19 Summary Page 4.18 Budget Page 4.19 Parks and Recreation 4.20-4.21 Summary Page 4.20 Budget Page 4.21 Street & Alley Fund 4.22-4.23 Summary Page 4.22 Budget Page 4.23 Court Services/ Municipal Court 4.24-4.25 Summary Page 4.24 Budget Page 4.25 Community Image 4.26-4.27 Summary Page 4.26 Budget Page 4.27 Planning 4.28-4.29 Summary Page 4.28 Budget Page 4.29 Community Agency Review Commission 4.30-4.31 Summary Page 4.30 Budget Page 4.31 Parks and Recreation- Special Events 4.32-4.33 Summary Page 4.32 Budget Page 4.33 Edmond Electric Economic Development Fund (EEEDA) 4.34-4.35 Summary Page 4.34 Budget Page 4.35
4.1
GENERAL FUND DEPARTMENTAL SUMMARY
The General Fund is the principal fund of the City which accounts for all transactions not accounted for in the other funds. It accounts for the costs of operating many of the City’s general basic services, such as street maintenance, parks and recreation, and general government. Financing is primarily provided by City sales tax, franchise taxes and Edmond Public Works Authority (EPWA) transfers, fines, licenses, and permits, charges for services and interest earnings.
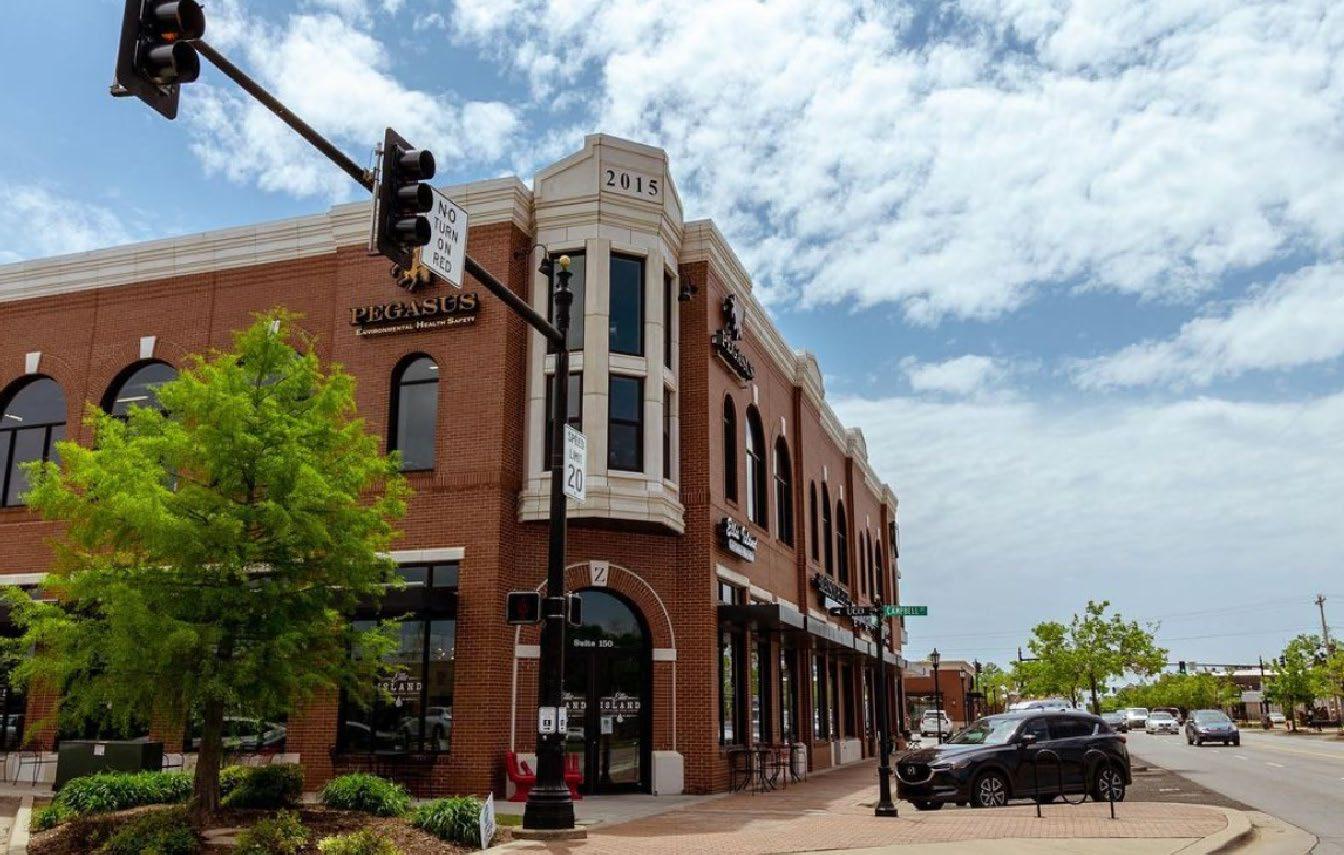


CONTACT
City Manager
Scot Rigby Ph (405) 359-4500
4.2 Click Here for Main Directory Click Here for Sub-Directory
FUND BUDGET SUMMARY GeneralFund FY 23-24 Prior Year Actual Adopted Year Budget Current Year Revised BUDGET YEARProjected BudgetProjected BudgetProjected BudgetProjected Budget FY 21-22 FY 22-23 FY 22-23 FY 23-24 FY 24-25 FY 25-26 FY 26-27 FY 27-28 ESTIMATED RESOURCES: REVENUES: Taxes 62,007,045 64,088,515 66,220,984 71,427,362 73,374,546 75,387,283 77,468,220 79,620,123 Inter-governmental 1,838,862 1,840,374 1,865,758 1,773,907 1,791,647 1,809,563 1,827,658 1,845,935 Licenses & Permits 1,947,553 1,657,316 1,708,603 2,504,658 2,537,013 2,569,842 2,603,146 2,636,933 Fines & Forfeitures 1,771,574 1,851,515 1,392,501 1,151,094 1,162,605 1,174,230 1,185,973 1,197,833 Charges for Services 6,478,635 6,634,803 6,892,529 6,646,907 6,712,478 6,778,716 6,845,628 6,913,220 Interest (43,127) 57,047 41,818 56,468 56,473 56,477 56,482 56,487 InvestmentIncome - - - - - - -CapitalLease Proceeds - - - - - - -Miscellaneous Revenue 456,898 658,803 284,044 436,397 438,893 441,413 443,960 446,529 Subtotal- Revenues 74,457,440 76,788,373 78,406,238 83,996,793 86,073,655 88,217,524 90,431,067 92,717,060 OTHER RESOURCES: Debt/Loan Proceeds - - - - - - -Restricted Prior Year Reserves 3,714,082 3,527,390 3,462,084 3,194,546 3,056,512 2,916,381 2,773,252 2,626,880 Assigned Prior Year Reserves (CouncilProjects) 100,000 100,000 100,000 100,000 100,000 100,000 100,000 100,000 Committed Prior Year Reserves - - - - - - -Unrestricted Prior Year Reserves (1,159,438) (1,528,103) 1,678,810 12,010,261 10,373,385 10,926,236 11,664,183 12,587,594 TOTAL ESTIMATED RESOURCES 77,112,084 78,887,660 83,647,132 99,301,600 99,603,551 102,160,140 104,968,502 108,031,534 ESTIMATED USES DIRECT COSTS BY FUNCTION: GeneralGovernment 259,621 576,607 441,117 571,375 404,750 404,750 404,750 404,750 Downtown CommunityCenter 166,447 191,770 175,863 - - - -Senior Citizens Center 363,483 497,528 396,768 519,306 533,775 530,027 546,260 558,262 EmergencyManagement 278,028 421,873 320,466 570,601 406,590 436,832 427,363 440,780 Cemetery 308,292 379,814 325,122 387,259 394,588 398,749 405,762 406,480 CommunityImage 1,349,489 1,686,002 1,452,748 1,724,680 1,714,022 1,764,134 1,798,560 1,826,980 FestivalMarketplace 51,412 159,965 99,448 129,975 136,543 135,965 139,040 141,885 Building Services Department 1,581,201 1,924,848 1,777,687 1,978,205 2,066,000 2,124,209 2,177,052 2,221,579 CityCouncil 339,693 531,877 448,032 566,240 606,240 608,240 606,740 606,740 HistoricalSociety 309,028 322,500 321,750 344,500 344,500 344,500 344,500 344,500 Park & Recreation 2,531,692 3,177,481 2,583,026 3,252,112 3,068,574 3,112,844 3,161,024 3,201,567 StreetMaintenance & Construction 1,125,427 1,260,000 839,092 1,550,000 965,000 1,100,000 1,100,000 1,100,000 MunicipalCourt 870,315 1,092,798 918,130 1,274,907 1,316,570 1,349,300 1,385,198 1,425,488 Outside Agencies 948,364 1,024,700 1,059,291 1,361,750 1,361,750 1,361,800 1,361,800 1,361,800 CommunityServices - - - - - - -Planning & Zoning 1,199,233 1,783,352 1,238,167 1,719,558 1,497,993 1,318,799 1,336,105 1,355,343 TOTAL ESTIMATED COSTS 11,681,725 15,031,115 12,396,709 15,950,468 14,816,895 14,990,149 15,194,154 15,396,154 TRANSFERS: Transfers In 19,709,706 21,697,535 22,257,265 20,009,486 20,327,675 20,655,366 20,666,620 20,666,620 Transfers Out(See detailbelow) (79,982,403) (80,745,959) (83,605,555) (89,704,269) (91,042,461) (93,155,667) (94,990,990) (96,985,799) NET TRANSFERS IN (OUT) (60,272,697) (59,048,424) (61,348,290) (69,694,783) (70,714,786) (72,500,301) (74,324,370) (76,319,179) OTHER USES: Reserve for Employee Obligations - - - - - - -Reserve for CouncilSpecialProjects - 100,000 100,000 100,000 100,000 100,000 100,000 100,000 Reserve for CapitalImprovements - - - - - - -Committed for Other Purposes - - - - - - -Restricted (Reserve for Other Purposes) 2,912,066 2,960,604 2,895,297 2,734,946 2,608,493 2,479,239 2,346,984 2,211,479 Restricted (Reserve for SpecialFund Purposes) 566,786 555,955 459,600 448,018 437,141 426,268 415,400 404,537 Unassigned (Res for Emergencies & Shortfalls*)1,678,810 12,010,261 6,447,236 10,373,385 10,926,236 11,664,183 12,587,594 13,600,184 TOTAL OTHER USES 5,157,663 15,626,820 9,902,133 13,656,349 14,071,870 14,669,691 15,449,978 16,316,201 TOTAL ESTIMATED USES 77,112,085 89,706,359 83,647,132 99,301,600 99,603,551 102,160,140 104,968,502 108,031,534 * LEVEL OF EMERGENCY RESERVES: Percentage of TotalRevenue 2.25% 15.64% 8.22% 12.35% 12.69% 13.22% 13.92% 14.67% Number of Days of Revenue 8 57 30 45 46 48 51 54 Percentage of TotalExpenses 2.19% 14.90% 7.95% 11.50% 12.13% 12.67% 13.38% 14.13% Number of Days of Revenue 8 54 29 42 44 46 49 52 DETAILOFTRANSFERS OUT: Administrative Support 6,608,064 6,699,155 6,699,155 6,933,468 7,072,137 7,082,605 7,224,257 7,368,742 FleetLease AssessmentFee 134,561 138,654 138,654 148,345 155,434 162,880 170,699 178,906 FleetManagementFund - - - - - - -Insurance Assessment 109,764 132,414 132,414 139,936 146,932 154,279 161,992 170,092 Vehicle Maintenance Fees 67,575 87,999 92,960 89,799 91,479 93,243 95,095 97,040 Field Services 7,068,932 7,642,686 7,642,686 7,961,993 7,985,817 8,162,528 8,261,979 8,425,085 Sales Tax (EPWA) 14,875,727 15,173,241 14,875,727 15,476,706 15,786,240 16,101,964 16,101,964 16,101,964 Arts in Public Places Fund 468,017 250,000 67,512 200,000 100,000 100,000 100,000 100,000 GeneralFund - - - - - - -Revenue Bond Funds (EPWA) - - - - - - -Other Transfers 50,649,764 50,621,810 53,956,447 58,754,022 59,704,422 61,298,168 62,875,004 64,543,970 TotalTransfers Out: 79,982,403 80,745,959 83,605,555 89,704,269 91,042,461 93,155,667 94,990,990 96,985,799 4.3 Click Here for Main Directory Click Here for Sub-Directory
GENERAL GOVERNMENT DEPARTMENTAL SUMMARY
The general government provides for all receipt of revenues not otherwise recorded in other functions of the general fund, and expenditures not otherwise recorded in other general fund departments.


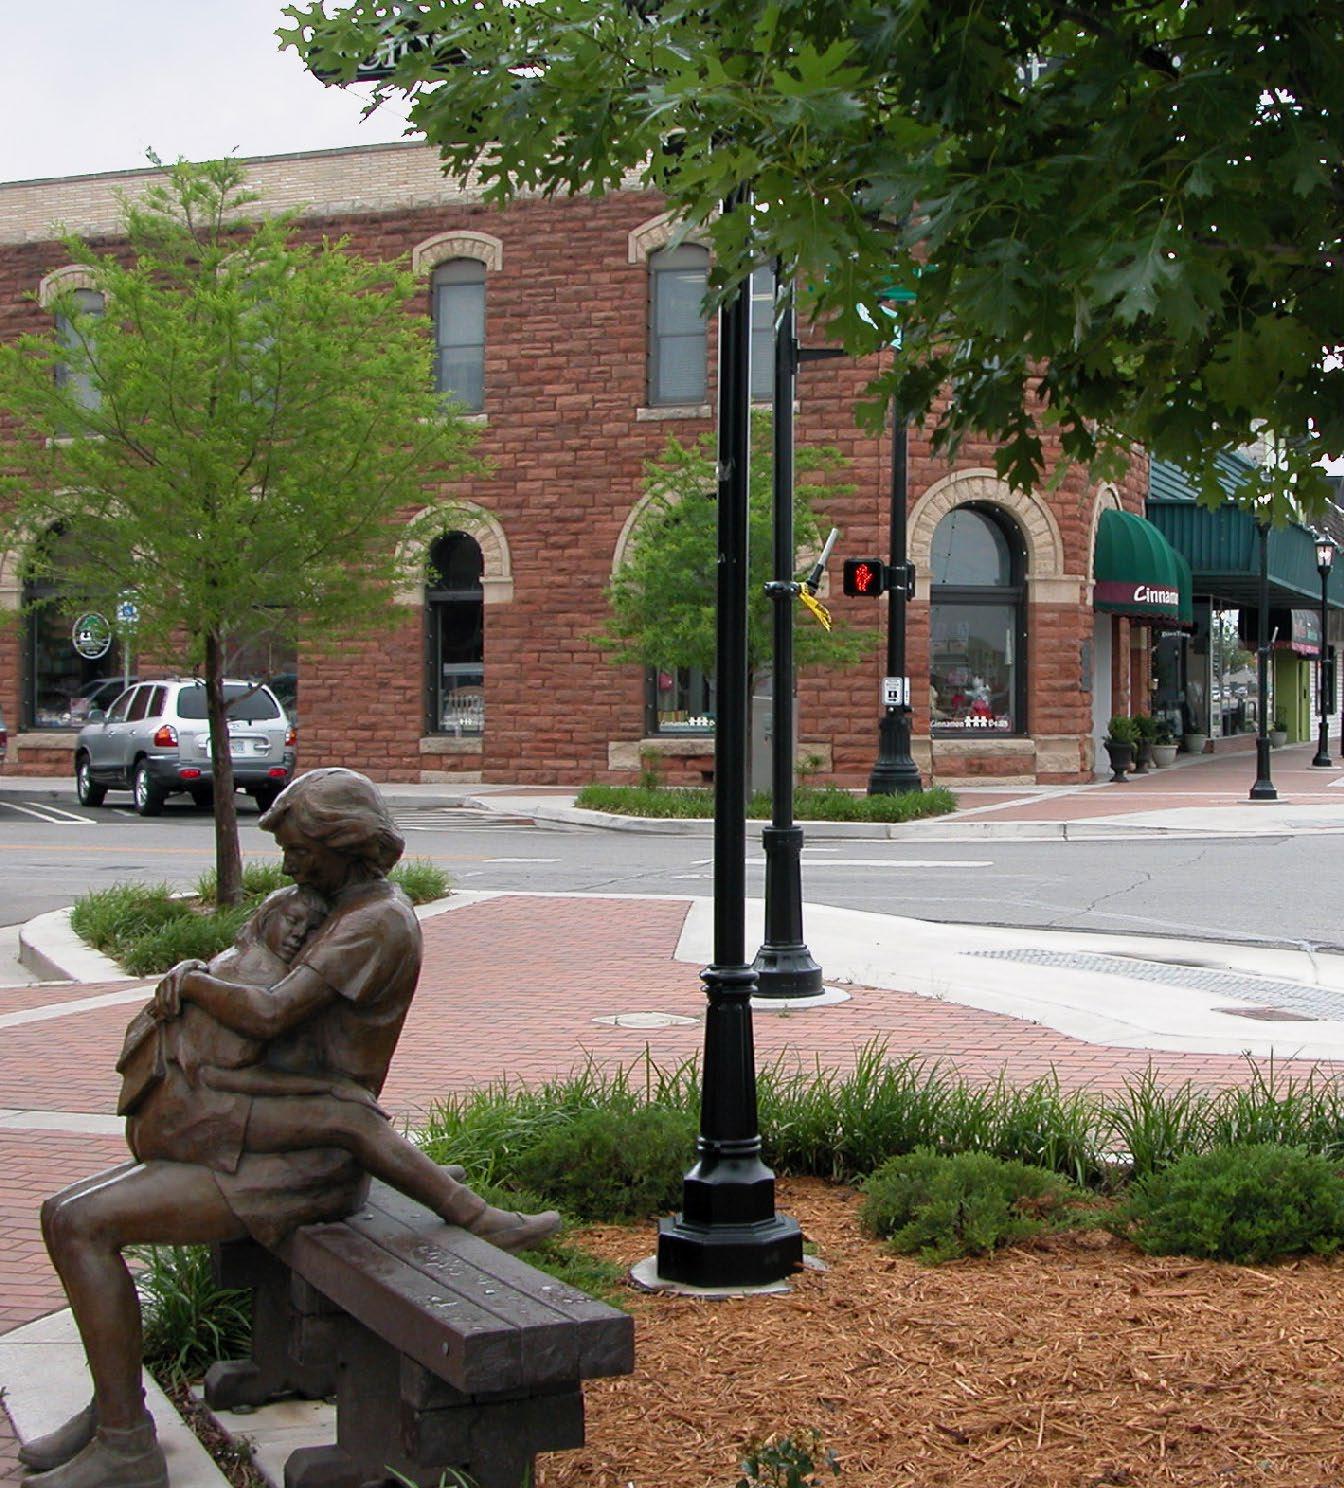

4.4 Click Here for Main Directory Click Here for Sub-Directory
DEPARTMENT: General Government FUND: GENERAL FUND FY 23-24 Prior Year Actual Adopted Year Budget Current Year Revised BUDGET YEARProjected BudgetProjected BudgetProjected BudgetProjected Budget FY 21-22FY 22-23FY 22-23 FY 23-24 FY 24-25FY 25-26FY 26-27FY 27-28 ESTIMATED RESOURCES: REVENUES: Taxes 62,007,045 64,088,515 66,220,984 71,427,362 73,374,546 75,387,283 77,468,220 79,620,123 Inter-governmental 1,838,862 1,840,374 1,865,758 1,773,907 1,791,647 1,809,563 1,827,658 1,845,935 Licenses and Permits 1,947,553 1,657,316 1,708,603 2,504,658 2,537,013 2,569,842 2,603,146 2,636,933 Fines & Forfeitures 1,771,574 1,851,515 1,392,501 1,151,094 1,162,605 1,174,230 1,185,973 1,197,833 Charges for Services 6,478,468 6,634,513 6,892,529 6,646,907 6,712,478 6,778,716 6,845,628 6,913,220 Interest (31,634) 50,000 37,285 50,000 50,000 50,000 50,000 50,000 Investment Income - - - - - - -Capital Lease Proceeds - - - - - - -Miscellaneous Revenue 456,054 658,121 284,044 436,397 438,893 441,413 443,960 446,529 Subtotal - Revenues 74,467,922 76,780,354 78,401,706 83,990,325 86,067,182 88,211,047 90,424,585 92,710,573 OTHER RESOURCES: Debt/Loan Proceeds - - - - - -Restricted Prior Year Reserves (17,620,817) - - 20,356,347 38,279,328 57,517,962 77,137,271 97,241,486 Assigned Prior Year Reserves (Council Projects) - - - - - -Committed Prior Year Reserves - - - - - -Unrestricted Prior Year Reserves - - - - - - -TOTAL ESTIMATED RESOURCES 56,847,106 76,780,354 78,401,706 104,346,672 124,346,510 145,729,009 167,561,856 189,952,059 ESTIMATED USES DIRECT COSTS BY FUNCTION: Personnel Services- - - 16,230 - - -Materials & Supplies 2,358 - - - - - -Other Services & Charges 44,827 476,357 263,192 454,895 304,500 304,500 304,500 304,500 Capital Outlay - - - - - - -Debt Service - - - - - - -TOTAL ESTIMATED COSTS 47,185 476,357 263,192 471,125 304,500 304,500 304,500 304,500 TRANSFERS: Transfers In 19,609,706 21,597,535 21,700,021 19,909,486 20,227,675 20,555,366 20,566,620 20,566,620 Transfers Out (76,409,627) (76,627,552) (79,482,187) (85,505,705) (86,751,723) (88,842,604) (90,582,490) (92,479,433) NET TRANSFERS IN (OUT) (56,799,921) (55,030,017) (57,782,166) (65,596,219) (66,524,048) (68,287,238) (70,015,870) (71,912,813) OTHER USES: Reserve for Employee Obligations Reserve for Council Special Projects - - - - - - -Reserve for Capital Improvements Committed for Other Purposes - - - - - - -Restricted (Reserve for Other Purposes) - - - - - - -Restricted (Reserve for Specific Fund Purposes) 21,273,980 20,356,347 38,279,328 57,517,962 77,137,271 97,241,486 117,734,746 Unassigned (Res for Emergencies & Shortfalls*) TOTAL OTHER USES - 21,273,980 20,356,347 38,279,328 57,517,962 77,137,271 97,241,486 117,734,746 DETAIL OF TRANSFERS OUT: Administrative Support 3,344,425 2,939,815 2,939,815 3,112,984 3,175,244 3,179,944 3,243,543 3,308,414 Fleet Lease Assessment Fee - - - - - - -Fleet Management Fund - - - - - - -Insurance Assessment 2,762 - - - - - -Vehicle Maintenance Fees - - - - - - -Field Services 7,068,932 7,642,686 7,642,686 7,961,993 7,985,817 8,162,528 8,261,979 8,425,085 Sales Tax (EPWA) 14,875,727 15,173,241 14,875,727 15,476,706 15,786,240 16,101,964 16,101,964 16,101,964 Arts in Public Places Fund 468,017 250,000 67,512 200,000 100,000 100,000 100,000 100,000 General Fund - - - - - - -Revenue Bond Funds (EPWA) - - - - - - -Fire Public Safety Limited Tax Fund 21,561,952 22,763,467 24,297,302 24,961,223 25,579,563 26,217,910 26,877,063 27,557,854 Police Public Safety Limited Tax Fund 26,449,330 25,937,147 27,818,652 30,619,100 31,377,597 32,160,637 32,969,197 33,804,301 Capital Improvement Fund 700,000 200,000 200,000 400,000 400,000 400,000 400,000 400,000 Arcadia Lake 203,028 - - - - - -PWA Economic Development 100,454 240,000 159,297 240,000 240,000 240,000 240,000 240,000 Edmond Electric Fund - - - - - - -Golf Course Fund 1,000,000 400,000 400,000 - - - -CityLink - - - - - - -CVB Fund - - - - - - -Additional Transfers 635,000 1,081,196 1,081,196 2,533,699 2,107,262 2,279,621 2,388,744 2,541,815 Total Transfers Out: 76,409,627 76,627,552 79,482,187 85,505,705 86,751,723 88,842,604 90,582,490 92,479,433 4.5 Click Here for Main Directory Click Here for Sub-Directory
SENIOR CITIZENS FUND
The Senior Citizens Fund has been established to account for dedicated revenues received for the benefit of the Senior Center and its patrons which include grants, donations, and other sources. Expenditures of the fund are administratively restricted for the benefit of senior citizens' activities or programs.
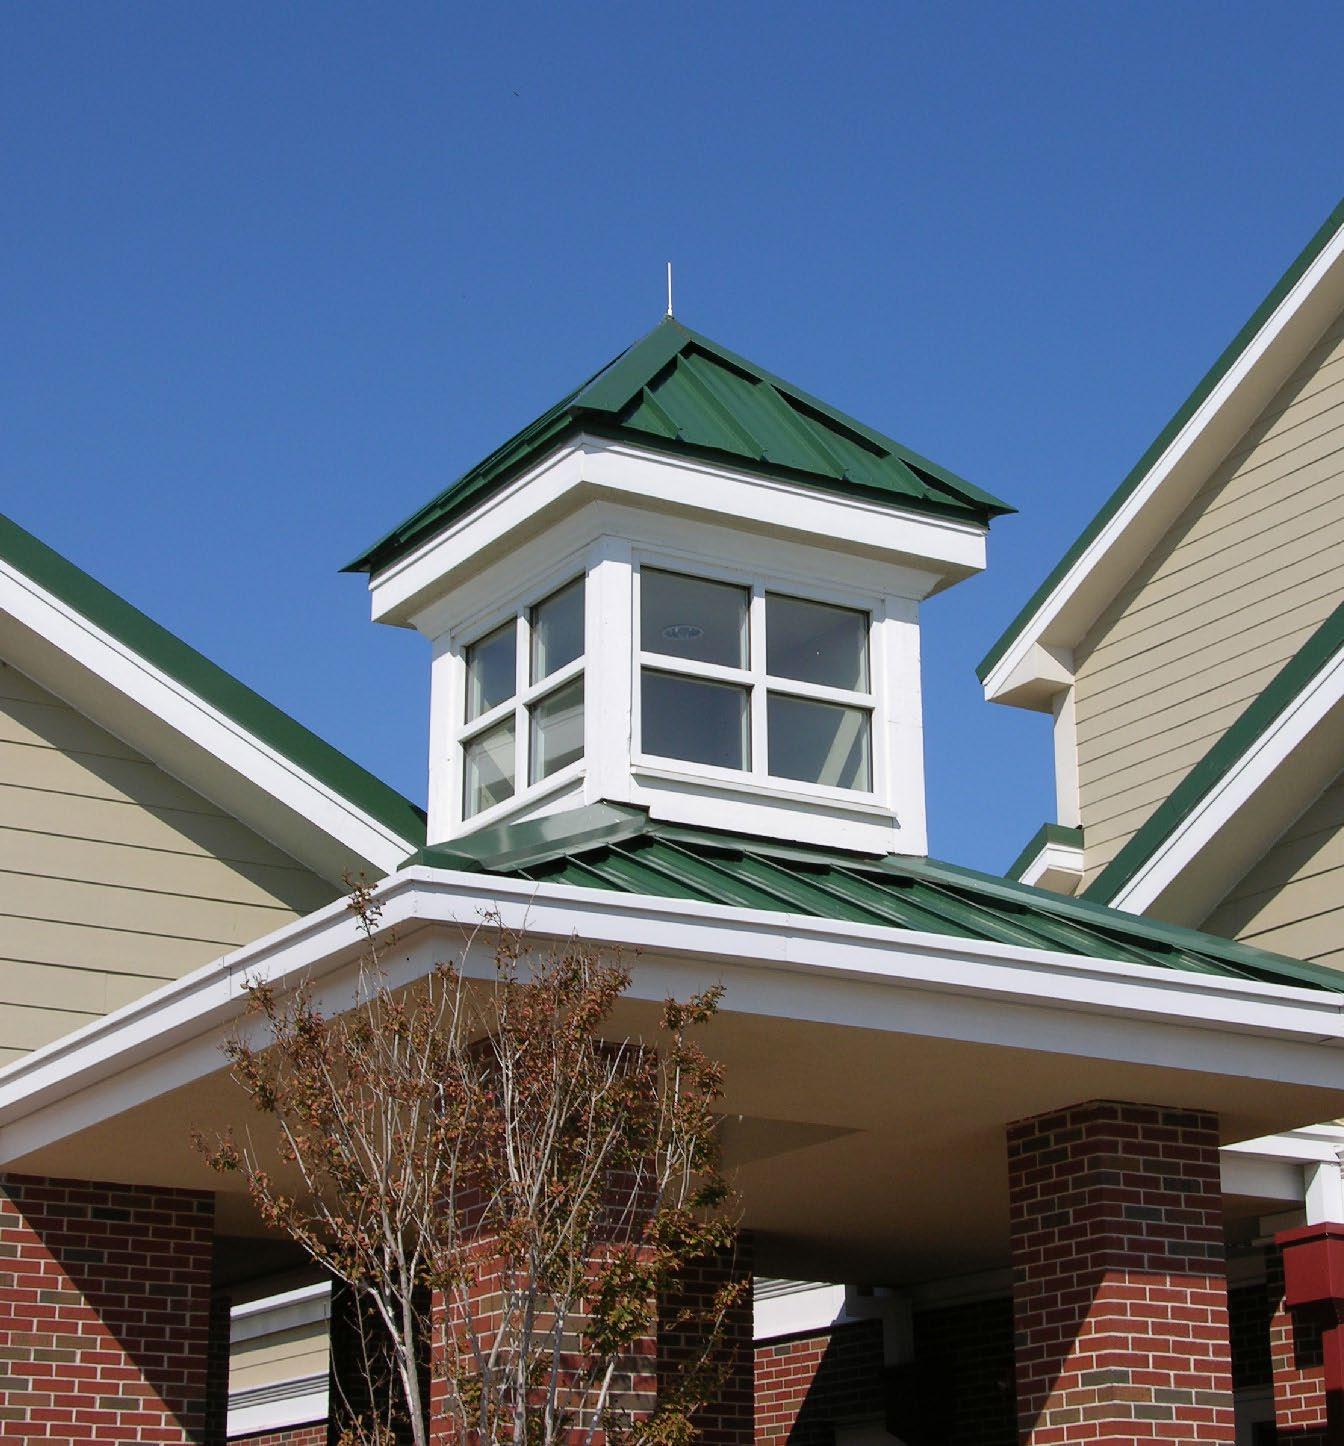

4.6 Click Here for Main Directory Click Here for Sub-Directory
DEPARTMENT: Senior Center FUND: GENERAL FUND FY 23-24 Prior Year Actual Adopted Year Budget Current Year Revised BUDGET YEAR Projected Budget Projected Budget Projected Budget Projected Budget FY 21-22FY 22-23FY 22-23 FY 23-24 FY 24-25FY 25-26FY 26-27FY 27-28 DIRECT COSTS BY FUNCTION: Personnel Services226,589 356,578 304,795 350,706 362,425 374,177 386,160 395,912 Materials & Supplies 18,635 37,050 16,664 37,600 46,350 30,850 35,100 37,350 Other Services & Charges 118,258 103,900 75,310 111,000 105,000 105,000 105,000 105,000 Capital Outlay - - - 20,000 20,000 20,000 20,000 20,000 Debt Service - - - - - - -TOTAL ESTIMATED COSTS 363,483 497,528 396,768 519,306 533,775 530,027 546,260 558,262 DETAIL OF TRANSFERS OUT: Administrative Support 115,589 116,479 116,479 139,691 142,484 142,695 145,549 148,460 Fleet Lease Assessment Fee 13,742 14,837 14,837 15,559 16,316 17,112 17,947 18,824 Fleet Management Fund - - - - - - -Insurance Assessment 4,221 6,999 6,999 6,666 6,999 7,349 7,716 8,102 Vehicle Maintenance Fees 4,846 8,199 3,600 8,199 8,199 8,199 8,199 8,199 Field Services - - - - - - -Sales Tax (EPWA) - - - - - - -Arts in Public Places Fund - - - - - - -General Fund - - - - - - -Revenue Bond Funds (EPWA) - - - - - - -Additional Transfers - - - - - - -Total Transfers Out: 138,398 146,514 141,915 170,115 173,998 175,355 179,411 183,585 4.7 Click Here for Main Directory Click Here for Sub-Directory
EDMOND EMERGENCY MANAGEMENT

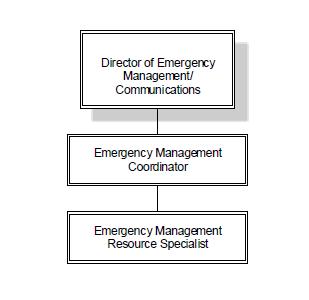
Committed to protecting our citizens from the effects of disasters through mitigation, preparedness, response and recovery actions.” Edmond's Emergency Management Office is focused on promoting and providing public safety in our community. Our planning is toward one goal: that the city and our community will be prepared for dealing with the effects of large scale events affecting public safety and disasters whether natural or man-made. We also provide public education and planning assistance for a variety of emergency management activities. We are dedicated to ensuring coordination and resources in time of need.
Organization Chart


Staffing C URRENT YEAR YEAR 202 4 YEAR 202 5 YEAR 202 6 YEAR 202 7 YEAR 202 8 2.2*-0-0 2.2*-0-0 2.2*-0-0 2.2*-0-0 2.2*-0-0 2.2*-0-0
CONTACT US: Brook Pintens 405.359.4378
*The Director is funded at 20% out of Emergency Management.
4.8 Click Here for Main Directory Click Here for Sub-Directory
DEPARTMENT: Emergency Management FUND: GENERAL FUND FY 23-24 Prior Year Actual Adopted Year Budget Current Year Revised BUDGET YEAR Projected Budget Projected Budget Projected Budget Projected Budget FY 21-22FY 22-23FY 22-23 FY 23-24 FY 24-25FY 25-26FY 26-27FY 27-28 DIRECT COSTS BY FUNCTION: Personnel Services204,012 224,273 239,382 232,468 243,490 252,732 264,263 274,480 Materials & Supplies 5,229 75,850 5,055 32,900 31,250 52,250 31,250 34,450 Other Services & Charges 68,787 86,750 76,028 93,150 96,850 96,850 96,850 96,850 Capital Outlay - 35,000 - 212,083 35,000 35,000 35,000 35,000 Debt Service - - - - - - -TOTAL ESTIMATED COSTS 278,028 421,873 320,466 570,601 406,590 436,832 427,363 440,780 DETAIL OF TRANSFERS OUT: Administrative Support 125,249 89,169 89,169 95,968 97,887 98,032 99,993 101,993 Fleet Lease Assessment Fee 8,115 8,520 8,520 9,354 9,802 10,271 10,765 11,282 Fleet Management Fund - - - - - - -Insurance Assessment 1,437 1,998 1,998 2,322 2,438 2,560 2,688 2,823 Vehicle Maintenance Fees 2,863 4,000 4,800 4,000 4,000 4,000 4,000 4,000 Field Services - - - - - - -Sales Tax (EPWA) - - - - - - -Arts in Public Places Fund - - - - - - -General Fund - - - - - - -Revenue Bond Funds (EPWA) - - - - - - -Additional Transfers - - - - - - -Total Transfers Out: 137,664 103,687 104,487 111,644 114,127 114,863 117,446 120,098 4.9 Click Here for Main Directory Click Here for Sub-Directory
EDMOND Cemetery Fund


The Cemetery’s mission is to serve the Public with their interment needs and provide landscape maintenance for 58.8 acres of Cemetery grounds. The Cemetery averages 150 interments per year; 90 stakings for monument companies; 20 Veteran Markers; and continue to sell burial spaces per year. With the first phase of Cemetery expansion completed, the estimate of burial spaces is 20-25 years.

• The oldest tombstone in the cemetery is dated 1893.
• Gracelawn Cemetery was called Fair Lawn form 1897 to 1903, due to unknown reasons
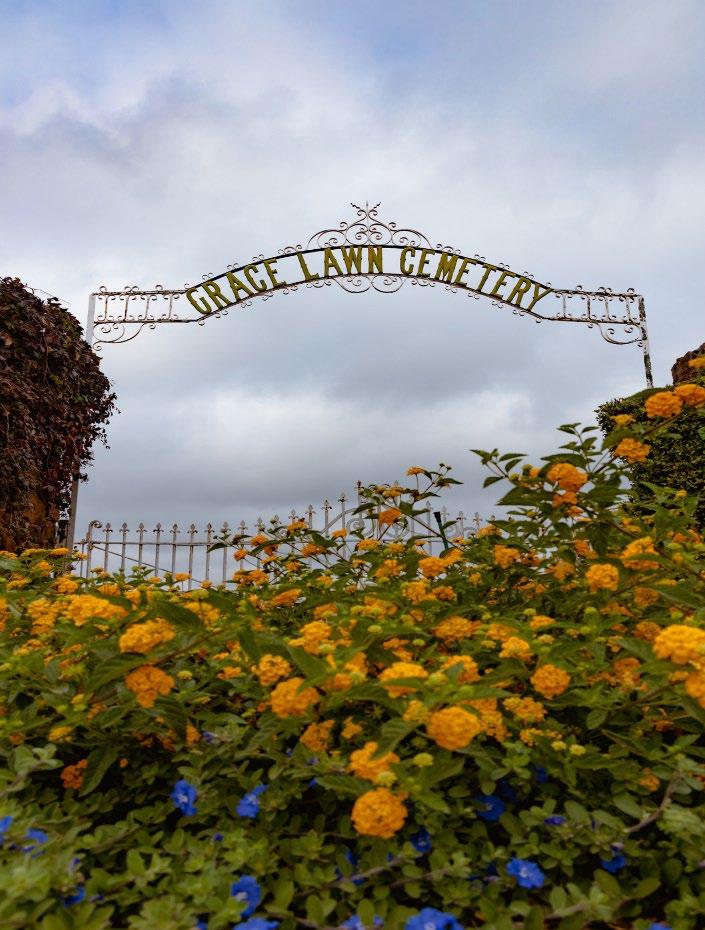


• The wall surrounding the cemetery was built by WPA in 1939-1940.

DID YOU KNOW? Contact Us Manager- Jamie C. Whitworth Gracelawn Cemetery 1407 N. Boulevard Edmond, OK 73034 Office- (405) 216-7645 Cell- (405)403-3087 Jamie.Whitworth@edmondok.gov
4.10 Click Here for Main Directory Click Here for Sub-Directory
DEPARTMENT: Cemetery FUND: GENERAL FUND FY 23-24 Prior Year Actual Adopted Year Budget Current Year Revised BUDGET YEAR Projected Budget Projected Budget Projected Budget Projected Budget FY 21-22FY 22-23FY 22-23 FY 23-24 FY 24-25FY 25-26FY 26-27FY 27-28 DIRECT COSTS BY FUNCTION: Personnel Services220,037 249,699 253,602 257,144 264,473 268,634 272,481 276,365 Materials & Supplies 17,453 18,050 16,642 18,050 18,050 18,050 21,216 18,050 Other Services & Charges 70,802 112,065 54,879 112,065 112,065 112,065 112,065 112,065 Capital Outlay - - - - - - -Debt Service - - - - - - -TOTAL ESTIMATED COSTS 308,292 379,814 325,122 387,259 394,588 398,749 405,762 406,480 DETAIL OF TRANSFERS OUT: Administrative Support 113,717 124,493 124,493 153,175 156,238 156,469 159,599 162,791 Fleet Lease Assessment Fee 10,707 11,446 11,446 12,008 12,598 13,218 13,869 14,552 Fleet Management Fund - - - - - - -Insurance Assessment 14,541 17,309 17,309 17,339 18,206 19,117 20,072 21,076 Vehicle Maintenance Fees 3,322 5,000 6,000 5,000 5,000 5,000 5,000 5,000 Field Services - - - - - - -Sales Tax (EPWA) - - - - - - -Arts in Public Places Fund - - - - - - -General Fund - - - - - - -Revenue Bond Funds (EPWA) - - - - - - -Additional Transfers - - - - - - -Total Transfers Out: 142,286 158,248 159,248 187,522 192,042 193,804 198,540 203,419 4.11 Click Here for Main Directory Click Here for Sub-Directory
FestivalMarketplace

The Festival Market Place's mission is to be a focal point for community life and a setting for cultural and civic activities and special events, which compliment the Festival Market Place and its location in the Downtown Edmond business district. The Festival Market Place is home to the Edmond Farmers Market (spring, summer and fall), many City of Edmond Sponsored and Affiliated events, and can be rented for private functions, such as wedding receptions and customer appreciation events.
DID YOU KNOW?


The Edmond Farmer's Market has operated since 1988, starting in the Downtown Community Center parking lot and moving to Festival Market Place when it was built/opened in May 2004.


The Market is the site of the popular Kentucky Daisy Statue. The statue represents the first female landowner, reporter Nanitta R.H. Daisey, who claimed land in the 1889 land run
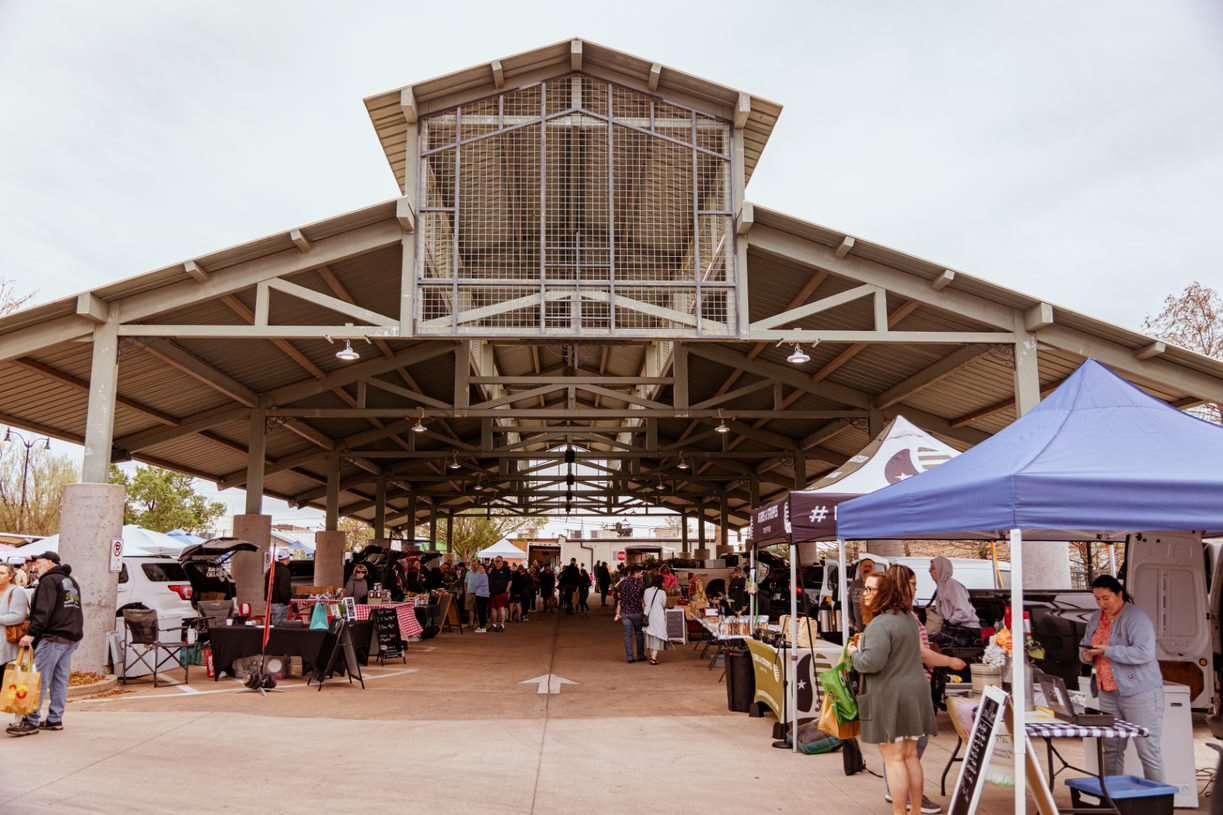
Staffing CURRENT YEAR YEAR 2024 YEAR 2025 YEAR 2026 YEAR 2027 YEAR 2028 1-0-2* 1-0-2 1-0-2 1-0-2 1-0-2 1-0-2 *Staffing includes Park Admin, Park Maintenance, Cemetery, Recreation, PelicanBay, Parks Tax, and Mitch Park Maintenance crew. The MAC Building custodian is counted as.5 FT in Parksand .5FT in Senior Center. ContactUs Emily Young Ph (405) 216-7634 Website: www.edmondparks.com
4.12 Click Here for Main Directory Click Here for Sub-Directory
DEPARTMENT: Festival Marketplace FUND: GENERAL FUND FY 23-24 Prior Year Actual Adopted Year Budget Current Year Revised BUDGET YEAR Projected Budget Projected Budget Projected Budget Projected Budget FY 21-22FY 22-23FY 22-23 FY 23-24 FY 24-25FY 25-26FY 26-27FY 27-28 DIRECT COSTS BY FUNCTION: Personnel Services25,061 105,503 54,675 75,835 78,831 81,350 84,425 87,270 Materials & Supplies7,035 8,512 6,444 6,490 9,012 5,915 5,915 5,915 Other Services & Charges 19,316 45,950 38,329 47,650 48,700 48,700 48,700 48,700 Capital Outlay - - - - - - -Debt Service - - - - - - -TOTAL ESTIMATED COSTS 51,412 159,965 99,448 129,975 136,543 135,965 139,040 141,885 DETAIL OF TRANSFERS OUT: Administrative Support 30,885 41,765 41,765 5,426 5,534 5,543 5,653 5,766 Fleet Lease Assessment Fee - - - - - - -Fleet Management Fund - - - - - - -Insurance Assessment 37 297 297 358 375 394 414 435 Vehicle Maintenance Fees - - - - - - -Field Services - - - - - - -Sales Tax (EPWA) - - - - - - -Arts in Public Places Fund - - - - - - -General Fund - - - - - - -Revenue Bond Funds (EPWA) - - - - - - -Additional Transfers - - - - - - -Total Transfers Out: 30,922 42,062 42,062 5,784 5,909 5,937 6,067 6,201 4.13 Click Here for Main Directory Click Here for Sub-Directory
EDMOND Building and Fire Code Services


The mission of the Building and Fire Code Services Department is to provide professional support in protecting the health, safety, and public welfare in the built environment of the community. Department employees perform plan review, permitting, and field inspections to ensure compliance with currently adopted building, state, and local codes consistent with the policies and ordinances adopted by the City of Edmond.

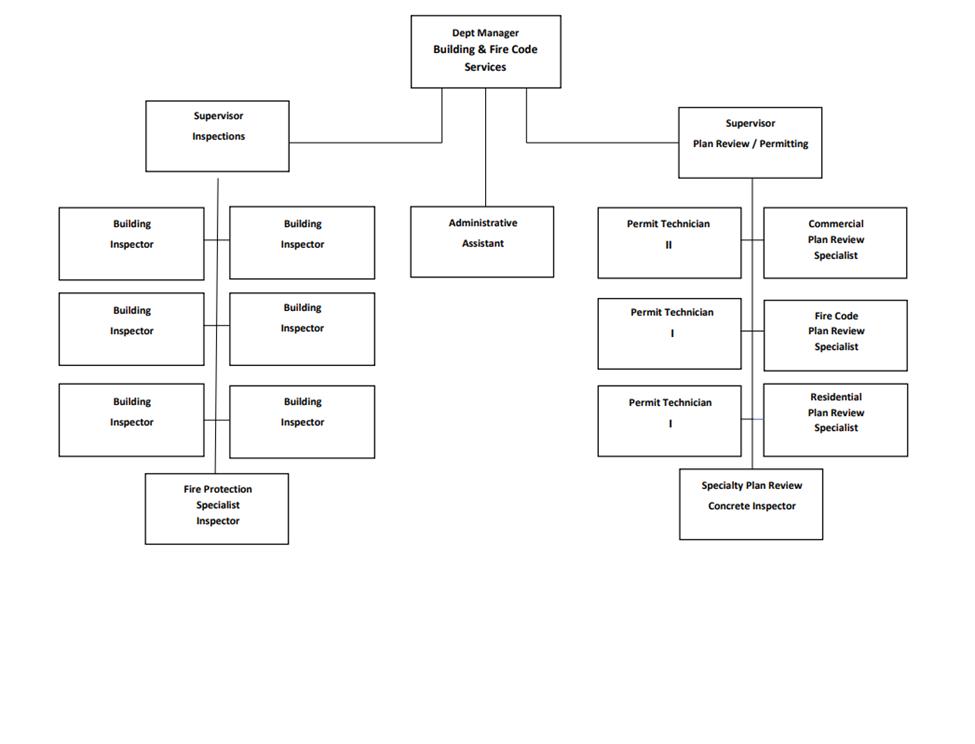
Staffing C URRENT YEAR YEAR 202 4 YEAR 202 5 YEAR 202 6 YEAR 202 7 YEAR 202 8 18-0-0 18-0-0 19-0-0 20-0-0 21-0-0 21-0-0 Contact Us Phone: (405) 359-4780 Online Applicant Portal: Permits.edmondok.gov buildingadministration@edmondok.com www.edmondok.gov/bfcs
Organization Chart
4.14 Click Here for Main Directory Click Here for Sub-Directory
DEPARTMENT: Building Services FUND: GENERAL FUND FY 23-24 Prior Year Actual Adopted Year Budget Current Year Revised BUDGET YEAR Projected Budget Projected Budget Projected Budget Projected Budget FY 21-22FY 22-23FY 22-23 FY 23-24 FY 24-25FY 25-26FY 26-27FY 27-28 DIRECT COSTS BY FUNCTION: Personnel Services1,435,699 1,717,818 1,629,898 1,785,051 1,859,134 1,911,574 1,951,708 1,985,184 Materials & Supplies57,057 79,940 50,776 61,318 68,437 67,286 72,016 76,450 Other Services & Charges88,445 127,090 97,013 131,836 138,429 145,349 153,328 159,945 Capital Outlay - - - - - - -Debt Service - - - - - - -TOTAL ESTIMATED COSTS 1,581,201 1,924,848 1,777,687 1,978,205 2,066,000 2,124,209 2,177,052 2,221,579 DETAIL OF TRANSFERS OUT: Administrative Support 364,856 443,033 443,033 482,978 492,638 493,367 503,234 513,299 Fleet Lease Assessment Fee 25,768 24,924 24,924 27,104 28,367 29,694 31,087 32,549 Fleet Management Fund - - - - - - -Insurance Assessment 21,768 25,566 25,566 31,952 33,550 35,227 36,989 38,838 Vehicle Maintenance Fees 29,843 32,000 32,000 33,600 35,280 37,044 38,896 40,841 Field Services - - - - - - -Sales Tax (EPWA) - - - - - - -Arts in Public Places Fund - - - - - - -General Fund - - - - - - -Revenue Bond Funds (EPWA) - - - - - - -Additional Transfers - - - - - - -Total Transfers Out: 442,235 525,523 525,523 575,634 589,835 595,332 610,206 625,527 4.15 Click Here for Main Directory Click Here for Sub-Directory
CITY COUNCIL
DEPARTMENTAL SUMMARY
The Edmond City Council’s vision is that Edmond will be a diverse and innovative hometown committed to excellence through leadership, balanced growth, and cooperation. These high standards will only be accomplished in full partnership with the community.
The mission of the Edmond City Council is to lead by setting policy for City direction, by balancing growth, and by serving as stewards of assets for today’s, as well as tomorrow’s, community & citizens. The following goals were adopted in the Spring of 2023. Prioritization scale is from highest (★★★★) to lowest (★).
STRATEGIC INITIATIVE 1: ECONOMIC DEVELOPMENT
Pursue appropriate transit and mobility solutions for residents of a modern, growing city
• Utilize recommendations from ULI Study of Downtown to enhance pedestrian safety and provide linkage across major roadways (★ ★ ★ ★)
• Pursue alternate funding methods for transportation project needs (★ ★ ★ ★)
Engage in aggressive economic development to create more local jobs and generate revenue to serve our residents
• Redevelop vacated city-owned properties in Downtown after office consolidation (★ ★ ★ ★)
Promote tourism and conference opportunities to enhance visitor experience and economic impact
• Support the development and implementation of a new master plan for Arcadia Lake (★ ★ ★)
STRATEGIC INITIATIVE 2: QUALITY OF LIFE
Ensure the highest level of city services that are fiscally responsible, well-staffed and technologically advanced
• Redevelop city-owned properties to include new City Hall & parking garage (★ ★ ★ ★)
Carefully and thoughtfully manage future capital project needs
• Support the construction of upgrades to AC Caplinger Ballfields at Hafer Park (★ ★ ★)
STRATEGIC INITIATIVE 3: COMMUNITY DEVELOPMENT
Promote a variety of affordable housing in Edmond, including more dense, multi-family options, to meet the needs of a diverse community and workforce
• Conduct an assessment/index of housing options available in Edmond to determine gaps (★ ★ ★ ★)
Encourage and support sustainability efforts that preserve and protect the environment for future generations
• Implement solutions to meet priorities identified by community mental health needs assessment (★ ★ ★ ★)
Ensure a healthy and diverse community by promoting neighborhoods, recreational resources, and community development policies and procedures
• Implement flexibility into code to encourage Low Impact Development methods (★ ★ ★)
Support efforts to create and maintain an efficient development process that utilizes effective technology and tactics
• Implement the 2050 East Edmond Plan (★ ★ ★ ★)
STRATEGIC INITIATIVE 4: PEOPLE & PARTNERSHIPS
Strengthen relationships at all levels of government to ensure the highest level of service for residents
• Create appropriate partnership(s) to pursue potential Performing Arts Center in Downtown Edmond (★)
4.16 Click Here for Main Directory Click Here for Sub-Directory
DEPARTMENT: City Council FUND: GENERAL FUND FY 23-24 Prior Year Actual Adopted Year Budget Current Year Revised BUDGET YEAR Projected Budget Projected Budget Projected Budget Projected Budget FY 21-22FY 22-23FY 22-23 FY 23-24 FY 24-25FY 25-26FY 26-27FY 27-28 DIRECT COSTS BY FUNCTION: Personnel Services49,223 50,977 52,706 49,090 49,090 49,090 49,090 49,090 Materials & Supplies942 8,000 1,209 6,150 6,150 7,650 6,150 6,150 Other Services & Charges 289,527 472,900 394,117 511,000 551,000 551,500 551,500 551,500 Capital Outlay - - - - - - -Debt Service - - - - - - -TOTAL ESTIMATED COSTS 339,693 531,877 448,032 566,240 606,240 608,240 606,740 606,740 DETAIL OF TRANSFERS OUT: Administrative Support 631,969 727,674 727,674 911,633 929,865 931,242 949,867 968,864 Fleet Lease Assessment Fee - - - - - - -Fleet Management Fund - - - - - - -Insurance Assessment 1,581 3,385 3,385 3,117 3,273 3,437 3,609 3,789 Vehicle Maintenance Fees - - - - - - -Field Services - - - - - - -Sales Tax (EPWA) - - - - - - -Arts in Public Places Fund - - - - - - -General Fund - - - - - - -Revenue Bond Funds (EPWA) - - - - - - -Transfer to CVB - - - - - - -Transfer to Luminance/Elect - - - - - - -Additional Transfers - - - - - - -Total Transfers Out: 633,550 731,059 731,059 914,750 933,138 934,679 953,476 972,653 4.17 Click Here for Main Directory Click Here for Sub-Directory
Historical Society

The Edmond Historical Society is a 501(c)(3) nonprofit organization that was formed in 1983 and incorporated in 1984. It was formed to establish, maintain, and operate a local museum of history as well as to collect, preserve, and exhibit artifacts, photographs and documents that interpret the history and development of Edmond and the surrounding area.
PURPOSE
The Society shall assume the responsibility of all functions of the Museum under the direction of the Board of Directors.
The Museum collection shall be the sole property of the Society as defined in the collection policy.
The Museum shall exhibit and interpret the history of Edmond and the surrounding area, shall engage traveling exhibits, and shall offer educational programs, including off-site exhibits.


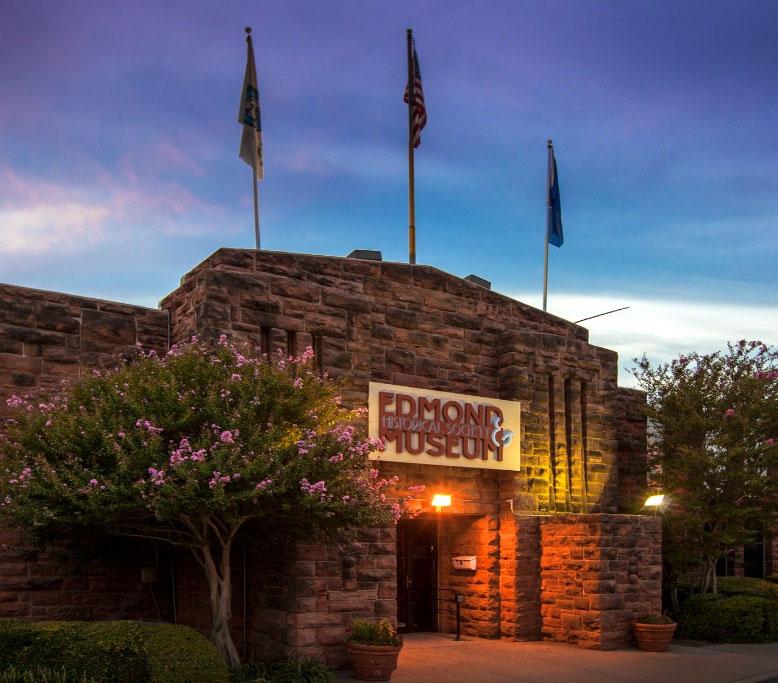
The Museum shall be open to the public on an established schedule at a minimum of 120 days per calendar year and closed on legal holidays, shall schedule special events, and shall be staffed by docents, volunteers, and/or staff during open hours.
DID YOU KNOW?

The museum’s collection of 40,000+ artifacts and photographs highlight over a century of Edmond history.
Programs are offered for children, families, adults, and schools. These programs include Living History summer camps, programs for toddlers in our gallery, our historical tea, and free art activities during school breaks.
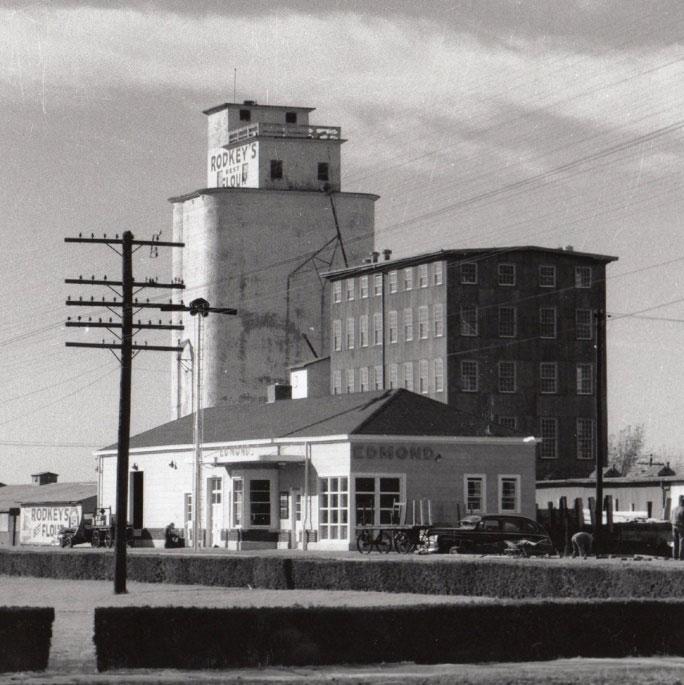
CONTACT Ph (405) 340-0078 edmondhistory.org
EDMOND
4.18 Click Here for Main Directory Click Here for Sub-Directory
DEPARTMENT: Historical Society FUND: GENERAL FUND FY 23-24 EXPENDITURE Prior Year Actual Adopted Year Budget Current Year Revised BUDGET YEAR Projected Budget Projected Budget Projected Budget Projected Budget CLASSIFICATION FY 21-22FY 22-23FY 22-23 FY 23-24 FY 24-25FY 25-26FY 26-27FY 27-28 DIRECT COSTS BY FUNCTION: Personnel Services- - - - - - -Materials & Supplies - 750 - 750 750 750 750 750 Other Services & Charges 309,028 321,750 321,750 321,750 321,750 321,750 321,750 321,750 Capital Outlay - - - - - - -Debt Service - - - - - - -TOTAL ESTIMATED COSTS 309,028 322,500 321,750 322,500 322,500 322,500 322,500 322,500 DETAIL OF TRANSFERS OUT: Administrative Support 5,992 6,095 6,095 5,101 5,203 5,210 5,315 5,421 Fleet Lease Assessment Fee - - - - - - -Fleet Management Fund - - - - - - -Insurance Assessment 3,550 3,920 3,920 4,248 4,460 4,683 4,917 5,163 Vehicle Maintenance Fees - - - - - - -Field Services - - - - - - -Sales Tax (EPWA) - - - - - - -Arts in Public Places Fund - - - - - - -General Fund - - - - - - -Revenue Bond Funds (EPWA) - - - - - - -Additional Transfers - - - - - - -Total Transfers Out: 9,542 10,015 10,015 9,349 9,663 9,89310,232 10,584 4.19 Click Here for Main Directory Click Here for Sub-Directory
EDMOND Parks and Recreation


The Parks and Recreation Department's vision is to provide a premier parks and recreation system with well-maintained facilities, outstanding programs, and a customer loyalty focus. Funding for maintenance operations and recreational programs comes from general tax revenues and the Park Tax Fund. New projects construction/renovations are funded through the Park Tax Fund and The City of Edmond's Capital Improvement Project Fund (CIP). Development of trails, community parks, and athletic facilities, as well as increasing interactive programming for all ages is our current focus.
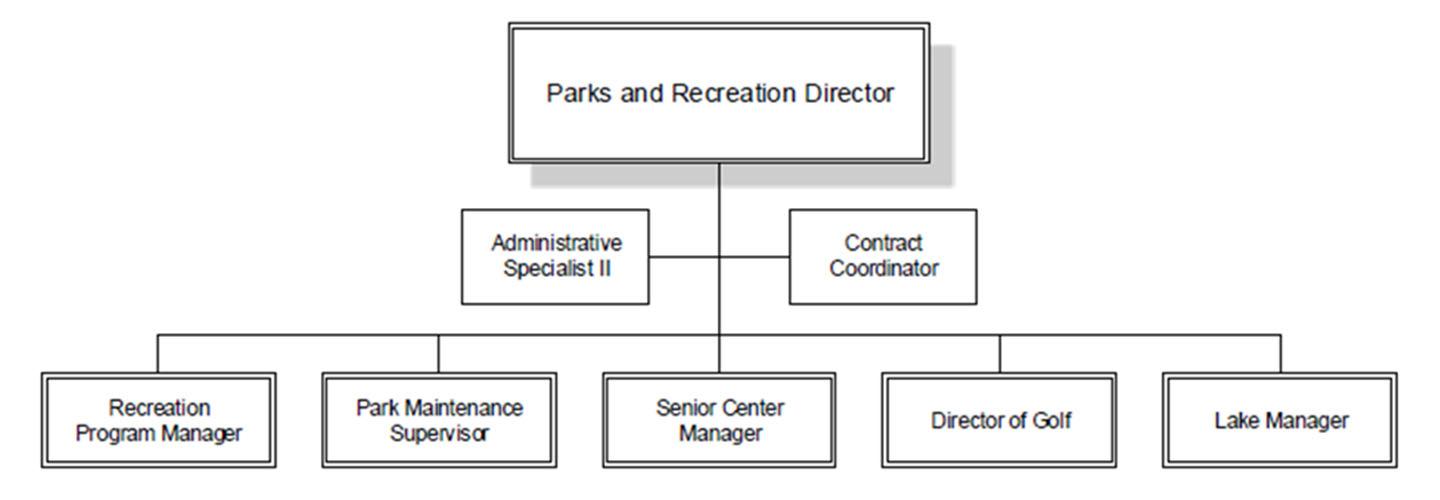
DID
YOU KNOW?
The City of Edmond Parks and Recreation Department puts on community events for families, including concerts in the park, camping adventures, Daddy Daughter dances, movie nights, and more.
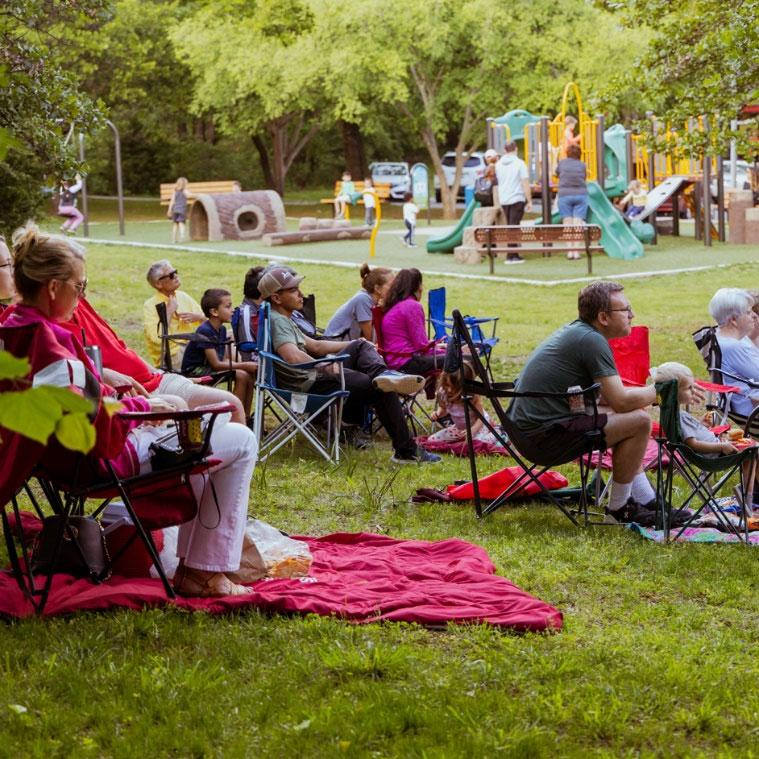

October brings the largest event month, drawing close to 10,000 people with a movie night family camp-out, and a Trunk or Treat event.
Organization Chart


Staffing CURRENT YEAR YEAR 2024 YEAR 2025 YEAR 2026 YEAR 2027 YEAR 2028 23.5*-7-127 23..5*-7-127 23.5*-7-127 23.5*-7-127 23.5*-7-127 23.5*-7-127 *Staffing includes Park Admin, Park Maintenance, Cemetery, Recreation, Pelican Bay, Parks Tax, and Mitch Park Maintenance crew. The MAC Building custodian is counted as .5 FT in Parks and .5 FT in Senior Center. Contact Us Main Number (405) 359-4630 Website: www.edmondparks.com
4.20 Click Here for Main Directory Click Here for Sub-Directory
DEPARTMENT: Parks & Recreation FUND: GENERAL FUND FY 23-24 Prior Year Actual Adopted Year Budget Current Year Revised BUDGET YEAR Projected Budget Projected Budget Projected Budget Projected Budget FY 21-22FY 22-23FY 22-23 FY 23-24 FY 24-25FY 25-26FY 26-27FY 27-28 DIRECT COSTS BY FUNCTION: Personnel Services1,291,669 1,460,595 1,386,296 1,490,919 1,496,007 1,539,296 1,585,879 1,628,702 Materials & Supplies164,463 237,186 203,049 296,265 240,717 229,848 231,445 229,165 Other Services & Charges 1,065,287 1,286,100 978,928 1,315,850 1,314,750 1,326,600 1,326,600 1,326,600 Capital Outlay - 175,000 - 131,278 - - -Debt Service - - - - - - -TOTAL ESTIMATED COSTS 2,521,419 3,158,881 2,568,274 3,234,312 3,051,474 3,095,744 3,143,924 3,184,467 DETAIL OF TRANSFERS OUT: Administrative Support 476,981 557,528 557,528 614,002 626,283 627,209 639,753 652,548 Fleet Lease Assessment Fee 46,862 49,514 49,514 52,114 54,627 57,266 60,038 62,948 Fleet Management Fund - - - - - - -Insurance Assessment 37,458 42,886 42,886 44,304 46,520 48,845 51,287 53,852 Vehicle Maintenance Fees 16,372 20,500 24,600 20,500 20,500 20,500 20,500 20,500 Field Services - - - - - - -Sales Tax (EPWA) - - - - - - -Arts in Public Places Fund - - - - - - -General Fund - - - - - - -Revenue Bond Funds (EPWA) - - - - - - -Additional Transfers - - - - - - -Total Transfers Out: 577,673 670,428 674,528 730,920 747,930 753,820 771,578 789,848 4.21 Click Here for Main Directory Click Here for Sub-Directory
STREET&ALLEYFUND


Per State Statute 11:1 Section 36-114; a municipal governing body which receives money from the state under the motor fuel tax or under the motor vehicle license and registration tax act may expend such money out of the street and alley fund of the general fund for construction, maintenance, repair, improvement, or lighting of streets and alleys. The City uses this fund mostly for reconstruction of rural section countyline roads.
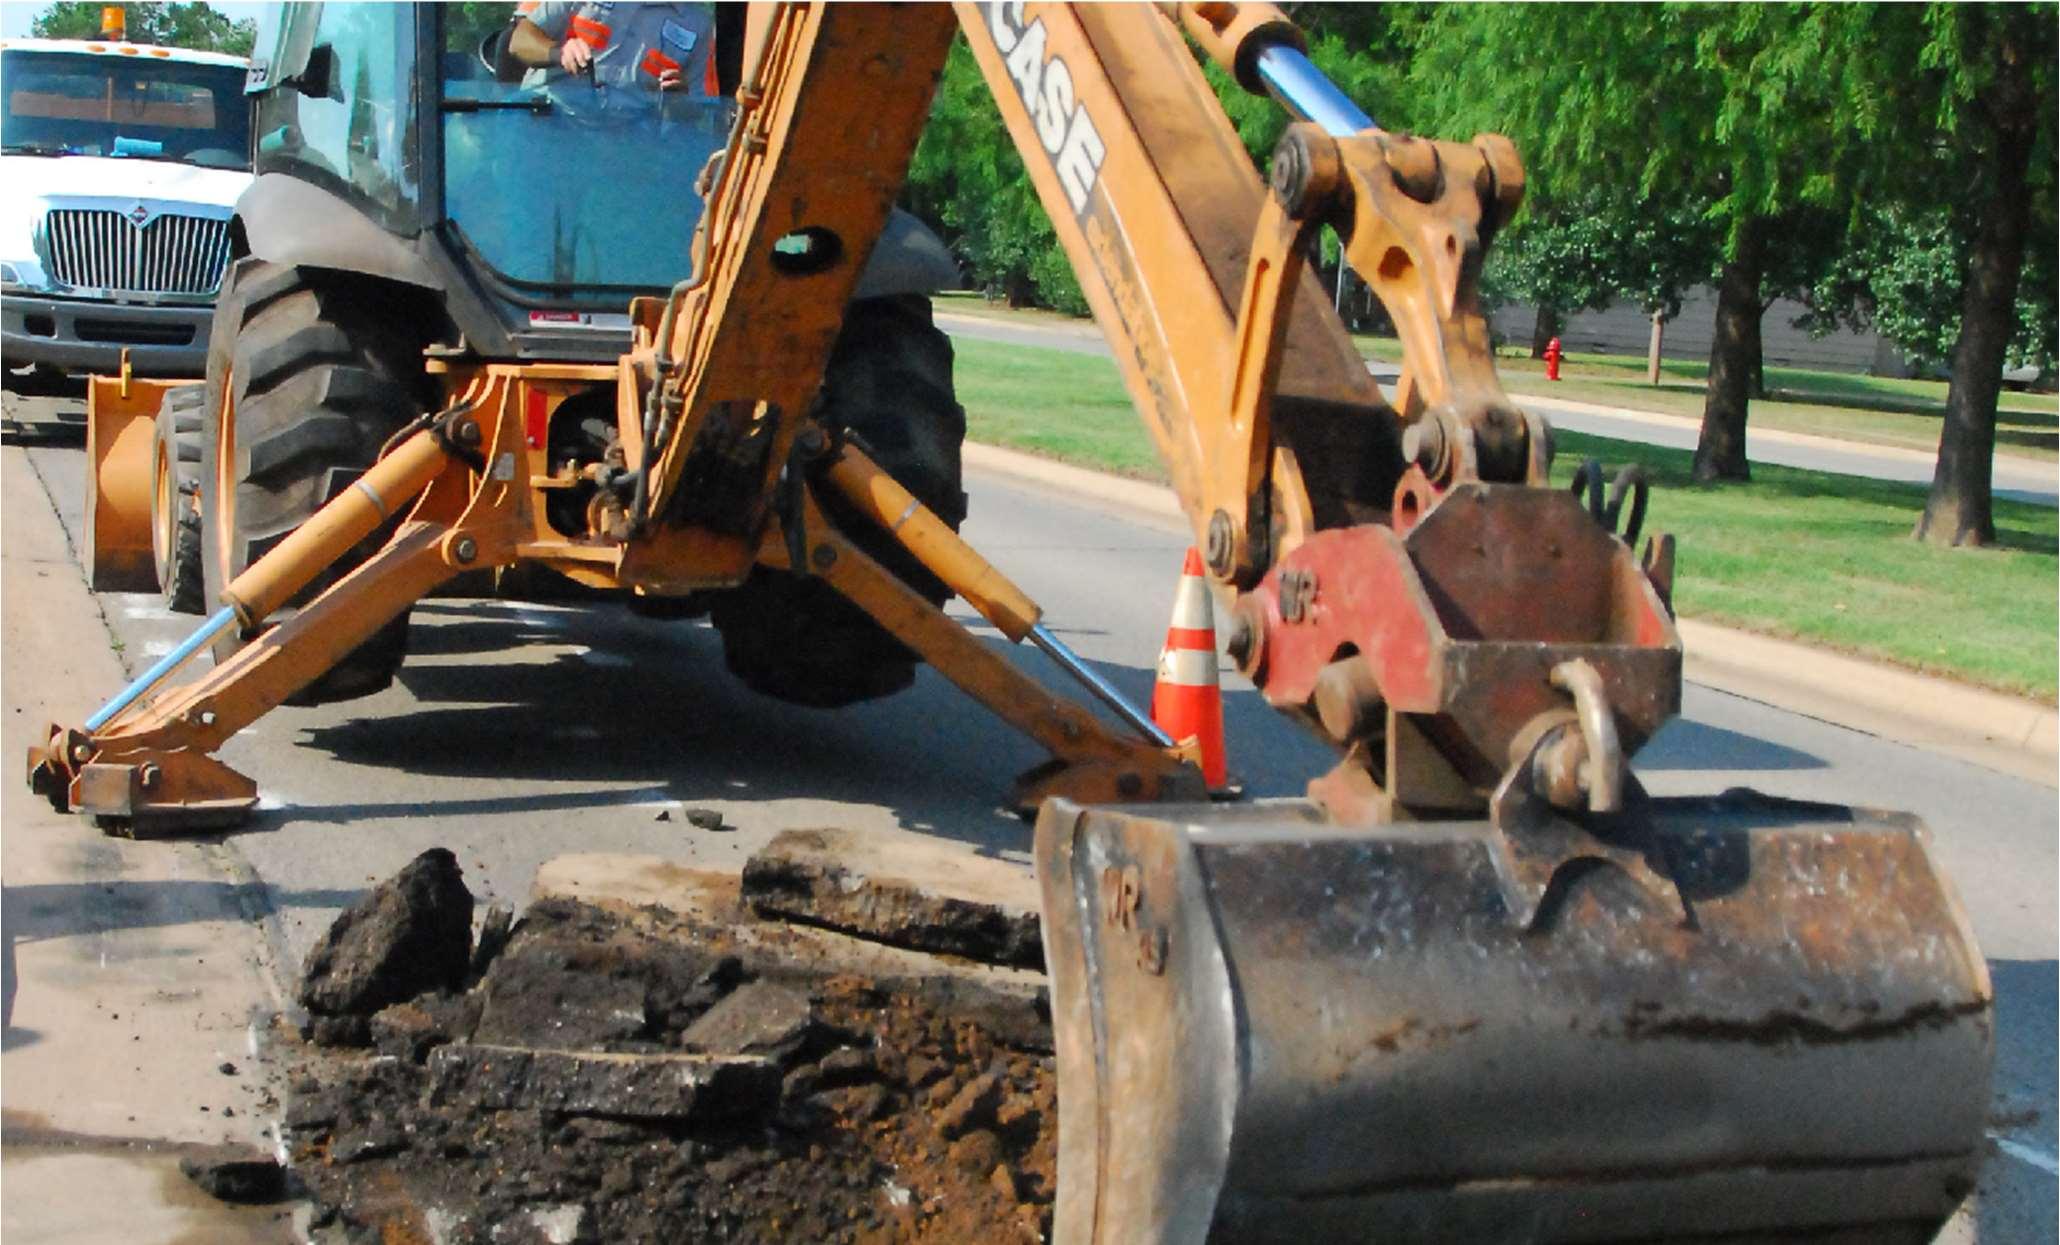
4.22 Click Here for Main Directory Click Here for Sub-Directory
DEPARTMENT: Street & Alley Fund FUND: GENERAL FUND FY 23-24 Prior Year Actual Adopted Year Budget Current Year Revised BUDGET YEAR Projected Budget Projected Budget Projected Budget Projected Budget FY 21-22FY 22-23FY 22-23 FY 23-24 FY 24-25FY 25-26FY 26-27FY 27-28 DIRECT COSTS BY FUNCTION: Personnel Services- - - - - - -Materials & Supplies - - - - - - -Other Services & Charges - - - - - - -Capital Outlay 1,125,427 1,260,000 839,092 1,550,000 965,000 1,100,000 1,100,000 1,100,000 Debt Service- - - - - - -TOTAL ESTIMATED COSTS 1,125,427 1,260,000 839,092 1,550,000 965,000 1,100,000 1,100,000 1,100,000 DETAIL OF TRANSFERS OUT: Administrative Support - - - - - - -Fleet Lease Assessment Fee - - - - - - -Fleet Management Fund - - - - - - -Insurance Assessment - - - - - - -Vehicle Maintenance Fees - - - - - - -Field Services - - - - - - -Sales Tax (EPWA) - - - - - - -Arts in Public Places Fund - - - - - - -General Fund - - - - - - -Revenue Bond Funds (EPWA) - - - - - - -Additional Transfers - - - - - - -Total Transfers Out: - - - - - - -4.23 Click Here for Main Directory Click Here for Sub-Directory
EDMOND Municipal Court
The Municipal Court is the judicial branch of city government. The fundamental purpose of the Municipal Court is to provide an impartial forum for citizens to be heard in a professional and just environment on matters related to possible violations of city ordinance(s). The Municipal Court ensures due process of law procedures and commits to administering justice in a fair, efficient and timely manner. The Municipal Court is responsible for case management, collection of fines, fees and state costs; filing citations/complaints; docket scheduling; issuing, tracking and clearing warrants; maintaining records of collections, convictions and statistical data.

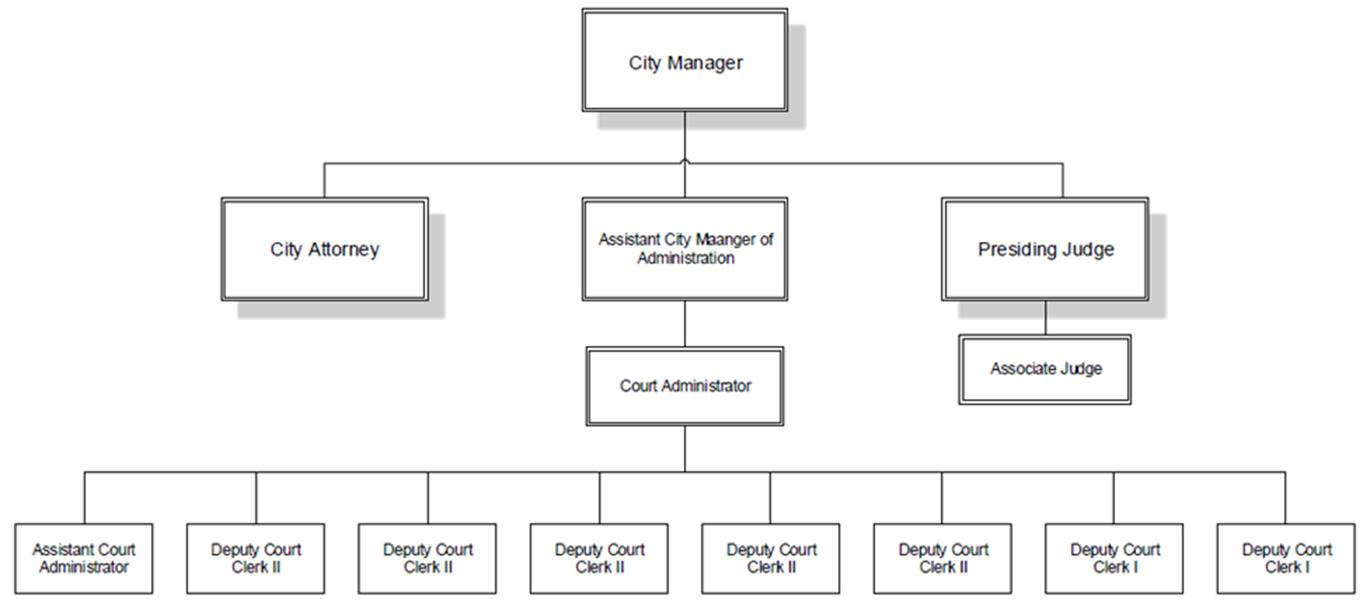
DID YOU KNOW?

We allow the University of Central Oklahoma Criminal Justice program to use our Court room for mock trials.
We partner with other agencies so juveniles can gain various community credit through their programs.


Support Staff: CURRENT YEAR YEAR 2024 YEAR 2025 YEAR 2026 YEAR 2027 YEAR 2028 0-9-0 0-10-0 0-10-0 0-10-0 0-10-0 0-10-0 Judicial Staff: CURRENT YEAR YEAR 2024 YEAR 2025 YEAR 2026 YEAR 2027 YEAR 2028 0-2-0 0-2-0 0-2-0 0-2-0 0-2-0 0-2-0 Contact Us Main Number (405) 359-4630 Website: edmondok.com/MunicipalCourt
Organization Chart Staffing
4.24 Click Here for Main Directory Click Here for Sub-Directory
DEPARTMENT: Municipal Court FUND: GENERAL FUND FY 23-24 Prior Year Actual Adopted Year Budget Current Year Revised BUDGET YEAR Projected Budget Projected Budget Projected Budget Projected Budget FY 21-22FY 22-23FY 22-23 FY 23-24 FY 24-25FY 25-26FY 26-27FY 27-28 DIRECT COSTS BY FUNCTION: Personnel Services728,686 885,918 847,208 988,437 1,029,305 1,065,222 1,102,678 1,142,968 Materials & Supplies 15,606 21,410 12,186 78,800 59,015 55,828 54,400 54,400 Other Services & Charges 126,023 185,470 58,736 207,670 228,250 228,250 228,120 228,120 Capital Outlay - - - - - - -Debt Service - - - - - - -TOTAL ESTIMATED COSTS 870,315 1,092,798 918,130 1,274,907 1,316,570 1,349,300 1,385,198 1,425,488 DETAIL OF TRANSFERS OUT: Administrative Support 518,641 734,177 734,177 687,854 701,611 702,650 716,703 731,037 Fleet Lease Assessment Fee - - - - - - -Fleet Management Fund - - - - - - -Insurance Assessment 8,767 8,293 8,293 9,253 9,716 10,202 10,712 11,247 Vehicle Maintenance Fees - - - - - - -Field Services - - - - - - -Sales Tax (EPWA) - - - - - - -Arts in Public Places Fund - - - - - - -General Fund - - - - - - -Revenue Bond Funds (EPWA) - - - - - - -Additional Transfers - - 7,200 - - - -Total Transfers Out: 527,408 742,470 749,670 697,107 711,327 712,852 727,415 742,284 4.25 Click Here for Main Directory Click Here for Sub-Directory
EDMOND Community Image

The Community Image department is comprised of work groups: Code Enforcement & Urban Forestry. Though their daily duties differ, their primary goal is to support a healthy physical environment for the citizens and visitors.
DID YOU KNOW?
Urban Forestry hosts a tree seedling distribution at the Edmond Public Works/Edmond Electric Open House each fall.
Organization Chart
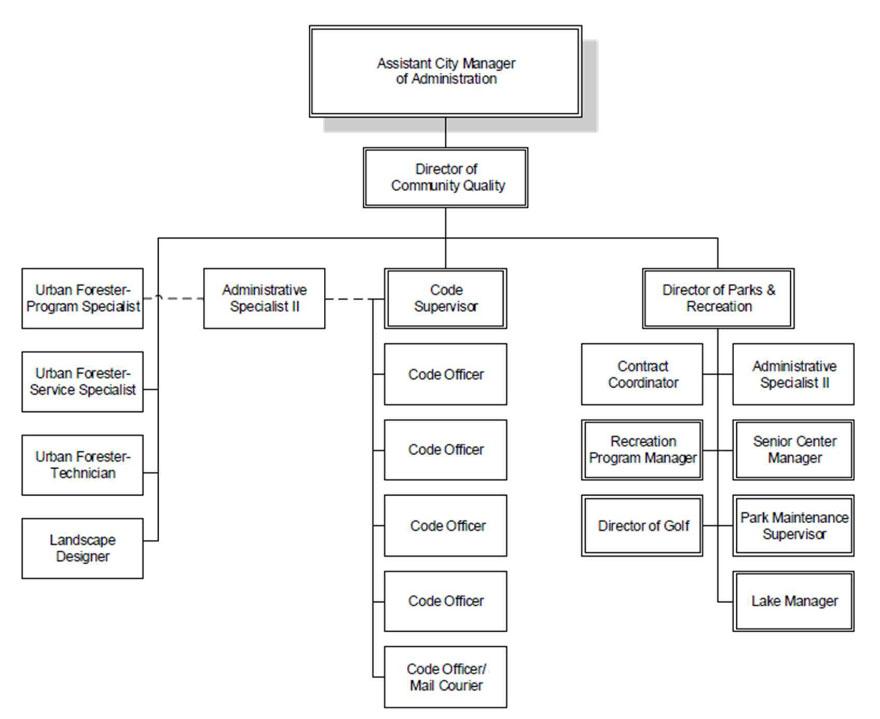
https://www.edmondok.gov/895/Community-Image


https://www.edmondok.gov/614/Urban-Forestry

Staffing Code Enforcement CURRENT YEAR YEAR 2024 YEAR 2025 YEAR 2026 YEAR 2027 YEAR 2028 7-0-0 7-0-0 7-0-0 7-0-0 7-0-0 7-0-0 Urban Forestry CURRENT YEAR YEAR 2024 YEAR 2025 YEAR 2026 YEAR 2027 YEAR 2028 5-0-0 5-0-0 5-0-0 5-0-0 5-0-0 5-0-0 Contact Us Ryan Ochsner: (405) 359-4799
4.26 Click Here for Main Directory Click Here for Sub-Directory
DEPARTMENT: Community Image FUND: GENERAL FUND FY 23-24 Prior Year Actual Adopted Year Budget Current Year Revised BUDGET YEAR Projected Budget Projected Budget Projected Budget Projected Budget FY 21-22FY 22-23FY 22-23 FY 23-24 FY 24-25FY 25-26FY 26-27FY 27-28 DIRECT COSTS BY FUNCTION: Personnel Services886,263 996,527 993,241 1,025,105 1,071,722 1,113,609 1,150,120 1,181,640 Materials & Supplies79,489 91,700 88,497 93,400 96,225 102,475 98,590 95,490 Other Services & Charges259,003 577,775 351,010 586,175 526,075 528,050 529,850 529,850 Capital Outlay 124,735 20,000 20,000 20,000 20,000 20,000 20,000 20,000 Debt Service- - - - - - -TOTAL ESTIMATED COSTS 1,349,489 1,686,002 1,452,748 1,724,680 1,714,022 1,764,134 1,798,560 1,826,980 DETAIL OF TRANSFERS OUT: Administrative Support 272,476 335,440 335,440319,137 325,520 326,002 332,521 339,172 Fleet Lease Assessment Fee 29,367 29,413 29,41332,206 33,724 35,319 36,993 38,751 Fleet Management Fund - - - - - - -Insurance Assessment 6,988 14,707 14,70713,934 14,630 15,362 16,130 16,936 Vehicle Maintenance Fees 10,329 18,300 21,96018,500 18,500 18,500 18,500 18,500 Field Services - - - - - - -Sales Tax (EPWA) - - - - - - -Arts in Public Places Fund - - - - - - -General Fund - - - - - - -Revenue Bond Funds (EPWA) - - - - - - -Additional Transfers - - - - - - -Total Transfers Out: 319,159 397,860 401,520 383,777 392,374 395,183 404,144 413,359 4.27 Click Here for Main Directory Click Here for Sub-Directory
EDMOND Planning

The Planning Department works to improve the quality of life of the people and community by creating attractive, connected, efficient, and equitable places for present and future generations.

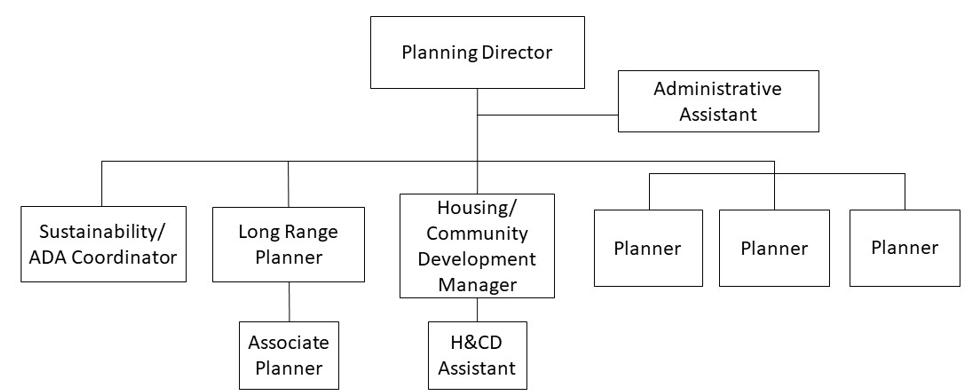
DID YOU KNOW?
The Planning Department (Current Planning) reviewed 309 applications in 2022. Edmond's first mobility plan, EdmondShift, was adopted in 2022 after a year long effort led by the Long Range Planning division.


CityLink increased its service area for the first time since 2009, now providing transit service to the I-35 Corridor.
Organization Chart

CURRENT YEAR YEAR 2024 YEAR 2025 YEAR 2026 YEAR 2027 YEAR 2028 10-0-0 10-0-0 10-0-0 11-0-0 11-0-0 11-0-0 Contact Us Phone: (405) 359-4799 planning@edmondok.gov
Staffing
4.28 Click Here for Main Directory Click Here for Sub-Directory
Grant/CDBG Coordinator
DEPARTMENT: Planning & Zoning FUND: GENERAL FUND FY 23-24 Prior Year Actual Adopted Year Budget Current Year Revised BUDGET YEAR Projected Budget Projected Budget Projected Budget Projected Budget FY 21-22FY 22-23FY 22-23 FY 23-24 FY 24-25FY 25-26FY 26-27FY 27-28 DIRECT COSTS BY FUNCTION: Personnel Services871,108 977,752 1,001,536 1,012,858 1,045,093 1,067,449 1,081,605 1,096,393 Materials & Supplies10,377 14,650 12,060 20,500 13,050 13,300 14,650 18,900 Other Services & Charges317,748 790,950 224,571 686,200 439,850 238,050 239,850 240,050 Capital Outlay - - - - - - -Debt Service - - - - - - -TOTAL ESTIMATED COSTS 1,199,233 1,783,352 1,238,167 1,719,558 1,497,993 1,318,799 1,336,105 1,355,343 DETAIL OF TRANSFERS OUT: Administrative Support 334,567 318,747 318,747 405,519 413,630 414,242 422,527 430,977 Fleet Lease Assessment Fee - - - - - - -Fleet Management Fund - - - - - - -Insurance Assessment 6,021 6,218 6,218 6,443 6,765 7,103 7,458 7,831 Vehicle Maintenance Fees - - - - - - -Field Services - - - - - - -Sales Tax (EPWA) - - - - - - -Arts in Public Places Fund - - - - - - -General Fund - - - - - - -Revenue Bond Funds (EPWA) - - - - - - -Additional Transfers - - - - - - -Total Transfers Out: 340,588 324,965 324,965 411,962 420,395 421,345 429,985 438,808 4.29 Click Here for Main Directory Click Here for Sub-Directory
CommunityAgency ReviewCommission


The Community Agency Review Commission (CARC) performs an annual review of local community agencies to determine eligibility and necessity for funding. After the annual review the Commission issues a formal recommendation to the Edmond City Council, for funding of the agencies. A community agency is directly engaged in charitable, educational, health, social services, community enrichment or related activities, which provide a direct and distinct benefit to the City. of Edmond and its residents. The community agency
CRITERIAFORFUNDING

Applying organizations shall conduct a recognized program of contracted service in or for the community and must show evidence to the City of Edmond that it is effectively meeting a social need, and providing a direct and distinct benefit to the City of Edmond and its residents.

Applying organizations shall have a plan of organization which gives evidence of a properly chosen Board of Directors which meets at least quarterly, and which in actual fact assumes responsibility to the public for efficient management of the agency it represents.

Applying organizations must provide the City of Edmond with annual financial statements and annual statistical reports of services rendered. Agency shall have its finances audited annually by an auditing firm acceptable to the City of Edmond.
Applying organizations must provide to the City of Edmond a statement of budgetary needs and provide any other operational information upon request by the City of Edmond.
Applying organizations must complete and submit for approval the contract service.
The Community Agency Review Commission (CARC) has been in place since 1984.
The CARC is governed by a five-person commission.

DIDYOUKNOW?
4.30 Click Here for Main Directory Click Here for Sub-Directory
DEPARTMENT: CommunityAgencyReview Commission FY23-24 Prior Year Actual Adopted Year Budget CurrentYear Revised BUDGET YEAR Projected Budget Projected Budget Projected Budget Projected Budget FY21-22 FY22-23 FY22-23 FY23-24 FY24-25 FY25-26 FY26-27 FY27-28 ESTIMATED USES DIRECT COSTS BYFUNCTION: PersonnelServices - - - - - - -Materials & Supplies - - - - - - -Other Services & Charges 948,364 1,024,700 1,059,291 1,361,750 1,361,750 1,361,800 1,361,800 1,361,800 CapitalOutlay - - - - - - -Debt Service - - - - - - -Transfers Out - - - - - - -TOTAL ESTIMATED COSTS 948,364 1,024,700 1,059,291 1,361,750 1,361,750 1,361,800 1,361,800 1,361,800 CARC DETAIL: Edmond FamilyCounseling 172,500 172,500 172,500 172,500 172,500 172,500 172,500 172,500 LibertyFest 40,000 80,000 80,000 100,000 100,000 100,000 100,000 100,000 HOPE Center 170,000 170,000 170,000 170,000 170,000 170,000 170,000 170,000 UCO Sports & Recreation 20,000 20,000 20,000 20,000 20,000 20,000 20,000 20,000 U R SpecialMinistries 25,000 25,600 26,008 25,625 25,625 25,650 25,650 25,650 Ministries ofJesus 70,000 70,000 70,000 90,000 90,000 90,000 90,000 90,000 Edm Historic Preservation Trust 25,000 25,000 25,000 30,000 30,000 30,000 30,000 30,000 Guthrie Edmond Airport 91,948 100,000 134,183 250,000 250,000 250,000 250,000 250,000 Fostering Sweet Dreams Fnd 15,000 15,000 15,000 20,000 20,000 20,000 20,000 20,000 Oklahoma Baptist Homes Child 7,500 7,500 7,500 7,500 7,500 7,500 7,500 7,500 Lilyfield, Inc. 15,000 15,000 15,000 20,000 20,000 20,000 20,000 20,000 Turning PointMinistries 50,000 50,000 50,000 100,000 100,000 100,000 100,000 100,000 Edmond Mobile Meals 80,000 85,600 85,600 90,625 90,625 90,650 90,650 90,650 Edmond Round-Up Club 7,500 7,500 7,500 17,500 17,500 17,500 17,500 17,500 Fine Arts Institute 60,000 65,000 65,000 107,000 107,000 107,000 107,000 107,000 Character CouncilofEdmond 6,000 6,000 6,000 6,000 6,000 6,000 6,000 6,000 Edmond Soccer Club 25,000 - - 20,000 20,000 20,000 20,000 20,000 Project66 Food Pantry 40,000 45,000 45,000 25,000 25,000 25,000 25,000 25,000 Mitch Park YMCA 15,000 15,000 15,000 15,000 15,000 15,000 15,000 15,000 Edmond Public Schools Foundation - 50,000 50,000 50,000 50,000 50,000 50,000 50,000 PeacefulFamily Solutions - - - 25,000 25,000 25,000 25,000 25,000 TOTAL 948,364 1,024,700 1,059,291 1,361,750 1,361,750 1,361,800 1,361,800 1,361,800 4.31 Click Here for Main Directory Click Here for Sub-Directory
PARKS AND RECREATION SPECIAL EVENTS

The Parks Special Events Fund tracks activity and fees for special events provided through the Edmond Parks & Recreation Department’s Program Division.

DID YOU KNOW?

Every Year on Thanksgiving since 2010, the Annual Turkey Trot has taken place on Edmond’s streets.
There are close to 100 special events each year in Edmond.

CONTACT
Sarah London Ph (405) 359-4580
4.32 Click Here for Main Directory Click Here for Sub-Directory
General Fund: Parks Special Events Fund FY 23-24 Prior Year Actual Adopted Year Budget Current Year Revised BUDGET YEAR Projected Budget Projected Budget Projected Budget Projected Budget FY 21-22FY 22-23FY 22-23 FY 23-24 FY 24-25FY 25-26FY 26-27FY 27-28 ESTIMATED RESOURCES: REVENUES: Taxes- - - - - - -Inter-governmental - - - - - - -Licenses and Permits - - - - - - -Fines & Forfeitures - - - - - - -Charges for Services 167 290 - - - - -Interest (1,494) 1,047 618 468 473 477 482 487 Investment Income - - - - - - -Capital Lease Proceeds - - - - - - -Miscellaneous Revenue 844 682 - - - - -Subtotal - Revenues (483) 2,019 618 468 473 477 482 487 OTHER RESOURCES: Debt/Loan Proceeds - - - - - -Restricted Prior Year Reserves 82,782 72,026 72,02657,892 40,560 23,933 7,310 (9,308) Assigned Prior Year Reserves (Council Projects) - - - - - -Committed Prior Year Reserves - - - - - -Unrestricted Prior Year Reserves - - - - - - -TOTAL ESTIMATED RESOURCES 82,299 74,045 72,64458,360 41,033 24,410 7,792 (8,821) ESTIMATED USES DIRECT COSTS BY FUNCTION: Personnel Services- - - - - - -Materials & Supplies 426 950 1,217 950 950 950 950 950 Other Services & Charges 9,847 17,650 13,535 16,850 16,150 16,150 16,150 16,150 Capital Outlay - - - - - - -Debt Service - - - - - - -TOTAL ESTIMATED COSTS 10,273 18,600 14,752 17,800 17,100 17,100 17,100 17,100 TRANSFERS: Transfers In- - - - - - -Transfers Out - - - - - - -NET TRANSFERS IN (OUT) - - - - - - -OTHER USES: Reserve for Employee ObligationsReserve for Council Special Projects - - - - - - -Reserve for Capital ImprovementsCommitted for Other Purposes - - - - - - -Restricted (Reserve for Other Purposes) - - - - - - -Restricted (Reserve for Specific Fund Purposes) 72,026 55,445 57,892 40,560 23,933 7,310 (9,308) (25,921) Unassigned (Res for Emergencies & Shortfalls*)TOTAL OTHER USES 72,026 55,445 57,892 40,560 23,933 7,310 (9,308) (25,921) TOTAL ESTIMATED USES 82,299 74,045 72,64458,360 41,033 24,410 7,792 (8,821) DETAIL OF TRANSFERS OUT: Administrative Support - - - - - - -Fleet Lease Assessment Fee - - - - - - -Fleet Management Fund - - - - - - -Insurance Assessment - - - - - - -Vehicle Maintenance Fees - - - - - - -Field Services - - - - - - -Sales Tax (EPWA) - - - - - - -Arts in Public Places Fund - - - - - - -General Fund - - - - - - -Revenue Bond Funds (EPWA) - - - - - - -Additional Transfers - - - - - - -Total Transfers Out: - - - - - - -4.33 Click Here for Main Directory Click Here for Sub-Directory
EDMOND ELECTRIC ECONOMIC DEVELOPMENT


The Edmond Electric Economic Development Fund has been established to stimulate the growth of Edmond’s economy by offering services that facilitate the growth and expansion of new and existing businesses and generating opportunities to increase the sales tax base of the City of Edmond. Funding for this activity is provided by Edmond Electric through a transfer of funds.

4.34 Click Here for Main Directory Click Here for Sub-Directory
General Fund: Edmond Electric Economic Development Fund FY 23-24 Prior Year Actual Adopted Year Budget Current Year Revised BUDGET YEAR Projected Budget Projected Budget Projected Budget Projected Budget FY 21-22FY 22-23FY 22-23 FY 23-24 FY 24-25FY 25-26FY 26-27FY 27-28 ESTIMATED RESOURCES: REVENUES: Taxes- - - - - - -Inter-governmental - - - - - - -Licenses and Permits - - - - - - -Fines & Forfeitures - - - - - - -Charges for Services - - - - - - -Interest (9,999) 6,000 3,914 6,000 6,000 6,000 6,000 6,000 Investment Income - - - - - - -Capital Lease Proceeds - - - - - - -Miscellaneous Revenue - - - - - - -Subtotal - Revenues (9,999) 6,000 3,914 6,000 6,000 6,000 6,000 6,000 OTHER RESOURCES: Debt/Loan Proceeds - - - - - -Restricted Prior Year Reserves 617,195 494,760 494,760401,708 407,458 413,208 418,958 424,708 Assigned Prior Year Reserves (Council Projects) - - - - - -Committed Prior Year Reserves - - - - - -Unrestricted Prior Year Reserves - - - - - -TOTAL ESTIMATED RESOURCES 607,196 500,760 498,675 407,708 413,458 419,208 424,958 430,708 ESTIMATED USES DIRECT COSTS BY FUNCTION: Personnel Services- - - - - - -Materials & Supplies - - - - - - -Other Services & Charges 12,597 250 86,455 250 250 250 250 250 Capital Outlay 199,839 100,000 91,469 100,000 100,000 100,000 100,000 100,000 Debt Service- - - - - - -TOTAL ESTIMATED COSTS 212,435 100,250 177,925 100,250 100,250 100,250 100,250 100,250 TRANSFERS: Transfers In100,000 100,000 100,000100,000 100,000 100,000 100,000 100,000 Transfers Out- - (19,042) - - - -NET TRANSFERS IN (OUT) 100,000 100,000 80,958 100,000 100,000 100,000 100,000 100,000 OTHER USES: Reserve for Employee ObligationsReserve for Council Special Projects - - - - - - -Reserve for Capital ImprovementsCommitted for Other Purposes - - - - - - -Restricted (Reserve for Other Purposes) - - - - - - -Restricted (Reserve for Specific Fund Purposes) 494,760 500,510 401,708 407,458 413,208 418,958 424,708 430,458 Unassigned (Res for Emergencies & Shortfalls*)TOTAL OTHER USES 494,760 500,510 401,708 407,458 413,208 418,958 424,708 430,458 TOTAL ESTIMATED USES 607,196 500,760 498,675 407,708 413,458 419,208 424,958 430,708 DETAIL OF TRANSFERS OUT: Administrative Support - - - - - - -Fleet Lease Assessment Fee - - - - - - -Fleet Management Fund - - - - - - -Insurance Assessment - - - - - - -Vehicle Maintenance Fees - - - - - - -Field Services - - - - - - -Sales Tax (EPWA) - - - - - - -Arts in Public Places Fund - - - - - - -General Fund - - - - - - -Revenue Bond Funds (EPWA) - - - - - - -Additional Transfers - - 19,042 - - - -Total Transfers Out: - - 19,042 - - - -4.35 Click Here for Main Directory Click Here for Sub-Directory
INTENTIONALLY
PAGE
LEFT BLANK
Special Revenue Funds - Sub-Directory
Senior CitizensFund 5.2-5.3 Summary Page 5.2 Budget Page 5.3 Community Development 5.4-5.5 Summary Page 5.4 Budget Page 5.5 Asset Forfeiture 5.6-5.7 Summary Page 5.6 Budget Page 5.7 Ambulatory Services Fund 5.8-5.9 Summary Page 5.8 Budget Page 5.9 Fire Department 5.10-5.11 Summary Page 5.10 Budget Page 5.11 Police Department 5.12-5.13 Summary Page 5.12 Budget Page 5.13 Visit Edmond 5.14-5.15 Summary Page 5.14 Budget Page 5.15 Special Parks Tax Fund 5.16-5.17 Summary Page 5.16 Budget Page 5.17 American Rescue Plan Act of 2021 (ARPA) 5.18-5.19 Summary Page 5.18 Budget Page 5.19 Opioid- Drug Settlement Revenue Fund 5.20-5.21 Summary Page 5.20 Budget Page 5.21 Real Property Fund 5.22-5.23 Summary Page 5.22 Budget Page 5.23 Tax Increment Financing (TIF) Fund 5.24-5.25 Summary Page 5.24 Budget Page 5.25 Hospital Sale Trust Fund 5.26-5.27 Summary Page 5.26 Budget Page 5.27
5.1
EDMOND Senior Citizens Center
The Edmond Senior Center provides comprehensive programs and services to improve the quality of life for senior citizens in our community.
DID YOU KNOW
The Edmond Senior Center provides programs in the areas of nutrition, fitness, education, arts and recreation.
The Senior Center provides lunch five days a week for seniors in the community. 12,370 meals were served in 2022.
Organization Chart


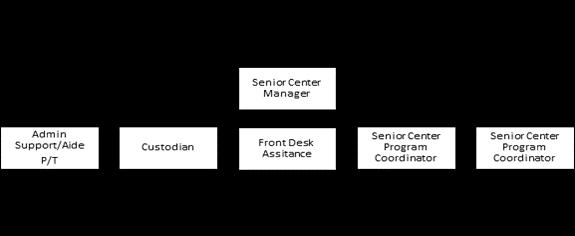

C URRENT YEAR YEAR 202 4 YEAR 202 5 YEAR 202 6 YEAR 202 7 YEAR 202 8 5-1-0 5-1-0 5-1-0 5-1-0 5-1-0 5-1-0 EMPLOYEES Contact Us 5 FTE, 1PTE LeAnna Holman: (405) 359-4338 www.edmondseniorcenter.gov
Staffing
5.2 Click Here for Main Directory Click Here for Sub-Directory
Senior Citizens Fund FY 23-24 Prior Year Actual Adopted Year Budget Current Year Revised BUDGET YEAR Projected Budget Projected Budget Projected Budget Projected Budget FY 21-22FY 22-23FY 22-23 FY 23-24 FY 24-25FY 25-26FY 26-27FY 27-28 ESTIMATED RESOURCES: REVENUES: Taxes- - - - - - -Inter-governmental - - - - - - -Licenses and Permits - - - - - - -Fines & Forfeitures - - - - - - -Charges for Services 897 1,443 - 1,000 1,000 1,000 1,000 1,000 Interest (6,938) 2,000 2,671 2,000 2,000 2,000 2,000 2,000 Investment Income - - - - - - -Capital Lease Proceeds - - - - - - -Miscellaneous Revenue 65,231 78,500 97,157 94,000 94,000 94,000 94,00 0 94,000 Subtotal - Revenues 59,190 81,943 99,828 97,000 97,000 97,000 97,000 97,000 OTHER RESOURCES: Debt/Loan Proceeds - - - - - -Restricted Prior Year Reserves 320,668 144,704 144,704 284,305 221,355 158,405 95,455 32,505 Assigned Prior Year Reserves (Council Projects) - - - - - -Committed Prior Year Reserves 163,818 163,818 - - - -Unrestricted Prior Year Reserves - - - - - -TOTAL ESTIMATED RESOURCES 379,858 390,465 408,349 381,305 318,355 255,405 192,455 129,505 ESTIMATED USES DIRECT COSTS BY FUNCTION: Personnel Services- - - - - - -Materials & Supplies 11,801 27,400 11,572 18,500 18,500 18,500 18,500 18,500 Other Services & Charges 59,536 115,750 112,472 141,450 141,450 141,450 141,450 141,450 Capital Outlay - - - - - - -Debt Service - - - - - - -TOTAL ESTIMATED COSTS 71,337 143,150 124,044 159,950 159,950 159,950 159,950 159,950 TRANSFERS: Transfers In - - - - - - -Transfers Out (See detail below) - - - - - - -NET TRANSFERS IN (OUT) - - - - - - -OTHER USES: Reserve for Employee Obligations - - - - -Reserve for Council Special Projects - - - - - - -Reserve for Capital Improvements - - - - -Committed for Other Purposes 163,818 -Restricted (Reserve for Other Purposes) - - - - - - -Restricted (Reserve for Specific Fund Purposes) 144,704 247,315 284,305 221,355 158,405 95,455 32,505 (30,445) Unassigned (Res for Emergencies & Shortfalls*)TOTAL OTHER USES 308,522 247,315 284,305 221,355 158,405 95,455 32,505 (30,445) TOTAL ESTIMATED USES 379,858 390,465 408,349 381,305 318,355 255,405 192,455 129,505 DETAIL OF TRANSFERS OUT: Administrative Support - - - - - - -Fleet Lease Assessment Fee - - - - - - -Fleet Management Fund - - - - - - -Insurance Assessment - - - - - - -Vehicle Maintenance Fees - - - - - - -Field Services - - - - - - -Sales Tax (EPWA) - - - - - - -Arts in Public Places Fund - - - - - - -General Fund - - - - - - -Revenue Bond Funds (EPWA) - - - - - - -Additional Transfers - - - - - - -Total Transfers Out: - - - - - - -5.3 Click Here for Main Directory Click Here for Sub-Directory
Housing&CommunityDevelopment
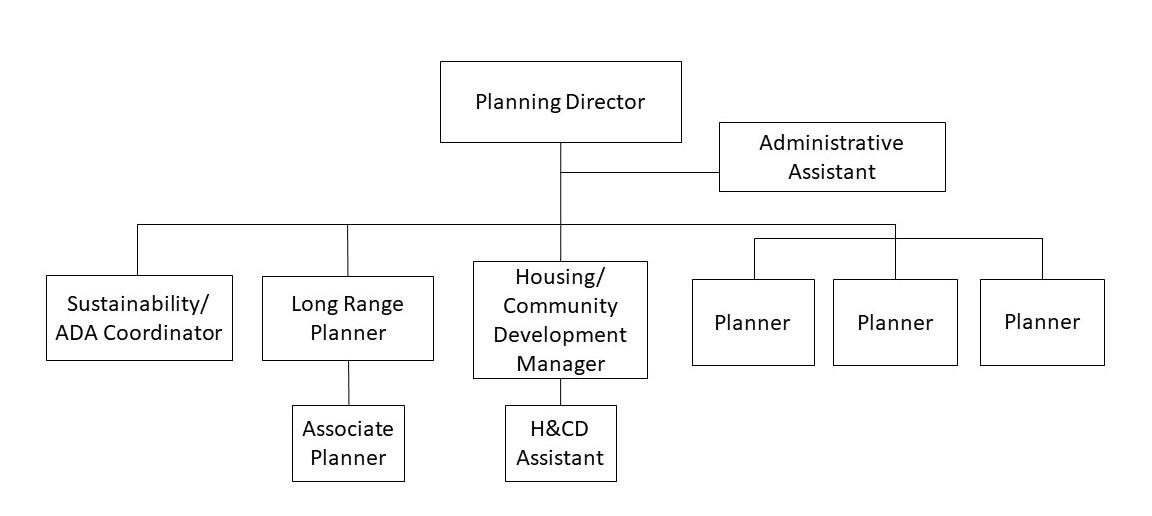

The City of Edmond's Housing & Community Development Department (HCD) oversees community development and affordable housing programs. They manage and administer grants, including the Community Development Block Grant, to support community initiatives and non-profit partnerships. The department also works to promote economic development and community revitalization efforts.

DID YOU KNOW
HCD has managed $7.4 Million dollars in funding over the past three years.


Staffing CURRENT YEAR YEAR 2024 YEAR 2025 YEAR 2026 YEAR 2027 YEAR 2028 1-0-0 1-0-0 1-0-0 1-0-0 1-0-0 1-0-0 ContactUs Christy Batterson: (405) 359-4694
OrganizationChart
5.4 Click Here for Main Directory Click Here for Sub-Directory
Grant/CDBG Coordinator
CDBG Fund
Prior Year Actual Adopted Year Budget Current Year Revised BUDGET YEAR FY 21-22FY 22-23FY 22-23 FY 23-24 ESTIMATED RESOURCES: REVENUES: Taxes- - -Inter-governmental 837,446 2,413,648 1,744,031 1,503,263 Licenses and Permits - - -Fines & Forfeitures - - -Charges for Services - - -Interest - - -Investment Income - - -Capital Lease Proceeds - - -Miscellaneous Revenue 29,563 - 3,428Subtotal - Revenues 867,010 2,413,648 1,747,459 1,503,263 OTHER RESOURCES: Debt/Loan Proceeds - -Restricted Prior Year Reserves (148,181) (185,206) (185,206) (515,347) Assigned Prior Year Reserves (Council Projects) - -Committed Prior Year Reserves - -Unrestricted Prior Year Reserves - -TOTAL ESTIMATED RESOURCES 718,829 2,228,442 1,562,252 987,916 ESTIMATED USES DIRECT COSTS BY FUNCTION: Personnel Services65,845 100,184 - 100,383 Materials & Supplies 93 1,700 1,751 1,900 Other Services & Charges 11,079 98,550 82,750 115,780 Capital Outlay 809,020 2,208,648 1,967,423 1,365,000 Debt Service- - -TOTAL ESTIMATED COSTS 886,036 2,409,082 2,051,924 1,583,063 TRANSFERS: Transfers In - - -Transfers Out (See detail below) (17,999) (25,676) (25,676) (23,320) NET TRANSFERS IN (OUT) (17,999) (25,676) (25,676) (23,320) OTHER USES: Reserve for Employee Obligations -Reserve for Council Special Projects - - -Reserve for Capital Improvements -Committed for Other Purposes - -Restricted (Reserve for Other Purposes) - - -Restricted (Reserve for Specific Fund Purposes) (185,206) (206,316) (515,347) (618,467) Unassigned (Res for Emergencies & Shortfalls*)TOTAL OTHER USES (185,206) (206,316) (515,347) (618,467) TOTAL ESTIMATED USES 718,829 2,228,442 1,562,252 987,916 DETAIL OF TRANSFERS OUT: Administrative Support 17,648 25,286 25,286 22,849 Fleet Lease Assessment Fee - - -Fleet Management Fund - - -Insurance Assessment 352 390 390 471 Vehicle Maintenance Fees - - -Field Services - - -General Fund - - -Sales Tax (EPWA) - - -Arts in Public Places Fund - - -Revenue Bond Funds (EPWA) - - -Additional Transfers - - -Total Transfers Out: 17,999 25,676 25,676 23,320 5.5 Click Here for Main Directory Click Here for Sub-Directory
The Asset Forfeiture Fund has been established to account for the Edmond Police Department’s share of assets that have been seized. Assets seized can vary from monetary instruments (cash, checks, stocks, bonds, etc.), hauling conveyances (cars, trucks, boats, airplanes, etc.) or any other real property with monetary value. The seizures are the result of a criminal investigation and are divided among all the agencies assisting in the investigation based on their level of involvement.


This account is used. to record receipts and expenditures of funds received through seizures in federal court.
This account is used, to record receipts and expenditures of funds received through seizures in state court.

DID YOU KNOW? Money from this fund has been used to purchase: • In Car Cameras • Body Cameras • Command Post • Rescue Vehicle CONTACT Non- Emergency Ph (405) 359-4338 EdmondPD.com Asset Forfeiture Federal Asset Forfeitures State Asset Forfeitures
DIVISIONS
5.6 Click Here for Main Directory Click Here for Sub-Directory
Asset Forfeiture Fund FY 23-24 Prior Year Actual Adopted Year Budget Current Year Revised BUDGET YEAR Projected Budget Projected Budget Projected Budget Projected Budget FY 21-22FY 22-23FY 22-23 FY 23-24 FY 24-25FY 25-26FY 26-27FY 27-28 ESTIMATED RESOURCES: REVENUES: Taxes- - - - - - -Inter-governmental - - - - - - -Licenses and Permits - - - - - - -Fines & Forfeitures - - - - - - -Charges for Services - - - - - - -Interest (13,731) 2,000 5,408 2,000 2,000 2,000 2,000 2,000 Investment Income - - - - - - -Capital Lease Proceeds - - - - - - -Miscellaneous Revenue 20,352 - 43,283 - - - -Subtotal - Revenues 6,620 2,000 48,691 2,000 2,000 2,000 2,000 2,000 OTHER RESOURCES: Debt/Loan Proceeds - - - - - -Restricted Prior Year Reserves 646,759 550,564 550,564 450,203 361,503 272,803 184,103 95,403 Assigned Prior Year Reserves (Council Projects) - - - - - -Committed Prior Year Reserves 74,691 74,691 - - - -Unrestricted Prior Year Reserves - - - - - -TOTAL ESTIMATED RESOURCES 653,379 627,255 673,946 452,203 363,503 274,803 186,103 97,403 ESTIMATED USES DIRECT COSTS BY FUNCTION: Personnel Services- - - - - - -Materials & Supplies 26,745 167,500 180,100 70,000 70,000 70,000 70,000 70,000 Other Services & Charges 379 20,700 3,569 20,700 20,700 20,700 20,700 20,700 Capital Outlay 1,000 30,000 40,074 - - - -Debt Service - - - - - - -TOTAL ESTIMATED COSTS 28,124 218,200 223,743 90,700 90,700 90,700 90,700 90,700 TRANSFERS: Transfers In - - - - - - -Transfers Out (See detail below) - - - - - - -NET TRANSFERS IN (OUT) - - - - - - -OTHER USES: Reserve for Employee Obligations - - - - -Reserve for Council Special Projects - - - - - - -Reserve for Capital Improvements - - - - -Committed for Other Purposes 74,691 -Restricted (Reserve for Other Purposes) - - - - - - -Restricted (Reserve for Specific Fund Purposes) 550,564 409,055 450,203 361,503 272,803 184,103 95,403 6,703 Unassigned (Res for Emergencies & Shortfalls*)TOTAL OTHER USES 625,255 409,055 450,203 361,503 272,803 184,103 95,403 6,703 TOTAL ESTIMATED USES 653,379 627,255 673,946 452,203 363,503 274,803 186,103 97,403 DETAIL OF TRANSFERS OUT: Administrative Support - - - - - - -Fleet Lease Assessment Fee - - - - - - -Fleet Management Fund - - - - - - -Insurance Assessment - - - - - - -Vehicle Maintenance Fees - - - - - - -Field Services - - - - - - -General Fund - - - - - - -Sales Tax (EPWA) - - - - - - -Arts in Public Places Fund - - - - - - -Revenue Bond Funds (EPWA) - - - - - - -Additional Transfers - - - - - - -Total Transfers Out: - - - - - - -5.7 Click Here for Main Directory Click Here for Sub-Directory
AMBULATORY SERVICES FUND

The Ambulatory Services Fund provides funding of the City of Edmond’s Ambulance Services through the regional Emergency Medical Services Authority (EMSA). It primarily covers those citizens who have elected to participate in the TotalCare Program which began in FY09-10.

5.8 Click Here for Main Directory Click Here for Sub-Directory
Ambulatory Services Fund FY 23-24 Prior Year Actual Adopted Year Budget Current Year Revised BUDGET YEAR Projected Budget Projected Budget Projected Budget Projected Budget FY 21-22FY 22-23FY 22-23 FY 23-24 FY 24-25FY 25-26FY 26-27FY 27-28 ESTIMATED RESOURCES: REVENUES: Taxes- - - - - - -Inter-governmental - - - - - - -Licenses and Permits - - - - - - -Fines & Forfeitures - - - - - - -Charges for Services 892,420 884,397 898,197 914,049 932,330 950,976 969,996 989,397 Interest (29,644) 3,500 12,397 3,500 3,500 3,500 3,500 3,500 Investment Income - - - - - - -Capital Lease Proceeds - - - - - - -Miscellaneous Revenue - - - - - - -Subtotal - Revenues 862,776 887,897 910,594 917,549 935,830 954,476 973,496 992,897 OTHER RESOURCES: Debt/Loan Proceeds - - - - - -Restricted Prior Year Reserves 1,184,200 1,306,821 1,306,821 1,529,271 1,636,116 1,760,457 1,903,154 2,064,001 Assigned Prior Year Reserves (Council Projects) - - - - - -Committed Prior Year Reserves 41,143 41,143 - - - -Unrestricted Prior Year Reserves - - - - - -TOTAL ESTIMATED RESOURCES 2,046,976 2,235,861 2,258,559 2,446,820 2,571,946 2,714,933 2,876,650 3,056,898 ESTIMATED USES DIRECT COSTS BY FUNCTION: Personnel Services- - - - - - -Materials & Supplies - 12,000 12,000 - - - -Other Services & Charges 660,135 674,020 674,020 764,000 764,000 764,000 764,000 764,000 Capital Outlay - - - - - - -Debt Service - - - - - - -TOTAL ESTIMATED COSTS 660,135 686,020 686,020 764,000 764,000 764,000 764,000 764,000 TRANSFERS: Transfers In - - - - - - -Transfers Out (See detail below) (38,877) (43,267) (43,267) (46,705) (47,489) (47,779) (48,649) (49,623) NET TRANSFERS IN (OUT) (38,877) (43,267) (43,267) (46,705) (47,489) (47,779) (48,649) (49,623) OTHER USES: Reserve for Employee Obligations - - - - -Reserve for Council Special Projects - - - - - - -Reserve for Capital Improvements - - - - -Committed for Other Purposes 41,143 -Restricted (Reserve for Other Purposes) - - - - - - -Restricted (Reserve for Specific Fund Purposes) 1,306,821 1,506,574 1,529,271 1,636,116 1,760,457 1,903,154 2,064,001 2,243,275 Unassigned (Res for Emergencies & Shortfalls*)TOTAL OTHER USES 1,347,964 1,506,574 1,529,271 1,636,116 1,760,457 1,903,154 2,064,001 2,243,275 TOTAL ESTIMATED USES 2,046,976 2,235,861 2,258,559 2,446,820 2,571,946 2,714,933 2,876,650 3,056,898 DETAIL OF TRANSFERS OUT: Administrative Support 33,049 36,853 36,853 40,091 40,893 40,954 41,773 42,608 Fleet Lease Assessment Fee - - - - - - -Fleet Management Fund - - - - - - -Insurance Assessment - - - - - - -Vehicle Maintenance Fees - - - - - - -Field Services 5,828 6,414 6,414 6,614 6,596 6,825 6,876 7,015 General Fund - - - - - - -Sales Tax (EPWA) - - - - - - -Arts in Public Places Fund - - - - - - -Revenue Bond Funds (EPWA) - - - - - - -Additional Transfers - - - - - - -Total Transfers Out: 38,877 43,267 43,267 46,705 47,489 47,779 48,649 49,623 5.9 Click Here for Main Directory Click Here for Sub-Directory
EDMOND Fire Department
The mission statement of the Edmond Fire Department is “Trustworthy Service-Through Continuous Improvement.” We accomplish this through preparedness, emergency response, prevention, education, and training.
DID YOU KNOW?

The Fire Department provides Advanced Life Support with 51 paramedics and 78 EMT's.

In 2022 the Fire Department responded to more than 10,000 emergency calls for the first time in our history

Organization Chart
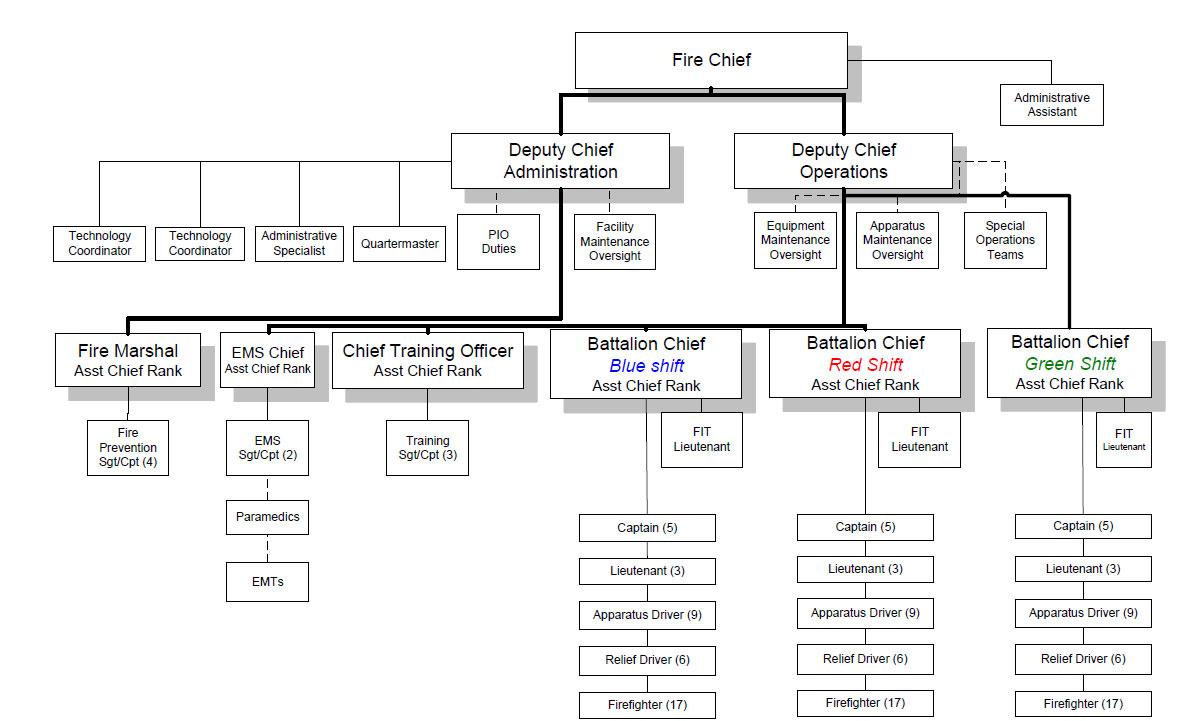

Staffing CURRENT YEAR YEAR 2024 YEAR 2025 YEAR 2026 YEAR 2027 YEAR 2028 143-0-0 143-0-0 158-0-0 158-0-0 158-0-0 158-0-0 Contact Us Fire Administration: (405) 216-7304
5.10 Click Here for Main Directory Click Here for Sub-Directory
Fire Public Safety Limited Tax Fund FY 23-24 Prior Year Actual Adopted Year Budget Current Year Revised BUDGET YEAR Projected Budget Projected Budget Projected Budget Projected Budget FY 21-22FY 22-23FY 22-23 FY 23-24 FY 24-25FY 25-26FY 26-27FY 27-28 ESTIMATED RESOURCES: REVENUES: Taxes5,510,209 5,521,390 5,812,558 5,980,701 6,100,315 6,222,321 6,346,767 6,473,703 Inter-governmental10,957 - - - - - -Licenses and Permits - - - - - - -Fines & Forfeitures - - - - - - -Charges for Services 31,608 14,000 3,990 14,000 14,000 14,000 14,000 14,000 Interest (533,598) 264,451 206,218 149,509 149,509 149,509 149,509 149,509 Investment Income - - - - - - -Capital Lease Proceeds - - - - - - -Miscellaneous Revenue 150,464 146,911 130,445 98,193 100,158 102,160 104,204 106,288 Subtotal - Revenues 5,169,638 5,946,752 6,153,211 6,242,403 6,363,982 6,487,990 6,614,480 6,743,500 OTHER RESOURCES: Debt/Loan Proceeds - - - - - -Restricted Prior Year Reserves 22,188,299 22,543,288 22,543,288 22,599,194 11,852,632 12,798,813 14,538,025 16,761,633 Assigned Prior Year Reserves (Council Projects) - - - - - -Committed Prior Year Reserves 1,311,370 1,311,370 - - - -Unrestricted Prior Year Reserves - - - - - -TOTAL ESTIMATED RESOURCES 27,357,938 29,801,410 30,007,868 28,841,597 18,216,614 19,286,803 21,152,505 23,505,133 ESTIMATED USES DIRECT COSTS BY FUNCTION: Personnel Services19,235,785 22,675,121 21,906,404 22,459,981 24,121,425 24,486,857 24,843,828 25,167,877 Materials & Supplies846,556 858,600 969,347 1,060,600 1,189,720 966,874 951,867 965,039 Other Services & Charges790,498 1,274,750 1,054,500 1,073,250 1,008,250 899,250 962,250 926,250 Capital Outlay 127,205 9,636,000 2,370,477 10,368,414 308,069 211,000 39,000 172,979 Debt Service - - - - - - -TOTAL ESTIMATED COSTS 21,000,043 34,444,471 26,300,728 34,962,245 26,627,464 26,563,981 26,796,945 27,232,145 TRANSFERS: Transfers In 21,561,952 22,763,467 24,297,302 27,403,624 25,579,563 26,217,910 26,877,063 27,557,854 Transfers Out (See detail below) (4,065,188) (3,932,731) (5,405,249) (9,430,344) (4,369,900) (4,402,708) (4,470,989) (4,381,492) NET TRANSFERS IN (OUT) 17,496,764 18,830,736 18,892,053 17,973,280 21,209,663 21,815,202 22,406,074 23,176,362 OTHER USES: Reserve for Employee Obligations - - - - -Reserve for Council Special Projects - - - - - - -Reserve for Capital Improvements - - - - -Committed for Other Purposes 1,311,370 -Restricted (Reserve for Other Purposes) - - - - - - -Restricted (Reserve for Specific Fund Purposes)22,543,288 14,187,674 22,599,194 11,852,632 12,798,813 14,538,025 16,761,633 19,449,350 Unassigned (Res for Emergencies & Shortfalls*)TOTAL OTHER USES 23,854,658 14,187,674 22,599,194 11,852,632 12,798,813 14,538,025 16,761,633 19,449,350 TOTAL ESTIMATED USES 27,357,938 29,801,410 30,007,868 28,841,597 18,216,614 19,286,803 21,152,505 23,505,133 DETAIL OF TRANSFERS OUT: Administrative Support 1,605,697 2,085,342 2,085,342 2,272,931 2,318,390 2,321,822 2,368,258 2,415,623 Fleet Lease Assessment Fee 1,410,000 919,334 919,334 6,097,863 963,982 963,982 954,982 785,732 Fleet Management Fund - - - - - - -Insurance Assessment 500,657 603,055 603,055 559,550 587,528 616,904 647,749 680,137 Vehicle Maintenance Fees 282,579 325,000 609,600 500,000 500,000 500,000 500,000 500,000 Field Services - - - - - - -General Fund - - - - - - -Sales Tax (EPWA) - - - - - - -Arts in Public Places Fund - - - - - - -Revenue Bond Funds (EPWA) - - - - - - -Additional Transfers 266,255 - 1,187,917 - - - -Total Transfers Out: 4,065,188 3,932,731 5,405,249 9,430,344 4,369,900 4,402,708 4,470,989 4,381,492 5.11 Click Here for Main Directory Click Here for Sub-Directory
EDMOND Police Department

The mission of the Edmond Police Department is “Trustworthy Service” by partnering with the community in the protection of life, property, public peace, and individual rights. Guided by the Community Oriented Policing philosophy, the Edmond Police Department focuses on building relationships with all segments the Edmond community to improve our citizen’s quality of life. Engagement activities such as the Citizen’s Police Academy, the School Resource Officer program, Community Oriented Policing Leadership Council, and Coffee with a Cop events increase trust between citizens and the Officers that serve them.

Organization Chart
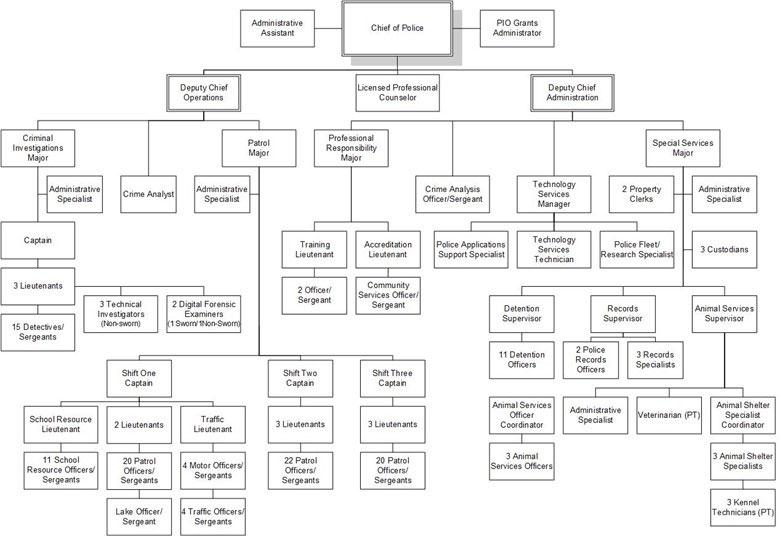

Staffing CURRENT YEAR YEAR 2024 YEAR 2025 YEAR 2026 YEAR 2027 YEAR 2028 172-4-0 176-4-0 178-4-0 178-4-0 180-4-0 180-4-0 Contact Us Non-Emergency Number: (405) 359-4338
5.12 Click Here for Main Directory Click Here for Sub-Directory
Police Public Safety Limited Tax Fund FY 23-24 Prior Year Actual Adopted Year Budget Current Year Revised BUDGET YEAR Projected Budget Projected Budget Projected Budget Projected Budget FY 21-22FY 22-23FY 22-23 FY 23-24 FY 24-25FY 25-26FY 26-27FY 27-28 ESTIMATED RESOURCES: REVENUES: Taxes2,755,105 2,760,695 2,906,279 2,990,350 3,050,157 3,111,160 3,173,384 3,236,851 Inter-governmental118,059 150,000 183,590 150,000 150,000 150,000 150,000 150,000 Licenses and Permits- - - - - - -Fines & Forfeitures - - 300 - - - -Charges for Services - 3,000 - 3,000 3,000 3,000 3,000 3,000 Interest (374,274) 35,000 146,243 35,000 35,000 35,000 35,000 35,000 Investment Income - - - - - - -Capital Lease Proceeds - - - - - - -Miscellaneous Revenue 477,566 33,509 41,173 529,643 529,736 529,831 529,927 530,026 Subtotal - Revenues 2,976,455 2,982,204 3,277,585 3,707,993 3,767,893 3,828,991 3,891,311 3,954,877 OTHER RESOURCES: Debt/Loan Proceeds - - - - - -Restricted Prior Year Reserves 15,023,284 13,916,402 13,916,402 14,589,480 11,758,134 13,472,605 15,870,967 17,450,483 Assigned Prior Year Reserves (Council Projects) - - - - - -Committed Prior Year Reserves 2,698,414 2,698,414 - - - -Unrestricted Prior Year Reserves - - - - - -TOTAL ESTIMATED RESOURCES 17,999,739 19,597,020 19,892,402 18,297,473 15,526,027 17,301,596 19,762,278 21,405,360 ESTIMATED USES DIRECT COSTS BY FUNCTION: Personnel Services20,934,033 23,607,017 22,079,859 23,594,391 24,221,684 24,617,867 25,230,771 25,606,039 Materials & Supplies1,346,041 1,587,078 1,239,451 1,808,971 1,430,052 1,378,361 2,089,839 1,413,173 Other Services & Charges648,627 1,066,330 667,428 1,189,145 1,172,945 1,197,295 1,214,845 1,222,095 Capital Outlay 8,905 635,000 635,700 4,452,778 250,000 15,000 - 1,169,000 Debt Service - - - - - - -TOTAL ESTIMATED COSTS 22,937,605 26,895,425 24,622,438 31,045,285 27,074,681 27,208,523 28,535,455 29,410,307 TRANSFERS: Transfers In 26,449,330 25,937,147 27,825,852 30,619,100 31,377,597 32,160,637 32,969,197 33,804,301 Transfers Out (See detail below) (4,896,647) (5,434,919) (8,506,336) (6,113,154) (6,356,338) (6,382,743) (6,745,537) (6,832,388) NET TRANSFERS IN (OUT) 21,552,683 20,502,228 19,319,516 24,505,946 25,021,259 25,777,894 26,223,660 26,971,913 OTHER USES: Reserve for Employee Obligations - - - - -Reserve for Council Special Projects - - - - - - -Reserve for Capital Improvements - - - - -Committed for Other Purposes 2,698,414 -Restricted (Reserve for Other Purposes) - - - - - - -Restricted (Reserve for Specific Fund Purposes)13,916,402 13,203,823 14,589,480 11,758,134 13,472,605 15,870,967 17,450,483 18,966,966 Unassigned (Res for Emergencies & Shortfalls*)TOTAL OTHER USES 16,614,816 13,203,823 14,589,480 11,758,134 13,472,605 15,870,967 17,450,483 18,966,966 TOTAL ESTIMATED USES 17,999,739 19,597,020 19,892,402 18,297,473 15,526,027 17,301,596 19,762,278 21,405,360 DETAIL OF TRANSFERS OUT: Administrative Support 2,765,218 3,022,109 3,022,109 3,438,096 3,506,858 3,512,049 3,582,290 3,653,936 Fleet Lease Assessment Fee 869,269 951,324 951,324 1,218,614 1,312,414 1,399,587 1,480,132 1,570,619 Fleet Management Fund 214,320 53,000 53,000 114,000 131,250 - 144,703Insurance Assessment 620,209 883,486 883,486 767,444 805,816 846,107 888,412 932,833 Vehicle Maintenance Fees 427,631 525,000 546,417 575,000 600,000 625,000 650,000 675,000 Field Services - - - - - - -General Fund - - - - - - -Sales Tax (EPWA) - - - - - - -Arts in Public Places Fund - - - - - - -Revenue Bond Funds (EPWA) - - - - - - -Additional Transfers - - 3,050,000 - - - -Total Transfers Out: 4,896,647 5,434,919 8,506,336 6,113,154 6,356,338 6,382,743 6,745,537 6,832,388 5.13 Click Here for Main Directory Click Here for Sub-Directory
VISIT EDMOND

Our mission is to promote Edmond as a destination in the state and region, as well as be a resource for newcomers and residents. We invite and encourage visitors to dine, shop, play and stay in Edmond. Visitors enjoy championship golf courses, indoor/outdoor food halls, downtown street festivals and local shopping and dining. Cruise Route 66 to explore Arcadia Lake, tour historic sites and snap selfies. Explore 33 parks, 47 miles of trails, more than 300 public art pieces and relax in your choice of 14 hotels and more than 150 vacation homes.
DID YOU KNOW?
Tourism is Oklahoma's third largest industry.

Enjoy 20 downtown festivals year-round.

Cruise 13.4 miles on Route 66 and visit the 1889 One-Room Schoolhouse, the Blue Hippo, Arcadia Lake and much more..

Organization Chart
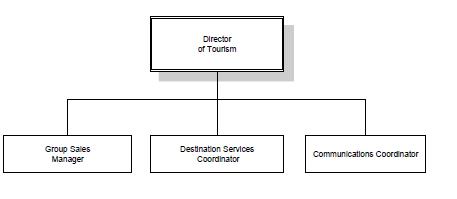

Staffing CURRENT YEAR YEAR 2024 YEAR 2025 YEAR 2026 YEAR 2027 YEAR 2028 4-0-0 4-0-0 4-0-0 5-0-0 5-0-0 5-0-0 Contact Us Jennifer Seaton, Tourism Director 405-341-4344 Jseaton@visitedmondok.gov www.VisitEdmondOK.com @VisitEdmond
5.14 Click Here for Main Directory Click Here for Sub-Directory
Visit Edmond FY 23-24 Prior Year Actual Adopted Year Budget Current Year Revised BUDGET YEAR Projected Budget Projected Budget Projected Budget Projected Budget FY 21-22FY 22-23FY 22-23 FY 23-24 FY 24-25FY 25-26FY 26-27FY 27-28 ESTIMATED RESOURCES: REVENUES: Taxes711,437 625,000 775,000 840,000 856,800 873,936 891,415 909,243 Inter-governmental- - - - - - -Licenses and Permits - - - - - - -Fines & Forfeitures - - - - - - -Charges for Services - - - - - - -Interest (6,424) 500 3,788 3,500 3,500 3,500 3,500 3,500 Investment Income - - - - - - -Capital Lease Proceeds - - - - - - -Miscellaneous Revenue 32,004 25,000 36,036 30,000 30,000 30,000 30,000 30,000 Subtotal - Revenues 737,017 650,500 814,824 873,500 890,300 907,436 924,915 942,743 OTHER RESOURCES: Debt/Loan Proceeds - - - - - -Restricted Prior Year Reserves 228,281 325,206 325,206 515,139 556,207 605,967 663,125 728,256 Assigned Prior Year Reserves (Council Projects) - - - - - -Committed Prior Year Reserves 21,477 21,477 - - - -Unrestricted Prior Year Reserves - - - - - -TOTAL ESTIMATED RESOURCES 965,298 997,183 1,161,507 1,388,639 1,446,507 1,513,403 1,588,040 1,670,999 ESTIMATED USES DIRECT COSTS BY FUNCTION: Personnel Services290,763 352,969 334,463 369,925 386,703 394,210 402,347 410,102 Materials & Supplies12,370 4,750 5,660 30,000 20,000 20,000 20,000 20,000 Other Services & Charges 82,013 93,832 80,195 220,000 220,000 222,000 222,000 222,000 Capital Outlay - - - - - - -Debt Service - - - - - - -TOTAL ESTIMATED COSTS 385,147 451,551 420,318 619,925 626,703 636,210 644,347 652,102 TRANSFERS: Transfers In - - - - - - -Transfers Out (See detail below) (233,469) (201,773) (226,049) (212,507) (213,837) (214,068) (215,437) (216,838) NET TRANSFERS IN (OUT) (233,469) (201,773) (226,049) (212,507) (213,837) (214,068) (215,437) (216,838) OTHER USES: Reserve for Employee Obligations - - - - -Reserve for Council Special Projects - - - - - - -Reserve for Capital Improvements - - - - -Committed for Other Purposes 21,477 -Restricted (Reserve for Other Purposes) - - - - - - -Restricted (Reserve for Specific Fund Purposes) 325,206 343,859 515,139 556,207 605,967 663,125 728,256 802,059 Unassigned (Res for Emergencies & Shortfalls*)TOTAL OTHER USES 346,683 343,859 515,139 556,207 605,967 663,125 728,256 802,059 TOTAL ESTIMATED USES 965,298 997,183 1,161,507 1,388,639 1,446,507 1,513,403 1,588,040 1,670,999 DETAIL OF TRANSFERS OUT: Administrative Support 68,605 49,346 49,346 59,848 61,045 61,136 62,359 63,606 Fleet Lease Assessment Fee - - - - - - -Fleet Management Fund - - - - - - -Insurance Assessment 2,130 2,427 2,427 2,659 2,792 2,932 3,078 3,232 Vehicle Maintenance Fees - - - - - - -Field Services - - - - - - -General Fund - - - - - - -Sales Tax (EPWA) - - - - - - -Arts in Public Places Fund - - - - - - -Revenue Bond Funds (EPWA) - - - - - - -EPWA Economic Development - - - - - - -Additional Transfers 162,734 150,000 174,276 150,000 150,000 150,000 150,000 150,000 Total Transfers Out: 233,469 201,773 226,049 212,507 213,837 214,068 215,437 216,838 5.15 Click Here for Main Directory Click Here for Sub-Directory
Special Tax- Parks Fund

The Special Tax- Park Fund was established to track the revenues for the additional sales tax that was established from January 2022 and ended December 2022 for the purchase of additional land for Hafer Park.
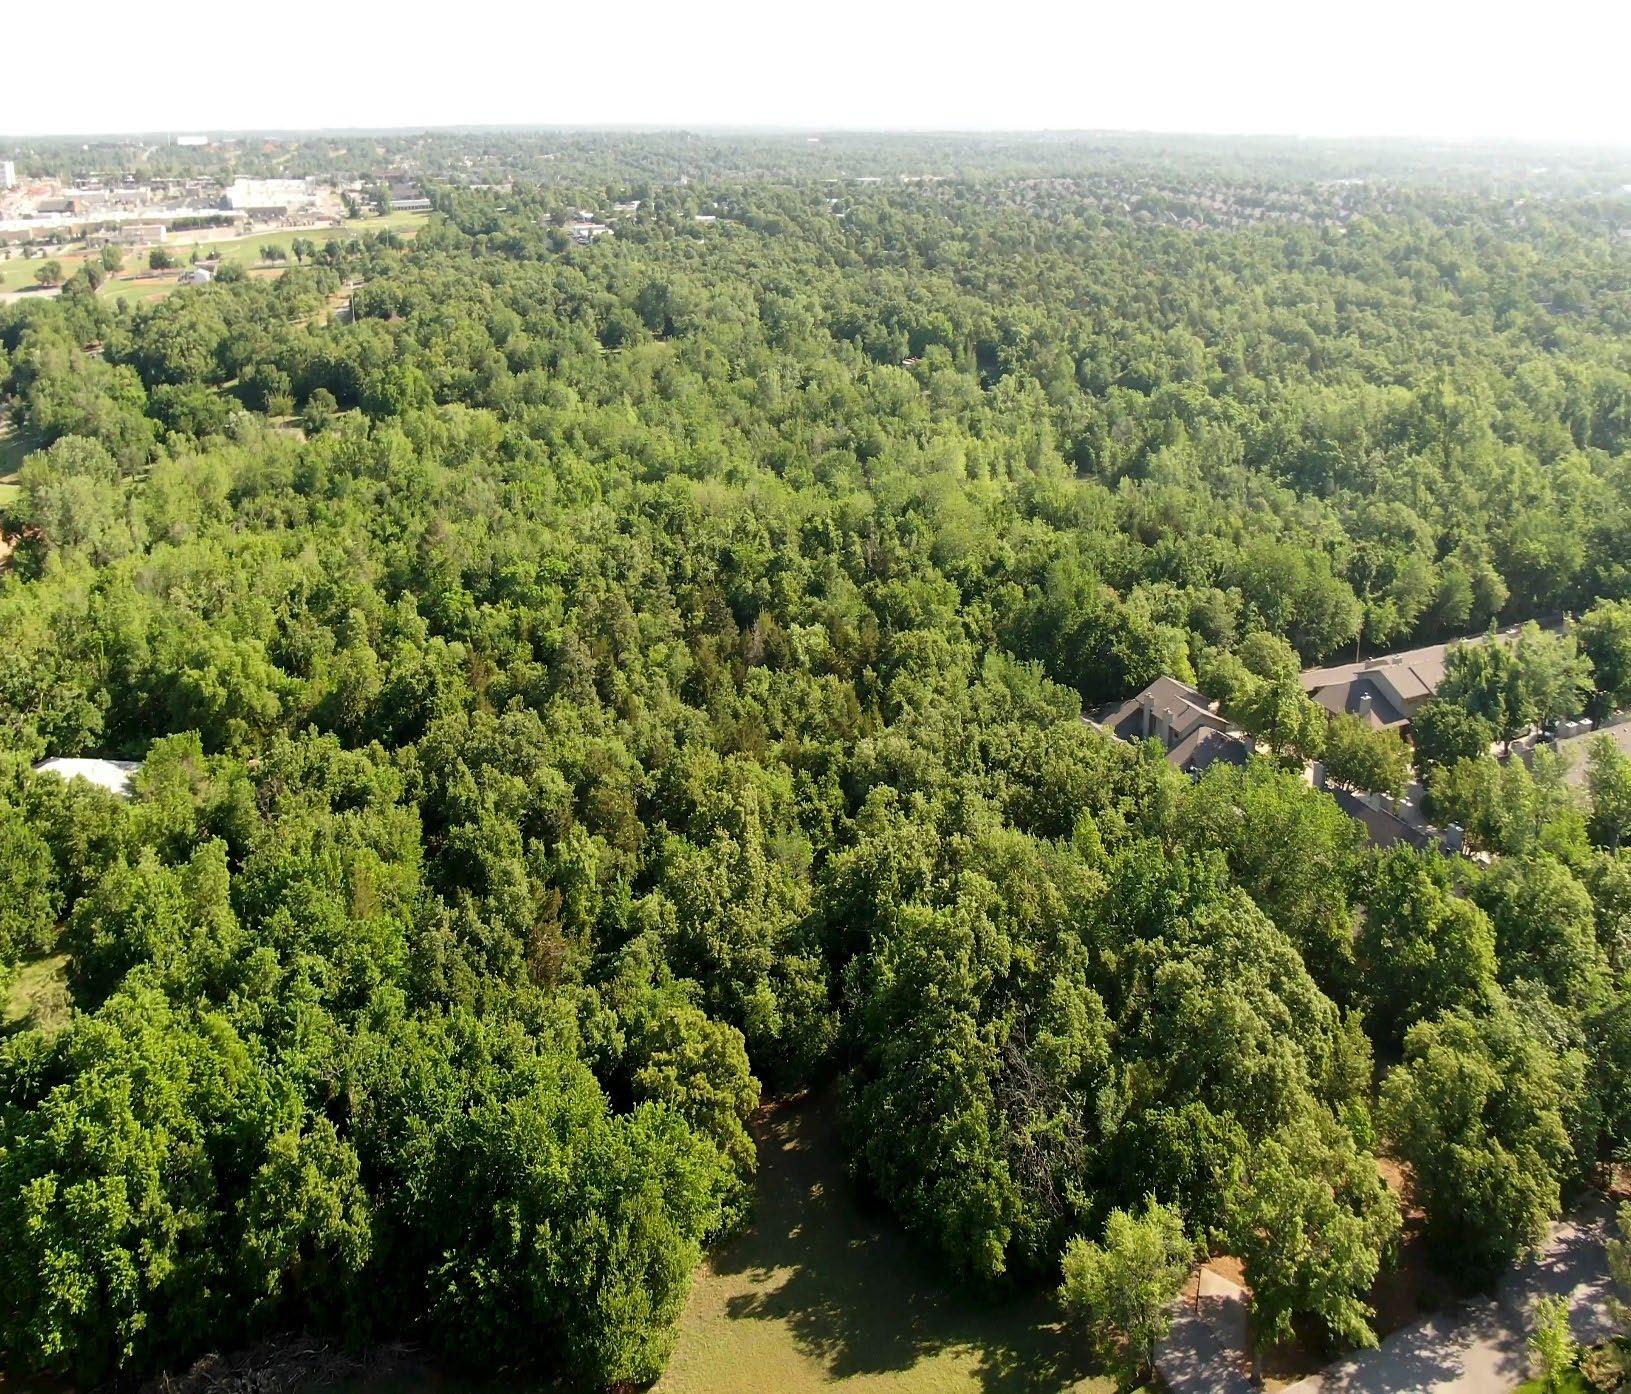
5.16 Click Here for Main Directory Click Here for Sub-Directory
Special Tax - Parks (Hafer) FY 23-24 Prior Year Actual Adopted Year Budget Current Year Revised BUDGET YEAR Projected Budget Projected Budget Projected Budget Projected Budget FY 21-22FY 22-23FY 22-23 FY 23-24 FY 24-25FY 25-26FY 26-27FY 27-28 ESTIMATED RESOURCES: REVENUES: Taxes- - 1,650,696 - - - -Inter-governmental - - - - - - -Licenses and Permits - - - - - - -Fines & Forfeitures - - - - - - -Charges for Services - - - - - - -Interest - - - - - - -Investment Income - - - - - - -Capital Lease Proceeds - - - - - - -Miscellaneous Revenue - - - - - - -Subtotal - Revenues - - 1,650,696 - - - -OTHER RESOURCES: Debt/Loan Proceeds - - - - - -Restricted Prior Year Reserves - - - 1,650,696 1,650,696 1,650,696 1,650,696 1,650,696 Assigned Prior Year Reserves (Council Projects) - - - - - -Committed Prior Year Reserves - - - - - -Unrestricted Prior Year Reserves - - - - - -TOTAL ESTIMATED RESOURCES - - 1,650,696 1,650,696 1,650,696 1,650,696 1,650,696 1,650,696 ESTIMATED USES DIRECT COSTS BY FUNCTION: Personnel Services- - - - - - -Materials & Supplies - - - - - - -Other Services & Charges - - - - - - -Capital Outlay - - - - - - -Debt Service - - - - - - -TOTAL ESTIMATED COSTS - - - - - - -TRANSFERS: Transfers In - - - - - - -Transfers Out (See detail below) - - - - - - -NET TRANSFERS IN (OUT) - - - - - - -OTHER USES: Reserve for Employee Obligations - - - - -Reserve for Council Special Projects - - - - - - -Reserve for Capital Improvements - - - - -Committed for Other Purposes - -Restricted (Reserve for Other Purposes) - - - - - - -Restricted (Reserve for Specific Fund Purposes) - - 1,650,696 1,650,696 1,650,696 1,650,696 1,650,696 1,650,696 Unassigned (Res for Emergencies & Shortfalls*)TOTAL OTHER USES - - 1,650,696 1,650,696 1,650,696 1,650,696 1,650,696 1,650,696 TOTAL ESTIMATED USES - - 1,650,696 1,650,696 1,650,696 1,650,696 1,650,696 1,650,696 DETAIL OF TRANSFERS OUT: Administrative Support - - - - - - -Fleet Lease Assessment Fee - - - - - - -Fleet Management Fund - - - - - - -Insurance Assessment - - - - - - -Vehicle Maintenance Fees - - - - - - -Field Services - - - - - - -General Fund - - - - - - -Sales Tax (EPWA) - - - - - - -Arts in Public Places Fund - - - - - - -Revenue Bond Funds (EPWA) - - - - - - -Additional Transfers - - - - - - -Total Transfers Out: - - - - - - -5.17 Click Here for Main Directory Click Here for Sub-Directory
American Rescue Plan Act of 2021

The American Rescue Plan Act (ARPA) provides relief funds to state, local, and tribal governments that have been negatively impacted by the coronavirus pandemic. These funds can be used by governments to respond to the public health and economic emergency, provide premium pay to essential workers, replace revenue lost due to the pandemic, and make necessary investments in water, sewer and broadband infrastructure.

5.18 Click Here for Main Directory Click Here for Sub-Directory
American Rescue Plan Act of 2021 FY 23-24 Prior Year Actual Adopted Year Budget Current Year Revised BUDGET YEAR Projected Budget Projected Budget Projected Budget Projected Budget FY 21-22FY 22-23FY 22-23 FY 23-24 FY 24-25FY 25-26FY 26-27FY 27-28 ESTIMATED RESOURCES: REVENUES: Taxes- - - - - - -Inter-governmental 216,819 - - - - - -Licenses and Permits - - - - - - -Fines & Forfeitures - - - - - - -Charges for Services - - - - - - -Interest (424,964) - - - - - -Investment Income - - - - - - -Capital Lease Proceeds - - - - - - -Miscellaneous Revenue - - - - - - -Subtotal - Revenues (208,146) - - - - - -OTHER RESOURCES: Debt/Loan Proceeds - - - - - -Restricted Prior Year Reserves 12,498,087 12,054,062 12,054,062 7,153,223 (0) (0) (0) (0) Assigned Prior Year Reserves (Council Projects) - - - - - -Committed Prior Year Reserves - - - - - -Unrestricted Prior Year Reserves - - - - - -TOTAL ESTIMATED RESOURCES 12,289,942 12,054,062 12,054,062 7,153,223 (0) (0) (0) (0) ESTIMATED USES DIRECT COSTS BY FUNCTION: Personnel Services- - - - - - -Materials & Supplies 13,142 1,000,000 64,321 50,000 - - -Other Services & Charges 157,573 1,000,000 698,860 1,000,000 - - -Capital Outlay 65,165 3,000,000 4,589,030 6,103,223 - - -Debt Service - - - - - - -TOTAL ESTIMATED COSTS 235,880 5,000,000 5,352,212 7,153,223 - - -TRANSFERS: Transfers In - - - - - - -Transfers Out (See detail below) - - (173,690) - - - -NET TRANSFERS IN (OUT) - - (173,690) - - - -OTHER USES: Reserve for Employee Obligations - - - - -Reserve for Council Special Projects - - - - - - -Reserve for Capital Improvements - - - - -Committed for Other Purposes - -Restricted (Reserve for Other Purposes) - - - - - - -Restricted (Reserve for Specific Fund Purposes)12,054,062 7,054,062 7,153,223 (0) (0) (0) (0) (0) Unassigned (Res for Emergencies & Shortfalls*)TOTAL OTHER USES 12,054,062 7,054,062 7,153,223 (0) (0) (0) (0) (0) TOTAL ESTIMATED USES 12,289,942 12,054,062 12,679,124 7,153,223 (0) (0) (0) (0) DETAIL OF TRANSFERS OUT: Administrative Support - - - - - - -Fleet Lease Assessment Fee - - - - - - -Fleet Management Fund - - - - - - -Insurance Assessment - - - - - - -Vehicle Maintenance Fees - - - - - - -Field Services - - - - - - -General Fund - - - - - - -Sales Tax (EPWA) - - - - - - -Arts in Public Places Fund - - - - - - -Revenue Bond Funds (EPWA) - - - - - - -Additional Transfers - - 173,690 - - - -Total Transfers Out: - - 173,690 - - - -5.19 Click Here for Main Directory Click Here for Sub-Directory
Opioid- Drug Settlement Revenue Fund
This special revenue fund was established to accept settlement funds received because of the nationwide litigation against certain opioid manufacturing, distributors and other third parties in connection with the manufacture, marketing, and distribution of opioids. The City along with many other Oklahoma cities and counties and the state joined this litigation. The settlements received by the City and placed in this special revenue fund are set aside primarily for opioid remediation pursuant to the terms of the respective settlement agreements. Additional funds may be received because of litigation regarding vaping and vape products
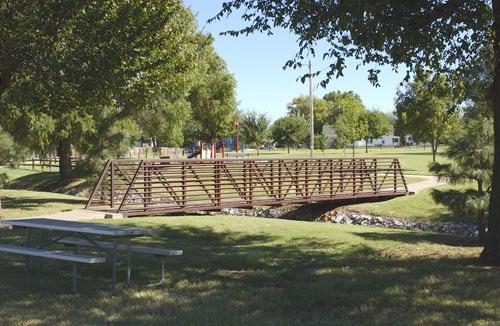


5.20 Click Here for Main Directory Click Here for Sub-Directory
Opioid/Drug Settlement Revenue Fund FY 23-24 Prior Year Actual Adopted Year Budget Current Year Revised BUDGET YEAR Projected Budget Projected Budget Projected Budget Projected Budget FY 21-22FY 22-23FY 22-23 FY 23-24 FY 24-25FY 25-26FY 26-27FY 27-28 ESTIMATED RESOURCES: REVENUES: Taxes- - - - - - -Inter-governmental - - - - - - -Licenses and Permits - - - - - - -Fines & Forfeitures - - - - - - -Charges for Services - - - - - - -Interest - - - - - - -Investment Income - - - - - - -Capital Lease Proceeds - - - - - - -Miscellaneous Revenue - - 391,406 - - - -Subtotal - Revenues - - 391,406 - - - -OTHER RESOURCES: Debt/Loan Proceeds - - - - - -Restricted Prior Year Reserves - - - 391,406 391,406 391,406 391,406 391,406 Assigned Prior Year Reserves (Council Projects) - - - - - -Committed Prior Year Reserves - - - - - -Unrestricted Prior Year Reserves - - - - - -TOTAL ESTIMATED RESOURCES - - 391,406 391,406 391,406 391,406 391,406 391,406 ESTIMATED USES DIRECT COSTS BY FUNCTION: Personnel Services- - - - - - -Materials & Supplies - - - - - - -Other Services & Charges - - - - - - -Capital Outlay - - - - - - -Debt Service - - - - - - -TOTAL ESTIMATED COSTS - - - - - - -TRANSFERS: Transfers In - - - - - - -Transfers Out (See detail below) - - - - - - -NET TRANSFERS IN (OUT) - - - - - - -OTHER USES: Reserve for Employee Obligations - - - - -Reserve for Council Special Projects - - - - - - -Reserve for Capital Improvements - - - - -Committed for Other Purposes - -Restricted (Reserve for Other Purposes) - - - - - - -Restricted (Reserve for Specific Fund Purposes) - - 391,406 391,406 391,406 391,406 391,406 391,406 Unassigned (Res for Emergencies & Shortfalls*)TOTAL OTHER USES - - 391,406 391,406 391,406 391,406 391,406 391,406 TOTAL ESTIMATED USES - - 391,406 391,406 391,406 391,406 391,406 391,406 DETAIL OF TRANSFERS OUT: Administrative Support - - - - - - -Fleet Lease Assessment Fee - - - - - - -Fleet Management Fund - - - - - - -Insurance Assessment - - - - - - -Vehicle Maintenance Fees - - - - - - -Field Services - - - - - - -General Fund - - - - - - -Sales Tax (EPWA) - - - - - - -Arts in Public Places Fund - - - - - - -Revenue Bond Funds (EPWA) - - - - - - -Additional Transfers - - - - - - -Total Transfers Out: - - - - - - -5.21 Click Here for Main Directory Click Here for Sub-Directory
REAL PROPERTY FUND
The Real Property Fund has been established to accumulate resources for future real property acquisitions of the City. Initially financing was provided by a one-time transfer of $463,230 reserved for land acquisition in the Capital Improvements Fund. Current funding is being provided by transfers from the Hospital Sale Trust Fund.


5.22 Click Here for Main Directory Click Here for Sub-Directory
Real Property Fund FY 23-24 Prior Year Actual Adopted Year Budget Current Year Revised BUDGET YEAR Projected Budget Projected Budget Projected Budget Projected Budget FY 21-22FY 22-23FY 22-23 FY 23-24 FY 24-25FY 25-26FY 26-27FY 27-28 ESTIMATED RESOURCES: REVENUES: Taxes- - - - - - -Inter-governmental - - - - - - -Licenses and Permits - - - - - - -Fines & Forfeitures - - - - - - -Charges for Services - - - - - - -Interest (12,219) 1,500 4,755 1,500 1,500 1,500 1,500 1,500 Investment Income - - - - - - -Capital Lease Proceeds - - - - - - -Miscellaneous Revenue - - - - - - -Subtotal - Revenues (12,219) 1,500 4,755 1,500 1,500 1,500 1,500 1,500 OTHER RESOURCES: Debt/Loan Proceeds - - - - - -Restricted Prior Year Reserves 567,218 554,949 554,949 540,485 540,485 540,485 540,485 540,485 Assigned Prior Year Reserves (Council Projects) - - - - - -Committed Prior Year Reserves - - - - - -Unrestricted Prior Year Reserves - - - - - -TOTAL ESTIMATED RESOURCES 554,999 556,449 559,704 541,985 541,985 541,985 541,985 541,985 ESTIMATED USES DIRECT COSTS BY FUNCTION: Personnel Services- - - - - - -Materials & Supplies - - - - - - -Other Services & Charges 50 1,500 39 1,500 1,500 1,500 1,500 1,500 Capital Outlay - - 19,180 - - - -Debt Service - - - - - - -TOTAL ESTIMATED COSTS 50 1,500 19,219 1,500 1,500 1,500 1,500 1,500 TRANSFERS: Transfers In - - - - - - -Transfers Out (See detail below) - - - - - - -NET TRANSFERS IN (OUT) - - - - - - -OTHER USES: Reserve for Employee Obligations - - - - -Reserve for Council Special Projects - - - - - - -Reserve for Capital Improvements - - - - -Committed for Other Purposes - -Restricted (Reserve for Other Purposes) - - - - - - -Restricted (Reserve for Specific Fund Purposes) 554,949 554,949 540,485 540,485 540,485 540,485 540,485 540,485 Unassigned (Res for Emergencies & Shortfalls*)TOTAL OTHER USES 554,949 554,949 540,485 540,485 540,485 540,485 540,485 540,485 TOTAL ESTIMATED USES 554,999 556,449 559,704 541,985 541,985 541,985 541,985 541,985 DETAIL OF TRANSFERS OUT: Administrative Support - - - - - - -Fleet Lease Assessment Fee - - - - - - -Fleet Management Fund - - - - - - -Insurance Assessment - - - - - - -Vehicle Maintenance Fees - - - - - - -Field Services - - - - - - -General Fund - - - - - - -Sales Tax (EPWA) - - - - - - -Arts in Public Places Fund - - - - - - -Revenue Bond Funds (EPWA) - - - - - - -Additional Transfers - - - - - - -Total Transfers Out: - - - - - - -5.23 Click Here for Main Directory Click Here for Sub-Directory
Tax Increment Financing Fund
The Tax Increment Financing (TIF) Fund has been established to track the revenues and expenses that are related to the established TIF. The Edmond TIF was established in the year 2020 and is a public financing method that is used as a subsidy for redevelopment, infrastructure, and other community improving projects in a defined area or district.
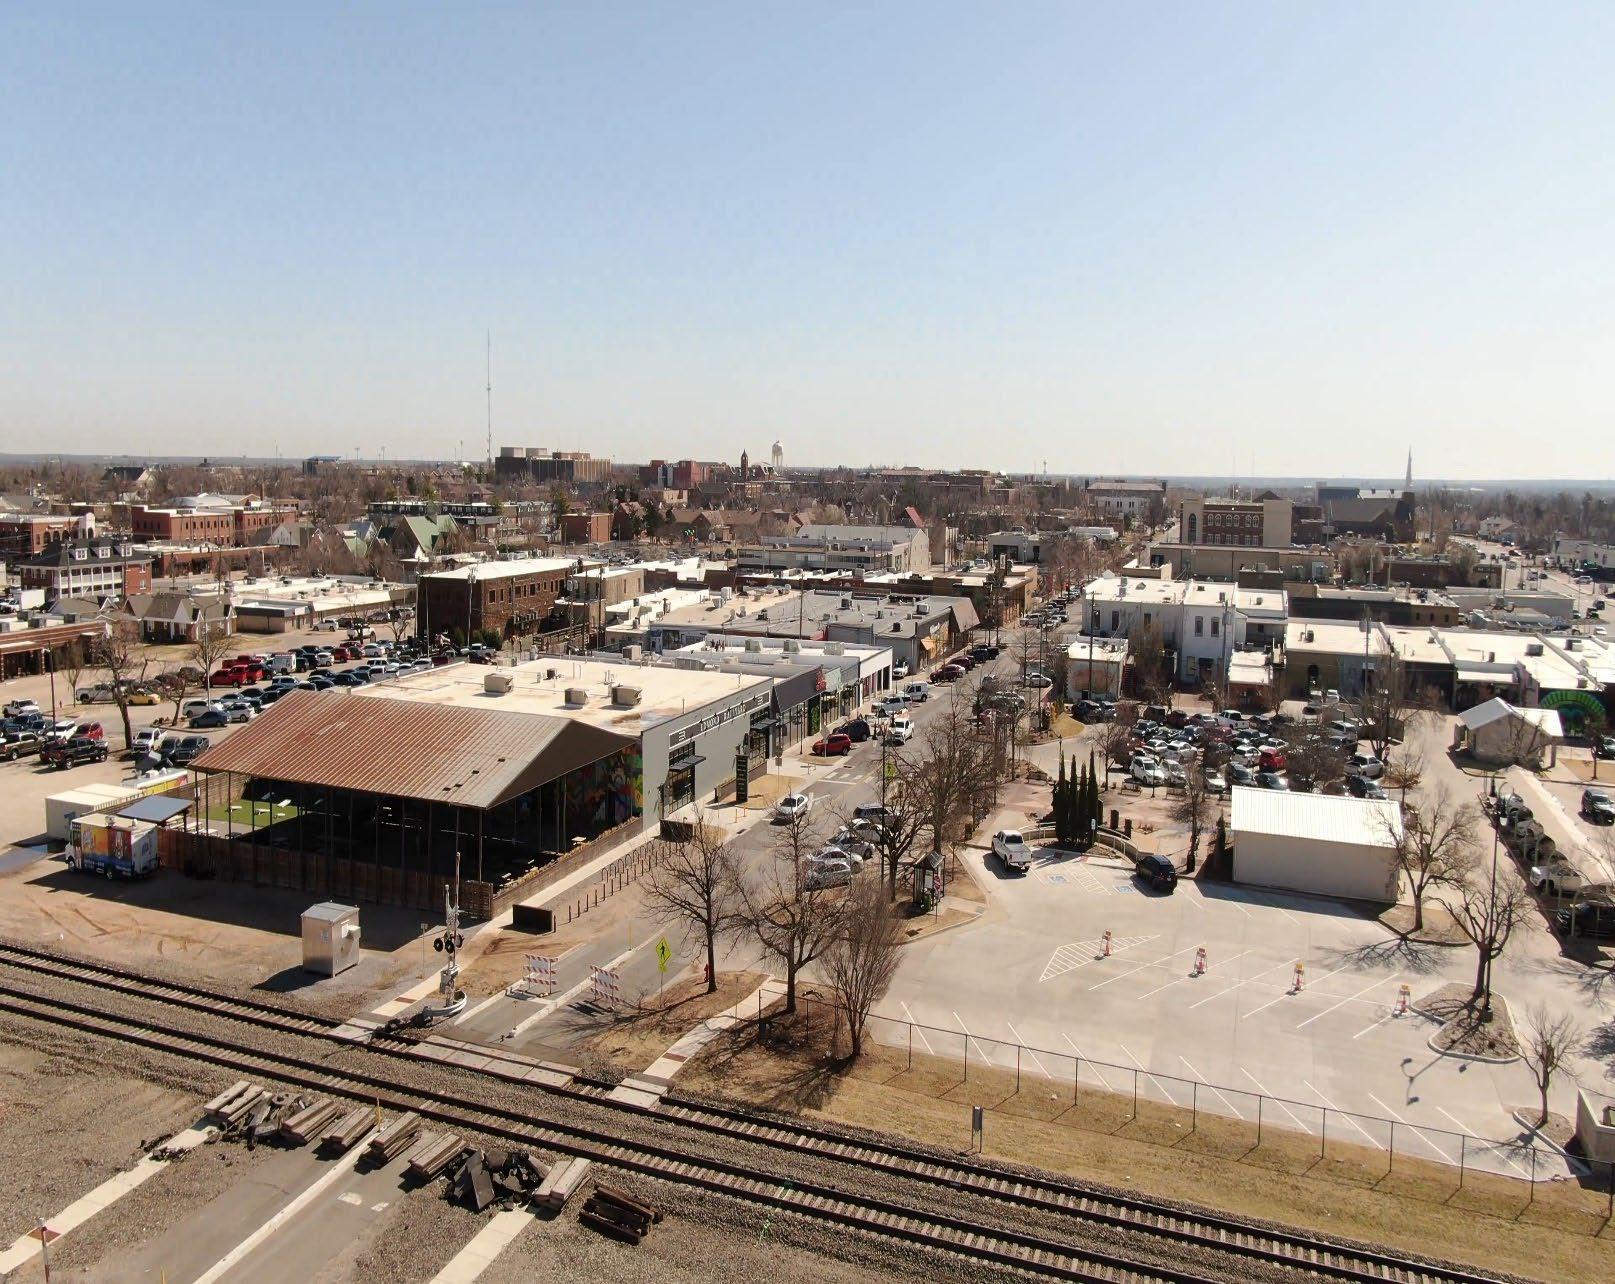

5.24 Click Here for Main Directory Click Here for Sub-Directory
Tax Increment Finance (TIF) Fund FY 23-24 Prior Year Actual Adopted Year Budget Current Year Revised BUDGET YEAR Projected Budget Projected Budget Projected Budget Projected Budget FY 21-22FY 22-23FY 22-23 FY 23-24 FY 24-25FY 25-26FY 26-27FY 27-28 ESTIMATED RESOURCES: REVENUES: Taxes- - - - - - -Inter-governmental - - - - - - -Licenses and Permits - - - - - - -Fines & Forfeitures - - - - - - -Charges for Services - - - - - - -Interest (78,200) - - - - - -Investment Income - - - - - - -Capital Lease Proceeds - - - - - - -Miscellaneous Revenue - - - - - - -Subtotal - Revenues (78,200) - - - - - -OTHER RESOURCES: Debt/Loan Proceeds - - - - - -Restricted Prior Year Reserves (3,226) - - - - - -Assigned Prior Year Reserves (Council Projects) - - - - - -Committed Prior Year Reserves 2,158,458 2,158,458 939,317 939,317 939,317 939,317 939,317 Unrestricted Prior Year Reserves - - - - - -TOTAL ESTIMATED RESOURCES (81,426) 2,158,458 2,158,458 939,317 939,317 939,317 939,317 939,317 ESTIMATED USES DIRECT COSTS BY FUNCTION: Personnel Services- - - - - - -Materials & Supplies - - - - - - -Other Services & Charges - - - - - - -Capital Outlay 4,260,116 - 1,219,141 - - - -Debt Service - - - - - - -TOTAL ESTIMATED COSTS 4,260,116 - 1,219,141 - - - -TRANSFERS: Transfers In 6,500,000 - - - - - -Transfers Out (See detail below) - - - - - - -NET TRANSFERS IN (OUT) 6,500,000 - - - - - -OTHER USES: Reserve for Employee Obligations - - - - -Reserve for Council Special Projects - - - - - - -Reserve for Capital Improvements - - - - -Committed for Other Purposes 2,158,458 2,158,458 939,317 939,317 939,317 939,317 939,317 939,317 Restricted (Reserve for Other Purposes) - - - - - - -Restricted (Reserve for Specific Fund Purposes)Unassigned (Res for Emergencies & Shortfalls*)TOTAL OTHER USES 2,158,458 2,158,458 939,317 939,317 939,317 939,317 939,317 939,317 TOTAL ESTIMATED USES (81,426) 2,158,458 2,158,458 939,317 939,317 939,317 939,317 939,317 DETAIL OF TRANSFERS OUT: Administrative Support - - - - - - -Fleet Lease Assessment Fee - - - - - - -Fleet Management Fund - - - - - - -Insurance Assessment - - - - - - -Vehicle Maintenance Fees - - - - - - -Field Services - - - - - - -General Fund - - - - - - -Sales Tax (EPWA) - - - - - - -Arts in Public Places Fund - - - - - - -Revenue Bond Funds (EPWA) - - - - - - -Additional Transfers - - - - - - -Total Transfers Out: - - - - - - -5.25 Click Here for Main Directory Click Here for Sub-Directory
HOSPITAL SALE TRUST FUND
This fund accounts for the proceeds received from the 1981 sale of the Edmond Memorial Hospital. Its only revenue source is interest earnings from the investment of the proceeds. The interest earnings may be used for capital improvements by the City Council and the Corpus may only be spent by a vote of the citizens of Edmond.

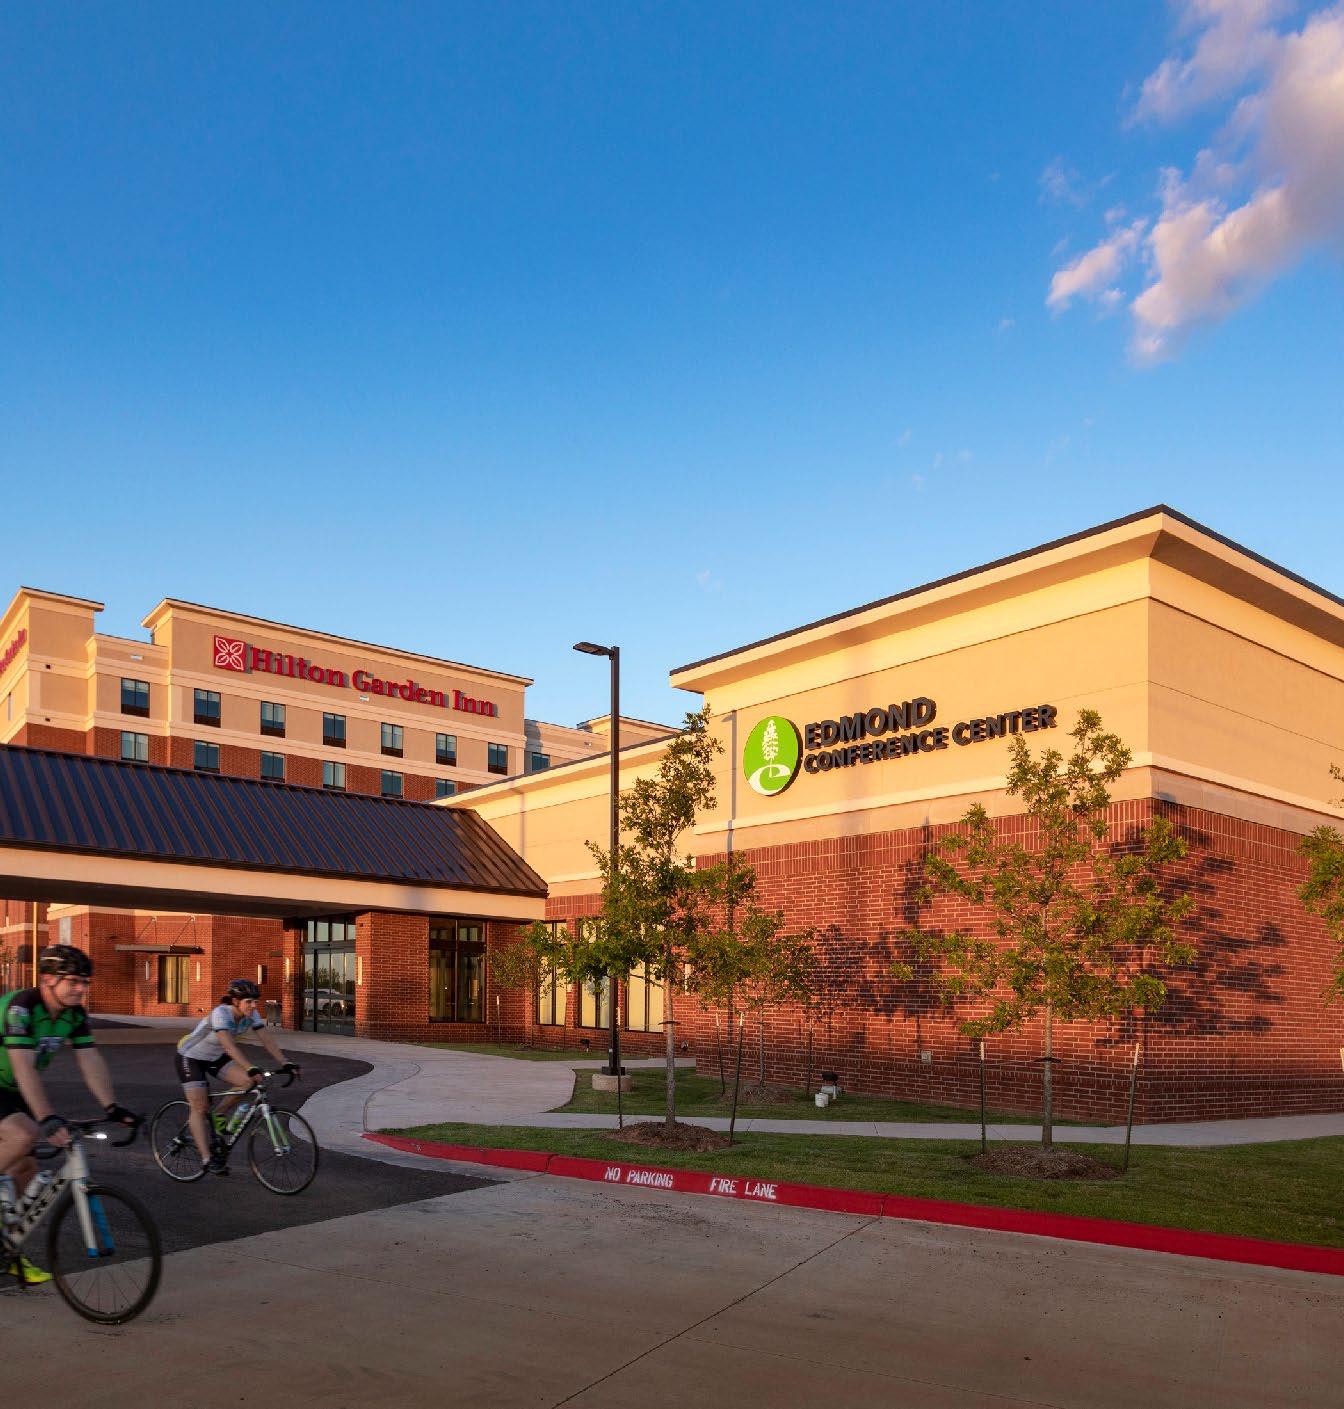
5.26 Click Here for Main Directory Click Here for Sub-Directory
Hospital Sale Trust Fund FY 23-24 Prior Year Actual Adopted Year Budget Current Year Revised BUDGET YEAR Projected Budget Projected Budget Projected Budget Projected Budget FY 21-22FY 22-23FY 22-23 FY 23-24 FY 24-25FY 25-26FY 26-27FY 27-28 ESTIMATED RESOURCES: REVENUES: Taxes- - - - - - -Inter-governmental - - - - - - -Licenses and Permits - - - - - - -Fines & Forfeitures - - - - - - -Charges for Services - - - - - - -Interest (237,895) 10,000 15,109 10,000 10,000 10,000 10,000 10,000 Investment Income - - - - - - -Capital Lease Proceeds - - - - - - -Miscellaneous Revenue - - - - - - -Subtotal - Revenues (237,895) 10,000 15,109 10,000 10,000 10,000 10,000 10,000 OTHER RESOURCES: Debt/Loan Proceeds - - - - - -Restricted Prior Year Reserves 7,237,095 6,997,000 6,997,000 7,011,010 7,019,010 7,027,010 7,035,010 7,043,010 Assigned Prior Year Reserves (Council Projects) - - - - - -Committed Prior Year Reserves - - - - - -Unrestricted Prior Year Reserves - - - - - -TOTAL ESTIMATED RESOURCES 6,999,200 7,007,000 7,012,110 7,021,010 7,029,010 7,037,010 7,045,010 7,053,010 ESTIMATED USES DIRECT COSTS BY FUNCTION: Personnel Services- - - - - - -Materials & Supplies - - - - - - -Other Services & Charges 2,200 - 1,100 - - - -Capital Outlay - - - - - - -Debt Service - 2,000 - 2,000 2,000 2,000 2,000 2,000 TOTAL ESTIMATED COSTS 2,200 2,000 1,100 2,000 2,000 2,000 2,000 2,000 TRANSFERS: Transfers In - - - - - - -Transfers Out (See detail below) - - - - - - -NET TRANSFERS IN (OUT) - - - - - - -OTHER USES: Reserve for Employee Obligations - - - - -Reserve for Council Special Projects - - - - - - -Reserve for Capital Improvements - - - - -Committed for Other Purposes - -Restricted (Reserve for Other Purposes) - - - - - - -Restricted (Reserve for Specific Fund Purposes) 6,997,000 7,005,000 7,011,010 7,019,010 7,027,010 7,035,010 7,043,010 7,051,010 Unassigned (Res for Emergencies & Shortfalls*)TOTAL OTHER USES 6,997,000 7,005,000 7,011,010 7,019,010 7,027,010 7,035,010 7,043,010 7,051,010 TOTAL ESTIMATED USES 6,999,200 7,007,000 7,012,110 7,021,010 7,029,010 7,037,010 7,045,010 7,053,010 DETAIL OF TRANSFERS OUT: Administrative Support - - - - - - -Fleet Lease Assessment Fee - - - - - - -Fleet Management Fund - - - - - - -Insurance Assessment - - - - - - -Vehicle Maintenance Fees - - - - - - -Field Services - - - - - - -General Fund - - - - - - -Sales Tax (EPWA) - - - - - - -Arts in Public Places Fund - - - - - - -Revenue Bond Funds (EPWA) - - - - - - -Additional Transfers - - - - - - -Total Transfers Out: - - - - - - -5.27 Click Here for Main Directory Click Here for Sub-Directory
INTENTIONALLY
PAGE
LEFT BLANK
Capital Project Funds - Sub-Directory
Park Tax Fund 6.2-6.3 Summary Page 6.2 Budget Page 6.3 Cemetery Care Fund 6.4-6.5 Summary Page 6.4 Budget Page 6.5 Art In Public Places 6.6-6.7 Summary Page 6.6 Budget Page 6.7 Cemetery Perpetual Care Fund 6.8-6.9 Summary Page 6.8 Budget Page 6.9 Capital Improvements Fund 6.10-6.11 Summary Page 6.10 Budget Page 6.11 2000 Capital Improvements Tax Fund 6.12-6.13 Summary Page 6.12 Budget Page 6.13 2017 Capital Improvements Tax Fund 6.14-6.15 Summary Page 6.14 Budget Page 6.15
6.1
PARKS TAX FUND
The Park Tax Fund is a dedicated 1/8 cent City sales tax for operations and improvements within the Parks & Recreation Department and its various divisions such as Arcadia Lake, KickingBird Golf & Tennis and our sports partners—such as Edmond Soccer, Rodeo, Adult Softball, Lacrosse benefit from this funding source.

6.2 Click Here for Main Directory Click Here for Sub-Directory
Park Tax Fund FY 23-24 Prior Year Actual Adopted Year Budget Current Year Revised BUDGET YEAR Projected Budget Projected Budget Projected Budget Projected Budget FY 21-22FY 22-23FY 22-23 FY 23-24 FY 24-25FY 25-26FY 26-27FY 27-28 ESTIMATED RESOURCES: REVENUES: Taxes5,357,451 2,760,695 5,680,654 2,990,530 3,050,157 3,111,160 3,173,384 3,236,851 Inter-governmental- - - - - - -Licenses and Permits - - - - - - -Fines & Forfeitures - - - - - - -Charges for Services - - - - - - -Interest (93,889) 10,000 69,748 10,000 10,000 10,000 10,000 10,000 Investment Income - - - - - - -Capital Lease Proceeds - - - - - - -Miscellaneous Revenue 229,437 196,958 53,972 74,367 75,855 77,371 78,9 19 80,497 EPS Reimbursement - - - - - - -Subtotal - Revenues 5,492,998 2,967,653 5,804,373 3,074,897 3,136,012 3,198,531 3,262,303 3,327,348 OTHER RESOURCES: Debt/Loan Proceeds - - - - - -Restricted Prior Year Reserves 3,867,969 3,011,352 3,011,352 6,806,245 7,295,554 7,187,809 7,818,211 9,397,769 Assigned Prior Year Reserves (Council Projects) - - - - - -Committed Prior Year Reserves 462,242 462,242 - - - -Unrestricted Prior Year Reserves - - - - - -TOTAL ESTIMATED RESOURCES 9,360,966 6,441,247 9,277,967 9,881,142 10,431,566 10,386,340 11,080,514 12,725,117 ESTIMATED USES DIRECT COSTS BY FUNCTION: Personnel Services478,471 554,766 529,148 563,667 575,185 594,640 615,976 635,983 Materials & Supplies60,342 75,300 84,802 75,400 75,300 75,300 76,883 75,400 Other Services & Charges 616,849 710,300 748,852 856,546 796,700 806,700 806,700 816,700 Capital Outlay 4,576,003 2,768,000 1,026,123 1,051,000 1,756,000 1,050,000 140,000Debt Service - - - - - - -TOTAL ESTIMATED COSTS 5,731,665 4,108,366 2,388,925 2,546,613 3,203,185 2,526,640 1,639,559 1,528,083 TRANSFERS: Transfers In - - - 25,000 25,000 25,000 25,000 25,000 Transfers Out (See detail below) (155,708) (168,698) (82,798) (63,975) (65,572) (66,489) (68,186) (69,945) NET TRANSFERS IN (OUT) (155,708) (168,698) (82,798) (38,975) (40,572) (41,489) (43,186) (44,945) OTHER USES: Reserve for Employee Obligations - - - - - - -Reserve for Council Special Projects - - - - - - -Restricted (Reserve for Capital Improvements) 3,011,352 2,164,183 6,806,245 7,295,554 7,187,809 7,818,211 9,397,769 11,152,089 Committed for Other Purposes 462,242 Restricted (Reserve for Other Purposes) - - - - - - -Restricted (Reserve for Specific Fund Purposes)Unassigned (Res for Emergencies & Shortfalls*)TOTAL OTHER USES 3,473,594 2,164,183 6,806,245 7,295,554 7,187,809 7,818,211 9,397,769 11,152,089 TOTAL ESTIMATED USES 9,360,966 6,441,247 9,277,967 9,881,142 10,431,566 10,386,340 11,080,514 12,725,117 DETAIL OF TRANSFERS OUT: Administrative Support 40,606 57,625 57,625 39,032 39,813 39,872 40,669 41,483 Fleet Lease Assessment Fee 9,337 10,858 10,858 11,370 11,908 12,473 13,066 13,689 Fleet Management Fund - 80,000 - - - - -Insurance Assessment 4,464 4,715 4,715 5,573 5,851 6,144 6,451 6,773 Vehicle Maintenance Fees 1,301 8,000 9,600 8,000 8,000 8,000 8,000 8,000 Field Services - - - - - - -Sales Tax (EPWA) - - - - - - -Arts in Public Places Fund - 7,500 - - - - -General Fund - - - - - - -Revenue Bond Funds (EPWA) - - - - - - -Transfers - EE Debt - - - - - - -Golf Course Fund 100,000 - - - - - -Arcadia Lake - - - - - - -Additional Transfers - - - - - - -Total Transfers Out: 155,708 168,698 82,798 63,975 65,572 66,489 68,186 69,945
6.3 Click Here for Main Directory Click Here for Sub-Directory
Fund Budget Summary
CEMETERY CARE FUND

The Cemetery Care Fund has been established to account for 12.5% of all monies received from the sale of lots and interments in accordance with state law. Monies received must be used for improving, caring for and beautifying cemetery property.
6.4 Click Here for Main Directory Click Here for Sub-Directory
Cemetery Care Fund FY 23-24 Prior Year Actual Adopted Year Budget Current Year Revised BUDGET YEAR Projected Budget Projected Budget Projected Budget Projected Budget FY 21-22FY 22-23FY 22-23 FY 23-24 FY 24-25FY 25-26FY 26-27FY 27-28 ESTIMATED RESOURCES: REVENUES: Taxes- - - - - - -Inter-governmental - - - - - - -Licenses and Permits - - - - - - -Fines & Forfeitures - - - - - - -Charges for Services 90,703 75,000 65,232 57,197 58,340 59,507 60,697 61,911 Interest (3,600) 500 4,871 500 500 500 500 500 Investment Income - - - - - - -Capital Lease Proceeds - - - - - - -Miscellaneous Revenue - - - - - - -Subtotal - Revenues 87,103 75,500 70,103 57,697 58,840 60,007 61,197 62,411 OTHER RESOURCES: Debt/Loan Proceeds - - - - - -Restricted Prior Year Reserves 192,201 226,185 226,185 315,967 356,164 411,004 467,011 524,208 Assigned Prior Year Reserves (Council Projects) - - - - - -Committed Prior Year Reserves 23,138 23,138 - - - -Unrestricted Prior Year Reserves - - - - - -TOTAL ESTIMATED RESOURCES 279,303 324,823 319,426 373,664 415,004 471,011 528,208 586,619 ESTIMATED USES DIRECT COSTS BY FUNCTION: Personnel Services- - - - - - -Materials & Supplies - - - - - - -Other Services & Charges 7,879 10,300 3,459 4,000 4,000 4,000 4,000 4,000 Capital Outlay 22,101 - - 13,500 - - -Debt Service - - - - - - -TOTAL ESTIMATED COSTS 29,980 10,300 3,459 17,500 4,000 4,000 4,000 4,000 TRANSFERS: Transfers In - - - - - - -Transfers Out (See detail below) - - - - - - -NET TRANSFERS IN (OUT) - - - - - - -OTHER USES: Reserve for Employee Obligations - - - - - - -Reserve for Council Special Projects - - - - - - -Restricted (Reserve for Capital Improvements)Committed for Other Purposes 23,138 Restricted (Reserve for Other Purposes) - - - - - - -Restricted (Reserve for Specific Fund Purposes) 226,185 314,523 315,967 356,164 411,004 467,011 524,208 582,619 Unassigned (Res for Emergencies & Shortfalls)TOTAL OTHER USES 249,323 314,523 315,967 356,164 411,004 467,011 524,208 582,619 TOTAL ESTIMATED USES 279,303 324,823 319,426 373,664 415,004 471,011 528,208 586,619 DETAIL OF TRANSFERS OUT: Administrative Support - - - - - - -Fleet Lease Assessment Fee - - - - - - -Fleet Management Fund - - - - - - -Insurance Assessment - - - - - - -Vehicle Maintenance Fees - - - - - - -Field Services - - - - - - -Sales Tax (EPWA) - - - - - - -Arts in Public Places Fund - - - - - - -General Fund - - - - - - -Revenue Bond Funds (EPWA) - - - - - - -Transfers - EE Debt - - - - - - -Golf Course Fund - - - - - - -Arcadia Lake - - - - - - -Additional Transfers - - - - - - -Total Transfers Out: - - - - - - - -
6.5 Click Here for Main Directory Click Here for Sub-Directory
Fund Budget Summary
ARTINPUBLICPLACES


Ordinance purpose is to provide means to fund the acquisition of works of art by the City and which art shall be in the City’s collection, to create a Visual Arts Commission (VAC), to provide a means to select works of art for the collection, to provide for the display of the collection, and to provide for the maintenance and repair of the works of art in the collection (Ord.2653, 1, Oct.8, 2001).

DIDYOUKNOW? InOctober2021,theVisualArts Commissioncelebrated20yearsofthe publicartprogramclosingouttwodecades ofpartnershipswith275publicartpieces ininventory. — AsofJanuary2022,privatedonations haveexceededthematchingfunds programby$1,000,000.
Wanttoseetheartforyourself?We nowhave5self-guidedarttourbrochures. CONTACT Cinda Covel Art Liaison Ph (405) 285-4275
—
6.6 Click Here for Main Directory Click Here for Sub-Directory
Art in Public Places Fund FY 23-24 Prior Year Actual Adopted Year Budget Current Year Revised BUDGET YEAR Projected Budget Projected Budget Projected Budget Projected Budget FY 21-22FY 22-23FY 22-23 FY 23-24 FY 24-25FY 25-26FY 26-27FY 27-28 ESTIMATED RESOURCES: REVENUES: Taxes - - - - - - -Inter-governmental - - - - - - -Licenses and Permits - - - - - - -Fines & Forfeitures - - - - - - -Charges for Services - - - - - - -Interest (5,997) 1,000 1,577 1,000 1,000 1,000 1,000 1,000 Investment Income - - - - - - -Capital Lease Proceeds - - - - - - -Miscellaneous Revenue 734,200 250,000 45,918 - - - -Subtotal - Revenues 728,203 251,000 47,495 1,000 1,000 1,000 1,000 1,000 OTHER RESOURCES: Debt/Loan Proceeds - - - - - -Restricted Prior Year Reserves 106,629 346,975 346,975 200,829 198,141 195,379 192,612 189,769 Assigned Prior Year Reserves (Council Projects) - - - - - -Committed Prior Year Reserves 6,563 6,563 - - - -Unrestricted Prior Year Reserves - - - - - -TOTAL ESTIMATED RESOURCES 834,832 604,538 401,034 201,829 199,141 196,379 193,612 190,769 ESTIMATED USES DIRECT COSTS BY FUNCTION: Personnel Services- - - - - - -Materials & Supplies 1 25 25 - - - -Other Services & Charges 10,476 16,000 16 - - - -Capital Outlay 936,565 737,500 253,753 200,000 100,000 100,000 100,000 100,000 Debt Service - - - - - - -TOTAL ESTIMATED COSTS 947,041 753,525 253,793 200,000 100,000 100,000 100,000 100,000 TRANSFERS: Transfers In 468,017 567,500 56,260 200,000 100,000 100,000 100,000 100,000 Transfers Out (See detail below) (2,270) (2,915) (2,672) (3,688) (3,762) (3,767) (3,843) (3,919) NET TRANSFERS IN (OUT) 465,747 564,585 53,588 196,312 96,238 96,233 96,157 96,081 OTHER USES: Reserve for Employee Obligations - - - - - - -Reserve for Council Special Projects - - - - - - -Restricted (Reserve for Capital Improvements/Self-Insured)Committed for Other Purposes 6,563 Restricted (Reserve for Other Purposes) - - - - - - -Restricted (Reserve for Specific Fund Purposes) 346,975 415,599 200,829 198,141 195,379 192,612 189,769 186,850 Unassigned (Res for Emergencies & Shortfalls*)TOTAL OTHER USES 353,538 415,599 200,829 198,141 195,379 192,612 189,769 186,850 TOTAL ESTIMATED USES 834,832 604,538 401,034 201,829 199,141 196,379 193,612 190,769 DETAIL OF TRANSFERS OUT: Administrative Support 2,270 2,915 2,672 3,688 3,762 3,767 3,843 3,919 Fleet Lease Assessment Fee - - - - - - -Fleet Management Fund - - - - - - -Insurance Assessment - - - - - - -Vehicle Maintenance Fees - - - - - - -Field Services - - - - - - -Sales Tax (EPWA) - - - - - - -Arts in Public Places Fund - - - - - - -General Fund - - - - - - -Revenue Bond Funds (EPWA) - - - - - - -Transfers - EE Debt - - - - - - -Golf Course Fund - - - - - - -Arcadia Lake - - - - - - -Additional Transfers - - - - - - -Total Transfers Out: 2,270 2,915 2,672 3,688 3,762 3,767 3,843 3,919 Fund Budget Summary 6.7 Click Here for Main Directory Click Here for Sub-Directory
CEMETERY PERPETUAL CARE FUND
The Cemetery Perpetual Care Fund has been established to account for 20% of all monies received from the sale of lots and interments in accordance with state law. Monies received must be used to purchase lands for cemeteries and for making capital improvements. Interest earned may be used for improving, caring for maintaining the existing cemetery and beautifying cemetery property.
6.8 Click Here for Main Directory Click Here for Sub-Directory
Cemetery Perpetual Care Fund FY 23-24 Prior Year Actual Adopted Year Budget Current Year Revised BUDGET YEAR Projected Budget Projected Budget Projected Budget Projected Budget FY 21-22FY 22-23FY 22-23 FY 23-24 FY 24-25FY 25-26FY 26-27FY 27-28 ESTIMATED RESOURCES: REVENUES: Taxes- - - - - - -Inter-governmental - - - - - - -Licenses and Permits - - - - - - -Fines & Forfeitures - - - - - - -Charges for Services 145,124 100,000 104,371 100,000 100,000 100,000 100,000 100,000 Interest (9,529) 500 - 500 500 500 500 500 Investment Income - - - - - - -Capital Lease Proceeds - - - - - - -Miscellaneous Revenue - - - - - - -Subtotal - Revenues 135,595 100,500 104,371 100,500 100,500 100,500 100,500 100,500 OTHER RESOURCES: Debt/Loan Proceeds - - - - - -Restricted Prior Year Reserves 134,975 270,570 270,570 374,941 475,341 575,741 676,141 776,541 Assigned Prior Year Reserves (Council Projects) - - - - - -Committed Prior Year Reserves - - - - - -Unrestricted Prior Year Reserves - - - - - -TOTAL ESTIMATED RESOURCES 270,570 371,070 374,941 475,441 575,841 676,241 776,641 877,041 ESTIMATED USES DIRECT COSTS BY FUNCTION: Personnel Services- - - - - - -Materials & Supplies - 500 - - - - -Other Services & Charges - 100 - 100 100 100 100 100 Capital Outlay - - - - - - -Debt Service - - - - - - -TOTAL ESTIMATED COSTS - 600 - 100 100 100 100 100 TRANSFERS: Transfers In - - - - - - -Transfers Out (See detail below) - - - - - - -NET TRANSFERS IN (OUT) - - - - - - -OTHER USES: Reserve for Employee Obligations - - - - - - -Reserve for Council Special Projects - - - - - - -Restricted (Reserve for Capital Improvements)Committed for Other PurposesRestricted (Reserve for Other Purposes) - - - - - - -Restricted (Reserve for Specific Fund Purposes) 270,570 370,470 374,941 475,341 575,741 676,141 776,541 876,941 Unassigned (Res for Emergencies & Shortfall*)TOTAL OTHER USES 270,570 370,470 374,941 475,341 575,741 676,141 776,541 876,941 TOTAL ESTIMATED USES 270,570 371,070 374,941 475,441 575,841 676,241 776,641 877,041 DETAIL OF TRANSFERS OUT: Administrative Support - - - - - - -Fleet Lease Assessment Fee - - - - - - -Fleet Management Fund - - - - - - -Insurance Assessment - - - - - - -Vehicle Maintenance Fees - - - - - - -Field Services - - - - - - -Sales Tax (EPWA) - - - - - - -Arts in Public Places Fund - - - - - - -General Fund - - - - - - -Revenue Bond Funds (EPWA) - - - - - - -Transfers - EE Debt - - - - - - -Golf Course Fund - - - - - - -Arcadia Lake - - - - - - -Additional Transfers - - - - - - -Total Transfers Out: - - - - - - -Fund Budget Summary 6.9 Click Here for Main Directory Click Here for Sub-Directory
CAPITAL IMPROVEMENT FUND
The Capital Improvements Fund has been established to account for major capital improvements and ADA (Americans with Disability Act) projects that are financed by the General Fund and other designated sources.

6.10 Click Here for Main Directory Click Here for Sub-Directory
Capital Improvements Fund FY 23-24 Prior Year Actual Adopted Year Budget Current Year Revised BUDGET YEAR Projected Budget Projected Budget Projected Budget Projected Budget FY 21-22FY 22-23FY 22-23 FY 23-24 FY 24-25FY 25-26FY 26-27FY 27-28 ESTIMATED RESOURCES: REVENUES: Taxes- - - - - - -Inter-governmental 108,500 - 11,938 - - - -Licenses and Permits - - - - - - -Fines & Forfeitures - - - - - - -Charges for Services - - - - - - -Interest (111,867) 2,500 25,546 2,500 20,000 - -Investment Income - - - - - - -Capital Lease Proceeds - - - - - - -Miscellaneous Revenue - - 82,203 - - - -Subtotal - Revenues (3,367) 2,500 119,688 2,500 20,000 - -OTHER RESOURCES: Debt/Loan Proceeds - - - - - -Restricted Prior Year Reserves 529,588 4,195,801 4,195,801 1,243,900 1,116,250 1,136,100 1,135,950 1,135,800 Assigned Prior Year Reserves (Council Projects) - - - - - -Committed Prior Year Reserves - - - - - -Unrestricted Prior Year Reserves - - - - - -TOTAL ESTIMATED RESOURCES 526,221 4,198,301 4,315,489 1,246,400 1,136,250 1,136,100 1,135,950 1,135,800 ESTIMATED USES DIRECT COSTS BY FUNCTION: Personnel Services- - - - - - -Materials & Supplies - - - - - - -Other Services & Charges 375 150 57,176 150 150 150 150 150 Capital Outlay General Government 1,732,878 400,000 3,347,689 530,000 400,000 400,000 400,000 400,000 Streets & Highways - - 143,495 - - - -Parks & Recreation - - - - - - -Downtown Development - - - - - - -Economic Development - - - - - - -Public Safety - - - - - - -Community Development - - - - - - -Other Capital Outlay: - - - - - - -Debt Service - - - - - - -TOTAL ESTIMATED COSTS 1,733,253 400,150 3,548,360 530,150 400,150 400,150 400,150 400,150 TRANSFERS: Transfers In 5,402,833 200,000 476,772 400,000 400,000 400,000 400,000 400,000 Transfers Out (See detail below) - - - - - - -NET TRANSFERS IN (OUT) 5,402,833 200,000 476,772 400,000 400,000 400,000 400,000 400,000 OTHER USES: Reserve for Employee Obligations - - - - - - -Reserve for Council Special Projects - - - - - - -Reserve for Capital Improvements 4,195,801 3,998,151 1,243,900 1,116,250 1,136,100 1,135,950 1,135,800 1,135,650 Committed for Other Purposes - - - - - - -Reserve for Other Restricted PurposesRestricted (Reserve for Specific Fund Purposes) - - - - - - -Unassigned (Res for Emergencies & Shortfalls*)TOTAL OTHER USES 4,195,801 3,998,151 1,243,900 1,116,250 1,136,100 1,135,950 1,135,800 1,135,650 TOTAL ESTIMATED USES 526,221 4,198,301 4,315,489 1,246,400 1,136,250 1,136,100 1,135,950 1,135,800 DETAIL OF TRANSFERS OUT: Administrative Support - - - - - - -Fleet Lease Assessment Fee - - - - - - -Fleet Management Fund - - - - - - -Insurance Assessment - - - - - - -Vehicle Maintenance Fees - - - - - - -Field Services - - - - - - -Sales Tax (EPWA) - - - - - - -Arts in Public Places Fund - - - - - - -General Fund - - - - - - -Revenue Bond Funds (EPWA) - - - - - - -Transfers - EE Debt - - - - - - -Golf Course Fund - - - - - - -Arcadia Lake - - - - - - -Additional Transfers - - - - - - -Total Transfers Out: - - - - - - -Fund Budget Summary 6.11 Click Here for Main Directory Click Here for Sub-Directory
2000CAPITALIMPROVEMENTFUND
The 2000 Capital Improvements Tax Fund has been established to account for capital improvements as recommended to the City Council by the Capital Improvement Projects Advisory Board. The improvements are being financed by a permanent three-fourths cent sales tax approved by the voters December 12, 2000.
In addition, this fund accounts for payment of principal and interest due each year on the outstanding balance of sales tax revenue bonds. There arefive bond and three note issuances outstanding with a total principal amount remaining of $131,638,800 as of June 30, 2023.
It is anticipated as we implement the new 2017 Capital Improvement TaxFund, these funds will work together tomeet the capital needs of the community.

6.12 Click Here for Main Directory Click Here for Sub-Directory
2000 Capital Improvement Tax Fund FY 23-24 Prior Year Actual Adopted Year Budget Current Year Revised BUDGET YEAR Projected Budget Projected Budget Projected Budget Projected Budget FY 21-22FY 22-23FY 22-23 FY 23-24 FY 24-25FY 25-26FY 26-27FY 27-28 ESTIMATED RESOURCES: REVENUES: Taxes16,530,628 15,173,241 17,472,188 17,942,102 18,300,944 18,666,963 19,040,302 19,421,108 Inter-governmental- - - - - - -Licenses and Permits - - - - - - -Fines & Forfeitures - - - - - - -Charges for Services - - - - - - -Interest (82,619) 200,000 863,180 3,000,000 700,000 245,924 253,302260,901 Investment Income - - - - - - -Capital Lease Proceeds - - - - - - -Miscellaneous Revenue 10,000 - 16 - 2,526,052 2,328,156 1,328,156 1,328,156 Subtotal - Revenues 16,458,010 15,373,241 18,335,385 20,942,102 21,526,996 21,241,043 20,621,760 21,010,165 OTHER RESOURCES: Debt/Loan Proceeds 40,000,000 - 81,100,000 - - - -Restricted Prior Year Reserves (25,933,258) 29,854,534 29,854,534 102,631,254 11,209,307 7,894,670 7,828,508 8,782,095 Assigned Prior Year Reserves (Council Projects) - - - - - -Committed Prior Year Reserves - - - - - -Unrestricted Prior Year Reserves - - - - - -TOTAL ESTIMATED RESOURCES 30,524,752 45,227,775 129,289,919 123,573,356 32,736,303 29,135,713 28,450,268 29,792,260 ESTIMATED USES DIRECT COSTS BY FUNCTION: Personnel Services- - - - - - -Materials & Supplies - 200 - 200 200 200 200 200 Other Services & Charges 739,220 35,000 265,809 35,000 35,000 35,000 35,000 35,000 Capital Outlay: General Government 187,6768,306,297 161,311 6,425,000 300,000 300,000 300,000300,000 Streets & Highways 10,917,135 4,695,125 6,758,036 10,161,000 11,425,330 4,843,090 5,664,383 9,289,314 Parks & Recreation 13,498,835 1,000,000 5,529,464 500,000 - 1,500,000 -Downtown Development 24,320 - 1,062,495 44,000,000 - 1,500,000 -Economic Development 113,299 7,400,000 37,078 5,000,000 - - 500,000500,000 Public Safety - - - - - - -Community Development - - - 30,000,000 - - -Other Capital Outlay: - - - - - - -Debt Service: Principal Retirement 6,591,580 5,982,000 - 6,673,800 7,875,000 8,230,000 8,575,000 6,580,000 Interest 1,194,472 1,198,889 - 3,708,231 4,328,069 4,019,581 3,696,669 3,369,182 Interest on Construction Debt - - - - - - -New Debt Service - - - - - - -EE Debt Service (P&I) - - - - - - -Other Debt Service: - 350,0007,262,793 - - - -TOTAL ESTIMATED COSTS 33,266,538 28,967,511 21,076,984 106,503,231 23,963,599 20,427,871 18,771,252 20,073,696 TRANSFERS: Transfers In 40,532,567 - 484 - - - -Transfers Out (See detail below) (7,936,248) (4,955,448) (5,582,165) (5,860,818) (878,034) (879,334) (896,921) (914,859) NET TRANSFERS IN (OUT) 32,596,320 (4,955,448) (5,581,681) (5,860,818) (878,034) (879,334) (896,921) (914,859) OTHER USES: Reserve for Employee Obligations - - - - - - -Reserve for Council Special Projects - - - - - - -Restricted (Reserve for Capital Improvements) - - - - - - -Committed for Other PurposesRestricted (Reserve for Other Purposes) - - - - - -Restricted (Reserve for Specific Fund Purposes) 29,854,534 11,304,816 102,631,254 11,209,307 7,894,670 7,828,508 8,782,095 8,803,705 Unassigned (Res for Emergencies & Shortfalls*)TOTAL OTHER USES 29,854,534 11,304,816 102,631,254 11,209,307 7,894,670 7,828,508 8,782,095 8,803,705 TOTAL ESTIMATED USES 30,524,752 45,227,775 129,289,919 123,573,356 32,736,303 29,135,713 28,450,268 29,792,260 DETAIL OF TRANSFERS OUT: Administrative Support 329,083 645,448 645,448 860,818 878,034 879,334 896,921914,859 Fleet Lease Assessment Fee - - - - - - -Fleet Management Fund - - - - - - -Insurance Assessment - - - - - - -Vehicle Maintenance Fees - - - - - - -Field Services - - - - - - -Sales Tax (EPWA) - - - - - - -Arts in Public Places Fund - 230,000 - - - - -General Fund - - - - - - -Revenue Bond Funds (EPWA) (0) - 665,845 - - - -Edmond Electric Fund 4,080,000 4,080,0004,080,000 - - - -Golf Course Fund - - - - - - -Arcadia Lake - - - - - - -Capital Improvement Fund 1,605,000 - 171,012 5,000,000 - - -Water Fund 1,900,000 - - - - - -Additional Transfers 22,165 - 19,860 - - - -Total Transfers Out: 7,936,248 4,955,448 5,582,165 5,860,818 878,034 879,334 896,921914,859 Fund Budget Summary 6.13 Click Here for Main Directory Click Here for Sub-Directory
2017 CAPITAL IMPROVEMENT FUND
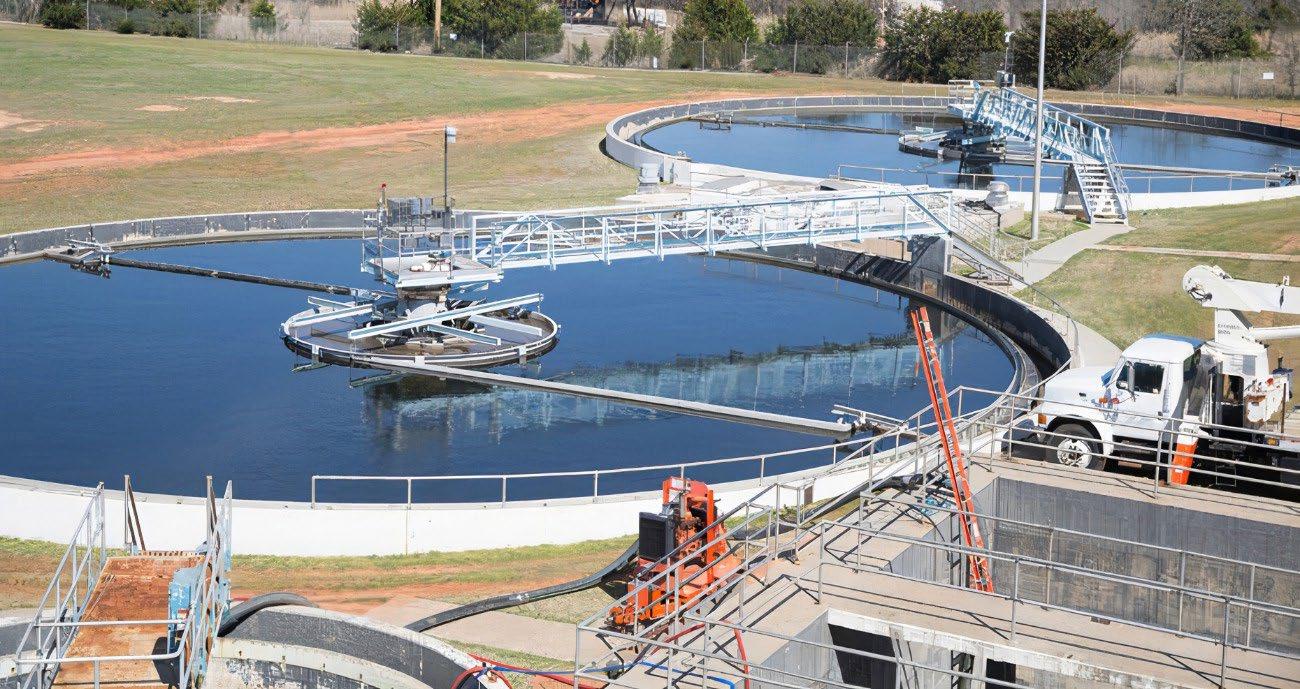
The 2017 Capital Improvements Tax was approved by the voters in April 2016 and the tax commenced April 1st, 2017 and will run for ten years, unless extended by the voters. This fund replaced the 2012 Public Safety Center - Capital Improvements Tax Fund which was established to account for the capital construction costs of a new Public Safety Center and other capital improvements.
Fund expenditure planning and project review are conducted by the Capital Improvement Project Advisory Board. Their recommendations are forwarded to the City Council for their approval.
6.14 Click Here for Main Directory Click Here for Sub-Directory
2017 Capital Improvement Tax Fund FY 23-24 Prior Year Actual Adopted Year Budget Current Year Revised BUDGET YEAR Projected Budget Projected Budget Projected Budget Projected Budget FY 21-22FY 22-23FY 22-23 FY 23-24 FY 24-25FY 25-26FY 26-27FY 27-28 ESTIMATED RESOURCES: REVENUES: Taxes11,020,418 10,115,493 11,625,115 11,961,401 12,200,629 12,444,642 9,899,016Inter-governmental - - - - - - -Licenses and Permits - - - - - - -Fines & Forfeitures - - - - - - -Charges for Services - - - - - - -Interest (471,317) 75,000192,184 140,918 145,145 149,500 115,489Investment Income - - - - - - -Capital Lease Proceeds - - - - - - -Miscellaneous Revenue - - - - - - -Subtotal - Revenues 10,549,101 10,190,493 11,817,300 12,102,319 12,345,774 12,594,142 10,014,505OTHER RESOURCES: Debt/Loan Proceeds - - - - - -Restricted Prior Year Reserves 22,448,661 22,512,756 22,512,756 6,984,461 350,530 2,298,678 4,494,909 2,357,644 Assigned Prior Year Reserves (Council Projects) - - - - - -Committed Prior Year Reserves - - - - - -Unrestricted Prior Year Reserves - - - - - -TOTAL ESTIMATED RESOURCES 32,997,763 32,703,249 34,330,056 19,086,780 12,696,304 14,892,820 14,509,414 2,357,644 ESTIMATED USES DIRECT COSTS BY FUNCTION: Personnel Services- - - - - - -Materials & Supplies - 2,500 - 2,500 2,500 2,500 2,500 2,500 Other Services & Charges 2,016 2,500 1,491 2,500 2,500 2,500 2,500 2,500 Capital Outlay: General Government 142,260 200,000 - 750,000 200,000 2,200,000 200,000Streets & Highways 7,747,557 150,000 3,319,806 500,000 1,000,000 1,000,000 8,500,000Parks & Recreation 1,214,884 22,845,700 16,703,834 17,150,000 8,500,000 2,000,000 -Downtown Development - - - 1,000,000 - - -Economic Development - - - - 500,000 - -Public Safety 3,849 250,000 11,658 700,000 - 5,000,000 3,250,000Community Development - 2,000,000 3,120,000 - - - -Debt Service: Principal Retirement - - - - - - -Interest - - - - - - -Interest on Construction Debt - - - - - - -New Debt Service - - - - - - -EE Debt Service (P&I) - - - - - - -Other Debt Service: - - - - - - -TOTAL ESTIMATED COSTS 9,110,566 25,450,700 23,156,789 20,105,000 10,205,000 10,205,000 11,955,000 5,000 TRANSFERS: Transfers In - - 44,082 4,000,000 - - -Transfers Out (See detail below) (1,374,441) (280,888) (4,232,888) (2,631,250) (192,626) (192,911) (196,770) (200,705) NET TRANSFERS IN (OUT) (1,374,441) (280,888) (4,188,806) 1,368,750 (192,626) (192,911) (196,770) (200,705) OTHER USES: Reserve for Employee Obligations - - - - - - -Reserve for Council Special Projects - - - - - - -Restricted (Reserve for Capital Improvements) 22,512,756 6,971,662 6,984,461 350,530 2,298,678 4,494,909 2,357,644 2,151,939 Committed for Other Purposes - - - - - - -Restricted (Reserve for Other Purposes) - - - - - -Restricted (Reserve for Specific Fund Purposes)Unassigned (Res for Emergencies & Shortfalls*)TOTAL OTHER USES 22,512,756 6,971,662 6,984,461 350,530 2,298,678 4,494,909 2,357,644 2,151,939 TOTAL ESTIMATED USES 32,997,763 32,703,249 34,330,056 19,086,780 12,696,304 14,892,820 14,509,414 2,357,644 DETAIL OF TRANSFERS OUT: Administrative Support 169,038 200,888 200,888 188,849 192,626 192,911 196,770 200,705 Fleet Lease Assessment Fee - - - - - - -Fleet Management Fund - - - - - - -Insurance Assessment - - - - - - -Vehicle Maintenance Fees - - - - - - -Field Services - - - - - - -Sales Tax (EPWA) - - - - - - -Arts in Public Places Fund - 80,000 32,000 - - - -General Fund - - - - - - -Revenue Bond Funds (EPWA) - - - - - - -Transfers - EE Debt - - - - - - -Golf Course Fund - - - - - - -Arcadia Lake - - - - - - -Fire PSLTF - - - 2,442,401 - - -Additional Transfers 1,205,402 - 4,000,000 - - - -Total Transfers Out: 1,374,441 280,888 4,232,888 2,631,250 192,626 192,911 196,770 200,705 Fund Budget Summary 6.15 Click Here for Main Directory Click Here for Sub-Directory
INTENTIONALLY
PAGE
LEFT BLANK
EPWA Utility Funds - Sub-Directory
Edmond Public Works Authority (EPWA) Fund 7.2-7.3 Summary Page 7.2 Budget Page 7.3 (EPWA) Revenue Bonds Fund 7.4-7.5 Summary Page 7.4 Budget Page 7.5 Edmond Electric 7.6-7.7 Summary Page 7.6 Budget Page 7.7 Water Resources Fund 7.8-7.9 Summary Page 7.8 Budget Page 7.9 Solid Waste Fund 7.10-7.11 Summary Page 7.10 Budget Page 7.11 Wastewater Resources Fund 7.12-7.13 Summary Page 7.12 Budget Page 7.13 EPWA Sewer Impact 7.14-7.15 Summary Page 7.14 Budget Page 7.15 Arcadia Lake Fund 7.16-7.17 Summary Page 7.16 Budget Page 7.17 Drainage Utility Fund 7.18-7.19 Summary Page 7.18 Budget Page 7.19 (EPWA) Economic Development 7.20-7.21 Summary Page 7.20 Budget Page 7.21
7.1
EDMOND PUBLIC WORKS AUTHORITY EPWA FUND


The EPWA Utility Funds are used to account for the cost of providing all utility services (electricity, water, wastewater, drainage, solid waste) to the citizens of Edmond funded with the revenue generated by the charges for services billed and collected through the utility billing process. The costs incurred include personnel, operations and maintenance of the utility services and capital outlay costs necessary to adequately develop and maintain a high level of service in for our customers. The fund also accounts for the operations of the Arcadia Lake recreational facilities. The operations and the Lake facilities are financed through user fees and General Fund and Park Tax Fund transfers.

7.2 Click Here for Main Directory Click Here for Sub-Directory
FUND BUDGET SUMMARY Public Works Authority Funds FY 23-24 Prior Year ActualAdopted Year Budget Current Year Revised BUDGET YEARProjected BudgetProjected BudgetProjected BudgetProjected Budget FY 21-22FY 22-23FY 22-23FY 23-24 FY 24-25FY 25-26FY 26-27FY 27-28 ESTIMATED RESOURCES: REVENUES: Taxes- - - - - - -Inter-governmental - - - - - - -Licenses & Permits 2,117,674 1,681,208 1,456,312 1,619,780 1,619,780 1,624,820 1,624,820 1,624,820 Fines & Forfeitures - - - - - - -Charges for Services 174,838,124 169,919,488 192,188,588 186,873,177 189,478,073 192,251,213 195,090,854 197,995,206 Interest (3,060,658) 610,000 3,579,516 1,302,563 1,201,146 1,208,891 1,179,298 1,141,677 Investment Income - - - - - - -Capital Lease Proceeds - - - - - - -Miscellaneous Revenue 3,036,829 397,533 264,348 336,935 348,152 361,049 375,412 379,933 Subtotal - Revenues 176,931,969 172,608,229 197,488,763 190,132,455 192,647,151 195,445,973 198,270,384 201,141,636 OTHER RESOURCES: Debt/Loan Proceeds - - 231,409,551 - - - -Restricted Prior Year Reserves 96,492,382 35,947,273 35,947,273 1,115,953 1,116,953 1,117,953 1,118,953 1,119,953 Assigned Prior Year Reserves (Council Pr - - - - - - -Committed Prior Year Reserves - - - - - - -Unrestricted Prior Year Reserves 149,740,254 138,062,485 138,062,485 164,492,191 145,034,313 139,386,976 129,586,540 120,542,144 TOTAL ESTIMATED RESOURCES 423,164,605 346,617,986 602,908,071 355,740,599 338,798,417 335,950,902 328,975,877 322,803,733 ESTIMATED USES DIRECT COSTS BY FUNCTION: Electric Utility 103,384,345 94,979,442 109,161,583 97,085,154 94,898,430 94,605,281 93,136,649 92,836,572 Water Utility 50,596,608 46,181,598 254,535,641 38,781,008 37,519,078 43,360,558 46,556,435 51,632,793 Solid Waste Utility 6,714,109 7,668,306 7,454,252 8,137,360 8,433,424 8,735,016 9,049,784 9,377,702 Wastewater Utility 30,277,541 23,257,242 37,065,068 25,020,064 24,819,591 25,614,631 25,770,622 25,812,190 Arcadia 1,181,946 1,509,693 1,344,502 1,622,919 1,640,421 1,663,076 1,692,410 1,696,598 Drainage 995,863 3,204,259 1,583,572 13,281,126 4,551,708 4,200,450 3,274,707 2,126,380 PWA Sewer Impact - - - - - - -PWA Economic Development 323,083 390,000 4,076,919 390,000 390,000 390,000 390,000 390,000 Revenue Bond Funds payment 53,295 2,282,565 8,027,615 - - - -TOTAL ESTIMATED COSTS 193,526,790 179,473,105 423,249,151 184,317,631 172,252,652 178,569,012 179,870,607 183,872,235 TRANSFERS: Transfers In 26,632,150 21,905,806 31,375,408 16,866,706 16,176,240 16,491,964 16,491,964 16,491,964 Transfers Out (See detail below) (56,674,434) (45,967,190) (45,426,184) (42,138,408) (42,217,076) (43,168,361) (43,935,137) (44,829,784) NET TRANSFERS IN (OUT) (30,042,284) (24,061,384) (14,050,776) (25,271,702) (26,040,836) (26,676,397) (27,443,173) (28,337,820) OTHER USES: Reserve for Employee Obligations** - - - - - - -Reserve for Council Special Projects - - - - - - -Reserve for Capital Improvements - - - - - - -Committed for Other Purposes 914,506 - - - - - -Reserve for Other Restricted Purposes 35,032,767 7,452,601 1,115,953 1,116,953 1,117,953 1,118,953 1,119,953 1,120,953 Restricted (Reserve for Special Fund Purp - - - - - - -Unassigned (Res for Emergencies & Shor 138,062,485 135,630,897 164,492,191 145,034,313 139,386,976 129,586,540 120,542,144 109,472,725 TOTAL OTHER USES 174,009,757 143,083,497 165,608,144 146,151,266 140,504,929 130,705,493 121,662,097 110,593,679 TOTAL ESTIMATED USES 397,578,832 346,617,986 602,908,071 355,740,599 338,798,417 335,950,902 328,975,877 322,803,733 *LEVEL OF EMERGENCY RESERVES: Percentage of Total Revenue 78% 79% 83% 76% 72% 66% 61% 54% Number of Days of Revenue 285 287 304 278 264 242 222 199 Percentage of Total Expenses 55% 60% 35% 64% 65% 58% 54% 48% Number of Days of Expenses 201 220 128 234 237 213 197 175 DETAIL OF TRANSFERS OUT: Administrative Support 8,885,149 8,868,990 8,868,990 9,791,705 9,974,905 9,989,671 10,189,465 10,393,253 Fleet Lease Assessment Fee 1,207,415 1,280,049 1,280,049 1,322,402 1,387,112 1,455,057 1,526,399 1,601,307 Fleet Management Fund 480,000 2,060,000 - 725,000 46,000 300,000 600,000 955,000 Insurance Assessment 317,634 461,186 461,186 503,651 528,833 555,275 583,040 612,189 Vehicle Maintenance Fees 1,298,578 1,420,089 1,551,419 1,513,681 1,566,999 1,622,637 1,680,701 1,741,297 Field Services 7,236,892 7,999,357 7,999,357 8,272,482 8,385,552 8,590,355 8,688,913 8,860,118 General Fund-Sales Tax 14,875,727 15,173,241 14,875,727 15,476,706 15,786,240 16,101,964 16,101,964 16,101,964 Arts in Public Places Fund - - - - - - -General Fund 9,010,622 6,424,294 6,824,294 4,432,780 4,441,435 4,453,402 4,464,656 4,464,656 Revenue Bond Funds (EPWA) - exp to ea 8,361,903 2,179,984 3,421,079 - - - -Edmond Economic Development Fund (EE - - - - - - -Edmond Electric Economic Development F 100,000 100,000 100,000 100,000 100,000 100,000 100,000 100,000 2000 CIP Electric LoanAdditional Transfers 4,900,514 - 44,082 - - - -Total Transfers Out: 56,674,434 45,967,190 45,426,184 42,138,408 42,217,076 43,168,361 43,935,137 44,829,784 7.3 Click Here for Main Directory Click Here for Sub-Directory
EPWA REVENUE BONDS FUND
The EPWA Revenue Bond Funds are utilized to account for the construction costs and improvement costs related to utility system capital improvements funded by the sale of Public Works Authority revenue bonds. In addition, the Bond Funds account for payment of principal and interest due each year on the outstanding balance of revenue bonds.

7.4 Click Here for Main Directory Click Here for Sub-Directory
BUDGET SUMMARY Revenue Bonds Fund FY 23-24 Prior Year Actual Adopted Year Budget Current Year Revised BUDGET YEAR Projected Budget Projected Budget Projected Budget Projected Budget FY 21-22FY 22-23FY 22-23 FY 23-24 FY 24-25FY 25-26FY 26-27FY 27-28 ESTIMATED RESOURCES: REVENUES: Taxes- - - - - - -Inter-governmental - - - - - - -Licenses and Permits - - - - - - -Fines & Forfeitures - - - - - - -Charges for Services - - - - - - -Interest (5,584) 20,000 12,800 - - - -Investment Income - - - - - - -Capital Lease Proceeds - - - - - - -Miscellaneous Revenue - - - - - - -Subtotal - Revenues (5,584) 20,000 12,800 - - - -OTHER RESOURCES: Debt/Loan Proceeds - - - - - -Restricted Prior Year Reserves 2,156,460 7,407,788 7,407,788 (0) (0) (0) (0) (0) Assigned Prior Year Reserves (Council Projects) - - - - - -Committed Prior Year Reserves - - - - - -Unrestricted Prior Year Reserves - - - - - - -TOTAL ESTIMATED RESOURCES 2,150,876 7,427,788 7,420,588 (0) (0) (0) (0) (0) ESTIMATED USES DIRECT COSTS BY FUNCTION: Personnel Services- - - - - - -Materials & Supplies - - - - - - -Other Services & Charges 3,149 50,000 - - - - -Capital Outlay - - - - - - -Debt Service: Principal Retirement - 1,883,917 7,866,015 - - - -Arbitrage - 250,000 - - - - -Bond Interest Expense 50,146 98,648 161,600 - - - -Trustee Fees - - - - - - -Debt Reserves - - - - - - -TOTAL ESTIMATED COSTS 53,295 2,282,565 8,027,615 - - - -TRANSFERS: Transfers In 5,310,207 2,262,565 607,026 - - - -Transfers Out (See detail below) - - - - - - -NET TRANSFERS IN (OUT) 5,310,207 2,262,565 607,026 - - - -OTHER USES: Reserve for Employee Obligations - - - - - - -Reserve for Council Special Projects - - - - - - -Reserve for Capital Improvements - - - - - - -Committed for Other PurposesReserve for Other Restricted Purposes 7,407,788 7,407,788 (0) (0) (0) (0) (0) (0) Restricted (Reserve for Special Fund Purposes) - - - - - - -Unassigned (Res for Emergencies & Shortfalls*)TOTAL OTHER USES 7,407,788 7,407,788 (0) (0) (0) (0) (0) (0) TOTAL ESTIMATED USES 2,150,876 7,427,788 7,420,588 (0) (0) (0) (0) (0) DETAIL OF TRANSFERS OUT: Administrative Support - - - - - - -Fleet Lease Assessment Fee - - - - - - -Fleet Management Fund - - - - - - -Insurance Assessment - - - - - - -Vehicle Maintenance Fees - - - - - - -Field Services - - - - - - -Sales Tax (EPWA) - - - - - - -Arts in Public Places Fund - - - - - - -General Fund - - - - - - -Revenue Bond Funds (EPWA) - - - - - - -Edmond Economic Development Fund (EEDA) - - - - - - -Edmond Electric Economic Development Fund - - - - - - -Additional Transfers - - - - - - -Total Transfers Out: - - - - - - -7.5 Click Here for Main Directory Click Here for Sub-Directory
FUND
EDMOND Electric

Edmond Electric's mission is to provide high quality electric service at a competitive price responding to our customers' needs with trustworthy service. Edmond Electric is Oklahoma's largest community owned electric utility. As a publicly owned power company and a city department, Edmond Electric returns funds to the community annually. Our revenues support vital city services such as police, fire, streets and parks. Because of Edmond Electric's support, our community maintains a high quality of living yet has one of the lowest sales tax rates in the state for a city our size. Edmond Electric provides fast, reliable service and a reliability rating of over 99%
DID YOU KNOW?
Edmond Electric is the largest municipally owned electric utility in Oklahoma.
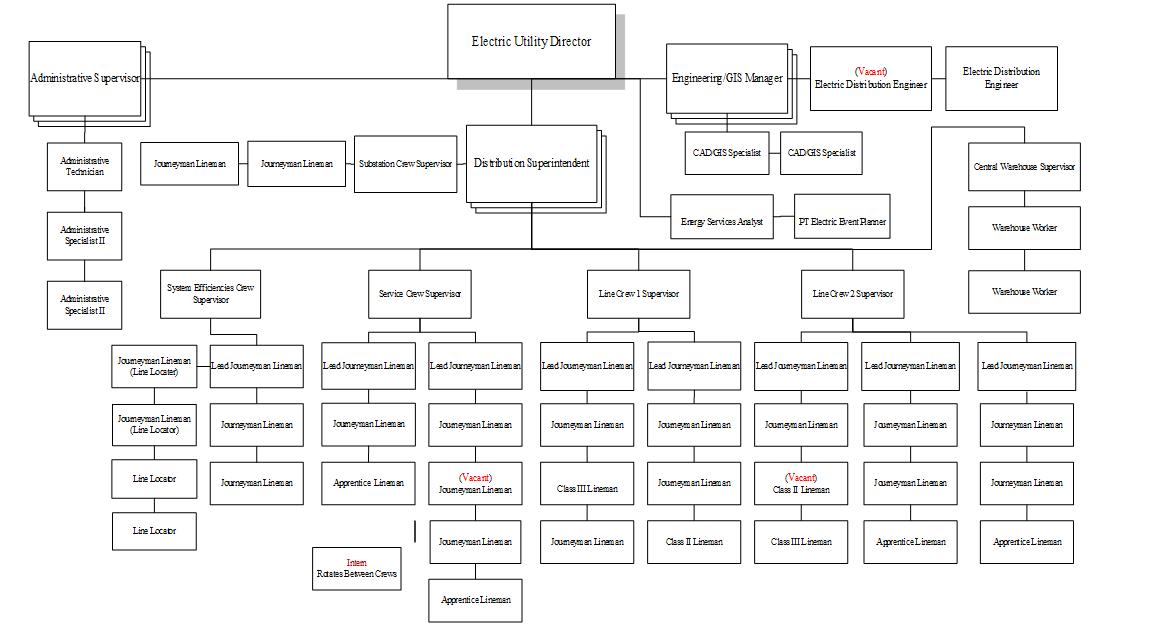

Edmond Electric staff volunteered over 500 hours in the community.
Lineman wear 45 lbs. of gear when climbing electric utility poles.

Staffing CURRENT YEAR YEAR 2024 YEAR 2025 YEAR 2026 YEAR 2027 YEAR 2028 54-1-0 54-1-0 54-1-0 54-1-0 54-1-0 54-1-0 Contact Us Glenn Fisher- Director: (405) 359-4772 https://www.edmondok.com/224/ Edmond-Electric
Organization Chart
7.6 Click Here for Main Directory Click Here for Sub-Directory
Electric Fund FY 23-24 Prior Year Actual Adopted Year Budget Current Year Revised BUDGET YEARProjected BudgetProjected BudgetProjected BudgetProjected Budget FY 21-22FY 22-23FY 22-23 FY 23-24 FY 24-25FY 25-26FY 26-27FY 27-28 ESTIMATED RESOURCES: REVENUES: Taxes- - - - - - -Inter-governmental - - - - - - -Licenses and Permits - - - - - - -Fines & Forfeitures - - - - - - -Charges for Services 98,349,157 93,485,263 109,567,986 106,518,365 107,048,027 107,580,326 108,113,282 108,644,122 Interest (592,674) 200,000 361,166 200,000 200,000 200,000 200,000 200,000 Investment Income - - - - - - -Capital Lease Proceeds - - - - - - -Miscellaneous Revenue 89,025 227,001 117,652 162,407 172,407 182,407 192,407 192,407 Subtotal - Revenues 97,845,509 93,912,264 110,046,804 106,880,772 107,420,434 107,962,733 108,505,689 109,036,529 OTHER RESOURCES: Debt/Loan Proceeds - - - - - -Restricted Prior Year Reserves 68,643,864 77,100 77,100 - - - -Assigned Prior Year Reserves (Council Projects) - - - - - -Committed Prior Year Reserves - - - - - -Unrestricted Prior Year Reserves 52,350,534 52,350,534 47,099,946 46,803,480 48,330,630 50,391,644 54,041,697 TOTAL ESTIMATED RESOURCES 166,489,373 146,339,898 162,474,438 153,980,718 154,223,914 156,293,363 158,897,333 163,078,226 ESTIMATED USES DIRECT COSTS BY FUNCTION: Personnel Services5,563,468 7,243,101 6,987,865 7,784,003 7,945,821 8,163,527 8,264,293 8,325,742 Materials & Supplies1,830,068 1,186,300 1,840,824 1,262,624 1,252,088 1,346,423 1,305,510 1,283,755 Wholesale Electric Purchases73,452,980 62,685,772 79,587,948 72,507,861 71,495,201 70,651,950 69,287,312 69,063,758 Other Services & Charges6,247,914 10,842,871 10,039,244 9,533,166 9,609,820 9,692,881 9,834,034 9,887,567 Capital Outlay 16,294,454 13,021,398 10,705,702 5,997,500 4,595,500 4,750,500 4,445,500 4,275,750 Debt Service(4,538) - - - - - -TOTAL ESTIMATED COSTS 103,384,345 94,979,442 109,161,583 97,085,154 94,898,430 94,605,281 93,136,649 92,836,572 TRANSFERS: Transfers In 4,080,000 4,080,000 4,080,000 1,000,000 - - -Transfers Out (See detail below) (14,757,394) (12,116,301) (10,292,908) (11,092,084) (10,994,854) (11,296,438) (11,718,987) (12,212,413) NET TRANSFERS IN (OUT) (10,677,394) (8,036,301) (6,212,908) (10,092,084) (10,994,854) (11,296,438) (11,718,987) (12,212,413) OTHER USES: Reserve for Employee Obligations** - - - - - - -Reserve for Council Special Projects - - - - - - -Reserve for Capital ImprovementsCommitted for Other PurposesReserve for Other Restricted Purposes 77,100 - - - - - -Restricted (Reserve for Special Fund Purposes)Unassigned (Res for Emergencies & Shortfalls*) 52,350,534 43,324,155 47,099,946 46,803,480 48,330,630 50,391,644 54,041,697 58,029,241 TOTAL OTHER USES 52,427,634 43,324,155 47,099,946 46,803,480 48,330,630 50,391,644 54,041,697 58,029,241 TOTAL ESTIMATED USES 166,489,373 146,339,898 162,474,438 153,980,718 154,223,914 156,293,363 158,897,333 163,078,226 * LEVEL OF EMERGENCY RESERVES: Percentage of Total Revenue 54% 46% 43% 44% 45% 47% 50% 53% Number of Days of Revenue 195 168 156 160 164 170 182 194 Percentage of Total Expenses 46% 42% 41% 43% 46% 48% 52% 55% Number of Days of Expenses 168 154 149 158 167 174 188 202 DETAIL OF TRANSFERS OUT: Administrative Support 4,961,526 4,859,978 4,859,978 5,414,342 5,509,993 5,518,150 5,628,513 5,741,083 Fleet Lease Assessment Fee - 16,000 16,000 16,000 16,000 16,000 16,000 16,000 Fleet Management Fund 480,000 1,855,000 - 240,000 46,000 300,000 600,000 955,000 Insurance Assessment 52,538 74,276 74,276 77,785 81,674 85,758 90,046 94,548 Vehicle Maintenance Fees 215,613 185,000 222,000 225,000 225,000 225,000 225,000 225,000 Field Services 897,940 988,262 988,262 1,018,957 1,016,187 1,051,530 1,059,428 1,080,782 Sales Tax (EPWA) - - - - - - -Arts in Public Places Fund - - - - - - -General Fund 4,000,000 4,000,000 4,000,000 4,000,000 4,000,000 4,000,000 4,000,000 4,000,000 Revenue Bond Funds (EPWA) 199,263 37,785 32,392 - - - -Edmond Electric Economic Development Fund 100,000 100,000 100,000 100,000 100,000 100,000 100,000 100,000 2000 CIP Loan - - - - - - -Additional Transfers 3,850,514 - - - - - -Total Transfers Out: 14,757,394 12,116,301 10,292,908 11,092,084 10,994,854 11,296,438 11,718,987 12,212,413 7.7 Click Here for Main Directory Click Here for Sub-Directory
Water Resources
Water Resources has three (3) divisions:
1. Water Production: Comprised of the Edmond Water Treatment Plant, water towers, storage tanks, and water pumping stations.
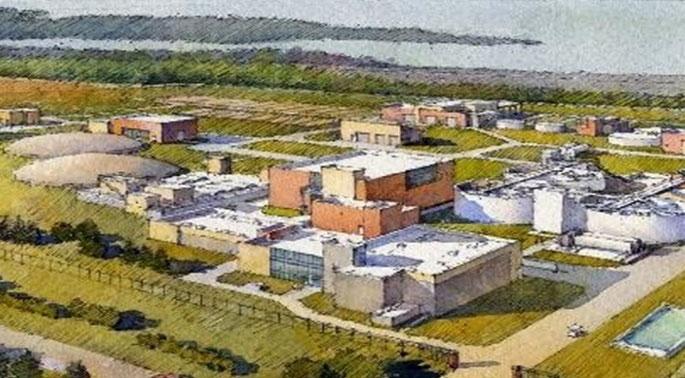
2. Water Wells: Charged with operation and maintenance of the City’s 50 water wells.
3. Wastewater Treatment: Consisting of the Coffee Creek Wastewater Treatment Plant and 7 lift stations.
Organization Chart Staffing
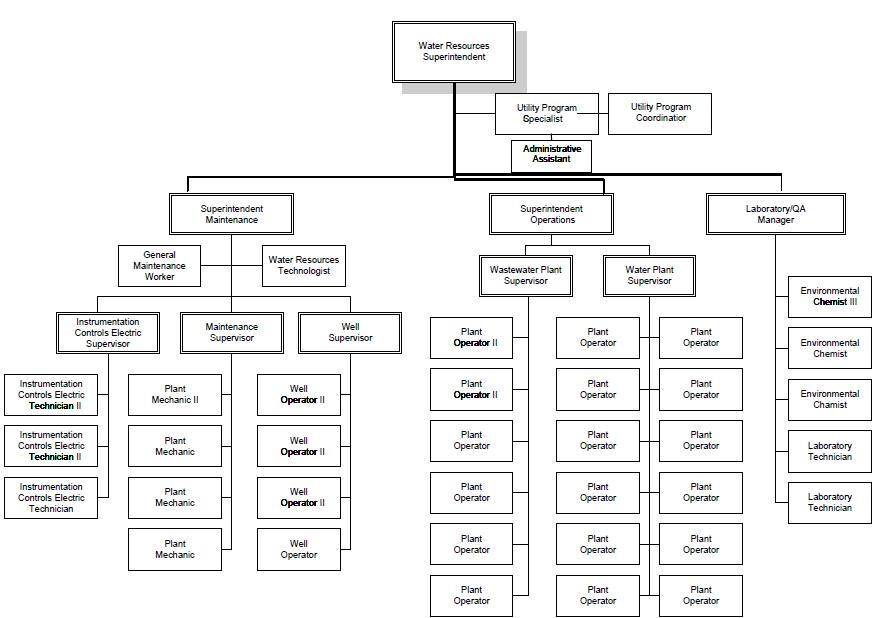
Contact Us
Director of Water Resources: (405) 216-7696


Water Treatment Plant: (405) 216-7690
Coffee Creek Water Resource Recovery Facility: (405) 216-7675
Website: www.edmondwater.com
CURRENT YEAR YEAR 2024 YEAR 2025 YEAR 2026 YEAR 2027 YEAR 2028 48-0-0 48-0-0 48-0-0 48-0-0 48-0-0 48-0-0
7.8 Click Here for Main Directory Click Here for Sub-Directory
FUND BUDGET SUMMARY Water Fund FY 23-24 Prior Year Actual Adopted Year Budget Current Year Revised BUDGET YEARProjected BudgetProjected BudgetProjected BudgetProjected Budget FY 21-22FY 22-23FY 22-23 FY 23-24 FY 24-25FY 25-26FY 26-27FY 27-28 ESTIMATED RESOURCES: REVENUES: Taxes- - - - - - -Inter-governmental - - - - - - -License & Permits: Water Tap Fees 322,053 310,000 76,912 281,948 281,948 288,094 288,094 288,094 Capacity Fees 982,622 800,000 776,570 767,204 767,204 766,098 766,098 766,098 Fines & Forfeitures - - - - - - -Charges for Services 37,742,702 37,264,692 42,197,698 39,158,675 40,526,086 41,942,837 43,407,642 44,923,715 Interest (1,383,299) 150,000 2,156,433 760,317 685,143 705,736 687,686 668,853 Investment Income - - - - - - -Capital Lease Proceeds - - - - - - -Miscellaneous Revenue 1,702,694 123,063 97,384 125,966 125,966 127,869 131,217 134,665 Subtotal - Revenues 39,366,772 38,647,755 45,304,997 41,094,110 42,386,347 43,830,634 45,280,737 46,781,425 OTHER RESOURCES: Debt/Loan Proceeds - - 215,110,830 - - - -Restricted Prior Year Reserves 7,305,382 7,305,382 - - - -Assigned Prior Year Reserves (Council Projects) - - - - - -Committed Prior Year Reserves - - - - - -Unrestricted Prior Year Reserves 92,637,699 58,822,276 58,822,276 70,317,138 65,863,824 64,040,814 57,721,492 49,540,380 TOTAL ESTIMATED RESOURCES 132,004,471 104,775,413 326,543,484 111,411,248 108,250,171 107,871,448 103,002,229 96,321,805 ESTIMATED USES DIRECT COSTS BY FUNCTION: Personnel Services2,697,672 3,158,674 2,985,376 3,307,594 3,438,366 3,550,891 3,652,8723,754,351 Materials & Supplies 882,089 1,291,463 1,362,130 1,420,972 1,456,836 1,504,399 1,548,6531,604,792 Other Services & Charges 5,490,804 4,805,737 4,866,435 5,509,603 5,709,973 5,840,894 6,107,0986,267,591 Capital Outlay 40,230,332 26,485,000 235,130,976 13,712,083 7,080,000 7,280,000 7,280,0007,280,000 Debt Service 1,295,711 10,440,724 10,190,724 14,830,756 19,833,903 25,184,374 27,967,812 32,726,059 Debt Issuance Costs - - - - - - -Debt Reserves - - - - - - -TOTAL ESTIMATED COSTS 50,596,608 46,181,598 254,535,641 38,781,008 37,519,078 43,360,558 46,556,435 51,632,793 TRANSFERS: Sales Tax In 14,875,727 15,173,241 14,875,727 15,476,706 15,786,240 16,101,964 16,101,964 16,101,964 Additional Transfers In 1,634,000 - 6,679,083 - - - -Transfers Out (See detail below) (31,789,932) (23,323,542) (23,245,516) (22,243,121) (22,476,519) (22,891,362) (23,007,377) (23,146,520) NET TRANSFERS IN (OUT) (15,280,205) (8,150,301) (1,690,706) (6,766,415) (6,690,279) (6,789,398) (6,905,413) (7,044,556) OTHER USES: Reserve for Employee Obligations** - - - - - - -Reserve for Council Special Projects - - - - - - -Reserve for Capital Improvements - - - - -Committed for Other PurposesReserve for Other Restricted Purposes 7,305,382 - - - -Restricted (Reserve for Special Fund Purposes) - - - - - - -Unassigned (Res for Emergencies & Shortfalls*) 58,822,276 50,443,514 70,317,138 65,863,824 64,040,814 57,721,492 49,540,380 37,644,456 TOTAL OTHER USES 66,127,658 50,443,514 70,317,138 65,863,824 64,040,814 57,721,492 49,540,380 37,644,456 TOTAL ESTIMATED USES 132,004,471 104,775,413 326,543,484 111,411,248 108,250,171 107,871,448 103,002,229 96,321,805 *LEVEL OF EMERGENCY RESERVES: Percentage of Total Revenue 149%131%155% 160% 151%132%109%80% Number of Days of Revenue 545 476 567 585 551 481 399 294 Percentage of Total Expenses 73%74%25% 112% 110%90%73%52% Number of Days of Expenses 266 272 93 407 403 328 268 189 DETAIL OF TRANSFERS OUT: Administrative Support 1,795,453 1,778,779 1,778,779 1,967,227 2,006,572 2,009,542 2,049,7332,090,727 Fleet Lease Assessment Fee 96,407 100,153 100,153 102,640 107,619 112,848 118,337 124,101 Fleet Management Fund - - - 180,000 - - -Insurance Assessment 89,425 106,620 106,620 121,249 127,312 133,678 140,362 147,379 Vehicle Maintenance Fees 24,849 66,800 80,160 68,467 70,185 71,953 73,775 75,652 Field Services 3,751,848 4,217,529 4,217,529 4,326,832 4,378,591 4,461,377 4,523,2064,606,697 Sales Tax (EPWA) 14,875,727 15,173,241 14,875,727 15,476,706 15,786,240 16,101,964 16,101,964 16,101,964 Arts in Public Places Fund - - - - - - -General Fund 3,998,325 - - - - - -Revenue Bond Funds (EPWA) 7,157,900 1,880,420 2,086,548 - - - -Edmond Economic Development Fund (EEDA) - - - - - - -Edmond Electric Economic Development Fund - - - - - - -Additional Transfers - - - - - - -Total Transfers Out: 31,789,932 23,323,542 23,245,516 22,243,121 22,476,519 22,891,362 23,007,377 23,146,520 7.9 Click Here for Main Directory Click Here for Sub-Directory
EDMOND Solid Waste


The Solid Waste Utility’s vision is to continuously improve solid waste services for the benefit of delivering “Trustworthy Service” to citizens Solid Waste department delivers safe, high quality, cost effective trustworthy solid waste collection service to our customers. Department focuses on streamlined solid waste route management and promotes safe vehicle operations with employee safety incentive programs. The department is accelerating use of new technologies to continuously improve delivery and lower cost of service to our customers.
Organization Chart
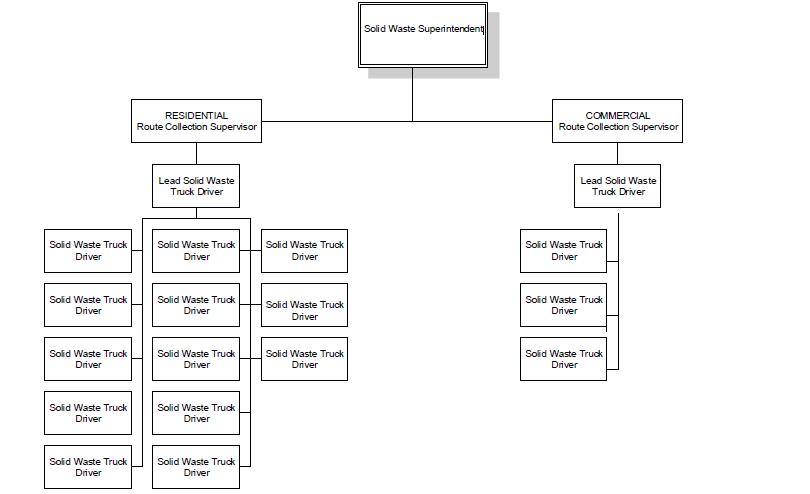

Staffing CURRENT YEAR YEAR 2024 YEAR 2025 YEAR 2026 YEAR 2027 YEAR 2028 20-0-0 20-0-0 20-0-0 20-0-0 20-0-0 20-0-0 Contact Us Jeff Pitman: (405) 216-7743 Jefferey.pittman@edmondok.gov
7.10 Click Here for Main Directory Click Here for Sub-Directory
FUND BUDGET SUMMARY Solid Waste Fund FY 23-24 Prior Year Actual Adopted Year Budget Current Year Revised BUDGET YEAR Projected Budget Projected Budget Projected Budget Projected Budget FY 21-22FY 22-23FY 22-23 FY 23-24 FY 24-25FY 25-26FY 26-27FY 27-28 ESTIMATED RESOURCES: REVENUES: Inter-governmental- - - - - - -Licenses and Permits - - - - - - -Fines & Forfeitures - - - - - - -Charges for Services 11,039,469 11,165,618 11,107,377 11,879,132 12,103,915 12,339,306 12,574,712 12,814,826 Interest (279,108) 68,000 99,780 68,000 68,000 68,000 68,000 68,000 Investment Income - - - - - - -Capital Lease Proceeds - - - - - - -Miscellaneous Revenue 615 - - - - - -Subtotal - Revenues 10,760,976 11,233,618 11,207,157 11,947,132 12,171,915 12,407,306 12,642,712 12,882,826 OTHER RESOURCES: Debt/Loan Proceeds - - - - - -Restricted Prior Year Reserves - - - - - -Assigned Prior Year Reserves (Council Projects) - - - - - -Committed Prior Year Reserves - - - - - -Unrestricted Prior Year Reserves 12,628,411 12,919,946 12,919,946 10,696,133 10,880,215 10,859,116 10,642,152 10,197,797 TOTAL ESTIMATED RESOURCES 23,389,387 24,153,564 24,127,103 22,643,265 23,052,130 23,266,422 23,284,864 23,080,623 ESTIMATED USES DIRECT COSTS BY FUNCTION: Personnel Services1,526,470 2,092,776 1,708,163 2,173,017 2,242,013 2,306,613 2,373,999 2,443,660 Materials & Supplies565,227 638,385 760,713 782,497 807,795 833,996 861,133 889,242 Other Services & Charges 4,623,648 4,932,418 4,980,951 5,177,000 5,378,649 5,589,317 5,809,434 6,039,451 Capital Outlay - 4,728 4,425 4,846 4,967 5,091 5,218 5,349 Debt Service (1,235) - - - - - -TOTAL ESTIMATED COSTS 6,714,109 7,668,306 7,454,252 8,137,360 8,433,424 8,735,016 9,049,784 9,377,702 TRANSFERS: Transfers In - - - - - - -Transfers Out (See detail below) (3,755,332) (5,494,721) (5,976,718) (3,625,691) (3,759,590) (3,889,254) (4,037,283) (4,180,791) NET TRANSFERS IN (OUT) (3,755,332) (5,494,721) (5,976,718) (3,625,691) (3,759,590) (3,889,254) (4,037,283) (4,180,791) OTHER USES: Reserve for Employee Obligations** - - - - - - -Reserve for Council Special Projects - - - - - - -Reserve for Capital Improvements - - - - -Committed for Other PurposesReserve for Other Restricted Purposes - - - - - - -Restricted (Reserve for Special Fund Purposes) - - - - - - -Unassigned (Res for Emergencies & Shortfalls*) 12,919,946 10,990,537 10,696,133 10,880,215 10,859,116 10,642,152 10,197,797 9,522,131 TOTAL OTHER USES 12,919,946 10,990,537 10,696,133 10,880,215 10,859,116 10,642,152 10,197,797 9,522,131 TOTAL ESTIMATED USES 23,389,387 24,153,564 24,127,103 22,643,265 23,052,130 23,266,422 23,284,864 23,080,623 *LEVEL OF EMERGENCY RESERVES: Percentage of Total Revenue 120% 98% 95% 91% 89% 86% 81% 74% Number of Days of Revenue 438 357 348 332 326 313 294 270 Percentage of Total Expenses 123% 83% 80% 92% 89% 84% 78% 70% Number of Days of Expenses 450 305 291 338 325 308 284 256 DETAIL OF TRANSFERS OUT: Administrative Support 762,524 778,489 778,489 798,921 814,899 816,105 832,428 849,076 Fleet Lease Assessment Fee 993,736 1,042,046 1,042,046 1,074,759 1,128,192 1,184,295 1,243,206 1,305,061 Fleet Management Fund - - - - - - -Insurance Assessment 113,086 107,409 107,409 129,249 135,711 142,497 149,622 157,102 Vehicle Maintenance Fees 1,028,902 1,085,395 1,149,786 1,135,320 1,184,840 1,236,547 1,290,539 1,346,918 Field Services 48,169 53,015 53,015 54,661 54,513 56,409 56,832 57,978 Sales Tax (EPWA) - - - - - - -Arts in Public Places Fund - - - - - - -General Fund 383,979 2,424,294 2,824,294 432,780 441,435 453,402 464,656 464,656 Revenue Bond Funds (EPWA) 74,936 4,073 21,678 - - - -Edmond Economic Development Fund (EEDA) - - - - - - -Edmond Electric Economic Development Fund - - - - - - -Additional Transfers 350,000 - - - - - -Total Transfers Out: 3,755,332 5,494,721 5,976,718 3,625,691 3,759,590 3,889,254 4,037,283 4,180,791 7.11 Click Here for Main Directory Click Here for Sub-Directory
Water Resources

Wastewater


Water Resources has three (3) divisions:
1.Water Production: Comprised of the Edmond Water Treatment Plant, water towers, storage tanks, and water pumping stations.
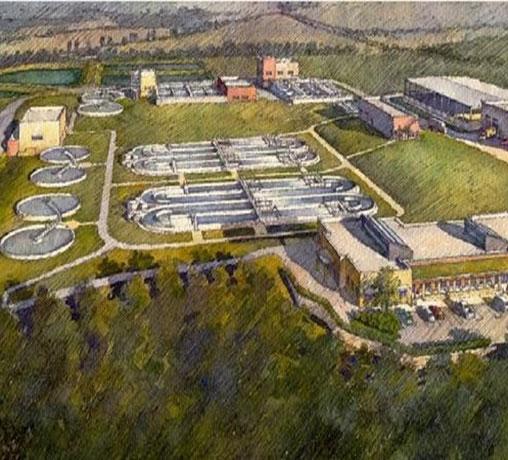
2.Water Wells: Charged with operation and maintenance of the City’s 50 water wells.
3.Wastewater Treatment: Consisting of the Coffee Creek Wastewater Treatment Plant and 7 lift stations.
Staffing CURRENT YEAR YEAR 2024 YEAR 2025 YEAR 2026 YEAR 2027 YEAR 2028 48-0-0 48-0-0 48-0-0 48-0-0 48-0-0 48-0-0 Contact Us Director of Water Resources: (405) 216-7696 Water Treatment Plant: (405) 216-7690 Coffee Creek Water Resource Recovery Facility: (405)216-7675 Website: www.edmondwater.com
Organization Chart
7.12 Click Here for Main Directory Click Here for Sub-Directory
FUND BUDGET SUMMARY Wastewater Fund FY 23-24 Prior Year Actual Adopted Year Budget Current Year Revised BUDGET YEAR Projected Budget Projected Budget Projected Budget Projected Budget FY 21-22FY 22-23FY 22-23 FY 23-24 FY 24-25FY 25-26FY 26-27FY 27-28 ESTIMATED RESOURCES: REVENUES: Inter-governmental- - - - - - -Licenses and Permits:Wastewater Tap Fees 70 1,080 84 500 500 500 500 500 Capacity Fees 782,791 570,128 584,975 570,128 570,128 570,128 570,128 570,128 Fines & Forfeitures - - - - - - -Charges for Services 24,451,345 24,760,245 26,076,484 25,725,066 26,238,267 26,761,732 27,295,667 27,840,280 Interest (512,032) 120,000 827,284 222,246 196,003 183,155 171,612 152,824 Investment Income - - - - - - -Capital Lease Proceeds - - - - - - -Miscellaneous Revenue 1,198,424 - 1,096 - - - -Subtotal - Revenues 25,920,598 25,451,453 27,489,923 26,517,940 27,004,898 27,515,515 28,037,907 28,563,732 OTHER RESOURCES: Debt/Loan Proceeds - - 16,298,721 - - - -Restricted Prior Year Reserves 20,198,684 20,198,684 - - - -Assigned Prior Year Reserves (Council Projects) - - - - - -Committed Prior Year Reserves - - - - - -Unrestricted Prior Year Reserves 31,516,782 2,873,561 2,873,561 24,531,162 21,635,526 19,600,328 17,181,391 15,066,108 TOTAL ESTIMATED RESOURCES 57,437,380 48,523,698 66,860,889 51,049,102 48,640,424 47,115,843 45,219,298 43,629,840 ESTIMATED USES DIRECT COSTS BY FUNCTION: Personnel Services1,261,658 1,339,302 1,287,816 1,396,671 1,445,878 1,498,814 1,558,759 1,590,598 Materials & Supplies357,596 478,436 451,906 525,568 534,635 554,602 570,427 587,294 Other Services & Charges 2,128,425 2,594,569 2,631,723 3,358,088 3,018,288 2,731,490 2,816,671 2,818,893 Capital Outlay 19,069,332 5,640,000 19,788,688 5,980,000 4,800,000 5,800,000 5,800,000 5,800,000 Debt Service 7,460,530 13,204,935 12,904,935 13,759,737 15,020,790 15,029,725 15,024,765 15,015,405 Debt Issuance Costs - - - - - - -Debt Reserves - - - - - - -TOTAL ESTIMATED COSTS 30,277,541 23,257,242 37,065,068 25,020,064 24,819,591 25,614,631 25,770,622 25,812,190 TRANSFERS: Transfers In 266,000 - - - - - -Transfers Out (See detail below) (4,353,593) (4,099,758) (5,264,659) (4,393,512) (4,220,505) (4,319,821) (4,382,568) (4,483,055) NET TRANSFERS IN (OUT) (4,087,593) (4,099,758) (5,264,659) (4,393,512) (4,220,505) (4,319,821) (4,382,568) (4,483,055) OTHER USES: Reserve for Employee Obligations** - - - - - - -Reserve for Council Special Projects - - - - - - -Reserve for Capital Improvements - - - - -Committed for Other PurposesReserve for Other Restricted Purposes 20,198,684 Restricted (Reserve for Special Fund Purposes) - - - - - - -Unassigned (Res for Emergencies & Shortfalls*) 2,873,561 21,166,698 24,531,162 21,635,526 19,600,328 17,181,391 15,066,108 13,334,595 TOTAL OTHER USES 23,072,245 21,166,698 24,531,162 21,635,526 19,600,328 17,181,391 15,066,108 13,334,595 TOTAL ESTIMATED USES 57,437,380 48,523,698 66,860,889 51,049,102 48,640,424 47,115,843 45,219,298 43,629,840 *LEVEL OF EMERGENCY RESERVES: Percentage of Total Revenue 11% 83% 89% 82% 73% 62% 54% 47% Number of Days of Revenue 40 304 326 298 265 228 196 170 Percentage of Total Expenses 8% 77% 58% 74% 67% 57% 50% 44% Number of Days of Expenses 30 282 212 268 246 209 182 161 DETAIL OF TRANSFERS OUT: Administrative Support 852,974 931,016 931,016 995,378 1,015,286 1,016,789 1,037,125 1,057,867 Fleet Lease Assessment Fee 68,512 71,635 71,635 76,380 80,148 84,105 88,259 92,621 Fleet Management Fund - 170,000 - 270,000 - - -Insurance Assessment 45,226 147,993 147,993 139,515 146,491 153,815 161,506 169,581 Vehicle Maintenance Fees 7,340 50,000 60,000 52,000 54,080 56,243 58,493 60,833 Field Services 2,528,543 2,729,114 2,729,114 2,860,239 2,924,500 3,008,869 3,037,185 3,102,153 Sales Tax (EPWA) - - - - - - -Arts in Public Places Fund - - - - - - -General Fund 628,318 - - - - - -Revenue Bond Funds (EPWA) 222,678 - 1,280,819 - - - -Edmond Economic Development Fund (EEDA) - - - - - - -Edmond Electric Economic Development Fund - - - - - - -Additional Transfers - - 44,082 - - - -Total Transfers Out: 4,353,593 4,099,758 5,264,659 4,393,512 4,220,505 4,319,821 4,382,568 4,483,055 7.13 Click Here for Main Directory Click Here for Sub-Directory
EDMOND PUBLIC WORKS SEWER IMPACT
The EPWA Sewer Impact Fund is used to account for impact fees collected on new developments in accordance with ordinance #2077. This ordinance, which was repealed in July 2002, established a fee of $100 per toilet to be used for the sole purpose of acquiring, equipping, and/or making capital improvements to the City's sewer facilities. The funds may also be used for debt service under certain conditions. When funds can legally be expended, this Fund will be closed out.


7.14 Click Here for Main Directory Click Here for Sub-Directory
FUND BUDGET SUMMARY PWA Sewer Impact Fund FY 23-24 Prior Year Actual Adopted Year Budget Current Year Revised BUDGET YEAR Projected Budget Projected Budget Projected Budget Projected Budget FY 21-22FY 22-23FY 22-23 FY 23-24 FY 24-25FY 25-26FY 26-27FY 27-28 ESTIMATED RESOURCES: REVENUES: Taxes- - - - - - -Inter-governmental - - - - - - -Licenses and Permits - - - - - - -Fines & Forfeitures - - - - - - -Charges for Services - - - - - - -Interest (464) - 114 - - - -Investment Income - - - - - - -Capital Lease Proceeds - - - - - - -Miscellaneous Revenue - - - - - - -Subtotal - Revenues (464) - 114 - - - -OTHER RESOURCES: Debt/Loan Proceeds - - - - - -Restricted Prior Year Reserves 13,705 13,241 13,241 13,355 13,355 13,355 13,355 13,355 Assigned Prior Year Reserves (Council Projects) - - - - - -Committed Prior Year Reserves - - - - - -Unrestricted Prior Year Reserves - - - - - -TOTAL ESTIMATED RESOURCES 13,241 13,241 13,355 13,355 13,355 13,355 13,355 13,355 ESTIMATED USES DIRECT COSTS BY FUNCTION: Personnel Services- - - - - - -Materials & Supplies - - - - - - -Other Services & Charges - - - - - - -Capital Outlay - - - - - - -Debt Service - - - - - - -TOTAL ESTIMATED COSTS - - - - - - -TRANSFERS: Transfers In - - - - - - -Transfers Out (See detail below) - - - - - - -NET TRANSFERS IN (OUT) - - - - - - -OTHER USES: Reserve for Employee Obligations - - - - - - -Reserve for Council Special Projects - - - - - - -Reserve for Capital Improvements - - - - - - -Committed for Other PurposesReserve for Other Restricted Purposes 13,241 13,241 13,355 13,355 13,355 13,355 13,355 13,355 Restricted (Reserve for Special Fund Purposes) - - - - - - -Unassigned (Res for Emergencies & Shortfalls*)TOTAL OTHER USES 13,241 13,241 13,355 13,355 13,355 13,355 13,355 13,355 TOTAL ESTIMATED USES 13,241 13,241 13,355 13,355 13,355 13,355 13,355 13,355 ** Funds to be used to add additional Wastewater Plant. DETAIL OF TRANSFERS OUT: Administrative Support - - - - - - -Fleet Lease Assessment Fee - - - - - - -Fleet Management Fund - - - - - - -Insurance Assessment - - - - - - -Vehicle Maintenance Fees - - - - - - -Field Services - - - - - - -Sales Tax (EPWA) - - - - - - -Arts in Public Places Fund - - - - - - -General Fund - - - - - - -Revenue Bond Funds (EPWA) - - - - - - -Edmond Economic Development Fund (EEDA) - - - - - - -Edmond Electric Economic Development Fund - - - - - - -Additional Transfers - - - - - - -Total Transfers Out: - - - - - - -Fund should be closed out June 30, 2017 7.15 Click Here for Main Directory Click Here for Sub-Directory
EDMOND Arcadia Lake
Arcadia Lake provides quality outdoor recreational experiences such as, camping, boating, swimming, hiking/biking, fishing, hunting and picnicking to the community. The lake offers 5 different parks which include day use, boat docks, fishing docks, pavilion rentals, beaches, playgrounds, disc golf, and various trails to hike or bike or ride your horse. Various programs are offered throughout the year: Storybook Forest, Eagle Watch, Lake Sweep, Kids Fishing Derby, Deer hunts, as well as educational programs.
DID YOU KNOW?

Arcadia Lake is open year around for guest to enjoy all seasons at the Lake.
Arcadia Lake was built for flood control, drinking water for Edmond Residents, and recreation, in that order.

Fees charged at Arcadia Lake stay at the Lake to provide funds for maintenance and operations.

Organization Chart
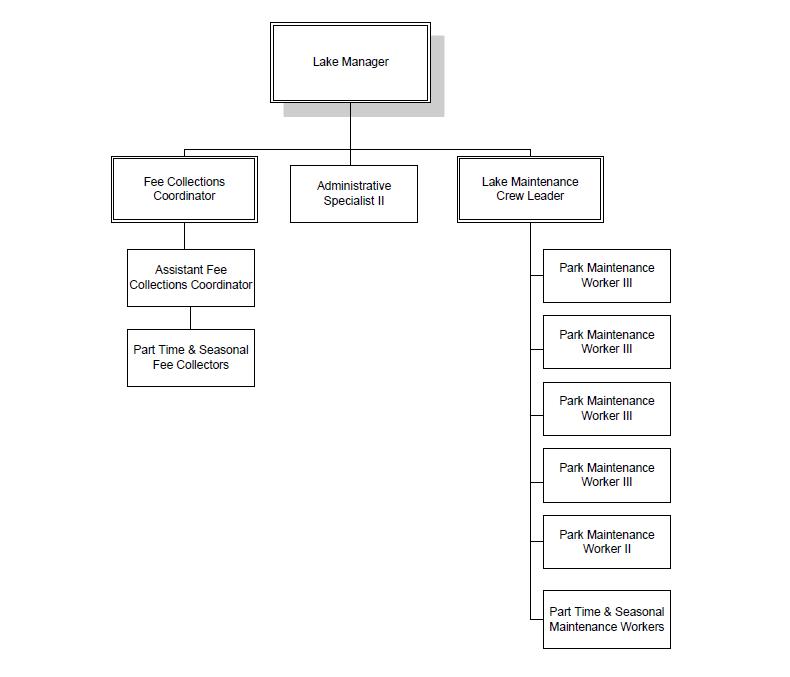

Staffing CURRENT YEAR YEAR 2024 YEAR 2025 YEAR 2026 YEAR 2027 YEAR 2028 10-5-23 11-6-23 11-6-26 11-6-26 11-6-26 11-6-26 Contact Us Phone: (405) 216-7470 Website: arcadialakeok.gov
7.16 Click Here for Main Directory Click Here for Sub-Directory
Arcadia Fund FY 23-24 Prior Year Actual Adopted Year Budget Current Year Revised BUDGET YEAR Projected Budget Projected Budget Projected Budget Projected Budget FY 21-22FY 22-23FY 22-23 FY 23-24 FY 24-25FY 25-26FY 26-27FY 27-28 ESTIMATED RESOURCES: REVENUES: Inter-governmental- - - - - - -Licenses and Permits - - - - - - -Fines & Forfeitures - - - - - - -Charges for Services 1,341,910 1,309,104 1,316,520 1,635,022 1,565,723 1,591,036 1,622,856 1,654,033 Interest (541) 1,000 (3,240) 1,000 1,000 1,000 1,000 1,000 Capital Lease Proceeds - - - - - - -Miscellaneous Revenue 45,993 47,469 48,093 48,562 49,779 50,773 51,788 52,861 Subtotal - Revenues 1,387,362 1,357,573 1,361,373 1,684,584 1,616,502 1,642,809 1,675,644 1,707,894 OTHER RESOURCES: Debt/Loan Proceeds - - - - - -Restricted Prior Year Reserves 914,506 914,506 - - - -Assigned Prior Year Reserves (Council Projects) - - - - - -Committed Prior Year Reserves - - - - - -Unrestricted Prior Year Reserves 207,205 (1,296,442) (1,296,442) (641,407) (960,238) (1,338,170) (1,716,723) (2,100,776) TOTAL ESTIMATED RESOURCES 1,594,567 975,637 979,437 1,043,177 656,264 304,639 (41,079) (392,882) ESTIMATED USES DIRECT COSTS BY FUNCTION: Personnel Services768,016 926,775 843,819 994,211 1,020,713 1,043,368 1,065,202 1,088,390 Materials & Supplies109,728 133,985 146,924 155,775 130,775 130,775 140,275 133,275 Other Services & Charges326,052 393,933 353,759 472,933 478,933 478,933 476,933 474,933 Capital Outlay - 55,000 - - 10,000 10,000 10,000Debt Service (21,851) - - - - - -TOTAL ESTIMATED COSTS 1,181,946 1,509,693 1,344,502 1,622,919 1,640,421 1,663,076 1,692,410 1,696,598 TRANSFERS: Transfers In 203,028 - - - - - -Transfers Out (See detail below) (997,586) (563,406) (276,342) (380,496) (354,013) (358,286) (367,287) (376,591) NET TRANSFERS IN (OUT) (794,558) (563,406) (276,342) (380,496) (354,013) (358,286) (367,287) (376,591) OTHER USES: Reserve for Employee Obligations** - - - - - - -Reserve for Council Special Projects - - - - - - -Reserve for Capital Improvements - - - - -Committed for Other Purposes - - - - - - -Reserve for Other Restricted Purposes 914,506 - - - - - -Restricted (Reserve for Special Fund Purposes) - - - - - - -Unassigned (Res for Emergencies & Shortfalls*)(1,296,442) (1,097,463) (641,407) (960,238) (1,338,170) (1,716,723) (2,100,776) (2,466,071) TOTAL OTHER USES (381,936) (1,097,463) (641,407) (960,238) (1,338,170) (1,716,723) (2,100,776) (2,466,071) TOTAL ESTIMATED USES 1,594,567 975,637 979,437 1,043,177 656,264 304,639 (41,079) (392,882) *LEVEL OF EMERGENCY RESERVES: Percentage of Total Revenue -82% -81% -47% -57% -83% -104% -125% -144% Number of Days of Revenue (298) (295) (172) (208) (302) (381) (458) (527) Percentage of Total Expenses -59% -53% -40% -48% -67% -85% -102% -119% Number of Days of Expenses (217) (193) (144) (175) (245) (310) (372) (434) DETAIL OF TRANSFERS OUT: Administrative Support 216,282 176,753 176,754 239,572 244,364 244,726 249,620 254,613 Fleet Lease Assessment Fee 40,508 41,821 41,821 43,840 45,961 48,188 50,526 52,980 Fleet Management Fund - 35,000 - 35,000 - - -Insurance Assessment 13,752 22,126 22,126 32,084 33,688 35,372 37,141 38,998 Vehicle Maintenance Fees 19,918 30,000 36,000 30,000 30,000 30,000 30,000 30,000 Field Services - - - - - - -Sales Tax (EPWA) - - - - - - -Arts in Public Places Fund - - - - - - -General Fund - - - - - - -Revenue Bond Funds (EPWA) 707,126 257,706 (359) - - - -Edmond Economic Development Fund (EEDA) - - - - - - -Edmond Electric Economic Development Fund - - - - - - -Additional Transfers - - - - - - -Total Transfers Out: 997,586 563,406 276,342 380,496 354,013 358,286 367,287 376,591 7.17 Click Here for Main Directory Click Here for Sub-Directory
FUND BUDGET SUMMARY
EDMOND Drainage Utility


Drainage Utility is one of the three divisions comprising the Engineering Department. It is funded by the storm water drainage system service charge that is collected through the utility billing system. Drainage Utility focuses on all aspects of storm water drainage including storm-water planning, floodplain management, and environmental protection of Edmond’s waterways.
DID YOU KNOW?
Drainage distributed 1,266 rain barrels since the beginning of the annual rain barrel and compost bin program (2016 - 2023).
450+ plan review are processed annually.

Run approximately 7,000 Public Service Announcements about floodplains and flood insurance each year.
Organization Chart
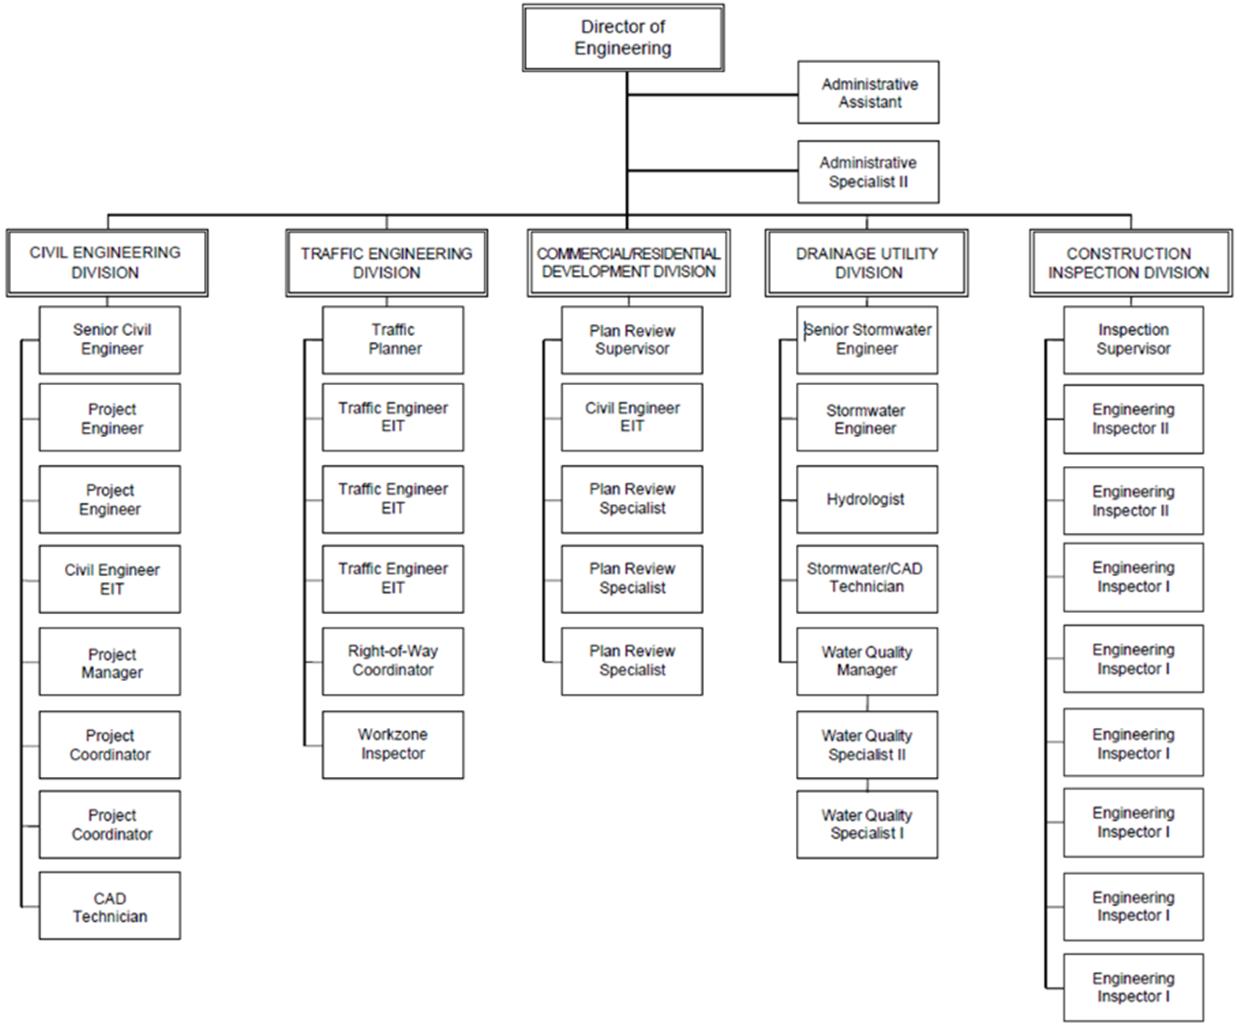
Staffing CURRENT YEAR YEAR 2024 YEAR 2025 YEAR 2026 YEAR 2027 YEAR 2028 6-0-0 7-0-0 7-0-0 7-0-0 7-0-0 7-0-0 Contact Us Keith Beatty: (405) 359-4772 https://edmondok.com/278/Stormwater-Quality-Management
7.18 Click Here for Main Directory Click Here for Sub-Directory
FUND BUDGET SUMMARY Drainage Fund FY 23-24 Prior Year Actual Adopted Year Budget Current Year Revised BUDGET YEAR Projected Budget Projected Budget Projected Budget Projected Budget FY 21-22FY 22-23FY 22-23 FY 23-24 FY 24-25FY 25-26FY 26-27FY 27-28 ESTIMATED RESOURCES: REVENUES: Taxes- - - - - - -Inter-governmental - - - - - - -Licenses and Permits 30,138 - 17,771 - - - -Fines & Forfeitures - - - - - - -Charges for Services 1,913,540 1,934,566 1,922,522 1,956,917 1,996,055 2,035,976 2,076,695 2,118,230 Interest (284,843) 50,000 109,805 50,000 50,000 50,000 50,000 50,000 Investment Income - - - - - - -Capital Lease Proceeds - - - - - - -Miscellaneous Revenue 79 - 123 - - - -Subtotal - Revenues 1,658,914 1,984,566 2,050,221 2,006,917 2,046,055 2,085,976 2,126,695 2,168,230 OTHER RESOURCES: Debt/Loan Proceeds - - - - - -Restricted Prior Year Reserves - - - - - -Assigned Prior Year Reserves (Council Projects) - - - - - -Committed Prior Year Reserves - - - - - -Unrestricted Prior Year Reserves 12,750,156 12,392,610 12,392,610 12,489,218 811,505 (2,105,743) (4,633,415) (6,203,063) TOTAL ESTIMATED RESOURCES 14,409,070 14,377,176 14,442,831 14,496,135 2,857,560 (19,767) (2,506,720) (4,034,833) ESTIMATED USES DIRECT COSTS BY FUNCTION: Personnel Services519,765 595,309 566,178 763,801 788,683 814,725 841,282 869,455 Materials & Supplies17,026 38,550 23,483 43,800 37,300 39,800 47,300 35,800 Other Services & Charges 60,435 205,400 175,040 468,525 310,725 310,925 311,125 311,125 Capital Outlay 398,637 2,365,000 818,870 12,005,000 3,415,000 3,035,000 2,075,000 910,000 Debt Service- - - - - - -TOTAL ESTIMATED COSTS 995,863 3,204,259 1,583,572 13,281,126 4,551,708 4,200,450 3,274,707 2,126,380 TRANSFERS: Transfers In - - - - - - -Transfers Out (See detail below) (1,020,597) (369,463) (370,041) (403,504) (411,595) (413,199) (421,635) (430,414) NET TRANSFERS IN (OUT) (1,020,597) (369,463) (370,041) (403,504) (411,595) (413,199) (421,635) (430,414) OTHER USES: Reserve for Employee Obligations** - - - - - - -Reserve for Council Special Projects - - - - - - -Reserve for Capital Improvements - - - - - - -Committed for Other PurposesReserve for Other Restricted Purposes - - - - - - -Restricted (Reserve for Special Fund Purposes) - - - - - - -Unassigned (Res for Emergencies & Shortfalls*)12,392,610 10,803,454 12,489,218 811,505 (2,105,743) (4,633,415) (6,203,063) (6,591,627) TOTAL OTHER USES 12,392,610 10,803,454 12,489,218 811,505 (2,105,743) (4,633,415) (6,203,063) (6,591,627) TOTAL ESTIMATED USES 14,409,070 14,377,176 14,442,831 14,496,135 2,857,560 (19,767) (2,506,720) (4,034,833) *LEVEL OF EMERGENCY RESERVES: Percentage of Total Revenue 747% 544% 609% 40% -103% -222% -292% -304% Number of Days of Revenue 2,727 1,987 2,223 148 (376) (811)(1,065)(1,110) Percentage of Total Expenses 615% 302% 639% 6% -42% -100% -168% -258% Number of Days of Expenses 2,243 1,103 2,333 22 (155) (367) (613) (941) DETAIL OF TRANSFERS OUT: Administrative Support 296,389 343,975 343,974 376,265 383,791 384,359 392,046 399,887 Fleet Lease Assessment Fee 8,252 8,394 8,394 8,783 9,192 9,621 10,071 10,544 Fleet Management Fund - - - - - - -Insurance Assessment 3,607 2,762 2,762 3,769 3,957 4,155 4,363 4,581 Vehicle Maintenance Fees 1,958 2,894 3,473 2,894 2,894 2,894 2,894 2,894 Field Services 10,392 11,438 11,438 11,793 11,761 12,170 12,261 12,508 Sales Tax (EPWA) - - - - - - -Arts in Public Places Fund - - - - - - -General Fund - - - - - - -Revenue Bond Funds (EPWA) - - - - - - -Edmond Economic Development Fund (EEDA) - - - - - - -Edmond Electric Economic Development Fund - - - - - - -Additional Transfers 700,000 - - - - - -Total Transfers Out: 1,020,597 369,463 370,041 403,504 411,595 413,199 421,635 430,414 7.19 Click Here for Main Directory Click Here for Sub-Directory
EDMOND PUBLIC WORKS ECONOMIC DEVELOPMENT
The Edmond Public Works Authority (EPWA) is involved in Economic Development projects as they can enter into multi-year transactions. This fund was created in 2018. There are two current projects to provide payment assistance through this fund. The Hotel/Conference Center will receive the payment of developments share of the Hotel/Motel Room Tax collected for payment for the operation of the conference center. The Movie Theater/ Entertainment Center project will receive the return of two cents ($0.02) of the sales tax collected at the complex to assist with project development costs.

7.20 Click Here for Main Directory Click Here for Sub-Directory
PWA Economic Development FY 23-24 Prior Year Actual Adopted Year Budget Current Year Revised BUDGET YEAR Projected Budget Projected Budget Projected Budget Projected Budget FY 21-22FY 22-23FY 22-23 FY 23-24 FY 24-25FY 25-26FY 26-27FY 27-28 ESTIMATED RESOURCES: REVENUES: Taxes- - - - - - -Inter-governmental - - - - - - -Licenses and Permits - - - - - - -Fines & Forfeitures - - - - - - -Charges for Services - - - - - - -Interest (2,113) 1,000 15,374 1,000 1,000 1,000 1,000 1,000 Investment Income - - - - - - -Capital Lease Proceeds - - - - - - -Miscellaneous Revenue - - - - - - -Subtotal - Revenues (2,113) 1,000 15,374 1,000 1,000 1,000 1,000 1,000 OTHER RESOURCES: Debt/Loan Proceeds - - - - - -Restricted Prior Year Reserves 92,580 30,572 30,572 1,102,599 1,103,599 1,104,599 1,105,599 1,106,599 Assigned Prior Year Reserves (Council Projects) - - - - - -Committed Prior Year Reserves - - - - - -Unrestricted Prior Year Reserves - - - - - -TOTAL ESTIMATED RESOURCES 90,467 31,572 45,946 1,103,599 1,104,599 1,105,599 1,106,599 1,107,599 ESTIMATED USES DIRECT COSTS BY FUNCTION: Personnel Services- - - - - - -Materials & Supplies - - - - - - -Other Services & Charges 323,083 390,000 261,305 390,000 390,000 390,000 390,000 390,000 Capital Outlay - - 3,815,614 - - - -Debt Service - - - - - - -TOTAL ESTIMATED COSTS 323,083 390,000 4,076,919 390,000 390,000 390,000 390,000 390,000 TRANSFERS: Transfers In263,188 390,000 5,133,572 390,000 390,000 390,000 390,000 390,000 Transfers Out (See detail below)- - - - - - -NET TRANSFERS IN (OUT) 263,188 390,000 5,133,572 390,000 390,000 390,000 390,000 390,000 OTHER USES: Reserve for Employee Obligations - - - - - - -Reserve for Council Special Projects - - - - - - -Reserve for Capital Improvements - - - - - - -Committed for Other PurposesReserve for Other Restricted Purposes 30,572 31,572 1,102,599 1,103,599 1,104,599 1,105,599 1,106,599 1,107,599 Restricted (Reserve for Special Fund Purposes)Unassigned (Res for Emergencies & Shortfalls*) - - - - - - -TOTAL OTHER USES 30,572 31,572 1,102,599 1,103,599 1,104,599 1,105,599 1,106,599 1,107,599 TOTAL ESTIMATED USES 90,467 31,572 45,946 1,103,599 1,104,599 1,105,599 1,106,599 1,107,599 DETAIL OF TRANSFERS OUT: Administrative Support - - - - - -Fleet Lease Assessment Fee - - - - - - -Fleet Management Fund - - - - - - -Insurance Assessment - - - - - - -Vehicle Maintenance Fees - - - - - - -Field Services - - - - - - -Sales Tax (EPWA) - - - - - - -Arts in Public Places Fund - - - - - - -General Fund - - - - - - -Revenue Bond Funds (EPWA) - - - - - - -Edmond Economic Development Fund (EEDA) - - - - - - -Edmond Electric Economic Development Fund - - - - - - -Additional Transfers - - - - - - -Total Transfers Out: - - - - - - -7.21 Click Here for Main Directory Click Here for Sub-Directory
FUND BUDGET SUMMARY
INTENTIONALLY
PAGE
LEFT BLANK
Other Enterprise Funds - Sub-Directory
KickingBird Golf Club 8.2-8.3 Summary Page 8.2 Budget Page 8.3 YourGovShop Fund 8.4-8.5 Summary Page 8.4 Budget Page 8.5 Citylink- Public Transportation 8.6-8.7 Summary Page 8.6 Budget Page 8.7
8.1
EDMOND KickingBird Golf


KickingBird Golf opened in May of 1971 making it the City of Edmond's oldest golf facility. The golf course closed on July 1, 2022 for the largest capital improvement project in the course's history. (New clubhouse, special events center, short game practice area, indoor teaching facility, driving range pavilion, new greens, new tee boxes and a new irrigation system.) Our mission is "To provide patrons with a ellmanicured golf course, excellent customer service, high quality amenities and a valuable golfing experience." We anticipate opening July 1, 2023.
DID YOU KNOW?
The southeast corner of our driving range is the second highest point in Oklahoma County and the highest point in Edmond.
There are more than 2 million Range Balls hit on the driving range each year.

The name "KickingBird" comes from Milton Reynold's pen name. He wrote of Native American affairs and established the Edmond Evening Sun in the late 1800's.

Organization Chart
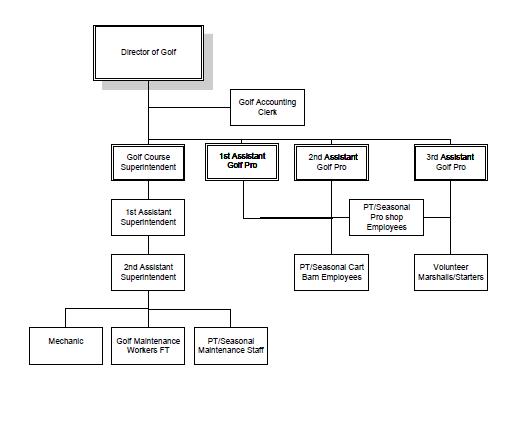
Staffing CURRENT YEAR YEAR 2024 YEAR 2025 YEAR 2026 YEAR 2027 YEAR 2028 12-2-41 12-17-26 12-17-26 12-17-26 12-17-26 12-17-26 Contact Us Brian Soerensen- Phone (405) 216-7421 Website: kickingbirdgolf.com
8.2 Click Here for Main Directory Click Here for Sub-Directory
Golf Course Fund FY 23-24 Prior Year Actual Adopted Year Budget Current Year Revised BUDGET YEAR Projected Budget Projected Budget Projected Budget Projected Budget FY 21-22FY 22-23FY 22-23 FY 23-24 FY 24-25FY 25-26FY 26-27FY 27-28 ESTIMATED RESOURCES: REVENUES: Inter-governmental- - - - - - -Fines & Forfeitures - - - - - - -Charges for Services 20,477 1,281,520 690,039 2,718,950 2,773,550 2,804,700 2,828,050 2,861,200 Interest (12,361) 2,716 2,547 5,000 5,000 5,000 5,000 5,000 Investment Income - - - - - - -Miscellaneous Revenue 137,148 47,184 33,414 122,358 247,438 252,524 257,524 262,524 Subtotal - Revenues 145,264 1,331,420 726,000 2,846,308 3,025,988 3,062,224 3,090,574 3,128,724 OTHER RESOURCES: Capital Lease Proceeds - - - -Debt/Loan Proceeds - - - - - -Restricted Prior Year Reserves 1,601 1,601 - - - -Assigned Prior Year Reserves (Council Projects) - - - - - -Committed Prior Year Reserves - - - - - -Unrestricted Prior Year Reserves 798,719 640,471 640,471 350,495 402,446 410,031 460,290 495,435 TOTAL ESTIMATED RESOURCES 943,983 1,973,492 1,368,072 3,196,803 3,428,434 3,472,255 3,550,864 3,624,159 ESTIMATED USES DIRECT COSTS BY FUNCTION: Personnel Services606,372 1,491,289 807,333 1,506,260 1,722,041 1,759,788 1,799,600 1,841,588 Materials & Supplies111,533 392,401 305,680 528,083 524,531 522,327 535,091 535,110 Other Services & Charges54,384 274,865 96,359 385,825 381,825 386,025 381,825 381,825 Capital Outlay 142,929 280,900 401,956 115,000 125,000 76,000 65,000 45,000 Debt Service (5,482) - 239,325 - - - -TOTAL ESTIMATED COSTS 909,736 2,439,455 1,850,653 2,535,168 2,753,397 2,744,140 2,781,516 2,803,523 TRANSFERS: Transfers In 1,100,000 400,000 1,032,000 - - - -Transfers Out (See detail below) (492,175) (321,905) (198,924) (259,189) (265,006) (267,825) (273,912) (280,181) NET TRANSFERS IN (OUT) 607,825 78,095 833,076 (259,189) (265,006) (267,825) (273,912) (280,181) OTHER USES: Reserve for Employee Obligations** - - - - - - -Reserve for Council Special Projects - - - - - - -Reserve for Capital Improvements - - - -Committed for Other PurposesReserve for Other Restricted Purposes 1,601 - - - - - -Restricted (Reserve for Special Fund Purposes)Unassigned (Res for Emergencies & Shortfalls*) 640,471 (387,869) 350,495 402,446 410,031 460,290 495,435 540,455 TOTAL OTHER USES 642,072 (387,869) 350,495 402,446 410,031 460,290 495,435 540,455 TOTAL ESTIMATED USES 943,983 1,973,492 1,368,072 3,196,803 3,428,434 3,472,255 3,550,864 3,624,159 *LEVEL OF EMERGENCY RESERVES: Percentage of Total Revenue 441% -29% 48% 14% 14% 15% 16% 17% Number of Days of Revenue 1,609 (106) 176 52 49 55 59 63 Percentage of Total Expenses 212% -16% 34% 14% 14% 15% 16% 18% Number of Days of Expenses 774 (60) 126 53 50 56 59 64 DETAIL OF TRANSFERS OUT: Administrative Support 199,916 173,659 173,659 167,570 170,920 171,175 174,595 178,090 Fleet Lease Assessment Fee 45,056 46,493 46,493 47,788 49,338 50,940 52,596 54,309 Fleet Management Fund - - - - - - -Insurance Assessment 20,034 18,672 18,672 18,331 19,248 20,210 21,221 22,282 Vehicle Maintenance Fees 566 500 - 500 500 500 500 500 Field Services - - - - - - -Sales Tax (EPWA) - - - - - - -Arts in Public Places Fund - - - - - - -General Fund - - - - - - -Revenue Bond Funds (EPWA) 226,603 82,581 (115) - - - -Park Tax Fund - - - 25,000 25,000 25,000 25,000 25,000 Total Transfers Out: 492,175 321,905 238,709 259,189 265,006 267,825 273,912 280,181 8.3 Click Here for Main Directory Click Here for Sub-Directory
YOUR GOVSHOP

YourGovShop’s mission is to aggregate material purchase for member cities to obtain discounted pricing. Our plan is to generate sufficient revenues through supplier rebates to cover its operational costs and generate a profit. Financial activity and results of operations will be monitored separately. Profits generated (if any) from the plan will be used to offset the expenses of the City’s Purchasing department or to expand this joint purchasing program in other areas.
Brenda Mayer
Ph (405) 359-4580
GOALS
1.Generate sufficient revenue to cover cost of operations.
2.Increase awareness and participation in the program through marketing.
3.Expand our customer base annually.
CONTACT
8.4 Click Here for Main Directory Click Here for Sub-Directory
YourGovShop Fund FY 23-24 Prior Year Actual Adopted Year Budget Current Year Revised BUDGET YEAR Projected Budget Projected Budget Projected Budget Projected Budget FY 21-22FY 22-23FY 22-23 FY 23-24 FY 24-25FY 25-26FY 26-27FY 27-28 ESTIMATED RESOURCES: REVENUES: Inter-governmental- - - - - - -Fines & Forfeitures - - - - - - -Charges for Services 113,949 72,000 126,007 78,000 78,000 80,000 80,000 80,000 Interest (9,679) 1,500 3,870 1,500 1,500 1,500 1,500 1,500 Investment Income - - - - - - -Capital Lease Proceeds - - - - - - -Miscellaneous Revenue - - - - - - -Subtotal - Revenues 104,269 73,500 129,877 79,500 79,500 81,500 81,500 81,500 OTHER RESOURCES: Debt/Loan Proceeds - - - - - -Restricted Prior Year Reserves - - - - - -Assigned Prior Year Reserves (Council Projects) - - - - - -Committed Prior Year Reserves - - - - - -Unrestricted Prior Year Reserves 385,961 450,368 450,368 511,157 522,279 533,425 546,887 559,986 TOTAL ESTIMATED RESOURCES 490,230 523,868 580,245 590,657 601,779 614,925 628,387 641,486 ESTIMATED USES DIRECT COSTS BY FUNCTION: Personnel Services34,015 38,731 38,731 40,568 40,916 40,983 41,041 41,101 Materials & Supplies - 1,700 1,700 1,700 1,700 1,700 1,700 1,700 Other Services & Charges 15,356 38,500 38,500 38,500 38,500 38,500 39,200 39,200 Capital Outlay - - - - - - -Debt Service - - - - - - -TOTAL ESTIMATED COSTS 49,371 78,931 78,931 80,768 81,116 81,183 81,941 82,001 TRANSFERS: Transfers In 12,026 12,029 12,029 12,390 12,762 13,145 13,540 13,540 Transfers Out (See detail below) (2,517)(2,186) (2,186) - - - -NET TRANSFERS IN (OUT) 9,509 9,843 9,843 12,390 12,762 13,145 13,540 13,540 OTHER USES: Reserve for Employee Obligations** - - - - - - -Reserve for Council Special Projects - - - - - - -Reserve for Capital Improvements - - - - - - -Committed for Other PurposesReserve for Other Restricted Purposes - - - - - - -Restricted (Reserve for Special Fund Purposes)Unassigned (Res for Emergencies & Shortfalls*) 450,368 454,780 511,157 522,279 533,425 546,887 559,986 573,025 TOTAL OTHER USES 450,368 454,780 511,157 522,279 533,425 546,887 559,986 573,025 TOTAL ESTIMATED USES 490,230 523,868 580,245 590,657 601,779 614,925 628,387 641,486 *LEVEL OF EMERGENCY RESERVES: Percentage of Total Revenue 432% 619% 394% 657% 671% 671% 687% 703% Number of Days of Revenue 1,577 2,258 1,437 2,398 2,449 2,449 2,508 2,566 Percentage of Total Expenses 1130% 658% 740% 647% 780% 804% 819% 837% Number of Days of Expenses 4,124 2,403 2,701 2,360 2,848 2,934 2,988 3,055 DETAIL OF TRANSFERS OUT: Administrative Support 2,517 2,186 2,186 - - - -Fleet Lease Assessment Fee - - - - - - -Fleet Management Fund - - - - - - -Insurance Assessment - - - - - - -Vehicle Maintenance Fees - - - - - - -Field Services - - - - - - -Sales Tax (EPWA) - - - - - - -Arts in Public Places Fund - - - - - - -General Fund - - - - - - -Revenue Bond Funds (EPWA) - - - - - - -Total Transfers Out: 2,517 2,186 2,186 - - - -8.5 Click Here for Main Directory Click Here for Sub-Directory
EDMOND CityLink Public Transportation
Citylink, Edmond's public transportation service, aims to provide residents with affordable, reliable, and customer-friendly transportation options for accessing employment, medical facilities, shopping, education, and social destinations. The service is operated by RATPDev USA, Inc. under a 5-year agreement with the Edmond Public Works Authority. Citylink operates 6 local fixed routes and a door-to-door paratransit service within Edmond on weekdays and Saturdays, using 12 transit buses. Additionally, it offers a commuter service to and from Oklahoma City.
DID YOU KNOW


Citylink has expanded from 4 fixed routes to six. Now providing services to I-35 Retailers and Medical Services.
All Citylink services are fare-free, including the Express Link to OKC and Paratransit.
Organization Chart
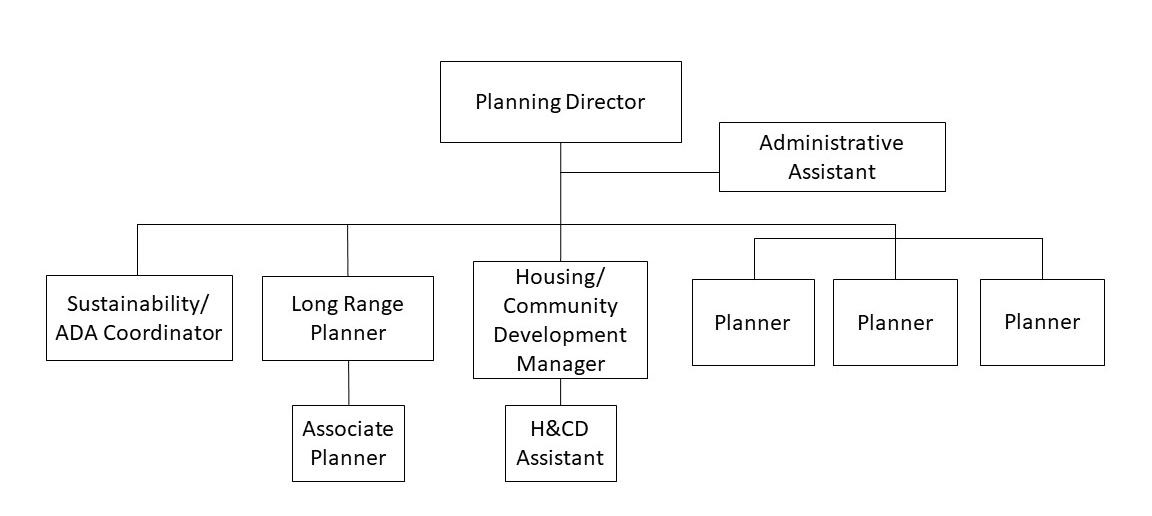


Staffing CURRENT YEAR YEAR 2024 YEAR 2025 YEAR 2026 YEAR 2027 YEAR 2028 1-0-0 1-0-0 1-0-0 1-0-0 1-0-0 1-0-0 Contact Us Christy Batterson: (405) 359-4694
8.6 Click Here for Main Directory Click Here for Sub-Directory
Grant/CDBG Coordinator
CITYLINK FY 23-24 Prior Year Actual Adopted Year Budget Current Year Revised BUDGET YEAR Projected Budget Projected Budget Projected Budget Projected Budget FY 21-22FY 22-23FY 22-23 FY 23-24 FY 24-25FY 25-26FY 26-27FY 27-28 ESTIMATED RESOURCES: REVENUES: Taxes- - - - - - -Inter-governmental 1,546,417 1,124,078 774,896 1,052,851 1,053,851 1,054,851 1,054,851 1,054,851 Fines & Forfeitures - - - - - - -Charges for Services - - - - - - -Interest (8,686) 2,500 1,780 2,500 2,500 2,500 2,500 2,500 Investment Income - - - - - - -Capital Lease Proceeds - - - - - - -Miscellaneous Revenue 10,730 18,000 14,400 12,000 12,000 12,000 12,000 12,000 Subtotal - Revenues 1,548,461 1,144,578 791,076 1,067,351 1,068,351 1,069,351 1,069,351 1,069,351 OTHER RESOURCES: Debt/Loan Proceeds - - - - - -Restricted Prior Year Reserves - - - - - -Assigned Prior Year Reserves (Council Projects) - - - - - -Committed Prior Year Reserves - - - - - -Unrestricted Prior Year Reserves 685,784 520,575 520,575 511,717 508,890 503,909 496,384 485,609 TOTAL ESTIMATED RESOURCES 2,234,246 1,665,153 1,311,652 1,579,068 1,577,241 1,573,260 1,565,735 1,554,960 ESTIMATED USES DIRECT COSTS BY FUNCTION: Personnel Services64,326 100,184 100,184 100,383 104,909 109,392 114,274 119,186 Materials & Supplies 137,575 164,500 174,536 199,500 199,500 199,500 199,500 199,500 Other Services & Charges 1,802,309 1,956,475 2,204,538 2,845,636 2,710,815 2,875,461 2,975,271 3,120,330 Capital Outlay - 300,000 - 300,000 - - -Debt Service - - - - - - -TOTAL ESTIMATED COSTS 2,004,210 2,521,159 2,479,258 3,445,519 3,015,224 3,184,353 3,289,045 3,439,016 TRANSFERS: Transfers In 635,000 1,081,196 1,823,746 2,533,699 2,107,262 2,279,621 2,388,744 2,541,815 Transfers Out (See detail below) (344,460) (144,423) (144,423) (158,358) (165,369) (172,144) (179,826) (187,874) NET TRANSFERS IN (OUT) 290,540 936,773 1,679,323 2,375,341 1,941,893 2,107,477 2,208,918 2,353,941 OTHER USES: Reserve for Employee Obligations** - - - - - - -Reserve for Council Special Projects - - - - - - -Reserve for Capital Improvements - - - - - - -Committed for Other PurposesReserve for Other Restricted Purposes - - - - - - -Restricted (Reserve for Special Fund Purposes)Unassigned (Res for Emergencies & Shortfalls*) 520,575 80,767 511,717 508,890 503,909 496,384 485,609 469,885 TOTAL OTHER USES 520,575 80,767 511,717 508,890 503,909 496,384 485,609 469,885 TOTAL ESTIMATED USES 2,234,246 1,665,153 1,311,652 1,579,068 1,577,241 1,573,260 1,565,735 1,554,960 *LEVEL OF EMERGENCY RESERVES: Percentage of Total Revenue 34% 7% 65% 48% 47% 46% 45% 44% Number of Days of Revenue 123 26 236 174 172 169 166 160 Percentage of Total Expenses 30% 5% 64% 14% 47% 46% 45% 43% Number of Days of Expenses 111 19 233 52 171 168 164 158 DETAIL OF TRANSFERS OUT: Administrative Support 20,844 22,698 22,698 30,181 30,784 30,830 31,446 32,075 Fleet Lease Assessment Fee 112,201 117,811 117,811 123,702 129,887 136,381 143,200 150,360 Fleet Management Fund 208,067 - - - - - -Insurance Assessment 3,348 3,914 3,914 4,475 4,698 4,933 5,180 5,439 Vehicle Maintenance Fees - - - - - - -Field Services - - - - - - -Sales Tax (EPWA) - - - - - - -Arts in Public Places Fund - - - - - - -General Fund - - - - - - -Revenue Bond Funds (EPWA) - - - - - - -Total Transfers Out: 344,460 144,423 144,423 158,358 165,369 172,144 179,826 187,874 8.7 Click Here for Main Directory Click Here for Sub-Directory
INTENTIONALLY
PAGE
LEFT BLANK
Internal Services - Sub-Directory
Administrative Support Services 9.2-9.3 Summary Page 9.2 Budget Page 9.3 Risk Management Services 9.4-9.5 Summary Page 9.4 Budget Page 9.5 Workers’ Compensation Reserve Fund 9.6-9.7 Summary Page 9.6 Budget Page 9.7 Employee Group Insurance Fund 9.8-9.9 Summary Page 9.8 Budget Page 9.9 Vehicle Maintenance 9.10-9.11 Summary Page 9.10 Budget Page 9.11 General Government (Internal Service) 9.12-9.13 Summary Page 9.12 Budget Page 9.13 City Clerk 9.14-9.15 Summary Page 9.14 Budget Page 9.15 City Manager 9.16-9.17 Summary Page 9.16 Budget Page 9.17 Facility Maintenance 9.18-9.19 Summary Page 9.18 Budget Page 9.19 Marketing & Public Relations 9.20-9.21 Summary Page 9.20 Budget Page 9.21 Information Technology 9.22-9.23 Summary Page 9.22 Budget Page 9.23 Legal Services 9.24-9.25 Summary Page 9.24 Budget Page 9.25 Public Works Administration 9.26-9.27 Summary Page 9.26 Budget Page 9.27 Operations Central Warehouse 9.28-9.29 Summary Page 9.28 Budget Page 9.29 Public Safety Communications 9.30-9.31 Summary Page 9.30 Budget Page 9.31 Engineering 9.32-9.33 Summary Page 9.32 Budget Page 9.33 Financial Services 9.34-9.35 Summary Page 9.34 Budget Page 9.35 Human Resources 9.36-9.37 Summary Page 9.36 Budget Page 9.37 Utility Customer Service 9.38-9.39 Summary Page 9.38 Budget Page 9.39 Fleet Management 9.40-9.41 Summary Page 9.40 Budget Page 9.41 Public Works Field Services 9.42-9.43 Summary Page 9.42 Budget Page 9.43
9.1
ADMINISTRATIVE SUPPORT SERVICES


The Administrative Support Services Fund has been established to allocate administrative overhead costs to user departments of the City. Financing is provided through billings to user departments based upon applicable cost accounting methods.

9.2 Click Here for Main Directory Click Here for Sub-Directory
Admin Support Services Fund FY 23-24 Prior Year Actual Adopted Year Budget Current Year Revised BUDGET YEAR Projected Budget Projected Budget Projected BudgetProjected Budget FY 21-22 FY 22-23 FY 22-23 FY 23-24 FY 24-25 FY 25-26 FY 26-27 FY 27-28 ESTIMATED RESOURCES: REVENUES: Taxes - - - - - - -Inter-governmental - - 671 - - - -Licenses and Permits 67,860 67,827 40,608 53,978 55,058 56,159 57,282 58,428 Fines & Forfeitures - - - - - - -Charges for Services 299,521 10,491 11,184 18,360 18,727 19,102 19,484 19,873 Interest (139,047) 35,000 47,583 35,000 35,000 35,000 35,000 35,000 Investment Income - - - - - - -Capital Lease Proceeds - - - - - - -Miscellaneous Revenue 137,561 2,500 199,924 2,500 2,500 2,500 2,500 2,500 Subtotal - Revenues 365,896 115,818 299,970 109,838 111,285 112,761 114,266 115,801 OTHER RESOURCES: Debt/Loan Proceeds - - - - - -Restricted Prior Year Reserves 3,821,301 5,385,298 5,385,298 6,668,468 1,233,323 (4,198,474) (10,092,539) (15,280,979) Assigned Prior Year Reserves (Council Projects) - - - - - -Committed Prior Year Reserves - - - - - -Unrestricted Prior Year Reserves - - - - - -TOTAL ESTIMATED RESOURCES 4,187,196 5,501,116 5,685,268 6,778,306 1,344,608 (4,085,713) (9,978,273) (15,165,178) ESTIMATED USES DIRECT COSTS BY FUNCTION: General Government 29,611 285,000 218,020 152,532 110,000 110,000 110,000 110,000 City Treasurer - - - - - - -City Manager 1,528,160 1,753,719 1,516,778 1,790,736 1,835,780 1,873,189 1,878,980 1,919,498 Central Communications 2,483,309 2,979,984 2,569,931 2,966,813 2,966,543 3,012,065 3,028,580 3,098,801 Information Technology 6,128,586 7,932,143 6,091,546 9,449,305 9,904,491 9,786,877 9,528,114 9,671,200 Financial Services 1,020,855 1,532,016 1,205,833 1,692,078 1,605,933 1,648,989 1,659,797 1,702,161 Human Resources 864,441 1,062,745 892,029 1,410,613 1,183,085 1,257,109 1,223,851 1,289,780 City Clerk 294,324 310,604 256,303 323,746 331,331 349,050 347,421 359,561 Facility Maintenance 1,646,533 2,811,592 1,684,521 3,284,905 3,317,964 3,457,622 3,480,996 3,686,182 Legal Services 751,426 1,090,864 911,972 1,238,304 1,134,553 1,142,186 1,141,749 1,150,194 Engineering 2,440,575 3,353,122 2,833,328 3,675,120 3,834,276 3,938,986 3,950,058 4,039,893 Marketing 727,082 1,026,328 826,477 1,085,114 1,163,904 1,141,088 1,147,379 1,166,582 Public Works-Administration 810,095 929,848 835,751 962,180 1,006,256 1,052,928 1,065,036 1,093,950 Operations Central Warehouse 227,843 279,228 257,546 244,367 252,072 262,405 263,597 274,104 Utility Customer Service 2,889,005 3,708,007 3,437,291 3,878,995 4,032,487 4,134,374 4,173,228 4,378,178 TOTAL ESTIMATED COSTS 21,841,846 29,055,200 23,537,327 32,154,808 32,678,675 33,166,868 32,998,786 33,940,084 TRANSFERS: Transfers In 23,312,522 24,800,381 24,800,382 26,942,853 27,481,711 27,522,393 28,072,841 28,634,298 Transfers Out (See detail below) (272,575) (292,578) (279,854) (333,028) (346,118) (362,351) (376,761) (392,375) NET TRANSFERS IN (OUT) 23,039,947 24,507,803 24,520,528 26,609,825 27,135,593 27,160,042 27,696,080 28,241,923 OTHER USES: Reserve for Employee Obligations** - - - - - - -Reserve for Council Special Projects - - - - - - -Reserve for Capital Improvements - - - - - - -Committed for Other PurposesReserve for Other Restricted Purposes 5,385,298 953,719 6,668,468 1,233,323 (4,198,474) (10,092,539) (15,280,979) (20,863,339) Restricted (Reserve for Specific Fund Purposes) - - - - - - -Unassigned (Res for Emergencies & Shortfalls*)TOTAL OTHER USES 5,385,298 953,719 6,668,468 1,233,323 (4,198,474) (10,092,539) (15,280,979) (20,863,339) TOTAL ESTIMATED USES 4,187,196 5,501,116 5,685,268 6,778,306 1,344,608 (4,085,713) (9,978,273) (15,165,178) DETAIL OF TRANSFERS OUT: Administrative Support 30,298 - (20,802) - - - -Fleet Lease Assessment Fee 63,314 60,334 60,334 80,562 83,833 87,257 90,841 94,591 Fleet Management Fund - - - - - - -Insurance Assessment 152,239 183,144 181,943 196,366 206,185 216,494 227,320 238,684 Vehicle Maintenance Fees 26,724 49,100 58,379 56,100 56,100 58,600 58,600 59,100 Field Services - - - - - - -Sales Tax (EPWA) - - - - - - -Arts in Public Places Fund - - - - - - -General Fund - - - - - - -Revenue Bond Funds (EPWA) - - - - - - -Additional Transfers - - - - - - -Total Transfers Out: 272,575 292,578 279,854 333,028 346,118 362,351 376,761 392,375 9.3 Click Here for Main Directory Click Here for Sub-Directory
EDMOND RISK MANAGEMENT
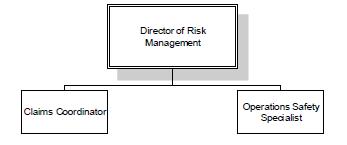


The Risk Management Department has and will continue to help prevent losses for the City. If a loss does occur, Risk Management will continue to look for ways to minimize costs. We continue to focus on the four main areas of greatest expenses for the City: workers compensation, property damage, tort claims, and insurance. Our listed goals explain our plan of action, which provide the means to track and monitor throughout the year.
Mission Statement

To provide a comprehensive risk management program that contributes to the health, safety and protections of employees, citizens and visitors, while also protecting the City’s physical and financial resources.
Organization Chart

Staffing CURRENT YEAR YEAR 2024 YEAR 2025 YEAR 2026 YEAR 2027 YEAR 2028 3-0-0 3-0-0 3-0-0 3-0-0 3-0-0 3-0-0 CONTACT US: Website: https://www.edmondok.gov/157/Risk-Management Phone: 405.349.4371
9.4 Click Here for Main Directory Click Here for Sub-Directory
Risk Management Fund FY 23-24 Prior Year Actual Adopted Year Budget Current Year Revised BUDGET YEAR Projected Budget Projected Budget Projected Budget Projected Budget FY 21-22FY 22-23FY 22-23 FY 23-24 FY 24-25FY 25-26FY 26-27FY 27-28 ESTIMATED RESOURCES: REVENUES: Taxes- - - - - - -Inter-governmental - - - - - - -Licenses and Permits - - - - - - -Fines & Forfeitures - - - - - - -Charges for Services - - - - - - -Interest (56,083) 10,000 15,561 10,000 10,000 10,000 10,000 10,000 Capital Lease Proceeds - - - - - - -Miscellaneous Revenue 198,672 150,000 150,624 150,000 150,000 150,000 150,000 150,000 Subtotal - Revenues 142,589 160,000 166,185 160,000 160,000 160,000 160,000 160,000 OTHER RESOURCES: Debt/Loan Proceeds - - - - - -Restricted Prior Year Reserves 2,052,410 2,311,162 2,311,162 4,807,063 4,126,963 3,426,920 2,782,507 2,195,500 Assigned Prior Year Reserves (Council Projects) - - - - - -Committed Prior Year Reserves - - - - - -Unrestricted Prior Year Reserves - - - - - -TOTAL ESTIMATED RESOURCES 2,194,998 2,471,162 2,477,347 4,967,063 4,286,963 3,586,920 2,942,507 2,355,500 ESTIMATED USES DIRECT COSTS BY FUNCTION: Personnel Services325,711 370,704 354,237 391,322 404,992 413,048 418,767 424,604 Materials & Supplies9,123 26,425 4,766 37,825 16,345 17,808 16,345 16,345 Other Services & Charges Workers Compensation Claims 306,351 824,000 1,960,505 1,001,000 1,051,050 1,082,582 1,115,059 1,148,511 Tort Claims (82,387) 225,000 89,533 225,000 225,000 225,000 225,000 225,000 Vehicle and Other Property Claims 103,753 165,000 136,512 165,000 165,000 165,000 165,000 165,000 Insurance Premiums 1,025,090 1,200,000 1,200,000 1,400,000 1,498,000 1,542,940 1,589,228 1,636,905 Other Charges 85,982 134,950 134,950 134,450 141,450 134,450 134,450 134,450 Capital Outlay - - - - - - -Debt Service - - - - - - -TOTAL ESTIMATED COSTS 1,773,623 2,946,079 3,880,504 3,354,597 3,501,837 3,580,828 3,663,849 3,750,815 TRANSFERS: Transfers In 1,951,053 2,615,873 6,275,873 2,570,607 2,699,136 2,834,095 2,975,802 3,124,587 Transfers Out (See detail below) (61,266) (65,294) (65,654) (56,110) (57,342) (57,680) (58,960) (60,273) NET TRANSFERS IN (OUT) 1,889,787 2,550,579 6,210,219 2,514,497 2,641,794 2,776,415 2,916,842 3,064,314 OTHER USES: Reserve for Employee Obligations - - - - - - -Reserve for Council Special Projects - - - - - - -Reserve for Capital Improvements - - - - - - -Committed for Other PurposesReserve for Other Restricted Purposes 2,311,162 2,075,662 4,807,063 4,126,963 3,426,920 2,782,507 2,195,500 1,668,999 Restricted (Reserve for Specific Fund Purposes)Unassigned (Res for Emergencies & Shortfalls) - - - - - - -TOTAL OTHER USES 2,311,162 2,075,662 4,807,063 4,126,963 3,426,920 2,782,507 2,195,500 1,668,999 TOTAL ESTIMATED USES 2,194,998 2,471,162 2,477,347 4,967,063 4,286,963 3,586,920 2,942,507 2,355,500 DETAIL OF TRANSFERS OUT: Administrative Support 47,254 58,924 58,924 49,089 50,071 50,145 51,148 52,171 Fleet Lease Assessment Fee 2,272 2,590 2,590 2,709 2,834 2,966 3,104 3,249 Fleet Management Fund - - - - - - -Insurance Assessment 11,470 1,980 1,980 2,512 2,637 2,769 2,908 3,053 Vehicle Maintenance Fees 271 1,800 2,160 1,800 1,800 1,800 1,800 1,800 Field Services - - - - - - -Sales Tax (EPWA) - - - - - - -Arts in Public Places Fund - - - - - - -General Fund - - - - - - -Revenue Bond Funds (EPWA) - - - - - - -Additional Transfers - - - - - - -Total Transfers Out: 61,266 65,294 65,654 56,110 57,342 57,680 58,960 60,273 9.5 Click Here for Main Directory Click Here for Sub-Directory
WORKERS’ COMPENSATION RESERVE FUND
The Risk Management Department operates a self-insured Workers’ Compensation program. To continue operating the program, State of Oklahoma Insurance Commission is requiring the City of Edmond to either post a security deposit or make an appropriation into a segregated workers’ compensation fund. The amount of the appropriation must be at least the average amount of workers’ compensation losses paid during the preceding three years. Based upon the latest actuarial study, our required reserves should be $1,240,000.


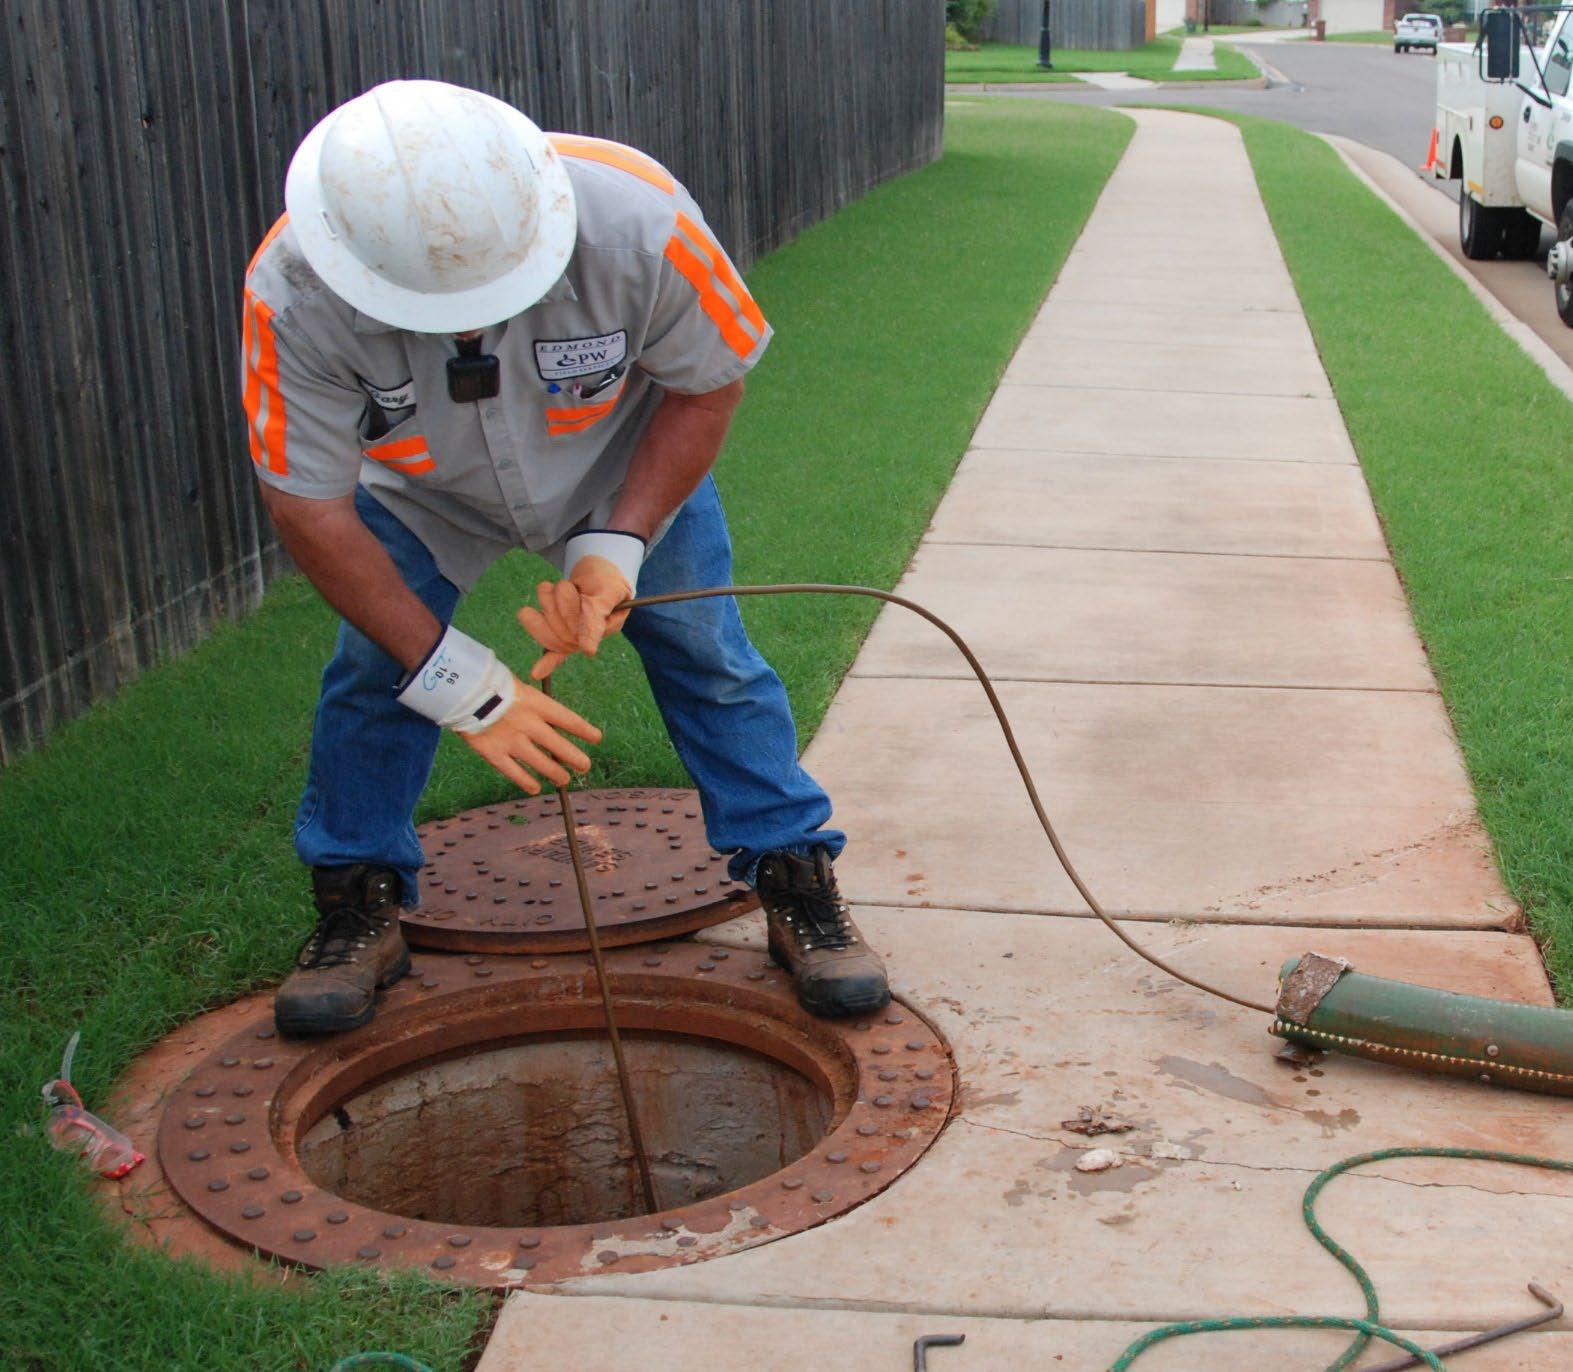
9.6 Click Here
Main Directory Click Here for Sub-Directory
for
Workers' Compensation Reserve Fund FY 23-24 Prior Year Actual Adopted Year Budget Current Year Revised BUDGET YEAR Projected Budget Projected Budget Projected Budget Projected Budget FY 21-22FY 22-23FY 22-23 FY 23-24 FY 24-25FY 25-26FY 26-27FY 27-28 ESTIMATED RESOURCES: REVENUES: Charges for Services- - - - - - -Interest (39,620) 25,000 15,137 25,000 25,000 25,000 25,000 25,000 Capital Lease Proceeds - - - - - - -Miscellaneous Revenue - - - - - - -Subtotal - Revenues (39,620) 25,000 15,137 25,000 25,000 25,000 25,000 25,000 OTHER RESOURCES: Debt/Loan Proceeds - - - - - -Restricted Prior Year Reserves 1,796,581 1,756,802 1,756,802 1,771,779 1,796,779 1,821,779 1,846,779 1,871,779 Assigned Prior Year Reserves (Council Projects) - - - - - -Committed Prior Year Reserves - - - - - -Unrestricted Prior Year Reserves - - - - - -TOTAL ESTIMATED RESOURCES 1,756,961 1,781,802 1,771,939 1,796,779 1,821,779 1,846,779 1,871,779 1,896,779 ESTIMATED USES DIRECT COSTS BY FUNCTION: Personnel Services- - - - - - -Materials & Supplies - - - - - - -Other Services & Charges Workers Compensation Claims - - - - - - -Tort Claims - - - - - - -Vehicle and Other Property Claims - - - - - - -Insurance Premiums - - - - - - -Other Charges 158 - 160 - - - -Capital Outlay - - - - - - -Debt Service - - - - - - -TOTAL ESTIMATED COSTS 158 - 160 - - - -TRANSFERS: Transfers In - - - - - - -Transfers Out (See detail below) - - - - - - -NET TRANSFERS IN (OUT) - - - - - - -OTHER USES: Reserve for Employee Obligations** - - - - - - -Reserve for Council Special Projects - - - - - - -Reserve for Capital Improvements - - - - - - -Committed for Other PurposesReserve for Other Restricted Purposes 1,756,802 1,781,802 1,771,779 1,796,779 1,821,779 1,846,779 1,871,779 1,896,779 Restricted (Reserve for Specific Fund Purposes) - - - - - - -Unassigned (Res for Emergencies & Shortfalls*) - - - - - - -TOTAL OTHER USES 1,756,802 1,781,802 1,771,779 1,796,779 1,821,779 1,846,779 1,871,779 1,896,779 TOTAL ESTIMATED USES 1,756,961 1,781,802 1,771,939 1,796,779 1,821,779 1,846,779 1,871,779 1,896,779 DETAIL OF TRANSFERS OUT: Administrative Support - - - - - - -Fleet Lease Assessment Fee - - - - - - -Fleet Management Fund - - - - - - -Insurance Assessment - - - - - - -Vehicle Maintenance Fees - - - - - - -Field Services - - - - - - -Sales Tax (EPWA) - - - - - - -Arts in Public Places Fund - - - - - - -General Fund - - - - - - -Revenue Bond Funds (EPWA) - - - - - - -Additional Transfers - - - - - - -Total Transfers Out: - - - - - - -9.7 Click Here for Main Directory Click Here for Sub-Directory
HUMAN RESOURCES/ EMPLOYEE GROUP INSURANCE FUND


The Human Resources (HR) Department provides high quality, trustworthy service. We strive to attract, develop, motivate and retain a productive and diverse workforce within an inclusive work environment by:
• Attracting and retaining a quality workforce by providing a competitive benefits package along with comprehensive programs to assist and promote employee well-being;
• Providing friendly trustworthy service to all internal and external customers;
• Providing sustainable benefit products and services responsive to and valued by employees.
Group Health, Dental, Vision, FSA, Longterm Disability, Life Insurance and other Voluntary Plans/Benefits

DID YOU KNOW? Average total lives on the City’s group health insurance plan 1,960.
DIVISIONS
Employee Health Clinic Employee Health ` Benefits/Wellness
The clinic provides free primary care services to include, lab draws, prescriptions and personal health assessments. CONTACT Group Insurance - Ammy Butler Ph (405) 359-4557 Employee Health Clinic –Sherry Altenburg Ph (405) 359-4634 9.8 Click Here for Main Directory Click Here for Sub-Directory
Employee Group Insurance Fund FY 23-24 PriorYear Actual Adopted Year Budget CurrentYear Revised BUDGET YEAR Projected Budget Projected Budget Projected Budget Projected Budget FY 21-22 FY 22-23 FY 22-23 FY 23-24 FY 24-25 FY 25-26 FY 26-27 FY 27-28 ESTIMATED RESOURCES: REVENUES: Inter-governmental - - - - - - -Charges forServices 12,265,916 13,032,283 13,513,793 12,929,560 13,317,447 13,716,971 14,128,480 14,552,334 Interest (92,378) 30,000 35,958 30,000 30,000 30,000 30,000 30,000 Miscellaneous Revenue 675,747 692,553 694,011 720,195 751,458 788,262 800,950 869,227 Subtotal -Revenues 12,849,285 13,754,836 14,243,762 13,679,755 14,098,905 14,535,233 14,959,430 15,451,561 OTHER RESOURCES: Debt/LoanProceeds - - - - - -Restricted Prior Year Reserves 4,724,091 3,864,023 3,864,023 5,782,325 3,969,467 1,562,850 (1,474,074) (5,235,492) Assigned Prior YearReserves (CouncilProjects) - - - - - -Committed PriorYear Reserves - - - - - -Unrestricted Prior YearReserves - - - - - -TOTAL ESTIMATED RESOURCES 17,573,377 17,618,859 18,107,785 19,462,080 18,068,372 16,098,083 13,485,356 10,216,069 ESTIMATED USES DIRECT COSTS BY FUNCTION: PersonnelServices - - - - - - -Materials & Supplies 1,179 500 - 500 500 500 500 500 Other Services & Charges: Claims 11,358,911 10,985,074 10,699,367 12,765,199 13,602,232 14,497,114 15,454,049 16,477,561 Insurance Premiums 1,080,458 1,326,451 1,053,743 1,432,217 1,546,437 1,669,787 1,836,766 2,020,443 HealthClinic 667,227 692,553 692,553 720,195 751,458 788,262 800,950 869,227 Wellness Program 19,970 20,000 55,352 - 20,000 20,000 20,000 20,000 OtherCharges 575,534 549,455 25,000 561,757 571,895 583,475 595,303 607,384 CapitalOutlay - - - - - - -DebtService - - - - - - -TOTAL ESTIMATED COSTS 13,703,279 13,574,033 12,526,015 15,479,868 16,492,522 17,559,138 18,707,568 19,995,115 TRANSFERS: Transfers In - - 208,428 - - - -Transfers Out(See detailbelow) (6,074) (7,873) (7,873) (12,745) (13,000) (13,019) (13,280) (13,545) NET TRANSFERS IN (OUT) (6,074) (7,873) 200,555 (12,745) (13,000) (13,019) (13,280) (13,545) OTHER USES: Reserve forEmployee Obligations** - - - - - - -Reserve forCouncilSpecialProjects - - - - - - -Reserve forCapitalImprovements - - - - - - -Committed forOther PurposesReserve forOther Restricted Purposes 3,864,023 4,036,953 5,782,325 3,969,467 1,562,850 (1,474,074) (5,235,492) (9,792,591) Restricted (Reservefor Specific Fund Purposes) - - - - - - -Unassigned (Res for Emergencies & Shortfalls*) - - - - - - -TOTAL OTHER USES 3,864,023 4,036,953 5,782,325 3,969,467 1,562,850 (1,474,074) (5,235,492) (9,792,591) TOTAL ESTIMATED USES 17,573,377 17,618,859 18,107,785 19,462,080 18,068,372 16,098,083 13,485,356 10,216,069 DETAIL OF TRANSFERS OUT: Administrative Support 6,074 7,873 7,873 12,745 13,000 13,019 13,280 13,545 FleetLease AssessmentFee - - - - - - -FleetManagementFund - - - - - - -Insurance Assessment - - - - - - -Vehicle MaintenanceFees - - - - - - -Field Services - - - - - - -Sales Tax (EPWA) - - - - - - -Arts inPublic Places Fund - - - - - - -GeneralFund - - - - - - -Revenue Bond Funds (EPWA) - - - - - - -AdditionalTransfers - - - - - - -TotalTransfers Out: 6,074 7,873 7,873 12,745 13,000 13,019 13,280 13,545 9.9 Click Here for Main Directory Click Here for Sub-Directory
EDMOND Vehicle Maintenance

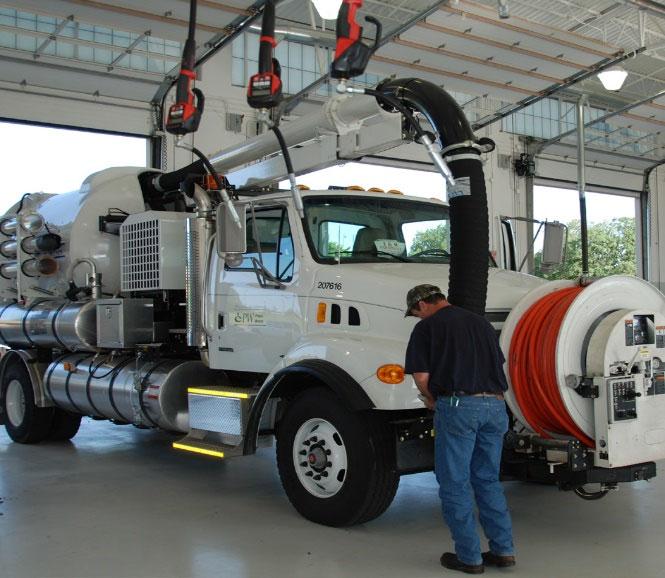


Vehicle Maintenance is an ASE Certified Blue Seal Facility. Vehicle maintenance delivers high quality, cost effective best in class trustworthy service to our customers. The department provides repair and preventative maintenance support services for the City’s approximately 600 vehicles and equipment. Employees are responsible for maintaining and repairing vehicles/ equipment, ordering and installing parts, tire repair and tire replacement. The department also provides “on call” mechanic available when the shop is not open who provides emergency repair service for any type of vehicle/equipment.
Organization Chart
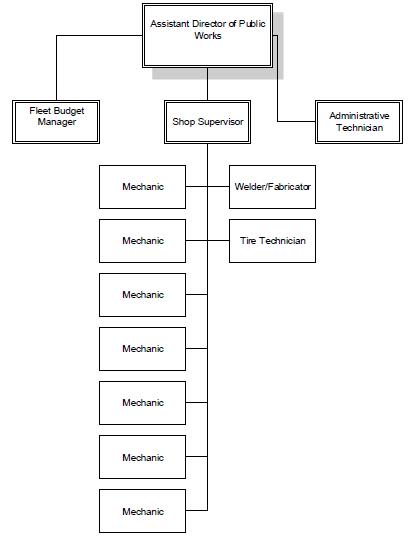
Staffing CURRENT YEAR YEAR 2024 YEAR 2025 YEAR 2026 YEAR 2027 YEAR 2028 11-0-0 11-0-0 11-0-0 11-0-0 11-0-0 11-0-0 Contact Us Bobby Masterson: (405) 216-7785 bobby.masterson@edmondok.gov Rick Everett: (405) 216-7681 rick.everett @edmondok.gov
9.10 Click Here for Main Directory Click Here for Sub-Directory
Vehicle Maintenance Fund FY 23-24 Prior Year Actual Adopted Year Budget Current Year Revised BUDGET YEAR Projected Budget Projected Budget Projected Budget Projected Budget FY 21-22FY 22-23FY 22-23 FY 23-24 FY 24-25FY 25-26FY 26-27FY 27-28 ESTIMATED RESOURCES: REVENUES: Inter-governmental- - - - - - -Charges for Services 1,244,576 1,569,999 1,268,998 1,469,397 1,513,479 1,558,883 1,605,650 1,653,819 Interest 276 4,869 11 - - - -Capital Lease Proceeds - - - - - - -Miscellaneous Revenue 1,171 8,200 338 1,281 1,281 1,281 1,281 1,281 Subtotal - Revenues 1,246,023 1,583,068 1,269,347 1,470,678 1,514,760 1,560,164 1,606,931 1,655,100 OTHER RESOURCES: Debt/Loan Proceeds - - - - - -Restricted Prior Year Reserves 196,637 - - - - - -Assigned Prior Year Reserves (Council Projects) - - - - - -Committed Prior Year Reserves - - - - - -Unrestricted Prior Year Reserves 141,738 141,738 62,771 164,807 304,252 493,228 543,328 TOTAL ESTIMATED RESOURCES 1,442,660 1,724,806 1,411,085 1,533,449 1,679,567 1,864,416 2,100,159 2,198,428 ESTIMATED USES DIRECT COSTS BY FUNCTION: Personnel Services1,036,955 1,147,577 1,102,153 1,184,821 1,197,749 1,207,120 1,394,573 1,351,273 Materials & Supplies1,139,232 1,246,111 1,158,923 1,283,319 1,320,871 1,359,552 1,399,398 1,440,444 Fuel & Lube Expense989,489 1,687,631 1,077,109 1,300,978 1,340,007 1,380,208 1,421,614 1,464,262 Other Services & Charges534,801 482,385 614,521 635,428 641,821 648,452 655,339 662,488 Capital Outlay - - - - - - -Debt Service - - - - - - -TOTAL ESTIMATED COSTS 3,700,477 4,563,704 3,952,706 4,404,546 4,500,448 4,595,332 4,870,924 4,918,467 TRANSFERS: Transfers In 2,593,357 2,964,488 2,817,419 3,293,880 3,388,794 3,489,086 3,584,912 3,682,433 Transfers Out (See detail below) (193,801) (213,027) (213,027) (257,977) (263,661) (264,942) (270,818) (276,842) NET TRANSFERS IN (OUT) 2,399,555 2,751,461 2,604,392 3,035,903 3,125,133 3,224,144 3,314,094 3,405,591 OTHER USES: Reserve for Employee Obligations** - - - - - - -Reserve for Council Special Projects - - - - - - -Reserve for Capital Improvements - - - - - - -Committed for Other PurposesReserve for Other Restricted Purposes - - - - - - -Restricted (Reserve for Specific Fund Purposes) - - - - - - -Unassigned (Res for Emergencies & Shortfalls*) 141,738 (87,437) 62,771 164,807 304,252 493,228 543,328 685,552 TOTAL OTHER USES 141,738 (87,437) 62,771 164,807 304,252 493,228 543,328 685,552 TOTAL ESTIMATED USES 1,442,660 1,724,806 1,411,085 1,533,449 1,679,567 1,864,416 2,100,159 2,198,428 DETAIL OF TRANSFERS OUT: Administrative Support 166,203 189,310 189,310 240,497 245,307 245,670 250,583 255,595 Fleet Lease Assessment Fee - - - - - - -Fleet Management Fund - - - - - - -Insurance Assessment 27,598 23,717 23,717 17,480 18,354 19,272 20,235 21,247 Vehicle Maintenance Fees - - - - - - -Field Services - - - - - - -Sales Tax (EPWA) - - - - - - -Arts in Public Places Fund - - - - - - -General Fund - - - - - - -Revenue Bond Funds (EPWA) - - - - - - -Additional Transfers - - - - - - -Total Transfers Out: 193,801 213,027 213,027 257,977 263,661 264,942 270,818 276,842 9.11 Click Here for Main Directory Click Here for Sub-Directory
GENERAL GOVERNMENT (INTERNAL SERVICE)


This department details the general, non-specific operating costs for the Administrative Support Service Departments listed on the following pages.

9.12 Click Here for Main Directory Click Here for Sub-Directory
DEPARTMENT: General Government FUND: ADMIN SUPPORT SERVICES FY 23-24 Prior Year Actual Adopted Year Budget Current Year Revised BUDGET YEAR Projected Budget Projected Budget Projected Budget Projected Budget FY 21-22FY 22-23FY 22-23 FY 23-24 FY 24-25FY 25-26FY 26-27FY 27-28 ESTIMATED RESOURCES: REVENUES: Taxes- - - - - - -Inter-governmental - - 671 - - - -Licenses and Permits 67,860 67,827 40,608 53,978 55,058 56,159 57,282 58,428 Fines & Forfeitures - - - - - - -Charges for Services 299,521 10,491 11,184 18,360 18,727 19,102 19,484 19,873 Interest (139,047) 35,000 47,583 35,000 35,000 35,000 35,000 35,000 Investment Income - - - - - - -Capital Lease Proceeds - - - - - - -Miscellaneous Revenue 135,836 2,500 199,924 2,500 2,500 2,500 2,50 0 2,500 Subtotal - Revenues 364,171 115,818 299,970 109,838 111,285 112,761 114,266 115,801 OTHER RESOURCES: Debt/Loan Proceeds - - - - - -Restricted Prior Year Reserves (20,411,126) - - 21,477,163 44,803,983 68,632,618 92,432,237 116,709,297 Assigned Prior Year Reserves (Council Projects) - - - - - -Committed Prior Year Reserves - - - - - -Unrestricted Prior Year Reserves - - - - - -TOTAL ESTIMATED RESOURCES (20,046,955) 115,818 299,970 21,587,001 44,915,268 68,745,379 92,546,503 116,825,098 ESTIMATED USES DIRECT COSTS BY FUNCTION: Personnel Services- - - 42,532 - - -Materials & Supplies 4,265 12,800 1,806 12,800 12,800 12,800 12,800 12,800 Other Services & Charges 25,346 230,200 216,215 55,200 55,200 55,200 55,200 55,200 Capital Outlay - 42,000 - 42,000 42,000 42,000 42,000 42,000 Debt Service - - - - - - -TOTAL ESTIMATED COSTS 29,611 285,000 218,020 152,532 110,000 110,000 110,000 110,000 DETAIL OF TRANSFERS OUT: Administrative Support (3,235,956) (3,405,168) (3,405,168) (3,573,339) (3,654,361) (3,725,535) (3,800,047) (3,876,047) Fleet Lease Assessment Fee - - - - - - -Fleet Management Fund - - - - - - -Insurance Assessment - - - - - - -Vehicle Maintenance Fees - - - - - - -Field Services - - - - - - -Sales Tax (EPWA) - - - - - - -Arts in Public Places Fund - - - - - - -General Fund - - - - - - -Revenue Bond Funds (EPWA) - - - - - - -Additional Transfers - - - - - - -Total Transfers Out: (3,235,956) (3,405,168) (3,405,168) (3,573,339) (3,654,361) (3,725,535) (3,800,047) (3,876,047) DEPARTMENT BUDGET SUMMARY 9.13 Click Here for Main Directory Click Here for Sub-Directory
EDMOND City Clerk


The City Clerk's Office maintains official city records, posts legal notices, handles a variety of permits and licenses, and otherwise supports City of Edmond elected officials and staff.
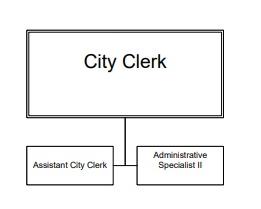
DID YOU KNOW?
The City Clerk's Office maintains official burial records for Gracelawn Cemetery.
We keep a variety of historical City of Edmond records, including handwritten minutes from the 1890s.
We are responsible for coordinating non-police related open records requests, providing a variety of information and records to the public.
Organization Chart
Staffing CURRENT YEAR YEAR 2024 YEAR 2025 YEAR 2026 YEAR 2027 YEAR 2028 3-0-0 3-0-0 3-0-0 3-0-0 3-0-0 3-0-0 Contact Us Phone: (405) 359-4555 Website: https://www.edmondok.gov/155/City-Clerk
9.14 Click Here for Main Directory Click Here for Sub-Directory
DEPARTMENT: City Clerk FUND: ADMIN SUPPORT SERVICES FY 23-24 Prior Year Actual Adopted Year Budget Current Year Revised BUDGET YEAR Projected Budget Projected Budget Projected Budget Projected Budget FY 21-22FY 22-23FY 22-23 FY 23-24 FY 24-25FY 25-26FY 26-27FY 27-28 ESTIMATED RESOURCES: REVENUES: Taxes- - - - - - -Inter-governmental - - - - - - -Licenses and Permits - - - - - - -Fines & Forfeitures - - - - - - -Charges for Services - - - - - - -Interest - - - - - - -Investment Income - - - - - - -Capital Lease Proceeds - - - - - - -Miscellaneous Revenue - - - - - - -Subtotal - Revenues - - - - - - -OTHER RESOURCES: Debt/Loan Proceeds - - - - - -Restricted Prior Year Reserves 294,324 - - (256,303) (464,278) (677,435) (905,855) (1,130,137) Assigned Prior Year Reserves (Council Projects) - - - - - -Committed Prior Year Reserves - - - - - -Unrestricted Prior Year Reserves - - - - - -TOTAL ESTIMATED RESOURCES 294,324 - - (256,303) (464,278) (677,435) (905,855) (1,130,137) ESTIMATED USES DIRECT COSTS BY FUNCTION: Personnel Services241,083 219,504 206,333 237,146 247,531 258,900 260,321 271,911 Materials & Supplies 5,272 8,900 4,107 9,400 5,900 9,600 5,900 5,900 Other Services & Charges 47,091 82,200 45,864 77,200 77,900 80,550 81,200 81,750 Capital Outlay - - - - - - -Debt Service 878 - - - - - -TOTAL ESTIMATED COSTS 294,324 310,604 256,303 323,746 331,331 349,050 347,421 359,561 TRANSFERS: Transfers In - - - - - - -Transfers Out (See detail below) - - - 115,771 118,174 120,630 123,139 125,703 NET TRANSFERS IN (OUT) - - - 115,771 118,174 120,630 123,139 125,703 OTHER USES: Reserve for Employee Obligations - - - - - - -Reserve for Council Special Projects - - - - - - -Reserve for Capital Improvements - - - - - -Committed for Other Purposes Restricted (Reserve for Other Purposes) - - - - - -Restricted (Reserve for Specific Fund Purposes) (310,604) (256,303) (464,278) (677,435) (905,855) (1,130,137) (1,363,995) Unassigned (Res for Emergencies & Shortfalls*) TOTAL OTHER USES - (310,604)(256,303) (464,278) (677,435) (905,855) (1,130,137) (1,363,995) TOTAL ESTIMATED USES 294,324 - - (256,303) (464,278) (677,435) (905,855) (1,130,137) DETAIL OF TRANSFERS OUT: Administrative Support 111,918 110,635 110,635 112,848 115,105 117,407 119,755 122,150 Fleet Lease Assessment Fee - - - - - - -Fleet Management Fund - - - - - - -Insurance Assessment 1,904 2,044 2,044 2,923 3,069 3,223 3,384 3,553 Vehicle Maintenance Fees - - - - - - -Field Services - - - - - - -Sales Tax (EPWA) - - - - - - -Arts in Public Places Fund - - - - - - -General Fund - - - - - - -Revenue Bond Funds (EPWA) - - - - - - -Additional Transfers - - - - - - -Total Transfers Out: 113,822 112,679 112,679 115,771 118,174 120,630 123,139 125,703 DEPARTMENT BUDGET SUMMARY 9.15 Click Here for Main Directory Click Here for Sub-Directory
EDMOND City Manager
The City Manager’s office has primary responsibility for both the day-to-day administration of Edmond’s city government, including all city departments and operations, and also the carrying out of City Council policies and directives.
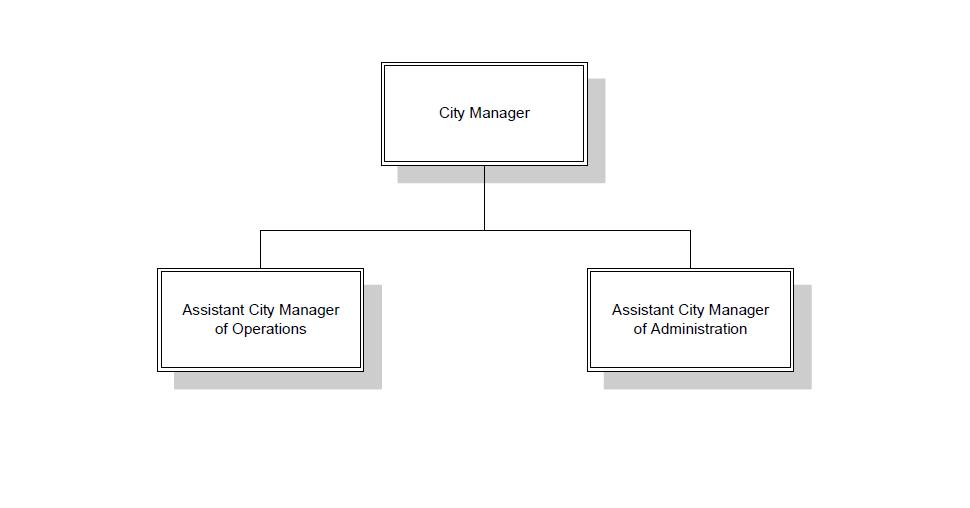
STATEMENT OF VALUES
• The City of Edmond exists only to provide services, and our internal mission of Trustworthy Service Through Continuous Improvement reflects our constant dedication to this reality.
• We are committed to our thoughts, words, and actions reflecting our eight core values.
• We intend to lead by example in the development of our organization to provide quality public services while balancing cost effectiveness.
DID YOU KNOW?
Our form of government, which is the Council-Manager form, was approved almost 100 years ago in 1925.
Organization Chart


Staffing C URRENT YEAR YEAR 202 4 YEAR 202 5 YEAR 202 6 YEAR 202 7 YEAR 202 8 8-1-0 8-1-0 8-1-0 8-1-0 8-1-0 8-1-0 Contact Us City Manager - Scot Rigby P: 405-359-4500 Scot.Rigby@edmondok.gov
9.16 Click Here for Main Directory Click Here for Sub-Directory
DEPARTMENT: City Manager & ACM of Operations FUND: ADMIN SUPPORT SERVICES FY 23-24 Prior Year Actual Adopted Year Budget Current Year Revised BUDGET YEAR Projected Budget Projected Budget Projected Budget Projected Budget FY 21-22FY 22-23FY 22-23 FY 23-24 FY 24-25FY 25-26FY 26-27FY 27-28 DIRECT COSTS BY FUNCTION: Personnel Services1,148,301 1,387,221 1,206,208 1,430,688 1,478,382 1,517,041 1,521,332 1,561,850 Materials & Supplies8,772 19,135 6,882 19,835 12,935 11,435 12,935 12,935 Other Services & Charges 371,087 347,363 303,688 340,213 344,463 344,713 344,713 344,713 Capital Outlay - - - - - - -Debt Service - - - - - - -TOTAL ESTIMATED COSTS 1,528,160 1,753,719 1,516,778 1,790,736 1,835,780 1,873,189 1,878,980 1,919,498 DETAIL OF TRANSFERS OUT: Administrative Support 152,362 128,479 107,677 131,049 133,669 136,343 139,070 141,851 Fleet Lease Assessment Fee - - - - - - -Fleet Management Fund - - - - - - -Insurance Assessment 6,258 7,008 5,807 7,250 7,613 7,994 8,394 8,813 Vehicle Maintenance Fees - - - - - - -Field Services - - - - - - -Sales Tax (EPWA) - - - - - - -Arts in Public Places Fund - - - - - - -General Fund - - - - - - -Revenue Bond Funds (EPWA) - - - - - - -Additional Transfers - - - - - - -Total Transfers Out: 158,620 135,487 113,484 138,299 141,282 144,337 147,464 150,664 DEPARTMENT BUDGET SUMMARY 9.17 Click Here for Main Directory Click Here for Sub-Directory
EDMOND Facility Maintenance
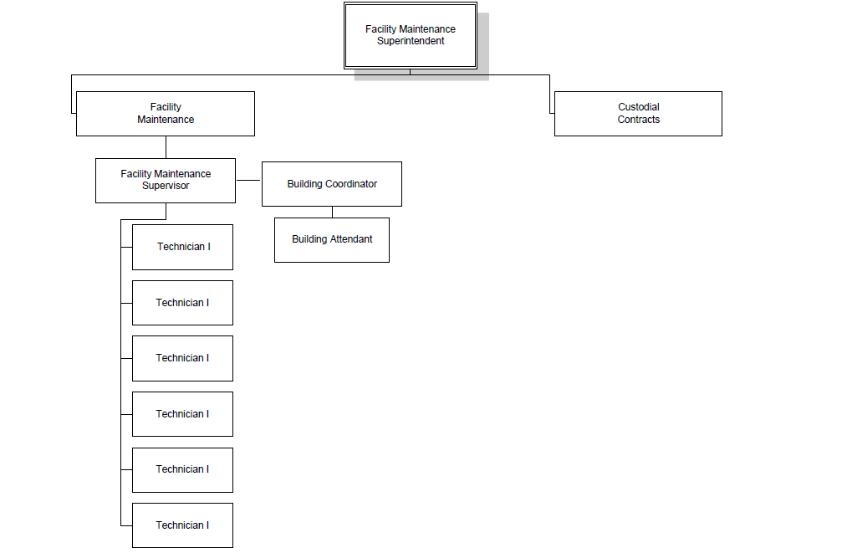
We deliver high quality, cost effective, best in class trustworthy service to our customers. The department provides a clean, safe, quality working environment for City of Edmond employees and the public by maintaining, repairing, cleaning and improving City facilities. The department tracks processes and procedures through use of Cityworks for asset management and timely response to the needs of internal and external customers. This encompasses 60 different City of Edmond divisions and over 600,000 square feet of occupied working space. The Facility Maintenance Department’s service is to ensure a safe and comfortable working environment for our customers.
DID YOU KNOW?
Facility Maintenance provides 24/7 day support and service.


We take care of over 600,000 square feet of occupied space throughout the City.
Staffing CURRENT YEAR YEAR 2024 YEAR 2025 YEAR 2026 YEAR 2027 YEAR 2028 10-0-0 10-0-0 11-0-0 11-0-0 12-0-0 12-0-0 Contact Us Bobby Masterson: (405) 216-7730 Main Number: (405) 216-7770 https://www.edmondok.gov/589/Public-Works
Organization Chart
9.18 Click Here for Main Directory Click Here for Sub-Directory
DEPARTMENT: Facility Maintenance FUND: ADMIN SUPPORT SERVICES FY 23-24 Prior Year Actual Adopted Year Budget Current Year Revised BUDGET YEAR Projected Budget Projected Budget Projected Budget Projected Budget FY 21-22FY 22-23FY 22-23 FY 23-24 FY 24-25FY 25-26FY 26-27FY 27-28 DIRECT COSTS BY FUNCTION: Personnel Services563,491 663,574 611,494 842,595 885,231 915,712 930,936 963,932 Materials & Supplies 181,367 283,768 234,171 284,249 293,703 294,000 300,350 308,350 Other Services & Charges 788,133 1,548,250 821,264 1,794,450 1,839,030 1,947,910 1,949,710 2,063,900 Capital Outlay 113,541 316,000 17,592 363,611 300,000 300,000 300,000 350,000 Debt Service - - - - - - -TOTAL ESTIMATED COSTS 1,646,533 2,811,592 1,684,521 3,284,905 3,317,964 3,457,622 3,480,996 3,686,182 DETAIL OF TRANSFERS OUT: Administrative Support 277,111 288,504 288,504 395,540 413,008 419,355 427,742 436,297 Fleet Lease Assessment Fee 27,451 24,168 24,168 28,105 29,439 30,839 32,310 33,854 Fleet Management Fund - - - - - - -Insurance Assessment 39,465 49,263 49,263 47,163 49,522 51,998 54,598 57,327 Vehicle Maintenance Fees 7,740 23,000 26,400 25,000 25,000 27,500 27,500 28,000 Field Services - - - - - - -Sales Tax (EPWA) - - - - - - -Arts in Public Places Fund - - - - - - -General Fund - - - - - - -Revenue Bond Funds (EPWA) - - - - - - -Additional Transfers - - - - - - -Total Transfers Out: 351,767 384,935 388,335 495,808 516,969 529,692 542,150 555,478
9.19 Click Here for Main Directory Click Here for Sub-Directory
DEPARTMENT BUDGET SUMMARY
EDMOND Marketing
The Marketing/Public Relations Department has several different functions, including media relations, public information, marketing and communications, design and maintenance of the website, graphic design, social media, photo/video production and television programming for the government access channel, Edmond Life TV, internal and external special event coordination. Our mission statement is “Providing timely, accurate information through professional, creative communication.” Our purpose is to keep our citizen/customers informed about city issues, programs, services, activities, accomplishments and plans.


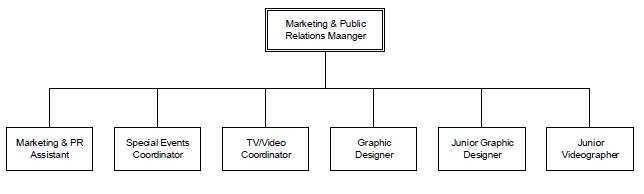

DID YOU KNOW?
As of April 2023:
The main City of Edmond social media accounts have more than 113,000 followers across seven platforms.
Our department has won 35 regional and national awards for excellence in communications.
With the launch of City source Edmond newsroom-style web page, residents are visiting on average, more than 6,000 times a month.
Organization Chart
Staffing CURRENT YEAR YEAR 2024 YEAR 2025 YEAR 2026 YEAR 2027 YEAR 2028 7-0-0 7-0-0 7-0-0 7-0-0 7-0-0 7-0-0 Contact Us Phone Number: (405) 359-4565 Website: https://www.edmondok.com/327/MarketingPublic-Relations
9.20 Click Here for Main Directory Click Here for Sub-Directory
DEPARTMENT: Marketing FUND: ADMIN SUPPORT SERVICES FY 23-24 Prior Year Actual Adopted Year Budget Current Year Revised BUDGET YEAR Projected Budget Projected Budget Projected Budget Projected Budget FY 21-22FY 22-23FY 22-23 FY 23-24 FY 24-25FY 25-26FY 26-27FY 27-28 DIRECT COSTS BY FUNCTION: Personnel Services524,553 638,178 611,890 756,964 793,754 819,938 824,229 846,432 Materials & Supplies 21,847 28,750 10,684 38,750 30,750 31,750 33,750 30,750 Other Services & Charges 172,487 339,400 203,904 279,400 329,400 279,400 279,400 279,400 Capital Outlay 8,195 20,000 - 10,000 10,000 10,000 10,000 10,000 Debt Service - - - - - - -TOTAL ESTIMATED COSTS 727,082 1,026,328 826,477 1,085,114 1,163,904 1,141,088 1,147,379 1,166,582 DETAIL OF TRANSFERS OUT: Administrative Support 60,263 61,048 61047.96 62,269 63,514 64,785 66,080 67,402 Fleet Lease Assessment Fee - - - - - - -Fleet Management Fund - - - - - - -Insurance Assessment 4,575 4,610 4,610 5,927 6,223 6,534 6,861 7,204 Vehicle Maintenance Fees - - - - - - -Field Services - - - - - - -Sales Tax (EPWA) - - - - - - -Arts in Public Places Fund - - - - - - -General Fund - - - - - - -Revenue Bond Funds (EPWA) - - - - - - -Additional Transfers - - - - - - -Total Transfers Out: 64,838 65,658 65,658 68,196 69,737 71,319 72,941 74,606 DEPARTMENT BUDGET SUMMARY 9.21 Click Here for Main Directory Click Here for Sub-Directory
EDMOND Information Technology

The Information Technology (IT) department is responsible for implementing technology solutions that enable departments throughout the city to provide efficient, high-quality services to the citizens of Edmond. The IT Department is comprised of three teams. These teams are IT Project Management, Infrastructure Support and Application Support which includes Geographic Information Systems (GIS).
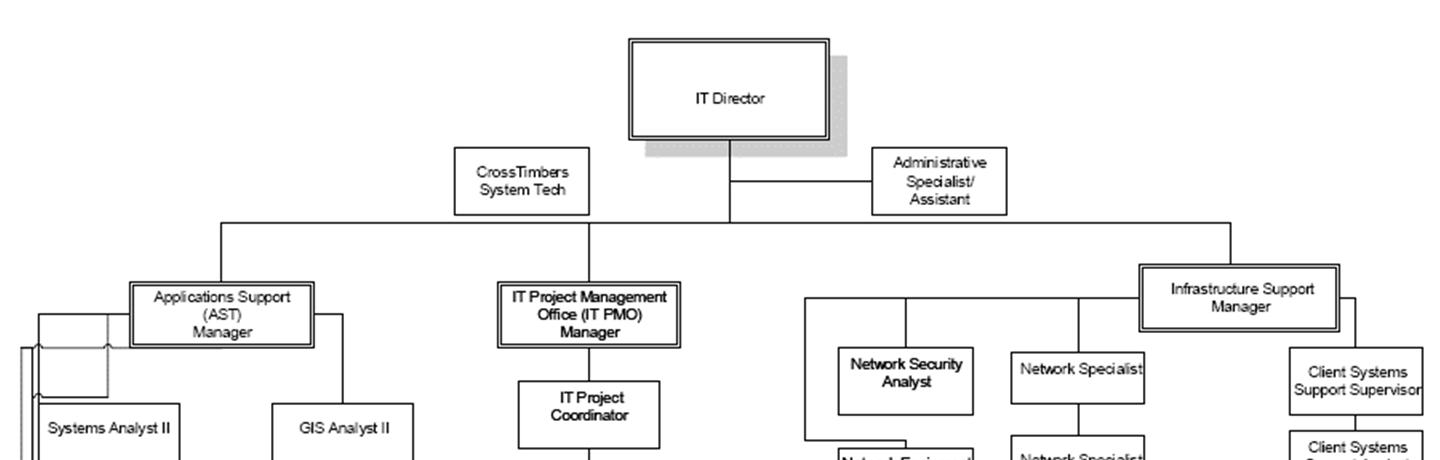
Together, these teams support the City's underlying network, technology projects and enterprise applications, and hardware with over 825 users and their associated desktop computers, laptops, and mobile devices.
DID YOU KNOW?
IT Supports over 830 users with 580+ PCs, 350+ Laptops & Tablets, 250+ monitored network devices, 250+ servers and 70 miles of Fiber.

Organization Chart
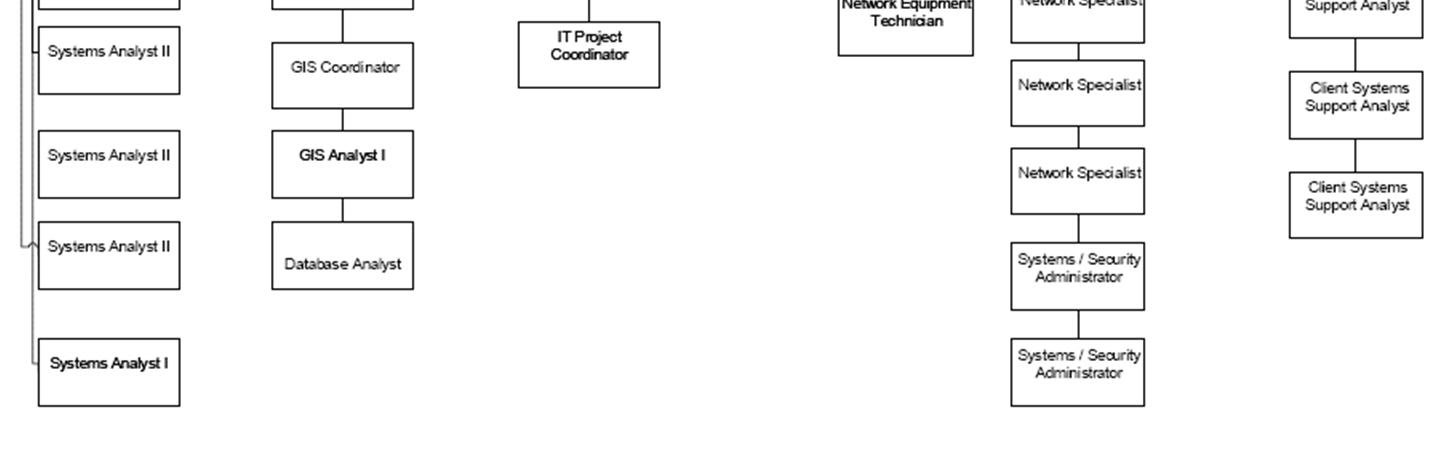
Staffing CURRENT YEAR YEAR 2024 YEAR 2025 YEAR 2026 YEAR 2027 YEAR 2028 25-0-0 29-0-0 32-0-0 35-0-0 35-0-0 35-0-0 Contact Us Main Number (405) 359-636 Email: Contact.IT@edmondok.gov
9.22 Click Here for Main Directory Click Here for Sub-Directory
DEPARTMENT BUDGET SUMMARY
DEPARTMENT: Information Technology FUND: ADMIN SUPPORT SERVICES FY 23-24 Prior Year Actual Adopted Year Budget Current Year Revised BUDGET YEAR Projected Budget Projected Budget Projected Budget Projected Budget FY 21-22FY 22-23FY 22-23 FY 23-24 FY 24-25FY 25-26FY 26-27FY 27-28 DIRECT COSTS BY FUNCTION: Personnel Services2,312,748 2,963,329 2,399,899 3,324,990 3,444,873 3,540,093 3,553,446 3,645,590 Materials & Supplies146,417 419,150 331,216 399,150 399,150 399,150 399,150 399,150 Other Services & Charges 2,914,151 3,949,664 3,357,731 4,450,165 4,635,468 4,782,634 4,950,518 5,001,460 Capital Outlay 755,269 600,000 2,700 1,275,000 1,425,000 1,065,000 625,000 625,000 Debt Service - - - - - - -TOTAL ESTIMATED COSTS 6,128,586 7,932,143 6,091,546 9,449,305 9,904,491 9,786,877 9,528,114 9,671,200 DETAIL OF TRANSFERS OUT: Administrative Support 211,490 214,804 214,804 219,100 223,482 227,952 232,511 237,161 Fleet Lease Assessment Fee 2,375 2,698 2,698 2,822 2,953 3,091 3,235 3,386 Fleet Management Fund - - - - - - -Insurance Assessment 11,362 19,018 19,018 20,959 22,007 23,107 24,262 25,476 Vehicle Maintenance Fees 975 1,500 1,920 1,500 1,500 1,500 1,500 1,500 Field Services - - - - - - -Sales Tax (EPWA) - - - - - - -Arts in Public Places Fund - - - - - - -General Fund - - - - - - -Revenue Bond Funds (EPWA) - - - - - - -Additional Transfers - - - - - - -Total Transfers Out: 226,202 238,020 238,440 244,381 249,942 255,650 261,508 267,523
9.23 Click Here for Main Directory Click Here for Sub-Directory
EDMOND Legal Services


The Edmond City Attorney is appointed by the Mayor and City Council to direct the management of all legal matters for the City. The Legal Services office provides legal assistance to the Mayor and Council, the Edmond Public Works Authority and other City departments. The office also aids various committees, boards and city agencies.
The City Attorney or the Assistant City Attorney(s) represents the City in all litigation in Edmond Municipal Court, Oklahoma County District Court, Appellate Courts, and the Federal Court System.
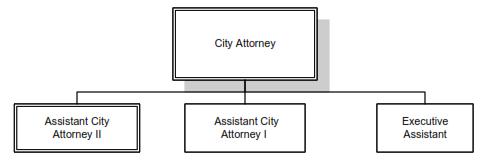
Risk Management, a division of the City Attorney’s office, handles subrogation recovery, liability, and property insurance.

DID YOU KNOW?
Our City Attorney attends weekly Rotary Club meetings and is involved in various other civic organizations and speaks at the Citizens Police Academy twice a year.
Staffing CURRENT YEAR YEAR 2024 YEAR 2025 YEAR 2026 YEAR 2027 YEAR 2028 4-0-0 4-0-0 4-0-0 4-0-0 4-0-0 4-0-0 Contact Us Main Number (405) 359-4350
Organization Chart
9.24 Click Here for Main Directory Click Here for Sub-Directory
DEPARTMENT: Legal Services FUND: ADMIN SUPPORT SERVICES FY 23-24 Prior Year Actual Adopted Year Budget Current Year Revised BUDGET YEAR Projected Budget Projected Budget Projected Budget Projected Budget FY 21-22FY 22-23FY 22-23 FY 23-24 FY 24-25FY 25-26FY 26-27FY 27-28 DIRECT COSTS BY FUNCTION: Personnel Services599,938 664,413 654,032 760,375 702,339 709,187 710,750 719,195 Materials & Supplies 5,070 7,100 3,492 7,100 9,100 9,100 7,100 7,100 Other Services & Charges 146,418 419,351 254,448 470,829 423,114 423,899 423,899 423,899 Capital Outlay - - - - - - -Debt Service - - - - - - -TOTAL ESTIMATED COSTS 751,426 1,090,864 911,972 1,238,304 1,134,553 1,142,186 1,141,749 1,150,194 DETAIL OF TRANSFERS OUT: Administrative Support 58,835 46,082 46082.04 47,004 47,944 48,903 49,881 50,878 Fleet Lease Assessment Fee - - - - - - -Fleet Management Fund - - - - - - -Insurance Assessment 8,163 12,243 12,243 19,125 20,081 21,085 22,139 23,246 Vehicle Maintenance Fees - - - - - - -Field Services - - - - - - -Sales Tax (EPWA) - - - - - - -Arts in Public Places Fund - - - - - - -General Fund - - - - - - -Revenue Bond Funds (EPWA) - - - - - - -Additional Transfers - - - - - - -Total Transfers Out: 66,998 58,325 58,325 66,129 68,025 69,988 72,020 74,124
9.25 Click Here for Main Directory Click Here for Sub-Directory
DEPARTMENT BUDGET SUMMARY
EDMOND Public Works Administration

Public Works Administration provides a call center for Public Works, handles the recording of field work and asset history, payroll, budget management, and accounts payable for Field Services, Solid Waste and Facility Maintenance, analyzes the quality of data, and facilitates accurate reporting and assistance to division heads.
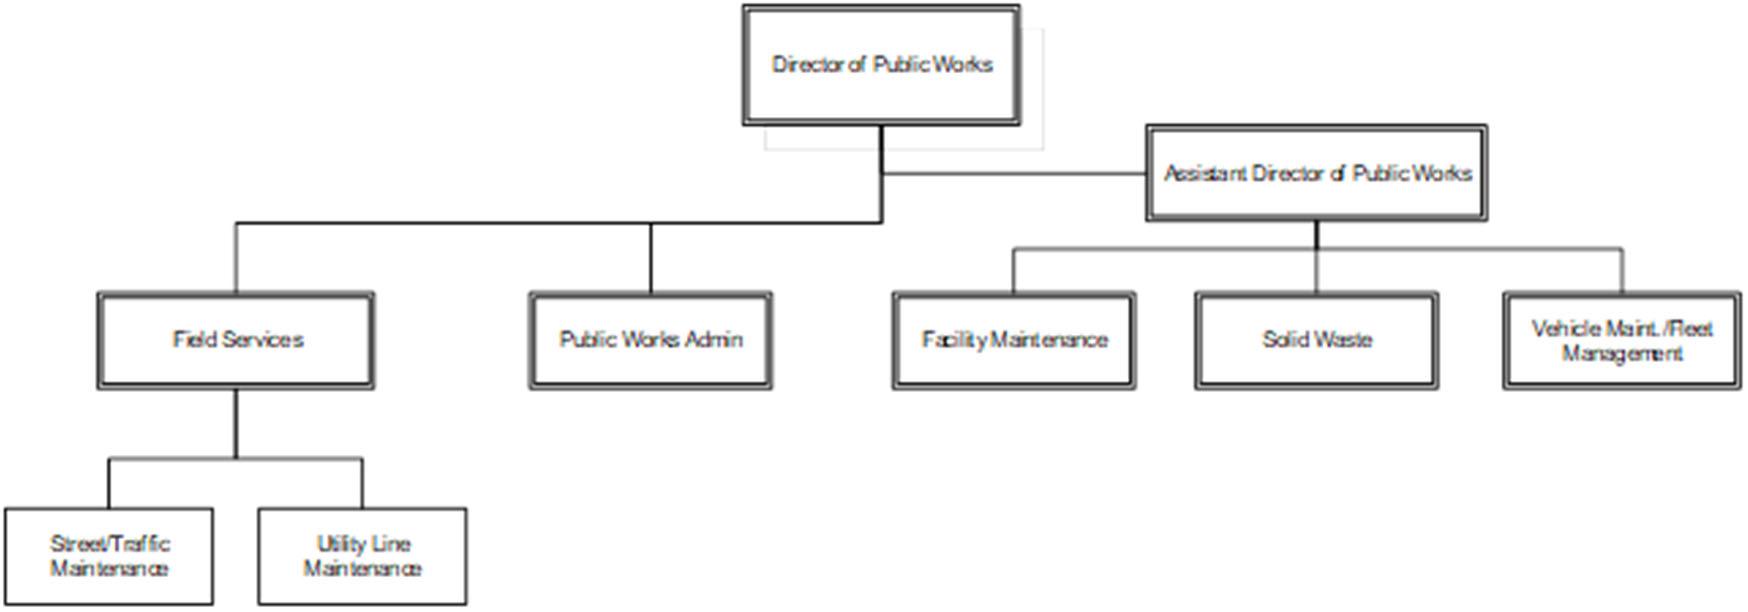
MISSION STATEMENT
Our mission is to deliver high quality, low cost, best in class, services to its customers. Our vision for achieving this mission includes the development of five-year strategic operating plans, a commitment to continuous improvement, professional growth, and all other available resources that support our ability to achieve our mission.

DID YOU KNOW?
Edmond Public Work (EPW) recently completed the American Public Works Association (APWA) re-accreditation process.
EPW is one of two agencies in the state of Oklahoma who have earned accreditation through APWA.
PW was fully compliant in all 121 applicable practices.

Staffing CURRENT YEAR YEAR 2024 YEAR 2025 YEAR 2026 YEAR 2027 YEAR 2028 12-0-0 12-0-0 12-0-0 12-0-0 12-0-0 12-0-0 Contact Us Phone: (405) 359-4555 Website: https://www.edmondok.gov/155/City-Clerk
Organization Chart
9.26 Click Here for Main Directory Click Here for Sub-Directory
DEPARTMENT: Public Works Administration FUND: ADMIN SUPPORT SERVICES FY 23-24 Prior Year Actual Adopted Year Budget Current Year Revised BUDGET YEAR Projected Budget Projected Budget Projected Budget Projected Budget FY 21-22FY 22-23FY 22-23 FY 23-24 FY 24-25FY 25-26FY 26-27FY 27-28 DIRECT COSTS BY FUNCTION: Personnel Services758,677 863,789 777,771 874,545 918,809 956,024 962,672 994,214 Materials & Supplies 6,683 10,009 6,789 11,380 5,730 8,318 14,702 11,590 Other Services & Charges 44,735 56,050 51,192 76,255 81,717 88,586 87,662 88,146 Capital Outlay - - - - - - -Debt Service - - - - - - -TOTAL ESTIMATED COSTS 810,095 929,848 835,751 962,180 1,006,256 1,052,928 1,065,036 1,093,950 DETAIL OF TRANSFERS OUT: Administrative Support 212,483 241,985 241985.04 246,825 251,761 256,796 261,932 267,171 Fleet Lease Assessment Fee - - - - - - -Fleet Management Fund - - - - - - -Insurance Assessment 7,805 8,716 8,716 10,302 10,817 11,358 11,926 12,522 Vehicle Maintenance Fees - - - - - - -Field Services - - - - - - -Sales Tax (EPWA) - - - - - - -Arts in Public Places Fund - - - - - - -General Fund - - - - - - -Revenue Bond Funds (EPWA) - - - - - - -Additional Transfers - - - - - - -Total Transfers Out: 220,288 250,701 250,701 257,127 262,578 268,154 273,858 279,693
9.27 Click Here for Main Directory Click Here for Sub-Directory
DEPARTMENT BUDGET SUMMARY
EDMOND Operations Central Warehouse

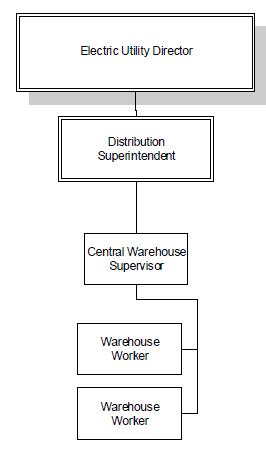
The Central Operations Warehouse plays an intricate role in sustaining the steady operation of Edmond Electric, Traffic Control, Facility Maintenance, Field Services as well as assisting external contractors. The Warehouse team is charged with ensuring the warehouse is fully stocked at all times, as well as keeping detailed records of all material that we receive and send out. We are also in charge of keeping a very neat and organized yard for quick and easy access to transformers, box pads, PVC pipe and much more material for our fellow departments to utilize at a moments notice, we also assist in loading and unloading material for contractors!
DID YOU KNOW?

Here in the Warehouse we get to learn the in's and out's of what each department does!

We get to work closely with many different contractors! Here in the warehouse we get the opportunity to learn something new each and every day !
Organization Chart Staffing CURRENT YEAR YEAR 2024 YEAR 2025 YEAR 2026 YEAR 2027 YEAR 2028 3-0-0 3-0-0 3-0-0 3-0-0 3-0-0 3-0-0 Contact Us James Davis – (405) 216-7721 James.Davis@edmondok.gov Randon West – (405) 216-7665 Randon.West@edmondok.gov Michael Luna – (405) 216-7721 Michael.Luna@edmondok.gov
9.28 Click Here for Main Directory Click Here for Sub-Directory
DEPARTMENT: Operations Central Warehousing FUND: ADMIN SUPPORT SERVICES FY 23-24 Prior Year Actual Adopted Year Budget Current Year Revised BUDGET YEAR Projected Budget Projected Budget Projected Budget Projected Budget FY 21-22FY 22-23FY 22-23 FY 23-24 FY 24-25FY 25-26FY 26-27FY 27-28 DIRECT COSTS BY FUNCTION: Personnel Services216,835 257,253 238,124 216,342 226,597 236,930 238,122 248,629 Materials & Supplies 3,479 4,650 3,864 9,450 6,650 6,650 6,650 6,650 Other Services & Charges 7,528 17,325 15,558 18,575 18,825 18,825 18,825 18,825 Capital Outlay - - - - - - -Debt Service - - - - - - -TOTAL ESTIMATED COSTS 227,843 279,228 257,546 244,367 252,072 262,405 263,597 274,104 DETAIL OF TRANSFERS OUT: Administrative Support 25,734 40,046 40046.04 40,847 41,664 42,497 43,347 44,214 Fleet Lease Assessment Fee 7,274 5,226 5,226 18,964 19,339 19,722 20,112 20,510 Fleet Management Fund - - - - - - -Insurance Assessment 1,266 1,330 1,330 1,578 1,657 1,740 1,827 1,918 Vehicle Maintenance Fees 5,577 10,000 12,000 10,000 10,000 10,000 10,000 10,000 Field Services - - - - - - -Sales Tax (EPWA) - - - - - - -Arts in Public Places Fund - - - - - - -General Fund - - - - - - -Revenue Bond Funds (EPWA) - - - - - - -Additional Transfers - - - - - - -Total Transfers Out: 39,851 56,602 58,602 71,389 72,660 73,959 75,286 76,642 DEPARTMENT BUDGET SUMMARY 9.29 Click Here for Main Directory Click Here for Sub-Directory
EDMOND Public Safety Communications

Professionally committed to providing quality emergency communications services for the City of Edmond and surrounding areas.

DID YOU KNOW?
•Dispatchers and call takers save seconds, seconds save lives!

•Dispatchers and call takers are the first, first responders and have been designated by the State of Oklahoma as first responders!
Organization Chart


Staffing CURRENT YEAR YEAR 2024 YEAR 2025 YEAR 2026 YEAR 2027 YEAR 2028 26.8*-0-0 26.8-0-0 26.8-0-0 26.8-0-0 26.8-0-0 26.8-0-0 *The Director is funded at 80% out of Public Safety Communications. CONTACT US: Phone: 405.349.4338
9.30 Click Here for Main Directory Click Here for Sub-Directory
DEPARTMENT: Public Safety Communications FUND: ADMIN SUPPORT SERVICES FY 23-24 Prior Year Actual Adopted Year Budget Current Year Revised BUDGET YEAR Projected Budget Projected Budget Projected Budget Projected Budget FY 21-22FY 22-23FY 22-23 FY 23-24 FY 24-25FY 25-26FY 26-27FY 27-28 DIRECT COSTS BY FUNCTION: Personnel Services1,951,171 2,510,184 2,208,579 2,493,949 2,542,773 2,623,745 2,640,310 2,716,931 Materials & Supplies125,873 72,710 17,063 74,750 101,800 66,350 66,300 59,900 Other Services & Charges 314,275 397,090 344,289 328,670 321,970 321,970 321,970 321,970 Capital Outlay 91,989 - - 69,444 - - -Debt Service - - - - - - -TOTAL ESTIMATED COSTS 2,483,309 2,979,984 2,569,931 2,966,813 2,966,543 3,012,065 3,028,580 3,098,801 DETAIL OF TRANSFERS OUT: Administrative Support 346,436 313,324 313323.96 319,590 325,983 332,502 339,152 345,935 Fleet Lease Assessment Fee - - - - - - -Fleet Management Fund - - - - - - -Insurance Assessment 22,188 25,174 25,174 24,115 25,321 26,587 27,917 29,312 Vehicle Maintenance Fees - - - - - - -Field Services - - - - - - -Sales Tax (EPWA) - - - - - - -Arts in Public Places Fund - - - - - - -General Fund - - - - - - -Revenue Bond Funds (EPWA) - - - - - - -Additional Transfers - - - - - - -Total Transfers Out: 368,624 338,498 338,498 343,705 351,304 359,089 367,069 375,247 DEPARTMENT BUDGET SUMMARY 9.31 Click Here for Main Directory Click Here for Sub-Directory
EDMOND Engineering

Engineering provides technical service and expertise to citizens, developers, contractors, city departments, and the City Council. Our department manages all aspects related to the expansion of city infrastructure, capital improvements, and private developments.
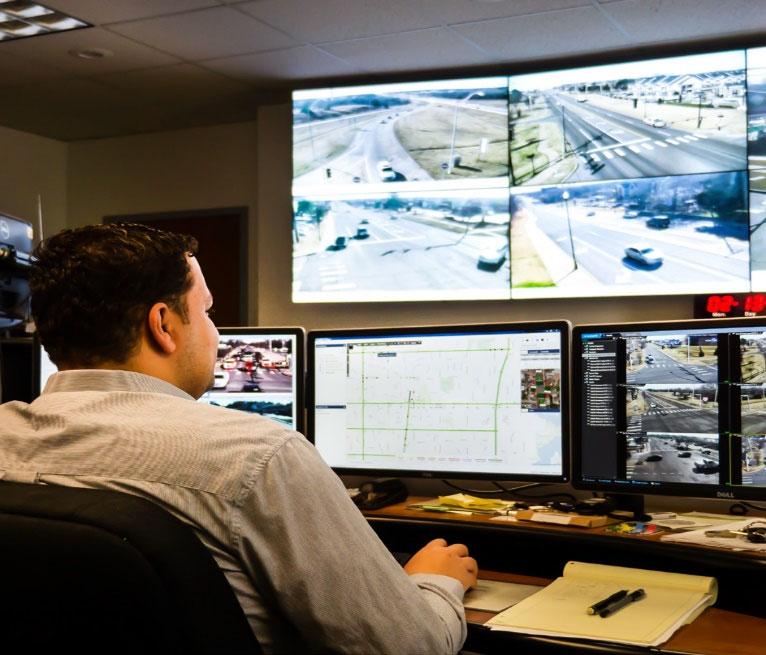
DID YOU KNOW?
Distributed 1,266 rain barrels since the beginning of the annual rain barrel and compost bin program (2016 - 2023).
450+ plan review are processed annually.

Organization Chart
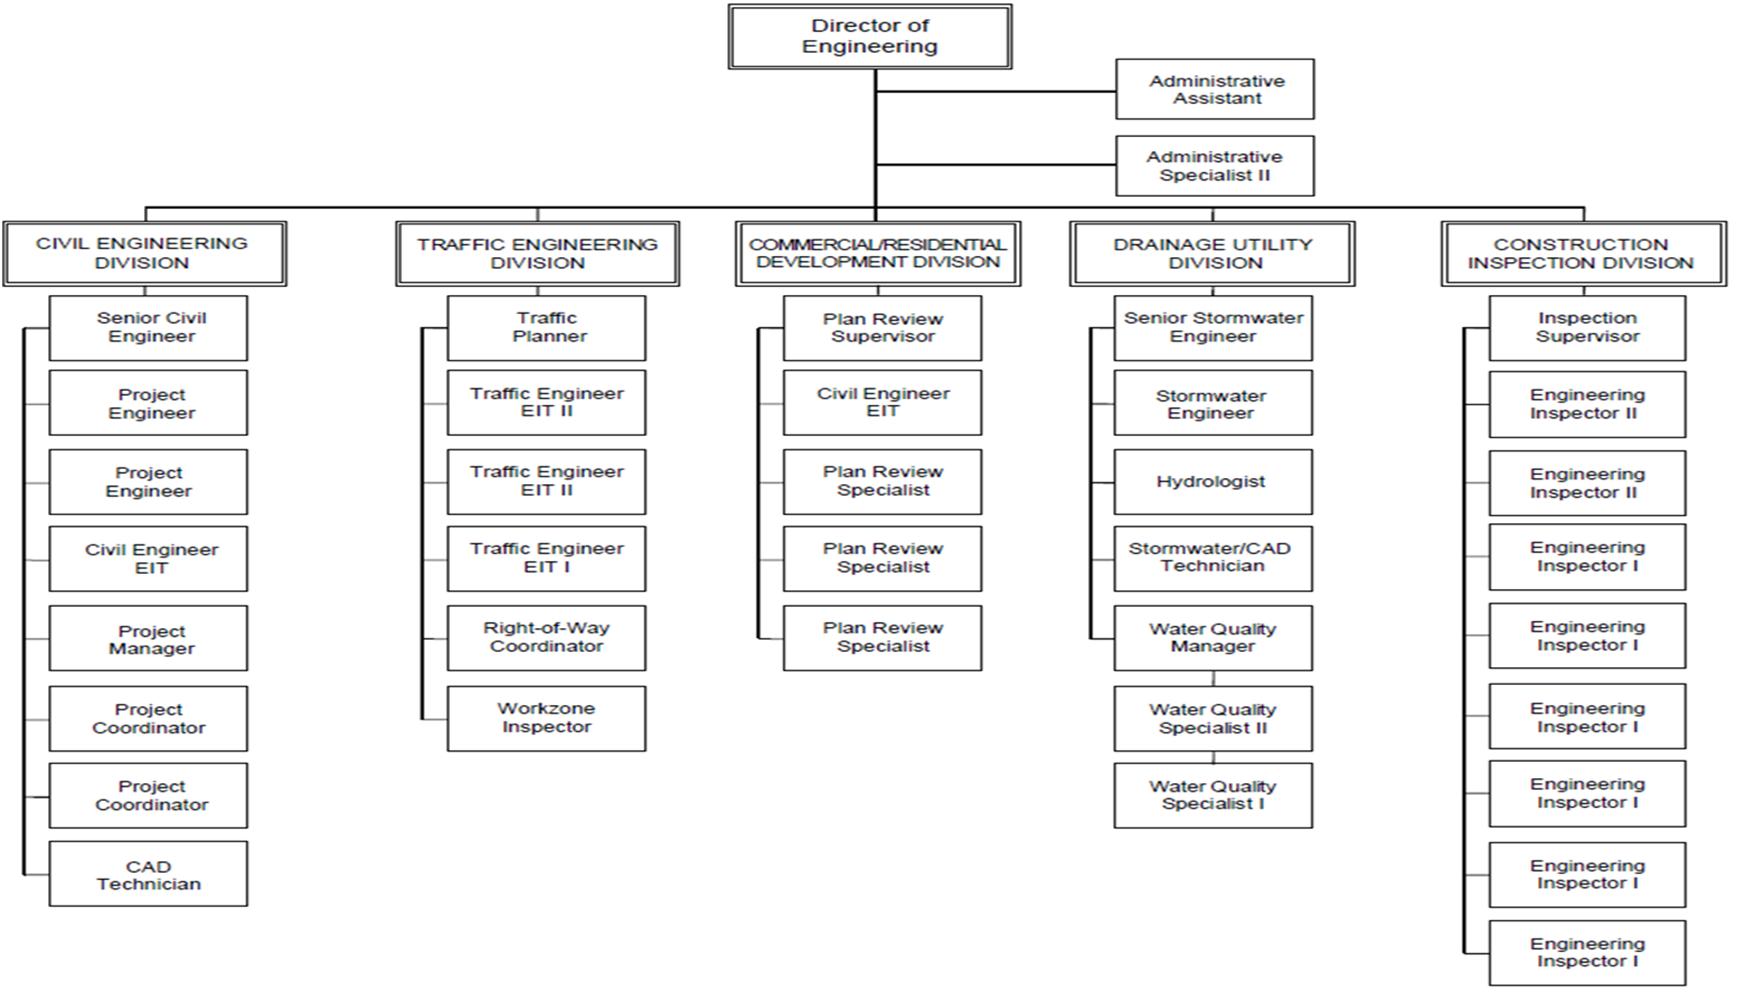
Staffing CURRENT YEAR YEAR 2024 YEAR 2025 YEAR 2026 YEAR 2027 YEAR 2028 35-0-0 38-0-0 40-0-0 40-0-0 40-0-0 40-0-0 Contact Us Civil Engineering –Steve Lawrence Ph (405) 359-4770 Plan Review –Mariah Fields Ph (405) 359-4766 Engineering Inspections –Ken Miner Ph (405) 359-4773 Traffic Management –Tom Minnick Ph (405) 359-4775
9.32 Click Here for Main Directory Click Here for Sub-Directory
DEPARTMENT: Engineering FUND: ADMIN SUPPORT SERVICES FY 23-24 Prior Year Actual Adopted Year Budget Current Year Revised BUDGET YEAR Projected Budget Projected Budget Projected Budget Projected Budget FY 21-22FY 22-23FY 22-23 FY 23-24 FY 24-25FY 25-26FY 26-27FY 27-28 DIRECT COSTS BY FUNCTION: Personnel Services2,342,246 3,109,322 2,664,891 3,420,651 3,633,851 3,729,536 3,724,083 3,824,393 Materials & Supplies49,369 102,900 71,169 85,025 66,700 73,225 86,750 75,275 Other Services & Charges 48,960 140,900 97,268 131,250 133,725 136,225 139,225 140,225 Capital Outlay - - - 38,194 - - -Debt Service - - - - - - -TOTAL ESTIMATED COSTS 2,440,575 3,353,122 2,833,328 3,675,120 3,834,276 3,938,986 3,950,058 4,039,893 DETAIL OF TRANSFERS OUT: Administrative Support 469,046 525,453 525453 535,962 546,681 557,615 568,768 580,143 Fleet Lease Assessment Fee 26,214 28,242 28,242 30,671 32,102 33,605 35,184 36,841 Fleet Management Fund - - - - - - -Insurance Assessment 22,106 24,424 24,424 24,916 26,161 27,469 28,843 30,285 Vehicle Maintenance Fees 12,432 14,600 18,059 19,600 19,600 19,600 19,600 19,600 Field Services - - - - - - -Sales Tax (EPWA) - - - - - - -Arts in Public Places Fund - - - - - - -General Fund - - - - - - -Revenue Bond Funds (EPWA) - - - - - - -Additional Transfers - - - - - - -Total Transfers Out: 529,798 592,719 596,178 611,149 624,544 638,289 652,395 666,869 DEPARTMENT BUDGET SUMMARY 9.33 Click Here for Main Directory Click Here for Sub-Directory
EDMOND Financial Services


Financial Services directs the day-to-day accounting functions, accounts payable, importing of financial data, bid process, city-wide credit cards, investments, and money handling. Our department creates a 5-year budget and our Annual Comprehensive Financial Report.

MISSION STATEMENT
With excellence and integrity, the Finance Department is committed to building the public trust through sound financial management, and innovative and effective business decisions while protecting the City’s assets, ensuring compliance with Federal, State and local laws and regulations. We are committed to providing timely, accurate, clear and concise information to the City’s leadership and departments with exemplary customer service. DID YOU KNOW?
We have won awards for GFOA's ACFR award for 37 years and PAFR award for 13 years
Our department tracks and reconciles over $1 billion in gross cash transactions per year.
We received the GFOA's Budget award for 2 straight years.
Organization Chart
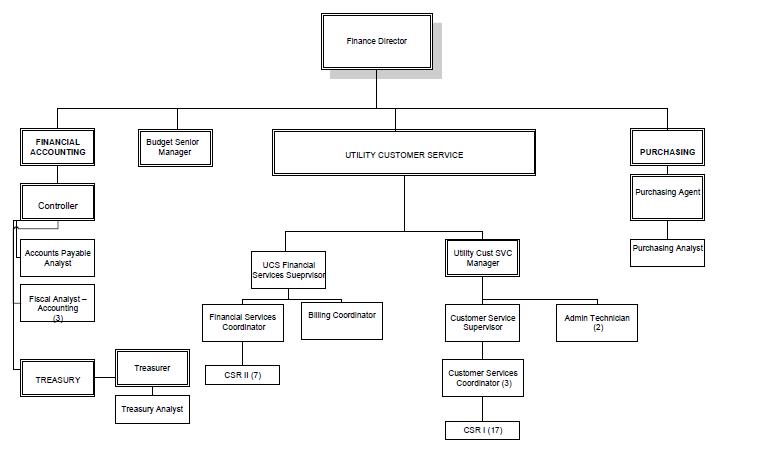
Staffing CURRENT YEAR YEAR 2024 YEAR 2025 YEAR 2026 YEAR 2027 YEAR 2028 9.7*-0-0 10.7-0-0 10.7-0-0 10.7-0-0 10.7-0-0 10.7-0-0 *Staffing level includes the Financial Services, Treasury, and Purchasing Departments. .3 of the Purchasing Manager is accounted for in the YourGovShop budget. Contact Us Kathy Panas (405) 359-4521
9.34 Click Here for Main Directory Click Here for Sub-Directory
DEPARTMENT: Financial Services FUND: ADMIN SUPPORT SERVICES FY 23-24 Prior Year Actual Adopted Year Budget Current Year Revised BUDGET YEAR Projected Budget Projected Budget Projected Budget Projected Budget FY 21-22FY 22-23FY 22-23 FY 23-24 FY 24-25FY 25-26FY 26-27FY 27-28 DIRECT COSTS BY FUNCTION: Personnel Services758,626 1,020,771 935,015 1,193,565 1,234,303 1,273,622 1,284,430 1,326,794 Materials & Supplies 7,436 12,262 10,079 19,194 13,119 16,581 16,581 16,581 Other Services & Charges 254,794 498,983 260,738 479,319 358,511 358,786 358,786 358,786 Capital Outlay - - - - - - -Debt Service - - - - - - -TOTAL ESTIMATED COSTS 1,020,855 1,532,016 1,205,833 1,692,078 1,605,933 1,648,989 1,659,797 1,702,161 DETAIL OF TRANSFERS OUT: Administrative Support 337,220 402,608 402,608 410,661 418,874 427,250 435,796 444,512 Fleet Lease Assessment Fee - - - - - - -Fleet Management Fund - - - - - - -Insurance Assessment 5,022 5,573 5,573 6,562 6,891 7,235 7,597 7,977 Vehicle Maintenance Fees - - - - - - -Field Services - - - - - - -Sales Tax (EPWA) - - - - - - -Arts in Public Places Fund - - - - - - -General Fund - - - - - - -Revenue Bond Funds (EPWA) - - - - - - -Additional Transfers - - - - - - -Total Transfers Out: 342,242 408,181 408,181 417,223 425,765 434,485 443,393 452,489 DEPARTMENT BUDGET
9.35 Click Here for Main Directory Click Here for Sub-Directory
SUMMARY
EDMOND Human Resources
The Human Resources (HR) Department is dedicated to providing high quality, trustworthy service. We strive to attract, develop, motivate and retain a productive and diverse workforce within an inclusive work environment by:
-Promoting and recruiting the best qualified, diverse, workforce committed to excellence
-Fostering employee engagement through performance management
-Supporting training and alignment to the city’s mission, core values, and strategic initiatives
-Providing sustainable benefit products and services, responsive to and valued by employees
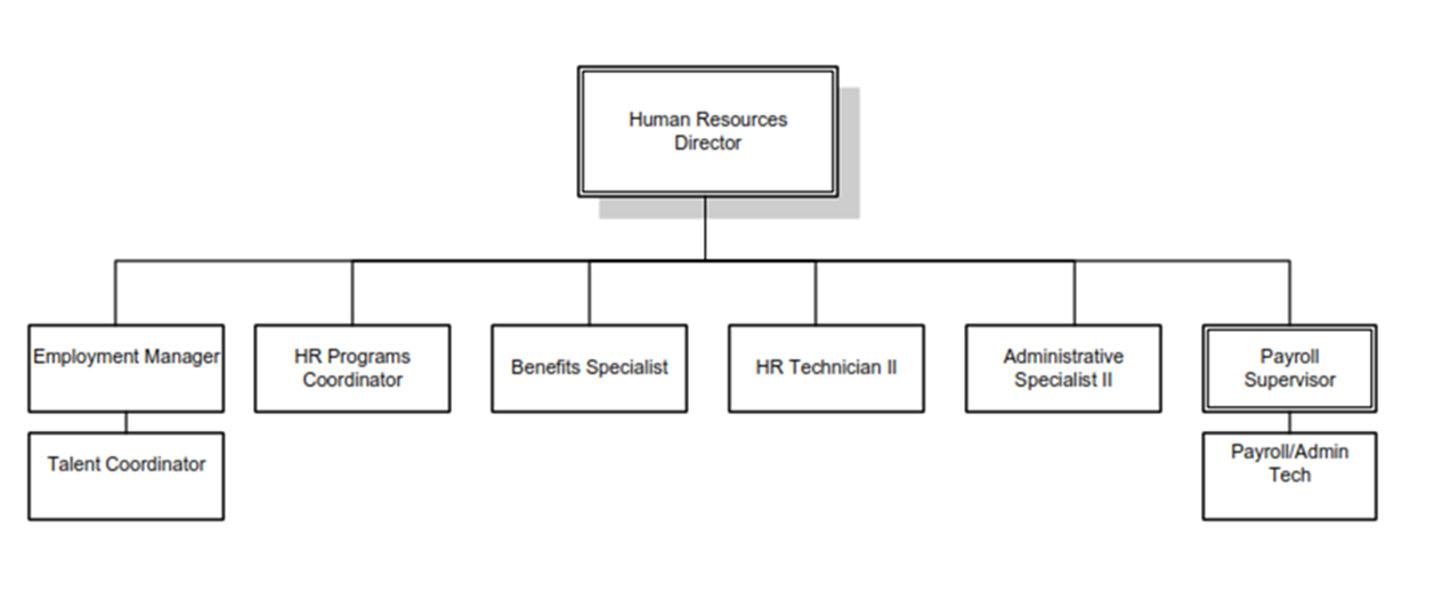
-Managing the city's employee payroll in full compliance, timely and accurately DID YOU KNOW?
In 2022:
-HR processed 2,712 applications and placed 77 new hires.

-501 employees were highlighted on the City's Recognition Slides.
-At the Employee Health Clinic, employees and their family members made 3187 visits, received 1722 labs, 617 injections and 5846 prescriptions, all FREE of charge.
Organization Chart
Staffing CURRENT YEAR YEAR 2024 YEAR 2025 YEAR 2026 YEAR 2027 YEAR 2028 9-0-0 9-0-0 9-0-0 9-0-0 9-0-0 9-0-0 Contact Us Call Main Number: (405) 359-4685 Email: HumanResources@edmondok.gov New Location: North Timbers, 2824 Progressive Drive, Edmond OK. 73034
9.36 Click Here for Main Directory Click Here for Sub-Directory
DEPARTMENT: Human Resources FUND: ADMIN SUPPORT SERVICES FY 23-24 Prior Year Actual Adopted Year Budget Current Year Revised BUDGET YEAR Projected Budget Projected Budget Projected Budget Projected Budget FY 21-22FY 22-23FY 22-23 FY 23-24 FY 24-25FY 25-26FY 26-27FY 27-28 DIRECT COSTS BY FUNCTION: Personnel Services760,550 844,363 786,819 1,037,263 1,013,435 1,047,059 1,053,701 1,075,330 Materials & Supplies 13,581 32,300 16,118 40,500 26,800 27,200 27,600 31,600 Other Services & Charges 90,309 185,050 89,092 332,850 142,850 182,850 142,550 182,850 Capital Outlay - 1,032 - - - - -Debt Service - - - - - - -TOTAL ESTIMATED COSTS 864,441 1,062,745 892,029 1,410,613 1,183,085 1,257,109 1,223,851 1,289,780 DETAIL OF TRANSFERS OUT: Administrative Support 208,000 218,308 218307.96 221,474 225,903 230,421 235,030 239,730 Fleet Lease Assessment Fee - - - - - - -Fleet Management Fund - - - - - - -Insurance Assessment 5,197 5,690 5,690 6,107 6,412 6,733 7,069 7,423 Vehicle Maintenance Fees - - - - - - -Field Services - - - - - - -Sales Tax (EPWA) - - - - - - -Arts in Public Places Fund - - - - - - -General Fund - - - - - - -Revenue Bond Funds (EPWA) - - - - - - -Additional Transfers - - - - - - -Total Transfers Out: 213,197 223,998 223,998 227,581 232,315 237,154 242,099 247,153 DEPARTMENT BUDGET SUMMARY 9.37 Click Here for Main Directory Click Here for Sub-Directory
EDMOND
Utility Customer Service

Utility Customer Service is comprised of three (3) service divisions: Administrative, Financial Services, Customer Services. We provide billing services for electric, water, sewer, solid waste collection, and drainage. Our goal is to provide you with high quality customer service.
DID YOU KNOW?
In 2022, Utility Customer Service responded to 26,533 customer emails. New Accounts processed 9,155 new utility accounts in 2022 for the first time.

Organization Chart
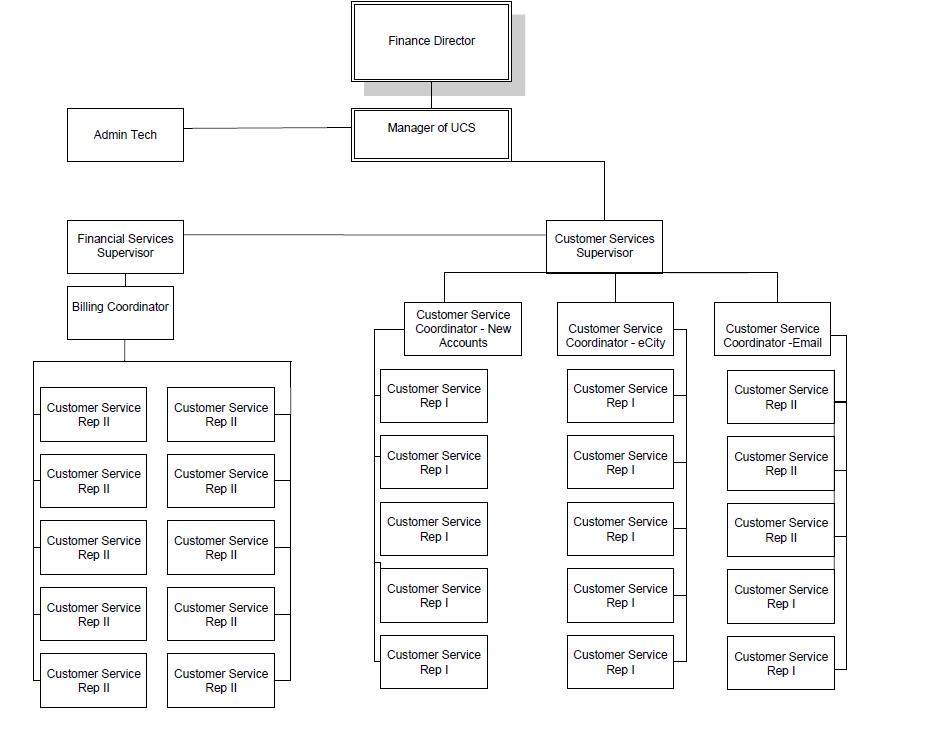
Staffing CURRENT YEAR YEAR 2024 YEAR 2025 YEAR 2026 YEAR 2027 YEAR 2028 34-0-0 34-0-0 34-0-0 34-0-0 34-0-0 34-0-0 Contact Us Non- Emergency Number (405) 216-4541 https://edmondok.gov/659/Utility-Customer-Service
9.38 Click Here for Main Directory Click Here for Sub-Directory
DEPARTMENT: Utility Customer Service FUND: ADMIN SUPPORT SERVICES FY 23-24 Prior Year Actual Adopted Year Budget Current Year Revised BUDGET YEAR Projected Budget Projected Budget Projected Budget Projected Budget FY 21-22FY 22-23FY 22-23 FY 23-24 FY 24-25FY 25-26FY 26-27FY 27-28 DIRECT COSTS BY FUNCTION: Personnel Services1,815,272 2,316,482 2,170,682 2,416,645 2,521,287 2,616,824 2,634,828 2,724,428 Materials & Supplies167,331 207,050 227,381 183,050 214,050 199,050 199,050 193,550 Other Services & Charges 906,402 1,184,475 1,039,228 1,279,300 1,297,150 1,318,500 1,339,350 1,460,200 Capital Outlay - - - - - - -Debt Service - - - - - - -TOTAL ESTIMATED COSTS 2,889,005 3,708,007 3,437,291 3,878,995 4,032,487 4,134,374 4,173,228 4,378,178 DETAIL OF TRANSFERS OUT: Administrative Support 795,356 813,892 813891.96 830,170 846,773 863,709 880,983 898,603 Fleet Lease Assessment Fee - - - - - - -Fleet Management Fund - - - - - - -Insurance Assessment 16,927 18,051 18,051 19,439 20,411 21,431 22,503 23,628 Vehicle Maintenance Fees - - - - - - -Field Services - - - - - - -Sales Tax (EPWA) - - - - - - -Arts in Public Places Fund - - - - - - -General Fund - - - - - - -Revenue Bond Funds (EPWA) - - - - - - -Additional Transfers - - - - - - -Total Transfers Out: 812,283 831,943 831,943 849,609 867,184 885,140 903,486 922,231 DEPARTMENT BUDGET SUMMARY 9.39 Click Here for Main Directory Click Here for Sub-Directory
EDMOND Fleet Management

Fleet Management provides administrative support in the most cost-efficient manner to all City departments who operate city owned vehicles/equipment. The department manages the fleet replacement fund and establishes budget figures for each fiscal year for fuel, parts accounts, car wash expense and vehicle/ equipment replacement. The department manages the bid process for new vehicle and equipment. Personnel are committed to exploring all means in which to aid departments in meeting the needs of their customers and the public sector.
Staffing
Bobby

CURRENT YEAR YEAR 2024 YEAR 2025 YEAR 2026 YEAR 2027 YEAR 2028 1-0-0 1-0-0 1-0-0 1-0-0 1-0-0 1-0-0 *Split with Vehicle Maintenance Contact Us
Masterson: (405) 216-7785
bobby.masterson@edmondok.gov
9.40 Click Here for Main Directory Click Here for Sub-Directory
Fleet Management Fund FY 23-24 Prior Year Actual Adopted Year Budget Current Year Revised BUDGET YEAR Projected Budget Projected Budget Projected Budget Projected Budget FY 21-22FY 22-23FY 22-23 FY 23-24 FY 24-25FY 25-26FY 26-27FY 27-28 ESTIMATED RESOURCES: REVENUES: Charges for Services25,095 34,345 17,388 33,635 33,635 33,635 33,635 33,635 Interest (443,887) 108,144 164,073 25,095 25,095 25,095 25,095 25,095 Capital Lease Proceeds - - - - - - -Miscellaneous Revenue 59,117 - 152,220 3,000 3,000 3,000 3,000 3,000 Subtotal - Revenues (359,675) 142,489 333,681 61,730 61,730 61,730 61,730 61,730 OTHER RESOURCES: Debt/Loan Proceeds - - - - - -Restricted Prior Year Reserves 16,055,961 18,661,707 18,661,707 19,512,420 23,704,491 23,672,953 24,275,981 24,066,697 Assigned Prior Year Reserves (Council Projects) - - - - - -Committed Prior Year Reserves - - - - - -Unrestricted Prior Year Reserves - - - - - -TOTAL ESTIMATED RESOURCES 15,696,285 18,804,196 18,995,388 19,574,150 23,766,221 23,734,683 24,337,711 24,128,427 ESTIMATED USES To General Govt to Public Safety Line DIRECT COSTS BY FUNCTION: To Utility Services Line Personnel Services57,958 62,204 62,324 63,268 63,309 63,512 63,706 63,906 Materials & Supplies 28 7,500 - 7,500 7,500 7,500 7,500 7,500 Other Services & Charges 129,117 161,820 53,647 169,808 172,128 174,505 176,942 179,440 Capital Outlay Fire - 653121 219,950 1,550,000 1,086,990 1,365,000 1,440,000 720,000 2,305,000 235,000 Police - 653122 783,224 895,000 807,020 1,125,000 1,192,800 1,252,440 1,315,062 1,380,815 Electric - 653032 309,005 1,855,000 413,839 200,000 46,000 300,000 -All Other Departments 1,342,897 2,075,500 2,075,500 3,698,222 2,361,045 2,479,822 2,605,039 2,737,098 Debt Service - - - - - - -TOTAL ESTIMATED COSTS 2,842,180 6,607,024 4,499,320 6,628,798 5,282,782 4,997,779 6,473,249 4,603,759 TRANSFERS: Transfers In 5,846,284 6,626,666 5,661,423 10,816,578 5,247,344 5,597,005 6,260,569 6,547,464 Transfers Out (See detail below) (38,682) (66,679) (645,071) (57,439) (57,830) (57,928) (58,334) (58,749) NET TRANSFERS IN (OUT) 5,807,601 6,559,987 5,016,352 10,759,139 5,189,514 5,539,077 6,202,235 6,488,715 OTHER USES: Reserve for Employee Obligations - - - - - - -Reserve for Council Special Projects - - - - - - -Reserve for Capital Improvements - - - - - - -Committed for Other PurposesReserve for Other Restricted Purposes Reserve for Fire 6,083,598 6,083,598 5,766,700 10,431,333 9,886,397 10,060,791 8,640,427 9,120,034 Reserve for Police 2,111,587 2,111,587 2,243,224 2,420,817 2,641,357 2,757,886 3,036,706 3,195,215 Reserve for Electric 1,113,814 1,113,814 686,127 488,481 444,697 146,780 148,710 150,485 Reserve for All Other Funds 9,352,707 9,448,159 10,816,369 10,363,860 10,700,501 11,310,524 12,240,853 13,547,648 Restricted (Reserve for Specific Fund Purposes)Unassigned (Res for Emergencies & Shortfalls) - - - - - - -TOTAL OTHER USES 18,661,707 18,757,159 19,512,420 23,704,491 23,672,953 24,275,981 24,066,697 26,013,383 TOTAL ESTIMATED USES 15,696,285 18,804,196 18,995,388 19,574,150 23,766,221 23,734,683 24,337,711 24,128,427 DETAIL OF TRANSFERS OUT: Administrative Support 10,672 15,591 15,591 16,033 16,354 16,378 16,706 17,040 Fleet Lease Assessment Fee - - - - - - -Fleet Management Fund - - - - - - -Insurance Assessment 1,306 1,088 1,088 1,406 1,476 1,550 1,628 1,709 Vehicle Maintenance Fees 26,704 50,000 9,600 40,000 40,000 40,000 40,000 40,000 Field Services - - - - - - -Sales Tax (EPWA) - - - - - - -Arts in Public Places Fund - - - - - - -General Fund - - - - - - -Revenue Bond Funds (EPWA) - - - - - - -Additional Transfers - - 618,792 - - - -Total Transfers Out: 38,682 66,679 645,071 57,439 57,830 57,928 58,334 58,749 9.41 Click Here for Main Directory Click Here for Sub-Directory
EDMOND PublicWorksFieldServices


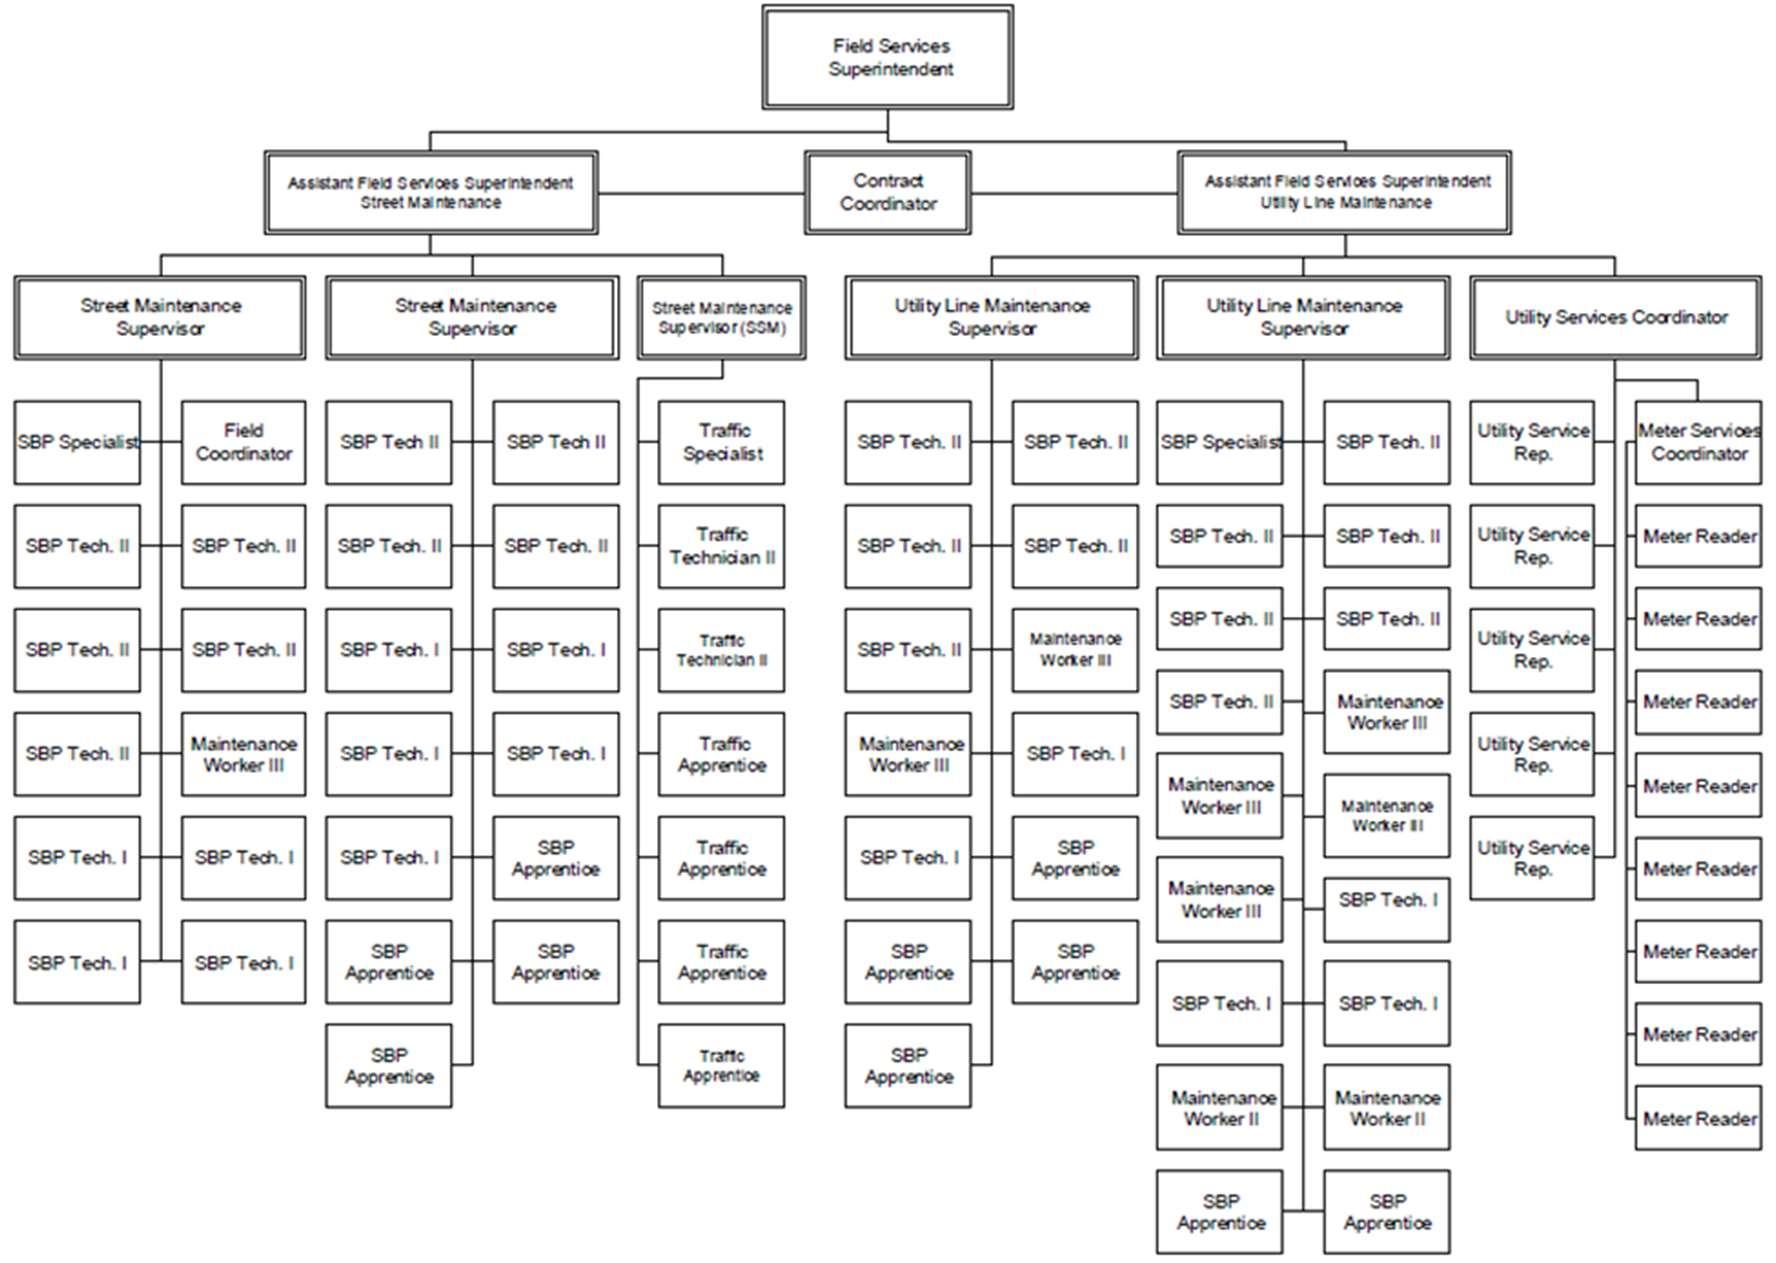

Field Services is responsible for the maintenance and upkeep of all public roads, water distribution, including meter reading and customer service in the field. The department is responsible for the wastewater collection systems within the city limits and ensures compliance with DEQ regulations. Field Services is also responsible for guardrails, signage and signal systems, curbs and gutters, pipe crossings, drainage systems in the right of way, and city owned sidewalks. Additionally, the division assists in maintenance in undeveloped areas and partners with Oklahoma County for rural arterial roadway improvements through inter-local agreements.

Staffing CURRENT YEAR YEAR 2024 YEAR 2025 YEAR 2026 YEAR 2027 YEAR 2028 87-0-0 87-0-0 87-0-0 87-0-0 87-0-0 87-0-0 ContactUs Phone: (405) 216-7770 https://edmondok.com/589/Public-Works
OrganizationChart
9.42 Click Here for Main Directory Click Here for Sub-Directory
Field Services Fund FY 23-24 Prior Year Actual Adopted Year Budget Current Year Revised BUDGET YEAR Projected Budget Projected Budget Projected Budget Projected Budget FY 21-22FY 22-23FY 22-23 FY 23-24 FY 24-25FY 25-26FY 26-27FY 27-28 ESTIMATED RESOURCES: REVENUES: Estimated FEMA Reimbursment Taxes - - - - - - -Inter-governmental - - - - - - -Licenses and Permits - - - - - - -Fines & Forfeitures - - - - - - -Charges for Services 201,394 203,980 200,500 203,980 211,150 211,150 214,843 218,610 Interest (176,186) 5,000 59,287 5,000 5,000 5,000 5,000 5,000 Investment Income - - - - - - -Capital Lease Proceeds - - - - - - -Miscellaneous Revenue 3,900 - (360) - - - -Subtotal - Revenues 29,108 208,980 259,427 208,980216,150 216,150 219,843 223,610 OTHER RESOURCES: Debt/Loan Proceeds - - - - - -Restricted Prior Year Reserves 5,527,354 6,860,053 6,860,053 8,706,157 7,689,167 6,689,167 5,689,167 4,689,167 Assigned Prior Year Reserves (Council Projects) - - - - - -Committed Prior Year Reserves - - - - - -Unrestricted Prior Year Reserves - - - - - -TOTAL ESTIMATED RESOURCES 5,556,462 7,069,033 7,119,480 8,915,137 7,905,317 6,905,317 5,909,010 4,912,777 ESTIMATED USES DIRECT COSTS BY FUNCTION: Personnel Services6,370,260 7,824,924 6,905,413 7,794,233 8,008,866 8,200,164 8,251,724 8,430,089 Materials & Supplies 1,401,551 1,544,173 1,320,637 1,610,657 1,554,883 1,625,134 1,619,382 1,609,203 Other Services & Charges 1,454,414 1,990,130 1,343,047 3,285,580 3,321,300 3,351,350 3,364,730 3,388,030 Capital Outlay - - 60 204,860 - - -Debt Service - - - - - - -TOTAL ESTIMATED COSTS 9,226,225 11,359,227 9,569,157 12,895,330 12,885,049 13,176,648 13,235,836 13,427,322 TRANSFERS: Transfers In 14,311,652 15,648,457 15,648,457 16,241,089 16,377,965 16,759,708 16,957,768 17,292,218 Transfers Out (See detail below) (3,781,835) (4,347,115) (4,492,624) (4,571,729) (4,709,066) (4,799,210) (4,941,775) (5,088,506) NET TRANSFERS IN (OUT) 10,529,816 11,301,342 11,155,833 11,669,360 11,668,899 11,960,498 12,015,993 12,203,712 OTHER USES: Reserve for Employee Obligations - - - - - - -Reserve for Council Special Projects - - - - - - -Reserve for Capital Improvements - - - - - - -Committed for Other PurposesReserve for Other Restricted Purposes 6,860,053 7,011,148 8,706,157 7,689,167 6,689,167 5,689,167 4,689,167 3,689,167 Restricted (Reserve for Specific Fund Purposes)Unassigned (Res for Emergencies & Shortfalls) - - - - - - -TOTAL OTHER USES 6,860,053 7,011,148 8,706,157 7,689,167 6,689,167 5,689,167 4,689,167 3,689,167 TOTAL ESTIMATED USES 5,556,462 7,069,033 7,119,480 8,915,137 7,905,317 6,905,317 5,909,010 4,912,777 DETAIL OF TRANSFERS OUT: Administrative Support 2,316,342 2,648,211 2648211.48 2,787,753 2,843,507 2,847,716 2,904,670 2,962,764 Fleet Lease Assessment Fee 824,217 876,219 876,219 924,223 973,352 1,025,482 1,080,847 1,139,702 Fleet Management Fund - 30,000 - - - - -Insurance Assessment 179,849 295,685 295,685 350,753 368,291 386,706 406,042 426,344 Vehicle Maintenance Fees 461,428 497,000 672,508 509,000 523,916 539,306 550,216 559,696 Field Services - - - - - - -Sales Tax (EPWA) - - - - - - -Arts in Public Places Fund - - - - - - -General Fund - - - - - - -Revenue Bond Funds (EPWA) - - - - - - -Additional Transfers - - - - - - -Total Transfers Out: 3,781,835 4,347,115 4,492,624 4,571,729 4,709,066 4,799,210 4,941,775 5,088,506 9.43 Click Here for Main Directory Click Here for Sub-Directory
Date: May 14th, 2013
Original Balance: $13,710,000
Interest Rate: 1.68%
Maturity Date: July 1, 2024
Series 2013 Bonds- Governmental
Purpose: To improve streets and overly projects, as well as building IT infrastructure.
Security: Issued by the Edmond Public Works Authority (EPWA), secured by utility revenues and pledged sales tax. Currently being paid with the restricted sales tax.
2013 Note- Business Type
Purpose: The proceeds of the Note will be used for the purpose of (i) refunding the outstanding portion of the Issuer's 7,620,000 Series 2005 Drinking Water SRF Promissory Note dated February 24, 2005, its $7,597,844 Series 2005B Drinking Water SRF Promissory Note dated June 10, 2005, its $3,068,246 Series 2005D Drinking Water SRF Promissory Note dated November 15, 2005 and its $3,713,142 Series 2006A Drinking Water SRF Promissory Note dated January 20, 2006; and (ii) paying certain costs associated with the issuance of the Note.
Security: Issued by the Edmond Public Works Authority (EPWA), secured by utility revenues and pledged sales tax. Currently being paid with the restricted sales tax.
Series 2014B Refunding Bonds- Governmental
Date: December 9th, 2014
Original Balance: $20,755,000
Interest Rate: 2.25%
Maturity Date: July 1, 2027
Date: December 9th, 2013
Original Balance: $16,085,000
Interest Rate: 2.86%
Maturity Date: July 1, 2027
Purpose: To improve Covell Parkway, reimburse IT for its City of Edmond contribution, to reimburse what was done on 33rd Street, to help pay ODOT, to pay Haskell Lemon for the 15-16 Street Overlay, and to pay for Markwell Paving for the 16-17 Street Overlay.
Security: Issued by the Edmond Public Works Authority (EPWA), secured by utility revenues and pledged sales tax. Currently being paid with the restricted sales tax
Series 2016 Bonds- Business Type
Purpose: The 2016 Bonds are being issued by The Edmond Public Works Authority (the Authority”) to provide funds which will be used to (i) finance capital projects for the use and benefit of the City of Edmond, (ii) establish a Reserve Fund for the 2016 Bonds, and (iii) pay certain costs of issuing the 2016 Bonds.
Security: Issued by the Edmond Public Works Authority (EPWA), secured by utility revenues and pledged sales tax. Currently being paid with the restricted sales tax
Date: July 5, 2016
Original Balance: $41,975,000 Interest Rate: 3.00 to 5.00%
Date: July 1, 2047
Fiscal Year Principal Interest Total 2024 1,530,000 15,300 1,545,300 Total 1,530,000 15,300 1,545,300
Fiscal Year Principal Interest Total 2024 1,940,000 407,000 2,347,000 2025 2,035,000 310,000 2,345,000 2026 2,140,000 208,250 2,348,250 2027 2,245,000 101,250 2,346,250 Total 8,360,000 1,026,500 9,386,500
Fiscal Year Principal Interest Total 2024 1,380,000 127,342 1,507,342 2025 1,420,000 87,588 1,507,588 2026 1,460,000 46,690 1,506,690 2027 535,000 7,651 542,651 Total 4,795,000 269,269 6,570,221
Maturity
Fiscal Year Principal Interest Total 2024 895,000 1,441,225 2,336,225 2025 940,000 1,395,350 2,335,350 2026 985,000 1,347,225 2,332,225 2027 1,035,000 1,296,725 2,331,725 2028 1,085,000 1,243,725 2,328,725 2029-2033 6,295,000 5,352,300 11,647,300 2034-2047 25,920,000 6,624,650 32,544,650 Total 37,155,000 18,701,200 55,856,200
10.1 Click Here for Main Directory
Date: October 19, 2017
Original Balance: $167,025,000
Interest Rate: 3.00 to 5.00%
Maturity Date: July 1, 2048
Series 2017 Bonds- Business Type
Purpose: The 2017 Bonds are being issued by The Edmond Public Works Authority (the Authority”) to provide funds which will be used to (i) construct and acquire improvements to the City’s wastewater system, (ii) establish a Reserve Fund for the 2017 Bonds, and (iii) pay certain costs of issuing the 2017 Bonds.
Security: Issued by the Edmond Public Works Authority (EPWA), secured by utility revenues and pledged sales tax. Currently being paid with the restricted sales tax.
Series 2021 Refunding Bonds- Governmental
Purpose: The proceeds of the Note will be used for the purpose of providing finds to (i) refinance the outstanding amount of the Authority's Sales Tax and Utility System Revenue Refunding Bonds, Series 2012 dated August 16, 2012, and issued in the original principal amount of $13,255,000; (ii)refinance the outstanding amount of the Authority's Sales Tax and Utility System Revenue Refunding Bonds, Series 2014 dated April 3, 2014, and issued in the original principal amount of $22,730,000;• and (iii) pay certain costs associated with the issuance of the Note.
Security: Issued by the Edmond Public Works Authority (EPWA), secured by utility revenues and pledged sales tax. Currently being paid with the restricted sales tax
2005C DWSRF- Business Type
Date: December 30, 2020
Date: December 30th,2020
Original Balance: $7,870,000
Interest Rate: 2.84%
Maturity Date: July 1, 2024
Purpose: This is for improvements to the City’s drinking water, specifically for the 2000 Water Improvements.
Security: Issued by the Edmond Public Works Authority (EPWA), secured by utility revenues and pledged sales tax. Currently being paid with the restricted sales tax
2018 DWSRF- Business Type
Purpose This is for the construction of the Danforth Water Tower and Control Building.
Security: Issued by the Edmond Public Works Authority (EPWA), secured by utility revenues and pledged sales tax. Currently being paid with the restricted sales tax
Date: December 30, 2020
Balance: $19,000,000
Rate: 2.86%
July 1, 2041
Fiscal Year Principal Interest Total 2024 3,560,000 6,459,700 10,019,700 2025 3,705,000 6,314,400 10,019,400 2026 3,850,000 6,163,300 10,013,300 2027 4,005,000 6,006,200 10,011,200 2028 4,165,000 5,842,800 10,007,800 2029-2033 23,655,000 26,257,700 49,912,700 2034-2048 108,745,000 40,300,125 149,045,125 Total 151,685,000 97,344,225 249,029,225
Fiscal Year Principal Interest Total 2024 1,410,000 6,627 1,416,627 Total 1,410,000 6,627 1,416,627
Fiscal Year Principal Interest Total 2024 191,102 1,216 192,317 2025 95,551 244 95,795 Total 286,653 1,460 288,113
Original Balance:
Interest
Maturity
$3,726,484
Rate: 0.50%
Date: July 1, 2025
Interest
Maturity Date:
Original
Fiscal Year Principal Interest Total 2024 755,000 491,134 1,246,134 2025 780,000 469,183 1,249,183 2026 800,000 446,589 1,246,589 2027 825,000 423,352 1,248,352 2028 850,000 399,399 1,249,399 2029-2033 4,625,000 1,613,255 6,238,671 2034-2041 8,915,000 1,058,415 9,973,415 Total 17,550,000 4,901,325 22,451,325
10.2 Click Here for Main Directory
Date: December 30th, 2020
2020C DWSRF- Business Type
Purpose: This is for the work done on Water Treatment Plant-01A, specifically for the Water Plant Solids.
Security: Issued by the Edmond Public Works Authority (EPWA), secured by utility revenues and pledged sales tax. Currently being paid with the restricted sales tax
2020A CWSRF- Business Type
Purpose: This is for phase 1 improvements to the Coffee Creek Interceptor.
Security: Issued by the Edmond Public Works Authority (EPWA), secured by utility revenues and pledged sales tax. Currently being paid with the restricted sales tax
2020B DWSRF- Business Type
Date: December 30, 2020
December 30th, 2020
Balance: $12,730,000
Rate: 1.60%
Date: July 1, 2052
Purpose: This is for improvements to the 33rd water tower and the Danforth Waterline.
Security: Issued by the Edmond Public Works Authority (EPWA), secured by utility revenues and pledged sales tax. Currently being paid with the restricted sales tax
2020D DWSRF- Business Type
Purpose: This is for Construction of INT-01 New intake Structure
Security: Issued by the Edmond Public Works Authority (EPWA), secured by utility revenues and pledged sales tax. Currently being paid with the restricted sales tax
Date: December 30, 2020
$45,000,000
2.75%
Fiscal Year Principal Interest Total 2024 1,015,000 786,030 1,801,030 2025 1,038,000 763,524 1,801,524 2026 1,059,000 742,682 1,801,682 2027 1,080,000 721,431 1,801,431 2028 1,099,000 701,653 1,800,653 2029-2033 5,847,000 3,160,008 9,007,008 2034- 2052 28,358,000 5,865,390 34,223,390 Total 39,496,000 12,740,718 52,236,718
Original Balance:
Interest Rate: 1.97% Maturity Date: July 1, 2052
$40,000,000
Fiscal Year Principal Interest Total 2024 340,000 197,040 537,040 2025 345,000 191,600 536,600 2026 350,000 186,040 536,040 2027 355,000 180,440 535,440 2028 360,000 174,720 534,720 2029-2033 1,890,000 785,040 2,675,040 2034- 2052 8,760,000 1,433,520 10,193,520 Total 12,400,000 3,148,400 15,548,400
Interest
Date:
Original
Maturity
Fiscal Year Principal Interest Total 2024 500,000 385,575 885,575 2025 505,000 375,875 880,875 2026 515,000 366,030 881,030 2027 525,000 355,990 880,990 2028 535,000 345,757 880,757 2029-2033 2,845,000 1,567,714 4,412,714 2034-2053 14,575,000 3,079,799 17,654,799 Total 20,000,000 6,476,739 26,476,739
Original Balance: $20,000,000 Interest Rate:
Maturity
1.94%
Date: July 1, 2053
Interest
Maturity Date:
Original Balance:
Rate:
July 1, 2054
Fiscal Year Principal Interest Total 2024 496,625 496,625 2025 $466,000 1,323,125 1,789,125 2026 $943,000 1,302,673 2,245,673 2027 $971,000 $1,274,742 2,245,742 2028 996,000 1,249,381 2,245,381 2029-2033 5,455,000 5,771,673 11,226,673 2034- 2054 36,169,000 13,219,049 49,388,049 Total 45,000,000 24,637,267 69,637,267
10.3 Click Here for Main Directory
2022A DWSRF- Business Type
Purpose: This is for construction of the Water Treatment Plant-2, also known as the interim Water Plant Security: Issued by the Edmond Public Works Authority (EPWA), secured by utility revenues and pledged sales tax. Currently being paid with the restricted sales tax
2022 FAP DWSRF- Business Type
Purpose: This is for improvements to the City’s WTP-01B and INT-01 Projects.
Security: Issued by the Edmond Public Works Authority (EPWA), secured by utility revenues and pledged sales tax. Currently being paid with the restricted sales tax
2021A Note- Governmental
Date: December 30th, 2021
Original Balance: $35,000,000
Interest Rate: 1.67%
Maturity Date: July 1, 2037
December 30th, 2022
Original Balance: $82,000,000
Interest Rate: 3.60%
Maturity Date: July 1, 2052
Purpose: The proceeds of the Note will be used for the purpose of providing funds to (i) finance all or a portion of the costs of certain capital improvements benefitting the City, including reconstruction and resurfacing of streets, Kelly/Danforth intersection improvements, Intelligent Traffic System Phase III, sidewalk improvements on 2nd Street and Edmond Road, Golf Course improvements, and Cross Timbers Maintenance Facility expansion, along with related costs; and (ii) pay certain costs associated with the issuance of the Note.
Security: Issued by the Edmond Public Works Authority (EPWA), secured by utility revenues and pledged sales tax. Currently being paid with the restricted sales tax
2021B (Taxable) Note- Governmental
Purpose: The proceeds of the Note will be used for the purpose of providing funds to (i) finance all or a portion of the costs of certain capital improvements benefitting the City, including Golf Course improvements, along with related costs; and (ii) pay certain costs associated with the issuance of the Note.
Security: Issued by the Edmond Public Works Authority (EPWA), secured by utility revenues and pledged sales tax. Currently being paid with the restricted sales tax.
Date: July 5, 2021
Original Balance: $5,000,000 Interest Rate: 1.39%
Maturity Date: July 1, 2027
Fiscal Year Principal Interest Total 2024 1,545,056 1,545,056 2025 4,116,389 4,116,389 2026 $1,487,000 4,116,389 5,603,389 2027 $3,005,000 4,051,161 7,056,161 2028 $3,084,000 3,972,943 7,056,943 2029-2033 16,895,000 18,391,800 35,286,800 2034-2056 115,529,000 43,254,674 158,783,674 Total $140,000,000 $79,448,411 $219,448,411 Date: December 30th, 2022 Original Balance: $140,000,000 Interest Rate: 2.75% Maturity Date: July 1, 2056
Fiscal Year Principal Interest Total 2024 3,769,830 3,769,830 2025 1,260,000 3,737,070 4,997,070 2026 1,325,000 3,669,860 4,994,860 2027 1,395,000 3,599,140 4,994,140 2028 1,470,000 3,524,650 4,994,650 2029-2033 8,570,000 16,363,030 24,933,030 2034- 2052 60,445,000 33,602,935 94,047,935 Total 74,465,000 68,266,515 142,731,515 Date:
Fiscal Year Principal Interest Total 2024 110,000 581,369 691,369 2025 110,000 579,532 689,532 2026 110,000 577,695 687,695 2027 120,000 575,816 695,816 2028 1,790,000 566,882 2,356,882 2029-2033 18,420,000 2,044,247 20,464,247 2034- 2037 14,180,000 478,914 14,658,914 Total 34,840,000 5,404,454 40,244,454
Fiscal Year Principal Interest Total 2024 100,000 67,068 167,068 2025 1,530,000 60,743 1,590,743 2026 1,590,000 39,268 1,629,268 2027 1,630,000 17,028 1,647,028 Total 4,850,000 184,106 5,034,106
10.4 Click Here for Main Directory
2023A Note- Governmental
Purpose: The proceeds of the Note will be used for the purpose of providing funds to (i) finance all or a portion of the costs of certain capital improvements benefitting the City, including the projected construction of the new YMCA and Metropolitan Library to be built on 15th street and I-35.
Security: Issued by the Edmond Public Works Authority (EPWA), secured by utility revenues and pledged sales tax. Currently being paid with the restricted sales tax
2023B Note- Governmental
Date: December 30th, 2022
Original Balance: $34,000,000 Interest Rate: 4.339% Maturity Date: July 1, 2038
December 30th, 2022
Balance: $37,100,000
Rate: 4.14%
Date: July 1, 2038
Purpose: The proceeds of the Note will be used for the purpose of providing funds to (i) finance all or a portion of the costs of certain capital improvements benefitting the City, including the projected construction of the City’s New City Hall and Municipal Court.
Security: Issued by the Edmond Public Works Authority (EPWA), secured by utility revenues and pledged sales tax. Currently being paid with the restricted sales tax
2023C Note- Governmental
Purpose: The proceeds of the Note will be used for the purpose of providing funds to (i) finance all or a portion of the costs of certain capital improvements benefitting the City, including projected construction of the Parking Garage located in Downtown Edmond.
Security: Issued by the Edmond Public Works Authority (EPWA), secured by utility revenues and pledged sales tax. Currently being paid with the restricted sales tax.
Date: December 30th, 2021
Original Balance: $10,000,000
Interest Rate: 5.24%
Maturity Date: July 1, 2038
Fiscal Year Principal Interest Total 2024 $945,000 1,138,043 2,083,043 2025 1,950,000 1,459,005 3,409,005 2026 2,035,000 1,378,432 3,413,432 2027 2,120,000 1,294,281 3,414,281 2028 2,210,000 1,206,652 3,416,652 2029-2033 12,500,000 4,586,219 17,086,219 2034- 2038 15,340,000 1,778,537 17,118,537 Total 37,100,000 13,258,408 49,941,169 Date:
Original
Interest
Maturity
Fiscal Year Principal Interest Total 2024 855,000 1,106,445 2,211,420 20251,765,000 1,419,178 3,184,178 20261,840,000 1,341,836 3,181,836 20271,920,000 1,261,130 3,181,130 20282,010,000 1,176,845 3,186,845 2029-203311,435,000 4,483,597 15,918,597 2034-203814,175,000 1,746,231 15,921,231 Total34,000,000 12,535,263 46,535,263
Fiscal Year Principal Interest Total 2024 235,000 388,500 623,500 2025 485,000 499,611 984,611 2026 515,000 474,100 989,100 2027 540,000 447,164 987,164 2028 570,000 418,803 988,803 2029-2033 3,335,000 1,612,664 4,947,664 2034- 2038 4,320,000 638,694 4,958,694 Total 10,000,000 4,479,535 14,479,535
10.5 Click Here for Main Directory
Bond Rating: AA- City of Edmond's Bond Rating
Projected Debt Payments
---7,605,422 9,711,869 11,806,898 11,777,889 11,755,298 11,729,800 11,711,905 11,681,872 11,655,348 11,637,803 9,949,182 12,271,668 12,249,580 12,203,069 10,382,030 30,964,501 30,988,828 30,990,758 32,251,925 32,266,308 32,281,494 32,290,202 32,298,220 32,307,098 32,344,797 32,354,679 32,309,194 32,318,841 32,348,728 32,337,767 32,356,957 32,364,960 32,913,822 32,427,119 30,593,822 25,600,863 -5,000,000 10,000,000 15,000,000 20,000,000 25,000,000 30,000,000 35,000,000 40,000,000 45,000,000 50,000,000 2044 2043 2042 2041 2040 2039 2038 2037 2036 2035 2034 2033 2032 2031 2030 2029 2028 2027 2026 2025 2024
Business Type 10.6 Click Here for Main Directory
Governental
Capital Improvement Plan (CIP) Fiscal Years 2024 – 2028
Introduction
This document provides a comprehensive plan of capital improvements that are to be undertaken by the City of Edmond over the next five (5) years. Cost estimates and financing methods for the improvements are included and are referenced by individual project. The development of the City’s Capital Improvement Plan is one of the more complex and multi-faceted processes of the City. Striking a balance between the needs and interests of the residents and the financial capacity of the City is a challenging proposition. For this community vision to have meaning, it must be accompanied by deliberate planning that leads the organization and community to its desired future. This requires clearly defined goals, proactive strategies, committed leadership, effective management and above all, the resources to carry out these plans and objectives. The City’s capital budget will include all capital projects funds and all capital resources. The capital budget will be prepared annually although the projects may span out on an on-going, multiyear plan. The multiyear CIP is reviewed annually and is updated and approved by City Council during the budget process.
What is a Capital Improvement Plan?
• A CIP is a multi-year document that summarizes the capital needs of a community over a specific time period. It outlines the individual capital projects, their strategic value and relationship to the community’s longterm goals and objectives as well as the fiscal impact that they pose to the community.
• A CIP (Capital Improvement Plan) is not a wish list, rather it is a realistic plan designed to fulfill the strategic goals and objectives necessary to achieve the mission and vision of the community.
Capital Improvement Plan Prioritization Strategy
• Preserve the past by investing in the continued upgrade of City assets and infrastructure.
• Protect the present with improvements and/or additions to facilities, roads, and capital investments.
• Plan for the future of the organization.
What is a Capital Project?
Capital includes all long-lived infrastructures such as water facilities, sewers, streets, parks and buildings along with major equipment like fire trucks, vehicles, backhoes and fixtures. Many of the larger Capital Project can span several years.
11.1 Click Here for Main Directory
Funding Considerations
In all communities, the cost associated with capital projects far outweighs the available resources necessary to pay for them; in short there is not enough money. This requires prioritization of the projects based upon their perceived impact on the community. Due to the vast number of individual desires, it is near impossible to satisfy everyone and requires a collaborative effort to create situations where the benefits are shared equitably with community stakeholders. In addition, dedicated revenues will, in most cases, determine which projects get funded. For example, the Water/Wastewater Fund may only contribute towards capital projects that improve water and wastewater projects.
Sources of Funding
There are five primary funding sources for capital improvements:
• Cash Funding (revenue sources such as sales tax)
• State/Federal funding (public grants)
• Private Funding (developmental impact fees or charitable donations)
• Bond Issuance
• Note/Loan Debt Issuance
The current CIP is funded primarily from three sources: cash funding, bond issuance, and grants.
Capitalization Criteria
• The asset is owned by the City of Edmond.
• The expected useful life of the asset must be longer than one year or extend the life on an existing asset by more than a year.
• The cost of the asset must be greater than $7500.00 (per item).
• The asset must be tangible.
• On-going repairs and general maintenance are not capitalized.
• Land purchases are booked into our system but will not be depreciated.
• New purchases-All costs associated with bringing that asset into service will be capitalized such as consulting fees, engineering fees, and special equipment for vehicles.
Capital Expenditures:
Sources of Funding add this in place of the last line in that section The City’s capital expenditures are identified mostly in the dedicated 2000 CIP fund and the 2017 CIP fund The 2000 CIP fund is funded by a .75% permanent sales tax and the 2017 CIP fund is funded by a .5% sales tax which was voted on in 2016 for a ten-year period. The total amount of expenditures are shown in the individual department’s budget under capital outlay.
11.2 Click Here for Main Directory
Capital Improvement Process
Ideas for CIP projects can come to management’s attention through several avenues. Some CIP projects get placed in the budget due to necessity-something needs to be repaired. Some CIP projects are put in the budget because of growth and needs. Some projects are put in the budget for economic development reasons. City staff determines the needs, desires, and the time frame of this projects. The project list then proceeds to the CIP Advisory Board for review and once approved it goes to City Council for approval and funding. These CIP projects are located in the 2000 CIP fund and the 2017 CIP fund which have dedicated sales tax revenues. Other smaller projects such as vehicles, machinery and furniture are identified in each individual fund that has planned for those purchases. The EPWA Utility departments are funding their own capital improvements due to the expansion and growth of East Edmond. Their projects are listed in the 5 year CIP list and in their individual department’s budget.
Capital Improvement Projects Advisory Board
The Capital Improvement Projects (CIP) Advisory Board consists of eleven members who serve three-year terms with a maximum of two terms each. As set out in Resolution 02-01 adopted February 12, 2001 by the Edmond City Council, the purpose of the Capital Improvements Sales Tax (Ordinance No. 2574), along with any state and/or federal matching funds. In coordination and consultation with city staff, the Task Force also recommends budgets and construction schedules of eligible projects. The Board meets every third Tuesday of the month.
Conclusion
Our Capital Improvement Plan plays an important role in helping our city reach its strategic objectives. It is equally important to consider the funding and economic considerations. Prudent financial stewardship should be based on cost minimization and long-range capital preservation.
11.3 Click Here for Main Directory Click Here for Main Directory
Five Year Capital Outlay by Funding Source
agreements with OK County for reconstruction of section line roads: Coffee Creek, Air Depot to Midwest; Danforth, Midwest to Douglas;
Danforth to
Description Fund FY23-24 FY24-25 FY25-26 FY26-27 FY27-28 Kitchen Updates General Fund-Senior Citizens Ceneter 20,000 20,000 20,000 20,000 20,000 Subtotal Senior Center 001012 20,000 20,000 20,000 20,000 20,000 Radio Tower General Fund-Parks admin 90,278.00 - - -Subtotal General Fund 001061 90,278 - - -Machinery and tool General Fund-Parks 41,000 - - -Subtotal General Fund 001062 41,000 - - - -
Air Depot,
Covell General Fund - Street & Alley 1,550,000 965,000 1,100,000 1,100,000 1,100,000 Subtotal General Fund 001073 1,550,000 965,000 1,100,000 1,100,000 1,100,000 Radio Tower Replacement General Fund - Emergency Management 52,083 - - -Misc Equipment General Fund - Emergency Management 160,000 35,000 35,000 35,000 35,000 Subtotal Emergency Management 001014 212,083 35,000 35,000 35,000 35,000 Entrance Signs General Fund - Land Betterments 20,000 20,000 20,000 20,000 20,000 Subtotal Streetscape/Med. Comm Image 001163 20,000 20,000 20,000 20,000 20,000 Rehabilitation Special Revenue Fund - CDBG 850,000 400,000 400,000 400,000 400,000 Public Service Special Revenue Fund - CDBG 500,000 243,000 100,000 100,000 100,000 Public Works Special Revenue Fund - CDBG 15,000 15,000 15,000 15,000 15,000 Subtotal Special Revenue Fund 112040 1,365,000 658,000 515,000 515,000 515,000 Future Fire Stations construction and renovation Fire Public Safety Limited Tax 1,500,000 Station #6 Construction and Architectural Services, Trench Rescue Prop Fire Public Safety Limited Tax 6,726,977 Artwork for Fire Station 6 Fire Public Safety Limited Tax 67,270 Fire Station #4 , #5 Admin Conrols Fire Public Safety Limited Tax 300,000 Storage Building Improvments Fire Public Safety Limited Tax 56,000 UTV Skid Unit Fire Public Safety Limited Tax 20,000 SCBA Compressor Replacement Fire Public Safety Limited Tax 38,000 SCBA Compressor Fire Public Safety Limited Tax 52,000 75,000 3 Lifepak 15 Fire Public Safety Limited Tax 140,569 98,400 154,979 Phoenix G2 Alerting All stations/dispatch Fire Public Safety Limited Tax 500,000 Sound System - CSV Fire Public Safety Limited Tax 20,000 Replace AV System Fire Public Safety Limited Tax 100,000 2 Lifepak 15 Fire Public Safety Limited Tax 89,200 Pediatric Maniquin Fire Public Safety Limited Tax 14,000 14,000 Vending Machine Fire Public Safety Limited Tax 22,000 24,000 14,000 16,000 18,000 Oxygen Fill Station Fire Public Safety Limited Tax 8,800 9,600 CAD-TO-CAD INTERFACE Fire Public Safety Limited Tax 50,000 Records Management System Fire Public Safety Limited Tax 50,000 Adult Manequin Fire Public Safety Limited Tax 23,000 23,000 Thermal Imaging Camera E6 Fire Public Safety Limited Tax 7,500 Combi Tools Fire Public Safety Limited Tax 13,000 Radio Tower Replacment Split Fire Public Safety Limited Tax 854,167 - - -Subtotal Fire Public Safety Fund 12110,368,414 308,069 211,000 39,000 172,979 Mitch Park Renovation of Ballfields & Courts Parks Tax Fund - - 250,000 -Mitch Park Amphitheater Improvements Parks Tax Fund - - - 140,000Mitch Park Trail Rebuild Parks Tax Fund - 750,000 - -Neighborhood Play Structure Replacement Parks Tax Fund 400,000 Ted Anderson Play Structure Parks Tax Fund 175,000 Signage Parks Tax Fund 8,000 66,000 50,000 Pool Remodel Parks Tax Fund Tennis Shade, A/V, netting, seating Parks Tax Fund 148,000 50,000 Multi-Activity Center Remodel Parks Tax Fund 750,000 Mitch Park YMCA Competition Pool Maintenance & ReplacementsParks Tax Fund 250,000 Bickham-Rudkin Pond Rehab Parks Tax Fund 120,000 Hafer Trail Rebuild-design Parks Tax Fund 50,000 Pelican Bay Building Remodel Parks Tax Fund 100,000 Pelican Bay Structure Remodel Parks Tax Fund 265,000 Design Service Blake Lighting Parks Tax Fund 35,000 Service Blake Lighting Upgrades Parks Tax Fund 150,000150,000 Service Blake Safety Nets Parks Tax Fund 50,000 Rodeo Facility Updates Parks Tax Fund 40,000 Subtotal Parks Tax Fund 116 1,051,000 1,756,000 1,050,000 140,000Repair of parking lot at the Training Center Police Public Safety Limited Tax 250,000 Access Control for PSC and Other PD Buildings Police Public Safety Limited Tax 750,000 Replacement lock cores and key system for the PSC Police Public Safety Limited Tax 50,000 Improvements at PD Training Center Police Public Safety Limited Tax 2,500,000 Replacement Radio tower split Police Public Safety Limited Tax 902,778 Radio Communication Equipment Police Public Safety Limited Tax 1,169,000 Replacement of the crematorium at Animal Services Police Public Safety Limited Tax 250,000 Misc. Equipment Police Public Safety Limited Tax 15,000 Subtotal Parks Tax Fund 122 4,452,778 250,000 15,000 -1,169,000 Utility Vehicle Replacement Cemetery Care Fund 13,500 Subtotal Cemetery Care Fund 118015 13,500 - - -ARPA American Rescue Plan Act Project 6,103,223 Subtotal ARPAP Fund 224001 6,103,223 - - -Art Art in Public Places 200,000100,000 100,000 100,000 100,000 Subtotal Art in Public Places Fund 123004 200,000 100,000 100,000 100,000 100,000 Downtown Development Edmond Electric Economic Development Fund 100,000 100,000 100,000 100,000 100,000 Subtotal EE Economic Developement Fund 124006 100,000 100,000 100,000 100,000 100,000 ADA Improvements Capital Improvements Fund 400,000400,000 400,000 400,000 400,000 North Timbers Drainage Capital Improvements Fund 75,000.00 3rd Street Demolition Capital Improvements Fund 20,000.00 Railing for Bridge on W. Edmond Road Capital Improvements Fund 15,000.00 Misc. additional/contingency for inflation Capital Improvements Fund 20,000
Inter-local
11.4 Click Here for Main Directory
Five Year Capital Outlay by Funding Source
Description Fund FY23-24 FY24-25 FY25-26 FY26-27 FY27-28
Subtotal Capital Improvements Fund 331001 530,000 400,000 400,000 400,000 400,000 Reconst. & Resurfacing of Streets 2000 Capital Improvement Sales Tax Fund 3,811,000 3,925,330 4,043,090 4,164,383 4,289,314 Kelly & Danforth to coffee Creek 2000 Capital Improvement Sales Tax Fund 1,250,000 Kelly & Danforth Intersection Imp 2001 Capital Improvement Sales Tax Fund 1,800,000 Intelligent Traffic Systems IV 2000 Capital Improvement Sales Tax Fund 600,000 5,700,000 Covell & Coltrane Intersection Imp 2000 Capital Improvement Sales Tax Fund 1,500,000 Danforth Sooner Interchange 2000 Capital Improvement Sales Tax Fund 800,000 1,500,000 5,000,000 Street Construction Costs 2000 Capital Improvement Sales Tax Fund 3,000,000 City Hall & Parking Garage 2000 Capital Improvement Sales Tax Fund 34,000,000 2nd Library and YMCA 2000 Capital Improvement Sales Tax Fund 30,000,000 Pedestrian Underpass 2000 Capital Improvement Sales Tax Fund 1,500,000 Indoor Sports Complex 5,000,000 Veterans Memorial 2000 Capital Improvement Sales Tax Fund 1,500,000 Parking Garage 2000 Capital Improvement Sales Tax Fund 10,000,000 Economic Development Incentive Funds 2000 Capital Improvement Sales Tax Fund 500,000 500,000 Kickingbird Clubhouse Improvement 2000 Capital Improvement Sales Tax Fund 500,000 Cross Timbers Facility Expansion 2000 Capital Improvement Sales Tax Fund 6,050,000 Capitalized Consulting Costs 2000 Capital Improvement Sales Tax Fund 375,000300,000 300,000 300,000 300,000 Subtotal 2000 Capital Improv. Tax Fund 33896,086,000 11,725,330 8,143,090 6,464,383 10,089,314 Regional Transit 2017 Capital Improvement Sales Tax Fund 600,000 2,000,000 2nd and Blvd Intersection 2017 Capital Improvement Sales Tax Fund 500,000 3,000,000Streetscape Hurd & Broadway3rd 2017 Capital Improvement Sales Tax Fund 1,000,000 Broadway & Coffee Creek Inters 2017 Capital Improvement Sales Tax Fund 1,000,000 500,000 5,500,000 Vista Lane Trail 2017 Capital Improvement Sales Tax Fund 100,000 1,000,000 Creek Bend Trail 2017 Capital Improvement Sales Tax Fund 3,000,000 Route 66 Trail to Spring Creek Trail Connection* 2017 Capital Improvement Sales Tax Fund 3,000,000 Stephenson Park Development 2017 Capital Improvement Sales Tax Fund 250,000 Economic Development Incentive 2017 Capital Improvement Sales Tax Fund 500,000 2nd & Coltrane Intersection 2017 Capital Improvement Sales Tax Fund 500,000 AC Caplinger Ball Fields 2017 Capital Improvement Sales Tax Fund 8,000,000 Rectangular Fields 2017 Capital Improvement Sales Tax Fund 800,000 7,500,000 Soccer Complex Improvements 2017 Capital Improvement Sales Tax Fund 250,000 Capitalized Construction Costs 2017 Capital Improvement Sales Tax Fund 150,000200,000 200,000 200,000 Hafer Park Restroom & Fishing 2017 Capital Improvement Sales Tax Fund 1,500,000 Repurpose Bickham Fields 2017 Capital Improvement Sales Tax Fund 250,000 2,000,000 Police Arcadia Lake Station 2017 Capital Improvement Sales Tax Fund 700,000 3,250,000 Fire Station Remodeling- Put in with 121005 in budget book 2017 Capital Improvement Sales Tax Fund - - 5,000,000 -Subtotal 2017 Capital Improv. Tax Fund 34000120,100,000 10,700,000 12,700,000 8,950,000Elec Dist Construction PWA Electric Utility Fund 3,535,000 3,535,000 3,535,000 3,570,000 3,535,000 Machinery & Tools PWA Electric Utility Fund 6,000 6,000 6,000 6,000 6,000 Furniture/Office Equipment PWA Electric Utility Fund 6,000 6,000 6,000 6,000 6,000 AMI/Communication Equipment PWA Electric Utility Fund 25,000 25,000 25,000 25,000 25,000 Substation Projects PWA Electric Utility Fund 2,201,000 986,500 1,141,500 801,500 666,750 Testing Equipment PWA Electric Utility Fund 12,000 12,000 12,000 12,000 12,000 Hardware/Software Systems PWA Electric Utility Fund 25,000 25,000 25,000 25,000 25,000 Radio Tower PWA Electric Utility Fund 187,500 - - -Subtotal PWA Electric Utility Fund 562032 5,997,500 4,595,500 4,750,500 4,445,500 4,275,750 W TP Expansion Engineering/ Inspection Fees PWA Water Utility Fund 5,000,000 W ater system construction, rehabilitation and replacement (includes construction, easement purchases & engineering) PWA Water Utility Fund 4,600,000 4,600,000 4,800,000 4,800,000 4,800,000 New Meter Installs PWA Water Utility Fund 200,000 200,000 200,000 200,000 200,000 Master Plan Engineering PWA Water Utility Fund 1,500,000 1,500,000 1,500,000 1,500,000 1,500,000 Tower/Ground Storage Rehab PWA Water Utility Fund 1,500,000 Pump Replacement PWA Water Utility Fund 100,000100,000 100,000 100,000 100,000 Lime Slaker PWA Water Utility Fund 170,000170,000 170,000 170,000 170,000 Utility Cart Replacement PWA Water Utility Fund 80,000 Well Srevices PWA Water Utility Fund 270,000270,000 270,000 270,000 270,000 Well Pumps and Motors PWA Water Utility Fund 240,000 240,000 240,000 240,000 240,000 Radio tower Replacement PWA Water Utility Fund 52,083 - - -Subtotal PWA Water Utility Fund 56313,712,083 7,080,000 7,280,000 7,280,000 7,280,000 Machinery & Tools 2,154 2,208 2,263 2,319 2,377 Equipment Solid Waste Fund 2,692 2,759 2,828 2,899 2,971 Subtotal Solid Waste Fund 564344 4,846 4,967 5,091 5,218 5,349 Master Plan Engineering PWA Wastewater Utility Fund 1,000,0001,000,000 1,000,0001,000,0001,000,000 Master Plan Engineering (m0003730) PWA Wastewater Utility Fund 1,000,000 Oak Tree Elect & Odor Control Upgrades PWA Wastewater Utility Fund 400,000 Replacement Grinder Units PWA Wastewater Utility Fund 100,000100,000 100,000 100,000 100,000 Replacement Pump Program PWA Wastewater Utility Fund 100,000100,000 100,000 100,000 100,000 Utility Cart Replacements PWA Wastewater Utility Fund 80,000 Existing line replacement PWA Wastewater Utility Fund 3,300,000 3,600,000 4,600,000 4,600,000 4,600,000 Subtotal PWA Wastewater Utility Fund 565352 5,980,000 4,800,000 5,800,000 5,800,000 5,800,000 Zero Turn mower PWA Arcadia Lake Fund 10,000 UTV for Ground Maintenance PWA Arcadia Lake Fund 10,000 10,000 Subtotal Arcadia Lake Fund 567037 - 10,000 10,000 10,000Ridgecrest Storm Sewer & easements Drainage Utility 1,270,000 Hollowdale Storm Sewer Drainage Utility 1,425,000 Main Street Detention and Storm Sewer and easments Drainage Utility 8,200,000 Capital View Storm Sewer Drainage Utility 425,000 2,260,000 Huntwick Detention Pond, Easment Drainage Utility 360,000 Flood Study for Danforth Rd between Midwest and Douglas Drainage Utility 150,000 Signal Ridge Detention Pond Drainage Utility 175,000 Rankin to Pine and 15th St. to RidgecrestStudy, storm sewer, easmentsDrainage Utility 275,000 2,910,000 LakeSide Circle Storm Sewer Design Drainage Utility 295,000 Detention Pond F Drainage Utility 410,000 Bradbury Drive Drainage Utility 175,000 Detention Pond G Drainage Utility 125,000 Classen Addition N of 2nd Street Feasibility Study, Improvments Drainage Utility 1,550,000 Feasibility Study Drainage Utility 350,000 11.5 Click Here for Main Directory
Five Year Capital Outlay by Funding Source
Description Fund FY23-24 FY24-25 FY25-26 FY26-27 FY27-28
Detention Pond H Drainage Utility 525,000 Detention Pond I Drainage Utility 560,000 Subtotal Drainage Utility Fund 56803812,005,000 3,415,000 3,035,000 2,075,000 910,000 Machinery & Tools KickingBird Golf Course Fund 115,000 125,000 76,000 65,000 45,000 Subtotal KickingBird Golf Course Fund 570740 115,000 125,000 76,000 65,000 45,000 Building & Improvements CityLink Fund 300,000 Subtotal CityLink Fund 572941 300,000 - - -Document Imaging Lease Admin Support Services-General Govt. 42,000 42,000 42,000 42,000 42,000 Subtotal Admin Support Services 652052 42,000 42,000 42,000 42,000 42,000 Document Imaging Lease Admin Support Services-General Govt. 315,000300,000 300,000 300,000 350,000 Replace Radio Tower Admin Support Services-General Govt. 48,611 - - -Subtotal Admin Support Services 652057 363,611 300,000 300,000 300,000 350,000 Radio Tower Admin Support Services-Central Communications 69,444 - - -Subtotal Admin Support Services 652541 69,444 - - -Radio Tower Admin Support Services-Central Communications 38,194 - - -Subtotal Admin Support Services 652561 38,194 - - -Audio/Visual Equipment Upgrades Admin Support Services-Marketing 10,000 10,000 10,000 10,000 10,000 Subtotal Admin Support Services 652058 10,000 10,000 10,000 10,000 10,000 Furniture/Office Equipment/IT Equipment Admin Support Services-IT 1,275,000 1,425,000 1,065,000 625,000 625,000 Subtotal Admin Support Services 652060 1,275,000 1,425,000 1,065,000 625,000 625,000 Machinery and tools 813,860 422,655 437,616 459,713 483,017 Motor Vehicle Fleet Replacement Fleet Management Fund (All divisions) 5,574,3624,617,190 4,314,6465,765,3883,869,896 Subtotal Fleet Management Fund 653 6,388,222 5,039,845 4,752,262 6,225,101 4,352,913 Radio Tower Machinery and tools 204,860 - - -Subtotal Fleet Management Field Services 654 204,860 - - -Total Capital Outlay 188,809,036 $ 53,884,711 $ 51,534,943 $ 44,766,202 $ 37,417,305 $ FIVE YEAR TOTAL376,412,197 $ 11.6 Click Here for Main Directory
Capital Outlay
Capital Project: Replacement of Radio Tower Fund: Multiple Funds
Project Description This Project is to replace the radio tower at UCO and move it to a new loca on. There are many funds coming together to pay for this project to be done in FY24.
Funding Source Gen Fund Parks Admin, GF Emergency Management, Fire Public Safety Limited Tax, PWA Electric U lity Fund, PWA Water U lity Fund, Admin Support Services-General Govt., Admin Support Services-Central Communica ons, Fleet Management Field Se rvices 654, and Police Public Safety Limited Tax. Five-Year
Capital Outlay
Capital Project: Kitchen Updates and Replacements Fund: 001012 Senior Citizens Center
Project Description This project is for new equipment and updates that will be needed at the Senior Ci zen Center.
Funding Source Transfer from the General fund (2% of 8.25% Sales Tax rate). Five-Year Project Funding Summary
Project Funding Summary FY 24 Cost FY 25 Cost FY 26 Cost FY 27 Cost FY 28 Cost 5 Year Cost Capital Cost 2,499,998.00
FY 24 Cost FY 25 Cost FY 26 Cost FY 27 Cost FY 28 Cost 5 Year Cost Capital Cost 20,000.00 20,000.00 20,000.00 20,000.00 20,000.00 100,000.00 11.7 Click Here for Main Directory
Capital Outlay
Capital Project: Parks Machinery, Tools, and Equipment
Fund: 001062 General Fund‐ Parks
Project Description This project is for new machinery, tools, and equipment that will be needed in FY24 for upkeep within the parks department.
Funding Source Transfer from the General fund (2% of 8.25% Sales Tax rate).
Capital Outlay
Capital Project: Street Rehab Resurface & Reconstruction Fund: 001073 Street and Alley
Project Description This Project is for the Rehab, reconstruc on and Resurfacing of the following roads with Inter-local agreements with Oklahoma County: Coffee Creek, Air Depot to Midwest; Danforth, Midwest to Douglas; Air Depot, Danforth to Covell.
Funding Source Transfer from the General fund (2% of 8.25% Sales Tax rate).
Five-Year Project Funding Summary
Capital Outlay
Capital Project: Emergency Equipment
Fund: 001014
Project Description This project is for various equipment needs that Emergency Management will need as new and/or replacements to old equipment.
Funding Source Transfer from the General fund (2% of 8.25% Sales Tax rate).
Five-Year Project Funding Summary
FY 24 Cost FY 25 Cost FY 26 Cost FY 27 Cost FY 28 Cost 5 Year Cost Capital Cost 41,000.00 - - - - 41,000.00
Five-Year Project Funding Summary
FY 24 Cost FY 25 Cost FY 26 Cost FY 27 Cost FY 28 Cost 5 Year Cost Capital Cost 1,550,000.00 965,000.00 1,100,000.00 1,100,000.00 1,100,000.00 5,815,000.00
FY 24 Cost FY 25 Cost FY 26 Cost FY 27 Cost FY 28 Cost 5 Year Cost Capital Cost 160,000.00 35,000.00 35,000.00 35,000.00 35,000.00 300,000.00 11.8 Click Here for Main Directory
Capital Outlay
Capital Project: Entrance Signs
Fund: 001163 Community Image
Project Description This Project is for Entrance signs that will be placed and replaced throughout the city.
Funding Source Transfer from the General fund (2% of 8.25% Sales Tax rate).
Five-Year Project Funding Summary
Capital Outlay
Capital Project: CDBG Rehabilitation, Public Service, and Public Works Fund: 112040 CDBG
Project Description This Project covers the expenses that CDBG will incur over FY24.
Funding Source Transfer from the General fund (2% of 8.25% Sales Tax rate).
Five-Year Project Funding Summary
Capital Outlay
Capital Project: Fire Equipment Fund: 121‐ Fire Public Safety Fund
Project Description This project is for various equipment needs that our Fire Department will need as new and/or replacements to old equipment, such as Lifepaks, tools, Thermal Imaging Cameras, etc.
Funding Source Pay as you go- Fire Tax (.250% of 8.25% Sales Tax Rate).
Five-Year Project Funding Summary
FY 24 Cost FY 25 Cost FY 26 Cost FY 27 Cost FY 28 Cost 5 Year Cost Capital Cost 20,000.00 20,000.00 20,000.00 20,000.00 20,000.00 100,000.00
FY 24 Cost FY 25 Cost FY 26 Cost FY 27 Cost FY 28 Cost 5 Year Cost Capital Cost 1,365,000.00 1,365,000.00
FY 24 Cost FY 25 Cost FY 26 Cost FY 27 Cost FY 28 Cost 5 Year Cost Capital Cost 64,000.00 308,069.00 211,000.00 39,000.00 172,979.00 1,595,048.00 11.9 Click Here for Main Directory
Capital Outlay
Capital Project: Future Fire Station Construction
Fund: 121‐ Fire Public Safety Limited Tax, 340‐ 2017 Capital Improvement Sales Tax Fund
Project Description This Project is for Future Fire Sta on Construc on, renova on, admin controls, and Storage Building Improvements, 5mm coming in from 2017 Capital Improvement Sales Tax Fund In FY26.
Funding Source Pay as you go- Fire Tax (.250% of 8.25% Sales Tax Rate). Five-Year
Capital Outlay
Capital Project: Fire Station #6
Fund: 121‐ Fire Public Safety Limited Tax
Project Description This project is for Sta on #6 Construc on and Architectural Services, Trench Rescue Prop, and artwork for sta on 6.
Funding Source Pay as you go- Fire Tax (.250% of 8.25% Sales Tax Rate). Five-Year Project Funding Summary
FY 24 Cost FY 25 Cost FY 26 Cost FY 27 Cost FY 28 Cost 5 Year Cost Capital Cost 1,856,000.00 5,000,000.00 - 6,856,000.00
Project Funding Summary
FY 24 Cost FY 25 Cost FY 26 Cost FY 27 Cost FY 28 Cost 5 Year Cost Capital Cost 6,794,247.00 - - - - 6,794,247.00 11.10 Click Here for Main Directory
Capital Outlay
Capital Project: Mitch Park and Multi‐ Activity Center Improvements
Fund: 116‐Park Tax Fund
Project Description This Project is for Mitch Park Ball field and Court Renova on, Amphitheater Improvements, trail rebuilds, pool maintenance and replacements, MAC center remodel.
Funding Source Pay as you go- Park Tax (.125% of 8.25% Sales Tax Rate).
Five-Year Project Funding Summary
Capital Outlay
Capital Project: Service Blake Soccer Fields
Fund: 116‐Park Tax Fund
Project Description This Project is for Service Blake Soccer Fields Ligh ng Design, Ligh ng Upgrades, and New safety nets.
Funding Source Pay as you go- Park Tax (.125% of 8.25% Sales Tax Rate).
Five-Year Project Funding Summary
Capital Outlay
Capital Project: Play Structures, Park Rehabs and Remodels
Fund: 116 Park Tax Fund
Project Description This Project is for Neighborhood Play structure replacements, including Ted Anderson Play structure, Signage, Tennis A/V, Ne ng, Sea ng, Bickham Rudkin Pond Rehab, Hafer Park Trail Design, and Pelican Bay Remodeling.
Funding Source Pay as you go- Park Tax (.125% of 8.25% Sales Tax Rate). Five-Year Project Funding Summary
FY 24 Cost FY 25 Cost FY 26 Cost FY 27 Cost FY 28 Cost 5 Year Cost Capital Cost - 1,000,000.00 1,000,000.00 140,000.00 - 2,140,000.00
FY 24 Cost FY 25 Cost FY 26 Cost FY 27 Cost FY 28 Cost 5 Year Cost Capital Cost 185,000.00 200,000.00 - - - 385,000.00
FY 24 Cost FY 25 Cost FY 26 Cost FY 27 Cost FY 28 Cost 5 Year Cost Capital Cost 866,000.00 556,000.00 50,000.00 - - 1,472,000.00 11.11 Click Here for Main Directory
Capital Outlay
Capital Project: PD Training Center
Fund: 122 Police Public Safety Tax
Project Description This Project is for PD Training Center Repairs and Improvements.
Funding Source Pay as you go- Police Tax (.125% of 8.25% Sales Tax Rate).
Capital Outlay
Capital Project: Public Safety Center and other Police Building Improvements
Fund: 122 Police Public Safety Tax
Project Description This Project is for Public Safety Center and other Police Building Improvements.
Funding Source Pay as you go- Police Tax (.125% of 8.25% Sales Tax Rate).
Capital Outlay
Capital Project: Animal Services Crematorium and Police Equipment Purchases
Fund: 122 Police Public Safety Tax
Project Description This project is for Animal Services Crematorium and other Police Equipment Purchases.
Funding Source Pay as you go- Police Tax (.125% of 8.25% Sales Tax Rate).
FY 24 Cost FY 25 Cost FY 26 Cost FY 27 Cost FY 28 Cost 5 Year Cost Capital Cost 2,750,000.00 - - - - 2,750,000.00
Five-Year Project Funding Summary
Project Funding Summary FY 24 Cost FY 25 Cost FY 26 Cost FY 27 Cost FY 28 Cost 5 Year Cost Capital Cost 800,000.00 - - - - 800,000.00
Five-Year
Project Funding Summary FY 24 Cost FY 25 Cost FY 26 Cost FY 27 Cost FY 28 Cost 5 Year Cost Capital Cost - 250,000.00 15,000.00 - 1,169,000.00 1,434,000.00 11.12 Click Here for Main Directory
Five-Year
Capital Outlay
Capital Project: Utility Vehicle Replacement Fund: 118015 Cemetery Care Fund
Project Description This Project is for a new U lity Vehicle Replacement for the Cemetery maintenance in FY24.
Funding Source Transfer from the General fund (2% of 8.25% Sales Tax rate).
Five-Year Project Funding Summary
Capital Outlay
Capital Project: American Rescue Plan Act Project
Fund: 224001 American Rescue Plan Act Project
Project Description American Rescue Plan Act Project
Funding Source American Rescue Plan Act Project Funding Five-Year Project Funding Summary
Capital Outlay
Capital Project: Public Art
Fund: 123004‐ Art in Public Places
Project Description This Project is the City’s match each Fiscal year for public art.
Funding Source Transfer from the General fund (2% of 8.25% Sales Tax rate).
Five-Year Project Funding Summary
FY 24 Cost FY 25 Cost FY 26 Cost FY 27 Cost FY 28 Cost 5 Year Cost Capital Cost 13,500.00 - - - - 13,500.00
FY 24 Cost FY 25 Cost FY 26 Cost FY 27 Cost FY 28 Cost 5 Year Cost Capital Cost 6,103,223.00 - - - - 6,103,223.00
FY 24 Cost FY 25 Cost FY 26 Cost FY 27 Cost FY 28 Cost 5 Year Cost Capital Cost 200,000.00 100,000.00 100,000.00 100,000.00 100,000.00 600,000.00 11.13 Click Here for Main Directory
Capital Outlay
Capital Project: Edmond Electric Economic Development Fund
Fund: 124006 Edmond Electric Economic Development Fund
Project Description This project is to cover the expenses incurred Edmond Electric Economic Development Fund each year.
Funding Source Transfer from the General fund (2% of 8.25% Sales Tax rate).
Five-Year Project Funding Summary
Capital Outlay
Capital Project: ADA Improvements
Fund: 331‐ Capital Improvements Fund
Project Description This project is for ADA Improvements across the city as well as addi onal con nencies for infla on.
Funding Source Transfer from the General fund (2% of 8.25% Sales Tax rate).
Five-Year Project Funding Summary
Capital Outlay
Capital Project: North Timbers Drainage
Fund: 331‐ Capital Improvements Fund
Project Description This project is for North Timbers Drainage.
Funding Source Transfer from the General fund (2% of 8.25% Sales Tax rate).
Five-Year Project Funding Summary
FY 24 Cost FY 25 Cost FY 26 Cost FY 27 Cost FY 28 Cost 5 Year Cost Capital Cost 100,000.00 100,000.00 100,000.00 100,000.00 100,000.00 500,000.00
FY 24 Cost FY 25 Cost FY 26 Cost FY 27 Cost FY 28 Cost 5 Year Cost Capital Cost 420,000.00 400,000.00 400,000.00 400,000.00 400,000.00 2,020,000.00
FY 24 Cost FY 25 Cost FY 26 Cost FY 27 Cost FY 28 Cost 5 Year Cost Capital Cost 75,000.00 - - - - 75,000.00 11.14 Click Here for Main Directory
Capital Outlay
Capital Project: 3rd Street Demolition
Fund: 331‐ Capital Improvements Fund
Project Description This project is for 3rd Street Demoli on.
Funding Source Transfer from the General fund (2% of 8.25% Sales Tax rate).
Capital Outlay
Capital Project: Railing for Bridge on W. Edmond Road
Fund: 331‐ Capital Improvements Fund
Project Description This project is for Railing for Bridge on W. Edmond Road.
Funding Source Transfer from the General fund (2% of 8.25% Sales Tax rate). Five-Year
Capital Outlay
Capital Project: Street Reconstruction and Resurfacing
Fund: 338‐ 2000 Capital Improvement Sales Tax Fund
Project Description This Project is for Reconstruc on & Resurfacing of Streets, streets construc on costs, and Capitalized Consul ng Costs.
Funding Source Pay as you go- 2000 CIP Tax (.750% of 8.25% Sales Tax Rate).
Funding
FY 24 Cost FY 25 Cost FY 26 Cost FY 27 Cost FY 28 Cost 5 Year Cost Capital Cost 20,000.00 - - - - 20,000.00
Five-Year Project
Summary
Project Funding Summary FY 24 Cost FY 25 Cost FY 26 Cost FY 27 Cost FY 28 Cost 5 Year Cost Capital Cost 15,000.00 - - - - 15,000.00
Project Funding Summary FY 24 Cost FY 25 Cost FY 26 Cost FY 27 Cost FY 28 Cost 5 Year Cost Capital Cost 7,186,000.00 4,225,330.00 4,343,090.00 4,464,383.00 4,589,314.00 24,808,117.00 11.15 Click Here for Main Directory
Five-Year
Capital Outlay
Capital Project: Kelly Street and Intersection Improvements
Fund: 338‐ 2000 Capital Improvement Sales Tax Fund
Project Description This Project is for Kelly & Danforth to Coffee Creek Street Improvements, Kelly and Danforth intersec on improvements, and Covell and Coltrane Improvements.
Funding Source Pay as you go- 2000 CIP Tax (.750% of 8.25% Sales Tax Rate).
Capital Outlay
Capital Project: Intelligent Traffic Systems Phase IV
Fund: 338‐ 2000 Capital Improvement Sales Tax Fund
Project Description This Project is for the Fourth Phase of the Intelligent Traffic Systems.
Funding Source Pay as you go- 2000 CIP Tax (.750% of 8.25% Sales Tax Rate) and Bond Proceeds.
Capital Outlay
Capital Project: New City Hall and Parking Garage
Fund: 338‐ 2000 Capital Improvement Sales Tax Fund
Project Description This Project is for the New City Hall and Parking Garage to be paid in FY24.
Funding Source Pay as you go- 2000 CIP Tax (.750% of 8.25% Sales Tax Rate) and Bond Proceeds.
Five-Year Project Funding Summary FY 24 Cost FY 25 Cost FY 26 Cost FY 27 Cost FY 28 Cost 5 Year Cost Capital Cost 2,750,000.00 1,800,000.00 - - - 4,550,000.00
Five-Year Project Funding Summary FY 24 Cost FY 25 Cost FY 26 Cost FY 27 Cost FY 28 Cost 5 Year Cost Capital Cost 600,000.00 5,700,000.00 - - - 6,300,000.00
Five-Year Project Funding Summary FY 24 Cost FY 25 Cost FY 26 Cost FY 27 Cost FY 28 Cost 5 Year Cost Capital Cost 44,000,000.00 - - - - 44,000,000.00 11.16 Click Here for Main Directory
Capital Outlay
Capital Project: 2nd Library and YMCA
Fund: 338‐ 2000 Capital Improvement Sales Tax Fund
Project Description This Project is for the 2nd Library and YMCA located on I-35.
Funding Source Pay as you go- 2000 CIP Tax (.750% of 8.25% Sales Tax Rate) and Bond Proceeds
Capital Outlay
Capital Project: Various Projects from 2000 CIP Funds
Fund: 338‐ 2000 Capital Improvement Sales Tax Fund
Project Description This Project is for specifically Cross Timbers Expansion (FY24),an Indoor Sports Complex (FY24), remaining KickingBird Clubhouse improvements (FY 24), Pedestrian Underpass (FY26), Veterans Memorial (FY26), and Econ Development Incen ve Funds(FY27 & FY28).
Funding Source Pay as you go- 2000 CIP Tax (.750% of 8.25% Sales Tax Rate).
Five-Year Project Funding Summary FY 24 Cost FY 25 Cost FY 26 Cost FY 27 Cost FY 28 Cost 5 Year Cost Capital Cost 30,000,000.00 - - - - 30,000,000.00
Five-Year Project Funding Summary FY 24 Cost FY 25 Cost FY 26 Cost FY 27 Cost FY 28 Cost 5 Year Cost Capital Cost 11,550,000.00 - 3,000,000.00 500,000.00 500,000.00 15,550,000.00 11.17 Click Here for Main Directory
Capital Outlay
Capital Project: Danforth Sooner Interchange*
Fund: 338‐ 2000 Capital Improvement Sales Tax Fund, 340‐2017 Capital Improvement Sales Tax Fund
Project Description This Project is the City’s por on for construc on of the Danforth Sooner Interchange.
Funding Source Pay as you go- 2000 CIP Tax (.750% of 8.25% Sales Tax Rate) and State Grant Funding.
Five-Year Project Funding Summary
*State Grant Projects - City only cost listed
Capital Outlay
Capital Project: Vista Lane Trail, Creek Bend Trail, Route 66 Trail to Spring Creek Trail Connection*
Fund: 340‐2017 Capital Improvement Sales Tax Fund
Project Description This project is for the construc on of Vista Lane Trail, Creek Bend Trail, and the City’s por on of the Route 66 Trail to Spring Creek Trail Connec on.
Funding Source Pay as you go- 2017 CIP Tax (.500% of 8.25% Sales Tax Rate) and State Grant Funding.
Five-Year Project Funding Summary
*State Grant Projects - City only cost listed
FY 24 Cost FY 25 Cost FY 26 Cost FY 27 Cost FY 28 Cost 5 Year Cost Capital Cost - - 800,000.00 1,500,000.00 5,000,000.00 7,300,000.00
FY 24 Cost FY 25 Cost FY 26 Cost FY 27 Cost FY 28 Cost 5 Year Cost Capital Cost 6,100,000.00 1,000,000.00 - - - 7,100,000.00
11.18 Click Here for Main Directory
Capital Outlay
Capital Project: Ballfield Projects Fund: 340‐2017 Capital Improvement Sales Tax Fund
Project Description This Project is for the rehabilita on of AC Caplinger Ball Fields, Rectangular Fields, Soccer Complex, and the Repurpose of Bickham Fields.
Funding Source Pay as you go- 2017 CIP Tax (.500% of 8.25% Sales Tax Rate).
Five-Year Project Funding Summary
Capital Outlay
Capital Project: Street Improvements and Regional Transit Fund: 340‐2017 Capital Improvement Sales Tax Fund
Project Description This Project is for Various projects funded by the 2017 CIP Fund including: Regional Transit, Streetscape For Hurd And Broadway, 2nd and Blvd intersec on improvements, Broadway and Coffee Creek Intersec on Improvements, Capitalized Construc on Costs, and Economic Development Incen ves.
Funding Source Pay as you go- 2017 CIP Tax (.500% of 8.25% Sales Tax Rate).
Five-Year Project Funding Summary
FY 24 Cost FY 25 Cost FY 26 Cost FY 27 Cost FY 28 Cost 5 Year Cost Capital Cost 9,300,000.00 7,500,000.00 2,000,000.00 - - 18,800,000.00
FY 24 Cost FY 25 Cost FY 26 Cost FY 27 Cost FY 28 Cost 5 Year Cost Capital Cost 1,750,000.00 2,200,000.00 3,200,000.00 8,700,000.00 - 15,850,000.00 11.19 Click Here for Main Directory
Capital Outlay
Capital Project: Development of Multiple Parks
Fund: 340‐2017 Capital Improvement Sales Tax Fund
Project Description This project is for the following parks improvements funded by the 2017 CIP: Stephenson Park Development, Hafer park Bathrooms & fishing ponds, and Police Sta on at Arcadia Lake.
Funding Source Pay as you go- 2017 CIP Tax (.500% of 8.25% Sales Tax Rate).
Capital Outlay
Capital Project: Electric Construction, Substation Projects, Equipment, and Tools
Fund: 562‐PWA Electric Utility Fund
Project Description This project is specifically for the following: Electric Distribu on Construc on, Tools, Equipment, Hardware/So ware Systems, and Substa on Projects.
Funding Source Revenues from U lity Charges.
Five-Year Project Funding Summary
Project Funding Summary FY 24 Cost FY 25 Cost FY 26 Cost FY 27 Cost FY 28 Cost 5 Year Cost Capital Cost 2,450,000.00 - - 3,250,000.00 - 5,700,000.00
Five-Year
FY 24 Cost FY 25 Cost FY 26 Cost FY 27 Cost FY 28 Cost 5 Year Cost Capital Cost 5,810,000.00 4,595,500.00 4,750,500.00 4,445,500.00 4,275,750.00 23,877,250.00 11.20 Click Here for Main Directory
Capital Outlay
Capital Project: WTP Expansion Engineering/ Inspection Fees, Water system
construction
Fund: 563‐PWA Water Utility Fund
Project Description This project is specifically for the following: WTP Expansion Engineering/ Inspec on Fees, Water system construc on, rehabilita on, and replacement (includes construc on, easement purchases & engineering).
Funding Source Revenues from U lity Charges and Bond Proceeds.
Capital Outlay
Capital Project: New Meter Installs, Various Equipment Replacements
Fund: 563‐PWA Water Utility Fund
Project Description This project is specifically for the following: New Meter Installs, Pump Replacements, Lime Slakers, U lity Cart Replacements, Well Services, and Well Pumps and Motors. Funding Source Revenues from U lity Charges.
Capital Outlay
Capital Project: Master Plan Engineering, Tower/Ground Storage Rehab
Fund: 563‐PWA Water Utility Fund
Project Description This project is for Master Plan Engineering and Tower/Ground Storage Rehab.
Funding Source Revenues from U lity Charges.
Five-Year Project Funding Summary FY 24 Cost FY 25 Cost FY 26 Cost FY 27 Cost FY 28 Cost 5 Year Cost Capital Cost 9,600,000.00 4,600,000.00 4,800,000.00 4,800,000.00 4,800,000.00 28,600,000.00
Five-Year Project Funding Summary FY 24 Cost FY 25 Cost FY 26 Cost FY 27 Cost FY 28 Cost 5 Year Cost Capital Cost 1,060,000.00 980,000.00 980,000.00 980,000.00 980,000.00 4,980,000.00
Five-Year Project Funding Summary FY 24 Cost FY 25 Cost FY 26 Cost FY 27 Cost FY 28 Cost 5 Year Cost Capital Cost 3,000,000.00 1,500,000.00 1,500,000.00 1,500,000.00 1,500,000.00 9,000,000.00 11.21 Click Here for Main Directory
Capital Outlay
Capital Project: Equipment, Machinery, and Tools
Fund: 564‐Solid Waste Fund
Project Description This Project is specifically for Equipment, Machinery, and Tools for the Solid Waste Department.
Funding Source Revenues from U lity Charges.
Five-Year Project Funding Summary
Capital Outlay
Capital Project: Master Plan Engineering, Oak Tree Elect & Odor Control Upgrades
Fund: 565‐ PWA Wastewater Utility Fund
Project Description This project is specifically for Master Plan Engineering and Oak Tree Elect & Odor Control Upgrades.
Funding Source Revenues from U lity Charges and Bond Proceeds.
Five-Year Project Funding Summary
Capital Outlay
Capital Project: Various Equipment replacements and upgrades
Fund: 565‐ PWA Wastewater Utility Fund
Project Description This Project Is Specifically for the following: Replacement Grinder Units, Replacement Pump Program, U lity Cart Replacements, and Exis ng Line Replacement.
Funding Source Revenues from U lity Charges. Five-Year Project Funding Summary
FY 24 Cost FY 25 Cost FY 26 Cost FY 27 Cost FY 28 Cost 5 Year Cost Capital Cost 4,846 4,967 5,091 5,218 5,349 25,471
FY 24 Cost FY 25 Cost FY 26 Cost FY 27 Cost FY 28 Cost 5 Year Cost Capital Cost 2,400,000.00 1,000,000.00 1,000,000.00 1,000,000.00 1,000,000.00 6,400,000.00
FY 24 Cost FY 25 Cost FY 26 Cost FY 27 Cost FY 28 Cost 5 Year Cost Capital Cost 3,580,000.00 3,800,000.00 4,800,000.00 4,800,000.00 4,800,000.00 21,780,000.00 11.22 Click Here for Main Directory
Capital Outlay
Capital Project: Ground Maintenance Equipment
Fund: 567‐PWA Arcadia Lake Fund
Project Description This project is specifically for Zero Turn Mower & UTV for ground Maintenance.
Funding Source Revenues from U lity Charges.
Five-Year Project Funding Summary
Capital Outlay
Capital Project: Storm Sewer Projects
Fund: 568‐ Drainage Utility
Project Description This project is specifically for the following: Storm Sewer Projects at Ridgecrest, Hollowdale, Capital View, Rankin to Pine, and Lakeside.
Funding Source Revenues from U lity Charges.
Five-Year Project Funding Summary
Capital Outlay
Capital Project: Detention Pond Projects
Fund: 568‐ Drainage Utility
Project Description This project is specifically for the following: Deten on Pond Projects at Huntwick, Signal Ridge, Bradbury Drive, and Deten on Pond F, G, H, and I.
Funding Source Revenues from U lity Charges. Five-Year
FY 24 Cost FY 25 Cost FY 26 Cost FY 27 Cost FY 28 Cost 5 Year Cost Capital Cost - 10,000.00 10,000.00 10,000.00 - 30,000.00
FY 24 Cost FY 25 Cost FY 26 Cost FY 27 Cost FY 28 Cost 5 Year Cost Capital Cost 3,120,000.00 2,830,000.00 2,910,000.00 - - 8,860,000.00
FY 24 Cost FY 25 Cost FY 26 Cost FY 27 Cost FY 28 Cost 5 Year Cost Capital Cost 535,000.00 585,000.00 125,000.00 525,000.00 560,000.00 2,330,000.00 11.23 Click Here for Main Directory
Project Funding Summary
Capital Outlay
Capital Project: Flood and Feasibility Studies
Fund: 568‐ Drainage Utility
Project Description This project is for the following: Flood Study for Danforth Rd between Midwest and Douglas, and other studies.
Funding Source Revenues from U lity Charges.
Capital Outlay
Capital Project: Main Street Detention and Storm Sewer and Easements
Fund: 568‐ Drainage Utility
Project Description This Project is specifically for Main Street Deten on, Storm Sewer, and Easements. Project will be fully funded in FY24.
Funding Source Pay as you go (Sales Tax Revenue). Five-Year
Capital Outlay
Capital Project: Machinery & Tools for Golf Course
Fund: 570‐KickingBird Golf Course Fund
Project Description This Project is Specifically for Machinery & Tools for KickingBird Golf Course.
Funding Source Revenue Generated by Fund and Transfer from General Fund.
Five-Year Project Funding Summary
FY 24 Cost FY 25 Cost FY 26 Cost FY 27 Cost FY 28 Cost 5 Year Cost Capital Cost 150,000.00 - - 1,550,000.00 350,000.00 2,050,000.00
Five-Year Project Funding Summary
FY 24 Cost FY 25 Cost FY 26 Cost FY 27 Cost FY 28 Cost 5 Year Cost Capital Cost 8,200,000.00 - - - - 8,200,000.00
Project Funding Summary
FY 24 Cost FY 25 Cost FY 26 Cost FY 27 Cost FY 28 Cost 5 Year Cost Capital Cost 115,000.00 125,000.00 76,000.00 65,000.00 45,000.00 426,000.00 11.24 Click Here for Main Directory
Capital Outlay
Capital Project: Building & Improvements
Fund: 572‐ CityLink Fund
Project Description This project is for Building and Improvements in FY24 for the CityLink Fund.
Funding Source Revenue Generated by Fund and Transfer from General Fund.
Five-Year Project Funding Summary
Capital Outlay
Capital Project: Document Lease, Equipment for Various Departments
Fund: 652‐ Admin Support Services
Project Description This project is specifically for the following: Document Imaging Lease for Administra ve Support, Audio Visual Equipment for Marke ng, and Furniture/Office Equipment/ IT equipment for IT.
Funding Source Transfer from the General fund (2% of 8.25% Sales Tax rate).
Five-Year Project Funding Summary
Capital Outlay
Capital Project: Fleet Management Costs, Machinery and tools
Fund: 653‐Fleet Management
Project Description This project is specifically for the purchases of new Fleet, Fleet Repairs, as well as Machinery and Tools needed each year for Fleet Maintenance .
Funding Source Transfer from the General fund (2% of 8.25% Sales Tax rate).
Five-Year Project Funding Summary
FY 24 Cost FY 25 Cost FY 26 Cost FY 27 Cost FY 28 Cost 5 Year Cost Capital Cost 300,000.00 - - - - 300,000.00
FY 24 Cost FY 25 Cost FY 26 Cost FY 27 Cost FY 28 Cost 5 Year Cost Capital Cost 1,642,000.00 1,777,000.00 1,417,000.00 977,000.00 1,027,000.00 6,840,000.00
FY 24 Cost FY 25 Cost FY 26 Cost FY 27 Cost FY 28 Cost 5 Year Cost Capital Cost 6,388,222.00 5,039,845.00 4,752,262.00 6,225,101.00 4,352,913.00 26,758,343.00 11.25 Click Here for Main Directory
Human Resources
Since July 1, 2022, (to date) we have processed 2772 applications for full-time and part-time positions. We only accept applications when we have open positions. During this same period, we hired 105 fulltime employees to fill existing vacancies and approved new positions. A total of 82 full-time employees separated from the city. Twenty-seven employees of the 82 that separated, retired from the city. Separation includes resignations, retirements, and discharges. Based on 841 full-time active positions, our turnover rate to date for FY 2023 is 9.8%. If you exclude retirements the turnover rate is 6.5%. At this time last year the City’s turnover rate was at 9.61% including retirees. According to the Bureau of Labor Statistics, the national turnover rate (for all industries) in February 2023 was 3.8%. As of February 2023, the average turnover rate for Oklahoma is 3%. Turnover rate for the surrounding cities is City of Oklahoma City – 11.08%, City of Moore – 9.24%, and City of Norman – 8%.
Labor Relations:
General Employees: In March 2023, an external consultant conducted a Pay and Compensation Study to achieve multiple project objectives. The first objective was to maintain a compensation system that ensures fair and equitable salaries based on internal job requirements and competitive external pay rates for similar positions in the regional area. Additionally, the aim was to align the compensation plan with the City’s goals and reduce the number of steps within salary grades from 17 to 10, resulting in greater pay differentiation between steps.
The study revealed that the City’s general employees were 5.4% below the market average. To address the market discrepancy Council approved 6% pay plan adjustment, effective July 1, 2023. Along with a pay plan adjustment, Council approved a pay plan restructuring, moving from 17 step salary plan to a 10-step salary plan, where each step will have a 4.6% increase between steps compared to the current 2.5% increase. The pay plan restructuring will be effective January 1, 2024.
In addition to the approved wage increases, the Council has made the decision to implement a Parental Leave policy for City of Edmond employees. This policy will help attract and retain skilled employees who can effectively serve our citizens while also supporting their families. Starting July 1, 2023, the following provisions will be in effect:
An employee giving birth will be eligible for up to 8 calendar weeks of paid maternity leave.
An employee who is the parent of a newborn child whose spouse or partner is the mother will be eligible for up to 4 weeks of paid leave.
An employee who is in the process of adopting a child will be eligible for 8 calendar weeks of paid leave upon the initial placement of the adoptive child.
An employee receiving a child as a foster care placement will be eligible to use a bank of 40-hours of paid leave in a calendar year.
Also, bilingual employees will be receiving a $50/month stipend. Bilingual employees bring valuable language skills to the City, allowing them to effectively communicate with a broader range of customers and citizens. By compensating our employees with a $50/month stipend, the City recognizes and rewards the additional value these employees bring through their language abilities.
Council also approved using American Rescue Plan Act (ARPA) funds up to 2% to offset increases in employee health insurance premiums.
12.1 Click Here for Main Directory
Police and Fire
The City has successfully finalized three-year contracts with the International Fire Fighters Association (IAFF) and the Fraternal Order of Police (FOP). The contracts will commence on July 1, 2023 and will remain in effect until June 30, 2026.
The FY 2023 through FY 2026 salaries are based on available revenues and City Council approved allocation of funds in each of the applicable years.
IAFF: FY 2023-2024
3% increase effective 07-01-23
3.5% increase effective 01-01-24
FY 2024-2025
3% increase effective 07-01-24
3.5% increase effective 01-01-25
FY 2025-2026
3% increase effective 07-01-25
3.% increase effective 01-01-26
FOP FY 2023-2024
Removing step 0 in the Police Officer/Sergeant grade and adding a step to the end of the pay plan for grades 51-56. Employee will remain at their hourly rate and advance the equivalent of one step on their anniversary date.
FY 2024-2025
Removing the first step in grades 51-56 and adding a step to the end of the pay plan. Employee will remain at their hourly rate and advance the equivalent of one step on their anniversary date.
FY 2025-2026
Removing the first step in grades 51-56 and adding a step to the end of the pay plan. Employee will remain at their hourly rate and advance the equivalent of one step on their anniversary date.
Personnel Budget: In response to the evolving requirements of the City and the growth it is experiencing, the number of budgeted positions for FY2023-2024 has increased from 845 in FY 20222023 to 854.
The proposed FY 2023-24 personnel budget of $101,128,083 is an increase of 17% or $15,265,995 over the FY 2022-23 personnel budget of $85,862,088. The personnel budget includes base, overtime, holiday pay, allowances, part time pay, FICA, Medicare, and pension. The 17% increase is the result of the 6% pay plan adjustment and reduction of steps from 17 to 10. Since the Council has yet to review and approve the IAFF and FOP collective bargaining agreements, the FY 2023-2024 personnel budget numbers above does not include the proposed pay increase for Police and Fire.
Pension: This self-funded program includes all City employees except uniformed police and fire personnel and the City Manager, and the projected contributions are identified in the individual fund budgets. The City’s annual contribution rate is determined by an independent actuary hired by the Employee Pension Board.
12.2 Click Here for Main Directory
The City’s contribution to meet the normal cost of the pension plan and amortize the unfunded actuarial liability over 25 years is $3.799 million, or 11.13% of participant payroll. This is an increase of 0.02% of payroll from last year’s contribution requirement. The increase is principally the result of investment earnings on the actuarial value of assets falling short of the long term assumed rate of return. The actuary recommended the City’s contribution rate be set to 11.13% or higher, the level required to meet the recommended 25-year funding standard. As a result of the actuary recommendation, City’s contribution increased from 11% to 11.13% effective July 1, 2023. Employee’s contributions remain at 6%.
Health Insurance / Employee Health Clinic
The City’s self-funded health insurance program remains one of the major employment benefits for fulltime and some part-time employees. The City’s plan is based on a calendar year instead of a fiscal year, which includes halves of two budget years.
The Employee Health Insurance Committee is a good partner in working with management and our health care consultant by taking joint ownership of the plan and being aware of the economic challenges of providing health care in today’s environment.
The total claims cost for 2022 was $10,929,107. The City’s total cost per employee per month for 2022 is $1,131.85 which is down from 2021 at $1,165.79. The City’s cost is well under the National average for 2022 of $1,245.66 per employee per month. The Municipality average for 2022 was $1,271.83 per employee per month.
The employee group health revenues for FY 2023-2024 are estimated at $12,592,683. The total expenditures for FY 2023-2024 are estimated at $12,681,843.
Another major benefit for our employees is the Employee Health Clinic, which has been in operation for the last eight years. The clinic has been managed and staffed by our third-party partner (Care ATC). This has been very popular with our employees, their dependents and retirees covered by our insurance plan. The Clinic’s impact on the wellness of our employees remains an ongoing focus. Total fixed cost for the employee health clinic for FY 2023-2024 is $720,195.32 ($837.44 per employee).
2022 clinic visits 3,187 / 2021 clinic visits 3,243 Prescriptions dispensed in 2022 – 5,846
Lab draws – 1,722
Physical Health Assessments completed – 417 Virtual visits with Doctor - 690
12.3 Click Here for Main Directory
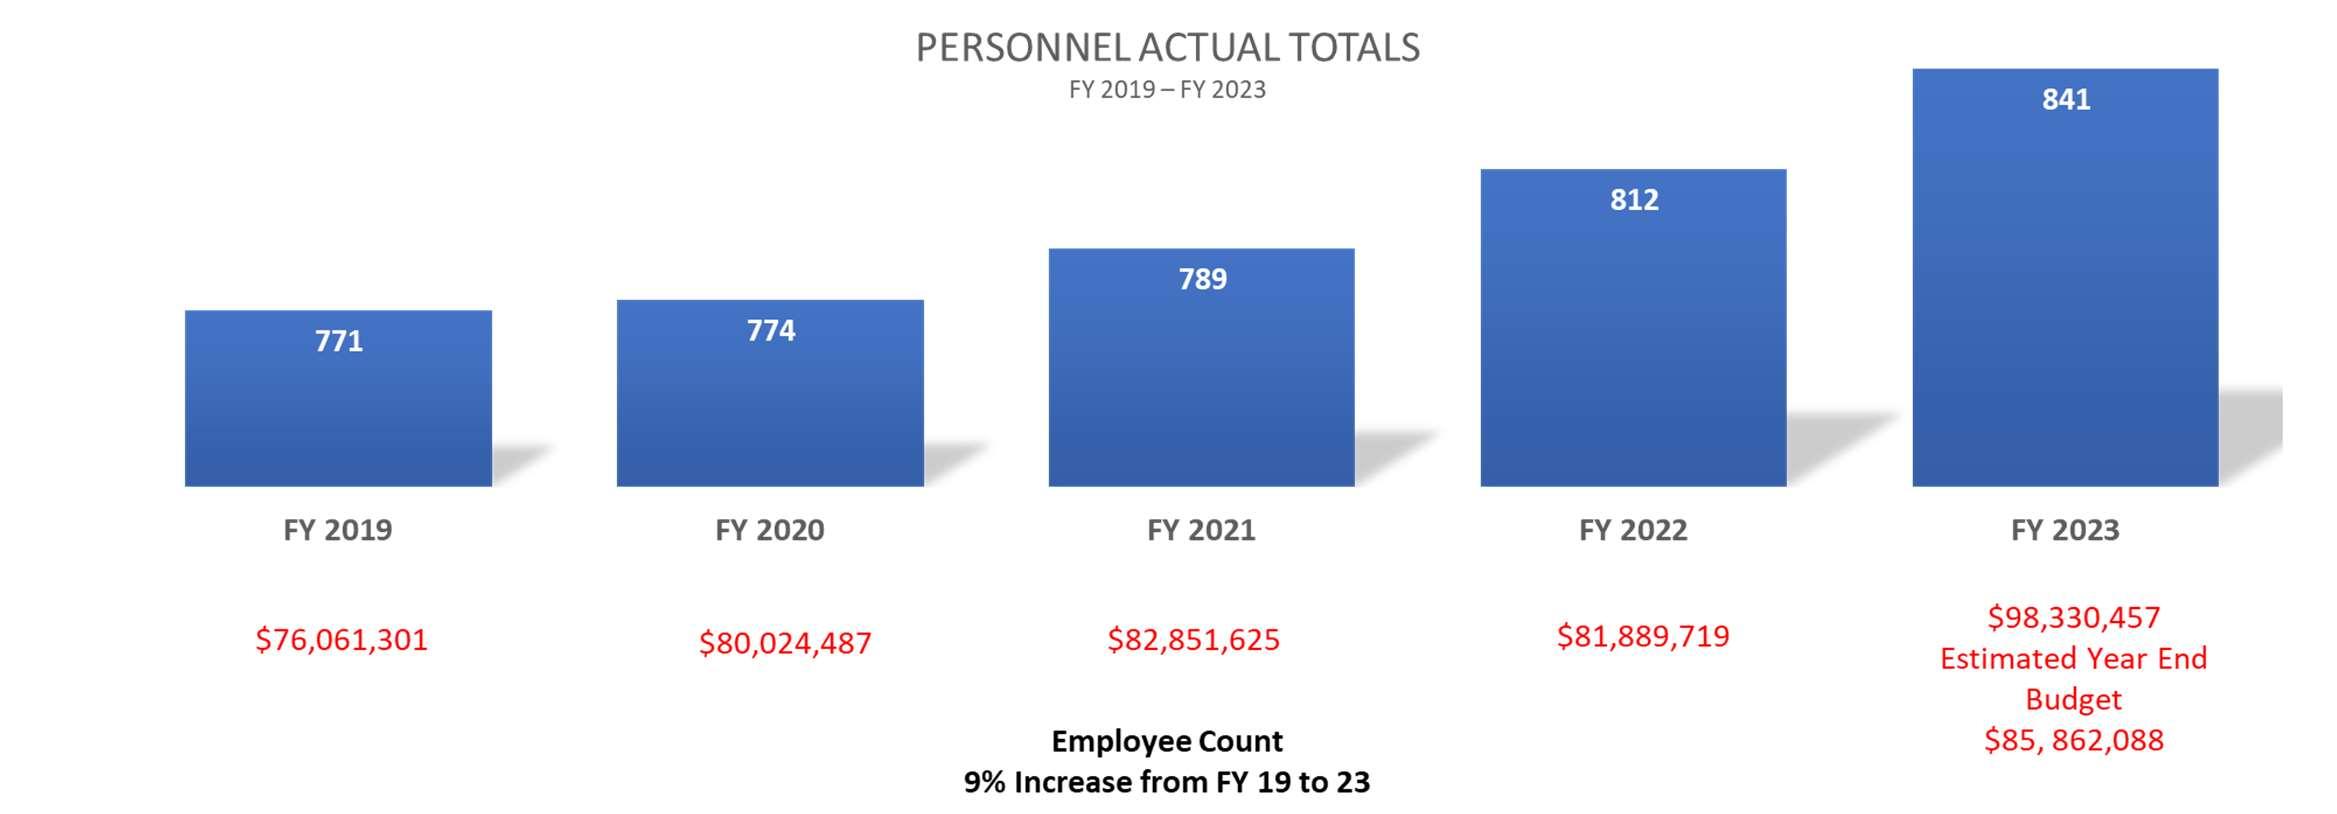

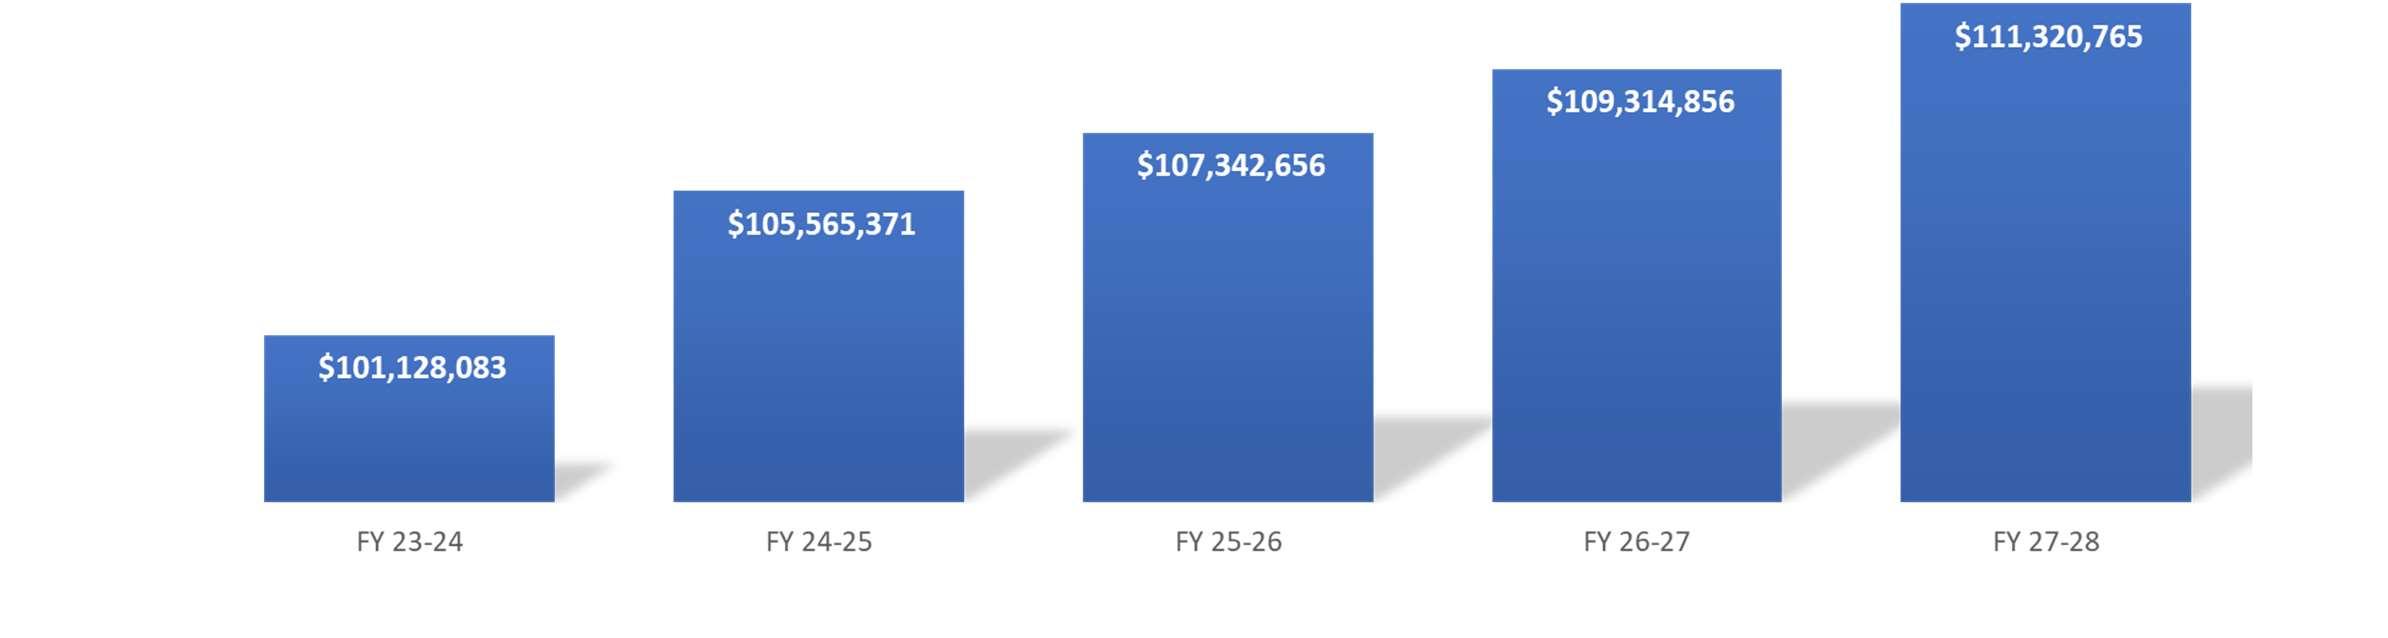
12.4 Click Here for Main Directory
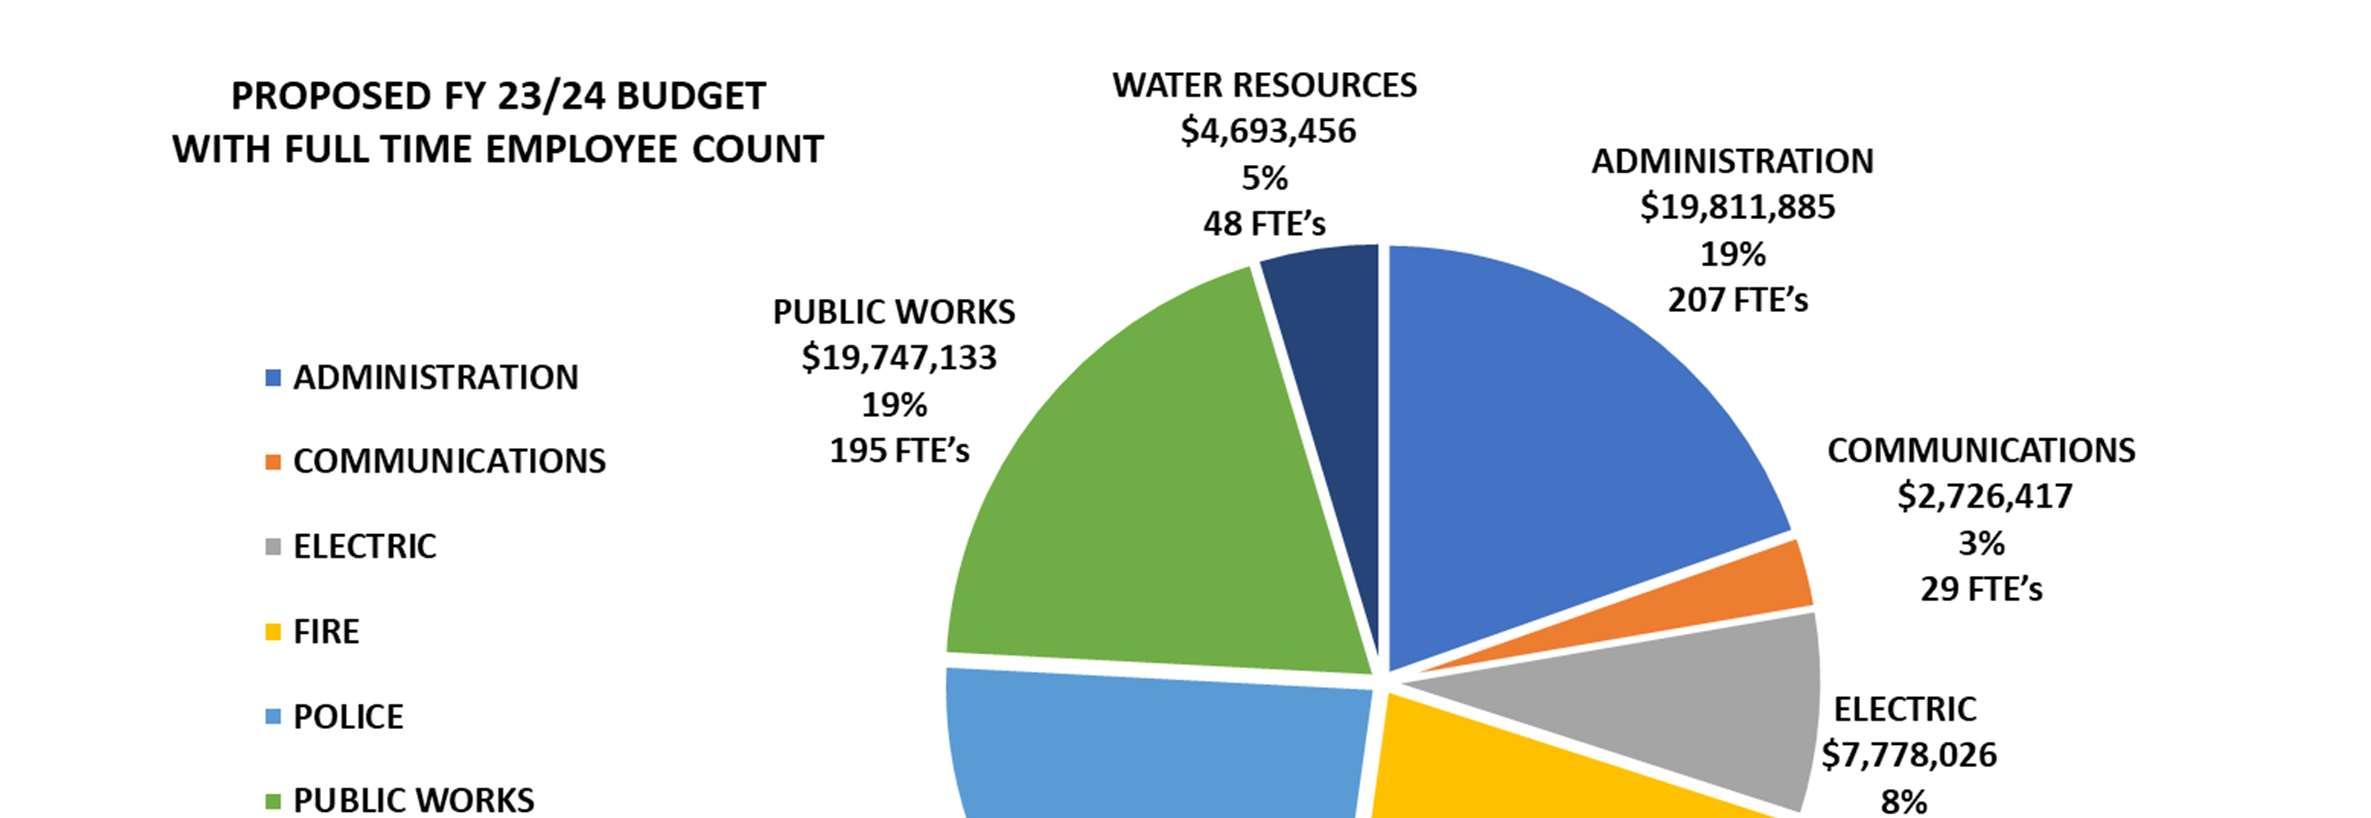
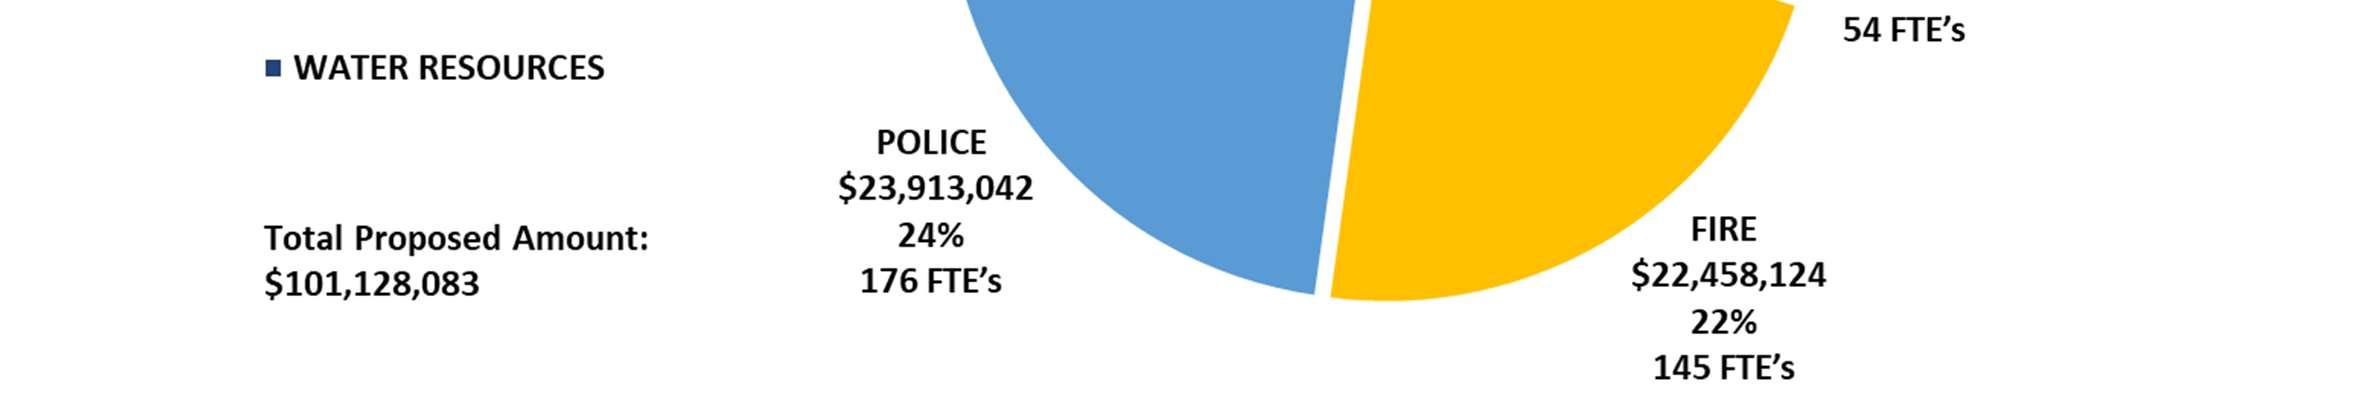
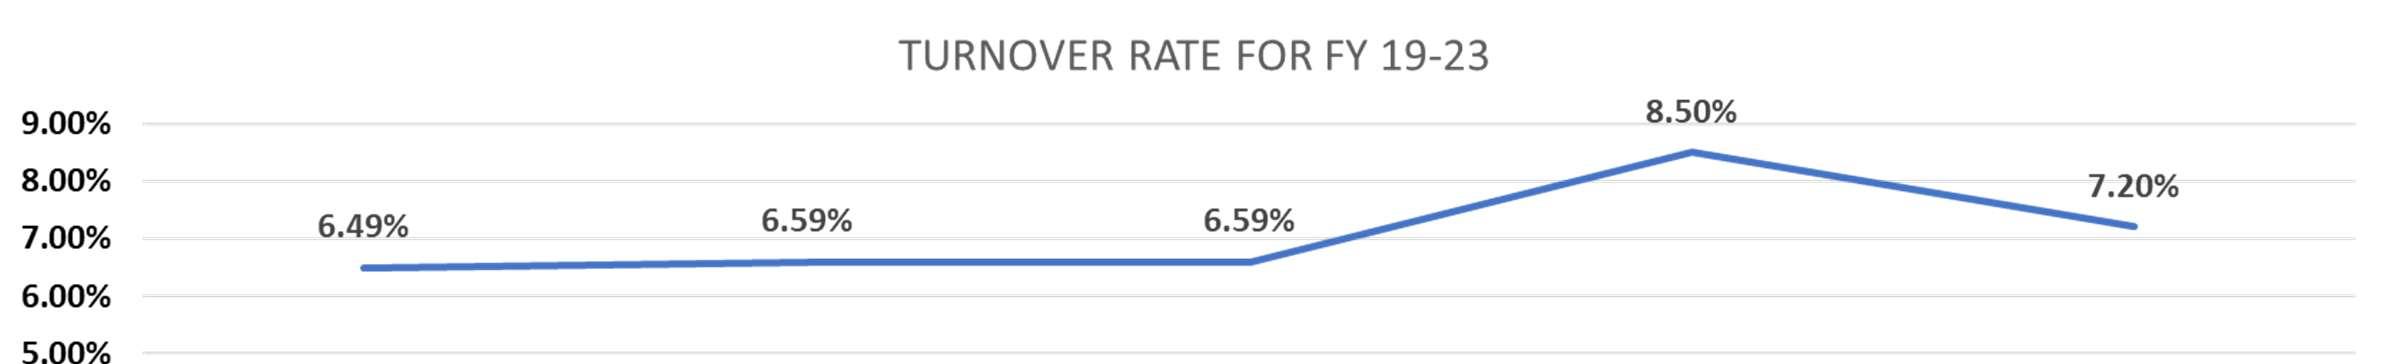
12.5 Click Here for Main Directory
BUDGETED CITY GOVERNMENT EMPLOYEES BY FUNCTION/PROGRAM - LAST 10 FISCAL YEARS
Function/Program General Government: Managament Services55666666888 CityClerk/Governmental Relations22222233222 Finance88887777999 Treasurer11100000000 HumanResources65578788888 IT1717171819192020222529 Legal87674444444 Other3232323133363737353536 Engineering1718181623222424272932 Planning77767987888 CDBG11111111111 Building1516161916151616161717 CommunityImage69101114141010777 Visit Edmond23344444444 DowntownCommunityCenter11111111222 Total General Government 128 132 133 137 145 147 149 148 153 159 167 Public Safety and Judiciary: Police: Officers114123120120122122121125129130131 Civilians2325303131313329293538 Animal Welfare997991099999 Fire: Firefighters & Officers115117117119120123121129129138138 Civilians105555575555 EmergencyManagement22222222222 Central Communications/EM2424242631292626262727 Municipal Court8879999991011 Total Public Safety and Judiciary 305 313 312 321 329 331 328 334 338 356 361 Transportation: Streets2525252525252626272727 Traffic56778888888 Public Works Administration1312111010101010101010 Total Transportation 43 43 43 42 43 43 44 44 45 45 45 Cultural, Parks and Recreation: Parks and Recreations4242424646464149515657 Total Cultural, Parks and Recreation 42 42 42 46 46 46 41 49 51 56 57 Utilities: Electric4950504954545556565656 Water4244445046466054545454 Solid Waste2020192222222222252525 Wastewater2422263131313129313131 Drainage55555566666 UtilityCustomer Service3942434647454646464949 Central Warehousing33333333333 Total Public Works 182 186 190 206 208 206 223 216 221 224 224 Total Full-Time Budgeted Employees by Function/Program 700716720752771773785791808840854 Other includes Risk, UrbanForestry, Vehicle Maintenance, Marketing and FacilityMaintenance Fiscal Year 2024 Fiscal Year 2018 Fiscal Year 2019 Fiscal Year 2020 Fiscal Year 2021 Fiscal Year 2022 Fiscal Year 2023 Fiscal Year 2014 Fiscal Year 2015 Fiscal Year 2016 Fiscal Year 2017 0 50 100 150 200 250 300 350 400 FiscalYear 2014 FiscalYear 2015 FiscalYear 2016 FiscalYear 2017 FiscalYear 2018 FiscalYear 2019 FiscalYear 2020 FiscalYear 2021 FiscalYear 2022 FiscalYear 2023 FiscalYear 2024 EmployeeGrowthbyFunction/Program-TenYears TotalGeneralGovernment TotalPublicSafetyandJudiciary TotalTransportation TotalCultural,ParksandRecreationTotalPublicWorks 12.6 Click Here for Main Directory
Financial Reporting Entity
The City’s accounting and financial reporting policies conform to accounting principles generally accepted in the United States of America (GAAP). The City’s financial reporting entity comprises the following:
Primary Government: City of Edmond
Blended Component Unit: Edmond Public Works Authority (EPWA)
Discretely Presented Component Units: Edmond Economic Development Authority
Edmond Historic Preservation Trust
The Park Conservancy Trust
Blended component units are separate legal entities that meet the GASB 14, 39 and 61 component unit criteria and whose governing body is the same or substantially the same as the City Council or the component unit provides services entirely to the City. The EPWA component unit funds are blended into the City’ by appropriate fund type to comprise part of the primary government presentation. The EPWA are reported as enterprise funds within the primary government presentation. The discretely presented component units are separate legal entities.
Fund Financial Statements:
Fund statements are organized into funds, each of which is considered to be separate accounting entities. Each fund is accounted for by providing a separate set of self-balancing accounts which constitute its assets, deferred outflows, liabilities, deferred inflows, fund equity, revenues, and expenditures/expenses. Separate financial statements are presented for the three major fund categories: governmental, proprietary and fiduciary. A fund is considered major if it is the primary fund of the City or meets the following criteria:
a. Total assets and deferred outflows, liabilities, and deferred inflows, revenues or expenditures/expenses of that individual governmental or enterprise fund are at least 10 percent of the corresponding total for all funds of that category or type, and
b. Total assets and deferred outflows, liabilities and deferred inflows, revenues or expenditures/expenses of the individual governmental fund or enterprise fund are at least 5 percent of the corresponding total for all governmental and enterprise funds combined.
c. A fund not meeting the criteria of (a) and (b), however management has elected to report the fund as a major fund due to its significance to users of the financial statements. All remaining governmental and enterprise funds not meeting the above criteria are aggregated and reported as nonmajor funds.
Measurement Focus and Basis of Accounting
Measurement focus is a term used to describe how transactions are recorded withing the financial statements. Basis of accounting refers to when transactions are recorded regardless of the measurement focus applied. All governmental funds utilize a “current financial resources” measurement focus. Only current financial assets, liabilities, deferred outflows, and inflows are generally included. These funds use ‘fund balance’ as their measure of available spendable financial resources at the end of the period. The proprietary fund utilizes an “economic resources” measurement focus. The accounting objective of this measurement focus are the determination of operating income, changes in net position, financial position, and cash flows. Proprietary fund equity is classified as net position.
FINANCIAL/BUDGET
POLICIES
13.1 Click Here for Main Directory
Basis of Accounting
In the government-wide Statement of Net Position and Statement of Activities, and the proprietary fund financial statements the accrual basis of accounting is applied. This means revenues are recognized when earned and expenses are recorded when the liability is incurred or economic asset used. Revenues, expenses, gains, losses, assets and liabilities resulting from exchange and exchange-like transactions are recognized when the exchange takes place.
In the governmental fund financial statements, the modified accrual basis of accounting is applied. Under this basis, revenues are recognized when “measurable and available”. Measurable means knowing or being able to reasonable estimate the amount. Available means collectible within the current period or soon enough thereafter to pay current liabilities. The City has defined “available” as collected within 60 days after year end.
Budgetary Basis of Accounting
The basis of accounting used for budget monitoring depends on the type of fund budgeted. Depreciation is not budgeted for in the Enterprise Funds.
Governmental funds (such as the General Fund) shall account for revenues on the budgetary basis when received in cash and charges to appropriations will be recorded when the encumbrance or commitment is created.
Proprietary funds shall account for revenue when billed and charges to expenditure budgets will be recorded when the encumbrance or commitment is created.
Fiduciary funds are not budgeted because, by their nature, they do not represent City spendable resources.
In accordance with state law, encumbered appropriations may remain open to pay proper claims against said appropriations until September 30 of the following fiscal year. All unencumbered appropriations remaining at year end are considered lapsed and no new encumbrances or obligations may be created subsequent to year end against these lapsed appropriations.
Budget Balancing Policy
It is the City’s policy to appropriate no more than the current year estimated revenues, including interfund transfers, for each fund, in the original budget for a given fiscal year. Compliance or departure from this policy shall be duly noted in the Budget Message submitted by the City Manager.
Budgeting Basis and Control
The City Manager presents the budget to City Council for formal adoption, prior to the beginning of the new fiscal year (see budget calendar for more details). Once adopted, the budget numbers are integrated into to our financial software. This control does not allow an encumbrance to incur if funds are not available. The department head personnel are responsible for reviewing through out the year and manage their department accordingly. The City Council’s goal is to adopt a balanced budget, in which current revenues are equal to expenditures. If a need arises to spend more money than available throughout the year, the department has the authority to present to City Council a budget amendment to amend the adopted budget and increase their budget authority. Once approved by City Council, the budget amendment is then entered into the financial software for use. The City Manager has authority to approve requests to move appropriated amounts from one object code to another object within the same category level without presenting to the City Council. The budgetary category levels are:
• Personal Services
• Materials and Supplies
FINANCIAL/BUDGET
POLICIES
13.2 Click Here for Main Directory
• Other Services & Charges
• Capital Outlay
• Transfers Out
Budgetary Legal Requirements
The budget process for all City funds (excluding those of the public trust authorities) is governed by 11 O.S. Sections 17-101 through 17-216. As such, the City will comply with all legal deadlines, public hearing and budget content requirements of the law.
The budgets for the public trust authorities are governed by 60 O.S. Section 176.
Policies
•Funds must be encumbered by a properly authorized purchase order, prior to obtaining any goods or services.
•Purchases <$20,000- do not require competitive bidding and may be purchased in the open market. Departments are still encouraged to compare prices.
•Purchases of $20,001-$49,999.99- shall be made after obtaining a minimum of 3 written price quotations. Quotes need to be similar in items, service, quality, and quantity.
•Purchases > $50,000- made after the solicitation of sealed bids/ approval of the City Council or Purchasing Manager, as applicable. Purchasing Manager may award up to $100,000 for supplies, equipment, and services provided the low bidder is recommended.
•Professional Services- procurement of professional services are encouraged to be made by sealed proposal or by request of qualification. Contracts of $50,000 need City Council's approval.
•Emergency Purchases- in the event of public calamity where immediate procurement is necessary, bids and quotes are not required. Purchases over $50,000 are approved by City Council after the emergency purchase has been made.
•Exempt Purchases- when there is only one provider for a service due to proprietary rights or other limitations, the purchase shall be considered exempt and awarded to that provider without competitive bidding. Budget funds must be available for the expenditure.
•Request for Proposals/ Request for Qualifications- When the use of competitive sealed bidding is not deemed practical/advantageous, the purchase may be made through solicitation of requests for proposal. Awards over $50,000 must be approved by City Council.
•Blanket Purchase Orders- Can be for any amount. However, if a purchase order exceeds $15,000, then price quotes or competitive bidding is required, and must not exceed encumbered amount.
•City Purchasing Cards- are the property of the City of Edmond and issued to individuals for authorized purchases. Each Department head is responsible for responsibly controlling and monitoring credit card use by employees, usage of cards is subject to normal Purchasing policies and procedures.
•Petty Cash- used for purchases no greater than $25 for supplies and services needed immediately and are not practical for a purchase order. Should be processed through the Administrative Services Department.
FINANCIAL/BUDGET POLICIES
Purchasing Policy (Revised 03-2019)
13.3 Click Here for Main Directory
Accounts Payable Policy (Revised 07-2022)
• This Policy is for Accounts payable (A/P) Transactions (Manual & Electronic).
• The Function of A/P is to complete payments and control expenses through processing, verifying and reconciling payments in a secure and efficient manner.
• Two Steps: New Vendor Setup, Payment.
• New Vendor Set Up- All requests sent to Invoices@edmondok.gov; Send W9, contact information, and reason an item is being purchased.
• Verification- are verified through a Taxpayer Identification Number (TIN) Match with the IRS, Electronic Verifications are conducted INDEPENDENTLY by a personal contact.
• Payments- Invoices and other requests should be sent to Invoices@edmondok.gov. All invoices need a Purchase Order (PO) Number, all payment requests received and approved through our software by noon on Monday, will be processed by Wednesday and distributed on Thursday.
• Payments will be made in accordance with the requested method, manual checks will be mailed-special requests and pickup will be coordinated by A/P.
One-Time Revenue Policy (Established 07-2022)
• This Policy has been Established to address use of one-time revenue, which is revenue that is non-recurring and cannot be relied on as a source of funding in future periods.
• Identify one-time revenue- Examples include grants, sale of assets, loan proceeds, and bond refunding savings.
• Determine Allowable Uses for one-time revenue- Uses must also be non-recurring. Any expenditure that is ongoing in nature should not be funded by one-time revenue. Examples include early debt retirement, capital purchases, startup costs, stabilization.
•Evaluate if any unstable or unpredictable revenue sources exist- If a revenue source is no longer reliable, take steps to budget the source as a one-time revenue. Establish a predictable minimum base for these sources. Examples include interest income, intergovernmental revenue, sales and use tax in conjunction with projections for the state of the economy.
• Develop contingency plans in advance- Determine what expenditures would be reduced or other steps needed to be taken to address unpredictable revenue fluctuations, this is to keep the City of Edmond in a stable financial state.
• Extraordinary circumstances may affect the determination of one-time revenue sources and allowable uses. This determination is subject to City Council discretion.
Debt Policy
• Our department has recognized the need for a debt policy. We are working to establish a policy on debt.
• Our department continues to follow Article 10 of the Oklahoma Constitution in regard to debt management which states the following:
• Section 26- if a city or town has an absolute need to acquire debt, therefore, such city or town may, with the assent of three-fifths of the voters thereof voting at an election to be held for that purpose, incur indebtedness to an amount, including existing indebtedness, in the aggregate exceeding five percent (5%) but not exceeding ten percent (10%) of the valuation of the taxable property.
• Section 27- Any incorporated city or town in this state may be allowed to become indebted in a larger amount than that specified in Section 26, for the purpose of purchasing or constructing public utilities, or for repairing the same, or for the purpose of constructing, reconstructing, improving, or repairing streets or bridges.
• Note- The City of Edmond is currently not participating in General Obligation Bonds referenced in Section 26.
FINANCIAL/BUDGET POLICIES
13.4 Click Here for Main Directory
Investment Policy (Revised 12-2013)
• This policy's purpose is to ensure the City invests all public finds in a manner which will provide maximum security of principal, meet daily cash flow demands, and conform to all state and local statues governing the investment of public funds.
• Legality- All investment transactions will be in accordance with all applicable State and Federal Statutes, City Charter and Municipal Code Restrictions
• Safety- Each investment transaction shall seek to ensure that capital losses are avoided due to security defaults, and to minimize erosion of value due to normal market fluctuations.
• Liquidity- The investment portfolio will at all times be maintained in a structure which enables the immediate cash flow needs of the City and Trusts to be met through the maturity or sale of investment securities.
• Return on investment- The portfolio shall be designed to attain a market rate of return throughout budgetary and economic cycles, taking into account the City's legal constraints, investment risk constraints and the cash flow characteristics of the portfolio.
• Safekeeping Requirements- The City Finance Department shall keep a written record of all investments and shall forward information to the Accounting Division to be posted in the financial records. All investment securities purchased through a broker/dealer that are being held for the City in unregistered form by the broker/dealer must be covered at a rate of one hundred ten percent (110%) of fair market value. Investment securities purchased may be held in safekeeping at an institution designated by the City Treasurer.
• Duties of the City Treasurer- The city treasurer shall have the custody of the funds of the City and shall pay out the same only upon order of the city manager attested by the city clerk and signed by the mayor.
• Investment Limitations- Investments of surplus funds will be limited to those investment types authorized by the City Charter through State Statutes. The Treasurer is authorized to invest funds in such securities as provided by Oklahoma State Statutes. Direct obligations of the United States Government are pledged or obligations to the payment of which the full faith and credit of this State is pledged; or collateralized or insured certificates of deposits, or savings accounts or savings certificates; or investments as authorized; or county, municipal or school district direct debt obligations.
• Bonds- The City Treasurer and the person or persons appointed as Assistant City Treasurer shall furnish to the City their good and sufficient bonds respectively, each in the amount of One Hundred Thousand Dollars ($100,000.00) guaranteeing their respective faithful performance and discharge of their official duties.
• Monthly Report- The City Treasurer shall make a monthly report to the Mayor and Council showing the financial condition of the City.
•This policy is a policy we plan to update in Fiscal Year 2024
• To see this policy in its entirety please contact the Finance Department of The City of Edmond.
FINANCIAL/BUDGET POLICIES
13.5 Click Here for Main Directory
Grant Management Policies and Procedures (Established 03-23)
• The City has adopted this policy to establish a general strategy for administering grants.
• Grant revenue is a significant portion of the city's overall resources, particularly for funding capital improvements. Although grant programs are being reduced and are becoming more competitive, actively pursuing grant revenues that assist in achieving the City's identified goals and objectives play a crucial role in the City's overall strategies for financial health.
• Objectives
• Emphasize the importance of grant programs in achieving City goals and objectives.
• Create a general framework and concepts for seeking and managing grant programs.
• Determine roles and responsibilities in grant program management.
• Establish consistent and comprehensive reporting and records.
• Simplify records for auditing and tracking.
• Establish Grant monitoring and Oversight.
• Grant Application Process
• Financial
• Total anticipated project cost
• Match requirements and sources
• Administration and Indirect Recapture Amounts
• Program income considerations
• Staffing requirements (including salary and benefits increases for multi-year grants)
• Documentation of a clear continuation plan. It is required that departments develop continuation plans (plans for sustaining grant funded programs if funding is reduced or terminated) prior to applying for grants, which reflect the potential for loss of funding and the subsequent loss of grant funded positions or program components. Departments must plan responsibly for either termination.
• Programmatic
• Alignment with City's strategic priorities and/or City’s plans
• Provision or expansion of services to address critical needs.
• Department's capacity to administer the financial and administrative aspects of the grant.
• Application Submission-Grants submitted online or through grants.gov must be done with the Grants Administrator. The Grants Administrator and Finance must have access to grant management portals administered by granting agencies.
• Award Notification, Review and Acceptance process has two components: (1) award notification and (2) City Council approval to accept the award.
• To see this policy in its entirety please contact the Finance Department of The City of Edmond.
FINANCIAL/BUDGET POLICIES
13.6 Click Here for Main Directory
Whistle Blowing Policy (Revised 09-2018)
• The City has adopted this policy to establish a general conduct for whistleblowing
• It is the responsibility of all employees to report improper expenditure of public funds, unlawful conduct, or violations of city policy. The City will not take adverse action against employees that report violations. All information received from an employee will be treated confidentially and the employee’s identity will be protected throughout the process to the extent possible, consistent with the need to conduct an adequate investigation. Suspected policy violations should be reported by contacting one or more of the following:
• Supervisor
• Department Head
• Human Resources Director
• Assistant City Manager of Operations
• Assistant City Manager of Administration
• City Attorney
• City Manager
• The potential exists for an immediate supervisor or other management staff in the organization to be the subject of the potential policy violation. The previous list provides you contact options outside of your department that can initiate the appropriate first action steps.
• The reported violations will then be directed immediately to the Director of Human Resources, City Attorney or City Manager, as appropriate, for a prompt and thorough investigation. A determination will be made and appropriate action, where warranted, will be instituted. The results of the investigation will be formally reported to the original reporting party.
• Determinations involving financial matters of the City shall be directed to the Chair of the Finance/Audit Committee for the Committee to review and provide any concurrent recommendations.
• This policy strictly prohibits any retaliation against an employee who, in good faith, reports misuse of public funds, unlawful conduct or policy violations.
• To see this policy in its entirety please contact the Finance Department of The City of Edmond
FINANCIAL/BUDGET POLICIES
13.7 Click Here for Main Directory
CITY OF EDMOND FINANCIAL SERVICES DEPARTMENT GLOSSARY OF TERMS
ACOG – Association of Central Oklahoma Governments. It is a non-partisan Voluntary association of local governments in the Oklahoma, Canadian, Cleveland, and Logan counties.
Accounting System – The total structure of records and procedures which discover, record, classify and report information on the financial position and operations of a governmental unit or any of its fund, balanced account groups, and organizational components.
Accrual Basis – The basis of accounting under which revenues are recorded when earned and expenditures are recorded as soon as they result in liabilities for benefits received, regardless of the timing of related cash flows.
ACH – Automated Clearing House
Accrued Expenses – Expenses incurred but not due until a later date.
Activity – Specific and distinguishable service performed by one or more organizational components of a government to accomplish a function for which the government is responsible. An example is Police is an activity within the public safety function.
Agency Fund – A fiduciary fund consisting of resources received and held by the City as an agent for others.
Allocate – To divide a lump-sum appropriation into parts, which are designated for expenditure by specific organizational units and/or for specific purposes, activities, or objects.
AMI – Automated Metering Implementation.
Amortization – The gradual reduction, redemption, or liquidation of the balance of an account according to a specified schedule of times and amounts.
Annual Comprehensive Financial Report (ACFR)– Financial report that contains, at a minimum, three sections: 1) introductory, 2) financial, and 3) statistical, and whose financial section provides information on each individual fund and component unit. Appropriation – A legal authorization granted by a governing body to make expenditures and to incur obligations for specific purposes.
Arbitrage – With respect to the issuance of municipal bonds, arbitrage usually refers to the difference between the interest paid on the bonds issued and the interest earned by investing the bond proceeds in other securities. Arbitrage profits are permitted on bond proceeds for various temporary periods after issuance of municipal bonds. IRS regulations govern arbitrage of municipal bond proceeds.
ARPA – American Rescue Plan Act.
14.1 Click Here for Main Directory
Audit – The examination of documents, records, reports, systems of internal control, accounting and financial procedures, and other evidence for one or more of the following purposes:
a. To ascertain whether the statements prepared from the accounts present fairly the financial position and the results of financial operations of the constituent funds and account groups of the governmental unit in accordance with generally accepted accounting principles and on a basis consistent with that of the preceding year (financial audit).
b. To determine the compliance with applicable laws and regulations of a governmental unit’s financial transactions (regulatory audit).
c. To ensure proper internal controls are in place for the safeguarding of assets and utilizing a risk based approach to assess the appropriate areas (internal audit).
d. To review the efficiency and economy with which operations were carried out and review effectiveness in achieving program results (performance audit).
Audit Committee – Group of individuals assigned specific responsibility for addressing issues related to the independent audit of the financial statements on behalf of the entity under audit.
Authority – A governmental unit or public agency created to perform a single function or a restricted group of related activities.
Basis Point – Yields on municipal securities are usually quoted in increments of basis points. One basis point is equal to 1/100 of 1 percent.
Bond – A written promise to pay a sum of money on a specific date at a specified interest rate. The most common types of bonds are general obligation and revenue bonds. These are most frequently used for construction of large capital projects, such as buildings, streets and utility infrastructure.
Budget – A plan of financial operation embodying an estimate of proposed expenditures for a given period and the proposed means of financing them.
Budget Adjustments – A legal procedure utilized by the City staff and City Council to revise a budget appropriation.
Budget Document – The instrument used by the budget-making authority to present a comprehensive financial program to the appropriating body. At the City, we refer to ours as the City of Edmond’s Budget and Financial Plan.
Budget Message – The opening section of the budget document, which provides the City Council and the public with a general summary of the most important aspects of the budget, changes from the current and previous fiscal years, and the views and recommendations of the City Manager.
Budgetary Control – The control or management of a governmental unit or enterprise in accordance with an approved budget for the purpose of keeping expenditures within the limitations of available appropriations and available revenues.
Business-Type Activities – One of two classes of activities reported in the governmentwide financial statements. Business-type activities are financed in whole or in part by fees charged to external parties for goods or services. These activities are usually reported in enterprise funds.
14.2 Click Here for Main Directory
Capital Budget – A plan of proposed capital outlays and the means of financing them. It is usually a part of the current budget.
Capital Project Funds – Accounts for resources restricted for the acquisition or construction of specific capital projects or items.
Cash Basis – A basis of accounting under which transactions are recognized only when cash changes hands.
Cash Equivalent – In the context of cash flows reporting, short-term, highly liquid investments that are both (a) readily convertible to known amounts of cash and (b) so near their maturity that they present insignificant risk of changes in value because of changes in interest rates. Generally, only investments with original maturities of three months or less meet this definition.
Cash Management – The management of cash necessary to pay for government services, while investing temporary cash excesses in order to earn interest revenue. Cash management refers to the activities of forecasting the inflows and outflows of cash, mobilizing cash to improve its availability for investment, establishing and maintaining banking relationships, and investing funds in order to achieve the highest interest and return available for temporary cash balances.
Certificate of Achievement for Excellence in Financial Reporting Program –Program sponsored by the Government Finance Officers Association to encourage and assist state and local governments to prepare high-quality comprehensive annual financial reports. The program has been in continuous operations since 1946. This program originally was known as the Certificate of Conformance Program.
CEUD – Central Edmond Urban District
Component unit – Legally separate organization for which the elected officials of the primary government are financially accountable. In addition, component units can be other organizations for which the nature and significance of their relationship with a primary government are such that exclusion would cause the reporting entity’s financial statements to be misleading or incomplete.
Cost – (1) The amount of money or other consideration exchanged for property or services. (2) Expense.
Cost Accounting – That method of accounting, which provides for assembling and recording of all the elements of cost incurred to accomplish a purpose, to carry on an activity or operation, or to complete a unit of work or a specific job.
Cost Allocation – The process to distribute or apportion costs to entities receiving a benefit of those costs, thus ensuring the full cost of delivery is measured. Those costs (indirect costs) along with an entity’s direct costs represent the full cost of the entity.
Current Assets – Those assets that are available or can be made readily available to meet the cost of operations or to pay current liabilities.
Current Financial Resources Measurement Focus – Measurement focus where the aim of a set of financial statements is to report the near-term (current) inflows, outflows, and balances of expendable financial resources. The current financial resources measurement focus is unique to accounting and financial reporting for state and local governments and is used solely for reporting the financial position and results of operations of governmental funds.
14.3 Click Here for Main Directory
Current Liabilities – Liabilities which are payable within a relatively short period of time, usually no longer than a year.
Current Year Actual Estimate – A column in the Budget & Financial Plan document; the amount of revenues and expenditures projected to be collected or expended during the fiscal year.
Current Year Budget – A column in the Budget & Financial Plan document; the sum of the original budget, plus amendments and the prior year encumbrance roll amounts.
CY – Calendar Year
Cycle Billing – A practice followed by utilities, retail stores and other organizations with a large number of credit customers of billing part of the customers each working day during a month, instead of billing all customers as of a certain day during the month.
Debt Service Fund – Receives all ad valorem taxes (property taxes) paid to the City as collected from each property owner by the County. Such taxes and any interest earned from the deposit of these taxes are used exclusively for the payment of principal and interest of the City’s general obligation bonds and judgments.
Debt Services – The City’s obligation to pay the principal and interest of all bonds and other debt instruments according to a pre-determined payment schedule.
Deferred Revenue – Resource inflows that do not yet meet the criteria for revenue recognition. Unearned amounts are always reported as deferred revenue. In governmental funds, earned amounts also are reported as deferred revenue until they are available to liquidate liabilities of the current period.
Deficit – (1) The excess of the liabilities of a fund over its assets. (2) The excess of expenditures over revenues during an accounting period; or, in the case of proprietary funds, the excess of expense over income during an accounting period.
Defined Benefit Pension Plan – Retirement plan having terms that specify the amount of pension benefits to be provided at a future date or after a certain period of time; the amount specified usually is a function of one or more factors such as age, years of service, and compensation. An example is the City’s pension plan.
Defined Contribution Pension Plan – Retirement plan having terms that (a) provide an individual account for each plan member and (b) specify how contributions to an active plan member’s account are to be determined, rather than the income or other benefits the member or his or her beneficiaries are to receive at or after separation from employment. An example is the City’s 457 plan.
Department – A department is a major administrative segment which indicates overall management responsibility for an operation or a group of related operations within functional area (e.g., Police Department, Fire Department, Parks and Recreation Department).
Depreciation – The process of estimating and recording the lost usefulness, expired useful life or diminution of service from a fixed asset that cannot or will not be restored by repair and will be replaced. The cost of the fixed asset’s lost usefulness is the depreciation or the cost to reserve in order to replace the item at the end of its useful life.
14.4 Click Here for Main Directory
Designated Unreserved Fund Balance – Management’s intended use of available expendable financial resources in governmental funds reflecting actual plans approved by the government’s senior management.
Direct Expenses – Those expenses which can be charged directly as a part of the cost of a product or service, or of a department or operating unit, as distinguished from overhead and other indirect costs which must be prorated among several products or services, departments, or operating units.
Disbursements – Payments in cash/checks/electronic format.
Division – The smallest organizational unit budgeted is the division. The division indicates responsibility for one functional area, and in many cases these functional areas are put together to demonstrate a broader responsibility. When this is done, the divisions are combined to make a department. For example, the Street Department is comprised of Street Maintenance, Street & Alley, Signs and Signal divisions.
Economic Resources Measurement Focus – Measurement focus where the aim of a set of financial statements is to report all inflows, outflows, and balances affecting or reflecting an entity’s net assets. The economic resources measurement focus is used for proprietary and trust funds, as well as for government-wide financial reporting. It also is used by business enterprises and nonprofit organizations in the private sector.
Encumbrances – Commitments related to unperformed contracts for goods or services. Enterprise Funds – Proprietary funds used to account for business-like activities provided to the general public.
Entry – The record or act of recording of a financial transaction in its appropriate account. Expenditure – This term refers to the outflow of funds paid or to be paid for an asset obtained or goods and services obtained. This term applies to all funds. Note: An encumbrance is not an expenditure. An encumbrance reserves funds to be expended.
Expenses – Charges incurred (whether paid immediately or unpaid) for operation, maintenance, interest and other charges.
Fiduciary – An individual or institution that has a special relationship of trust with another person or group of people and is legally responsible for their assets.
Fiduciary Funds – Used to report net assets and changes therein of assets held by the City in a trustee or agency capacity. These net assets are not available for operations of the City.
Financial Structure – The Financial structure of the budget is organized by funds. The two types of funds utilized in this budget are Governmental and Proprietary. The Governmental and Proprietary Funds operates separately and independently from one another, therefore, they are budgeted separately and include separate financial statements.
Fiscal Year – The time period designated by the City signifying the beginning and ending period for recording financial transactions. The City of Edmond has specified July 1 through June 30 as its fiscal year.
14.5 Click Here for Main Directory
Fixed Assets – Assets of a long-term character that is intended to continue to be held or used, such as land, buildings, improvements other than buildings, machinery and equipment. The City has further defined capital outlay as any item having a cost of $2,500 or more and a useful life of at least two years. There is no $2,500 floor for costs relating to the electric, water, and wastewater utilities that are adding to their distribution systems.
FOP- Fraternal Order of Police
Franchise Tax – This is a charge paid for the use of City streets and public right of way and is in lieu of all other municipal charges, fees, street rentals, pipe taxes, inspections and easement taxes.
Function – A group of related activities aimed at accomplishing a major service or regulatory responsibility for which a governmental unit is responsible. For example, public safety is a function.
Fund – Generally defined as a fiscal and accounting entity which has its own selfbalancing set of accounts recording cash and other financial resources, as well as any liabilities or residual equities or balances. Normally, funds are segregated for the purpose of carrying on specific activities or attaining certain objectives in accordance with special regulations, restrictions, or limitations. However, when appropriate, funds are made up of departments.
Fund Balance – Fund balance is the excess of assets over liabilities and is therefore also known as surplus funds and with regard to proprietary funds, also known as retained earnings.
Fund Type – One of eleven classifications into which all individual funds can be categorized. Governmental fund types include the general fund, special revenue funds, debt service funds, capital projects funds, and permanent funds. Proprietary fund types include enterprise funds and internal service funds. Fiduciary fund types include pension (and other employee benefit) trust funds, investment trust funds, private-purpose trust funds, and agency funds.
FY – Fiscal Year
General Fund – Primary operating fund of the City. Used to account for all activities except those legally or administratively required to be accounted for in other funds. It accounts for the costs of operating many of the City’s general basic services, such as street maintenance, parks and recreation and general government. Financing is primarily provided by City sales tax, franchise taxes and EPWA transfers, fines, licenses and permits, charges for services and interest earnings. The General Fund is reported as a major governmental fund for audit purposes. General Ledger – A book, file or other device which contains the accounts needed to reflect, in summary and in detail, the financial position and the results of financial operations of the governmental unit.
General Obligation Bonds – Bonds that finance a variety of public projects, such as streets, buildings, and improvements. The repayment of these bonds is usually made from property tax, and these bonds are backed by the full faith and credit of the issuing government.
14.6 Click Here for Main Directory
Generally Accepted Accounting Principles (GAAP) – Uniform minimum standards of and guidelines to financial accounting and reporting. They govern the form and content of the basic financial statements of an entity and encompass the conventions, rules, and procedures necessary to define accepted accounting practice at a particular time. They include not only board guidelines of general application, but also detailed practices and procedures. They provide a standard by which to measure financial presentations.
Government Accounting Standards Board (GASB) – Ultimate authoritative accounting and financial reporting standard-setting body for state and local governments.
Governmental Activities – Activities generally financed through taxes, intergovernmental revenues, and other nonexchange revenues. These activities are usually reported in governmental funds and internal service funds.
Governmental Funds – Funds that account for the General Fund, Special Revenue Funds, Debt Service Fund and Capital Projects Funds.
Government-wide Financial Statements – Financial statements that incorporate all of a government’s governmental and business-type activities, as well as its nonfiduciary component units. There are two basic government-wide financial statements: the statement of net assets and the statement of activities.
Grants – Contributions or gifts of cash or other assets from another government to be used or expended for a specified purpose, activity, or facility.
Hotel/Motel Tax – A tax levied upon the cost of occupancy of any room or space furnished by any hotel where such costs of occupancy is at the rate of three dollars ($3.00) or more per day. The law authorizes a room tax of 4% of hotel rate.
Impact Fee – Fee charged to developers to cover, in whole or in part, the anticipated cost of improvements that will be necessary as a result of the development (e.g., parks, sidewalks).
Income – A term used in accounting for governmental enterprises to represent the excess of revenues earned over the expenses incurred in carrying on the enterprise’s operations.
Indirect Costs – (1) Those elements of cost necessary in the production of an article or the performance of a service which are of such a nature that the amount applicable to the product or service cannot be determined accurately or readily. (2) Those costs allocated from servicing departments or divisions. Examples of indirect costs are accounting, purchasing, human resources and information technology.
IAFF- International Fire Fighters Association
INT – Acronym for Intake. This is a project that Water and Wastewater resources are in process.
Interfund Services – Sales or purchases of goods and services between funds and are reported as revenues and expenditures/expenses.
Interfund Transfers – Flow of assets from one fund to another where repayment is not expected and are reported as Transfers In and Transfers Out.
Internal Control – A plan of organization under which employees’ duties are so arranged and records and procedures so designed as to make it possible to exercise effective accounting control over assets, liabilities, revenues, and expenditures. Under such a system, the work of employees is subdivided so that no single employee performs a complete cycle of operations.
14.7 Click Here for Main Directory
Internal Service Funds – Proprietary funds used to account for business-like activities provided and charged to other funds or entities within the City.
Investments – Securities and real estate held for the production of revenues in the form of interest, dividends, rentals, or lease payments. The term does not include fixed assets used in governmental operations. Investments are reported on fair value selected bases. Investments that do not have an established market are reported at estimated fair value as estimated by a broker/dealer.
IVR – Interactive Voice Response.
Levy – To impose taxes, special assessments, or service charges for the support of governmental activities. The total amount of taxes, special assessments, or service charges imposed by a government.
Line-Item Budget – A detailed expense or expenditure budget, generally classified by object within each organizational unit, and often, classified within each object as to authorized number of employees at each salary level within each job classifications, etc.
Liquor Tax – A tax imposed on the gross receipts of a Licensee for the sale, preparation, or service of mixed beverages or from the sale of ice or non-alcoholic beverages and consumed on the premises of the permittee.
Long-Term Debt – Debt with a maturity of more than one year after the date of issuance.
Modified Accrual Basis – The accrual basis of accounting adapted to the governmental fund type spending measurement focus. Under it, revenues are recognized when they become both “measurable” and “available” to finance expenditures of the current period.” Expenditures are recognized when the related fund liability is incurred except for (1) inventories or materials and supplies which may be considered expenditures when consumed rather than when purchased; (2) prepaid insurance and similar items which need not be reported; (3) accumulated unpaid vacation, sick pay, and other employee benefit amounts which need not be recognized in the current period, but for which larger-than-normal accumulations must be disclosed in the notes to the financial statements; (4) interest on special assessment indebtedness which may be recorded when due rather than accrued, if approximately offset by interest earnings on special assessment levies; and (5) principal and interest on long-term debt which are generally recognized when due. MDM – Meter Data Management.
Net Position – A term used in accounting for governmental enterprises to designate the excess of total revenues over total expenses for an accounting period.
Net Working Capital – Current assets minus current liabilities. In budgeting, used to represent available savings of a fund for future budget needs.
Nonoperating Expenses – Expenses incurred for nonoperating properties or in the performance of activities not directly related to supplying the basic services by a governmental enterprise. An example is interest paid on outstanding revenue bonds.
Nonoperating Income – Income of governmental enterprises which is not derived from the basic operations of such enterprises. An example is interest on investments. Object or Object Code – Expenditure classification according to the types of items purchased or services obtained, for example, personal services, materials & supplies, and equipment.
14.8 Click Here for Main Directory
Operating Budget – A budget which applies to all outlays other than capital outlays.
Operating Expenses – Proprietary fund expenses that are directly related to the fund’s primary service activities.
Operating Revenues – Proprietary fund revenues, which are directly related to the fund’s primary service activities. They consist primarily of user charges for services.
Operating Transfers – All interfund transfers other than residual equity transfers.
Ordinance – A formal legislative enactment by the governing board of a municipality. If it is not in conflict with any higher form of law, such as a statute or constitutional provision, it has the full force and effect of law within the boundaries of the municipality to which it applies. Revenue raising measures, such as the imposition of taxes, special assessments and service charges, universally require ordinances.
Original Budget – First completed appropriated budget; adopted budget.
Overhead – See Indirect Costs.
Performance Measures – Specific quantitative and qualitative measures of work performed as an objective of the department.
PLL Management System – Purchasing, Licensing, and Land Management System.
Posting – The act of transferring to an account in a ledger the data, either detailed or summarized, contained in a book or document of original entry.
Prior Year Actual – A column in the Budget & Financial Plan document; previous year’s audited financial results.
Prior Year Encumbrance Roll – Encumbrances outstanding at the end of a fiscal year are added to the adopted budget to provide the necessary funding during the current year of those commitments.
Program Goals – Description of the purpose or benefit the division/department plans to provide to the community and/or organizations it serves. Goals identify the end result the division/department desires to achieve with its activities, but goals are often ongoing and may not be achieved in one year.
Proprietary Funds – Includes the Enterprise Funds and Internal Service Funds. Proprietary fund operating revenues, such as charges for services, result from exchange transactions associated with the principal activity of the fund.
Public Authority – See Authority.
Purchase Order – A document which authorizes the delivery of specified merchandise or the rendering of certain services and the making of a charge for them.
RATP Dev – Régie autonome des transports parisiens développement (English: Autonomous Parisian Transportation Administration Development). Our City contracts through them for Our Citylink Transportation Services.
Receivables – In governmental fund types, revenue accruals such as sales tax, franchise tax, and grants and other similar intergovernmental revenues as long as they are both measurable and available. Receivables in proprietary type funds consist of revenues earned at year-end and not yet received. Can be reported net of allowance for uncollectible accounts.
Reserve – An account used to indicate that a portion of a fund’s balance is legally restricted for a specific purpose and is, therefore, not available for general appropriation.
14.9 Click Here for Main Directory
Reserved Fund Balance – Portion of a governmental fund’s net assets that is not available for appropriation.
Resolution – A special or temporary order of a legislative body; an order of the legislative body requiring less legal formality than an ordinance or statue; a means of formally adopting policy.
Restricted Assets – Assets of enterprise funds and business-type activities that are legally restricted as to their use.
Retained Earnings – The accumulated earnings of an Enterprise or Internal Service Fund which have been retained in the fund and which are not reserved for any specific purpose.
Revenue Bonds – Bonds whose principal and interest are payable exclusively from earnings of an Enterprise Fund.
Sales Tax – A general “sales tax” is levied on persons and businesses selling merchandise or services in the city limits on a retail basis. The categories for taxation are defined by state law. Monies collected under authorization of this tax are for the use and benefit of the City; however, no city may pledge anticipated revenues from this source to secure the payment of funds or other indebtedness. The City levies a three and one-forth cent sales tax on taxable sales within the City. The sales tax is collected by the Oklahoma Tax Commission and remitted to the City in the month following receipt by the Tax Commission.
Single Audit – Audit designed to meet the needs of all federal grantor agencies and performed in accordance with the Single Audit Act of 1984.
Special Revenue Funds – Used to account for the proceeds of specific revenue sources that are legally or administratively restricted to expenditures for certain purposes.
Statue – A written law enacted by a duly organized and constituted legislative body.
Taxes – Compulsory charges levied by a governmental unit for the purpose of financing services performed for the common benefit.
TIF – Tax Increment Financing. Allows local governments to finance development projects with the revenue generated by development.
Trust Fund – A fiduciary fund consisting of resources received and held by the City as trustee, to be expended or invested in accordance with the conditions of the trust.
Undesignated Unreserved Fund Balance – Available expendable financial resources in a governmental fund that are not the object of tentative management plans.
Unearned Revenue – Specific type of deferred revenue that does not involve the application of the availability criterion, and therefore applies equally to both accrual and modified accrual financial statements.
Unencumbered Balance – The amount of an appropriation that is neither expended nor encumbered. It is essentially the amount of money still available for fiscal year spending.
Use Tax – Tax paid on goods purchased outside the City but used within the jurisdiction.
WTP – Acronym for Water Treatment Plant. This is a project that Water and Wastewater resources are in process.
14.10 Click Here for Main Directory
