Adapted from the Wedge Diagram Methodology document created for the Minnesota Local Government Project for Energy Planning (LoGoPEP) by LHB and the University of Minnesota, Center for Science, Technology, and Environmental Policy. LoGoPEP was supported by the Department of Energy, Office of Energy Efficiency and Renewable Energy (EERE), under Award Number DE- DE-EE0007229.
EXECUTIVE SUMMARY
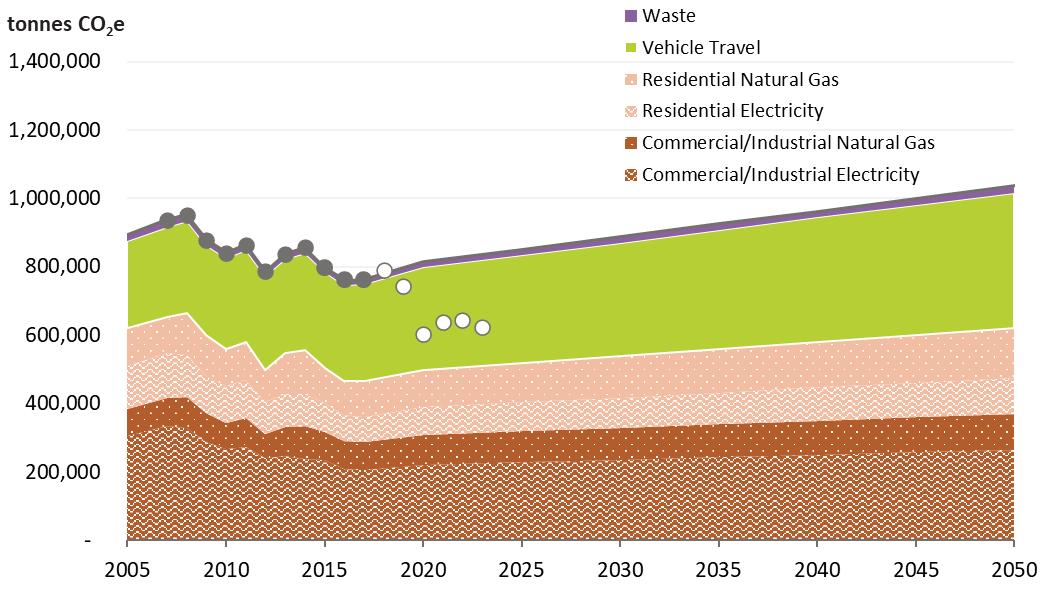
By 2050, Eden Prairie’s community-wide business-as-usual emissions are predicted to total 1,028,901 tonnes of carbon dioxide equivalent (CO2e). These emissions, in order of the largest generating source, will come from travel, commercial/industrial electricity and natural gas usage, residential electricity and natural gas usage, and waste. Total CO2e emissions by generating source can be found in Figure 1Business-as-Usual Emissions.
Figure 1 - Business-as-Usual Emissions
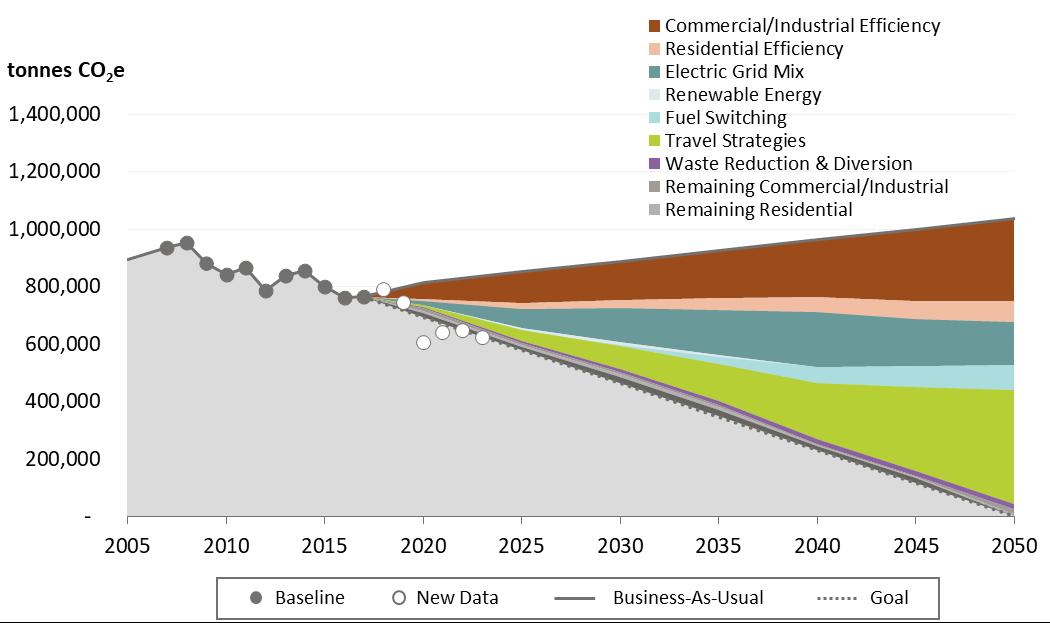
To achieve a 2050 zero carbon emission goal several strategies have been identified in the categories of commercial/industrial efficiency, residential efficiency, electric grid mix changes, renewable energy, fuel switching in buildings, travel, and waste. Combined, these strategies have the ability to reduce total carbon emissions by over 1,000,000 tonnes as shown in Figure 2 - Planned Emissions Reduction.
The strategies that will need to be employed to achieve this reduction include energy code enforcement, net-zero energy buildings, energy-efficient retrofits, behavior change, Xcel Energy’s planned emissions reduction, on-site renewable electricity, green power purchases, at-use fuel switching, travel mode shift, fleet electrification, and waste reduction and diversion. In support of these strategies the City will need to take several actions that encourage, regulate, incentivize, or demonstrative via leadership ways to accomplish significant decarbonization of our community’s energy usage. A summary of all actions that support the strategies leading to a carbon neutral 2050 are summarized in Table 1 - Climate Plan Actions
Encouragement Actions
• Encourage Energy Star, LEED, and/or net-zero energy certification
• Continue implementing the actions described in the City’s Energy Action Plan
• Promote building and operations BMPs
• Publicize financial resources for energy efficiency and renewable energy projects on City website
• Create a Commercial Energy Squad program
• Create neighborhood Green Teams and a Green Team Academy
• Promote renewable energy
• Encourage time-of-use pricing participation
• Encourage Xcel Energy to strengthen wireline infrastructure to support net metering solar array installations
• Promote participation in Xcel Energy’s renewable energy programs such as Windsource & Renewable*Connect
• Host education sessions on solar energy such as Solar Power Hours
• Provide education on types of green power options
• Promote building efficiency to reduce up-front costs of electrification
Figure 2 - Planned Emissions Reduction
Table 1 - Climate Plan Actions
• Promote use of light rail transit and development of Transit Oriented Development
• Increase funding to close trail and sidewalk gaps
• Promote Southwest transit bike program and Prime Services
• Encourage ride-share programs
• Participate in National Bike Challenge
• Encourage higher ridership on school bus system
• Develop City yard waste compost site
• Be a resource for businesses required to implement back-of-house organics by 2020
• Promote Hennepin County Master Recycler and Composter program
• Provide Hennepin County Fix-it-Clinics
• Create greater awareness for reuse options
Regulatory Actions
• Adopt and enforce an energy benchmarking ordinance
• Enforce current and future energy codes
• Support statewide policies such as building energy code updates and appliance, equipment and future efficiency standards
• Lobby for stretch energy code legislation
• Adopt and enforce an energy disclosure policy
• Explore rental licensing energy efficiency improvement requirements
• Prepare for grid modernization and battery stations
• Require new construction to be “solar ready”
• Adopt green building policy
• Renewable landfill gas purchase options
• Encourage the revision of the Conservation Improvement Program Planning and Performance Reporting to allow rebates/incentives for fuel switching by the MN Department of Commerce
• Require new development/redevelopment to install charging stations or be “EV ready”
• Support clean car rules requiring vehicle manufacturers to offer more electric vehicles for consumers
• Require more robust transit management demand (TDM) for new office development
• Implement curbside residential organics by 2022 and include multifamily
• Review possibility of zero-waste packaging ordinance
• Require events at City rental facilities to be zero-waste
• Require deconstruction versus demolition for redevelopment
• Explore options for decreasing single use plastics (on demand only, charge per use, ban)
Incentive Actions
• Educate, promote and continue offering PACE financing for clean energy projects
• Offer technical assistance for private sector development to incorporate net-zero energy
• Offer Home Energy Squad buy downs
• Incentives for elective energy improvements made during remodels
• Explore residential PACE financing program opportunities
• Explore incentives to promote fuel switching
• Reserved priority parking and charging stations for EVs
Leadership Actions
• Adopt net-zero energy standards for new public facilities
• Expand implementation of GreenStep Cities best practices for energy efficiency in existing public buildings
• Participate in the Guaranteed Energy Savings Program
• Facilitate development of green neighborhoods
• Develop a community solar garden
• Continue working on City solar projects
• Continue working with programs like Minnesota Brightfields Initiative and SolSmart
• Facilitate landfill solar project in Eden Prairie
• Implement strategic electrification in public buildings
• Install EV charging stations at high use City facilities
• Purchase EV police patrol car
• Modernize City facilities for operational EV Fleet
• Replace City Fleet with hybrid or fully electric vehicles
• Implement bike or e-scooter share program
• Purchase electric mowers for City operations
• Build out City trail and bike lane system with connections to neighboring cities and across freeway barriers
• Roundabout preference over signal
• Flashing signals during off-peak times
• Implement zero-waste City events
• Expand City organics to other facilities including Senior Center, Community Center, Water Treatment Plant and Maintenance Facility
• Develop portable water station to replace plastic water bottle sales at City events
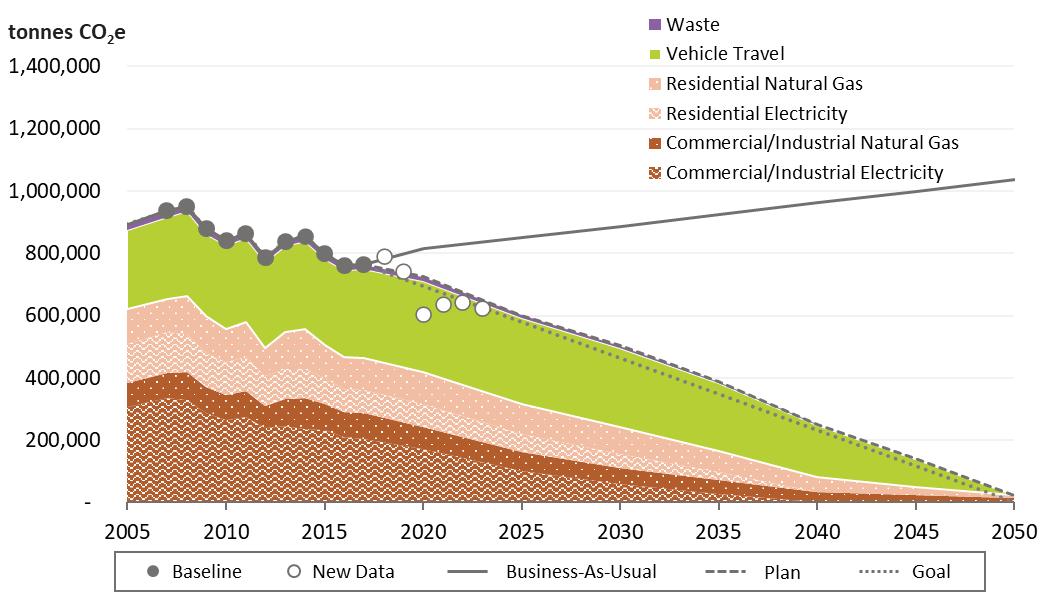
As shown in Figure 3 - Planned Emissions, the successful implementation of Eden Prairie’s Climate Action Plan strategies and actions will lead to the achievement of community-wide emissions dropping to zero by 2050 These efforts will require critical partnerships with homeowners, businesses, nonprofit organizations, other regulatory agencies, Xcel Energy, CenterPoint Energy, and the private sector advancement of emerging technologies. Many steps have already been taken which position the City well to be a leader in community-wide carbon reduction, but there will need to be a sustained push to encourage, regulate, incentivize and lead as the plan is implemented over the next 30 years. At key milestones the City will need to evaluate progress in meeting planned emission reduction goals and retool as necessary. It is recommended that the regional indicators presented in this report be collected and compared to planned targets every two years until 2030, then every five years thereafter.
While it is the goal of EP CAP to achieve total communitywide decarbonization by 2050, efforts that work to achieve this goal ahead of 2050 should be sought out and diligently pursued. Furthermore, The City shall make periodic updates to the CAP after communitywide emission data is collected to ensure the 2050 goal is achieved or to accelerate achievement to a more near term date.
Figure 3 - Planned Emissions
INTRODUCTION AND BACKGROUND
In 2019, the City of Eden Prairie partnered with LHB Corporation to develop a Climate Action Plan with a goal of becoming carbon neutral by 2050. To accomplish this effort historical energy use and carbon dioxide equivalent (CO2e) emissions were evaluated and contrasted to predict future annual emissions. This involved the use of a Wedge Diagram Tool developed by Minnesota’s Local Government Project for Energy Planning. The wedge diagram models actionable strategies for energy and greenhouse gas emission reductions and helps prioritize impactful strategies, understand implementation pathways, outline a plan for action, and measure progress toward goals.
After reviewing historic baseline data and determining business-as-usual forecasts, a series of strategies were developed and modeled with the Wedge Diagram Tool that showed significant reductions in carbon emissions in the categories of commercial/industrial efficiency, residential efficiency, electric grid mix changes, renewable energy strategies, fuel switching in buildings, travel, and waste commercial/industrial Next, the wedge diagram results were shared with the Eden Prairie Conservation Commission who then provided input on actionable steps that could be taken in support these key carbon reduction strategies.
Through this effort a menu of actions were developed and categorized as either encouragement, regulation, incentive or leadership. Encouragement action items are defined as those which the City publically promotes to aid in awareness, publicizes to draw attention to, to participates in to assist with education and outreach. Regulation action items are defined as efforts that involve the City mandating through the establishment of standards, rules, policies or ordinances. Regulation action could also involve the City advocating for other regulatory agencies to develop standards, rules, policies or statutes. Incentive actions are defined as measures that work to motivate others to take steps they otherwise might not. This often times include financial incentives but can also consist of providing technical assistance or priority treatments. Finally, leadership action items are those where the City is taking a forward role in demonstrating best practices or implanting new technologies as a means of demonstration.
BASELINE DATA
Baseline emissions data are gathered through the Regional Indicators Initiative in compliance with the U.S. Community Protocol for Accounting and Reporting of Greenhouse Gas Emissions produced by ICLEI.
The baseline greenhouse gas emissions inventories include:
• Energy: Emissions from non-travel energy consumed within city boundaries. Each energy utility serving customers within the city provides annual totals for citywide electricity use, natural gas use, and district heating and cooling (if applicable), broken down between residential and commercial/industrial uses. Emissions are calculated based on the emissions factors associated with each energy source. Electricity emissions factors vary over time based on the energy sources used for generation. When available, electricity emissions factors are utility-specific; otherwise, regional averages from eGRID subregion MRO West are used 1
• Travel: Emissions caused by on-road vehicle travel within city boundaries. Vehicle miles traveled are measured by the Minnesota Department of Transportation and publicly reported at the city scale. 2 The associated greenhouse gas emissions are calculated based on the historic vehicle fleet mix for urban areas of Minnesota, annual national averages for fuel economy, and statewide biofuel characteristics.
Eden Prairie Climate Action Plan 2020 6
• Waste: Emissions caused by the generation and management of municipal solid waste. Solid waste data is collected by the Minnesota Pollution Control Agency at the county scale and is estimated for cities using the county's per capita rate. Associated emissions are calculated based on the waste management method.
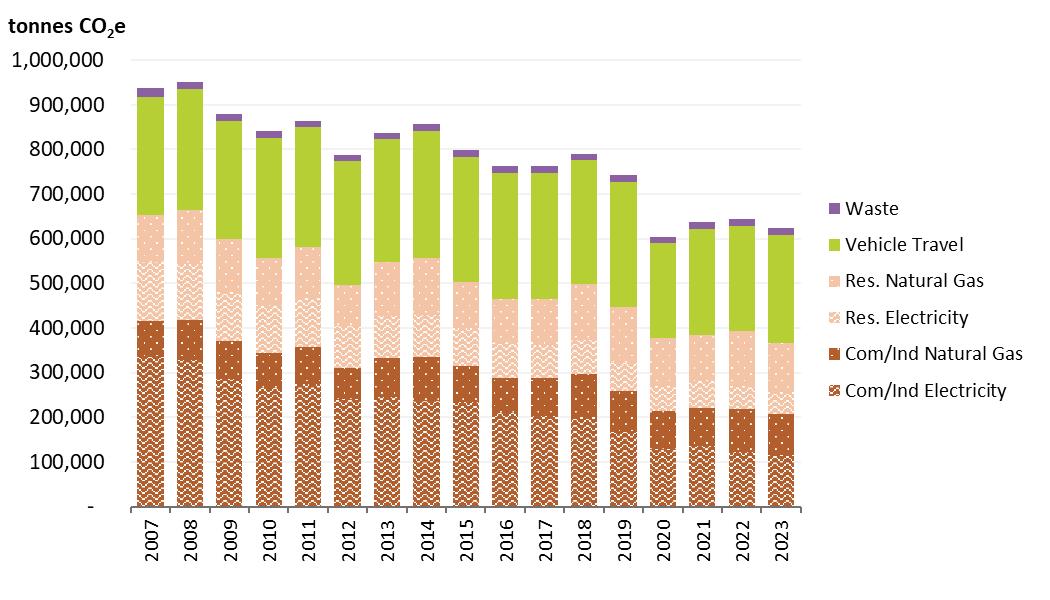
The summary of Eden Prairie historical emissions can be found in Figure 4 – Baseline Emissions The full methodology for determining baseline greenhouse gas emissions can be found at the Regional Indicators Initiative website (www.regionalindicatorsmn.com).
BUSINESS-AS-USUAL FORECAST
The business-as-usual emissions forecast is based upon predicted city growth, assuming current efficiency levels (energy, travel, waste per person) and carbon intensities (GHG per unit of energy consumed, miles travelled, waste managed) remain constant. This approach enables efficiency and decarbonization improvements to be accounted for in the reduction wedges, whether these improvements are legislatively mandated, market-driven, or voluntary.
Business-as-usual energy emissions are estimated by:
1. Calculating the 3-year moving average residential energy consumption per person and commercial/industrial energy consumption per job from the baseline data for natural gas and electricity.
2. Multiplying the normalized energy consumption from Step 1 by future population and jobs estimates, respectively, to get the total expected energy consumption.
Figure 4 – Baseline Emissions
3. Multiplying the total expected energy consumption by the most recent emissions factors for electricity and natural gas, respectively, to get the total expected energy emissions.
Business-as-usual travel emissions are estimated by:
1. Calculating the 3-year moving average vehicle miles traveled (VMT) per person from the baseline data.
2. Multiplying the VMT/person from Step 1 by future population estimates to get the total expected vehicle miles traveled
3. Multiplying the total expected vehicle miles traveled by the most recent emissions factor for vehicle travel to get the total expected travel emissions.
Business-as-usual waste emissions are estimated by:
1. Calculating the 3-year moving average municipal solid waste (MSW) per person from the baseline data.
2. Multiplying the MSW/person from Step 1 by future population estimates to get the total expected municipal solid waste.
3. Multiplying the total expected municipal solid waste by the most recent emissions factor for waste management to get the total expected waste emissions.
The baseline energy consumption, vehicle miles traveled, demographic data, and emissions factors are from the Regional Indicators Initiative data. Population and job forecasts are from the Metropolitan Council’s “Population, Households and Employment Forecasts to 2040, Twin Cities Metropolitan Area” (August 28, 2019). 3 Since these projections are only through 2040, a linear forecast was used to estimate out to 2050.
Since different portfolios of reduction strategies are available to new buildings versus existing buildings, the business-as-usual energy use needs to be divided between new and existing buildings to effectively calculate the reduction wedges. The new construction rates for Eden Prairie were calculated based on information from the City’s comprehensive plan for 2040. Commercial and industrial new construction rates were estimated using planned growth in the commercial, office/light industrial, and industrial land use categories. 4 Growth in each of the land use categories was weighted equally since each is assigned the same maximum floor area ratio (FAR) by City ordinance. 5
Residential new construction rates were estimated by:
1. Calculating the number of new housing units needed to serve the City’s projected growth in households, assuming the current vacancy rate is held constant. 6, 7
2. Determining the number of new housing units that will be single-family homes based on the available land for low-density housing and the minimum density. 8, 9
3. Assuming the remaining housing units will be high-density.
4. Weighting the new low-density and high-density housing units based on how their predicted size (sf) compares to the average size of the existing housing stock in the City to account for the lower energy use of high-density housing. 10, 11, 12
Since the comprehensive plan projections only extend to 2040, the new construction rates are assumed to stay constant between 2040 and 2050. In 2050, this methodology results in 48% of the city’s commercial building stock and 26% of the city’s residential stock being built after 2017.
A summary of business-as usual emissions for waste, vehicle travel, residential natural gas, residential electricity, business natural gas and business electricity can be found in Figure 5 -Business-As-Usual Emissions.
5 - Business-As-Usual Emissions
STRATEGIC PLAN
The strategic plan shows the anticipated outcomes of committing to a set of emission reduction strategies. The strategic plan is calculated by adjusting the business-as-usual forecast based on the sum of the reductions achieved through each of the selected strategies.
Eden Prairie Climate Action Plan 2020
Figure
Strategy Interactions
Climate planning should be approached through a combination of efficiency and decarbonization. However, if the savings from efficiency and decarbonization are both calculated based on the businessas-usual consumption and emissions factors, the savings would be double-counted. To avoid this, savings are applied first to efficiency strategies, then to decarbonization strategies. For building energy, this approach first applies savings to efficiency strategies, then electric grid mix strategies, then to renewable energy strategies, and finally to fuel switching strategies. In essence, efficiency savings are based on business-as-usual energy use and business-as-usual emissions factors. Electric grid mix
Example
In 2030, Community A has a business-as-usual energy use of 1000 MMBtu and a business-as-usual emissions factor of 0.10 tCO2e/MMBtu. Community A commits to efficiency strategies that reduce energy use by 25% by 2030 and plan to install enough on-site photovoltaics to generate 100 MMBtu per year. The energy utility that serves Community A commits to reducing their emissions factor by 30% by 2030.
Energy Efficiency Reduction: 1000 MMBtu x 25% x 0.10 tCO2e/MMBtu = 25 tCO2e
Electric Grid Mix Reduction: 750 MMBtu x 0.10 tCO2e/MMBtu x 30% = 22.5 tCO2e
strategies are based on planned energy use and business-as-usual emissions factors. Renewable energy strategies are based on planned energy use and planned emissions factors. A similar approach is used within the travel sector to first apply savings from mode shift and then electrification. In addition to these big picture strategy interactions, there are also several overlaps between strategies within a single category. These interactions are described in the respective category sections.
Definitions
The following terms are used in the calculation of the savings potential associated with each strategy.
• Emission reduction
For each strategy, the emission reduction represents the reduction in tonnes of carbon dioxide equivalents (tCO2e) from the business-as-usual forecast.
• Building energy use
Building energy use refers to the amount of energy used in buildings, in million British thermal units (MMBtu). This is the first data point needed for the energy efficiency strategies, and is typically separated into commercial and industrial buildings versus residential buildings, as well as existing versus new versus renovated buildings. For strategies that have different savings rates based on fuel type, building energy use may also be separated between electricity and natural gas.
While Business-As-Usual (BAU) building energy use is used as the starting point for all efficiency strategies, planned building energy use is the starting point for decarbonization strategies. Planned
building energy use is defined as the amount of energy anticipated after all efficiency and fuel switching strategies are applied.
• Participation rate
Participation rates are defined as the percentage of people or buildings adopting the given strategy, assuming all households operate at the same energy intensity, and all jobs have equivalent energy intensities. Since this is not true (especially for commercial/industrial buildings), the participation rate is more accurately described as the percentage of energy use that will be affected by the strategy. For example, if large commercial buildings comprise 25% of the building stock, but use 50% of the energy, a strategy that targets all large commercial buildings would use a participation rate of 50%.
For one-time strategies such as equipment replacement or retrofits, participation rates are distributed equally across the time period selected for strategy adoption. For example, a participation rate of 15% for building retrofits from 2025-2040 would result in a 1% annual participation rate. For ongoing strategies such as behavior change or green power purchase, participation rates are assigned to each year of the designated time period. For example, a participation rate of 15% for behavior change from 2025-2040 would result in a 15% annual participation rate.
• Energy savings rate
Energy savings rates are defined as the reduction in energy use from the BAU based upon the given strategy. Depending on the strategy, there may be separate energy savings rates for electricity versus natural gas.
• Emission factor
Emission factors refer to the emissions intensity of each unit of energy consumed, in tonnes of carbon dioxide equivalent per million British thermal unit (tCO2e/MMBtu). Since natural gas emission factors do not vary substantially over time, the emissions factor for natural gas remains constant at 0.05 tCO2e/MMBtu. 13 The emission intensity of electricity changes based on the primary energy used to generate the electricity. In this analysis, electricity supplied through the grid is assigned an emissions factor that changes over time based on the anticipated portfolio mix of each utility serving the community. Electricity supplied through renewable energy – whether from green power purchase or on-site renewables – are assigned an emissions factor of zero.
While the Business-As-Usual (BAU) emissions factor is used to determine emissions savings for all efficiency strategies, the planned emissions factor is the starting point for decarbonization strategies. The planned emissions factor is the anticipated emissions factor of the grid, after applying the electric grid mix strategies.
A summary of community-wide planned emissions reduction in Eden Prairie can be found in Figure 6 - Planned Emissions Reduction and Figure 7 - Planned Emissions.
Figure
Persistence of Strategies
Persistence is defined as the effectiveness and longevity of reduction strategies after the initial implementation period. Savings from one-time strategies that are based on installed technology (e.g. Net-Zero Energy Buildings and Appliance, Equipment, and Fixture Efficiency) are typically assumed to persist throughout the planning horizon, reflecting the lifetime of the energy-saving building component or device. Savings from strategies that rely on the continued engagement of the building operator or occupants (e.g. Energy-Efficient Operations and Behavior Change) are assumed to be contingent on continued participation. Assumptions regarding persistence are described for each strategy in the documentation below. A summary of actions steps supporting Eden Prairie’s carbon reduction strategies is found in the various tables below.
1. COMMERCIAL/INDUSTRIAL ENERGY EFFICIENCY
Increased energy efficiency in commercial and industrial new construction, renovations, and existing buildings can be achieved by improving the building’s thermal envelope, using more efficient equipment, appliances, and fixtures, and using these devices more efficiently.
Strategy Interactions:
- The savings from these efficiency strategies are based on the business-as-usual emissions factor rather than the planned emissions factor.
- Savings from Energy Code Enforcement are applied before Net-Zero Energy Buildings, so that the savings from Net-Zero Energy Buildings are compared to the planned energy code, rather than compared directly to the business-as-usual.
- Buildings constructed within the planning horizon are not eligible for strategies for existing buildings. For example, a building constructed in 2025 can achieve ongoing savings through compliance with the energy code, but cannot achieve additional savings through efficient building operations. While this may underestimate the total savings potential for a new building, it avoids double-counting.
- The remaining commercial/industrial efficiency strategies are defined in a way that avoids overlap. For example, Energy-Efficient Retrofits include actions related to replacing or enhancing components of the building’s thermal envelope, mechanical systems, lighting fixtures, and appliances. Efficient Building Operations addresses operations and maintenance practices that are typically within the control of a building operator, while actions that are controlled by building occupants are included in Behavior Change.
1.1. Energy Code Enforcement
New construction and renovation projects in Minnesota are required to comply with the Minnesota Energy Code. In 2015, Minnesota adopted the 2012 International Energy Conservation Code (IECC), which identifies energy conservation requirements for building envelopes and systems and references ASHRAE 90.1-2010 as a compliance pathway. This strategy estimates the emissions savings from the increased energy efficiency of a new building that complies with the current energy code as compared to a baseline building To avoid double-counting with other strategies, renovations are not included within this strategy.
Assumptions:
- The methodology for predicting energy use from new construction is described in the “Business-AsUsual Forecast” section at the beginning of this document.
- All new construction and renovations comply with the energy code. This is an improvement from the average Minnesota compliance rate, which was 91.8% for commercial buildings in 2012-2013. 14 The interim participation rates are:
- New buildings that comply with the energy code achieve 34.5% energy savings in comparison with the average baseline building. 15 This assumes the energy performance of the average baseline building is comparable to the ASHRAE 90.1-1989 energy code – which was in effect from 1991 to 2009 – and that meeting Minnesota’s current energy code is equivalent to meeting ASHRAE 90.12010. 16
- Although new versions of the energy code typically go into effect in Minnesota every 6 years, future energy code improvements are not modeled as part of this strategy. Commercial building energy savings have historically ranged from 3.2-11.9% for each 3-year code update. 17
- Energy savings rates are applied equally to natural gas and electricity.
- Energy savings associated with energy-efficient building design and construction are expected to persist over the lifetime of the building.
1.2. Net-Zero Energy Buildings
This strategy involves meeting more aggressive energy performance thresholds for new construction than required by the current Energy Code, with the goal of producing as much energy on-site as is used. This concept is called net-zero energy. Based on the Architecture 2030 Challenge, this strategy models
stepped energy performance targets for new buildings that lead to net-zero energy building design by 2030. To avoid double-counting with other strategies, renovations are not included within this strategy.
Minnesota has implemented a unique example of a net-zero energy standard through a program called Sustainable Buildings 2030 (SB 2030), which is currently required on projects that receive general obligation bond funding from the State of Minnesota. There are several ways to expand this strategy to include additional buildings. Individual projects can elect to pursue aggressive performance targets (which may be incentivized through utility programs). Cities can require compliance with a green building policy for their own buildings and other projects that receive financial support or regulatory approval from the city. At the statewide scale, the building code can be revised to either adopt a more aggressive energy code or to provide a stretch code as an option that can be adopted by local jurisdictions.
Assumptions:
- The methodology for predicting energy use from new construction is described in the “Business-AsUsual Forecast” section at the beginning of this document.
- The city achieves a participation rate of 100% by 2032, which assumes that net-zero energy is a requirement of Minnesota’s building code by then. The interim participation rates are:
- The energy emissions savings rate increases over time, mimicking the savings anticipated through complying with SB 2030 and assuming a lag time between building design and occupancy. For example, a building that starts schematic design in 2030 would be designed to be net-zero energy, but may not actually be built and operational until 2035. The savings values are slightly different than the stated SB 2030 savings of 70%, 80%, and 90% due to a different baseline being used. SB 2030 uses a 2003 building, which has been estimated to be 10% worse than a building meeting ASHRAE 90.1 1989. The baseline building used here is assumed to meet ASHRAE 90.1 1989.
- To avoid double-counting, energy emissions savings are adjusted from the user input to remove savings associated with energy code enforcement (Strategy 1.1).
- On-site renewable electricity is calculated based on the assumption that energy emissions savings of 84% can be achieved through efficiency. 18 The remaining 16% required to achieve net zero energy will need to be fulfilled by renewable energy generation.
- Renewable energy generation savings are based on the planned electricity emissions factor, rather than the BAU emissions factor.
- Energy savings rates are applied equally to natural gas and electricity.
- Energy savings associated with energy-efficient building design and construction are expected to persist over the lifetime of the building.
1.3. Energy-Efficient Retrofits
Commercial building retrofits are defined here as building envelope improvements and/or replacement of mechanical equipment, lighting fixtures, or appliances that results in improved energy efficiency. This strategy applies to existing buildings only, and not to new construction.
Assumptions:
- This strategy models the energy savings from achieving the targets described in Eden Prairie’s Energy Action Plan for participation in Xcel Energy’s conservation programs for electricity and CenterPoint’s conservation programs for natural gas: “By 2025, 50 percent of the largest commercial/industrial energy users participate in Xcel Energy conservation programs.” 19
Annual savings from conservation program participation in the specified year: 20
- Assuming the average participating business will complete 2.75 conservation programs, this will result in 84% of businesses participating by 2050. Percent of businesses that have participated in conservation programs for their existing buildings by the specified year:
-Energy savings from energy-efficient retrofits are assumed to persist over the lifetime of the building since these savings are not dependent on occupant behavior.
1.4. Efficient Building Operations
Low to no-cost improvements in energy efficiency can be achieved through building operations by optimizing temperature setpoints and setback schedules and conducting equipment maintenance and diagnostics. In addition to regular diagnostic tasks conducted by the building operator, efficient building operations may also include periodic re-commissioning, during which a certified professional will systematically identify and remedy energy wasting malfunctions.
Assumptions:
-By 2025, 85% of the city’s commercial and industrial buildings are actively engaged in building operations BMPs. This is based on the ultimate net participation rate estimated in a national study for commercial building operations and performance programs. 21 This is described as an “aggressive but reasonable level of participation.” The interim participation rates are:
- The Energy Savings Rate is 23%. This reflects the savings potential simulated by the New Buildings Institute for implementing best practices for commissioning, operations, and maintenance in a midsize office building in Minneapolis and Duluth. 22 This is on the conservative end of the savings potential of 23-30% modeled on a national scale by the Pacific Northwest National Laboratory. 23
- The persistence of savings for this strategy relies on the continued implementation of energyefficient operation practices. If the participation rate drops, savings achieved in previous years will not persist. This may slightly underestimate the continued savings from this strategy; the average persistence for retrocommissioning programs range from 5-7 years, and a 3-year life is assumed for programs like strategic energy management. 24
1.5. Behavior Change
Businesses and industries can reduce their energy consumption through actions such as using smart power strips and power management strategies to reduce plug loads, turning off lights and computers, using operable windows and blinds to control heat gain, and adjusting temperature setpoints. These actions can be supported through behavior change programs that are based on information, education, and/or social interaction. 25 Examples of behavior change programs include real time feedback, competitions, and strategic energy management led by an energy champion.
Assumptions:
- By 2025, occupants of 33% of the city’s commercial/industrial buildings are engaged in sustained behavior change strategies. This has been estimated as the adoption rate of strategic energy management in 2030. 26 The interim participation rates are:
- The average percentage reduction in energy consumption for businesses engaged in behavior change activities is 5%. This is within the range of savings typically achieved through real-time feedback (1%-15%), persuasive messaging (1.2%-8%), competitions (1.8%-21%), and in-person strategies (4.4%-27%). 27
- The energy savings rate is applied equally to natural gas and electricity. In practice, commercial behavior change programs often achieve higher savings in electricity than natural gas – whether due to being targeted at electricity only, or due to the types of actions taken. 28
- The energy savings rate is assumed to be constant over time. This does not account for variations in savings as programs ramp-up or as the participants’ engagement level changes. 29
- Long-term persistence rates for behavior change strategies are currently unknown, but are likely to depend on the duration of user exposure to the program. 30, 31 Here, the persistence of savings for this strategy is assumed to rely on the continued implementation of behavior-based energy management.
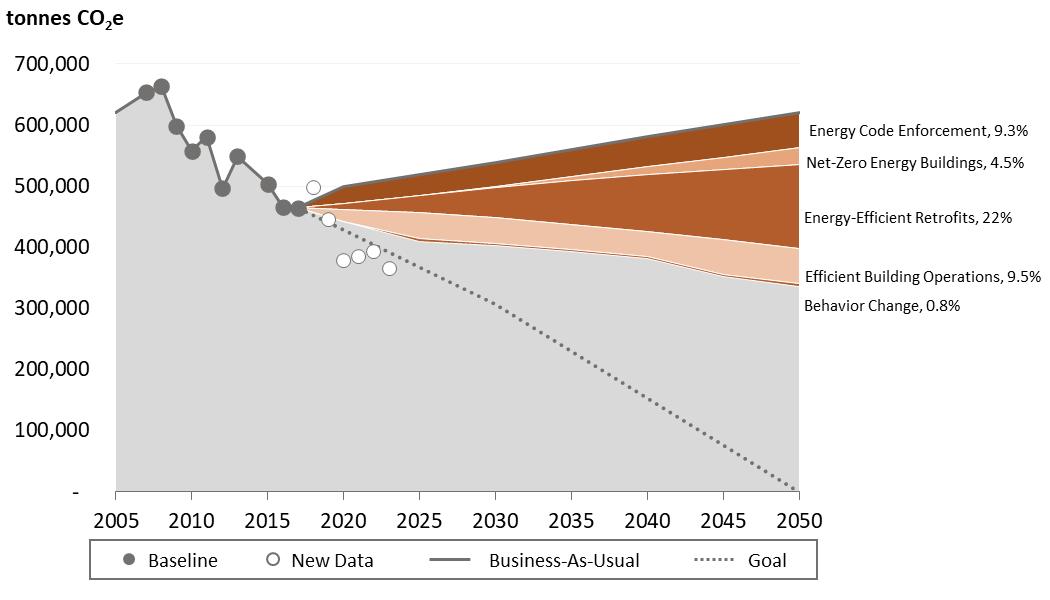
1.6. Total Estimated Commercial/Industrial Energy Efficiency Emissions Reduction
Through the strategies of energy code enforcement, net-zero energy buildings, energy-efficient retrofits, efficient building operations and behavior change, commercial and industrial facilities in Eden Prairie could attain an emissions reduction of 286,208 tonnes of CO2e by 2050. This represents 28.5% of all emissions in the Eden Prairie business-as-usual model. Predicted results for each strategy in the commercial/industrial category are detailed in Figure 8 – Estimated Commercial/Industrial Energy Efficiency Emissions Reduction.
1.7.
Commercial/Industrial Energy Efficiency Emissions Reduction Actions
Several actions will need to be taken to achieve the desired results outlined in the commercial/industrial emission reduction strategies These actions will target new construction, renovations, and existing buildings. Recommended actions have been grouped under the categories of encouragement, regulation, incentive or leadership. Details for all recommended actions are listed in Table 2Commercial/Industrial Actions
Table 2 - Commercial/Industrial Actions
Encouragement Actions
• Encourage Energy Star, LEED, and/or net-zero energy certification
• Continue implementing the actions described in the City’s Energy Action Plan
• Promote building and operations BMPs
• Publicize financial resources for energy efficiency projects on City website
• Create a Commercial Energy Squad program
Regulatory Actions
• Adopt and enforce an energy benchmarking ordinance
• Enforce current and future energy codes
• Support statewide policies such as building energy code updates and appliance, equipment and future efficiency standards
• Lobby for stretch energy code legislation
Incentive Actions
• Educate, promote and continue offering PACE financing for clean energy projects
• Offer technical assistance for private sector development to incorporate net-zero energy Leadership Actions
• Adopt net-zero energy standards for new public facilities
• Expand implementation of GreenStep Cities best practices for energy efficiency in existing public buildings
• Participate in the Guaranteed Energy Savings Program
2. RESIDENTIAL ENERGY EFFICIENCY
Increased energy efficiency in residential new construction, renovations, and existing buildings can be achieved by improving the building’s thermal envelope, using more efficient equipment, appliances, and fixtures for space conditioning, lighting, cooking, and entertainment, and using these devices more efficiently.
Strategy Interactions:
- The savings from these efficiency strategies are based on the business-as-usual emissions factor rather than the planned emissions factor.
- Savings from Energy Code Enforcement are applied before Net-Zero Energy Buildings, so that the savings from Net-Zero Energy Buildings are compared to the planned energy code, rather than compared directly to the business-as-usual.
2.1.
Energy Code Enforcement
New construction and renovation projects in Minnesota are required to comply with the Minnesota Energy Code. In 2015, Minnesota adopted the 2012 International Energy Conservation Code (IECC), which identifies energy conservation requirements for building envelopes and systems. This strategy estimates the emissions savings from the increased energy efficiency of a residential building that complies with the current energy code as compared to a baseline building. To avoid double-counting with other strategies, renovations are not included within this strategy.
Assumptions:
- The methodology for predicting energy use from new construction and renovations is described in the “Business-As-Usual Forecast” section at the beginning of this document.
- All new construction complies with the energy code. This is an improvement from the average Minnesota compliance rate, which was 76.8% for residential buildings in 2012-2013. 32 The interim participation rates are:
- New buildings that comply with the energy code achieve 38.5% energy savings in comparison with the average baseline building. 33 This assumes the energy performance of the average baseline building is comparable to the 1989 Model Energy Code (MEC) – which was in effect during the 1990s – and that meeting Minnesota’s current energy code is equivalent to meeting 2012 IECC. 34
- Although new versions of the energy code typically go into effect in Minnesota every 6 years, future energy code improvements are not modeled as part of this strategy.
- Energy savings rates are applied equally to natural gas and electricity.
- Energy savings associated with energy-efficient building design and construction are expected to persist over the lifetime of the building.
2.2. Net-Zero Energy Buildings
This strategy involves meeting more aggressive energy performance thresholds for new construction than required by the current Energy Code, with the goal of producing as much energy on-site as is used. This concept is called net-zero energy. Based on the Architecture 2030 Challenge, this strategy models stepped energy performance targets for new buildings that lead to net-zero energy building design by 2030. To avoid double-counting with other strategies, renovations are not included within this strategy.
Minnesota has implemented a unique example of a net-zero energy standard through a program called Sustainable Buildings 2030 (SB 2030), which is currently required on projects that receive general obligation bond funding from the State of Minnesota. There are several ways to expand this strategy to include additional buildings. Individual projects can elect to pursue aggressive performance targets (which may be incentivized through utility programs). Cities can require compliance with a green building policy for their own buildings and other projects that receive financial support or regulatory approval from the city. At the statewide scale, the building code can be revised to either adopt a more aggressive energy code or to provide a stretch code as an option that can be adopted by local jurisdictions.
Assumptions:
- The methodology for predicting energy use from new construction is described in the “Business-AsUsual Forecast” section at the beginning of this document.
- The city achieves a participation rate of 100% by 2032, which assumes that net-zero energy is a requirement of Minnesota’s building code by then. The interim participation rates are:
- The energy emissions savings rate increases over time, mimicking the savings anticipated through complying with SB 2030 and assuming a lag time between building design and occupancy. For example, a building that starts schematic design in 2030 would be designed to be net-zero energy, but may not actually be built and operational until 2035. The savings values are slightly different than the stated SB 2030 savings of 70%, 80%, and 90% due to a different baseline being used. SB 2030 uses a 2003 building, which has been estimated to be 10% worse than a building meeting 1989 MEC. The baseline building used here is assumed to meet 1989 MEC.
- To avoid double-counting, energy emissions savings are adjusted from the user input to remove savings associated with energy code enforcement (Strategy 1.1).
- On-site renewable electricity is calculated based on the assumption that energy emissions savings of 80% can be achieved through efficiency. 35 The remaining 20% required to achieve net zero energy will need to be fulfilled by renewable energy generation
- Renewable energy generation savings are based on the planned electricity emissions factor, rather than the BAU emissions factor.
- Energy savings rates are applied equally to natural gas and electricity.
- Energy savings associated with energy-efficient building design and construction are expected to persist over the lifetime of the building.
2.3. Energy-Efficient Retrofits
Residential building retrofits are defined here as weatherization and/or replacement of mechanical equipment, lighting fixtures, or appliances that results in improved energy efficiency. Programs such as home energy audits can help homeowners identify and prioritize impactful upgrades. This strategy applies to existing homes only, and not to new construction.
Assumptions:
- This strategy models the energy savings from achieving the targets described in Eden Prairie’s Energy Action Plan for participation in Xcel Energy’s conservation programs for electricity and CenterPoint’s conservation programs for natural gas: “By 2025, 75 percent of Eden Prairie households will participate in a renewable energy or energy efficiency program.” 36
Annual savings from conservation program participation in the specified year: 37
- Assuming the average participating household will complete 2.25 conservation programs, this will result in 82% of businesses participating by 2050. Percent of households that have participated in conservation programs for their existing buildings by the specified year:
-Energy savings from thermal envelope improvements are assumed to persist over the lifetime of the building since these savings are not dependent on occupant behavior.
2.4. Behavior Change
Residents can reduce their household energy consumption through actions such as turning off lights and computers, using operable windows and blinds to control heat gain, and adjusting temperature setpoints. These actions can be supported through behavior change programs that are based on information, education, and/or social interaction. 38 Examples of behavior change programs include home energy reports that encourage conformation to social norms by comparing a household’s energy use to that of its neighbors, real time feedback, and competitions.
Assumptions:
-By 2025, 98% of the city’s households will be actively engaged in behavior change. These participation rates can be achieved through behavior change programs, which may be implemented as “opt-out” programs – in which all residents participate unless they request to be excluded – or “opt-in” programs in which residents actively choose to participate. Opt-in programs typically have lower participation rates (20%) than opt-out programs (98%). 39 The interim participation rates are: -
- The average percentage reduction in energy consumption for households engaged in behavior change activities is 1.6%. Energy savings for behavior change programs vary based on program design, with higher per-customer savings achieved through opt-in programs than through opt-out programs. While savings from opt-in home energy report programs can reach as high as 16%, optout program savings range from 1.2-2.2% for electricity and 0.3-1.6% for natural gas. 40 This is similar to the savings seen from real-time feedback, with demonstrated savings of 1% and a theoretical maximum potential of up to 17% 41 Savings from residential competitions range from 0.7-14% for electricity and 0.4-10% for natural gas, with most achieving savings of 5% or less. 42
- The energy savings rate is applied equally to natural gas and electricity. In practice, residential behavior change programs often achieve higher savings in electricity than natural gas – whether due to being targeted at electricity only, or due to the types of actions taken. 43
- The energy savings rate is assumed to be constant over time. This does not account for variations in savings as programs ramp-up or as the participants’ engagement level changes. 44
- The persistence of savings for this strategy relies on the continued implementation of behavioral practices. 45 If the participation rate drops, savings achieved in previous years will not persist. 46
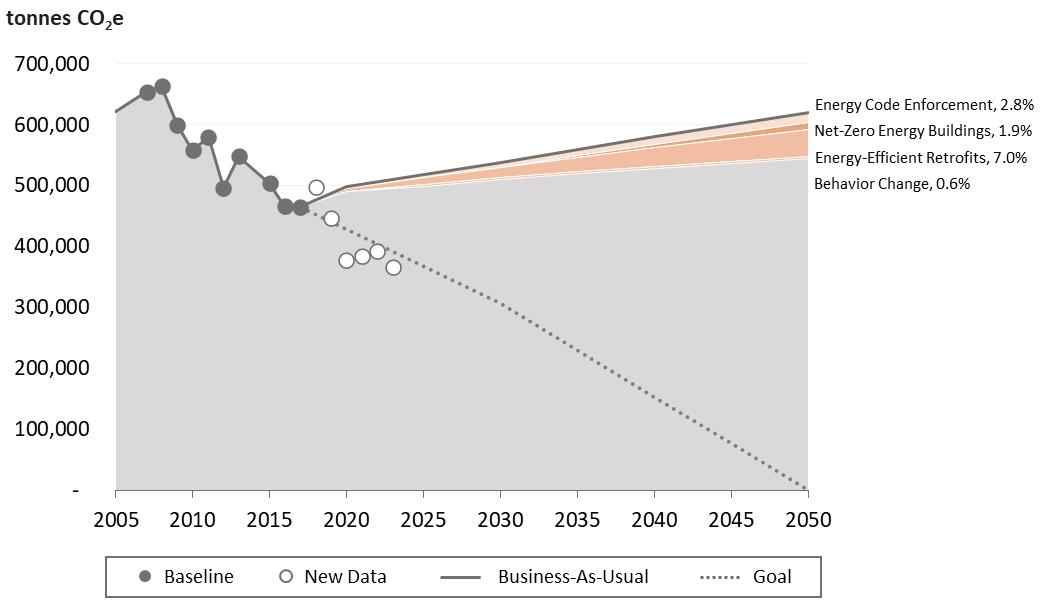
2.5. Total Estimated Residential Energy Efficiency Emissions Reduction
Through the strategies of energy code enforcement, net-zero energy buildings, energy-efficient retrofits, and behavior change, residential buildings in Eden Prairie could attain an emissions reduction of 75,815 tonnes of CO2e by 2050. This represents 7.5% of all emissions in the Eden Prairie business-as-usual model. Predicted results for each strategy in the residential category are detailed in Figure 9 –Estimated Residential Energy Efficiency Emissions Reduction.
2.6. Residential Energy Efficiency Emissions Reduction Actions
Several actions will need to be taken to achieve the desired results outlined in the residential emission reduction strategies. These actions will target new construction, renovations, and existing buildings. Recommended actions have been grouped under the categories of encouragement, regulation, incentive or leadership. Details for all recommended actions are listed in Table 3 - Residential Actions
Encouragement Actions
• Encourage Energy Star, LEED, Passive House and/or net-zero energy certification
• Continue implementing the actions described in the City’s Energy Action Plan
• Publicize financial resources for energy efficiency projects on City website
• Create neighborhood Green Teams and a Green Team Academy Regulatory Actions
• Enforce current and future energy codes
• Adopt and enforce an energy disclosure policy
• Support statewide policies such as building energy code updates and appliance, equipment and future efficiency standards
• Explore rental licensing energy efficiency improvement requirements Incentive Actions
Table 3 - Residential Actions
• Offer technical assistance for private sector development to incorporate net-zero energy
• Offer Home Energy Squad buy downs
• Incentives for elective energy improvements made during remodels
• Explore residential PACE financing program opportunities
Leadership Actions
• Facilitate development of green neighborhoods
3. ELECTRIC GRID MIX
With the majority of non-travel energy emissions attributed to electricity consumption, strategies that impact the electric generation sector have the potential to result in significant savings. This wedge includes strategies that shift the primary energy used to generate electricity for the grid to less carbonintensive sources.
Strategy Interactions:
- The savings from these strategies are based on planned – not business-as-usual – electricity use. Increasing energy efficiency will decrease the savings from these strategies.
- Electric grid mix strategies are treated independently from the renewable energy strategies. It is assumed that the renewable energy strategies occur in addition to electric grid mix changes, rather than counting local renewable energy generation toward system-wide emissions reduction goals. This reflects current practice for green power purchase programs in which the renewable energy credit (REC) is owned by the end customer, but may result in an overestimate of savings when RECs are owned by the utility, which is often the case for community solar projects.
- To avoid double-counting, the emissions savings from any displaced electricity achieved through the Renewable Energy strategies are based on the planned emissions intensity of the grid, which is selected in this section. For example, if the grid mix is less clean, the savings from an on-site photovoltaic system will be greater.
3.1. Xcel Energy’s Planned Emissions Reductions
Minnesota's Renewable Energy Standard requires electric utilities to procure at least 25% of their portfolio from renewable sources by 2025 This has resulted in a reduction in the electricity emissions factor during the baseline time period, and will continue to achieve reductions through 2025. In addition to these legislated savings, electric utilities impact their emissions factor through other portfolio management decisions, such as switching from coal-fired power plants to natural gas. This strategy is based on the projected emissions factors identified by electric utilities in their Integrated Resource Plans (IRPs). 47
Assumptions:
- Xcel Energy’s future emissions factors for 2020-2034 are based on the five-state Northern States Power Company System. 48 For 2035-2050, the emissions reductions follow a linear trajectory to Xcel’s stated goal of carbon-free by 2050. 49
Planned Emissions Factor Savings Rates:
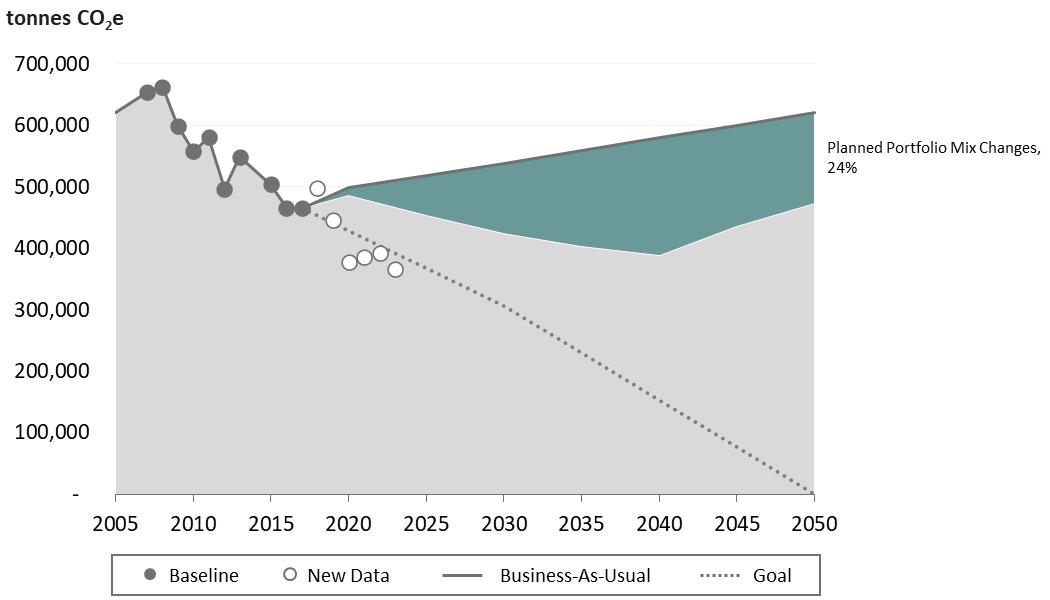
3.2. Total Estimated Electric Grid Mix Emissions Reduction
Through Xcel Energy’s planned emissions reduction strategies the electric grid mix in Eden Prairie could attain an emissions reduction of 148,051 tonnes of CO2e by 2050. This represents 14.7% of all emissions in the Eden Prairie business-as-usual model. Predicted results for these strategies are detailed in Figure 10 – Estimated Electric Grid Mix Emissions Reduction.
10 – Estimated Electric Grid Mix Emissions Reduction
3.3. Electric Grid Mix Emissions Reduction Actions
Several actions will need to be taken to achieve the desired results outlined in the electric grid mix emission reduction strategies. These actions will target the electric generation sector. Recommended actions have been grouped under the categories of encouragement, regulation, incentive or leadership. Details for all recommended actions are listed in Table 4 - Electric Grid Mix Actions
Table 4 - Electric Grid Mix Actions
Encouragement Actions
• Promote renewable energy
• Encourage time-of-use pricing participation
• Encourage Xcel Energy to strengthen wireline infrastructure to support net metering solar array installations
Regulatory Actions
• Prepare for grid modernization and battery stations
Incentive Actions
• None identified
Figure
None identified
4. RENEWABLE ENERGY
In addition to the energy transition occurring at the scale of the electric grid, local commitment to renewable energy can contribute to emissions reductions. This wedge includes strategies such as green power purchase by residents and businesses as well as on-site renewable installations.
Strategy Interactions:
- The savings from these strategies are based on planned – not business-as-usual – electricity use. Increasing energy efficiency will decrease the savings from these strategies.
- Renewable energy strategies are limited to meet a maximum of 100% of the community’s energy demand, meaning that excess energy production cannot be used to offset other sources. This does not reflect current practice – in which a household with solar panels could be a net-positive energy prosumer – and may not reflect the community’s approach to carbon accounting.
-It is assumed that the renewable energy strategies occur in addition to electric grid mix changes, rather than counting local renewable energy generation toward system-wide emissions reduction goals. This reflects current practice for green power purchase programs in which the renewable energy credit (REC) is owned by the end customer, but may result in an overestimate of savings when RECs are owned by the utility, which is often the case for community solar projects.
- The savings from renewable energy strategies are based on the planned emissions intensity of the grid, which is specified in the electric grid mix wedge. If the grid mix is less carbon-intensive, the savings from additional renewable energy will be reduced.
- The selected renewable energy strategies are combined with the selected electric grid mix strategy to determine the planned carbon intensity of energy used within the community. This planned carbon intensity is used to calculate savings from the fuel switching strategies. For example, if residents switched from natural gas water heaters to electric water heaters, the resulting electricity use is assigned an emissions factor that accounts for both green power purchase and a cleaner grid.
4.1. On-Site Photovoltaics
Minnesota has a goal of meeting 1.5% of its annual electricity consumption through solar energy by 2020 and 10% by 2030. 50 Building owners may elect to install photovoltaic panels on their roofs to reduce their electricity costs and carbon footprint. The generated electricity can either be used on site, which may require energy storage, or sold back to the grid. This strategy is dependent on the amount of viable rooftop area within the community that receives adequate solar energy. As a state, Minnesota has the technical potential to meet 38.5% of its annual electricity consumption through rooftop photovoltaics. 51
Assumptions:
- By 2030, the city meets 10% of its electricity load through on-site photovoltaics, in line with the Statewide goal. By 2025, it meets 5% of its electricity load through on-site photovoltaics. The interim participation rates are:
- There is 401,690 MWh of rooftop solar resource available within city boundaries, which represents 16% of 2017 city-wide electricity use. 52 This was calculated through a GIS analysis of the Minnesota Solar Suitability App. 53
- After energy efficiency and fuel switching strategies are applied, achieving 10% of citywide electricity from on-site photovoltaics would require a rooftop utilization rate of 57% in 2030, 64% in 2040, and 66% in 2050 The rooftop utilization rate is the percentage of the total viable rooftop solar resource utilized for photovoltaic panels
- To distribute emissions savings between sectors, it is assumed that the ratio of commercial/industrial solar to residential solar is equal to the ratio of commercial/industrial electricity usage to residential electricity usage. This does not impact the overall size of the wedge, but does impact the amount of grid-based electricity remaining in each sector that is eligible for green power purchase.
4.2. Green Power Purchase – Commercial/Industrial
Commercial and industrial customers that purchase electricity from a utility company can participate in voluntary programs that allow them to purchase a portion of their electricity from renewable energy sources In Minnesota, utility green tariff programs and community solar gardens (CSGs) are two options for consumers seeking to purchase renewable electricity 54
Assumptions:
- Programs currently available in the city include WindSource and Renewable Connect. Participation rates in these programs through 2045 are projected based on linear growth from 2015-2018 community-wide participation. Green power purchase is expected to become obsolete when the electricity grid is carbon-free in 2050.
2020 2030 2040 2050
- The sum of carbon-neutral electricity achieved through on-site photovoltaics and green power purchase does not exceed the total planned electricity.
4.3. Green Power Purchase – Residential
Residential customers that purchase electricity from a utility company can participate in voluntary programs that allow them to purchase a portion of their electricity from renewable energy sources. In Minnesota, utility green tariff programs and community solar gardens (CSGs) are two options for consumers seeking to purchase renewable electricity 55
Assumptions:
- Programs currently available in the city include WindSource and Renewable Connect. Participation rates in these programs through 2025 are based on the participation goals from Eden Prairie’s Energy Action Plan. 56 Future years are based on a linear growth in the percentage of subscribed energy based on 2015-2018 community-wide data. Green power purchase is expected to become obsolete when the electricity grid is carbon-free in 2050.
2020 2030 2040 2050
- The sum of carbon-neutral electricity achieved through on-site photovoltaics and green power purchase does not exceed the total planned electricity.
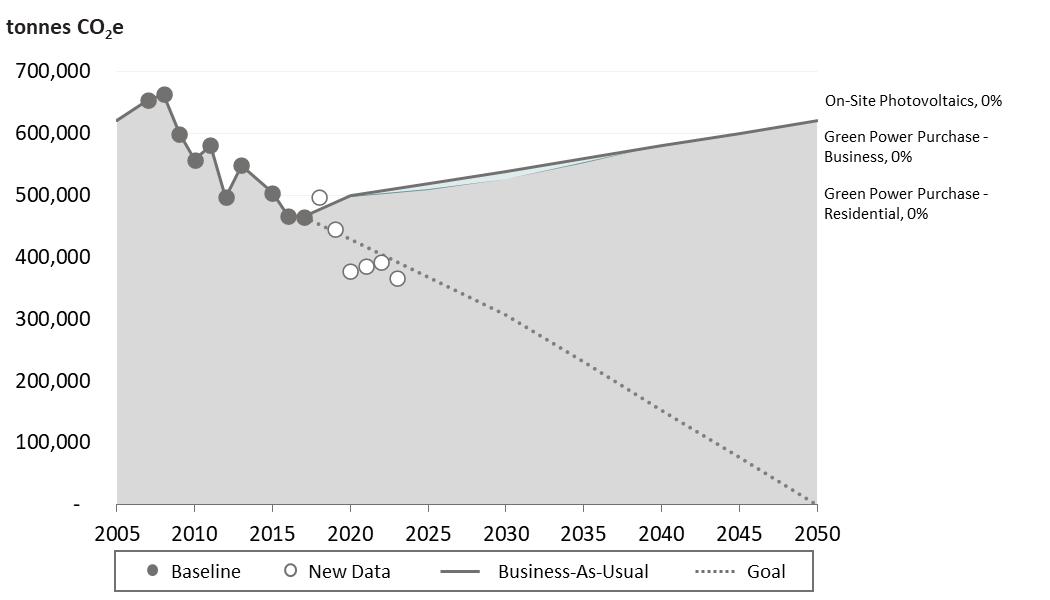
4.4. Total Estimated Renewable Energy Emissions Reduction
Through the strategies of on-site renewable electricity, business green power purchase and residential green power purchase, local renewable energy emission reductions in Eden Prairie would ultimately fall to near zero tonnes of CO2e by 2050. Annual savings of 8,969 tonnes are achieved in earlier years, but by 2050 the electric grid becomes decarbonized. This renders green power purchases obsolete while onsite renewable energy systems become less common. Predicted results for each strategy in the renewable energy category are detailed in Figure 11 – Estimated Renewable Energy Emissions Reduction.
Figure 11 – Estimated Renewable Energy Emissions Reduction
4.5. Renewable Energy Emissions Reduction Actions
Several actions will need to be taken to achieve the desired results outlined in the renewable energy emission reduction strategies. These actions will target local commitments to renewable energy. Recommended actions have been grouped under the categories of encouragement, regulation, incentive or leadership. Details for all recommended actions are listed in Table 5 - Renewable Energy Actions.
Table 5 - Renewable Energy Actions
Encouragement Actions
• Promote participation in Xcel Energy’s renewable energy programs such as Windsource & Renewable*Connect
• Host education sessions on solar energy such as Solar Power Hours
• Provide education on types of green power options
• Publicize financial resources for renewable energy projects on City website
Regulatory Actions
• Require new construction to be “solar ready”
• Adopt a green building policy
• Renewable landfill gas purchase options
Incentive Actions
• Educate, promote and continue offering PACE financing for clean energy projects to interested parties
Leadership Actions
• Develop a community solar garden
• Continue working on City solar projects
• Continue working with programs like Minnesota Brightfields Initiative and SolSmart
• Facilitate landfill solar project in Eden Prairie
5. FUEL SWITCHING – BUILDINGS
With over a fifth of the state’s energy emissions coming from fuel combustion in homes, businesses, and industries, to achieve aggressive greenhouse gas reduction targets these emissions must be addressed. 57 In addition to efficiency strategies to reduce the amount of energy need for space heating, water heating, cooking, and industrial processes, the energy for these needs can be met through less carbonintensive sources. Natural gas is currently less carbon-intensive than electricity in Minnesota. However, as the electricity grid transitions to renewable energy sources, it will become less carbon-intensive than natural gas. This wedge includes strategies that shift from on-site combustion to electricity use.
Strategy Interactions:
- Both efficiency and other decarbonization strategies are applied before fuel switching strategies. The savings from these strategies are based on planned – not business-as-usual – energy use and emissions factors.
- Green power purchase rates are applied to the additional electricity load from fuel switching.
- These strategies account for the on-site efficiency savings inherent in switching from combustion to electricity use, but do not include additional efficiency savings from technologies such as heat pumps, which are typically powered by electricity. Therefore, these strategies should be applied in conjunction with the Energy Efficiency Retrofits strategies to fully account for savings associated with electric heat pump heating systems.
5.1. Commercial/Industrial Electrification
This strategy models the impact of switching from natural gas space and water heating to electric heating systems in commercial buildings. The savings depend on the planned electricity emissions factor; if the electricity emissions factor is higher than the natural gas emissions factor, this strategy will result in added emissions. Since switching from natural gas to electric heating often involves switching
to heat pumps – which are much more efficient than gas-fired boilers – this strategy should be considered in conjunction with the Energy-Efficient Retrofits strategy.
Assumptions:
-The percentage of commercial/industrial buildings served by natural gas for space and water heating that have switched to electricity by the specified year aligns with the “Electrification Futures Study Sensitivity” scenario used in the energy modeling analysis conducted as part of Xcel Energy’s Integrated Resource Planning process for 2020-2034. 58 This analysis uses assumptions derived from the national Electrification Futures Study (EFS) led by the National Renewable Energy Laboratory to “explore the impacts of widespread electrification in all U.S. economic sectors.” 59
- The energy savings rate from switching from natural gas to electric heating is 20%. This is based on a thermal efficiency of 80% for natural gas-fired equipment and 100% for electric. 60 The actual energy savings will vary based on the baseline and replacement technologies (electric heat pumps can achieve efficiencies of over 400%). However, this strategy accounts only for the inherent efficiency differences between on-site combustion and electricity, and not for specific technologies.
- The percentage of natural gas used for space and water heating is 89%, which is average for commercial buildings in the West North Central region of the Midwest. 61
5.2. Residential Electrification
This strategy models the impact of switching from natural gas space and water heating to electric heating systems in residential buildings. The savings depend on the planned electricity emissions factor; if the electricity emissions factor is higher than the natural gas emissions factor, this strategy will result in added emissions. Since switching from natural gas to electric heating often involves switching to heat pumps – which are much more efficient than gas-fired furnaces – this strategy should be considered in conjunction with the Appliance, Equipment, and Fixture strategy.
Assumptions:
- The percentage of residential buildings served by natural gas for space and water heating that have switched to electricity by the specified year aligns with the “Electrification Futures Study Sensitivity” scenario used in the energy modeling analysis conducted as part of Xcel Energy’s Integrated Resource Planning process for 2020-2034. 62 This analysis uses assumptions derived from the national Electrification Futures Study (EFS) led by the National Renewable Energy Laboratory to “explore the impacts of widespread electrification in all U.S. economic sectors.” 63
- The energy savings rate from switching from natural gas to electric heating is 20%. This is based on a thermal efficiency of 80% for natural gas-fired equipment and 100% for electric. 64 The actual energy savings will vary based on the baseline and replacement technologies (electric heat pumps can achieve efficiencies of over 400%). However, this strategy accounts only for the inherent efficiency differences between on-site combustion and electricity, and not for specific technologies
- The percentage of natural gas used for space and water heating is 93%, which is the average for residential buildings in Iowa, Minnesota, North Dakota, and South Dakota. 65
5.3.
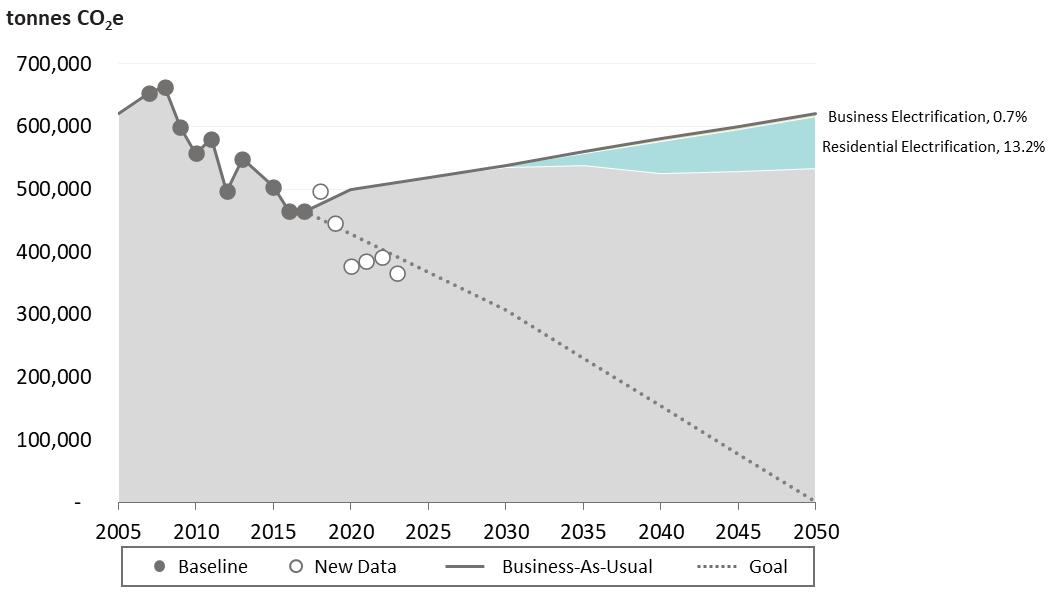
Total Estimated Fuel Switching Emissions Reduction
Through the strategies of business and residential electrification, fuel switching in Eden Prairie could attain an emissions reduction of 86,344 tonnes of CO2e by 2050. This represents 8.6% of all emissions in the Eden Prairie business-as-usual model. Predicted results for each strategy in the fuel switching category are detailed in Figure 12 – Estimated Fuel Switching Emissions Reduction.
12 – Estimated Fuel Switching Emissions Reduction
5.4. Fuel Switching Emissions Reduction Actions
Several actions will need to be taken to achieve the desired results outlined in the fuel switching emission reduction strategies. These actions will target commercial and residential fuel combustion in businesses and homes. Recommended actions have been grouped under the categories of encouragement, regulation, incentive or leadership. Details for all recommended actions are listed in Table 6 - Fuel Switching Actions
Table 6 - Fuel Switching Actions
Encouragement Actions
• Promote building efficiency to reduce up-front costs of electrification Regulatory Actions
• Encourage the revision of the Conservation Improvement Program Planning and Performance Reporting to allow rebates/incentives for fuel switching by the MN Department of Commerce Incentive Actions
• Explore incentives to promote fuel switching
Figure
• Implement strategic electrification in public buildings
6. VEHICLE TRAVEL
Emissions from vehicle travel can be addressed by adjusting transportation behavior to reduce the overall number of vehicle miles traveled (VMT) and by reducing the emissions associated with each mile traveled by upgrading the vehicles on the road.
Strategy Interactions:
- As an efficiency strategy, Mode Shift is applied before the decarbonization strategy of Electric Vehicles.
- The electric vehicles strategy is dependent on Xcel Energy’s Planned Emissions Reduction, but is not assumed to be covered by on-site photovoltaics or green power purchase.
6.1.
Mode Shift
This strategy involves reducing vehicle travel within city boundaries through increased walking, biking, transit ridership, ride-sharing, trip efficiency, and telecommuting. It impacts passenger cars as well as light- and heavy-duty trucks.
Assumptions:
- An 8.6% reduction from the baseline is derived from the estimated regional change in daily VMT per resident by 2040 due to all changes made to the regional transit system. 66 This model assumes additional savings due to the greater-than-average impact of the Southwest Light Rail and SouthWest Transit Prime MD on Eden Prairie (as compared to the region as a whole) in addition to the build-out of the City’s bicycle and pedestrian infrastructure network, rideshare technology further advancing, autonomous vehicle implementation, use of bike/scooter share systems, and telecommuting.
Percent reduction in VMT/capita from 2017:
6.2.
Electric Vehicles
Driving electric rather than gasoline or diesel vehicles can provide significant greenhouse gas emission reductions, with increasing reductions expected in Minnesota as the electricity grid becomes less carbon-intensive. This strategy focuses on electrifying the passenger cars and light- and heavy-trucks that drive within the city.
Assumptions:
- By 2050, all vehicles driving within City boundaries will be electric. This assumes a rapid electrification of the transportation sector that outpaces what would be achieved under current vehicle replacement rates
Percentage of vehicles that drive within City boundaries that are electric by the specified
- For passenger cars the emissions reductions associated with switching from gasoline to electricity is based on an emissions factor of 326.9 g CO2e/mile for gasoline, a 2017 emissions factor of 142.1 g CO2e/mile for electric, and future electric emissions reductions based on Xcel Energy’s planned emissions reductions through 2034 and goalof carbon-free electricity by2050. 67, 68, 69 In accordance with the baseline data calculations, this strategy accounts for emissions from fuel feedstock production and refining, but not vehicle and battery manufacturing.
Emissions reduction from switching from gasoline to electric:
-Emissions reductions for light and heavy trucks switching from gasoline or diesel to electric are assumed to be comparable to passenger cars.
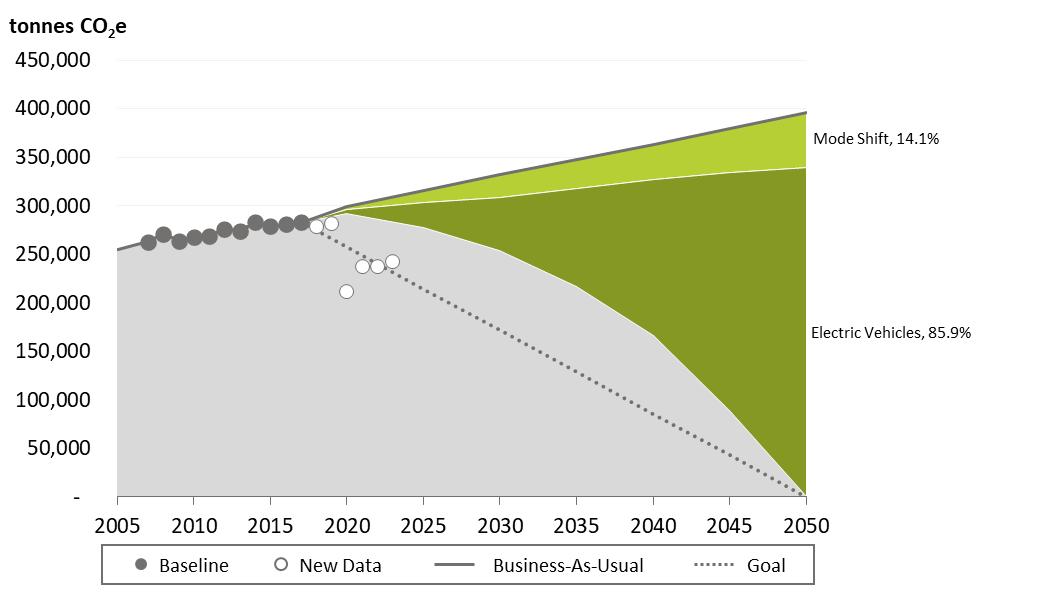
6.3. Total Estimated Travel Emissions Reduction
Through the strategies of mode shift, electric passenger vehicles, electric light trucks, and electric heavy trucks, travel in Eden Prairie could attain an emissions reduction of 387,664 tonnes of CO2e by 2050. This represents 38.6% of all emissions in the Eden Prairie business-as-usual model. Predicted results for each strategy in the travel category are detailed in Figure 13 - Estimated Travel Emissions Reduction
6.4. Travel Emissions Reduction Actions
Several actions will need to be taken to achieve the desired results outlined in the travel emission reduction strategies. These actions will target transportation behaviors to reduce the number of vehicle miles traveled as well as work to upgrade the types of vehicle son the road. Recommended actions have been grouped under the categories of encouragement, regulation, incentive or leadership. Details for all recommended actions are listed in Table 7 - Travel Actions.
Encouragement Actions
• Promote use of light rail transit and development of Transit Oriented Development
• Increase funding to close trail and sidewalk gaps
• Promote Southwest transit bike program and Prime Services
• Encourage ride-share programs
• Participate in National Bike Challenge
• Encourage higher ridership on school bus system
Regulatory Actions
• Require new development/redevelopment to install charging stations or be “EV ready”
• Support clean car rules requiring vehicle manufacturers to offer more electric vehicles for consumers
Table 7 - Travel Actions
• Require more robust transit management demand (TDM) for new office development Incentive Actions
• Reserved priority parking and charging stations for EVs Leadership Actions
• Install EV charging stations at high use City facilities
• Purchase EV police patrol car
• Modernize City facilities for operational EV Fleet
• Replace City Fleet with hybrid or fully electric vehicles
• Implement bike or e-scooter share program
• Purchase electric mowers for City operations
• Build out City trail and bike lane system with connections to neighboring cities and across freeway barriers
• Roundabout preference over signal
• Flashing signals during off-peak times
7. WASTE
Though emissions caused by waste management are only a small percentage of the community’s total emissions, waste reduction and diversion can be a cost-effective strategy that visibly engages the entire community in climate action. In addition to reducing the emissions from waste management, minimizing waste also results in upstream emissions savings by reducing the impacts of harvesting, manufacturing, and transporting goods and food.
General assumptions:
- In accordance with ICLEI’s U.S. Community Protocol, the community’s waste emissions only represent the management of municipal solid waste (e.g. from landfills, resource recovery facilities, etc.). Upstream emissions from harvesting, manufacturing, and transporting goods and foods are intended to be accounted for within the community in which these activities occur.
- Savings from reducing vehicle emissions associated with waste management should be accounted for in the Vehicle Travel Mode Shift strategy.
7.1. Waste Reduction and Diversion
This strategy involves comprehensively reducing emissions from managing municipal solid waste (MSW) generated within city boundaries. This can be achieved through a combination of reducing MSW and using less carbon-intensive management methods (e.g. recycling, composting).
Assumptions:
- By 2050, net-zero emissions are generated from the management of municipal solid waste generated in the city.
Percent reduction from 2017 emissions from the management of municipal solid waste:
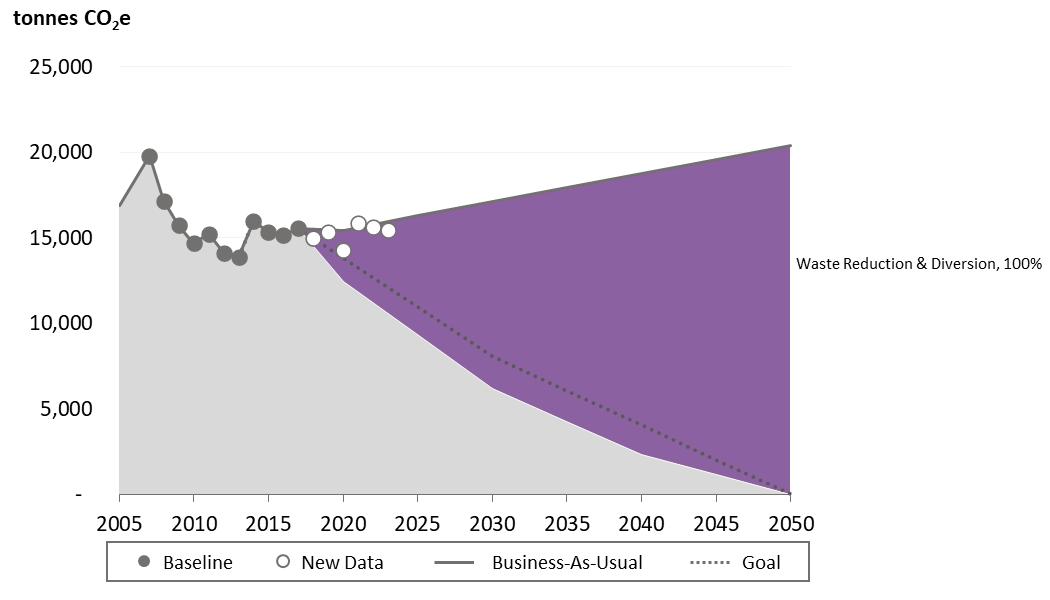
7.2. Total Estimated Waste Emissions Reduction
Through the strategies of reduction and diversion, waste in Eden Prairie could attain an emissions reduction of 21,360 tonnes of CO2e 2050. This represents 2.1% of all emissions in the Eden Prairie business-as-usual model. Predicted results for this strategy are detailed in Figure 14 - Estimated Waste Emissions Reduction.
14 - Estimated Waste Emissions Reduction
7.3. Waste Emissions Reduction Actions
Several actions will need to be taken to achieve the desired results outlined in the waste emission reduction strategies. These actions will target the minimization and diversion of waste Recommended actions have been grouped under the categories of encouragement, regulation, incentive or leadership. Details for all recommended actions are listed in Table 8 - Waste Actions
Table 8 - Waste Actions
Encouragement Actions
• Develop City yard waste compost site
• Be a resource for businesses required to implement back-of-house organics by 2020
• Promote Hennepin County Master Recycler and Composter program
• Provide Hennepin County Fix-it-Clinics
Figure
• Create greater awareness for reuse options
• Create neighborhood Green Teams and Green Team Academy
Regulatory Actions
• Implement curbside residential organics by 2022 and include multifamily
• Review possibility of zero-waste packaging ordinance
• Require events at City rental facilities to be zero-waste
• Require deconstruction versus demolition for redevelopment
• Explore options for decreasing single use plastics (on demand only, charge per use, ban)
Incentive Actions
• None identified Leadership Actions
• Implement zero-waste City events
• Expand City organics to other facilities including Senior Center, Community Center, Water Treatment Plant and Maintenance Facility
• Develop portable water station to replace plastic water bottle sales at City events
SUMMARY
By 2050, Eden Prairie’s community-wide business-as-usual emissions are predicted to total 1,028,901 tonnes of CO2e. These emissions, in order of the largest generating source, will come from travel, commercial/industrial electricity and natural gas usage, residential electricity and natural gas usage, and waste. To achieve a 2050 zero carbon emission goal several strategies have been identified in the categories of commercial/industrial efficiency, residential efficiency, electric grid mix changes, renewable energy, fuel switching in buildings, travel, and waste. Combined, these strategies have the ability to reduce total carbon emissions by over 1,000,000 tonnes.
The strategies that will need to be employed to achieve this reduction include energy code enforcement, net-zero energy buildings, energy-efficient retrofits, behavior change, Xcel Energy’s planned emissions reduction, on-site renewable electricity, green power purchases, at-use fuel switching, travel mode shift, fleet electrification, and waste reduction and diversion. In support of these strategies the City will need to take several actions that encourage, regulate, incentivize, or demonstrative via leadership ways to accomplish significant decarbonization of our community’s energy usage.
Combined, these efforts will require critical partnerships with homeowners, businesses, nonprofit organizations, other regulatory agencies, Xcel Energy, CenterPoint Energy, and the private sector advancement of emerging technologies. Many steps have already been taken which position the City well to be a leader in community-wide carbon reduction, but there will need to be a sustained push to encourage, regulate, incentivize and lead as the plan is implemented over the next 30 years. At key milestones the City will need to evaluate progress in meeting planned emission reduction goals and retool as necessary. It is recommended that the regional indicators presented in this report be collected and compared to planned targets every two years until 2030, then every five years thereafter.
While it is the goal of EP CAP to achieve total communitywide decarbonization by 2050, efforts that work to achieve this goal ahead of 2050 should be sought out and diligently pursued. Furthermore, The City shall make periodic updates to the CAP after communitywide emission data is collected to ensure the 2050 goal is achieved or to accelerate achievement to a more near term date.
APPENDIX
USER INPUTS
Fuel Switching - Buildings
ASSUMPTIONS
EMISSIONS REDUCTION CALCULATIONS
Commercial/Industrial Energy Efficiency
Energy Code Enforcement: Emission Reduction (tCO2e) = BAU New Commercial/Industrial Building Energy Use (MMBtu) x Compliance Rate (% of new building area complying with the energy code) x Energy Savings Rate (%) x BAU Emissions Factor (tCO2e/MMBtu)
Net-Zero Buildings: Emission Reduction (tCO2e) = [BAU New Commercial/Industrial Building Energy Use (MMBtu) x Participation Rate (% of new building area meeting SB 2030 goals) x Energy Emissions Savings Rate (%) - On-Site Renewable Electricity (MMBtu)] x BAU Emissions Factor (tCO2e/MMBtu) + On-Site Renewable Electricity (MMBtu) x Planned Electricity Emissions Factor (tCO2e/MMBtu)
Energy-Efficient Retrofits: Emission Reduction (tCO2e) = Estimated Commercial/Industrial Building Energy Savings from Participation in Utility Conservation Programs (MMBtu) x BAU Emissions Factor (tCO2e/MMBtu)
Efficient Building Operations: Emission Reduction (tCO2e) = BAU Existing Commercial/Industrial Building Energy Use (MMBtu) x Participation Rate (% of existing buildings undergoing efficient building operations) x Energy Savings Rate (%) x BAU Emissions Factor (tCO2e/MMBtu)
Behavior Change: Emission Reduction (tCO2e) = BAU Commercial/Industrial Energy Use (MMBtu) x Participation Rate (% of businesses participating in behavior change program) x Energy Savings Rate (%) x BAU Emissions Factor (tCO2e/MMBtu)
Residential Energy Efficiency
Energy Code Enforcement: Emission Reduction (tCO2e) = BAU New Residential Building Energy Use (MMBtu) x Compliance Rate (% of new building area complying with the energy code) x Energy Savings Rate (%) x BAU Emissions Factor (tCO2e/MMBtu)
Net-Zero Buildings: Emission Reduction (tCO2e) = [BAU New Residential Building Energy Use (MMBtu) x Participation Rate (% of new building area meeting SB 2030 goals) x Energy Emissions Savings Rate (%) - On-Site Renewable Electricity (MMBtu)] x BAU Emissions Factor (tCO2e/MMBtu) + On-Site Renewable Electricity (MMBtu) x Planned Electricity Emissions Factor (tCO2e/MMBtu)
Energy-Efficient Retrofit: Emission Reduction (tCO2e) = Estimated Residential Building Energy Savings from Participation in Utility Conservation Programs (MMBtu) x BAU Emissions Factor (tCO2e/MMBtu)
Behavior Change: Emission Reduction (tCO2e) = BAU Residential Energy Use (MMBtu) x Participation Rate (% of households participating in behavior change program) x Energy Savings Rate (%) x BAU Emissions Factor (tCO2e/MMBtu)
Xcel Energy’s Planned Emissions Reduction: Emission Reduction (tCO2e) = Planned Electricity Use (MMBtu) x Difference between BAU Electricity Emissions Factor and Planned Portfolio Mix Emissions Factor (tCO2e/MMBtu)
Renewable Energy
On-Site Photovoltaics: Emission Reduction (tCO2e) = Total Electricity (MWh) x Percentage of Electricity Load met by On-Site Photovoltaics (%) x Planned Emissions Factor (tCO2e/MMBtu)
Green Power Purchase – Commercial/Industrial: Emission Reduction (tCO2e) = Planned Commercial/Industrial Electricity Use (MMBtu) x Participation Rate (% of commercial/industrial electricity loads met through green power purchase) x Planned Electricity Emissions Factor (tCO2e/MMBtu)
Green Power Purchase – Residential: Emission Reduction (tCO2e) = Planned Residential Electricity Use (MMBtu) x Participation Rate (% of residential electricity loads met through green power purchase) x Planned Electricity Emissions Factor (tCO2e/MMBtu)
Fuel Switching
Commercial/Industrial Electrification: Emission Reduction (tCO2e) = Commercial/Industrial Natural Gas Reduction (MMBtu) x Planned Natural Gas Emissions Factor (tCO2e/MMBtu)Commercial/Industrial Electricity Use Increase (MMBtu) x Planned Electricity Emissions Factor (tCO2e/MMBtu)
Commercial/Industrial Natural Gas Reduction (MMBtu) = Planned Commercial/Industrial Natural Gas Use (MMBtu) x Percentage of Commercial/Industrial Natural Gas Used for Space and Water Heating x Participation Rate (% of commercial/industrial buildings served by natural gas that have switched to electricity)
Commercial/Industrial Electricity Use Increase (MMBtu) = Commercial/Industrial Natural Gas Reduction (MMBtu) x [1 - Energy Savings Rate (% savings from fuel switching)]
Residential Electrification: Emission Reduction (tCO2e) = Residential Natural Gas Reduction (MMBtu) x Planned Natural Gas Emissions Factor (tCO2e/MMBtu) - Residential Electricity Use Increase (MMBtu) x Planned Electricity Emissions Factor (tCO2e/MMBtu)
Residential Natural Gas Reduction (MMBtu) = Planned Residential Natural Gas Use (MMBtu) x Percentage of Residential Natural Gas Used for Space and Water Heating x Participation Rate (% of residential buildings served by natural gas that switch to electricity)
Residential Electricity Use Increase (MMBtu) = Residential Natural Gas Reduction (MMBtu) x [1Energy Savings Rate (% savings from fuel switching)]
Vehicle Travel
Mode Shift: Emission Reduction (tCO2e) = Baseline Vehicle Travel per Capita (VMT/capita) x Reduction from Baseline VMT per capita (%) x Forecasted Population (capita) x BAU Emissions Factor (tCO2e/VMT)
Electric Vehicles: Emission Reduction (tCO2e) = Planned Vehicle Travel (VMT) x Participation Rate (% of vehicles that are electric) x Emissions Rate Savings (%) x BAU Emissions Factor (tCO2e/VMT)
Participation Rate (% of vehicles that are electric) = New Vehicle Purchase Rate (%) x Percentage of New Vehicle Purchases that are Electric (%)
Waste
Waste Reduction and Diversion: Emission Reduction (tCO2e) = Baseline Waste Emissions (tCO2e) x Reduction from Baseline Waste Emissions (%)
BIBLIOGRAPHY
Argonne National Laboratory. “GREET Life Cycle Model,” n.d. https://greet.es.anl.gov/.
Campbell, Iain, and Koben Calhoun. “Old Buildings Are U.S. Cities’ Biggest Sustainability Challenge.” Harvard Business Review, 2016.
Construction, McGraw-Hill. Smart Market Report: Business Case for Energy Efficient Building Retrofit and Renovation, 2011.
“Corporate Average Fuel Economy.” Wikipedia. Accessed June 1, 2017. https://en.wikipedia.org/wiki/Corporate_Average_Fuel_Economy.
Frankel, Mark, Morgan Heater, and Jonathan Heller. “Sensitivity Analysis: Relative Impact of Design, Commissioning, Maintenance and Operational Variables on the Energy Performance of Office Buildings.” ACEEE Summer Study on Energy Efficiency in Buildings, August 12-17, 2012, 52–64. https://newbuildings.org/wp-content/uploads/2015/11/SensitivityAnalysis_ACEEE20122.pdf
Gagnon, Pieter, Robert Margolis, Jennifer Melius, Caleb Phillips, and Ryan Elmore. “Rooftop Solar Photovolatic Technical Potential in the United States: A Detailed Assessment,” 2016.
Google. “Project Sunroof.” Accessed June 1, 2017. https://www.google.com/get/sunroof/dataexplorer/place/ChIJIw_zeAAg9ocRNCg_O27jJ1Y/ .
ICLEI - Local Governments for Sustainability USA. “U.S. Community Protocol for Accounting and Reporting of Greenhouse Gas Emissions Version 1.1,” no. July (2013): 1–67. doi:www.icleiusa.org/tools/ghg-protocol/community-protocol/us-community-protocol-foraccounting-and-reporting-of-greenhouse-gas-emissions.
Lowenberger, Amanda, Joanna Mauer, Marianne Dimascio, Jennifer Amann, and Steven Nadel. “The Efficiency Boom: Cashing In on the Savings from Appliance Standards” 20045, no. 202 (2012): 1–87. Mauer, Joanna. “Energy-Saving States of America : How Every State Benefits from National Appliance Standards.” Appliance Standards Awareness Project and American Council for an Energy-Efficient Economy, no. February (2017).
McFarlane, Dane. “Analysis: Electric Vehicles Provide Even Greater GHG Reductions in 2017 and Beyond for the Upper Midwest.” Great Plains Institute Blog, 2017. http://www.betterenergy.org/blog/update-electric-vehicles-provide-even-greater-ghgsreductions-2017-and-beyond.
Minnesota Department of Labor & Industry Construction Codes and Licensing Division. “Energy Code Compliance in Minnesota Baseline for ARRA Compliance,” no. September (2013). http://bcapcodes.org/wp-content/uploads/2015/12/Energy-Code-Compliance-in-Minnesota-20122013-Baseline-for-ARRA-Compliance.pdf.
National Renewable Energy Laboratory. “Transportation Summary for St. Louis Park, Minnesota 55426.” State and Local Energy Data. Accessed June 1, 2017. https://apps1.eere.energy.gov/sled/#/. O’Shaughnessy, Eric, Jenny Heeter, David Keyser, and Pieter Gagnon. “Estimating the National Carbon Abatement Potential of City Policies : A Data- Driven Approach,” 2016.
Randall, Tom. “The Electric-Car Boom Is so Real Even Oil Companies Say It’s Coming.” Bloomberg New Energy Finance, 2017. https://www.bloomberg.com/news/articles/2017-04-25/electric-car-boomseen-triggering-peak-oil-demand-in-2030s.
Shaughnessy, Eric O ’, Chang Liu, and Jenny Heeter. “Status and Trends in the U.S. Voluntary Green Power Market (2015 Data),” 2015.
Stevens, Matthew. “How Long Does It Take for 50% of Cars to Comply with a New Law?” FleetCarma Blog, December 2015. http://www.fleetcarma.com/cars-new-law-timeline/.
Sussman, Reuven, and Maxine Chikumbo. “Behavior Change Programs: Status and Impact.” ACEEE Report, no. October (2016).
Torcellini, Paul. “Zero Energy.” U.S. Department of Energy: Energy Efficiency& Renewable Energy, 2017. U.S. DOE. “Quadrennial Technology Review: An Assessment of Energy Technologies and Research Opportunities,” no. September (2015): 1–505.
“Saving Energy and Money with Appliance and Equipment Standards in the United States,” 2017. https://energy.gov/sites/prod/files/2017/01/f34/Appliance and Equipment Standards Fact Sheet011917_0.pdf.
U.S. EIA. “Table CE4.3. Household Site End-Use Consumption by Fuel in the Midwest Region, Totals, 2009 (RECS),” 2013. https://www.eia.gov/consumption/residential/data/2009/index.php?view=consumption#end-useby-fuel.
. “Table E5. Electricity Consumption (kWh) by End Use, 2012 (CBECS),” 2016. https://www.eia.gov/consumption/commercial/data/2012/c&e/pdf/e5.pdf.
. “Table E7 . Natural Gas Consumption and Conditional Energy Intensities (Btu) by End Use, 2012 (CBECS),” 2016. https://www.eia.gov/consumption/commercial/data/2012/c&e/pdf/e7.pdf.
U.S. EPA. “ENERGY STAR Qualified Appliances,” 2016. https://www.energystar.gov/ia/new_homes/features/Appliances_062906.pdf.
University of Minnesota. “Minnesota Solar Suitability Analysis: Methods,” n.d. Williams, Jeremy. “Presentation Overview : Introduction Statutory Requirements Program Structure Recent Accomplishments.” U.S. Department of Energy, 2014.
York, Dan, Maggie Molina, Max Neubauer, Seth Nowak, Steven Nadel, Anna Chittum, Neal Elliott, et al. “Frontiers of Energy Efficiency: Next Generation Programs Reach for High Energy Savings,” no. January (2013): 262.
Zhang, J, R Athalye, R Hart, M Rosenberg, Y Xie, S Goel, V Mendon, and B Liu. “Energy and Energy Cost Savings Analysis of the IECC for Commercial Buildings.” Pacific Northwest National Laboratory, no. August (2013): 1–87.
1 United States Environmental Protection Agency, “Emissions & Generation Resource Integrated Database (eGRID),” https://www.epa.gov/energy/emissions-generation-resource-integrated -database-egrid.
2 Minnesota Department of Transportation, “Roadway Data,” “VMT by Route System in each City, within each County,” https://www.dot.state.mn.us/roadway/data/
3 More information on the demographic forecast methodology can be found at Metropolitan Council, “Council Forecasts,” n.d., https://metrocouncil.org/Data-and-Maps/Data/CouncilResearchProducts/Council-Forecasts.aspx.
4 City of Eden Prairie, “Aspire Eden Prairie 2040,” Guided Land Uses Change table, page 56, May 3, 2019 draft.
5 City of Eden Prairie City Code, Table 3 - Section 11.03, Ordinance No. 17-2017, Effective Date: September 28, 2017.
6 Forecasted growth in the number of households in the City is estimated by the Metropolitan Council, shown in the table above.
7 The City’s 2016 housing vacancy rate is 4.2%, per the 2016 Housing Unit Type table, City of Eden Prairie, “Aspire Eden Prairie 2040,” page 52, May 3, 2019 draft.
8 City of Eden Prairie, “Aspire Eden Prairie 2040,” Guided Land Uses Change table, page 56, May 3, 2019 draft.
9 Minimum density (housing units/acre) from the Development and Redevelopment table, City of Eden Prairie, “Aspire Eden Prairie 2040,” page 58, May 3, 2019 draft.
10 The average size of existing housing units in Eden Prairie is 2,206sf. This was provided by the City of Eden Prairie’s Assessing Department and includes all housing types within the City: condos, townhomes, single-family, cooperatives, and apartments.
11 The average size of new single-family homes in Eden Prairie is 3,989sf. This was provided by the City of Eden Prairie’s Assessing Department and represents the average size of new single-family construction between 2016 and 2018.
12 The average size of new high-density housing units in Eden Prairie is 1,147sf. This was provided by the City of Eden Prairie’s Assessing Department and represents the average size of two new high -density projects in the city –one senior living and one apartment building.
13 ICLEI - Local Governments for Sustainability USA, “U.S. Community Protocol for Accounting and Reporting of Greenhouse Gas Emissions Version 1.1,” no. July (2013): 1–67, Table G.1 and G.3, doi:www.icleiusa.org/tools/ghgprotocol/community-protocol/us-community-protocol-for-accounting-and-reporting-of-greenhouse-gasemissions.
14 Minnesota Department of Labor & Industry Construction Codes and Licensing Division, “Energy Code Compliance in Minnesota Baseline for ARRA Compliance,” no. September (2013), http://bcapcodes.org/wpcontent/uploads/2015/12/Energy-Code-Compliance-in-Minnesota-2012-2013-Baseline-for-ARRA-Compliance.pdf.
15 J Zhang et al., “Energy and Energy Cost Savings Analysis of the IECC for Commercial Buildings,” Pacific Northwest National Laboratory, no. August (2013): 1–87.
16 Zhang et al., “Energy and Energy Cost Savings Analysis of the IECC for Commercial Buildings,” Table C.3. ASHRAE 90.1-2010 is one compliance pathway in IECC 2012. Energy savings from ASHRAE 90.1-2010 are within 10% of the alternative pathway – a set of requirements specific to IECC 2012.
17 Eric O’Shaughnessy et al., “Estimating the National Carbon Abatement Potential of City Policies: A Data-Driven Approach,” 2016.
18 Ibid. Based on discussions with Minnesota agency staff, the CSEO analysis estimates the contribution of different technologies toward achieving net-zero energy in 2030. Energy efficiency is estimated to comprise 78% of the required commercial electricity savings and 90.9% of the required commercial natural gas savings. Since commercial buildings typically use relatively equal amounts of electricity and natural gas, an unweighted average is used to estimate the total energy savings achievable through efficiency.
19 Xcel Energy, “An Energy Action Plan for Eden Prairie,” September 13, 2017.
20 Annual savings from participation in Xcel Energy’s conservation programs were calculated out to 2050 by the Center for Energy and Environment and provided through e-mail correspondence with LHB. These calculations reflect the savings from program participation within the specified year; to calculate the total savings these numbers are adjusted to account for the ongoing savings expected from past program participation.
21 York et al., “Frontiers of Energy Efficiency: Next Generation Programs Reach for High Energy Savings.”
22 Mark Frankel, Morgan Heater, and Jonathan Heller, “Sensitivity Analysis: Relative Impact of Design, Commissioning, Maintenance and Operational Variables on the Energy Performance of Office Buildings,” ACEEE Summer Study on Energy Efficiency in Buildings, August 12-17, 2012, 52–64, https://newbuildings.org/wpcontent/uploads/2015/11/SensitivityAnalysis_ACEEE20122.pdf.
23 N Fernandez et al., “Impacts of Commercial Building Controls on Energy Savings and Peak Load Reduction,” 2017, http://buildingretuning.pnnl.gov/publications/PNNL-25985.pdf. The cited range of savings reflects seven of the nine commercial building types studied, excluding secondary schools (49%) and stand-alone retail/dealership (41%).
24 York et al., “Frontiers of Energy Efficiency: Next Generation Programs Reach for High Energy Savings.”
25 Reuven Sussman and Maxine Chikumbo, “Behavior Change Programs: Status and Impact,” ACEEE Report, no. October (2016).
26 Ibid.
Eden Prairie Climate Action Plan 2020
27 Ibid.
28 Ibid.
29 Ibid.
30 Heidi Ochsner, Alden Jones, and Rita Siong, “Persistence of Behavioral Energy Management Activities and Savings in Commercial Office Buildings,” in Behavior, Energy & Climate Change Conference (Washington, 2014), doi:10.5811/westjem.2011.5.6700.
31 Peter Therkelsen and Prakash Rao, “Organizational Change in Industry Through Strategic Energy Management : Results and Barriers to Success,” in Behavior, Energy & Climate Change Conference (Sacramento, 2015).
32 Minnesota Department of Labor & Industry Construction Codes and Licensing Division, “Energy Code Compliance in Minnesota Baseline for ARRA Compliance.”
33 Jeremy Williams, “Presentation Overview : Introduction Statutory Requirements Program Structure Recent Accomplishments” (U.S. Department of Energy, 2014).
34 ASHRAE 90.1-2010 is one compliance pathway in IECC 2012. Energy savings from ASHRAE 90.1-2010 are within 10% of the alternative pathway – a set of requirements specific to IECC 2012. Zhang et al., “Energy and Energy Cost Savings Analysis of the IECC for Commercial Buildings,” Table C.3.
35 Ibid. Based on discussions with Minnesota agency staff, the CSEO analysis estimates the contribution of different technologies toward achieving net-zero energy in 2030. Energy efficiency is estimated to comprise 78.5-79.5% of the required residential electricity savings and 76.5-85.2% of the required residential natural gas savings.
36 Xcel Energy, “An Energy Action Plan for Eden Prairie,” September 13, 2017.
37 Annual savings from participation in utility conservation programs were calculated out to 2050 by the Center for Energy and Environment and provided through e-mail correspondence with LHB. These calculations reflect the savings from program participation within the specified year; to calculate the total savings these numbers are adjusted to account for the ongoing savings expected from past program participation.
38 Sussman and Chikumbo, “Behavior Change Programs: Status and Impact.”
39 Ibid.
40 Ibid.
41 Ibid.
42 Ibid.
43 Ibid.
44 Ibid.
45 Ibid.
46 A study has shown that suspending a home energy report program after two years of ongoing participation resulted in energy savings declining at a rate of 20% per year for two years. This gradual decline is not reflected in this tool. Ibid.
47 Every two years, electric utilities submit IRPs to the Public Utilities Commission that for the next 15 years, indicating the resource options they might use to meet the service needs of their customers.
48 Xcel Energy, “Information Request CEO No. 9,” Minnesota Department of Commerce Docket No. E002/RP-19368, July 22, 2019.
49 Xcel Energy, “Building a Carbon-free Future,” 2019.
50 State of Minnesota, “M.S. 216B.1692” (2016).
Eden Prairie Climate Action Plan 2020
51 Pieter Gagnon et al., “Rooftop Solar Photovolatic Technical Potential in the United States: A Detailed Assessment,” 2016.
52 City of Eden Prairie, “Aspire Eden Prairie 2040,” May 3, 2019 draft.
53 University of Minnesota, “Minnesota Solar Suitability Analysis: Methods,” n.d.
54 Eric O’ Shaughnessy, Chang Liu, and Jenny Heeter, “Status and Trends in the U.S. Voluntary Green Power Market (2015 Data),” 2015.
55 Shaughnessy, Liu, and Heeter, “Status and Trends in the U.S. Voluntary Green Power Market (2015 Data).”
56 Xcel Energy, “An Energy Action Plan for Eden Prairie,” September 13, 2017.
57 Claflin, “Greenhouse Gas Emissions: 1990-2014.”
58 E3, “MN PATHWAYS Assumptions,” submitted by Xcel Energy to Minnesota Department of Commerce Docket No. E002/RP-15-21, Document ID: 201811-147866-02, last updated October 23, 2018. The electric equipment adoption rates used in the “EFS Sensitivity Scenario” are higher than the “Reference Scenario” and lower than the “High Electrification Scenario.” However, Xcel notes that these are “aspirational scenarios” and “do not represent Xcel Energy’s viewpoint of what is likely to occur in our Upper Midwest service territories during the planning period of this resource plan.”
59 National Renewable Energy Laboratory, “Electrification Futures Study,” accessed October 3, 2019. https://www.nrel.gov/analysis/electrification-futures.html.
60 Code of Federal Regulations, Energy Efficiency Program for Certain Commercial and Industrial Equipment, title 10, sec. 431.87.
61 U.S. EIA, “Table E7 . Natural Gas Consumption and Conditional Energy Intensities (Btu) by End Use, 2012 (CBECS).” Space heating accounts for 76.5% and water heating accounts for 12.8% of total natural gas consumption.
62 E3, “MN PATHWAYS Assumptions,” submitted by Xcel Energy to Minnesota Department of Commerce Docket No. E002/RP-15-21, Document ID: 201811-147866-02, last updated October 23, 2018. The electric equipment adoption rates used in the “EFS Sensitivity Scenario” are higher than the “Reference Scenario” and lower than the “High Electrification Scenario.” However, Xcel notes that these are “aspirational scenarios” and “do not represent Xcel Energy’s viewpoint of what is likely to occur in our Upper Midwest service territories during the planning period of this resource plan.”
63 National Renewable Energy Laboratory, “Electrification Futures Study,” accessed October 3, 2019. https://www.nrel.gov/analysis/electrification-futures.html
64 Code of Federal Regulations, Energy Efficiency Program for Certain Commercial and Industrial Equipment, title 10, sec. 431.87.
65 U.S. EIA, “Table E7 . Natural Gas Consumption and Conditional Energy Intensities (Btu) by End Use, 2012 (CBECS).” Space heating accounts for 71.8% and water heating accounts for 21.4% of residential natural gas consumption.
66 USDOT, FTA, Metropolitan Council, “Southwest Light Rail Transit Final Environmental Impact Statement, May 2016
67 Gasoline emissions factor based on 2017 data from the Regional Indicators Initiative
68 Dane McFarlane, “Analysis: Electric Vehicles Provide Even Greater GHG Reductions in 2017 and Beyond for the Upper Midwest,” Great Plains Institute Blog, 2017, http://www.betterenergy.org/blog/update-electric-vehiclesprovide-even-greater-ghgs-reductions-2017-and-beyond.
69 Xcel Energy, “Information Request CEO No. 9,” Minnesota Department of Commerce Docket No. E002/RP-19368, July 22, 2019.