
Tourism Monitor 2022

Authored by: Jo Mackellar
13 April 2023
Disclaimer and Copyright
The report has been compiled by researchers from Destination Research. The visitation statistics contained this report are based on the sample data collected by Tourism Research Australia (TRA 2021 unpublished data) and therefore provide an indication of visitor trends rather than actual performance measures. The information presented in this report is accurate at the time of printing. Whilst all care is taken to ensure its accuracy, no liability is accepted for loss or damage as a result of its content. Findings and recommendations are based on the data of the current study; further research may be required in some areas to validate the findings of this study. Enquiries should be directed to the Research Manager, destination.research@yahoo.com
© All content is the property of Coffs Harbour City Council and may not be reproduced without permission.
2

Pg.3
Introduction .................................................................................................................. ...................... 5 Key Performance Indicators .................................................................................................... ................ 6 Coffs Harbour Visitor Profile (2022).......................................................................................... .............. 7 Total visitation .............................................................................................................. .................. 7 Domestic overnight visitors ................................................................................................... ......... 7 Domestic day visitors ......................................................................................................... ............. 7 International markets ......................................................................................................... ............ 7 Domestic Overnight Visitors ................................................................................................... ................ 8 Visitor Expenditure (DON) ..................................................................................................... ............. 8 Visitor Residence (DON)....................................................................................................... ............... 9 Reason for Visit (DON) ........................................................................................................ .............. 10 Accommodation (DON) ........................................................................................................... .......... 10 Age and lifecycle (DON) ....................................................................................................... ............. 11 Lifecycle/travel party (DON) .................................................................................................. ........... 11 Activities (DON) .............................................................................................................. ................... 12 Transport (DON) ............................................................................................................... ................. 13 Main destination (DON) ........................................................................................................ ............ 13 Domestic Day Visitors ......................................................................................................... .................. 14 Visitor Expenditure (DDV) ..................................................................................................... ............ 14 Visitor Residence (DDV) ....................................................................................................... ............. 15 Reason for Visit (DDV) ........................................................................................................ ............... 15 Age and lifecycle (DDV) ....................................................................................................... .............. 16 Transport (DDV) ............................................................................................................... ................. 16 Activities (DDV) .............................................................................................................. ................... 17 International Visitors ........................................................................................................ .................... 18 Visitor Residence (INT) ....................................................................................................... ............... 18 Traveller Type (INT) .......................................................................................................... ................. 18 Comparisons to other regions - 2017-2022 ...................................................................................... .... 19 Appendix 1 .................................................................................................................... ........................ 20 Methodology................................................................................................................... .................. 20
TABLE OF CONTENTS
4
Table 1: Performance Indicators ............................................................................................... .............. 6 Table 2: Visitor Summary: Calendar year 2022.................................................................................. ..... 7 Table 3: Domestic Overnight visitors (2018-2022) .............................................................................. ... 8 Table 4: Visitor Residence: 5 year average AND 2022 ........................................................................... . 9 Table 5: Accommodation of domestic overnight visitors ..................................................................... 10 Table 6: Transport ........................................................................................................... ..................... 13 Table 7: Key destination in the LGA .......................................................................................... ........... 13 Table 8: Domestic Day Visitors: Summary ....................................................................................... ..... 14 Table 9: Domestic Day Visitors: Residence ..................................................................................... ...... 15 Table 10: International Visitors: Summary ..................................................................................... ...... 18 Table 11: Comparison regions 2022 ............................................................................................. ........ 19 Figure 1: Domestic Overnight: Visitors and Nights 2010 to 2022 ........................................................... 8 Figure 2: Region of residence of domestic overnight visitors................................................................. 9 Figure 3: reason for visit .................................................................................................... ................... 10 Figure 4: Generation groups of domestic overnight visitors (2018-2022) ........................................... 11 Figure 5: Domestic Overnight: Lifecycle (5YR Average to 2022) .......................................................... 11 Figure 6: Domestic Overnight: Activities..................................................................................... ......... 12 Figure 7: Domestic Overnight: Nature Activities ............................................................................... ... 12 Figure 8: Domestic Overnight: Nature Activities ............................................................................... ... 12 Figure 9: Domestic Day Visitors: 2013 – 2022 .................................................................................. .... 14 Figure 10: Domestic Day Visitors: Top domestic day markets............................................................. 15 Figure 11: Domestic Day Visitors: Reason ...................................................................................... ...... 15 Figure 12: Generation groups of domestic day visitors (2017-2022) ................................................... 16 Figure 13: Lifecycle Segments ................................................................................................. .............. 16 Figure 14: Domestic Day Visitors: Activities................................................................................. ........ 17 Figure 15: Day visitor: Nature activities ..................................................................................... ........... 17
Tables and Figures
Introduction
The purpose of this report is to analyse visitor data provided by Tourism Research Australia (TRA) regarding domestic and international visitors. The report assesses data relevant to the Coffs Harbour destination across the following variables:
• Visitor numbers
• Visitor nights and average length of stay
• Purpose of trip
• Age groups
• Source markets
• Key activities
• Accommodation
• Life cycle groups
• Transport and/or place of arrival
• Travel party type (package, backpackers).
TRA conducts statistically reliable surveys of domestic travellers over the phone asking for details of travel undertaken throughout Australia and asking for the destination and activities of travellers. This provides a pattern of where visitors are travelling and how much that travel is worth to the economy. The data is reported quarterly; however, it is not released to the industry until a few months later. In a separate survey, international travellers are surveyed at airports and cruise terminals to discover their visitation patterns while they are in Australia.
However, the TRA data has known issues particularly when analysing smaller segments of visitors coming to regional areas - where the sample size is small the results can be unreliable. For example, the numbers of international heritage tourists in Coffs Harbour are a tiny percentage of all international tourists to Australia and is therefore hard to accurately capture in a large survey.
The research is therefore considered an indication of visitor trends rather than actual performance measures.
Despite the slight variations in smaller segments of data the TRA data is the most reliable source of visitor data available, showing historical data over the past 10 years. The best indicator of the reliability of TRA data is the consistency of the results over time. As shown in this report, the ratios of tourists, their activities and accommodation etc remains fairly constant over both five and ten year timeframes. It is important however to seek further research into specific market segments before basing planning, development or investment decisions on TRA data alone.
Further information on the methodology used can be found in Appendix 1 and TRA: https://www.tra.gov.au/Domestic/national-visitor-survey-methodology
Pg.5
Key Performance Indicators
Review of the key visitor markets for the past five years demonstrates a rebound from the impact of COVID-19 lockdowns and travel restrictions to the Coffs Harbour LGA. Visitation in 2022 has shown;
• an increase of 4% in total visitation from decreases in 2020 and 2021.
• a strong increase in overnight visitors of 20% in 2022, recovering from the 26% decrease in 2020.
• a further decrease in day visitors of 11% in 2022, after the decreases in 2020 and 2021.
• International travel data has not been recorded by TRA since March 2020. Prior to that time the area was averaging 89,000 international visitors per year.
Over the past 5 years there has been an average of 0.3% increase in total domestic visitation. As shown in the chart below, the volume of overnight visitors has overtaken day visitors, which continue to show a downward trend.

6
Year-end Dec '000 2018 2019 2020 2021 2022 5-year average Domestic overnight visitors 971 1,062 786 774 928 905 % change 17% 9% -26% -2% 20% 3% Domestic nights 3,061 3,554 2,975 2,763 3,420 3,155 % change 7% 16% -16% -7% 24% 5% av night stay 3.2 3.3 3.8 3.6 3.7 3.5 Domestic day visitors 915 954 933 880 787 894 % change -2% 4% -2% -6% -11% -3% International visitors 95 104 17 % change 7% 9% -84% Total visitors 1,981 2,120 1,736 1,654 1,715 1,841 % change 7% 7% -18% -5% 4% -1% Total nights 3,904 4,703 3,226 2,763 3,420 3,603 % change 7% 20% -31% -14% 24% -5%
TABLE 1: PERFORMANCE INDICATORS
DOMESTIC VISITORS ONLY Year-end Dec '000 2018 2019 2020 2021 2022 5-year average overnight visitors 971 1,062 786 774 928 905 day visitors 915 954 933 880 787 894 total domestic visitors 1886 2016 1719 1654 1715 1,799 % change 7% 7% -15% -4% 4% 0.3%
National Visitor Survey & International Visitor Survey, Tourism Research Australia
Source:
Coffs Harbour Visitor Profile (2022)
The following is a brief profile of visitors to Coffs Harbour for the 2022 calendar year. Further analysis of the key markets is found in the sections following.
Total visitation
o 1.71 million total visitors; a 4% increase on the previous year
o 3.4 million visitor nights
o Day visitors comprise 46%, overnight 54% and international 0%.
Domestic overnight visitors
o 928,000 domestic overnight visitors for 3.4 million nights.
o Lifecycle segments include families (30%) and retired persons (31%).
o Key activities include social activities (42%) and outdoor nature activities (27%).
o Key markets Sydney (29%), North Coast (11%) and Brisbane (9%).
Domestic day visitors
o 787,000 domestic day trips.
o Lifecycle segments include older retired persons (39%) and families (35%).
o Key activities include social activities (42%) and outdoor/nature activities (28%).
o Key markets are North Coast (84%), Sydney (3%), New England (3%)
International markets
o International markets provided 0 visitors this year due to international border restrictions.
Pg.7
Domestic overnight Domestic day trip Total Visitors 928,000 787,000 1,715,000 Nights 3,420,000 ^ 3,420,000 Av night stay 3.7 ^ Lifecycle Families with children (30%) Older retired persons (31%) Older retired couples (39%) Families with children (35%) Activities 1. Social (dining, VFR) 2. Outdoor/nature 3. Active sports 1. Social (dining, VFR) 2. Outdoor/nature 3. Active sports Source markets Sydney (29%) North Coast (11%) Brisbane (9%) North Coast (84%) Sydney (3%) New England (3%)
TABLE 2: VISITOR SUMMARY: CALENDAR YEAR 2022
previous year
on
Domestic Overnight Visitors
In 2022, there was an estimated 928,000 domestic overnight visitors to the Coffs Harbour LGA showing a strong rebound from the impact of Covid 19 with a 20% increase on the previous year. The results for Coffs Harbour show a similar trend to NSW Regional areas reported by TRA where the number of domestic overnight trips to NSW regional areas has rebounded by 33% in 20221.

The number of nights increased to 3.4 million, - just under the high in 2019 of 3.5 million.
The average night stay was high at 3.7 nights, comparable to the North Coast average of 3.8.
When viewed over the previous 10 years, the variations between years can be seen, with this year improving strongly. The trendline also shows positive growth over that time of 2.2%, pointing to an overall positive growth with further recovery.
Visitor Expenditure (DON)
Visitor expenditure in individual LGAs is estimated by TRA using a four-year average. The statistics for 2019 suggest overnight visitors to Coffs Harbour spend an average of $168 per night and $531 per trip3. While there is no current data available for the LGA, expenditure in the North Coast region increased 18% from $163 per night in 20194 to $218 per night in 20221. A similar rise would be expected in the Coffs LGA when the data becomes available.
1 www.tra.gov.au/data-and-research/reports/national-visitor-survey-results/national-visitor-survey-results.

8
'000 2018 2019 2020 2021 2022 5-year average # of visitors 971 1,062 786 774 928 905 % change on yr 17% 9% -26% -2% 20% 3% Nights 3,061 3,554 2,975 2,763 3,420 3,155 % change on yr 7% 16% -16% -7% 24% 5% Av night 3.2 3.3 3.8 3.6 3.7 3.5 Sample 373 438 321 327 273 364 Spend per trip $531 Spend per night2 $168
TABLE 3: DOMESTIC OVERNIGHT VISITORS (2018-2022)
FIGURE 1: DOMESTIC OVERNIGHT: VISITORS AND NIGHTS 2010 TO 2022
2 TRA (2019) LGA report for Coffs Harbour – Average spend per night all domestic overnight visitors
3 TRA (2019) LGA Profile Report for Coffs Harbour.
4 DNSW (2019) NSW North Coast visitor profile (YE Dec 19)
Visitor Residence (DON)
Over the past 10 years, Sydney has been the dominant market segment with around 30% of visitors from this location. The Top 5 Market segments continue to show moderate variation over the 10-year timeframe as a result of Covid_19 and other climatic conditions. As highlighted in Figure 2, Sydney has shown consistent growth over that time, while visitors from the North Coast has decreased by 3% in 2022.

These 5 market segments represent 65% of the total domestic overnight market supported by various other smaller segments shown in Table 4 below.
Interstate visitors represent 30% of domestic overnight visitors with most from Queensland (19%) and Victoria (7%). As shown, the proportion of interstate visitors has rebounded in 2022.
Pg.9
FIGURE 2: REGION OF RESIDENCE OF DOMESTIC OVERNIGHT VISITORS
5 Year average 2022 % change NSW (70%) Sydney 29.3% 29.2% North Coast 14.7% 11.3% -3.4% Hunter 9.0% 6.7% -2.3% New England North West 7.4% 8.2% 0.8% Central Coast 4.6% 6.9% 2% South Coast 2.8% 3.1% Central NSW 1.7% 2.5% 1% Blue Mountains 0.9% 1.8% 1% Capital Country 1.2% 0.2% -1% Riverina 0.5% Other NSW 0.0% 2.3% QLD (19%) Brisbane 10.1% 9.2% -1% Gold Coast 3.5% 5.2% 2% Sunshine Coast 2.2% 3.0% 1% Other QLD 2.3% 1.6% -1% VIC 6.2% 6.7% 1% ACT 1.3% 1.1% SA 0.7% 0.5% WA 0.6% 0.5% TAS 0.3% NT 0.1% 0.0%
TABLE 4: VISITOR RESIDENCE: 5 YEAR AVERAGE AND 2022
Reason for Visit (DON)
The reasons to visit Coffs Harbour LGA remain consistent with previous averages to suggest most overnight visitors to Coffs Harbour were on a holiday (52%), while around a third are visiting friends or relatives (34%).
Less visitors were in transit (2%) or visiting for other reasons such as education and medical visits (3%).
Accommodation (DON)
In 2022, commercial accommodation (shaded section in Table 5) accounted for 58% of accommodation used by domestic overnight visitors, including hotels and resorts (36%), commercial caravan parks (14%). There were less rented houses and apartments used in 2022 (5%).
Non-commercial accommodation accounts for 42% and includes friends and relatives’ homes (32%) and non-commercial camping (2%) as well as private weekenders (2%) and other homestay etc (6%).

10
2018 2019 2020 2021 2022 5 yr average Hotels/resorts 38% 34% 30% 32% 36% 34% Caravan Park or commercial campground 15% 16% 15% 13% 14% 15% Rented house/apt/flat 10% 7% 8% 11% 5% 8% Guest house or Bed & Breakfast 1% 1% 3% 2% 2% 2% Backpackers 0% 0% 0% 0% 1% 0% Private accomm (VFR) 28% 33% 35% 32% 32% 32% Non-commercial camp 5% 4% 5% 4% 2% 4% Private residence 3% 3% 4% 4% 2% 4% Other Private (homestay etc*) 1% 1% 1% 2% 6% 1% *TRA doesn’t include Air BnB in any one category
TABLE 5: ACCOMMODATION OF DOMESTIC OVERNIGHT VISITORS
FIGURE 3: REASON FOR VISIT
Age and lifecycle (DON)
The age of visitors has been categorised into generations5 which highlights the dominance of the Gen X (43-56 years) as the largest group of overnight travellers, at around 32%. Interestingly, a larger ratio of visitors were Baby Boomers in 2022. This typology allows travel marketers and planners to see the preferences of generations more than age-based typology.


Lifecycle/travel party (DON)
To analyse this further the travel party also demonstrates a higher ratio of older retired visitors (31%) replacing older working couples. Gen X Families and Boomer Couples remain the two primary lifecycle segments.
5 https://mccrindle.com.au/insights/blog/generations-defined-50-years-change-5-generations-resource/
Pg.11
FIGURE 4: GENERATION GROUPS OF DOMESTIC OVERNIGHT VISITORS (2018-2022)
FIGURE 5: DOMESTIC OVERNIGHT: LIFECYCLE (5YR AVERAGE TO 2022)
Activities (DON)
The types of activities undertaken are very consistent year-to-year. Social activities and outdoor/nature activities continue to be the two main activities undertaken in Coffs Harbour. In 2022, social activities accounted for 42% of all activities, and outdoor/nature activities accounted for 27% of all activities, both close to the 5-year average.
Within the category of "outdoor/nature activities" beach activities (23%) have been the most popular activity over the past 5 years. However visiting parks, gardens and bushwalks are also popular with a total estimated 520,000 overnight visits related to all nature-based tourism activities.

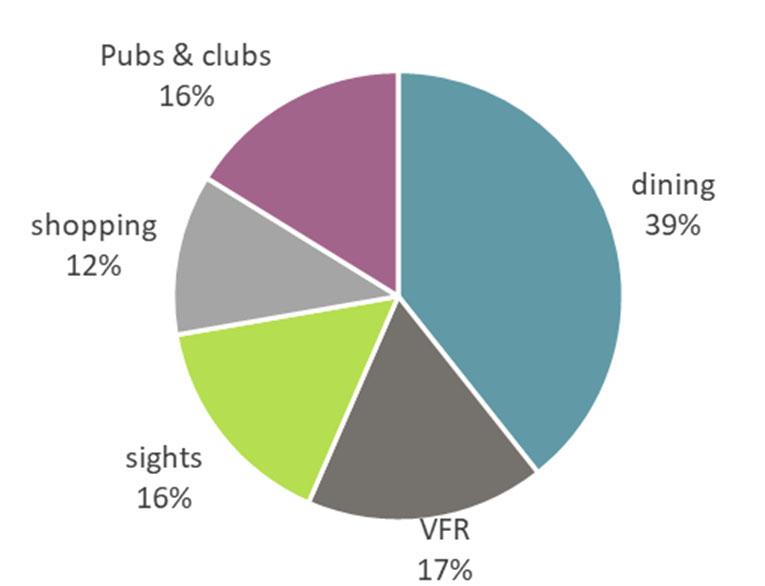
Within the category of "social activities" dining out continues to be the most popular activity in 2022 (39%).

Visiting pubs/clubs, shopping and VFR are all equally popular social activities.
12
FIGURE 6: DOMESTIC OVERNIGHT: ACTIVITIES
* Survey respondents could choose more than one response, showing multiple activities undertaken in the same trip
FIGURE 7: DOMESTIC OVERNIGHT: NATURE ACTIVITIES
* Survey respondents could choose more than one response, showing multiple activities undertaken in the same trip
FIGURE 8: DOMESTIC OVERNIGHT: NATURE ACTIVITIES
Transport (DON)
The most popular transport option in 2022 is for self-drive (88%) with 3% choosing coach. Those using aircraft remained at 8%.
Main destination (DON)
Over the past 5 years Coffs Harbour has been the main destination in the LGA with the other parts of Coffs Harbour registering a smaller proportion of overnight visitors as shown below.
In 2022, 70% visited the central Coffs Harbour district as their main destination. Other parts of Coffs Harbour LGA receive similar visitation of around 5%.
*It should be noted that individual smaller towns will have very low sample sizes to assess. Geographic boundaries are constructed by TRA from SA2 data.
Pg.13
2018 2019 2020 2021 2022 5 yr av Aircraft 11% 6% 6% 8% 8% 8% Self-drive vehicle 88% 91% 93% 89% 88% 90% Coach and other transport 2% 2% 1% 3% 3% 2%
TABLE 6: TRANSPORT (DON)
2018 2019 2020 2021 2022 5 yr av Coffs Harbour 74% 68% 69% 67% 70% 71% Woolgoolga – Arrawarra* 6% 9% 8% 7% 8% 7% Sawtell – Boambee* 6% 7% 7% 6% 5% 6% Bellingen* 5% 6% 7% 10% 8% 7% Urunga* 4% 3% 4% 3% 4% 4% Dorrigo* 3% 3% 3% 3% 2% 3% Korora - Emerald Beach* 1% 4% 2% 3% 3% 3% Coramba - Nana Glen - Bucca 1% 1% 0% 1% 0% 1%
TABLE 7: KEY DESTINATION IN THE LGA (DON)
Domestic Day Visitors
The number of day visitors declined during Covid_19 to approximately 0.88 million, a decrease of 2% in 2020 and 6 % in 2021. The current level of 0.78 million is below the 5-year average (0.89 million) however is above the record low of 0.70 million in 2016.

The linear trendline over the last 10 years suggests a slight downward movement in this segment at an average decrease of 0.5% in the past 10 years. It is interesting that the day market has not rebounded as well as the overnight market, with a further 11% decrease since 2021. This may be related to weather and road conditions, including the floods of the Northern Rivers in March 2022.
Visitor Expenditure (DDV)
Visitor expenditure in individual LGAs is estimated by TRA using a four-year average. The statistics for 2019 suggested that day visitors to Coffs Harbour spend an average of $159 per trip6. This is higher than in 2017 ($148 per trip) and higher than North Coast region average ($113 per trip 2019)7
In 2022, the average for the North Coast was $149 8 .
6 TRA (2019) (2017) LGA Profile Report for Coffs Harbour.

7 DNSW (2019) Travel to North Coast Destination Network
8 www.tra.gov.au/data-and-research/reports/national-visitor-survey-results/national-visitor-survey-results.
14
TABLE 8: DOMESTIC DAY VISITORS: SUMMARY
FIGURE 9: DOMESTIC DAY VISITORS: 2013 – 2022
Domestic Day Visitors '000 2018 2019 2020 2021 2022 5 yr average # of visitors 915 954 933 880 787 894 % change -2% 4% -2% -6% -11% -3% Spend per trip $159
Visitor Residence (DDV)
In 2022, day visitation returned to previous patterns with the North Coast region comprising 84% of day visitors, and visitors from other regions increasing. Further analysis shows:
• 19% come from a variety of towns south of Coffs Harbour (e.g. Macksville and Port Macquarie).
• 12% from towns north of Coffs Harbour (e.g. Grafton 10%).
The results demonstrate the strength of the local North Coast segment, with most day trippers coming from neighbouring areas such as Nambucca and Macksville. Road conditions often impact travel in regional areas with decreases continuing from New England/North West.

Reason for Visit (DDV)
In 2022, the reason to visit has returned to pre-covid trends where the majority of day visitors came to Coffs Harbour on a leisure visit (69%). The ratio of VFR has returned to 16%. Those travelling for medical reasons (11%) remained at a similar ratio.

Pg.15
TABLE 9: DOMESTIC DAY VISITORS: RESIDENCE
FIGURE 10: DOMESTIC DAY VISITORS: TOP DOMESTIC DAY MARKETS
5 Year 2022 NSW (92%) North Coast 88.3% 83.9% New England 4.6% 3.0% Sydney 3.4% 3.2% Other NSW 1.1% 0.0% QLD (8%) Gold Coast 2.1% 4.7% Brisbane 2.2% 2.3% 100.0% 100.0%
FIGURE 11: DOMESTIC DAY VISITORS: REASON
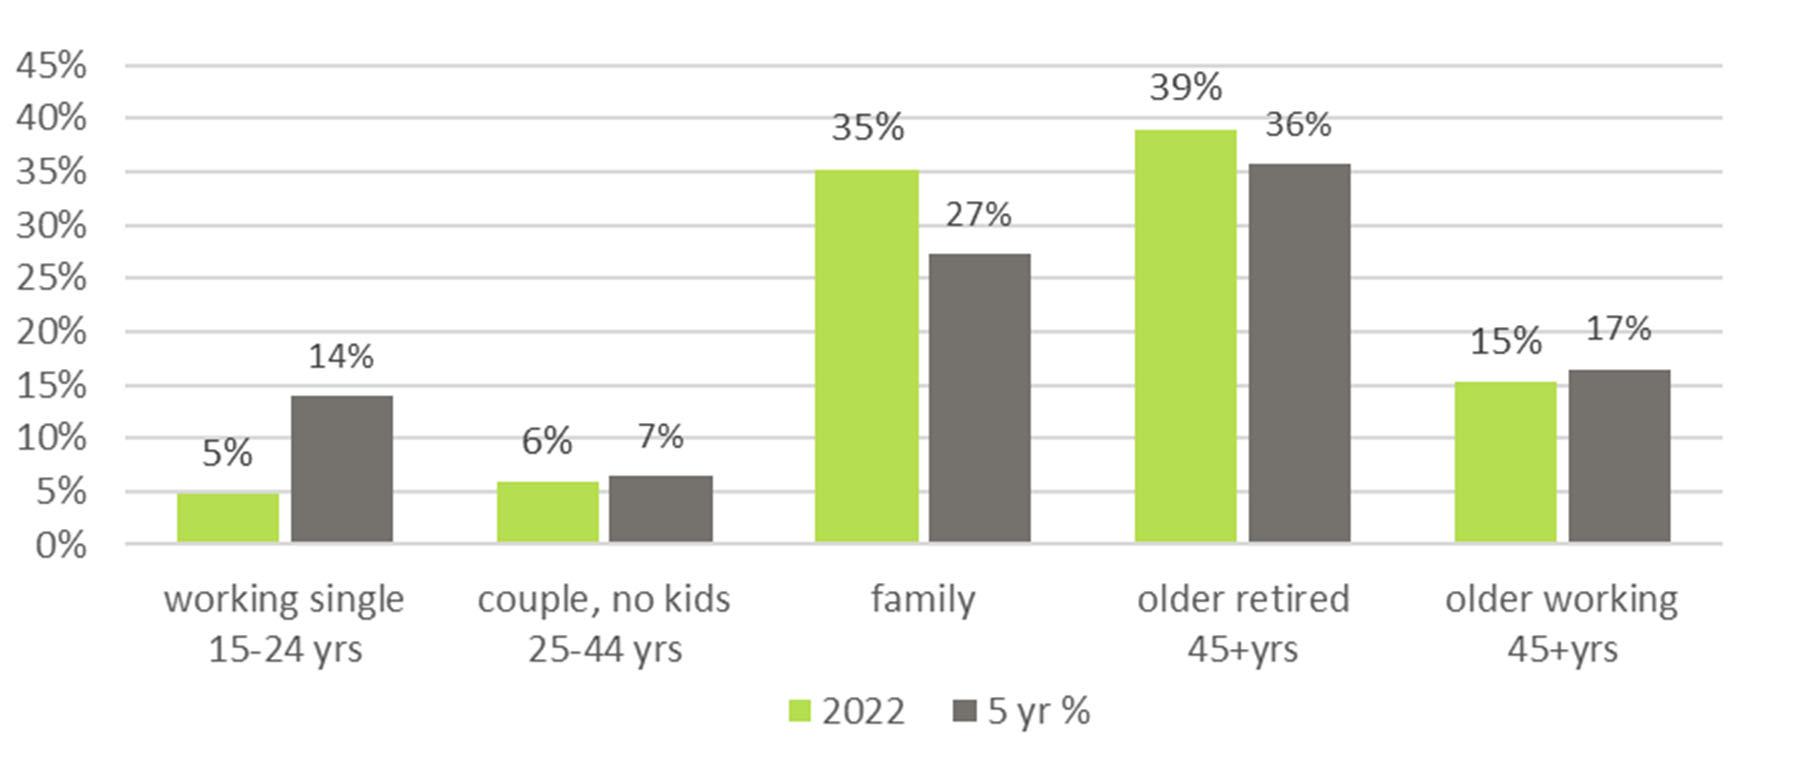
Age and lifecycle (DDV)
The age of visitors is categorised into generations as shown, with Gen X (42-60 years) the largest group of day travellers; reversing the trend from 2021 where most day travellers were baby boomers.

Two lifecycle segments remain prominent, those being: Retired people (single or married) represented 39% of day visitors and families (35%). Previous reports also showed the family market growing, from 26% in 2016, to 32% in 2018, and now growing again to 35% in 2022.
Transport (DDV)
In 2022, the most popular transport option is for self-drive (99%), with 1% choosing the bus/coach and less than >1% choosing air transport.
16
FIGURE 12: GENERATION GROUPS OF DOMESTIC DAY VISITORS (2017-2022)
FIGURE 13: LIFECYCLE SEGMENTS
Activities (DDV)
In 2022, the most popular activity for day trippers was again related to social activities. As shown below, social activities reduced to 42%, while outdoor/nature activities increased to 28%.

Arts and heritage activities were severely impacted by Covid19 restrictions over the past 3 years, and are slow to recover, representing only 2% of day visitor activities.

The types of social activities follow the same trends as overnight visitors with a recovery in dining out (28% of total activities), shopping (13%) and sightseeing (10%). Visiting friends/relatives for a day visit decreased from its average of around 12% to 8% during 2022.
Interest in nature activities had been growing over the past 10 years prior to the impact of Covid19. In 2022, there were an estimated 355,000 day visits related to nature-based tourism. As shown below, this is a large increase from an average of 18% to 28% of day visitors. While this could be related to the recovery stages from Covid-19 and changes in traveller behaviour – the increase should be viewed with some caution as to the sample size of this data (see Appendix).
Pg.17
FIGURE 14: DOMESTIC DAY VISITORS: ACTIVITIES
* * Survey respondents could choose more than one response, showing multiple activities undertaken in the same trip
FIGURE 15: DAY VISITOR: NATURE ACTIVITIES
International Visitors
Data for international visitors is unavailable for 2022 as border closures were imposed as a result of Covid-19 in March 2020. As a point of future reference, the number of international travellers averaged 89,000 per annum before the restrictions were enforced, comprising less than 4% of total visitation.
The five-year average stay of 8.8 nights was less than the North Coast average of 10.9 nights9 and the Regional NSW average of 16.9 nights in 2019 10
Visitor Residence (INT)
Over the past 5 years (2015-2019) Coffs Harbour LGA attracted a consistent mix of international markets, with the main generating regions being:
• Europe & UK (58%)
• New Zealand (7%)
• Asia (17%)
• North America (13%)
• all other countries - including South America, UAE and Pacific (5%).
Traveller Ty pe (INT)
The following characteristics are typical of international visitors to Coffs Harbour LGA:
• 80% FIT travellers, with only 2% on a group tour and >1% on a packaged tour.
• Backpackers comprise 40% of the market,
• 29% use private accommodation such as VFR homes.
The main purpose of travel is for holiday (84%) or VFR (12%), while 4% are on business.
9 DNSW (2019) Travel to North Coast Destination Network Year ended December 2019
10
18
INTERNATIONAL '000 2015 2016 2017 2018 2019 5 yr average # of visitors* 80 80 89 95 104 89 % change on year 14% 0% 11% 6% 10% 8% Nights 635 598 789 843 1,149 802 Av night stay 7.9 7.5 8.8 8.9 11.1 8.8 Sample size 600 559 521 526 540 550 Spend per trip8 ^ $369 $408 $461 Spend per night8 $55 $56 $49 Activities 1. Social,
Outdoor/nature,
local attractions Source All Europe incl UK (58%) Nth America (13%) All Asia (17%) UK (16%) Germany (14%) USA (7%)
TABLE 10: INTERNATIONAL VISITORS: SUMMARY
2.
3.
DNSW (2019) Travel to Regional NSW YE June 2019
Comparisons to other regions - 2018-2022
Comparisons have been made to the following local government areas and for the North Coast region as a whole.
Note: In 2022 Coffs Harbour LGA had a larger share of the North Coast market than Byron Bay or any other destination.
Pg.19
2019 2020 2021 2022 % change from 2021 % share of north coast 2022 Coffs Harbour Domestic overnight 1062 786 774 928 20% Domestic day 954 933 880 787 -11% International 104 Total 2120 1719 1654 1715 4% 15% Port Macquarie Domestic overnight 880 685 610 816 34% Domestic day 855 691 780 613 -21% International 80 Total 1815 1376 1390 1429 3% 13% Byron Bay Domestic overnight 1014 523 613 713 16% Domestic day 1172 423 516 739 43% International 223 Total 2409 946 1129 1452 29% 13% Ballina Domestic overnight 433 253 285 313 10% Domestic day 492 386 336 519 54% International 16 Total 941 639 621 832 34% 7% North Coast Domestic overnight 6402 4305 4322 5490 27% Domestic day 8510 5558 5221 5902 13% International 375 Total 15287 9863 9543 11392 19% 100%
TABLE 11: COMPARISON REGIONS 2022
Appendix 1
Methodology
Data is downloaded from TRA National Visitor Survey and International Visitor Survey and reanalysed by staff at Destination Research. Where possible this is cross-checked with published statistics, and data compiled by DNSW, TRA and other tourism organisations. The following methods are used.
I. The analysis utilises TRA subscription data, with most analysis using a five-year averagehowever where needed a ten-year time series is also shown to examine trends over time. This is then compared to the current year results.
II. All analysis in this report is undertaken using a calendar year (2022). Other analysis by the TRA is undertaken using year-end in September, July and March, providing slightly different reporting of "yearly" results.
III. TRA data is analysed in statistical areas (SA2) which when combined make up the total LGA of Coffs Harbour the report is based on:
• Coffs Harbour (South and North)
• Coramba - Nana Glen
• Woolgoolga - Arrawarra
• Bellingen
• Korora - Emerald Beach
• Sawtell - Boambee
• Urunga
• Dorrigo
IV. Sample sizes for each data set are shown in this report and it is acknowledged that the data derived from TRA surveys are subject to sample error. The likelihood of sample error is explained by TRA and should be read before drawing any conclusions or inferences, or taking any action, based on the data.
V. TRA data should be used with caution when analysing smaller segments of visitors coming to regional areas - where the sample size is small the results can be unreliable. For example, the numbers of international heritage tourists in Coffs Harbour are a tiny percentage of all international tourists to Australia.
VI. Visitor expenditure data for individual local government areas (LGA), or statistical areas (SA2) is not provided quarterly by the TRA and is provided in a summarised format LGA level on a yearly basis as shown in this report.
VII. In 2018, TRA revised methods for collecting and analysing international data. This caused some small changes to previously published data. Revised estimates for data prior to 2018 HAVE BEEN included in this report.
VIII. Use caution when comparing 2019 NVS estimates with earlier years. The move to 100 per cent mobile phone interviewing has seen increases to 2019 NVS estimates which have an upward influence on growth rates.
IX. Data for 2017 and 2018 has been revised to align with the latest ABS population projections and will differ from previously published estimates.
X. The border restrictions brought about by Covid_19 mean that international visitor data is not available for 2020, 2021 or 2022.
20