FINANCIAL REPORT
FIRST QUARTER 2023
COMMUNITY AND ECONOMIC DEVELOPMENT

INFRASTRUCTURE
ORGANIZATIONAL AND SERVICE EFFECTIVENESS SAFE COMMUNITY
VIBRANT COMMUNITY AND NEIGHBORHOODS
Contributors:
Bryan Archer, Director of Finance
Deb Nielson, Deputy Director of Finance
Chris Kelly, Budget Analyst
Carolyn Ewing, Budget Analyst
Rocky Sheppard, Budget Analyst
Vesta Weinhauer, Controller
Carolyn Ivey, Accounting Supervisor
Natasha Galston, Grant Accountant
Jenna Belec, Finance Program Coordinator
Steve Milke, Bun Heng, Print Shop
Finance Department • 8101 Ralston Road • Arvada, Colorado 80002 720-898-7120 • www.arvada.org
1 Table of Contents Overview ................................................................................................................................. 3 Property Tax ............................................................................................................................ 4 General Fund ....................................................................................................................... 5 - 8 Street Maintenance Fund................................................................................................... 9 -10 Parks Fund ........................................................................................................................... 11 Special Revenue Funds Tax Increment Funds ......................................................................................................... 12 Community Development .................................................................................................. 13 Arvada Housing Authority .................................................................................................. 14 Capital Improvements Projects Fund ................................................................................ 15 -16 Enterprise Funds Water Fund ....................................................................................................................... 17 Wastewater Fund .............................................................................................................. 18 Stormwater Fund 19 Golf Fund .......................................................................................................................... 20 Solid Waste Fund .............................................................................................................. 21 Internal Service Funds Insurance Fund ................................................................................................................. 22 Computer Fund ................................................................................................................. 23 Vehicle Fund ..................................................................................................................... 24 Print Services Fund ........................................................................................................... 25 Buildings Fund .................................................................................................................. 25 3F Bond Projects ............................................................................................................. 26 -27 Investment Report ........................................................................................................... 28 -29 Grant Information ................................................................................................................. 30 Performance Data............................................................................................................ 31-32
Intentionally left blank
OVERVIEW
2023 First Quarter Financial Report
The Financial Report for the City of Arvada provides an unaudited overview of the major funds and how their revenues and expenditures performed in comparison to budget. This is not meant to be a complete accounting, but rather a quick look at the highlights.
As we turn the calendar from 2022 to 2023, the economic signals and host of geopolitical risks suggest that this year could be as challenging as the last. Gross Domestic Product (GDP) is projected to increase 2.8% on an aggregate basis but only .1% on a real basis (GDP minus inflation). GDP grew at 1.1% for the first quarter, below expectations of 2%. The Purchasing Managers Index (PM) has just moved under 50 for both the manufacturing and service industries, which indicates contraction and is historically a leading indicator for a recession.
Inflation has started to slow, up “only” 5% year over year, down from 6.5% but still well above the Feds goal of 2%. This has caused the Fed to continue its tightening practices, with three 25 basis point increases so far in 2023, raising the short term rate to 5.25%. The yield curve is still inverted at historically high levels. The yield curve – specifically, the spread between the interest rates on the 10-year Treasury note and the three-month Treasury bill – is a valuable forecasting tool. The current spread on the 10-year and three-month Treasury is 1.8% with the spread on the 10-year and 2-year sitting at .53%. Using these numbers as a historic estimator, the recession probability in the next year now sits at 60%. The financial markets were hit with a shock to the system when Silicon Valley Bank (the 16th largest, with more than $200 billion in assets) and then Signature Bank (with more than $100 billion in assets) failed and had to be taken over by the FDIC creating even more uncertainty in the overall stability of the markets.
Through all of this, there are still some bright spots. The Stock Market has shaken off all of these concerns, with the S&P 500 up 7.5% for the first quarter. The market is historically forward looking currently betting that any slowdown will be short lived. Unemployment continues to be low, ending March at 3.5%, signally a healthy economy.
Another bright spot is the finances of the State. While GDP is expected to slow to 1.5% in 2023, overall tax revenues continue to grow. The State is expected to hit the TABOR limitation again in 2023 with sales, income and property taxes showing strong growth. The unemployment rate has fallen to 2.8% from 3% at the end of 2022. Competition for the most qualified workers continues to drive wages up, helping the consumer but putting pressure on business.
The City has experienced a little bit of a slowdown in the first quarter of 2023, though many revenue categories are still exceeding their budget expectations. Sales tax collections are up 4.4% but lag one month, so first quarter results only include January and February. The top industry increases are in Electric Power, Super Market/Grocery, Local Delivery and Limited Service Restaurants. The industries that have struggled to start the year are Hardware Stores and Liquor Stores.
Auto Use continues to be strong, up 11.6% for the first quarter. Production of new cars has speed up as demand for both new and used cars remains high. General Use is up 8.0% in the first quarter, demonstrating businesses are still investing in themselves. Building Use is down 6.2% as compared to first quarter 2022 but is still exceeding budget. The budget for building use tax is tied to the costs to run the program.
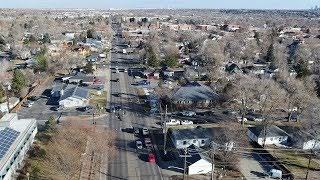
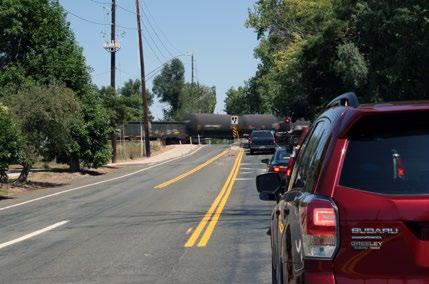
Overall expenditures are in line with budgets except capital. The first quarter of the year is a slower time for expenditures as many of the outside operations are gearing up for the summer. Capital costs continue to escalate, especially on our larger projects, notably 72nd Ave, Ralston Road and Meyers Pool. Elevated inflation, supply chain interruptions and increasing wage costs all have contributed.
One capital project is discussed on this quarter – Gold Strike Park. Please take the opportunity to read the write-up on this exciting project that is over 45 years in the making and is the first documented location that gold was discovered in Colorado!
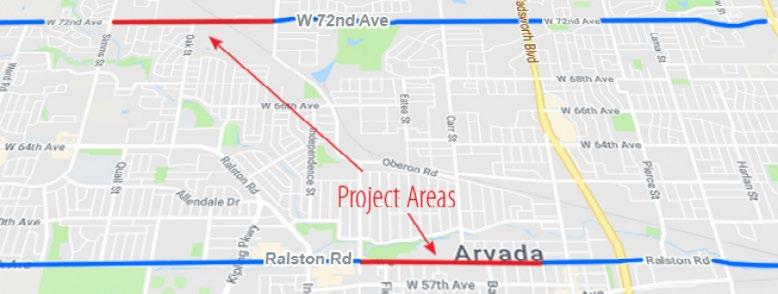
The citizens of Arvada passed Ballot Issue 3F in November of 2018, approving a sales and use tax bond to fund the widening of Ralston Road from Yukon to Garrison and the widening and creation of an underpass on 72nd Avenue from Kipling to Ward. Please see the project detail pages (pages 26-27) in the document for detailed updates.
The City has started the year out strong, with revenues exceeding budget and overall expenditures in line with budgets. More and more economic signs point towards a recession. The City’s conservative financial practices along with healthy reserves, will allow the continued delivery of core services for years to come.
3
OVERVIEW
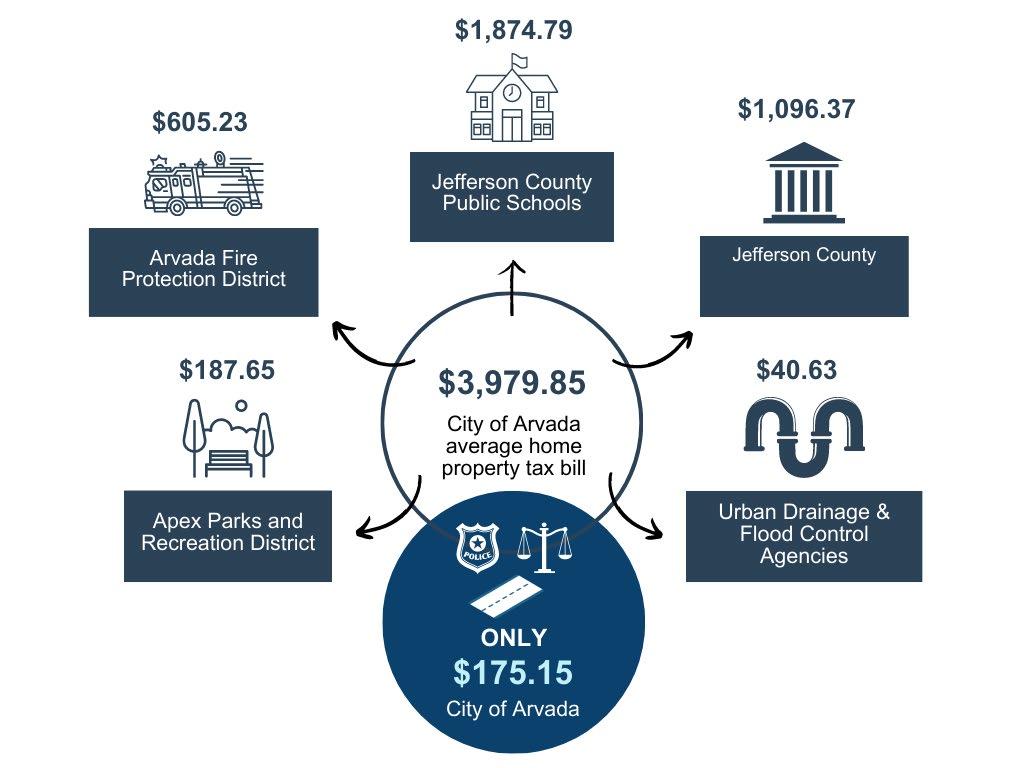
The City’s property tax mill levy rate for 2023 was 4.31 mills. Residents paid $175.15 in City property taxes on the medium home price of $620,000
For 31 straight years, Arvada has received the Tree City USA Award from the @arborday for our commitment to the City’s urban forest.
For the 3rd straight year, Arvada has received the @arborday Growth Award for higher levels of tree care and community engagement.
4 WHRE DO YOUR PROPERTY TAX DOLLARS GO?
Overview
Residents may pay additional property taxes if they live in a Metro District. These additional mill rates vary from 10 mills up to 75 mills. A Metro District is a taxing entity that exists primarily to finance public improvements and amenities that benefit property owners in the district.
GENERAL FUND
General Fund Overview
The General Fund pays for the City’s basic services. This includes police, planning, transportation planning, street light maintenance and costs, building activity and general administration. In addition, the General Fund also provides for the following:
• Operational support to the Parks Fund
• General Debt Service payments

• Transfer to the Capital Improvements Fund for new parks, transportation and other infrastructure projects
• Grant support to the Arvada Center
The following table provides a comparison of budgeted cash balances, revenues and expenditures to actual amounts.
• The 2023 beginning fund balance was $70,069,000.
• $3,842,062 of the fund balance is dedicated to projects not completed in 2022, one-time items and new requests.
• The 2023-2032 ten-year financial plan requires the use of $29,129,232 to balance and requires $26,031,923 as a reserve. A 10-year plan will be updated this summer in conjunction with the 2024 budget cycle.
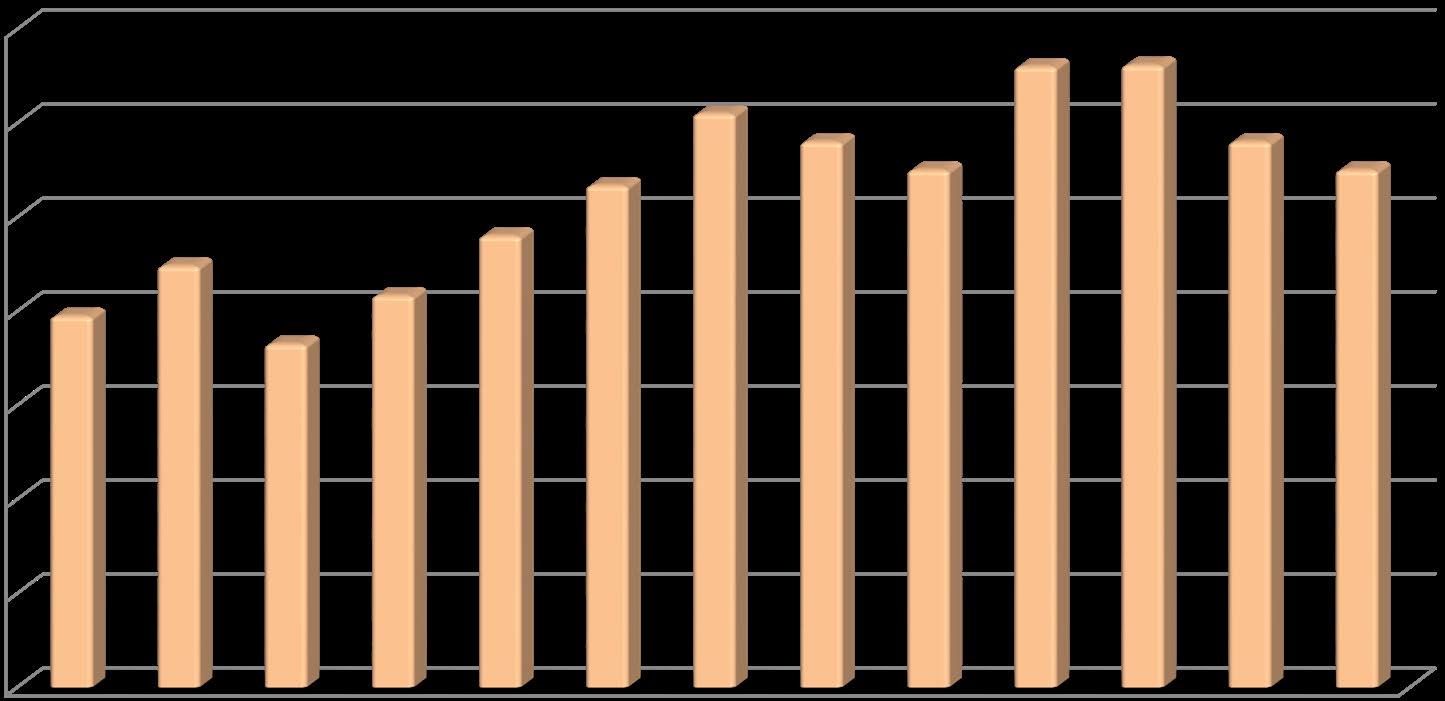
GENERAL FUND ENDING FUND BALANCE BY QUARTER COMPARED TO FUND BALANCE GOAL OF 17% OF BUDGETED EXPENDITURES
5
General Fund 2023 Budget As of 03/31/23 As of 03/31/22 Beginning Fund Balance $70,069,000 $70,069,000 REVENUES Sales & Use Tax 90,373,950 13,935,002 13,374,083 Property Tax 8,152,193 3,041,499 3,062,689 Interest 1,173,000 240,957 204,778 Other 26,891,325 4,724,647 4,067,879 Total Revenues $126,590,468 $21,942,105 $20,709,429 EXPENDITURES Ongoing $110,490,352 $22,959,498 $18,666,893 Capital 10,701,459 -Debt Service 5,360,782 -Total Expenditures $126,552,593 $22,959,498 $18,666,893 Income/(Loss) 37,875 (1,017,393) 2,042,536 Ending Fund Balance $70,106,875 $69,051,607
0% 10% 20% 30% 40% 50% 60% 70% Q1 2020 Q2 2020 Q3 2020 Q4 2020 Q1 2021 Q2 2021 Q3 2021 Q4 2021 Q1 2022 Q2 2022 Q3 2022 Q4 2022 Q1 2023
Revenue Highlights
• Overall revenues increased $1,232,676 or 6.0% over 2022.
• Franchise fees saw an increase of $246,133 or 33.5% over 2022. This increase is due to increased collections from Xcel energy as energy and natural gas charges to customers increased in 2023 over 2022.
• Sales tax saw an increase of $428,459 and is discussed in more detail in the “Sales Tax” section.
• General use tax saw a decrease of $9,461 and is discussed in more detail in the “Use Tax” section.
• Auto use tax saw an increase of $117,266 and is discussed in more detail in the “Use Tax” section.
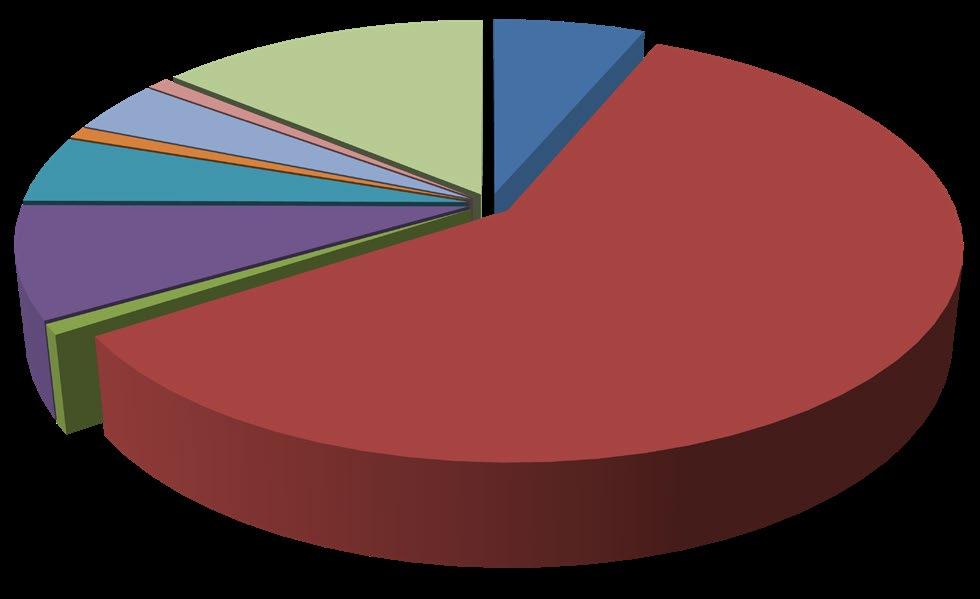
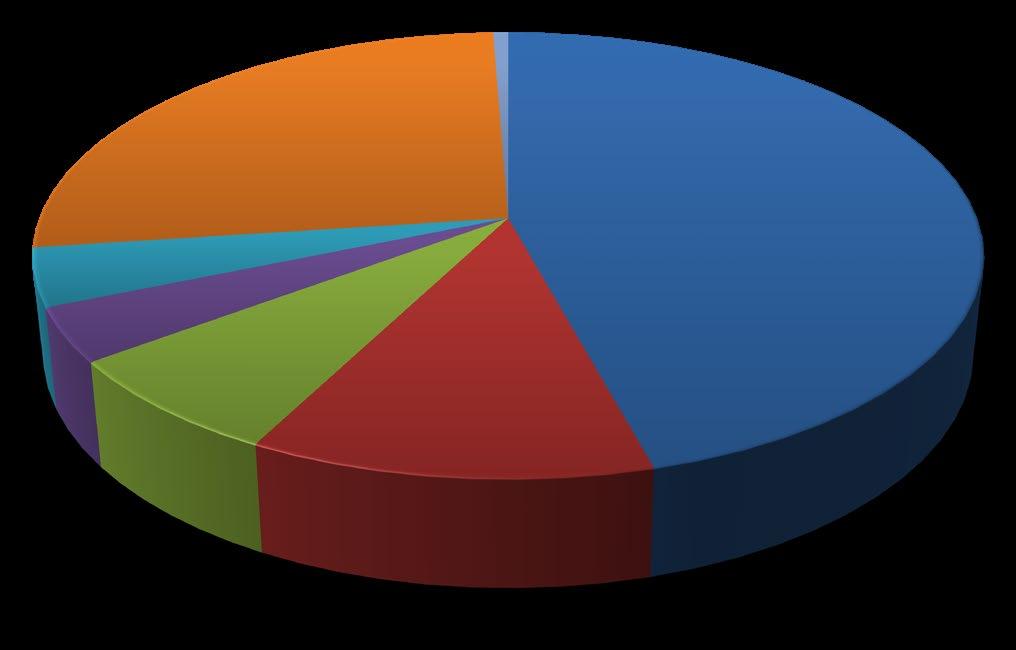
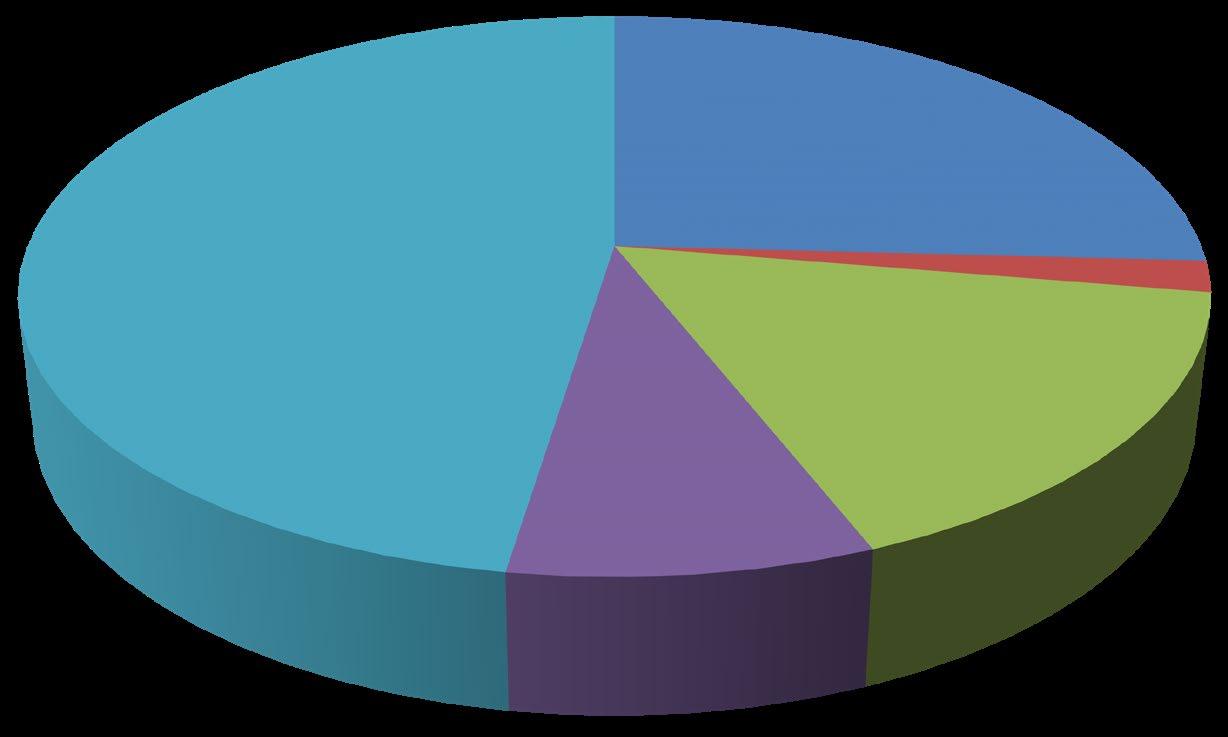
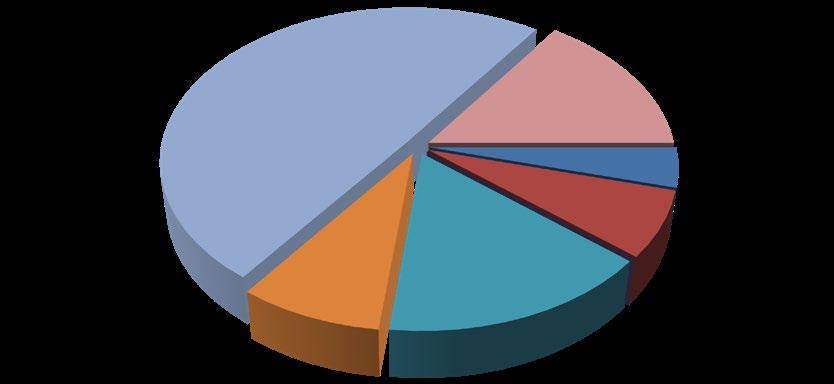
2023 BUDGETED GENERAL FUND REVENUES
Sales Tax
• Sales tax collections lag one month; therefore, collections for the first quarter represent January and February collections.
• Sales tax is up 4.4% for the first quarter.
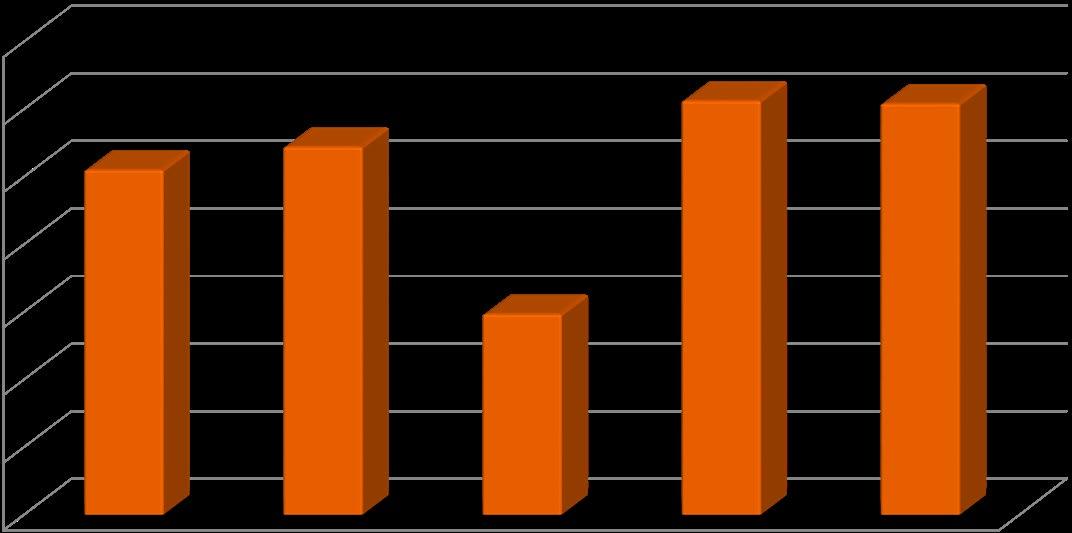
Use Tax
Building Use Tax
• Building use tax decreased 6.2% for the first quarter.
• This is a slight decrease from 2022 but still in line with the budget.
Auto Use Tax
• Auto use tax is up 11.6% in the first quarter.
• The nation continues to see a shortage in new cars and the price of used cars is also elevated, so auto use tax is continuing to increase.
General Use Tax
• General use tax increased 8.0% in the first quarter.
• Area businesses are re-investing in their business with higher purchases during the first quarter 2023.
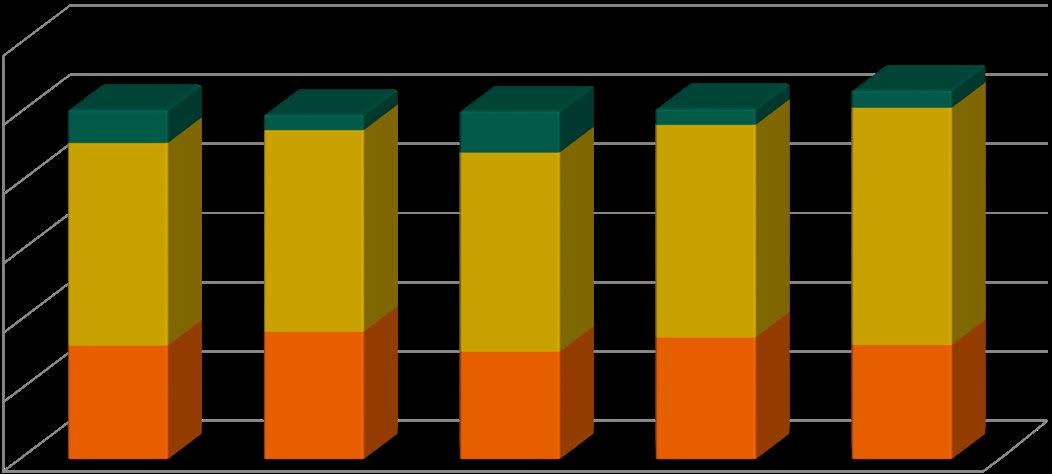
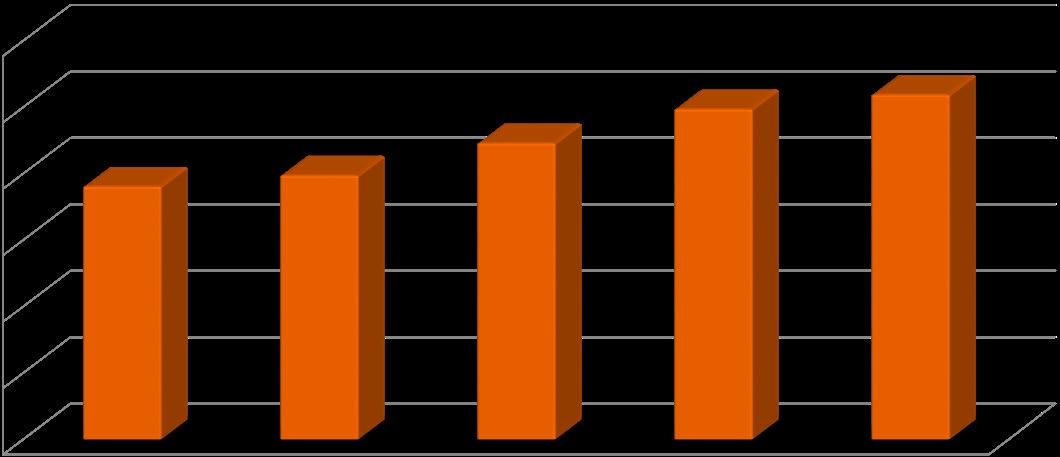
Sales Tax Collections
Use Tax Collections
6
GENERAL FUND
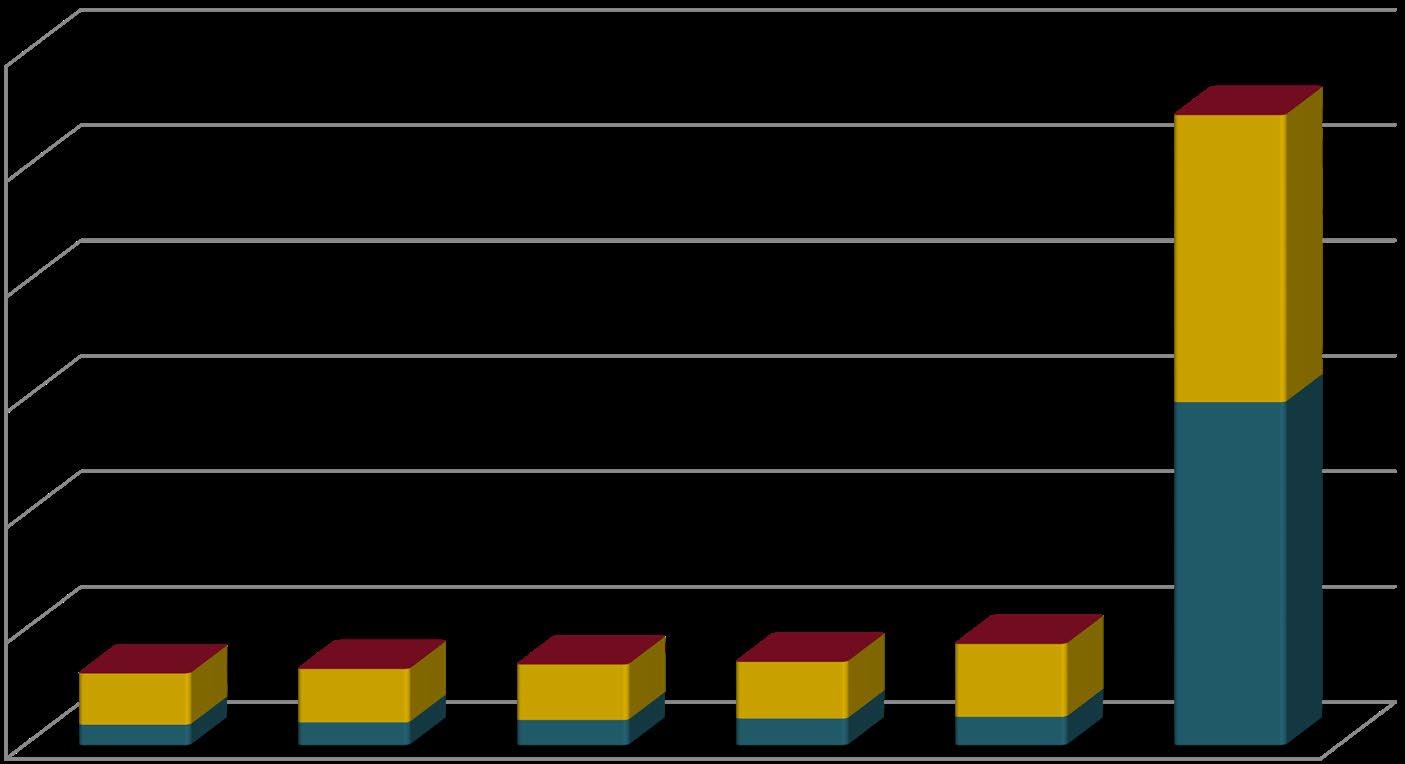
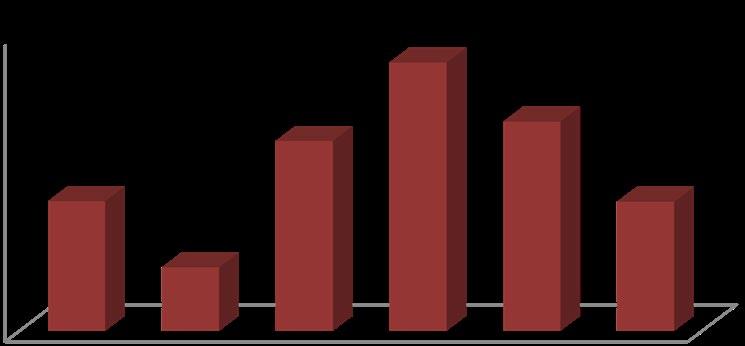
$$2,000,000 $4,000,000 $6,000,000 $8,000,000 $10,000,000 $12,000,000 03/31/2019 03/31/2020 03/31/2021 03/31/2022 03/31/2023 Sales Tax $7,614,354 $7,947,112 $8,920,211 $9,944,331 $10,378,238
$$500,000 $1,000,000 $1,500,000 $2,000,000 $2,500,000 $3,000,000 03/31/2019 03/31/2020 03/31/2021 03/31/2022 03/31/2023 General $241,379 $113,659 $301,032 $118,049 $127,511 Auto $1,462,767 $1,455,296 $1,438,010 $1,535,258 $1,712,795 Building $818,913 $919,016 $775,149 $877,531 $822,995
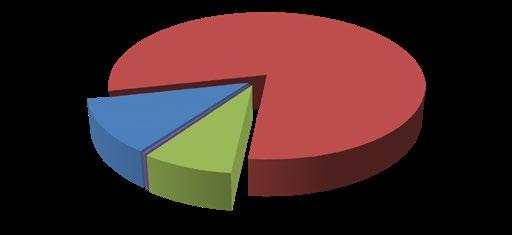
Property Tax, 6.4% Sales Tax, 59.4% Use Tax, 0.8% Auto Use Tax, 8.5% Building Use Tax & Permits, 5.1% Court Fines & Fees, 0.9% Franchise Fees, 4.0% Interest, 0.9% Other, 14.0%
Property Tax
• The City’s property tax rate is 4.31 mills per $1,000 of valuation.
• 2023 property tax is based on the mill which is placed on the assessed valuation from 2022.
• Property tax slightly decreased .7% from 2022.
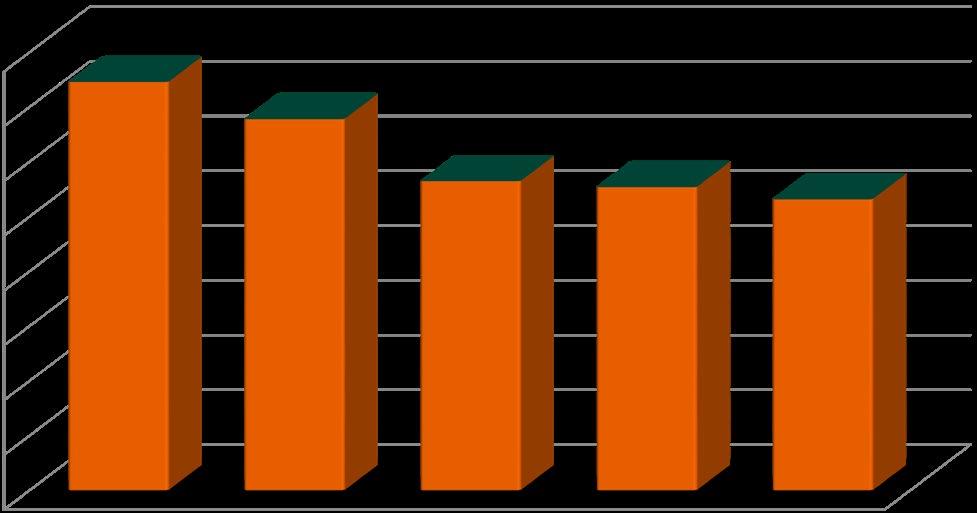
Property Tax Collections
Intergovernmental Revenues
• Highway Users Tax Fund (HUTF), the City’s share of statecollected gas tax revenue, is down 4.0% for the first quarter. This tax is collected on the number of gallons of gas sold.
• Road and Bridge funds, the City’s share of property tax collected by Jefferson County & Adams County and dedicated to the maintenance of roads and bridges, is disbursed several months after it is collected, so January revenues will not be received until April.
Intergovernmental Revenues
7 GENERAL FUND
$$100,000 $200,000 $300,000 $400,000 $500,000 $600,000 $700,000 $800,000 03/31/2019 03/31/2020 03/31/2021 03/31/2022 03/31/2023 Jefferson County $- $- $- $- $HUTF $745,146 $677,451 $564,064 $553,361 $531,190
$$500,000 $1,000,000 $1,500,000 $2,000,000 $2,500,000 $3,000,000 $3,500,000 03/31/2019 03/31/2020 03/31/2021 03/31/2022 03/31/2023 Property Tax $2,550,891 $2,722,011 $1,484,135 $3,062,689 $3,041,499
Expenditure Highlights
• Overall expenditures increased $4,292,605 or 23% over 2022.
• Personnel charges increased $1,075,397 as team members received a 3% pay increase January 1, 2023.
• Services and charges increased $1,864,563 or 98.7% from 2022. This is due to the timing of the support payment to the Arvada Center in 2022 as this was paid in the second quarter of 2022 and paid in the first quarter of 2023.
• Supplies and expenses saw an increase of $442,683 or 22.8% over 2022. This is primarily due to contributions to the computer replacement and maintenance fund to support additional costs associated with technology.
• Transfers increased $1,038,498 or 26.9% over 2022. This is due to an increase in the transfer to the Streets Maintenance Fund, the Parks Fund to support park maintenance and safety, and an increase to the COP Fund for payment of the Meyers Pool Debt Service.
Salary and Benefit
2023 BUDGETED GENERAL FUND EXPENDITURES
• Personnel costs increased due to the numerous new positions and a mid-year pay adjustment in 2022. The 2023 pay plan included 38 new positons. The City increased employee’s pay in the 3rd quarter of last year to accommodate for unusually high inflation.
8 GENERAL FUND Personnel, 45.8% Services and Charges, 11.8% Supplies and Expenses, 7.2% Contracts 3.9% Debt Service 4.2% Transfers 26.5% Miscellaneous 0.6%
Salary & Benefits 2023 Budget As of 03/31/23 As of 03/31/22 Salaries & Wages $44,678,818 $7,793,478 $6,859,316 Vacancy Savings (2,141,434) -Overtime 857,155 232,023 271,494 Group Insurance 7,740,561 1,171,214 1,115,009 Retirement 4,988,662 875,946 778,442 Medicare 659,148 111,088 97,982 Temporary Wages & SS 281,393 58,730 96,004 Other 849,852 168,341 135,845 Total $57,914,155 $10,410,820 $9,354,092
Street Maintenance Fund
Overview
The Pavement Management - Street Maintenance Fund accounts for costs associated with street maintenance, repair and replacement planned by the Pavement Management Program including: ADA curb ramp compliance, concrete replacement, crack sealing, hot chip, cape and slurry sealing, reconstruction, milling and overlay. Revenues are derived from the City’s General Fund and the Highway Users Tax Fund which is the City’s share of state-collected gas tax revenue.
Revenue Highlights
• Revenues consist of a transfer from the General Fund and street degradation fees.
Expenditure Highlights
• The 2023 Pavement Management Program map includes proposed areas to be addressed is attached hereto and incorporated herein by reference. The map identifies areas proposed to be addressed in 2023 with compliant ADA curb ramps, concrete replacement, mill and overlay, hot chip seal, slurry seal, cape seal and crack seal.
Overview:
The Public Works Department is committed to improving our accessibility and roadways throughout the City. During the annual selection process, the Pavement Management team evaluates data, researches past and current plans and collaborates with other internal departments about their annual project planning. This process helps prioritize and coordinate with other City work that may be needed before the correct pavement application is completed. Some examples include ADA curb ramp compliance and utility work.
Title II of the Americans with Disabilities Act (ADA) requires that state and local governments (City of Arvada) ensure that persons with disabilities have access to the pedestrian routes in the public right-of-way (PROW). An important part of this requirement is the obligation whenever streets, roadways or highways are altered to provide curb ramps where street level pedestrian walkways cross curbs. This requirement is intended to ensure the accessibility and usability of the pedestrian walkway for persons with disabilities. Without curb ramps, sidewalk travel in urban areas can be dangerous, difficult, or even impossible for people who use wheelchairs, scooters, and other mobility devices. Curb ramps allow people with mobility disabilities to gain access to the sidewalks and to pass through center islands in streets. Otherwise, these individuals are forced to travel in streets and roadways and are put in danger or prevented from reaching their destination. Alterations and maintenance comprise the bulk of the work done in the Public Right of Way (PROW). An alteration is a change that affects or could affect the usability of all or part of a building or facility. Alterations of streets, roads or highways include activities such as reconstruction, rehabilitation, resurfacing, widening, and projects of similar scale and effect. Examples include, but are not limited to the following treatments or their equivalents: addition of a new layer of asphalt; cape seals; concrete pavement rehabilitation and reconstruction.
The map attached hereto and incorporated herein by reference identifies areas proposed to be addressed with future street alterations and are proposed to be addressed in 2023 with compliant ADA curb ramps and concrete replacement budget permitting
9 STREET MAINTENANCE
FUND
Street Maintenance Fund 2023 Budget As of 03/31/23 As of 03/31/22 Beginning Fund Balance $388,000 $388,000 REVENUES General Fund Transfer $11,954,121 $3,001,030 $2,537,408 Other $120,000 $62,988 51,580 Total Revenues $12,074,121 $3,064,018 $2,588,988 EXPENDITURES Asphalt Replacement $8,634,721 $- $Concrete Replacement 2,276,721 - $Crack Sealing - - $Other 1,097,860 $195,724 $99,887 Total Expenditures $12,009,302 $195,724 $99,887 Income/(Loss) 64,819 2,868,294 2,489,101 Ending Fund Balance $452,819 $3,256,294 $ 2,489,101
Pavement Maintenance 2023 ADA Curb Ramp and Concrete Replacement Program:
• First Quarter 2023 summary
• Two (2) Concrete Contracts
• Proposed Areas - 13
• Triple M Construction started March 13, 2023
• Area 1 Completed
• 80% Complete in Area 2
Pavement Maintenance 2023 Mill and Overlay Program:
• First Quarter 2023 summary
• Two (2) Asphalt Contracts
• Proposed Areas - 5
• Asphalt Specialties started construction March 13, 2023
• Patching construction progressing
• Mill and Overlay to commence when consistent favorable weather conditions apply.
• Approximately Mid to end of April
Pavement Maintenance 2023 Hot Chip, Slurry Seal and Crack Seal Program:
• First Quarter 2023 summary
• One (1) Contract
• Crack Seal and Patching is scheduled to commence April 17, 2023
• Hot Chip, Slurry, Cape Seal Surface Treatments are scheduled to commence June/July, 2023
HUTF/ARPA Grant:
• First Quarter 2023 summary
• Coordinated with Purchasing preparation of bid documents for Kipling Parkway Pavement Resurfacing (between Allendale and W 58th Avenue)
• Advertisement for Bid scheduled to go out Mid April
• Work to be completed in July/August
Other
The Pavement Management Team is committed to improving our accessibility and roadways throughout the City. As well as making significant progress with the 2023 Pavement Management Program (PMP), by starting construction in March, the Pavement Management Team has and continues to collaborate to build and improve processes and procedures. First Quarter examples include:
• Collaborating with internal teams to develop and implement a standardized processes
• Road Matrix. Utilizing software to assist with determining pavement maintenance applications and priorities
• Communication. Continuous collaboration with internal teams to review, update and implement standardized communication internally and externally.
• Collaborating with internal departments to 2023 strategize budget utilization efficiently and effectively
• Collaborating with Internal Asphalt team to develop a process as it relates to patching in areas which will be addressed with Surface Treatments
Challenges
• Poor subgrade conditions found during preparation for repaving. Additional costs will be incurred. However, by addressing and correcting before repaving, the result will significantly extend the service life of the streets. It may impact the proposed areas projected to be completed in 2023 as it relates to available funding.
10 STREET MAINTENANCE
FUND
--------------------E Overlay Program Hot Chip Seal Cape Seal Slurry Seal Curb Ramps Crack Seal Concrete Program Public Works Department Engineering Division OF PROPOSED STREET MAINTENANCE PROGRAMS 2023 8101 Ralston Rd. Arvada, Colorado 80002
Parks Fund
Overview
The Parks Fund accounts for costs associated with the acquisition, design, development, maintenance and beautification of parks, open space and trails within the City. Revenues are derived from the City’s General Fund, Grants Fund, Apex and Jefferson County Open Space funds.
Revenue Highlights
• Overall revenues increased by $746,764, or 47.6% over 2022.
• Jefferson County open space increased $28,942, or 6.3%.
• In 2022, the City transitioned athletic field programming from the APEX Recreation District to the Parks Department. This new revenue source has contributed to the overall increase in revenue.
• The cash transfer from the General Fund increased 28.6% or $281,527 to support employees added to the Parks Fund related to parks maintenance.
Expenditure Highlights
• Overall expenditures increased from 2022 by $366,260, or 19.3%.
• A high number of expenses are associated with running the new athletic field program and the new employees added for Parks maintenance
11
PARKS FUND
Parks Fund 2023 Budget As of 03/31/23 As of 03/31/22 Beginning Fund Balance $7,529,000 $7,529,000 REVENUES Open Space $5,941,771 $489,218 $460,276 City Cash Transfer 4,975,153 1,264,509 982,982 APEX Reimbursement - -Other 1,436,781 562,579 126,284 Total Revenues $12,353,705 $2,316,306 $1,569,542 EXPENDITURES Ongoing $13,381,967 $2,268,493 $1,902,233 Capital -Total Expenditures $13,381,967 $2,268,493 $1,902,233 Income/(Loss) (1,028,262) 47,813 (332,691) Ending Fund Balance $6,500,738 $7,576,813
$$2,000,000 $4,000,000 $6,000,000 $8,000,000 $10,000,000 $12,000,000 2019 2020 2021 2022 2023 2023 Budget APEX $- $- $- $- $- $Cash Transfer $887,148 $924,307 $960,607 $982,982 $1,264,509 $4,975,153 Open Space $354,348 $392,540 $435,186 $460,276 $489,218 $5,941,771
Special Revenue Funds Overview
Special Revenue Funds account for revenues that are to be used for specific purposes. The following funds are considered special revenue funds:
• Tax Increment Funds
• Community Development

• Housing
Tax Increment Funds
Overview
There are two tax increment funds which account for the voter-approved sales tax increases to fund expanded police services. The first accounts for the .21 cent sales and use tax and the second accounts for the .25 cent sales and use tax. Sources include sales tax, general use tax, auto use tax, building use and interest income. Since the tax increment is in addition to the City’s 3% sales tax, revenue trends in the tax increment fund will closely follow those in the general fund.
Revenue Highlights
• Sales Tax and Audit revenue increased due to inflation. The price of goods and services has increased over the last year which is directly related to the sales tax increase.
• The increase in other revenue is due to a larger accounting adjustment entry for daily interest in 2023 than the same entry made in 2022.
Expenditure Highlights
• Ongoing expenditures are comparable to the previous year’s expenditures.
12 SPECIAL REVENUE
FUNDS
Tax Increment Funds 2023 Budget As of 03/31/23 As of 03/31/22 Beginning Fund Balance $18,334,000 $18,334,000 REVENUES Sales Tax/Audit Revenue $12,039,036 $1,789,249 $1,719,271 Use Tax 2,374,576 408,379 380,074 Other 694,433 1,172,174 56,302 Total Revenues $15,108,045 $3,369,801 $2,155,647 EXPENDITURES Ongoing $18,290,470 $2,268,994 $2,276,833 Capital 16,634 49Total Expenditures $18,307,099 $2,269,043 $2,276,833 Income/(Loss) (3,199,054) 1,100,758 (121,186) Ending Fund Balance $15,134,946 $19,434,758
Community Development
The Community Development Fund accounts for all entitlements, revenues and expenditures of the Community Development Block Grants (CDBG) program and the Home Rehabilitation program and Essential Home Repairs program.
Revenue Highlights
• Overall revenues decreased by $61,534 or 34.4% from 2022.
• This large decrease is due to the timing of Community Development Block Grant CARES (CDBG-CV) grant reimbursement at the beginning of 2022 and not received in 2023.
Expenditure Highlights
• Overall expenditures decreased $42,465 which is a 22.0% decrease from 2022. This decrease is due to the payout timing of Homeless Housing Payments in prior year and assigning Essential Home Repair Program (EHRP) to a third party starting in 2023.
• The Essential Home Repair program decreased $46,399 or 94.6% from 2022. This program is funded by CDBG grant and is administered by a third party starting in 2023.
• As the program is just starting this year, no projects were completed during the 1st quarter of 2023. The wait list for essential home repairs is at 70 as of March 31, 2023.
• Ongoing expenses increased due to the timing of Human Services grants payout.
13 SPECIAL REVENUE FUNDS Community Development Fund 2023 Budget As of 03/31/23 As of 03/31/22 Beginning Fund Balance $6,397,000 $6,397,000 REVENUES Recovered $156,810 $31,520 $28,416 Grants 659,470 35,814 134,889 City Cash Transfer 45,000 11,250 13,199 Interest/Other 34,000 38,554 2,169 Total Revenues $895,280 $117,138 $178,673 EXPENDITURES Ongoing $385,080 $102,861 $50,548 CDBG Essential Home Repairs 407,056 2,663 49,062 CDBG Other 532,571 45,458 93,837 DOLA Grant
Total Expenditures $1,324,707 $150,982 $193,447 Income/(Loss) (429,427) (33,844) (14,774) Ending Fund Balance $5,967,844 $6,363,427
- - -
Overview
Arvada Housing Authority
The Authority administers funds received for rent subsidy to low/moderate income households under Section 8 of the U.S. Housing Assistance Payment Program.
Revenue Highlights
• Overall revenues increased $145,195 or 9.3% from 2022.
• Grants revenue increased $145,500 or 9.3% from 2022 due to increased leasing in both Section 8 and Mainstream Programs.
• For the first quarter 2023 there have not been transfers from the General Fund or Community Development fund, similar to 2022.
Expenditure Highlights
• Overall expenditures increased $272,477 or 18.0% over 2022.
• Rent expenditures increased by $260,685 or 18.5% due to the increased number of tenants on the programs.
• The Arvada Housing Authority served 474 families during the first quarter 2023, while 425 were served during the same period in 2022. The Housing Authority also served 49 families with disabled family members through the Mainstream Voucher program, compared to 35 families during the same quarter last year. As of March 31, 2023, the voucher program waitlist has 211 people on it.
14 SPECIAL
REVENUE FUNDS
Arvada Housing Authority 2023 Budget As of 03/31/2023 As of 03/31/2022 Beginning Fund Balance $350,000 $350,000 REVENUES Recovered $15,600 $2,011 $3,355 Grants 5,881,629 1,705,377 1,559,877 Transfers (Rev) 75,000 -Interest/Other 1,000 1,070 32 Total Revenues $5,973,229 $1,708,458 $1,563,264 EXPENDITURES Ongoing $866,649 $93,686 $79,088 Rents 5,033,321 1,686,077 1,425,392 Transfers (Exp) 39,691 5,041 7,847 Total Expenditures $5,939,661 $1,784,805 $1,512,327 Income/(Loss) 33,568 (76,346) 50,936 Ending Fund Balance $383,385 $273,471 Overview
Capital Improvement Projects (CIP) Fund Overview
Revenue Highlights
• Transfers consist of transfers from the General Fund, Grants and Police Tax Increment taxes. Contributions are lands dedicated fees that help fund eligible projects. Grants and recovered costs are reimbursements from other agencies that have shared in the cost of a project.
Expenditure Highlights
• Administration expenditures are related to: improvements to the park maintenance building, Olde Town parking garage, City Hall second floor remodel, fire system replacement and City Hall ADA compliance.
• Technology expenditures are related to the fiber conduit boring project.
• Streets expenditures are related to the streets master plan and Ralston Road.
• Traffic expenditures are related to 58th & Kipling Road, Tennyson Corridor and the Alkire Street trail.
• Park expenditures are for Standley Lake Library trailhead, Gold Strike park, Holistic Health and Fitness park, Marge Roberts park, Pomona Bike park, irrigation improvements, Majestic View classroom improvements and Lake Arbor community pool.
15 CAPITAL IMPROVEMENTS PROJECTS FUND
Capital Improvement Fund 2023 Budget As of 03/31/23 As of 03/31/22 Beginning Fund Balance $56,853,000 $56,853,000 $48,394,048 REVENUES Transfers $13,885,940 $- $6,748,150 Grants and Recovered Costs 106,604 282,692Contributions - 344,650Interest 300,000 3,246,172 300,000 Total Revenues $14,292,544 $3,873,514 $7,048,150 EXPENDITURES CIP Administration $6,968,897 $108,883 $2,244,906 CIP Technology $245,975 $7,592 $238,810 CIP Street Projects 2,987,435 $68,993 1,418,668 CIP Traffic Projects 2,238,018 35,407 2,063,858 CIP Park Projects 961,273 200,354 886,916 FN American Rescue Plan 2021 - 286Total Expenditures $13,401,598 $421,515 $6,853,158 Income/(Loss) 890,946 3,451,999 194,992 Ending Fund Balance $57,743,946 $60,304,999 $48,589,040
The Capital Improvement Projects Fund accounts for capital projects for streets, traffic, and parks.
CIP Admin, $108,883
CIP Technology, $7,592
CIP Street Projects, $68,993
CIP Traffic Projects, $35,407
CIP Park Projects, $200,354
2023 CIP EXPENDITURES
CAPITAL IMPROVEMENTS PROJECTS FUND
Project Updates
Gold Strike Park:
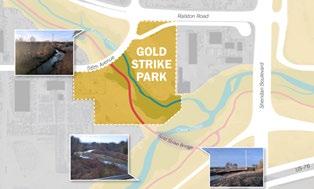
Gold Strike Park sits at the confluence of Clear Creek and Ralston Creek in Arvada and is listed on the State Registrar of Historical Places as the site where gold was first documented in Colorado. Efforts to turn the 14-acre site into a community space for historical and ecological explorations began over 45 years ago. With the goal of finally fulfilling Gold Strike Park’s full potential, the City has launched a park design effort to create a commemorative and special place for outdoor enjoyment and sharing the rich history of Arvada at what is considered the eastern entrance to the City.
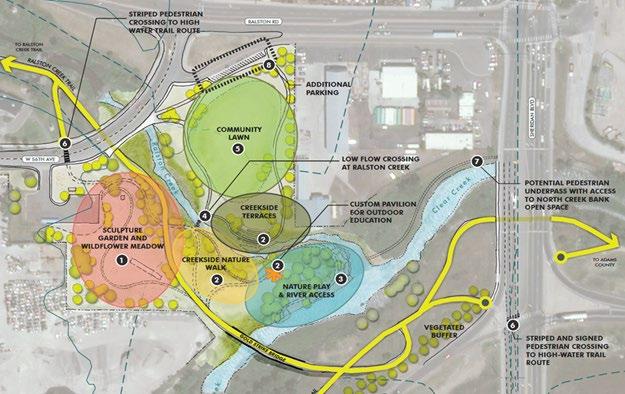
The park design effort builds on: the 2000 Gold Strike Park Master Plan, where it’s first acknowledged as the “Gateway to the City”; the 2016 Parks, Trails, and Open Space Master Plan, where it’s designated as a Historical Site, a Park Improvement Priority Project, a Ralston Creek Trail Regional Trail Connection, and a Potential Clear Creek Regional Trail Connection; and the 2019 Clear Creek Corridor Plan (CCCP), where the park is called out as Opportunity Site #2. In the CCCP, general areas shown below were identified and programmed by the community:
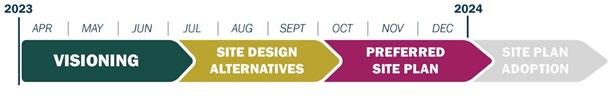
This project builds on previous planning recommendations and community input as described above. Engagements planned for 2023 will further inform the development of a holistic schematic design for Gold Strike Park that will be taken into construction documentation and phased for construction. The first engagement window begins at the Kite Festival, continues with a virtual public meeting scheduled for May 5th, and concludes with the closing of the public survey a couple weeks thereafter. Over the summer the second engagement window will present schematic design alternatives to the public for feedback which will inform a final park design that will be shared back in the fall in a final engagement window.
This project is the realization of decades of city planning, and close collaboration with multiple outside agencies including the Mile High Flood District (MHFD), CDOT, Jefferson County, Adams County, the Arvada Historic Society, educational institutions, and others. Parks and Urban Design (P+UD) department has already identified funding for the design, public engagement, and a phase 1 of construction scope to be determined. P+UD has also identified potential grant opportunities through MHFD for flood mitigation, and Jefferson County for acquisitions and/or regional trails.
16
1) Sculpture garden and wildflower meadow; 2) Creekside outdoor education programs; 3) Nature play & river access; 4) Ralston Creek low-flow crossing; 5) Community lawn; 6) Safe at-grade crossings 56th Avenue and Sheridan Blvd; 7) Pedestrian access under Sheridan on the north side of the creek; 8) Additional parking.
Water Fund Overview
The Water Fund accounts for all activities within the scope of the water utility operations including administration, operations, capital water projects, financing and related debt service and billing and collection.
Revenue Highlights
• Water Charges revenue has increased as a result of the new water consumption rate and the new bi-monthly water service fee.
• Tap Fees revenue increased due to a large new construction project. The timing of new construction projects, are not consistent from year-to-year so Tap Fees revenue vary.
Expenditure Highlights
• The Major Capital Maintenance expenditures increased because of the Water Meter Replacement project.
• Capital expenditures increased due to a payment for the Gross Reservoir expansion project occurring in the 1st quarter of 2023 and not a corresponding payment in 2022.
*$28,748,700 of the Fund Balance is a cash escrow reserved in Denver Water’s name and related to the Gross Reservoir expansion. The Water Fund’s overall obligation is expected to total $110 million through 2026
17 ENTERPRISE
FUNDS
Water Fund 2023 Budget As of 03/31/23 As of 03/31/22 Beginning Fund Balance $130,800,000 $130,800,000 REVENUES Water Charges $30,643,493 $4,257,948 $3,753,388 Tap Fees 10,372,000 4,222,204 987,062 Interest 686,104 491,343 239,623 Other 53,063,768 519,937 598,225 Total Revenues $94,765,365 $9,491,432 $5,578,299 EXPENDITURES Ongoing $29,403,851 $4,463,336 $4,088,234 Debt Service 3,100,000 (2,023)Major Capital Maintenance 7,228,104 491,506 277,252 Capital 60,520,467 1,621,840 908,236 Total Expenditures $100,252,422 $6,574,660 $5,273,721 Income/(Loss) (5,487,057) 2,916,772 304,577 Ending Fund Balance $125,312,943 $133,716,772
Wastewater Fund
Overview
The Wastewater Fund accounts for all activities necessary in the collection, transmission and disposal of sewage and wastewater.
Revenue Highlights
• Sewer Charges and Tap Fees revenues increased due to the new wastewater rate, the new bi-monthly service fee and the large new construction project.
• Other revenue decreased due to a retainage fee being refunded in 2022 from Jefferson Center Metropolitan District (JCMD) for the Alkire Lift project and there was not similar revenue in 2023.
Expenditure Highlights
• Major Capital Maintenance expenditures decreased due to the Trenchless Sewer Construction project having activity in 2022 and there were no maintenance projects in 2023.
• Capital expenditures increased because of the Ralston Trunk Sewer Improvement project and the North Trunk Sewer Improvement project in 2023 and no projects in the 1st quarter of 2022.
18 ENTERPRISE FUNDS
Wastewater Fund 2023 Budget As of 03/31/23 As of 03/31/22 Beginning Fund Balance $57,408,000 $57,408,000 REVENUES Sewer Charges $14,814,322 $3,541,863 $3,237,266 Tap Fees 3,022,443 461,580 89,988 Interest 208,090 101,033 14,803 Other 51,507,393 7,385 91,973 Total Revenues $69,552,248 $4,111,861 $3,434,029 EXPENDITURES Metro District $10,274,700 $2,290,451 $2,500,435 Ongoing 8,522,054 865,876 715,782 Major Capital Maintenance - - 433,292 Capital 12,065,954 103,100 8,935 Total Expenditures $30,862,708 $3,259,426 $3,658,445 Income/(Loss) 38,689,540 852,435 (224,415) Ending Fund Balance $96,097,540 $58,260,435
Stormwater Fund
Overview
The Stormwater Fund accounts for all activities necessary to maintain a stormwater management plan.
Revenue Highlights
• Stormwater Fee revenue increased due to the new-bi-monthly service fee
Expenditure Highlights
• Ongoing expenditures increased because of The Capital expenditures decreased due to the large payments for the Ralston Creek at Ward Road project in 2022 whereas there were minimal capital project expenditures in the 1st quarter of 2023.
19 ENTERPRISE
FUNDS
Stormwater Fund 2023 Budget As of 03/31/23 As of 03/31/22 Beginning Fund Balance $4,523,000 $4,523,000 REVENUES Stormwater Fee $4,014,289 $1,067,229 $1,037,043 Other 104,345 33,805 21,285 Total Revenues $4,118,634 $1,101,034 $1,058,328 EXPENDITURES Ongoing $3,180,835 $478,858 $455,681 Debt Service 864,237 216,059 215,527 Capital 3,768,645 35,919 677,201 Total Expenditures $7,813,717 $730,836 $1,348,409 Income/(Loss) (3,695,083) 370,198 (290,081) Ending Fund Balance $827,917 $4,893,198
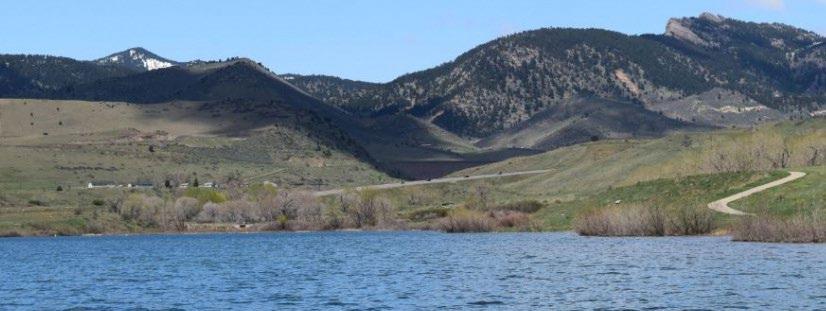
Golf Fund
Overview
The Golf Course Fund accounts for all revenues and expenses of the Lake Arbor and West Woods Golf Courses, including food service operations.
Revenue Highlights
• Overall revenues increased in the 1st quarter 2023 by $184,445 or 29.3% from 2022.
• Golf course revenue increased quite a bit, by 40.5% or $109,958 over 2022 numbers. The snowy weather was a factor in January and February, but it did not seem to affect revenue or golf rounds played. In fact, golf rounds played increased by 24% in the 1st quarter of 2023.
• Restaurant revenue increased as well from 2022, by $70,353 or 24.9%.
Expenditure Highlights
• Overall first quarter expenditures increased by $320,617 or 27.7% over 2022.
• In order to keep up with the higher demand from golf and restaurant customers, expenditures increased in relation to increased revenue. The annual lease payment for the golf carts was also made in March of 2023 versus May of 2022. This payment is $194,000.
Golf Rounds by Type - January - March
20 ENTERPRISE FUNDS
Golf Fund 2023 Budget As of 03/31/23 As of 03/31/22 Beginning Fund Balance $(48,000) $(48,000) REVENUES Golf Courses $5,096,091 $381,489 $271,531 Restaurants 2,322,200 352,864 282,511 Construction Revenue - -City Cash Transfer 282,570 78,810 74,676 Total Revenues $7,700,861 $813,163 $628,718 EXPENDITURES Golf Courses $2,847,847 $408,649 $386,057 Restaurants 2,149,305 363,112 295,755 Administration 2,652,182 706,433 475,765 Capital -
Total Expenditures $7,649,334 $1,478,193 $1,157,576 Income/(Loss) 51,527 (665,030) (528,858) Ending Fund Balance $3,527 $(713,030)
- -
Player Support Super Users Annuals Super Users Clubs Tournament/ Corp Leagues Grow the Game Total West Woods 2022 1,616 330 - 115 1 2,062 2023 1,832 445 - - 33 2,310 Variance 216 115 - (115) 32 248 13% 35% 0% 0% 3200% 12% Lake Arbor 2022 1,070 509 - - - 1,579 2023 1,601 595 - - - 2,196 Variance 531 86 - - - 617 50% 17% 0% 0% 0% 39% Combined Rounds Total 2022 2,686 839 - 115 1 3,641 2023 3,433 1,040 - - 33 4,506 Variance 747 201 - (115) 32 865 28% 24% 0% 0% 3200% 24%
Solid Waste Fund
Overview
In 2020, the Arvada City Council approved a new waste and recycling program. The City entered into an agreement with a single trash company to provide waste and recycling collection for residents. The trash and recycling services started in July 2021
Revenue Highlights
• Total Revenue increased from more customers receiving trash and recycling services. There were 489 new customers in the past year.
Expenditure Highlights
• The Operating expenditures decreased due to a one-time purchase in 2022. Replacement parts for the trash and recycling carts were purchased.
21 ENTERPRISE FUNDS
Solid Waste Fund 2023 Budget As of 03/31/23 As of 03/31/22 Beginning Fund Balance $405,000 $405,000 REVENUES Charges & Fees $4,185,030 $1,105,678 $1,013,657 Other 263,987 24,262 1,045 Total Revenues $4,449,017 $1,129,940 $1,014,702 EXPENDITURES Operating $4,095,778 $640,149 $800,270 Debt Services 490,000 -Other - -Total Expenditures $4,585,776 $640,149 $800,270 Income/(Loss) (136,759) 489,790 214,432 Ending Fund Balance $268,241 $894,790
Internal Service Funds Overview
There are five Internal Service Funds – Insurance Fund (Risk Management), Computer Fund, Print Services Fund, Vehicles Fund and Building Fund. Internal Service Funds charge internal programs and departments for use of goods and services. The Funds then pay for all associated costs of things such as purchasing insurance, vehicle purchases and maintenance, computer purchases and maintenance, and buildings maintenance.

Insurance Fund
Overview
The Insurance Fund, administered by the Risk Management Program of the City Attorney’s Office, accounts for the City’s self-insurance against loss. It is funded with contributions by all City departments and programs based on their levels and types of exposure. The Fund is also used for loss prevention programs, the protection of City personnel and the preservation of City property and assets.
*Per GASB Statement 10, an additional $3,210,034 in cash is currently held in the Risk Management fund to cover potentially incurred liabilities as of the beginning of the year. This figure was reached by the Risk Management’s actuary for 2022.
Revenue Highlights
• Revenues increased $227,929 or 33.6% over 2022.
• Contributions to the Insurance fund from other funds increased $245,941 or 39.1%, in order to cover premium cost increases.
• Recovered costs decreased $33,084 or 95.3%, due to lower amount of claims recovered in Q1 of 2022.
Expenditure Highlights
• Overall expenditures increased $108,617 or 16.7% over 2022.
• Workers compensation claims increased $35,116 or 38.2% over 2022 due to an increase in claim costs.
• Property claims increased $52,729 or 23.9% over 2022 due to increased premium costs, continued work from several water damage claims in 2022, and emergency repair of sewer trunk line.
• Liability claims decreased $11,361 or 8.0% partially due to delay in payments of claims on sewer trunk line damage and overall lower amount of claims in comparison to 2022.
22 INTERNAL SERVICE FUNDS
Insurance Fund 2023 Budget As of 03/31/23 As of 03/31/22 Beginning Fund Balance $1,896,000 $1,896,000 REVENUES Contributions $3,469,066 $875,546 $629,606 Interest 66,000 29,337 14,264 Other - 1,626 34,709 Total Revenues $3,535,066 $906,509 $678,579 EXPENDITURES Risk Management Administration $2,760,753 $643,477 $560,613 Risk Management Operations 605,550 116,544 90,792 Total Expenditures $3,366,303 $760,022 $651,405 Income/(Loss) 168,763 146,487 27,174 Ending Fund Balance $2,064,763 $2,042,487 $27,174
Computer Fund
Overview
The Computer Fund provides resources for both ongoing maintenance and replacement of the City’s computers, network hardware, and other electronic infrastructure. It is funded with contributions by all City departments based on their levels of use of this technology.

Revenue Highlights
• Other Revenues increased due to a larger accounting adjustment entry for daily interest in 2023 than the same entry made in 2022. The interest rate earned is higher this year compared to last year’s rate.
Expenditure Highlights
• Maintenance expenditures decreased as a result of a purchase in 2022 that did not have a corresponding transaction in 2023 and an accounting error. Verizon cell phone plans were charged to the wrong fund in 2022 and then corrected later in the year. Technology security software was paid for in the 1st quarter of 2022 while the same charge did not occur during the 1st quarter of 2023.
• Replacement expenditures increased due to the MARC Core radio system being upgraded.
23 INTERNAL SERVICE FUNDS
Computer Fund 2023 Budget As of 03/31/23 As of 03/31/22 Beginning Fund Balance $13,400,000 $13,400,000 REVENUES Maintenance $2,672,221 $716,994 $659,132 Replacement 1,948,381 566,699 649,986 Other 238,000 868,135 35,819 Total Revenues $4,858,602 $2,151,829 $1,344,937 EXPENDITURES Maintenance $2,851,939 $616,568 $691,676 Replacement 4,492,240 210,328 56,481 Other 101,062 18,414 17,010 Total Expenditures $7,445,241 $845,310 $765,167 Income/(Loss) (2,586,639) 1,306,518 579,770 Ending Fund Balance $10,813,361 $14,706,518
INTERNAL SERVICE FUNDS
Vehicle Fund Overview
The Vehicles Fund provides resources for the maintenance and replacement of City vehicles and heavy equipment. It is funded with contributions by all City departments based on their vehicle inventory and use.
Revenue Highlights
• Overall revenues increased 41.3% from 2022. The increase in revenue is largely due to transfers from other departments for the purchase of new vehicles not included in the annual replacement contributions.
Expenditure Highlights
• Expenditures have increased slightly over 2022, by 6.5%. In the 1st quarter of 2023, the City purchased:
• 6 Ford F350 Utility Trucks
• 6 3500 Regular Cab with Utility Body
• 2 2023 Toyota 4Runners
• 2022 Big Tex Trailer
• John Deere Wheel Loader
• John Deere Open Tractor
• 2 2022 Ford F150
• 2023 2500 Crew Cab LT
• 2022 Ford F550 Crew Cab 4x4
• 2022 Ford F450 4x4 Super Cab
24
Vehicles Fund 2023 Budget As of 03/31/23 As of 03/31/22 Beginning Fund Balance $7,193,000 $7,193,000 REVENUES Maintenance Contributions $2,727,970 $654,210 $598,840 Replacement Contributions 3,844,370 862,297 737,933 Other 346,000 528,124 110,478 Total Revenues $6,918,340 $2,044,631 $1,447,251 EXPENDITURES Maintenance $3,274,666 $796,425 $799,782 Replacement 1,742,300 813,178 711,800 Total Expenditures $5,016,966 $1,609,603 $1,511,582 Income/(Loss) 1,901,374 435,027 (64,331) Ending Fund Balance $9,094,374 $7,628,027
Print Services Fund

The Print Services Fund provides ongoing operational support for the City’s printing needs.
Revenue Highlights
• Print shop revenue is down 7.5% from 2022 due to a decrease in print jobs.
• Copier revenue is down 25.3% due to a decrease in copier activities within departments.
Expenditure Highlights
• Print shop expenditures increased $125,288 or 90.4% in comparison to 2022, primarily due to a large equipment purchase and increased labor cost.
• In relation to copier expenses, with decreased activity by departments and increased printing cost, copier expenditures remained relatively the same as in 2022 and only saw a marginal increase of $257 or 1.5%.
Buildings Fund
The Buildings Fund provides resources for maintaining major portions of facility infrastructure as replacement becomes necessary. The primary types of infrastructure are HVAC equipment, parking lots, roofs, and carpet. It is funded with contributions by all City departments based on their facility occupancy.
Revenue Highlights
• Revenues include savings related to the Ameresco Energy Performance contract being transferred to the Buildings fund to help offset the original construction costs. Other revenues include interest on investments. 1st quarter 2023 has seen a 50.9% increase in revenue over the same period in 2022.
Expenditure Highlights
• Replacement spending includes Asset Planner Software and HVAC renovations at the Olde Wadsworth Shops. Also, air units at the Indiana Shops.
25 INTERNAL SERVICE FUNDS
Overview
Building Fund 2023 Budget As of 03/31/23 As of 03/31/22 Beginning Fund Balance $348,000 $348,000 REVENUES Replacement Transfers $1,080,795 $237,703 $163,862 Other 25,000 9,712 47 Total Revenues $1,105,795 $247,415 $163,909 EXPENDITURES Personnel $71,610 $15,041 $13,051 Replacement 729,563 59,757 1,218 Equipment - -Total Expenditures $801,173 $74,797 $14,269 Income/(Loss) 304,622 172,618 149,640 Ending Fund Balance $652,622 $520,618
Overview
Print Services Fund 2023 Budget As of 03/31/23 As of 03/31/22 Beginning Fund Balance $346,000 $346,000 $374,000 REVENUES Print Shop $200,000 $46,262 $43,076 Copiers 135,000 26,995 36,146 Total Revenues $335,000 $73,258 $79,221 EXPENDITURES Print Shop $271,421 $53,597 $48,331 Copiers 80,329 17,742 17,485 Equipment 11,500 53,949Total Expenditures $363,250 $125,288 $65,815 Income/(Loss) (28,250) (52,031) 13,406 Ending Fund Balance $317,750 $293,969 $387,406
Overview:
On November 6, 2018 the citizens of Arvada approved Ballot Issue 3F to fund improvements to Ralston Road and West 72nd Avenue. Municipal bonds are commonly used by cities to fund capital improvement projects. In 2018, the City finished paying off a previous bond issue, freeing up $4.5 million in annual payments already accounted for in the City’s current budget. “Debt re-authorization” allows the money from the previous bond to be applied to a new bond whose funds will be used for these new capital improvement projects.
Ralston Road - Yukon to Garrison Bond Project
Description: Ralston Road is an arterial roadway and a major east-west corridor for Arvada’s transportation network, serving 23,000 vehicle trips each day. It provides connectivity to major north-south corridors including three State Highways. The Regional Transportation District (RTD) operates five bus lines using portions of Ralston Road. The Citizens Capital Improvement Plan Committee has twice ranked Ralston Road improvements as the number one transportation priority and recommended it for funding to the City Council. The project also addresses concerns expressed in recent Arvada Citizen Surveys. The 2014 Comprehensive Plan generated transportation models indicating that the congestion, operation, and safety of Ralston Road will deteriorate with the build-out of the City, and roadways will perform at the lowest levels of services
Progress:
Roadway:
• During the first quarter of 2023, the contractor completed a significant amount of work on the south side of Ralston Rd. The following activities were completed on the south side of Ralston between Garrison and west of Carr St: aggregate base course, geogrid placement, bottom two lifts of asphalt paving. Contractor also performed removal of existing asphalt pavement between Balsam and Yukon streets and prepared the road base. Contractor is also working on completing the improvements (parking lot pavement, grading work and etc.) in temporary construction easements between Garrison and Carr St.
Drainage:
• The contractor also completed a significant amount of storm sewer and water line work on the south side of Ralston Rd between Balsam and Allison St, including manhole work, storm sewer pipe replacement, meter pit connections and waterline work. Currently, the contractor is working on a storm sewer and water line tie-in work on the south side of Ralston between Allison and Yukon streets.
• One sanitary sewer service line at Estes Street is found to be in bad condition and the project team is working with the city utilities team to identify the blockage and repair the sewer line.
Dry Utilities:
• Most of the dry utilities (Xcel, Comcast and Century link) work on the north side and part of the south side is done. Currently project team is coordinating with Xcel and century link for a couple of utility conflicts associated with the construction activities between Ammons to Yukon St.
Wet Utilities:
• Contractor completed the deep waterline tie in connection at Allison Street.
• Meter pit connections and fire hydrants work is ongoing on the south side of Ralston Rd between Ammons and Yukon St.
Challenges:
• Due to insufficient underground utility information there are significant amounts of dry utility conflicts found during the construction on south side as well.
• During the construction work, city utilities team found some of the additional sanitary sewer service lines which are in bad shape and had to replace them which caused additional financial burden on the project
• In the past few months the contractor is constantly working on filling the potholes and re-striping the road as soon as possible. Through the City’s social media outlets, the project webpage, and direct contact with project team members, the City attempts to explain the challenges of the construction zone and upcoming work and any road closures. The project team recognizes the challenges with a construction zone and the City and Contractor teams are taking all reasonable steps to avoid as much inconvenience as possible.
• Due to school being in session the contractor is not able to close the Balsam St to work on the underground storm sewer work and asphalt removal continuously. To avoid the inconvenience to the school, the contractor is planning this work during the summer break.
Next Steps:
• Contractor is working on completing the improvements in the Temporary construction easement area on the south side of the parcels between Garrison to Carr St. Once this work is completed the traffic will be shifted to southside in this stretch.
• Contractor is working on existing asphalt pavement removals, road base preparation, curb and gutter (flatwork), storm sewer and water line work from Balsam to Yukon St on south side of Ralston rd.
• Continue coordination with third party utility providers to relocate/remove utility conflicts with roadway construction.
26
3F BOND PROJECTS
Ralston Road Budget Actual Remaining Design $1,809,992 $1,999,518 $(189,526) Right-of-Way 4,861,539 4,892,769 (31,230) Construction 10,540,410 7,295,415 3,244,995 Miscellaneous 671,059 390,155 280,904 Total Project $17,883,000 $14,577,857 $3,305,143
Ralston Road 72nd Avenue
W.
72nd Avenue Bond Project
Description: W. 72nd Avenue is an arterial parkway and a major east-west corridor for Arvada’s transportation network, serving 21,000 vehicle trips each day. It provides connectivity to major north-south corridors including three State Highways. The regional corridor not only serves all of Arvada, it provides access to Westminster and Golden/Jefferson County. The Citizens Capital Improvement Plan Committee twice ranked improvements to W. 72nd Avenue as a high priority. The project also meets concerns expressed in recent Arvada Citizen Surveys. The 2014 Comprehensive Plan generated transportation models indicating the congestion, operations, and safety of W. 72nd Avenue will deteriorate with the build-out of the City and roadways will perform at the lowest levels of service.
Progress:
• Construction Package 1 - CP-1 (tree removal, utility relocation for the entire corridor, and new utilities). Xcel, Comcast, and Lumen are working to relocate utilities in the corridor. SEMA has met their contract deadline and is complete with CP-1.
• Construction Package 2 - CP-2 (Swadley to Oak). Work includes utilities and full roadway reconstruction. 100% Plans signed/stamped were received in February 2022. CP-2 began in March 2022. Currently, CP2 is on schedule to be completed in Feb 2024. Some delays have been experienced due to dry utility companies’ failure to relocate their facilities; however they have not impacted the critical schedule. CP-2 is $22.6 million.
• Construction Package 3 - CP-3 (Oak to Kipling, including the UPRR underpass) has five components: 1) bridge structure; 2) railroad shoofly; 3) temporary vehicular bypass; 4) roadway design plans; and 5) Construction and Maintenance Agreement (C & M Agreement), which are at varying stages of review by UPRR (Union Pacific Railroad) and the City. UPRR reviews have been occurring outside the expected timelines. 60% bridge plans have been returned with comments from UPRR in April 2023. The team is working on the next steps to achieve approval from UPRR. Anticipated Notice to Proceed is Q2 of 2024.
• Project scheduling will remain fluid until there is a better understanding of the UPRR coordination and response time. Construction Package 2 underway. UPRR reviews and timelines continue to be unpredictable. The length of the UPRR review process has now created a gap between the completion of CP-2 and the expected start of CP-3 will remain fluid until there is a better understanding of the UPRR coordination and response time. Construction Package 2 underway. UPRR reviews and timelines continue to be unpredictable. The length of the UPRR review process has now created a gap between the completion of CP-2 and the expected start of CP-3 Project Challenges:
• For the underpass excavation component of CP-3, the project team is developing a plan to mitigate underpass excavation and dewatering issues and possible environmental issues. Options include discharging groundwater to the public sanitary sewer system and treating for heavy metals using a Baker Truck removal system, thus allowing discharge into the storm sewer system. A possible test hole is being considered at a City-owned property at the 72nd and UPRR intersection to better understand the dewatering method needed to waterproof the underpass excavation limits.
• Sonheim Underground Stream - The project team is assessing how the underpass may cut off underground stream flow to several properties on the south side of 72nd. A french drain is being proposed to recharge the water table in that location. Assessments are ongoing.
• UPRR has returned 60% bridge plans with comments during April 2023. Remaining and new comments are currently being addressed. Meanwhile the City is looking for other approaches to get more timely and effective responses from the UPRR in order to get the 60% plan finalized and move on to the next phase.
• The project team continues to work with dry utility contractors to get their infrastructure relocated and to keep our contractor, SEMA, moving on the roadway and utility portion of the project Right of Way (ROW):
• 71 of the 72 parcels to be acquired have been closed. The final parcel is expected to close soon.
• Temporary easements were extended for 20 parcels using the 6-month option in the agreements. Work is complete in the remaining temporary easements
Other Challenges:
• The Arvada’s citizens’ interest remains high in the construction progress. The City’s team of representatives continues to respond to all inquiries in a professional and timely fashion.
• Comments from our citizens range from temporary/permanent fence, traffic, signals, walls, potholes, stairs, and safety.
• Many of the homeowners are pleased with the work done to their property such as driveway replacements.
• The project team has made a significant effort to keep all users safe during construction.
• We have been coordinating with both schools in the area to understand typical drop-off and pick-up patterns.
• Periodically we have project team members at the major intersections to remind students/pedestrians to be safe while waiting to cross the street.
• We have lowered the speed limit through the construction zone to 25 mph.
• We have asked the Arvada Police Department to periodically enforce through the construction zone. We have seen the police department doing just that at different times over the last few months.
• We have deployed digital speed signs to inform drivers of their speed and hopefully make them aware that they should slow down.
• We have circulated pedestrian maps to show the public which sidewalks are open through the construction zone.
Next Steps:
• Continue working with the UPRR to have them review plans in a timely manner and to get the on-site visit review complete. The City to begin negotiation of the C & M (Construction and Maintenance) Agreement in late 2023.
• Continue development of a construction organizational chart to allow the City team to forecast construction staffing needs for the different construction packages. Inspections will be a combination of City staff and Owner’s Rep staff.
• Continue coordination efforts with stakeholders, including the UPRR, Xcel Energy, Jefferson County School District, and Lincoln Academy, to allow a smooth transition from design to construction. The project team has worked with zero injuries and zero lost work days.
27 3F BOND
72nd Avenue Budget Actual Remaining Design $2,915,584 $4,768,240 $(1,852,656) Right-of-Way 5,550,000 5,603,806 (53,806) Professional Services 2,695,226 2,343,834 351,392 Construction 53,339,190 12,591,573 40,747,617 Total Project $64,500,000 $25,307,453 $39,192,547
PROJECTS
Investment Portfolio Objectives
The City maintains a conservative investment policy with the primary objectives of safety, liquidity and yield. Consistent with this policy, the portfolio of securities is invested in U.S. Treasuries, U.S. Agencies; local government investment pools (LGIPs), commercial paper, and corporate debt subject to rating restrictions and concentration limits which are outlined in the City’s investment policy. The City-managed investment portfolio is administered to provide sufficient liquidity to meet all reasonably anticipated operating cash needs without selling securities prior to maturity. The portfolio controlled by PFM is actively managed which means that investments may be sold prior to maturity and reinvested in order to achieve the desired duration, yield or diversification of the portfolio.
The first quarter of 2023 saw two more Fed rate hikes despite the market uncertainty. The new target range for the short-term fed funds rate is 5.00%. The markets are facing increased volatility after two large bank failures and the takeover of a third. While the U.S. banking system is resilient and sound, the tightening of credit conditions for consumers and businesses will impact inflation, the labor market and overall economic activity. Stubbornly high inflation led to a rise in Treasury yields which peaked in early March. This was followed by the biggest 3-day slide since 1987 with yields falling over 100 bps. As shorter rates peaked, the 2- and 10- year spread saw its largest inversion in over 40 years when spreads reached 108 bps. Spreads for investment-grade corporates saw a sharp but short-lived widening in March as a result of a volatile credit markets. The bid spreads for federal agencies and supranationals remain wider than normal. The CPI index for March fell slightly to 5% and the unemployment rate remains low at 3.5%.
The City’s total investment portfolio increased to $305 million. It has increased by over $37 million on a year-over-year basis. Strong sales tax revenues and delayed spending on some CIP projects allowed most of the new money to be allocated to US Agencies, Treasuries and Municipal Bonds. The City continues to add callable issues to its portfolio with call protection options. The yields on LGIPs increased 75 bps. The overall allocation of the portfolio remained balanced with 65% in Treasuries and Agencies, 24% in corporate and municipal debt, and about 11% in liquid assets.
At the end of the first quarter of 2023, the yield in the City-managed portfolio was 2.26% and 1.88% in the PFM portfolio, both up over 75 bps from last year. Interest earnings increased by $761,136 due to the overall portfolio growth and higher yields.
Neither the City’s or PFM’s portfolio saw any significant changes to the duration this year. Higher yield-to-maturity at market indicates that the
PORTFOLIO CHANGES
28 CITY OF ARVADA INVESTMENT REPORT
Par Value as of 3/31/23 Par Value as of 3/31/22 Difference CITY-MANAGED PORTFOLIO MM/Savings/ Cash $12,561,339 $6,487,810 $6,073,529 LGIP 21,154,227 28,587,046 (7,432,819) Time CD - 3,185,457 (3,185,457) Corporate 32,068,000 23,669,000 8,399,000 Municipal 21,850,000 22,350,000 (500,000) US Agency 140,036,000 106,000,000 34,036,000 US Treasury 22,000,000 23,000,000 (1,000,000) Subtotal - City $249,669,566 $213,279,313 $36,390,253 PFM-MANAGED PORTFOLIO Negotiable CD $- $- $Corporate 16,210,000 10,950,000 5,260,000 Municipal 3,480,000 3,220,000 260,000 US Agency 11,115,000 20,895,000 (9,780,000) US Treasury 24,525,000 19,120,000 5,405,000 Subtotal - PFM $55,330,000 $54,185,000 $1,145,000 CONSOLIDATED PORTFOLIO MM/Savings/ Cash $12,561,339 $6,487,810 $6,073,529 LGIP 21,154,227 28,587,046 (7,432,819) Time CD - 3,185,457 (3,185,457) Negotiable CD - -Corporate 48,278,000 34,619,000 13,659,000 Municipal 25,330,000 25,570,000 (240,000) US Agency 151,151,000 126,895,000 24,256,000 US Treasury 46,525,000 42,120,000 4,405,000 Total - Combined $304,999,566 $267,464,313 $37,535,253 CONSOLIDATED MATURITY DISTRIBUTION CONSOLIDATED PORTFOLIO ALLOCATION MM/Savings/Cash 4.1% LGIP 6.9% Corporate 15.8% Municipal 8.3% US Agency 49.6% US Treasury 15.3% 0.0% 5.0% 10.0% 15.0% 20.0% 25.0% 30.0% 0-.25 .25-1 1-2 2-3 3-4 4-5 13.1% 6.4% 19.2% 27.1% 21.1% 13.0% Maturity (years)
matured securities will be re-invested at higher rates and the average yield on the portfolio will increase over time along with its investment earnings.
The market value of the portfolio is down due to higher current yields. The total unrealized loss is $13.6 million. Because the City holds its investments till maturity, the securities mature at par and no loss is realized. PFM may sell securities prior to maturity in order to reinvest the proceeds into a more attractive investment with higher potential future earnings.
The City’s investment policy requires a minimum A- rating from two credit rating agencies. The Credit Quality graph is based on the S&P rating only, the other two agencies are Moody’s and Fitch. The City’s portfolio of invested securities is comprised of: 92% in the AAA and AA category, 8% in the A category and 0.3% that are rated BBB+.
Investment Management Focus - 2023
CREDIT QUALITY (S&P RATING)
• The Fed is expected to continue to reduce its balance sheet holdings and anticipates additional policy firming to return inflation to 2%. The City may slightly reduce the portfolio duration by the end of the year to take advantage of the higher rates on short-term yields.
• To utilize excess cash, the City will tap into liquidity from the LGIPs. The yields in the LGIP pools continue to rise along with the Fed interest rates. Monthly yields on the LGIPs are averaging 4.77% and above for March.
• Investment-grade corporate spreads are getting wider and may look more attractive in 2023. The City will be selective in this sector but will look to re-invest few bonds as the current corporate bonds mature.
• The supply in municipal bonds sector has slowed down with the increasing interest rates. The city will continue to look for any attractive opportunities in this sector.
• The Federal Agencies’ spreads have been lifting especially on the callable options. With the rising interest rates the risk of securities being called before maturity is lower. The City will look to increase its allocation to callable Agencies in the shorter maturity buckets while balancing it with the bullets (non-callable) on the longer end.
29 CITY OF ARVADA INVESTMENT REPORT
PORTFOLIO CHARACTERISTICS 3/31/2023 3/31/2022 Difference City Interest Earnings $1,324,428 $538,390 $786,038 PFM Interest Earnings 187,225 212,126 (24,902) Total Interest Earned $1,511,652 $750,516 $761,136 YTD City Portfolio Yield 2.26% 1.07% +119 bps YTD PFM Portfolio Yield 1.88% 1.13% +75 bps YTD Benchmark 3.68% 0.46% +322 bps PORTFOLIO PERFORMANCE City PFM Duration to Maturity (yrs) 2.14 2.35 Yield to Maturity at Cost 2.170% 1.910% Yield to Maturity at Market 4.230% 4.210% City PFM Total Par Value $249,669,566 $55,330,000 $304,999,566 Book Value 249,334,945 55,009,935 304,344,880 Market Value 238,052,537 52,625,402 290,677,939 Unrealized Gain /(Loss) $(11,282,408) $(2,384,533) $(13,666,941)
ACCOUNT SUMMARY
AAA category, 11.5% AA category, 80.2% A category, 8.0% BBB+ category, 0.3%
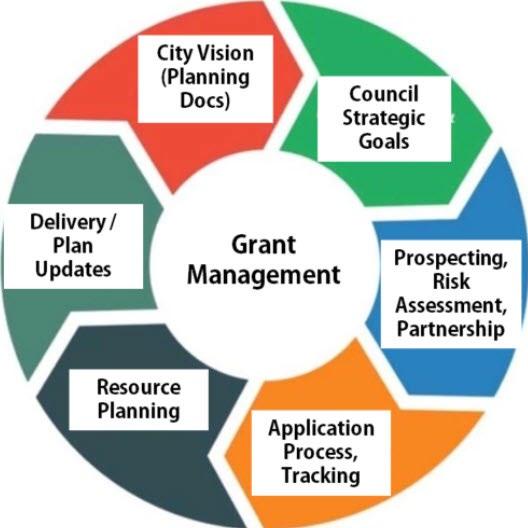
GRANT INFORMATION
Overview:
The City is in the proecess of implementing AmpliFund, a grants management software. Future financial updates will include additional information.
30
t
aWarDeD
tOtaL
Grants ManaGeMent PrOsPeC tInG
BD PenDInG Grant reQUests (2023) $2,858,823
(2022) $7,713,481
reM aInInG Grant BaL anCe $21,619,767
Safe Community
BY 12/23, PUBLIC SAFETY STAFFING LEVELS WILL BE AT 95% FILLED
By 12/24, continue to utilize the recruitment and retention plan on a yearly basis
By 12/24, continue use of an over-hire strategy to leverage access to quality candidates and be fully staffed
By 12/20, Create performance measures documenting the amount of and reasons for officer attrition
BY
12/23, UPDATE WATER, SEWER, STORMWATER MASTER PLANS AND DEVELOP AN IMPLEMENTATION PLAN TO ADDRESS ALL FINDINGS
By 12/21 complete the Water Master Plans
By 12/21, complete the Sewer and Stormwater Master Plans
Community and Economic Development
95% OF DEVELOPMENT PROJECT APPROVALS CONFORM TO THE CITY’S COMPREHENSIVE PLAN
By 12/20, complete and implement the updated Land Development Code through adoption and remapping
Completed
Completed
7/1/19-12/31/23
Completed
4/1/19-12/31/23
By 12/22, Create a sub-area plan for NW Arvada focused on place making Completed
31 WE DREAM BIG AND DELIVER
4/1/19-12/31/24
4/1/19-12/31/24
Completed Infrastructure
By 12/23, actions including conceptual project and operational changes to utilities programs necessary to implement the Master Plans are included in the 10 year CIP and performance budget
By 12/25, fully align Master Plans contained within the City’s Comprehensive Plan
Vibrant Community and Neighborhoods
BY 12/25, COMPLETE CURRENT IMPROVEMENTS TO RECOGNIZE ARVADA’S HISTORY
By 6/21 identify all historical resources to include in the plan
By 12/21, develop a collaboration system between the Chamber, Visitor’s Center, Historical Society and the City
By 12/23, partner with AURA in the development of a plan for activation of the Flour Mill in Olde Town
By 12/23, complete operational plan for display of the restored .04 Trolley
Organizational and Service Effectiveness
BY 12/24 BASED ON LONG-TERM FINANCIAL PROJECTIONS AND UPDATED MASTER PLANS, DEVELOP FINANCIAL RESILIENCY RECOMMENDATIONS TO ENSURE ADEQUATE AND ONGOING INVESTMENT IN CITY INFRASTRUCTURE AND CORE SERVICES.
By 12/2022 using information assembled as part of the 2023-2024 budget development process and current master planning efforts, prepare a summary of long range unfunded needs by work system Completed
By 12/2023 develop a city-wide consolidated level of service summary
By 12/2023 prepare an exhastive list of funding source opportunities for closing identified infrastructure and core service funding gaps
32 WE DREAM BIG AND DELIVER
3/31/22-12/29/23
2/1/23-12/29/23
4/1/19-6/30/21
2/1/20-12/31/21
2/1/20-12/31/23
9/1/22-12/31/23