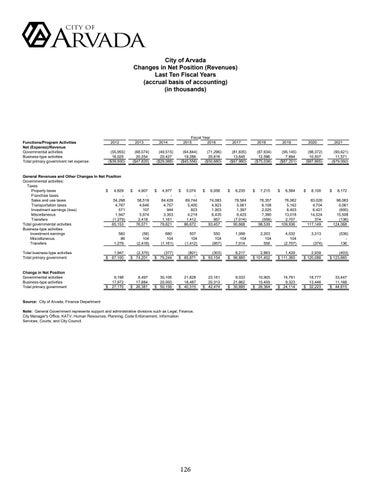
City of Arvada Changes in Net Position (Revenues) Last Ten Fiscal Years (accrual basis of accounting) (in thousands)
Functions/Program Activities Net (Expense)/Revenue Governmental activities Business-type activities Total primary government net expense
(55,955) 16,025 ($39,930)
General Revenues and Other Changes In Net Position Governmental activities: Taxes $ 4,829 Property taxes Franchise taxes 54,298 Sales and use taxes Transportation taxes 4,787 571 Investment earnings (loss) Miscellaneous 1,947 Transfers (1,279) 65,153 Total governmental activities Business-type activities 582 Investment earnings Miscellaneous 86 Transfers 1,279 Total business-type activities Total primary government
Change in Net Position Governmental activities Business-type activities Total primary government
(68,074) 20,254 ($47,820)
$
4,907 58,519 4,646 107 5,974 2,418 76,571
Fiscal Year 2016 2015
2014
2013
2012
(49,515) 20,427 ($29,088)
$
4,977 64,429 4,757 944 3,353 1,161 79,621
(64,844) 19,288 ($45,556)
$
5,074 69,744 5,400 823 4,219 1,412 86,672
(71,296) 20,616 ($50,680)
$
6,056
(81,635) 13,645 ($67,990)
$
6,235
(87,634) 12,596 ($75,038)
$
7,215
2020
2019
2018
2017
(95,145) 7,894 ($87,251)
$
6,584
(98,372) 10,507 ($87,865)
$
8,100
2021 (90,621) 11,571 ($79,050)
$
8,172
74,083 4,923 1,003 6,435 957 93,457
78,564 5,061 1,397 6,425 (7,014) 90,668
76,357 6,108 2,025 7,390 (556) 98,539
76,062 5,162 6,403 13,018 2,707 109,936
83,026 4,704 6,421 14,524 374 117,149
96,063 5,061 (600) 15,508 (136) 124,068
1,099 104 7,014
2,203 104 556
4,032 104 (2,707)
3,313 (374)
(539) 136
(56) 104 (2,418)
680 104 (1,161)
507 104 (1,412)
550 104 (957)
$
1,947 67,100
(2,370) $ 74,201
(377) $ 79,244
(801) $ 85,871
(303) $ 93,154
8,217 $ 98,885
2,863 $ 101,402
1,429 $ 111,365
2,939 $ 120,088
(403) $ 123,665
$
9,198 17,972 27,170
8,497 17,884 $ 26,381
30,106 20,050 $ 50,156
21,828 18,487 $ 40,315
22,161 20,313 $ 42,474
9,033 21,862 $ 30,895
10,905 15,459 $ 26,364
14,791 9,323 $ 24,114
18,777 13,446 $ 32,223
33,447 11,168 $ 44,615
Source: City of Arvada, Finance Department Note: General Government represents support and administrative divisions such as Legal, Finance, City Manager's Office, KATV, Human Resources, Planning, Code Enforcement, Information Services, Courts, and City Council.
126


