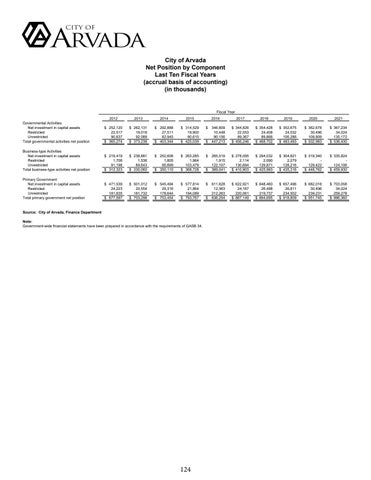
City of Arvada Net Position by Component Last Ten Fiscal Years (accrual basis of accounting) (in thousands)
Fiscal Year Governmental Activities Net investment in capital assets Restricted Unrestricted Total governmental activities net position
2012
2013
2014
2015
$ 252,120 22,517 90,637 $ 365,274
$ 262,131 19,018 92,089 $ 373,238
$ 292,888 27,511 82,945 $ 403,344
$ 314,529 19,900 90,610 $ 425,039
$
Business-type Activities Net investment in capital assets Restricted Unrestricted Total business-type activities net position
$ 219,419 1,706 91,198 $ 312,323
$ 238,881 1,536 89,643 $ 330,060
$ 252,606 1,805 95,699 $ 350,110
$ 263,285 1,964 103,479 $ 368,728
$
Primary Government Net investment in capital assets Restricted Unrestricted Total primary government net position
$ 471,539 24,223 181,835 $ 677,597
$ 501,012 20,554 181,732 $ 703,298
$ 545,494 29,316 178,644 $ 753,454
$ 577,814 21,864 194,089 $ 793,767
$
Source: City of Arvada, Finance Department Note: Government-wide financial statements have been prepared in accordance with the requirements of GASB 34.
124
2017
2018
2019
2020
2021
346,609 10,448 90,156 447,213
$ 344,826 22,053 89,367 $ 456,246
$ 354,428 24,408 89,866 $ 468,702
$ 352,675 24,532 106,286 $ 483,493
$ 362,678 30,496 109,809 $ 502,983
$ 367,234 34,024 135,172 $ 536,430
265,019 1,915 122,107 389,041
$ 278,095 2,114 130,694 $ 410,903
$ 294,032 2,090 129,871 $ 425,993
$ 304,821 2,279 128,216 $ 435,316
$ 319,340 129,422 $ 448,762
$ 335,824 124,106 $ 459,930
611,628 12,363 212,263 836,254
$ 622,921 24,167 220,061 $ 867,149
$ 648,460 26,498 219,737 $ 894,695
$ 657,496 26,811 234,502 $ 918,809
$ 682,018 30,496 239,231 $ 951,745
$ 703,058 34,024 259,278 $ 996,360
2016
$
$
$


