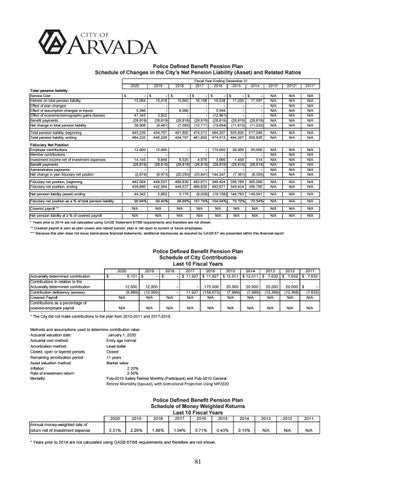
Police Defined Benefit Pension Plan Schedule of Changes in the City’s Net Pension Liability (Asset) and Related Ratios 2020
Fiscal Year Ending December 31 2017 2016 2015 2014
2013*
2012*
2011*
- $ - $ - $ - $ - $ - $ 15,084 15,416 15,663 16,108 16,538 17,200 17,597 5,396 6,060 5,548 47,345 3,922 (12,961) (28,819) (28,819) (28,818) (28,819) (28,819) (28,819) (28,819) 39,006 (9,481) (7,095) (12,711) (19,694) (11,619) (11,222)
N/A N/A N/A N/A N/A N/A N/A
N/A N/A N/A N/A N/A N/A N/A
N/A N/A N/A N/A N/A N/A N/A
Total pension liability, beginning Total pension liability, ending
445,226 484,232
454,707 445,226
461,802 454,707
474,513 461,802
494,207 474,513
505,826 494,207
517,048 505,826
N/A N/A
N/A N/A
N/A N/A
Fiduciary Net Position Employer contributions Member contributions Investment income net of investment expenses Benefit payments Administrative payments Net change in plan fiduciary net positon
12,000 14,145 (28,819) (2,674)
12,000 9,846 (28,819) (6,973)
8,525 (28,818) (20,293)
4,978 (28,819) (23,841)
170,000 3,066 (28,819) 144,247
20,000 1,458 (28,819) (7,361)
20,000 514 (28,819) (8,305)
N/A N/A N/A N/A N/A N/A
N/A N/A N/A N/A N/A N/A
N/A N/A N/A N/A N/A N/A
Fiduciary net position, beginning Fiduciary net position, ending
442,564 439,890
449,537 442,564
469,830 449,537
493,671 469,830
349,424 493,671
356,785 349,424
365,090 356,785
N/A N/A
N/A N/A
N/A N/A
(8,028)
(19,158)
144,783
149,041
N/A
101.74%
104.04%
Total pension liability Service Cost Interest on total pension liability Effect of plan changes Effect of assumption changes or inputs Effect of economic/demographic gains (losses) Benefit payments Net change in total pension liability
$
2019
2018
Net pension liability (asset) ending
44,342
2,662
5,170
Fiduciary net position as a % of total pension liability
90.84%
99.40%
98.86%
N/A
N/A
70.70%
70.54%
N/A
N/A
N/A
Covered payroll **
N/A
N/A
N/A
N/A
N/A
N/A
N/A
N/A
N/A
N/A
Net pension liability at a % of covered payroll
N/A
N/A
N/A
N/A
N/A
N/A
N/A
N/A
N/A
N/A
* Years prior to 2014 are not calculated using GASB Statement 67/68 requirements and therefore are not shown. ** Covered payroll is zero as plan covers one retired person; plan is not open to current or future employees. *** Because this plan does not issue stand-alone financial statements, additional disclosures as required by GASB 67 are presented within this financial report.
Police Defined Benefit Pension Plan Schedule of City Contributions Last 10 Fiscal Years Actuarially determined contribution Contributions in relation to the Actuarially determined contribution Contribution deficiency (excess) Covered Payroll Contributions as a percentage of covered-employee payroll
$
2020
6,131
$
12,000 (5,869) N/A N/A
2019
- $
12,000 (12,000) N/A N/A
2018
N/A
2017 - $ 11,927 -
N/A
11,927 N/A
2016 $ 11,927 170,000 (158,073) N/A
N/A
2015 $ 12,011
2014 $ 12,011
20,000 (7,989) N/A
20,000 (7,989) N/A
N/A
N/A
N/A
2013 $ 7,632 20,000 (12,368) N/A N/A
2012 $ 7,632
2011 $ 7,632
20,000 $ (12,368) (7,632) N/A N/A N/A
N/A
* The City did not make contributions to the plan from 2010-2011 and 2017-2018. Methods and assumptions used to determine contribution rates: Actuarial valuation date: January 1, 2020 Actuarial cost method: Entry age normal Amortization method: Level dollar Closed, open or layered periods Closed Remaining amortization period: 11 years Asset valuation method: Market value 2.20% Inflation: Rate of investment return: 2.50% Mortality: Pub-2010 Safety Retiree Monthly (Participant) and Pub-2010 General
Retiree Mortality (Spouse), with Gnerational Projection Using MP2020
Annual money-weighted rate of return net of investment expense
2020
2019
3.31%
2.26%
Police Defined Benefit Pension Plan Schedule of Money Weighted Returns Last 10 Fiscal Years 2018
2017
2016
2015
2014
2013
2012
2011
1.88%
1.04%
0.71%
0.43%
0.15%
N/A
N/A
N/A
* Years prior to 2014 are not calculated using GASB 67/68 requirements and therefore are not shown.
81

