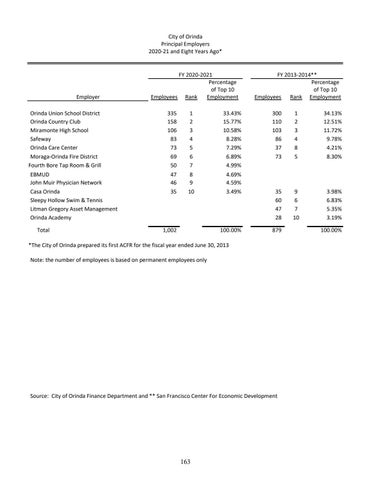
City of Orinda Principal Employers 2020‐21 and Eight Years Ago*
FY 2020‐2021 Percentage of Top 10 Employees Rank Employment
FY 2013‐2014** Percentage of Top 10 Employees Rank Employment
335 158 106 83 73 69 50
1 2 3 4 5 6 7
33.43% 15.77% 10.58% 8.28% 7.29% 6.89% 4.99%
300 110 103 86 37 73
1 2 3 4 8 5
34.13% 12.51% 11.72% 9.78% 4.21% 8.30%
EBMUD John Muir Physician Network Casa Orinda Sleepy Hollow Swim & Tennis Litman Gregory Asset Management Orinda Academy
47 46 35
8 9 10
4.69% 4.59% 3.49%
35 60 47 28
9 6 7 10
3.98% 6.83% 5.35% 3.19%
Total
1,002
Employer Orinda Union School District Orinda Country Club Miramonte High School Safeway Orinda Care Center Moraga‐Orinda Fire District Fourth Bore Tap Room & Grill
100.00%
879
*The City of Orinda prepared its first ACFR for the fiscal year ended June 30, 2013 Note: the number of employees is based on permanent employees only
Source: City of Orinda Finance Department and ** San Francisco Center For Economic Development
163
100.00%


