
28 minute read
Management’s Discussion and Analysis


INTRODUCTION City of Orinda Management’s Discussion and Analysis (MDA) June 30, 2021
As management of the City of Orinda (the City), we offer readers this discussion and analysis of the City’s financial performance for the fiscal year (FY) ended June 30, 2021. Please read this overview in conjunction with the letter of transmittal and the accompanying basic financial statements which follow.
OVERVIEW OF THE FINANCIAL STATEMENTS
This discussion and analysis is intended to serve as an introduction to the City's basic financial statements, which are comprised of three components:
Government-wide Financial Statements - These include the Statement of Net Position and
Statement of Activities. These statements provide information about the activities of the City as a whole and about the overall financial condition of the City in a manner similar to a private-sector business.
Fund Financial Statements - These statements provide additional information about the City's major funds, including how services were financed including fund balances available for financing future projects.
Notes to the Financial Statements - The notes provide additional detail that is essential to a full understanding of the information provided in the Government-wide and Fund Financial Statements.
GOVERNMENT-WIDE FINANCIAL STATEMENTS - DESCRIPTION
These statements include all assets and liabilities of the City using the accrual basis of accounting, which is similar to the accounting used by most private sector companies. All current year's revenues and expenses are accounted for regardless of when the cash is paid or received. These statements report the City's net position and changes to the net position during the Fiscal Year. Net position - the difference between assets and liabilities - is one way to measure the City's financial position. Over time, increases or decreases in the net position are among indicators used to assess whether the financial condition of the City is improving or deteriorating. The Statement of Activities and Changes in Net Position presents information showing how the City’s net assets for primary governmental activities have changed during the fiscal year. For the City of Orinda, governmental activities include: general government, police services, public works and engineering, parks, recreation and library, planning, and interest on bonds payable.
GOVERNMENT WIDE FINANCIAL STATEMENTS - ANALYSIS
The net position serves as an overall indicator of the City’s financial position. Table 1 provides a high level summary of year to year changes in the net position.
Table 1: SUMMARY OF NET POSITION June 30, 2021 and 2020
Governmental Activities
June 30, 2021 June 30, 2020 $ Change
% Change
Current and other assets $38,074,053 $37,571,118 $502,935 1.3% Capital assets 111,490,924 108,702,945 2,787,979 2.6% Total Assets 149,564,977 146,274,063 3,290,914 2.2%
Deferred Outflow of Resource 56,703 27,666 29,037 105.0% (Related to OPEB - Note 12)
Current liabilities 6,130,611 6,545,187 (414,576) -6.3% Noncurrent liabilities 46,559,081 48,178,504 (1,619,423) -3.4% Total Liabilities 52,689,692 54,723,691 (2,033,999) -3.7%
Deferred Inflow of Resources 261,050 249,626 11,424 4.6% (Related to OPEB - Note 12)
Net Position:
Invested in capital assets 63,759,559 62,775,273 984,286 1.6%
Restricted for:
Capital projects 3,496,524 3,611,710 (115,186) -3.2%
Special purpose projects 11,278,372 11,115,831 162,541 1.5% Unrestricted 18,136,483 13,825,598 4,310,885 31.2%
Total Net Position $96,670,938 $91,328,412 $5,342,526 5.8%
As illustrated in the table above, the City’s net position increased by $5.3 million (5.8%) during FY 20202021. This is primarily due to the following: Total assets increased by $3.3 million, due primarily to the additions to capital assets as the result of completion of infrastructure projects which accounted for 85% of the total change ($2.8 million). The change in current assets accounted for $0.5 million of the total increase. This was a combination of a reduction in restricted cash (including the expenditure of $3 million in GO bond proceeds) which was offset by the recording of a loan receivable in the Affordable Housing fund. The largest type of capital projects completed were various paving and road rehabilitation projects. The increase in capital assets were partially offset by $5.9 million in asset depreciation. Total liabilities decreased by approximately $2.0 million (-3.7%). Current liabilities totaled $6.1 million which was a decrease of approximately $415,000. This was primarily attributable to a decrease in accounts payable as of June 30, 2021. Non-current liabilities decreased by approximately $1.6 million. The primary contributing factors this change were: a reduction in longterm COP and GO bonds outstanding after the annual debt service payments; and a reduction of the OPEB Liability for Retiree Health Benefits. The OPEB reduction was achieved as a result providing additional funding to the OPEB Trust and updated calculations in a new actuarial study. The OPEB liability decreased by 80% from the amount reported in 2020.
The City reports certain deferred inflows and outflows related to OPEB (Retire Medical) on the government-wide Statement of Net Position. Deferred outflows of resources represent a consumption of net position/fund balance that applies to a future period and will not be recognized as an outflow of resources (expense/expenditure) until then. Deferred inflows of resources represent the acquisition of net position/fund balance that applies to a future period and will not be recognized as an inflow of resources (revenue) until that time. Deferred items reported as of June 30, 2021 (Outflow = $56,703 | Inflow = $261,050) have minimal impact on the total Net Assets.
The City’s nearly $63.8 million invested in capital assets represents 66% of total $96.7 million reported as net position. Capital asset investments include the City's investments in land, infrastructure, buildings, and equipment. As the City uses these capital assets to provide current services to residents, the assets are not available as a resource for future spending. The change in annual capital assets reflects both the addition of capital assets (including construction in progress), less accumulated depreciation. Table 2 provides a more detailed analysis of the changes that occurred between Fiscal Year 2020 and 2021. A comparison of the Statement of Activities is based on revenue, program expenses, and transfers. The program expenses are consolidated into six major activities. Similar to the previous Table, data is provided for both the current and previous fiscal year.
Table 2: SUMMARY OF CHANGES IN NET POSITION (June 30, 2021 and 2020)
As shown in Table 2 revenues from all sources totaled $26.7 million and expenses for all city programs totaled approximately $21.4 million in Fiscal Year 2020-2021.
June 30, 2021 June 30, 2020 $ Change % Change
Revenues:
Program revenues:
Charges for services $6,961,426 $6,168,260 $793,166 12.9%
Operating grants and contributions 331,698 867,374 ($535,676) -61.8%
Capital grants and contributions 1,017,913 3,505,205 ($2,487,292) -71.0%
General revenues:
Property Tax 10,824,872 10,350,583 474,289 4.6%
Sales Tax 3,139,364 2,449,156 690,208 28.2%
Franchise Taxes 1,161,418 1,152,773 8,645 0.7%
Transfer Tax 519,674 296,104 223,570 75.5%
Transient Occupancy Tax 34,660 49,763 (15,103) -30.3%
Rent and Interest 106,663 1,067,239 (960,576) -90.0%
Other 2,630,490 1,510,369 1,120,121 74.2%
Total Revenues 26,728,178 27,416,826 (688,648) -2.5%
Expenses:
General Government
Police Services
Public Works and Engineering
Parks, Recreation & Library
Planning
Interest on bonds payable Total Governmental Activities
Increase In Net Position
Net Position Beginning of Year
Net Position - End of Year
2,893,144 2,716,501 176,643 6.5% 4,439,418 4,236,572 202,846 4.8% 7,311,925 6,511,462 800,463 12.3% 4,169,449 4,725,088 (555,639) -11.8% 1,020,329 1,102,985 (82,656) -7.5% 1,551,387 1,602,013 (50,626) -3.2% 21,385,652 20,894,621 491,031 2.4%
5,342,526 6,522,205 (1,179,679) -18.1%
91,328,412 84,806,207 6,522,205 7.7%
$96,670,938 $91,328,412 $5,342,526 5.8%
Revenues
When compared to the previous year, overall revenues decreased by approximately $689,000 or -2.5%. The net change is made up of both increases and decreases. A significant portion of the decrease is in capital grants and contributions. In the previous fiscal year the City received disaster grant reimbursements of approximately $2.5 million arising from storm damage that occurred in 2017. One-time capital grants and grant revenue can fluctuate from year to year depending on the timing of grant funded projects. This was offset by a $1.4 million net increase in taxes (Property, Sales, Franchise, Transfer, and TOT). The increase in property tax is largely the result of increased assessed values. The Sales Tax revenue reflects one quarter of the new Measure R which is an add-on sales tax at a higher rate than the previous add-on tax. The interest revenue variance is impacted due to recording an unrealized gain in Fiscal Year 2019-2020 and based on market conditions the current year required recording an unrealized investment loss, based on market values at June 30th. The City continued to hold the investments and they are expected to mature at full value.
Expenses
Overall expenses as shown in the Statement of Activities increased by approximately $0.5 million or 2.4%. The largest factors contributing to the increase were increased costs of operation including contracted costs. Parks, Recreation & Library had a significant decrease of approximately $556,000. This was due to the temporary closure of facilities as well as the reduction in staff due to program curtailment as a result of the pandemic.
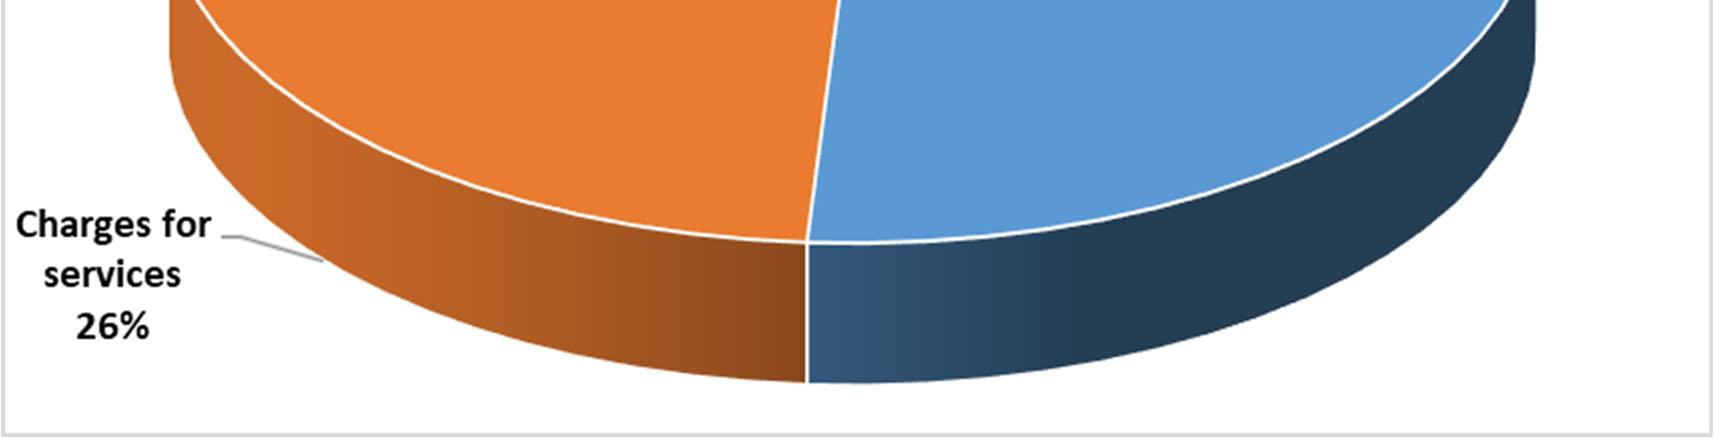
Revenues and Expenses by Category
The following chart presents the Government-Wide Fiscal Year 2020-2021revenue in a pie chart format. For analysis purposes this provides a layout which graphically provides the reader with a sense of relative comparison of the different types of Revenue. Approximately 79% of the revenues come from three sources Property Taxes, Sales Tax and Charges for Services.
Government-Wide Revenue By Type
The following chart presents the Government-Wide Fiscal Year 2020-2021 expenses in a pie chart format. For analysis purposes this provides a layout which graphically provides the reader with a sense of relative comparison of the different types of activities.
Government-Wide Expense By Activity
Approximately 74% of the $21.3 million in expenses are comprised three activities: 21% are attributable to Police Services; Public Works & Engineering account for 34% and Parks, Recreation, and Library account for 19% of the government wide expenses.
FUND FINANCIAL STATEMENTS
A fund is a grouping of related accounts that is used to maintain control over resources that have been segregated for specific activities or objectives. The City of Orinda, like other state and local governments, uses fund accounting to ensure and demonstrate compliance with finance-related legal requirements. The funds used by the City can be divided into three categories: Governmental funds, Proprietary funds, and Fiduciary funds.
Governmental funds
Governmental funds are used to account for essentially the same functions reported as governmental activities in the government-wide financial statements. However, unlike the government-wide financial statements, which focus on the long-term, governmental funds financial statements focus on short-term inflows and outflows of spendable resources and the balances of these resources that are available for spending. This information is useful in evaluating a government’s short-term financing requirements. To assist the user of these financial statements in understanding the differences and the relationship between the government-wide financial statements and the governmental funds financial statements, reconciliations between the two sets of statements have been included in this report. The City of Orinda maintains numerous individual governmental funds that, for financial reporting, are grouped according to their type (general fund, special revenue, capital projects, and debt service). In accordance with accounting standards, Major Funds are determined based on their relative size when measured among Governmental Funds. The examination compares expenditures, assets, liabilities, and revenues. Management may also include as Major Funds, those funds that are deemed of importance to the

users of the financial statements. All Major Funds are reported separately in the governmental funds statements. The criteria for defining a Major Fund can result in differences in the funds identified from one year to the next. In this report the Affordable Housing Fund is now presented as part of the Major Funds. All other funds are grouped together for reporting purposes (Other governmental funds). Major funds for the City of Orinda as of June 30, 2021 are: General Fund
City Capital Projects Community Facilities Maintenance Contra Costa Transportation Authority (CCTA) Affordable Housing Fund General Obligation Road Bonds 2016 Capital Project General Obligation Road Bonds 2014 – Debt Service General Obligation Road Bonds 2016 – Debt Service Other Governmental Funds (Note: Individual fund data for each non-major governmental fund is provided in combining statements included in the Other Supplementary Information section of this report).
FINANCIAL HIGHLIGHTS GOVERNMENTAL FUNDS
The following Table summarizes the activity in the Governmental Funds displaying at a high level of the revenues, expenditures and change in fund balances. Information for the 2014 GO Bond Debt Service & 2016 GO Bond Debt Service, is combined for this presentation. A consolidated number is presented for all Other governmental funds. As part of the overall ACFR the City has also provided information on individual funds later in the report. The total net change in fund balance for all Governmental Funds was a decrease of approximately $1.3 million. An analysis of the factors contributing to the change is discussed following Table 3.
TABLE 3: SUMMARY GOVERNMENTAL FUNDS REVENUES, EXPENDITURES, AND
OTHER CHANGES IN FUND BALANCES FOR THE FISCAL YEAR ENDED JUNE 30, 2021
General Fund
The General Fund is the principal operating fund and represents the most significant portion of Governmental Fund revenues and expenditures (69% of governmental revenue and 58% of expenditures). As of June 30, 2021, the fund balance was $15.3 million which was an increase of $1.9 million from the $13.3 million at the beginning of the year. The General Fund also includes general fund “Add-On Sales
General Fund Community Facilities Maint. CCTA City Capital Projects 2016 Road Bonds - Capital 2014 & 2016 Road Bonds Debt Service Affordable Housing
Other Governmental Funds
TOTAL Governmental Funds
Revenues
Current Expenditures Capital outlay Debt service
Total expenditures
Net transfers $16,926,645 $14,206 $474,525 $0 $3,702 $2,644,148 $1,937 $4,591,648 $24,656,811
$12,768,133 $ $5,617 $1,813 $104,966 -$ $ $1,540,880 $14,421,409 1,571,252 69,892 919,134 204,624 3,116,236 - 2,541,009 8,422,147
560,519 - - 2,492,496
3,053,015
14,899,904 69,892 924,751 206,437 3,221,202 2,492,496 4,081,889 25,896,571
(78,670) (942) - - - - 23,721 (55,891)
Net change in fund balances 1,948,071 (55,686) (451,168) (206,437) (3,217,500) 151,652 1,937 533,480 (1,295,651)
Fund balances, beginning of yr 13,307,285 1,383,180 1,251,115 2,364,424 3,217,500 2,011,418 135,830 7,655,151 31,325,903
Fund balances, end of year $15,255,356 $1,327,494 $799,947 $2,157,987 $ $2,163,070 $137,767 $8,188,631 $30,030,252
Tax” revenue approved by the voters in November 2012 (and operative April 1, 2013) and the replacement Measure R Approved by the voters November 2020 (and operative April 1, 2021). The use of the Measure L add-on sales tax has been appropriated by the City Council to fund street and storm drain projects, which are typically capital projects. The timing of projects funded with Add-On Sales Tax revenue impacts the fund balance from year to year. Of the $1.9 million net change in General Fund balance the add-on sales taxes contributed approximately $526,000. This was largely due to the fact that Measure R was only in place one quarter and had limited expenditures before year-end. The portion of the $15.3 million fund balance assigned for add-on tax priority expenditures total $4.2 million ($3.6 million Measure L and $0.6 million Measure R). A separate schedule detailing the combining of these funds is included as part of the Other Supplementary Information. Approximately $766,000 of the fund balance is assigned for use in completing General and Long Term Plans. The total funds designated as unassigned increased by $1.8 million from the prior year. The unassigned portion of the General Fund balance complies with the adopted policy to maintain at least 50% of expenditures as a contingency (See reserve policy as described in Note 10). During the year the City also had reduced expenditures which were impacted by vacancies as well as reduced contract Police personnel due to vacancies.
Community Facilities Maintenance This fund holds monies received in 2006 that were a requirement of the Wilder (Gateway) Development Agreement. The funds were referred to as a Community Facilities Maintenance Endowment, for the purpose of funding operations and maintenance of Community Facilities. The only revenue reflects interest earnings. Expenditures were related to field improvements at the Wilder sports fields. As of June 30, 2021 the balance in this fund was approximately $1.3 million. The adopted CIP allocates the funds for future improvements to be undertaken in Fiscal Year 2021-2022. Contra Costa Transportation Authority (CCTA) This fund accounts for monies distributed by CCTA to local cities for street improvement projects. CCTA administers a special one-half cent sales tax levied to support a county-wide transportation improvement plan. The City receives both project specific revenue and distributions that are made based on a formula using population and road network miles. This fund accounted for 2% of governmental revenues and 4% of expenditures. The fund balance decreased by approximately $451,000. This was the result project expenditures which included unexpended balances from prior years. The expenditures were from the sources distributed according to the CCTA formula and were not project specific grants. The remaining road maintenance funds are targeted for projects identified in the five year capital improvement program. Capital Projects Fund There was no revenue recorded in this fund in the current Fiscal Year and expenditures were approximately $206,000 which reduced the available balance. This fund includes General Fund monies set-aside and planned for one-time priority capital projects for which there is not another source of funding. As of June 30, 2021 the balance in this fund was approximately $2.2 million. 2016 General Obligation Road Bonds – Capital Project In 2016 the voters approved a general obligation property tax for up to $25 million to complete residential roadway improvements. In April 2017, the full $25 million of authorized bonds was issued. The funds have been expended on different projects. This fund accounted for 12% of the total expenditures in governmental funds. The expenditures occurring this year were used on the 2020 Street Rehabilitation project and resulted in no remaining funds from the 2016 bond proceeds. 2014 General Obligation Road Bonds & 2016 General Obligation Bonds – Debt Service As presented in Table 3 above, the Debt Service funds for two General Obligation Bond authorizations have been combined showing total revenue of approximately $2.6 million and expenditures of approximately $2.5 million. In combination these funds represented approximately 11% of the total Governmental Funds revenues and 10% of total Governmental Funds expenditures.
2014 General Obligation Bond Debt Service In 2014 the voters approved a general obligation property tax for up to $20 million for residential roadway improvements. The first $10 million of the authorized bonds was issued in 2015 and the second $10 million was issued in April of 2017. All of the proceeds from this issue were fully expended as of June 30, 2019. As presented later in this report in the schedule of Revenues, Expenditures and Changes in Fund Balance, the 2014 GO Bond Debt Service had a total of $1.1 million in Revenue and expenditures were approximately $1.1 million. The ending fund balance for the 2014 debt service fund was approximately $944,000. 2016 General Obligation Bond Debt Service In 2016 the voters approved a general obligation property tax for up to $25 million to complete residential roadway improvements. In April 2017, the full $25 million of authorized bonds was issued. All of the proceeds from this issue were fully expended as of June 30, 2021. As presented later in this report in the schedule of Revenues, Expenditures and Changes in Fund Balance, the 2016 GO Bond Debt Service had a total of $1.5 million in Revenue and expenditures were $1.4 million. The ending fund balance for the 2016 debt service fund was approximately $1.2 million. Revenue collected in both 2014 and 2016 debt service funds, is the amount deemed necessary in accordance with the debt service requirements for the bonds. Affordable Housing Fund Based on the criteria for reporting Major funds the Affordable Housing Fund meets the required criteria due to the assets of the fund representing 6% of the assets of all governmental funds combined. As disclosed in Note 5 the fund holds a Note in the amount of $2,050,000 that is due in 2069 from Eden Housing and related to the development of the Monteverde Senior Apartments. There is no accrued interest due and the asset is offset by a deferred inflow of revenue that is unavailable. The fund had minor revenue of approximately $2,000 related to interest and miscellaneous fees collected. This fund has an ending balance of approximately $138,000 which is used to monitor deed restricted affordable units in the Pulte project. Other Governmental Funds As noted earlier this information aggregates financial results from several funds. As of June 30, 2021 the combined fund balance was approximately $8.2 million. These funds represented 19% of the total governmental fund revenues and 16% of the expenditures. There was an overall net increase in fund balance of approximately $533,000. The change was comprised of both increases and decreases between the individual funds. The most significant factors were decreases of approximately $269,000 in Park Dedication & Improvement Fees and $95,000 in Gas Tax expended on capital projects. There was also a decrease of $116,000 in the Recycling funds. Some of the larger increases occurred where current year revenue did not exceed expenditures and the increase in funds will be available for future projects. This includes nearly $445,000 in storm-water and drainage funds as well as approximately $247,000 available from Road Maintenance fees collected from the garbage company. The Library parcel tax fund had an increase in the available balance of $134,500 due to reduced operating hours and a delay in the start of planned capital projects. These increases will be used to fund future projects and services.
Proprietary Fund
The City maintains one type of Proprietary fund - an Internal Services Fund (ISF). An ISF is an accounting structure used to accumulate and allocate costs internally among the City’s various operating functions. The City has four ISF funds to address: Information Systems, Building Maintenance, Vehicle Replacement, and Risk Management. These services solely benefit the government function. Total assets in these funds were approximately $2.5 million as of June 30, 2021. This was approximately $227,000 more than was reported for the same funds in the previous year. The primary factor was additional collection of charges to accumulate replacement funds for fleet and information technology. There was also a delay in projects to be funding by the Building Services fund. A separate Statement of Net Position and Statement of Cash Flow is included for each of the ISF funds.
Fiduciary / Custodial Funds
Fiduciary funds are used to account for resources held for the benefit of parties outside of the reporting government. Fiduciary funds are not reflected in the government-wide financial statements because the resources of those funds are not available to support the City’s own programs. The City utilizes a custodial fund to report monies held for the Orinda Geologic Hazard Abatement District (GHAD). This District is an agency established under California Public Resources Code 26570 which explicitly states “A district is a political subdivision of the state. A district is not an agency or instrumentality of a local agency.” In January 2020 the GHAD Board entered into an agreement with the City to provide accounting and investing services of the funds which are not held in a trust. As of June 30, 2021 the net position of this fund was $1,920,402.
GENERAL FUND BUDGETARY HIGHLIGHTS
As a financial planning document the General Fund Budget is monitored throughout the year and adjusted based upon changes encountered during the year. Budget adjustments are presented to the City Council for approval based on adopted policy. A summary of the General Fund original adopted budget, compared to the final amended budget is shown in Table 4 below. During Fiscal Year 2020-2021 the original General Fund budgeted revenue was increased by approximately $723,000 and the General Fund Budgeted expenditures were increased by approximately $750,000 which would produce a net difference of approximately $30,000. The City Council was cautious in approving budget changes given the uncertainty of the range of impacts from the pandemic. A balanced budget approach was considered a prudent approach.
TABLE 4: SUMMARY GENERAL FUND ORIGINAL BUDGET COMPARED TO FINAL BUDGET FOR THE FISCAL YEAR ENDED JUNE 30, 2021
General Fund Budget Compared to Final Actual Table 5 provides a summary comparing the General Fund Final Adjusted Budget to the Actual results. As a financial plan using estimates and projections variances are not unexpected. The end results were positive for the City in that the actual Revenue (including transfers) exceeded the Budget estimate by $1.1 million, while the General Fund Expenditures (including operating transfers) were $2.5 million less than the authorized Budget.
Factors impacting the revenue results included: Federal Cares Act grant of approximately $234,000; increased sales tax partially attributable to one quarter of the new voter approved Measure R; increased revenue from property transfer tax partially due to newly constructed homes in the Wilder development being sold; increased development activity resulting in more revenue from building permits and other development review service fees; and an increase in recreation fees as programs and facility rentals that were precluded in the first nine months of the year were allowed to occur under modified Covid 19 health restrictions. The various positive results in revenue were partially offset by the recording of an unrealized market value adjustment on investments held by the City.
Resources:
Revenues
Original Budget Final Budget Budget Variance
$15,121,235 $15,844,327 $723,092
Transfers In Total Resources
16,360 16,360 -
15,137,595 15,860,687 723,092
Appropriations Expenditures
The largest single factor causing General Fund expenditures to be less than the Budget is related to capital project timing. Approximately $1.1 million in budgeted capital outlay was not spent during the year and is expected to carry over to expenditures in the next year. Staffing vacancies and turnover impacted Planning, Public Works and Police resulting in budgetary savings.
Table 5 below summarizes the results of the Final Adjusted Budget compared to the final Actual results. The complete schedule which includes additional detail, as required, is included in the supplementary information following the notes to the financial statements.
TABLE 5: SUMMARY GENERAL FUND FINAL BUDGET COMPARED TO ACTUAL REVENUE, EXPENSE, TRANSFERS FISCAL YEAR ENDED JUNE 30, 2021
Resources:
Revenues
Transfers In
Final Budget Actual June 30, 2021 Variance Final Budget
Total Resources 15,860,687 16,947,574 1,086,887
Appropriations Expenditures
Fund balance beginning of year
Fund balance end of year 13,307,285
15,255,356
CAPITAL ASSETS AND DEBT ADMINISTRATION
Capital Assets
Detailed information regarding composition and activity in capital assets is provided in Note 6 to the financial statements. The City’s capital assets for governmental activities as of June 30, 2021 amounted to $111.5 million (net of accumulated depreciation). This investment in capital assets includes land, buildings, improvements, machinery and equipment, park facilities, roads, and bridges, and work in progress. A summary comparison to the previous year is presented in Table 6 below:
TABLE 6: CAPITAL ASSETS NET OF ACCUMULATED DEPRECIATION
June 30, 2021 June 30, 2020 $ Change % Change
Land $2,442,087 $2,441,034 $1,053 0.0% Parkland and improvements 1,295,205 1,295,205 - 0.0% Work in progress 15,816,655 14,808,092 1,008,563 6.8% Buildings, grounds and improvements 36,047,671 35,574,773 472,898 1.3% Furniture and equipment 2,439,485 2,283,988 155,497 6.8% Infrastructure 141,529,830 134,535,399 6,994,431 5.2% Subtotal 199,570,933 190,938,491 8,632,442 4.5% Less: Accumulated depreciation 88,080,009 82,235,546 5,844,463 7.1% Total Net of Depreciation $111,490,924 $108,702,945 $2,787,979 2.6%
As shown in Table 5 the combined total change was approximately $8.6 million. Major capital asset additions during FY 2020-2021 included: Annual Pavement Rehabilitation projects (over $6.9 million); $300,000 related to design of seismic improvements on two bridges; and approximately $430,000 associated with Park facilities (Tennis Court Rehabilitation; and Wilder Sports fields).
Debt Administration
As of June 30, 2020 the total balance outstanding was approximately $49.2 million. The combined balance outstanding decreased by $2 million from the prior year. At June 30, 2020, the City had total long-term debts and obligations as summarized in Table 6 below.
TABLE 7: OUTSTANDING LONG-TERM OBLIGATIONS
June 30, 2021 June 30, 2020 $ Change
2015 Refunding COP (City Hall) $6,569,906 $6,905,525 ($335,619) 2014 GO Bond Series A 7,167,036 7,458,838 (291,802) 2014 GO Bond Series B 10,105,000 10,340,312 (235,312) 2016 GO Bond Series A 23,889,423 24,514,074 (624,651)
TOTAL $47,731,365 $49,218,749 ($1,487,384)
Approximately 86% of the total debt balance is attributable to voter approved General Obligation Bonds issued to fund road and drainage projects. General obligation (GO) bonds are debt instruments issued by City to raise funds for public works. The source of repayment is a special additional ad valorem property tax that is levied solely to address the outstanding debt. The Certificate of Participation (COP) is a lease financing transaction that was entered into to pay for the cost of City Hall. The current obligation represents the refunding of an earlier transaction and it is repaid from the General Fund. Significant details related to outstanding debt can also be found in Note 9 of the financial statements.
ECONOMIC FACTORS AND NEXT YEAR’S BUDGET
The City of Orinda is responsible for providing important and essential services required by its citizens. The City’s ability to provide high level of services to its citizens is dependent upon a balancing expenditure growth with what is occurring to City revenue. The local economic health is tied to the regional, State and the Nation’s economy which cannot be easily predicted given the impacts of a world-wide pandemic. The challenge is that the City receives a small percentage of property tax and the retail / commercial land uses are vastly outnumbered by residential properties. Non-residential properties offer an opportunity for a City to diversify its tax base beyond just the property tax. The City Council and community are in the process of completing a Downtown Precise Plan and an Update to the Housing Element and Safety Plan, which are components of the City General Plan. The conclusion of these efforts which are also influenced heavily by changes in State Laws will help guide development in the future.
As noted earlier Property Tax is a significant revenue source for the City. The automatic adjustment to assessed values in California is calculated as the lesser of 2% or the increase in the California Consumer Price Index. With the 2021/2022 Fiscal Year the automatic increase was limited to 1%. Into the fall of 2021 both the number of homes sold and the median prices continued to increase which will help to mitigate the reduction in the automatic change in assessed valuations.
With the collection of the new Measure R Add-On Sales tax that began in April 2021 the City is embarking on new initiatives to address priority needs when the tax measure was presented to the voters. The City Council has appointed a Supplemental Sales Tax Oversight Commission to assist in the planning for these funds. The initial focus is on addressing the risks posed from wildfires and disaster response and preparedness. Other critical priorities include critical storm drainage repairs and improvements and continued maintenance of the public roadways. The City will need to continue to monitor the impacts of the COVID 19 pandemic and balancing resources and expenditures. One positive factor was the receipt of the first of two payments of Federal Grant Local Government Fiscal Recovery funds. In total the City will be receiving approximately $4.8 million. The City Council has considered a framework for the expenditure of these funds with the focus being on one-time needs. It is also possible that in the coming years the City may be eligible for Federal Infrastructure grants as part of a $1 trillion package passed by Congress in the second half of 2021.
REQUESTS FOR INFORMATION
This financial report is designed to provide a general overview of the City’s finances for all those with an interest in the government’s finances. Questions concerning any information provided in this report or request for addition financial information should be directed to: City of Orinda Finance Department 22 Orinda Way Orinda, CA 94563 (925)253-4220
Basic Financial Statements
This Page Left Intentionally Blank
STATEMENT OF NET POSITION
AND STATEMENT OF ACTIVITIES
The Statement of Net Position and the Statement of Activities summarize the entire City’s financial activities and financial position. They are prepared on the same basis as is used by most businesses, which means they include all the City’s assets and all its liabilities, as well as all its revenues and expenses. This is known as the full accrual basis—the effect of all the City’s transactions is taken into account, regardless of whether or when cash changes hands, but all material internal transactions between City funds have been eliminated.
The Statement of Net Position reports the difference between the City’s total assets and the City’s total liabilities and deferred inflows of resources, including all the City’s capital assets and all its long-term debt. The Statement of Net Position focuses the reader on the composition of the City’s net assets, by subtracting total liabilities from total assets.
The Statement of Net Position summarizes the financial position of all the City’s Governmental Activities.
The City’s Governmental Activities include the activities of its General Fund, along with all its Special Revenue, Capital Projects and Debt Service Funds. Since the City’s Internal Service Funds service these Funds primarily, their activities are consolidated with Governmental Activities, after eliminating interfund transactions and balances.
The Statement of Activities reports increases and decreases in the City’s net position. It is also prepared on the full accrual basis, which means it includes all the City’s revenues and all its expenses, regardless of when cash changes hands. This differs from the “modified accrual” basis used in the Fund financial statements, which reflect only current assets, current liabilities, deferred outflows/inflows of resources, available revenues and measurable expenditures.
The format of the Statement of Activities presents the City’s expenses first, listed by program. Program revenues—that is, revenues which are generated directly by these programs—are then deducted from program expenses to arrive at the net expense of each governmental. The City’s general revenues are then listed in the Governmental Activities as appropriate, and the Change in Net Position is computed and reconciled with the Statement of Net Position.

