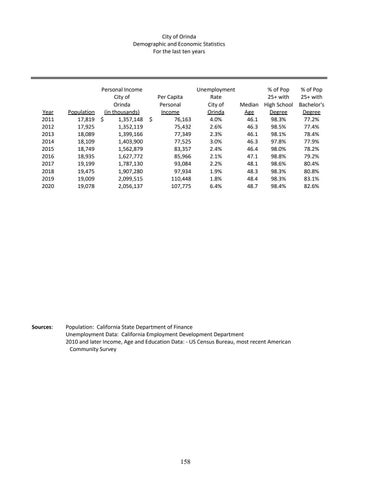
City of Orinda Demographic and Economic Statistics For the last ten years
Year 2011 2012 2013 2014 2015 2016 2017 2018 2019 2020
Sources:
Population 17,819 17,925 18,089 18,109 18,749 18,935 19,199 19,475 19,009 19,078
Personal Income City of Orinda (in thousands) $ 1,357,148 1,352,119 1,399,166 1,403,900 1,562,879 1,627,772 1,787,130 1,907,280 2,099,515 2,056,137
Per Capita Personal Income $ 76,163 75,432 77,349 77,525 83,357 85,966 93,084 97,934 110,448 107,775
Unemployment Rate City of Orinda 4.0% 2.6% 2.3% 3.0% 2.4% 2.1% 2.2% 1.9% 1.8% 6.4%
% of Pop % of Pop 25+ with 25+ with Median High School Bachelor's Age Degree Degree 46.1 98.3% 77.2% 46.3 98.5% 77.4% 46.1 98.1% 78.4% 46.3 97.8% 77.9% 46.4 98.0% 78.2% 47.1 98.8% 79.2% 48.1 98.6% 80.4% 48.3 98.3% 80.8% 48.4 98.3% 83.1% 48.7 98.4% 82.6%
Population: California State Department of Finance Unemployment Data: California Employment Development Department 2010 and later Income, Age and Education Data: ‐ US Census Bureau, most recent American Community Survey
158


