City of Orinda, California
Annual Comprehensive Financial Report
For the Fiscal Year Ended June 30, 2025
Prepared by Finance Department
City of Orinda, California
Annual Comprehensive Financial Report
For the Fiscal Year Ended June 30, 2025
Prepared by Finance Department

November 30, 2025
To the Members of the City Council, and Residents of the City of Orinda:
We are pleased to present the Annual Comprehensive Financial Report (ACFR) for the City of Orinda (City) for the fiscal year ending June 30, 2025. The purpose of the report is to provide the City Council, City Staff, residents, bond holders, and other interested parties with useful information concerning the City’s operations and financial position. The City management assumes full responsibility for the completeness and reliability of the information contained in this report.
To provide a rational basis for making these representations, Management of the City has established an internal control framework that is designed both to protect the City’s assets from loss, theft, or misuse and to compile sufficient reliable information for the preparation of the City’s financial statements in conformity with GAAP. Because the cost of internal controls should not outweigh their benefits, the City’s framework of internal controls has been designed to provide reasonable rather than absolute assurance that the financial statements will be free from material misstatements.
The City’s financial statements have been audited by Badawi & Associates, a firm of certified public accountants. Based upon the audit, the independent auditor concluded that there was reasonable basis for rendering an unmodified (“clean”) opinion, on the City of Orinda’s financial statements for the year ended June 30, 2025. The independent auditor’s report is contained as the first component of the financial section of this report.
Management’s discussion and analysis (MD&A) immediately follows the independent auditor’s report and provides a narrative introduction, overview, and analysis of the basic financial statements. MD&A complements this letter of transmittal and should be read in conjunction with it.
The City of Orinda was incorporated in 1985 after more than 100 years of gradual development. One of the primary reasons cited by voters for supporting incorporation was the desire for local decision making. Most of residential Orinda is comfortably mature existing in a bucolic and wooded environment.
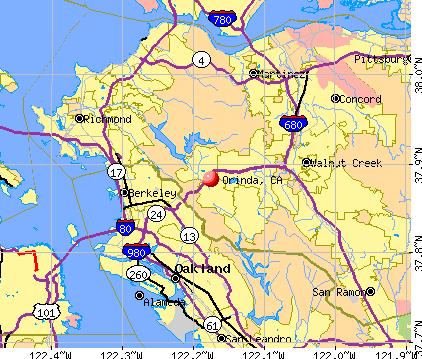
The City comprises approximately 12.8 square miles and is situated adjacent to the Oakland/Berkeley hills, immediately east of the Caldecott Tunnel on Highway 24 in Contra Costa County. Orinda is a residential oriented community with a population of 19,351.
The City of Orinda operates under a Council-Manager form of government. Policy making and legislative authority are vested in the City Council, which consists of five members, elected at large to four-year overlapping terms. The positions of Mayor and Vice Mayor are chosen annually by the City Council. The City Council is responsible for the City's ordinances, operating resolutions, adoption of the annual budget, land use decisions in accordance with the General Plan, hiring the City Manager and City Attorney, and appointments of all members of advisory boards and commissions. The City Manager is responsible for the
following activities: implementing the policies, ordinances, and directives of the City Council; and overseeing the day-to-day operations of the City. The City Attorney services are provided through a professional services agreement with a private law firm.
The City provides municipal services that include public safety, public works, parks and recreation, and planning services. The City operates with a small staff of 40.5 Full-Time Equivalent (FTE) positions supplemented by part-time employees. Sworn police services staff are employees of the Contra Costa County Sheriff’s Office and law enforcement services are provided under an agreement with the Sheriff’s Office. Parks and Recreation maintenance services are augmented by work performed by a private contractor. The City Moraga Orinda Fire District, a separate unrelated agency is responsible for fire and emergency medical services.
The financial statements included in this ACFR present the City and its component unit, Orinda Facilities Financing Corporation. While the Corporation is a separate legal entity from the City, it is not only financially dependent on the City but also controlled by the City. Therefore, financial activities of the corporation are reported as if they were part of the primary government. Additional information on this legally separate entity can be found in the notes to the financial statements (see Note 1).
The City Council establishes biennial (two year) budgets with a mid-cycle annual review for the General Fund and all other Funds. Budgetary control is legally maintained at the fund level for these funds. Department Directors submit budget requests to the City Manager and Administrative Services Director. The Administrative Services Director projects revenues and prepares recommendations for the budget. The preliminary budget as well as the mid-cycle adjustment are presented to the City Council at a public meeting. After deliberation and any amendments discussed as part of the public process, the City Council adopts the budget by resolution on or before June 30th in accordance with the municipal code.
The City of Orinda has adopted a comprehensive set of financial policies, including two policies which are particularly relevant. The City has a policy that requires the adoption of a balanced annual operating budget (i.e., estimated revenues and accumulated reserves equal to or in excess of appropriations). Any uncommitted operating surplus (revenues that exceeds expenditures) that exists at the end of the budget cycle may be held in reserve or re-appropriated to a capital reserve, long term obligation, or debt service fund, upon City Council’s approval, or may be used as a supplemental source of revenue to purchase onetime, non-recurring expenditures during the subsequent budget cycle.
In addition, the City has a Fund Balance Reserve policy, which states that the General Fund will strive to maintain an operating reserve equal to fifty percent (50%) of budgeted operating and debt service expenditures for the following fiscal year. The City’s operating reserve has exceeded the fifty percent (50%) target level in each of the last five fiscal years.
Orinda is an affluent residential suburb in the San Francisco metropolitan area. Orinda continues to make a mark on the region with the beautifully restored art deco Orinda Theatre, a popular Community Center, and a beautiful Public Library. The City also includes a Bay Area Rapid Transit (BART) train station providing easy access to the greater Bay Area. Major industries located within proximity to Orinda include hospitals, manufacturers of computer hardware and software, retail stores, as well as several financial institutions and insurance companies.
In Orinda, 85.4% of people aged 25 and over hold a bachelor's degree or above, which is substantially
higher than the percentages in the County (44.9%) and State (36.5%). Median household incomes within the City are significantly higher than for the state as a whole. According to the 2023 American Community Survey, the median family income in Orinda was more than $250,000, about twice as much as the median household income in Contra Costa County ($125,727) and more than twice as much as the median household income in the state of California ($96,334).
Because of its location in a region with a varied economic base, unemployment had been relatively stable. Although unemployment rates have risen nationwide over the last year, the Orinda continues to experience unemployment rates consistently lower than national averages. The City’s unemployment rate as of June 2025 was 2.5% compared to 5.8% at the State level.
Despite the softening of the housing market nationwide, housing prices in Orinda continue to remain strong. At the end of the second quarter of 2025, the median price of a single-family home in Orinda was $1.8 million.
Due to a strong and healthy local economy, Orinda has maintained a credit rating of AAA from S&P Global Ratings Service since 2015, which is the highest bond rating given to any government.
Recent economic data suggest slower growth in 2025 and greater market uncertainty as the effects of fiscal policy continue to unfold. Although inflation pressures have somewhat eased, tariffs continue to cloud forecasts, which has the potential to impact on our local economy in a variety of both positive and negative ways. An increased activity level coupled with higher prices has the potential to drive up revenue in the short term but could result in a recession or slow growth over the longer term. World and national events have resulted in the need to rely somewhat less on historical trends in terms of expected resources and services to be provided. Going forward it will be imperative to monitor program revenues and to allocate resources based on emerging trends.
Although the ACFR is reporting one year’s results, the City’s financial planning horizon extends beyond a single year. In terms of the operating budget, the City takes a longer view by adopting a two-year budget. Every two years, as part of the biennial budget process, the Orinda City Council holds a workshop to discuss the key issues facing the City of Orinda and to strategize opportunities and solutions to meet the City’s needs. These efforts include projecting revenues by each funding source and using a cash flow model to address the proposed timing for major expenditures. As a small City, one of the most pressing needs is ensuring financial resources are available to meet long-term major capital needs. The City uses a five-year Capital Improvement Plan (CIP) to identify and plan for capital needs. Sometimes the model indicates the need to accumulate funds over multiple years in order to facilitate larger projects. This can account for the increase in the fund balance in certain funds.
The Biennial Budget for the two ensuing fiscal years (2025-26 and 2026-27) incorporates the Strategic Priorities identified by the City Council in March 2025 as guidance in prioritizing the allocation of available resources. The Strategic Priorities focused on the following areas:
• Wildfire Adaptability and Emergency Preparedness
• Infrastructure Strategy and Improvement
• Downtown Development and Beautification
• Community Engagement and Education
The Biennial Budget was developed with great care and effort, reflecting the new leadership's fresh perspective on organizational needs, particularly with regard to investing in emergency preparedness. This includes updating the Emergency Operations Plan (EOP), providing staff with ongoing training, utilizing
the newest technological tools for the City's emergency planning efforts, and launching the Orindaready.com platform for residents.
A significant budgetary impact in Fiscal Year 2025-26 is the annual pavement rehabilitation capital projects which include over $3.6 million in funding from a variety of sources. These projects continue the important progress being made on the conditions of streets and roadways and include funding from Measure R funds, Road Maintenance Funds, and Gas Tax. The investment in streets can be measured by the improvements reported by the Metropolitan Transportation Commission. In 2018 the 3-year average for Orinda was rated “Fair” with a score of 68. By 2022 the City achieved a rating of “Very Good” with a rating of 84, the second highest ranking in the Bay Area.
The City has also made substantial progress in eliminating its OPEB (retiree health benefits) liabilities. As of June 30, 2025, the trust fund covers 128% of the total OPEB liability. The City Council has established a policy to continue making annual contributions to the Trust in addition to the current “pay-as-you-go” premiums. The “pay-as-you-go” retiree benefit cost in the most recent fiscal year, which was $5,820, represents actual premium costs paid by the City for participating retirees.
The City does not participate in the California Public Employees Retirement System (CalPERS) for retirement benefits. Instead, unique compared to most cities in California, Orinda offers a scheduled contribution to employee 401a and 457 retirement accounts, on a defined contribution basis. Agencies that participate in CalPERS are facing required pension contribution increases as well as increases in long term liabilities, which is not the case for the City of Orinda.
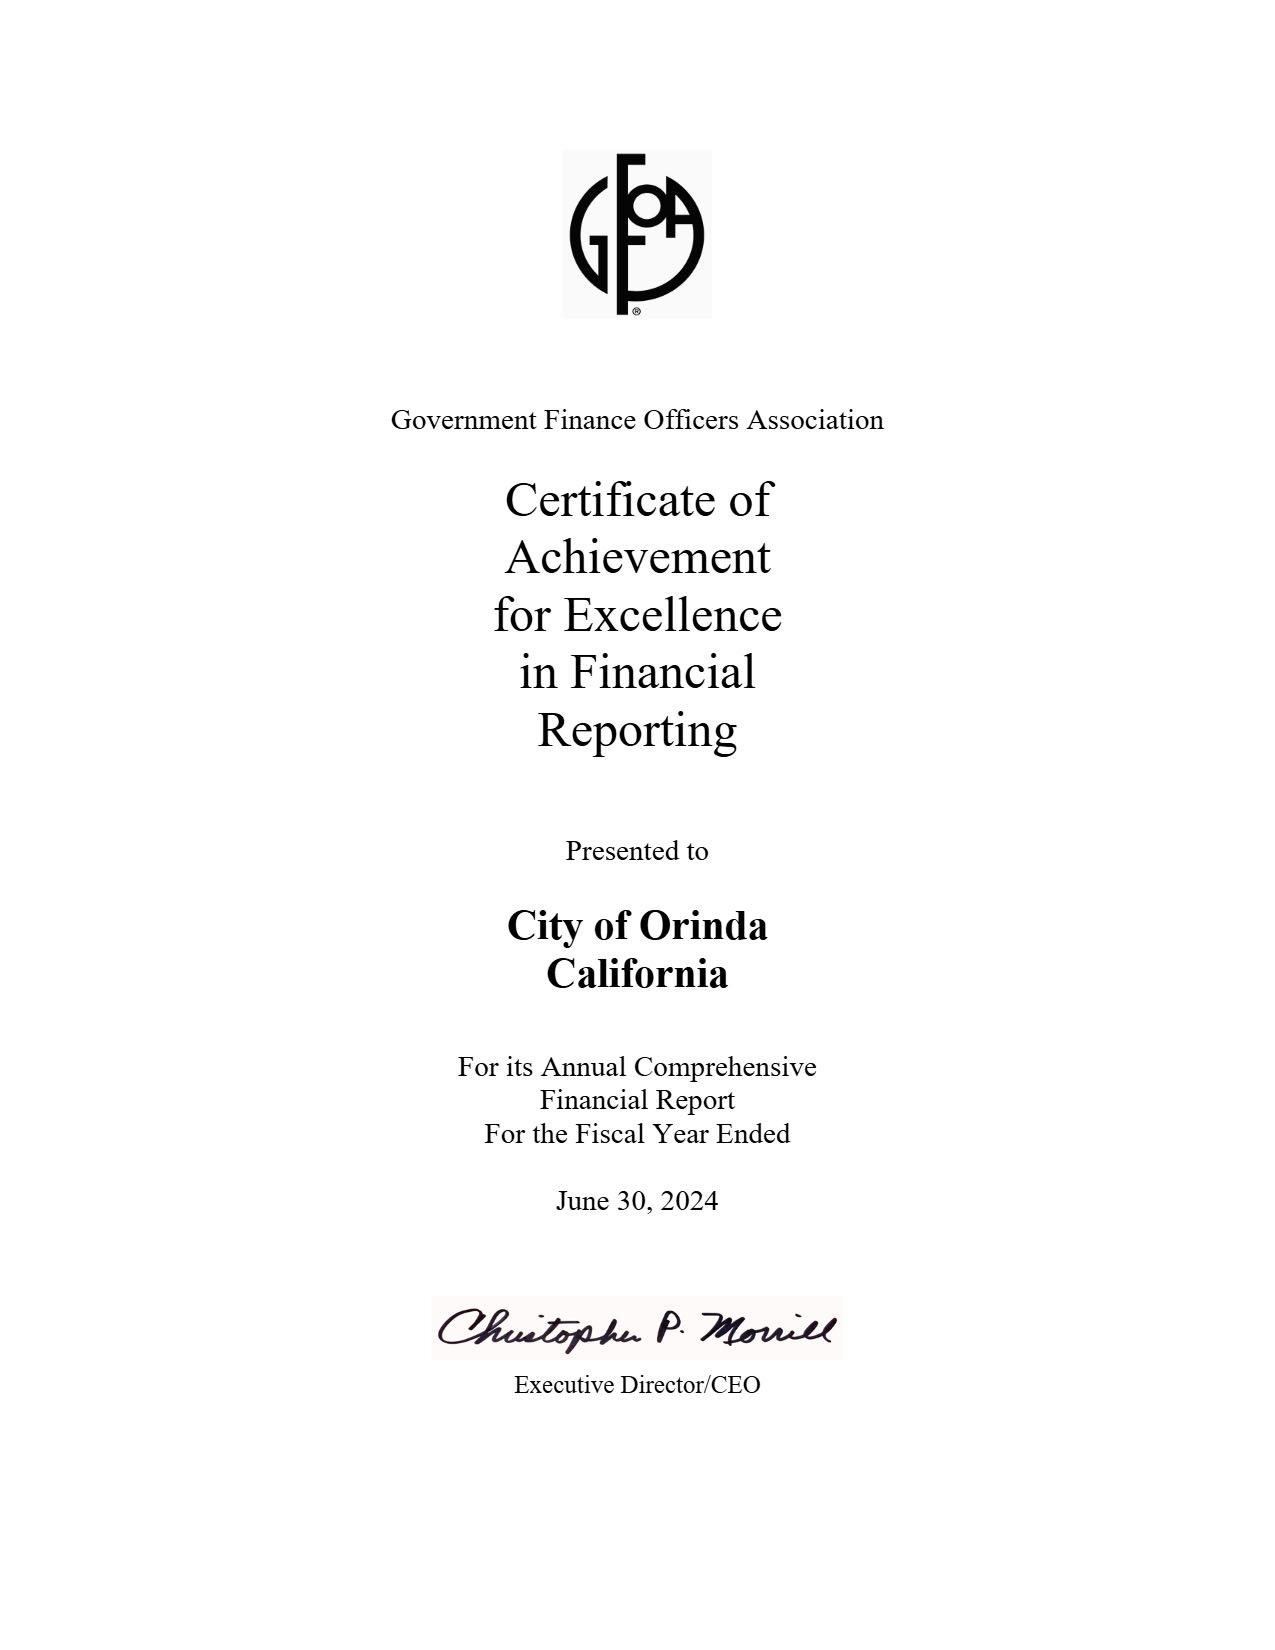
The Government Finance Officers Association (GFOA) has recognized the City of Orinda for its Annual Comprehensive Financial Report covering the period ending June 30, 2024. A copy of the award from GFOA is included in this report. This award represents the 11th consecutive year that the City's report was recognized by the GFOA.
In order to be recognized, the City was required to produce an easily readable and efficiently organized Annual Comprehensive Financial Report (ACFR). The report must satisfy both generally accepted accounting principles and applicable legal requirements. A Certificate of Achievement is valid for a period of one year only. We believe that this report will meet the program requirements to receive the award.
The City of Orinda will be submitting this Annual Comprehensive Financial Report for the Certificate of Achievement for Excellence in Financial Reporting from the Government Finance Officers Association (GFOA).
The Annual Comprehensive Financial Report represents the culmination of dedicated efforts by City staff both inside and outside of the Finance Division. The preparation of this report on a timely basis could not have been completed without the skill, effort, and commitment of the entire Finance Division. We also deeply appreciate the help from every department in supplying the information needed for audit and financial reporting.
Furthermore, we wish to thank the professional staff at Badawi & Associates including Partner Ahmed Badawi, CPA, for working diligently to fulfil the audit requirements.
The Staff also thanks the City Council for valuing the importance of comprehensive financial reporting and assigning resources to its completion. In addition, the City has active participation from volunteer committee and commission members that offer additional input to the City Council including members of
the Finance Advisory Committee and the Supplemental Sales Tax Oversight Commission. The collective endeavor demonstrates the support of the community for upholding the highest professional standards in the financial management of the City of Orinda.
Respectfully submitted,

Linda Smith

Douglas Alessio City Manager Administrative Services Director
This page intentionally left blank
The City of Orinda operates under a Council-Manager form of government. Policy making and legislative authority is vested in the City Council, which consists of five members, elected at large to four-year overlapping terms. The positions of Mayor and Vice Mayor are chosen annually by the City Council. The City Council is responsible for the City's ordinances, operating resolutions, adoption of the annual budget, land use decisions in accordance with the General Plan, hiring the City Manager and City Attorney, and appointments of all members of advisory boards and commissions.
The City is organized into operating departments including Administrative Services, Planning, Police, Public Works, Parks and Recreation. The City Manager is responsible for the following activities: implementing the policies, ordinances, and directives of the City Council; and overseeing the day-to-day operations of the City. The City Attorney services are provided through a professional services agreement with a private law firm. The City’s website, www.cityoforinda.gov, is the source for information about city services, programs, projects, meetings, policies, employment opportunities, and financial reports.

Name of Official Position Title
Linda Smith
Osa Wolff
City Manager
City Attorney (Contract)
Sheri Smith City Clerk
Douglas Alessio Administrative Services Director
Ginger Staton Human Resources Manager
Todd Trimble Parks and Recreation Director
Lashun Cross Planning Director
Anthony Rossi Police Chief (Contract)
Scott Christie Public Works Director
Sivakumar Natarajan City Engineer
“Orinda strives to provide excellent service in a fiscally responsible manner to promote a safe, friendly and vibrant community.”


ChiefofPolice (contract) PoliceOfficers (11contract)


PoliceSergeant (2contracts) SeniorAdmin Asst


To the Honorable Mayor and Members of the City Council of the City of Orinda Orinda, California
Opinions
We have audited the financial statements of the governmental activities, each major fund, and the aggregate remaining fund information of the City of Orinda (City), as of and for the year ended June 30, 2025, and the related notes to the financial statements, which collectively comprise City’s basic financial statements as listed in the table of contents.
In our opinion, the accompanying financial statements present fairly, in all material respects, the respective financial position of the governmental activities, each major fund, and the aggregate remaining fund information of the City, as of June 30, 2025, and the respective changes in financial position and, where applicable, cash flows thereof for the year then ended in accordance with accounting principles generally accepted in the United States of America.
We conducted our audit in accordance with auditing standards generally accepted in the United States of America (GAAS) and the standards applicable to financial audits contained in Government Auditing Standards, issued by the Comptroller General of the United States. Our responsibilities under those standards are further described in the Auditor’s Responsibilities for the Audit of the Financial Statements section of our report. We are required to be independent of the City and to meet our other ethical responsibilities, in accordance with the relevant ethical requirements relating to our audit. We believe that the audit evidence we have obtained is sufficient and appropriate to provide a basis for our audit opinions.
The City’s management is responsible for the preparation and fair presentation of the financial statements in accordance with accounting principles generally accepted in the United States of America, and for the design, implementation, and maintenance of internal control relevant to the preparation and fair presentation of financial statements that are free from material misstatement, whether due to fraud or error.
In preparing the financial statements, management is required to evaluate whether there are conditions or events, considered in the aggregate, that raise substantial doubt about the City’s ability to continue as a going concern for twelve months beyond the financial statement date, including any currently known information that may raise substantial doubt shortly thereafter.

To the Honorable Mayor and Members of the City Council of the City of Orinda
Orinda, California
Page 2
Our objectives are to obtain reasonable assurance about whether the financial statements as a whole are free from material misstatement, whether due to fraud or error, and to issue an auditor’s report that includes our opinions. Reasonable assurance is a high level of assurance but is not absolute assurance and therefore is not a guarantee that an audit conducted in accordance with GAAS will always detect a material misstatement when it exists. The risk of not detecting a material misstatement resulting from fraud is higher than for one resulting from error, as fraud may involve collusion, forgery, intentional omissions, misrepresentations, or the override of internal control. Misstatements are considered material if there is a substantial likelihood that, individually or in the aggregate, they would influence the judgment made by a reasonable user based on the financial statements.
In performing an audit in accordance with GAAS, we:
Exercise professional judgment and maintain professional skepticism throughout the audit.
Identify and assess the risks of material misstatement of the financial statements, whether due to fraud or error, and design and perform audit procedures responsive to those risks. Such procedures include examining, on a test basis, evidence regarding the amounts and disclosures in the financial statements.
Obtain an understanding of internal control relevant to the audit in order to design audit procedures that are appropriate in the circumstances, but not for the purpose of expressing an opinion on the effectiveness of the City’s internal control. Accordingly, no such opinion is expressed.
Evaluate the appropriateness of accounting policies used and the reasonableness of significant accounting estimates made by management, as well as evaluate the overall presentation of the financial statements.
Conclude whether, in our judgment, there are conditions or events, considered in the aggregate, that raise substantial doubt about the City’s ability to continue as a going concern for a reasonable period of time.
We are required to communicate with those charged with governance regarding, among other matters, the planned scope and timing of the audit, significant audit findings, and certain internal control–related matters that we identified during the audit.
Accounting principles generally accepted in the United States of America require that the management’s discussion and analysis, budgetary comparison schedules for the General Fund and major special revenue funds, and the required OPEB schedules on pages 5-19 and 86–93 be presented to supplement the basic financial statements. Such information is the responsibility of management and, although not a part of the basic financial statements, is required by the Governmental Accounting Standards Board who considers it to be an essential part of financial reporting for placing the basic financial statements in an appropriate operational, economic, or historical context. We have applied certain limited procedures to the required supplementary information in accordance with auditing standards generally accepted in the United States
To the Honorable Mayor and Members of the City Council of the City of Orinda
Orinda, California
Page 3
of America, which consisted of inquiries of management about the methods of preparing the information and comparing the information for consistency with management’s responses to our inquiries, the basic financial statements, and other knowledge we obtained during our audit of the basic financial statements. We do not express an opinion or provide any assurance on the information because the limited procedures do not provide us with sufficient evidence to express an opinion or provide any assurance.
Our audit was conducted for the purpose of forming opinions on the financial statements that collectively comprise the City’s basic financial statements. The combining statements and the budgetary comparison schedules for the General Fund, the combining statements, and the individual budgetary comparison schedules of the nonmajor governmental funds on pages 99-155 are presented for purposes of additional analysis and are not a required part of the basic financial statements.
The combining statements and the budgetary comparison schedules for the General Fund, the combining statements, and the individual budgetary comparison schedules of the nonmajor governmental funds on pages 97-153 are presented for purposes of additional analysis and are not a required part of the basic financial statements are the responsibility of management and were derived from and relate directly to the underlying accounting and other records used to prepare the basic financial statements. Such information has been subjected to the auditing procedures applied in the audit of the basic financial statements and certain additional procedures, including comparing and reconciling such information directly to the underlying accounting and other records used to prepare the basic financial statements or to the basic financial statements themselves, and other additional procedures in accordance with auditing standards generally accepted in the United States of America. In our opinion, the combining statements and the budgetary comparison schedules for the General Fund, the combining statements, and the individual budgetary comparison schedules of the nonmajor governmental funds on pages 99-155 are fairly stated, in all material respects, in relation to the basic financial statements as a whole.
Management is responsible for the other information. The other information comprises the introductory and statistical section but does not include the financial statements and our auditor's report thereon. Our opinions on the financial statements do not cover the other information, and we do not express an opinion or any form of assurance thereon. In connection with our audit of the financial statements, our responsibility is to read the other information and consider whether a material inconsistency exists between the other information and the financial statements, or the other information otherwise appears to be materially misstated. If, based on the work performed, we conclude that an uncorrected material misstatement of the other information exists, we are required to describe it in our report.
To the Honorable Mayor and Members of the City Council of the City of Orinda
Orinda, California
Page 4
In accordance with Government Auditing Standards, we have also issued our report dated November 30, 2025 on our consideration of the City’s internal control over financial reporting and on our tests of its compliance with certain provisions of laws, regulations, contracts, and grant agreements and other matters. The purpose of that report is solely to describe the scope of our testing of internal control over financial reporting and compliance and the results of that testing, and not to provide an opinion on the effectiveness of internal control over financial reporting or on compliance. That report is an integral part of an audit performed in accordance with Government Auditing Standards in considering the City’s internal control over financial reporting and compliance.

Badawi & Associates, CPAs
Emeryville, California
November 30, 2025
As management of the City of Orinda (the City), we offer readers this discussion and analysis of the City’s financial performance for the fiscal year (FY) ending June 30, 2025. The purpose of management’s discussion and analysis (MD&A) is to help City residents and other readers understand what the financial statements and notes in this financial report say about the City’s financial health and why it has changed since last year. It contains information drawn from those other parts of the report, accompanied by explanations based on the Finance Staff’s knowledge of the City’s finances.
The discussion and analysis are intended to serve as an introduction to the City’s basic financial statements, which have the following three components: (1) government-wide financial statements, (2) fund financial statements, and (3) notes to financial statements. Those financial statements present the City’s finances at both an overall and a detailed level.
The diagram in Figure 1 illustrates the financial reporting structure of a typical city. It is important to note that the City of Orinda does not operate any Enterprise Funds and hence does not have any businesstype activities.


Government-wide Financial Statements are designed to provide readers with a broad overview of City finances, in a manner similar to a private sector business. The City of Orinda’ government wide financial statements include the governmental activities which comprise the City’s most basic functions, such as general government, public works and engineering; park, recreation, and library; planning; and police services. Governmental activities primarily are financed by taxes paid by City residents and businesses and grants from the State of California and the federal government.
The statement of net position presents financial information on all the City’s assets, liabilities, and deferred inflows/outflows of resources, with the difference reported as net position. Over time, increases or decreases in net position may serve as a useful indicator of whether the financial position of the City is improving or deteriorating.
The statement of activities presents information showing how the City’s net position changed during the most recent fiscal year. All changes in net position are reported as soon as the underlying event giving rise to the change occurs, regardless of the timing of related cash flows. Thus, revenues and expenses are reported for some items that will only result in cash flows in future fiscal periods (e.g., uncollected revenues and earned but unused vacation leave).
The remaining basic financial statements present the City’s finances in greater detail and present fiduciary activities. As their name implies, the fund financial statements disaggregate financial information by separate funds to report on the specific purposes for which resources are used or for which they are restricted. The City reports three groups of funds:
Governmental fund financial statements report all governmental activities except those that involve providing services to City departments. In addition to the City’s main operating fund, the general fund, those financial statements report special revenue funds to account for resources that are legally restricted, debt service funds to record the repayment of outstanding bonds, and capital projects funds to account for resources used to acquire transportation infrastructure and certain other long-lived assets.
Proprietary fund financial statements report only internal service funds which provide services to City departments.
Fiduciary fund financial statements report on resources for which the City acts as a trustee or custodian. The resources in those funds do not belong to the City and cannot be used to provide services, which is why they are not included in the government-wide financial statements. The City maintains only one Fiduciary fund- the Geological Hazard Abatement District.
The next section of this financial report contains notes to financial statements, which delve deeper into the City’s finances as reported in the financial statements. The information in the notes is as important to understanding the City’s finances as the information in the financial statements. The City uses notes to (1) present information in greater detail than is possible within the financial statements themselves, (2) explain the nature of the amounts reported in the financial statements and how those amounts were determined, and (3)report certain information that does not meet the requirements for inclusion in the financial statements (such as certain contingencies).
All of the City’s financial statements, except for the governmental fund financial statements, use the economic resources measurement focus and accrual basis of accounting. (See Figure 2.) In other words, they comprehensively report all types of financial statement elements:
Assets- resources the City controls, from short-term assets like cash to long-term assets like roads and bridges
Liabilities- amounts the City owes, from short-term liabilities such as salaries payable to long-term liabilities such as outstanding debt and net amounts owed to employees for retiree health (OPEB)
Deferred outflows of resources and deferred inflows of resources- flows that occurred during the year, or in prior years, that will not be reported as expenses and revenues until the future year to which they are related
Revenues and expenses- inflows and outflows of economic resources, respectively, related to the current year.
Governmental fund financial statements use the current financial resources measurement focus and modified accrual basis of accounting to report on the sources, uses, and balances of current financial resources. Governmental funds do not report nonfinancial assets, such as capital assets, or certain other long-term items, such as general obligation bonds, but they do report the flows of current financial resources related to those long-term items; for example, the proceeds from issuing bonds or selling vehicles, as well as principal and interest payments on bonds and spending on the construction of a City building.
Types of assets and liabilities
Types of revenues/additions
Types of expenses/deductions/ expenditures
Types of deferred outflows of resources and deferred inflows of resources
All assets and liabilities, both financial and nonfinancial, short term and long term
All types of revenues/additions that flow into the government during the year that relate to that year, regardless of when cash is received
All types of expenses/ deductions that flow out of the government during the year that relate to that year, regardless of when cash is paid
All types of resources that flow into and out of the government during the year that relate to a future year
Only current financial resources, such as cash, accounts receivable, and accounts payable
Only revenues that are measurable and available to finance expenditures of that year
Only expenditures for which the related governmental fund liability is incurred in that year
Current financial resources that flow into and out of the governmental funds during the year that relate to a future year
Because the focus of governmental funds is narrower than that of the government-wide financial statements, it is useful to compare the information presented for governmental funds with similar information presented for governmental activities in the government-wide financial statements. By doing so, readers may better understand the long-term impact of the government’s near-term financing decisions. Both the governmental fund balance sheet and the governmental fund statement of revenues, expenditures, and changes in fund balances provide a reconciliation to facilitate this comparison between governmental funds and governmental activities.
More details about the measurement focuses and bases of accounting can be found in the first note to financial statements, the summary of significant accounting policies, beginning on page 51.
The following sections of MD&A analyze the financial performance of governmental activities. As noted earlier, the City’s net position over time may serve as a useful indicator of the City’s financial position. Table 1 shows that as of June 30, 2025, the City’s total net position (assets and deferred outflows minus liabilities and deferred inflows) was nearly $114.3 million.
(amounts expressed in thousands)
Deferred Outflow of Resources
Inflow of Resources
Restated
By far, the largest portion of the City’s net position ($66.6 million or 58.2%) reflects its investment in capital assets (e.g., land, buildings, machinery, equipment, vehicles, and infrastructure) net of accumulated depreciation, less any related outstanding debt that was used to acquire those assets. The City uses these capital assets to provide a variety of services to its citizens. Accordingly, these assets are not available for future spending. Although the City’s investment in capital assets is reported net of related debt, it should be noted that the resources used to repay this debt must be provided from other sources, since the capital assets themselves cannot be used to liquidate these liabilities.
An additional portion of the City’s net position ($13.2 million or 11.5%) represents resources that may be used only for specified capital projects, special revenue programs, or debt service. The restrictions on these funds were placed there by outside agencies and are not subject to change by the City. The remaining balance of $34.5 million (or 30.2 percent) is unrestricted and may be used to finance day-to-day operations without constraints established by debt covenants or other legal requirements or restrictions. At the end of the current Fiscal Year, the City reported positive balances in all categories of net position.
The City’s net position at the end of current Fiscal Year was $1.5 million higher than the previous year. This increase is primarily due to a $5.1 million or 17.5 increase in unrestricted net position offset by a reduction of $2.3 million and $1.8 million in restricted net position and net position invested in capital assets respectively. The decline in the net position invested in capital assets is mostly due to depreciation, whereas the reduction in the restricted net position is caused by the debt service funds balance included in the prior year as the restricted net position.
Current and other assets increased in governmental activities by $6.1 million from the prior year primarily due to a $6.6 million increase in cash and investments offset by a reduction of $0.7 million in accounts receivables resulting from the current year governmental activities combined with increases in current liabilities. The City recognized a Net OPEB Asset of $86,000 in current year compared to a Net OPEB Liability of $188,000 in the previous fiscal year primarily due to an additional employer’s contribution of Governmental
$50,000 made by the City as well as change in the discount rate used for actuarial estimates, which was increased based on higher anticipated long-term investment returns on prefunded amounts held in trust.
Current liabilities went up by $3.4 million from the previous year, mostly due to an increase of $1.6 million in accounts payable and $1.5 million in deposit liabilities. The increase in the account payable balance reflects $1.2 million payable related to the 2024 pavement restoration project expenses, whereas the deposit obligation increased due to the State's $1.5 million passthrough aid to the Orinda Unified School District for Wagner Ranch.
Long-term liabilities, which consist of general obligation bonds, certificates of participation, compensated absences and postemployment benefit obligations, declined by $2.5 million from the previous year largely due to scheduled principal payments during the current Fiscal Year.
Table 2 below provides a more detailed analysis of the changes that occurred between fiscal years 2024-25 and 2023-24. A comparison of the Statement of Activities is based on revenues, program expenses, and transfers. The program expenses are consolidated into six major activities. Prior year expenses are restated for comparison purposes.
(amounts expressed in thousands)
For the year ended
June 30, 2025June 30, 2024$ Change% Change Revenues:
* restated
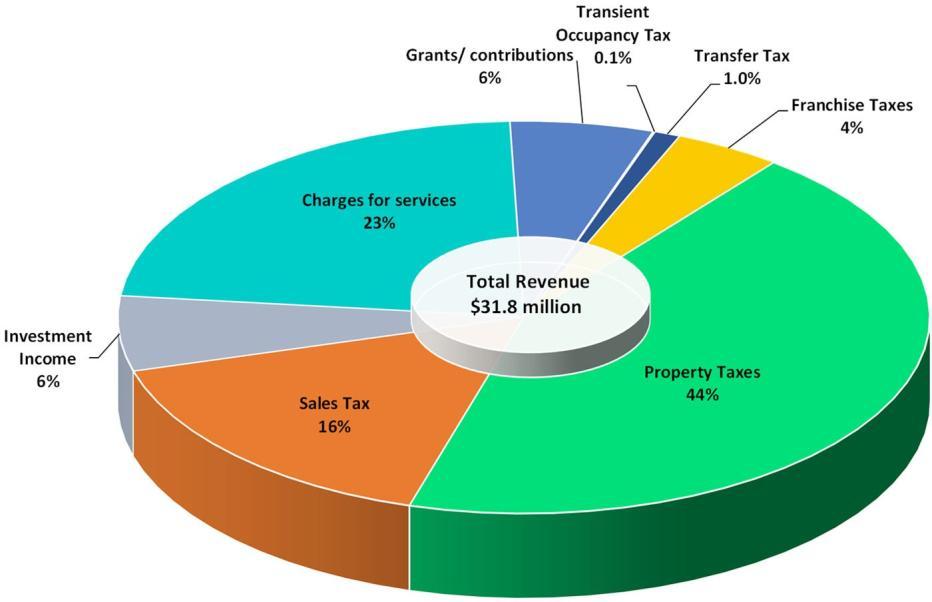
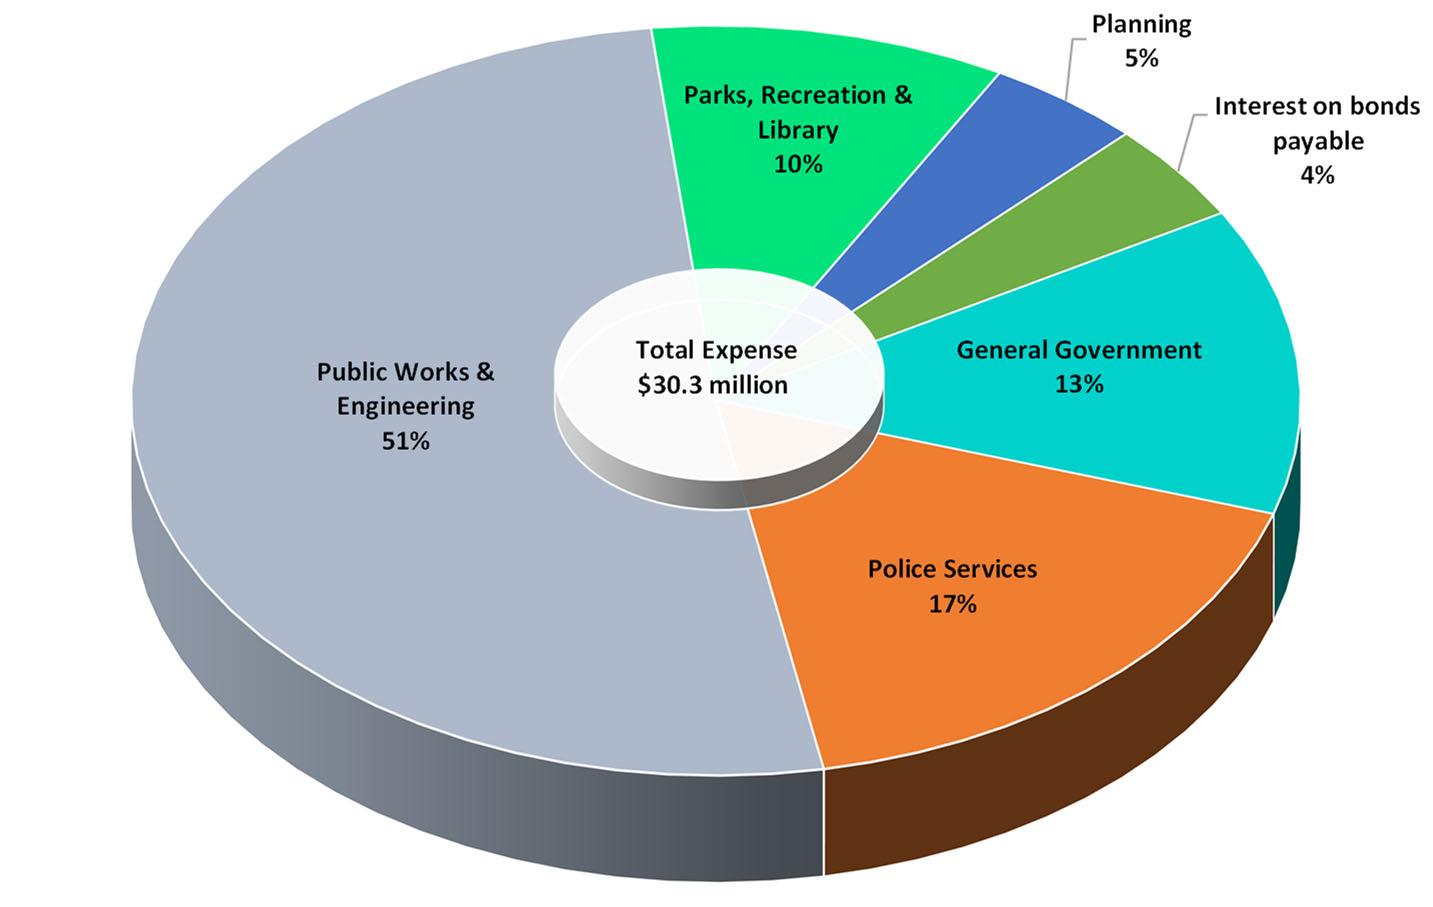
Revenues from all sources totaled $31.8 million and expenses for all city programs totaled approximately $30.3 million in most recent fiscal year. Overall revenue and expenses both went down by approximately $1.8 million (or 5.5 percent) from the previous year. The net changes are made up of both increases and decreases when compared with the prior year. The total net position of the City’s governmental activities was over $114.3 million, an increase of $1.4 million or 1.3 percent from 2024
million. Various events contributed to this increase in net position as discussed in detail below.
Total program revenues declined from the previous year largely due to the decreases in operating grants and contributions and capital grant and contributions categories. Operating grants and contribution were $1.3 million in the current Fiscal Year, down 0.8 million (or 38 percent) from the previous year. This decrease was a result of a $1.2 million grant from the California Department of Transportation for the annual paving project recognized in the prior Fiscal Year. Capital grants and contribution category decreased $1.2 million or 71.7 percent in current Fiscal Year driven by the recognition of a federal grant of $0.9 million for seismic retrofitting of bridges over San Pablo Creek as well as Contra Costa Transportation Authority (CCTA) project-specific grant of $0.5 million in the previous Fiscal Year.
• Property tax- Property tax is the single largest source of revenue to the City which amounted to $13.9 million in the Current Fiscal Year or about 44 percent of total revenue for governmental activities. Orinda's property tax includes an ad-valorum tax of $10.3 million, and special parcel taxes assessed for debt service for general obligation bonds and library services of $3.0 million and $0.5 million, respectively. Total property tax grew $0.5 million (or 3.6 percent) from $13.4 million in the previous Fiscal Year, mostly due to ad-valorum tax as assessed values increased by a similar percentage.
The base automatic annual adjustment in assessed valuation was 2 percent for properties without a change in ownership or new construction. The difference is made of sales at a higher value than the previously assessed value and by construction or improvements which added assessed value. Transfer tax grew $68,000 or 26 percent in the current fiscal year compared to last year as a result of a very competitive housing market.
• Sales tax- The City's second major source of tax revenue is sales tax, which totaled $5.1 million in the current fiscal year and accounted for 16 percent of total governmental revenues. Due to historically high inflation driving up the cost of household necessities (food, utilities, and insurance), consumers spent less on discretionary goods in FY 2024–25, resulting in a decline of $123,000 (or 2.4 percent) in
sales tax receipts from the previous fiscal year.
The point-of-sale revenue derived from local retailers was concentrated in three business categories (Fuel and service stations, restaurants, and food markets). These sectors comprise nearly 56 percent of the City’s local sales tax base. The allocation of sales tax for on-line sales is distributed via a county pool based on the City’s proportional share of point-of-sale transactions compared to the other cities in the County. Due to changes in State law as well as changes in consumer purchase patterns using online transactions, the share of sales tax allocated to the county pool has been significant. In Fiscal Year 2024-25 the pool contributed approximately 20 percent of the total City general purpose sales tax revenue.
The City’s sales tax rate of two percent consists of two major components. The first is a one percent general-purpose sales tax allotted to the City based on local retail sales (point of sale). The second componentisrelatedtothevoter-approvedMeasure Rthatestablishedaonepercentsalestax,replacing the ½ percent Measure L sales tax, commencing April 1, 2021. All sales tax is reported as the General Fund revenue. The ACFR includes a separate schedule which accounts for the voter approved Add-On Sales Tax separate from the “General Purpose” General Fund.
• Franchise tax revenue grew from about $26,000 (or 2.0 percent) from the prior year mostly due to rate and user fee increases.
Net investment income is composed of interest income, dividend income, and unrealized fair market value adjustment. Net investment income was $1.9 million in FY 2024-25, up $74 thousand (or 3.9 percent) from 2023-24 primarily due to greater interest income driven mostly by higher interest rates and unrealized gain on the City’s portfolio.
In keeping with the drop in revenues, the City's overall costs of providing services for governmental activities fell by 5.5 percent. The City transitioned maintenance programs from Park and Recreation Department to the Public Works and Engineering during the current fiscal year. Consequently, the Park, Recreation, and Library spending fell $3.5 million over the previous year while the Public Works and Engineering expenses grew by $1.6 million. The increase in Public Works and Engineering expenses was ascribed to the reorganization-related increases, which was partly offset by a reduction in non-capitalized road repair and maintenance expenses.
The increase in expenses for other functions reflects, in part, increased cost of operations, including contract services as well as personnel costs due to citywide cost-of-living adjustments.
The City maintains 33 individual government funds for financial reporting out of which three funds are reported as major funds individually in the governmental fund financial statements. Those funds are the General Fund, Gas Tax special revenue fund, and Wilder CFD special revenue fund.
Table 3: Revenues, Expenditures, and Changes in Fund Balances (amounts expressed in thousands)
Federal Grant special revenue fund, Wilder facilities Endowment fund, CCTA special revenue fund, City Capital Projects fund, Road Maintenance special revenue fund, Road Bonds 2016 debt service fund, and Road Bonds 2014 debt service fund did not qualify to be a major fund in the current year; therefore, their fund balances are moved to the non-major funds. Data from the remaining governmental funds are combined into a single, aggregated presentation. Individual fund data for each of these nonmajor governmental funds is provided in the form of combining statements in the Non-major Governmental Funds section of this Report.
As part of the overall ACFR, the City has also provided information on individual funds later in the report. Most of the discussion regarding governmental activities is equally applicable to the finances of those governmental funds. However, certain factors that are relevant to the City’s current financial health are more apparent in the fund financial statements than in the government-wide financial statements. Major funds are shown in Table 3. Significant changes in major funds are discussed in more detail below. Fund balance represents the financial standing of a governmental fund as of the end of the fiscal year from a short-term perspective.
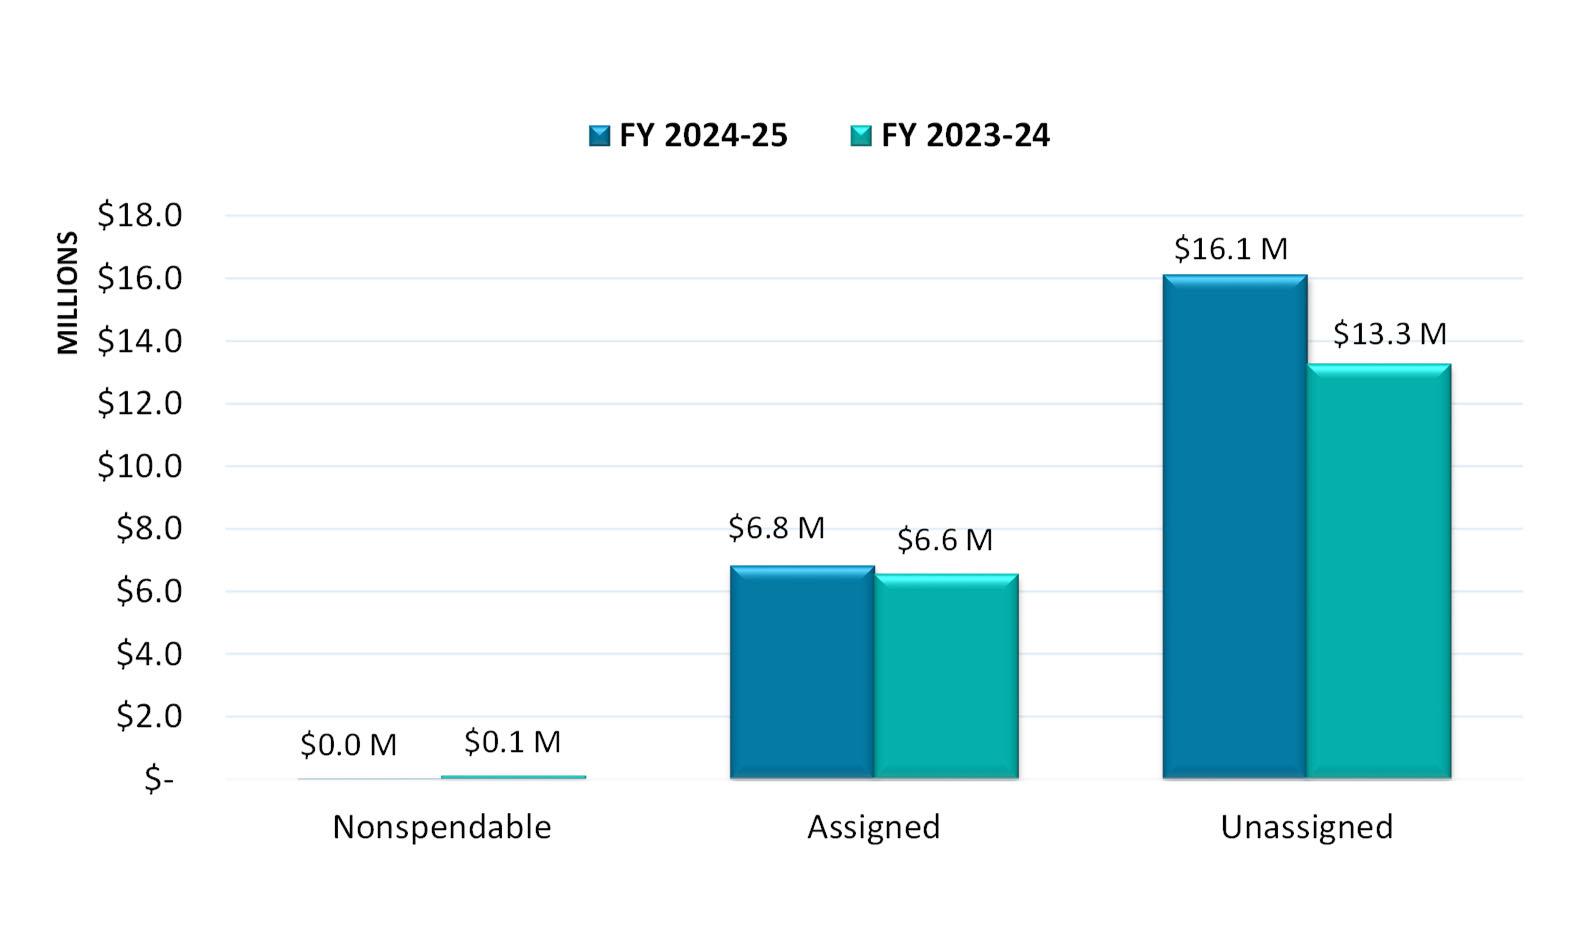
The General Fund is the main operating fund and accounts for the largest share of Governmental Fund revenues (71 percent) and expenses (72 percent). As of June 30, 2025, the fund balance was $22.9 million, an increase of $3.0 million from $19.9 million at the beginning of the year. The non-spendable fund balance of $18,000 represents balances set aside for prepaid and deposits that are not available, spendable resources.
The General Fund column also includes general fund “Add-On Sales Tax” Measure R Approved by the voters in November 2020 (and operative April 1, 2021). The General Fund assigned fund balance of $6.8 million represents Measure R resources.
The total fund balance designated as unassigned was $16.1 million on June 30, 2025. As a measure of the General Fund liquidity, it may be useful to compare both unassigned fund balance and total fund balance to total general fund expenditures and transfers out. The unassigned fund balance includes reserves of $9.1 million for the emergency/contingency reserve which can be only spent on cash flow needs, economic uncertainty, and emergency disaster. The remaining unassigned fund balance of $6.9 million represents approximately 35 percent of total general fund expenditure and transfers out, while the total fund balance of $22.9 million represents approximately 115 percent of the same amount.
The unassigned portion of the General Fund balance complies with the adopted policy to maintain at least 50 percent of expenditures as a contingency (See reserve policy as described in Note 10).
The fund balance of the City’s General Fund increased by 15 percent due to revenue exceeding expenditure although both were higher compared to previous year, as discussed previously. Net transfer in
the current year decreased $2.8 million from previous year. There are no significant transfers in or transfers out for the current fiscal year. Prior year’s transfers were associated with transferring of the American Recovery Plan Act (ARPA) grant from Federal Grant fund into the General Fund to provide funding for the grant expenditures incurred in previous years combined with transfers out to capital project funds and internal services funds for financing anticipated capital projects.
The Gas Tax fund's overall fund balance declined approximately by $0.3 million in the current fiscal year, from a beginning fund balance of $1.5 million to a balance of $1.2 million For the Fiscal Year 2024-25, total expenditures expended on various street maintenance projects were approximately $1.5 million which exceeded total revenues of $1.2 million. In the current Fiscal Year total expenditures were down approximately $0.6 million while total revenues were down $1.2 million over last Fiscal Year. The primary reason for this change is related to a local partnership program grant and related expenditures reported in the prior fiscal year.
The Wilder CFD special revenue fund is responsible for special assessments collected on parcels in the district to maintain public playfields and police services. There is typically a lag in the receiving of special assessments to support expenditures of this fund, resulting in a fund balance shortfall. The fund balance on June 30, 2025, increased by $0.7 million from the beginning fund deficit of $1.8 million, owing principally to the realization of $1.4 million in previously unavailable receipts in the current Fiscal Year. Total expenditures of $0.6 million for the current Fiscal Year were about $0.2 million greater than the previous Fiscal Year, attributable to increased utility demand and rising rates. There were no revenues recognized related to the current Fiscal Year's expenditures because they were not available within the City's 60-day availability period, resulting in a $0.6 million fund balance deficit.
The City has four internal service funds (ISF): Information Systems, Building Maintenance, Vehicle Replacement, and Risk Management. These services solely benefit the governmental function. Total net position in these funds was approximately $5.3 million as of June 30, 2025. This was approximately $0.5 million more than the restated beginning net position. See Note 15 for more information about the restatement. The key driver was an additional transfer of $0.5 million from the General Fund to the Building Maintenance Fund for capital asset acquisitions. Compared to the previous year, total operating expenses in the current year were approximately $100,000 lower, due primarily to a $240,000 reduction in claim expenses, which was offset by higher costs for goods and contract services. Both operating and non-operating revenues were approximately $100,000 greater than the previous year due to higher anticipated operating expenditures, investment income, and gains on the disposal of capital assets. A separate Statement of Net Position and Statement of Cash Flow is included for each of the ISF funds.
As a financial planning document, the General Fund Budget is monitored throughout the year and adjusted based on changes encountered during the year. Budget adjustments are presented to the City Council for approval based on the adopted policy. A summary of the General Fund's original budget and final budget is shown in Table 4 below. The original estimated revenues were revised by $305,000 for property tax based upon a review and analysis of property tax actual receipts
As previously stated, during the current fiscal year, the City reorganized and shifted maintenance programs from the Parks and Recreation Department to the Public Works and Engineering Department, resulting in a budget adjustment for these departments in the final budget. Overall, the original budget amounts were amended by over $2.4 million, mostly due to the following changes:
Approximately $1.1 million of supplemental budget appropriations were adopted for the capital
improvement projects out of which $980,000 of the budget amendment was for the San Pablo Creek Culvert Repair Project.
An additional $497,500 was budgeted for the GIS survey and mapping of public and private storm drains.
The final budget has been increased by $340,000 for the Fire Fuels Reduction Incentive Program.
The amended contract for Animal Control Services and the new labor agreement with Contra Costa County and the Deputy Sheriff's Association resulted in a $280,000 increase in the budget for police services.
(amounts expressed in thousands)
2,386
2,386
Table 5 provides a summary comparing the General Fund Final Adjusted Budget to the Actual results for the Fiscal Year ending June 30, 2025. As a financial plan using estimates and projections, variances are not unexpected. The year ended stronger than expected and ultimately the actual revenue (including transfers) exceeded the budget estimate by $2.3 million. Factors impacting the revenue results included the following:
Actual investment income of $1.4 million was $1.0 million (or 327%) higher than anticipated as the City’s investment pool’s average annualized yield increased due to higher interest rates and unrealized gain on investments.
Property tax collections in FY 2024-25 were $10.3 million, which was $0.5 million (or 5 percent) over final budget, primarily due to higher assessed valuation. Property transfer tax of $326,000 exceeded the budget by $125,000 (or 63%) because of continued strong real estate market.
Service Fees revenues were $4.3 million, which was about $0.5 million (or 13%) above budget due to higher-than-expected receipts for recreation classes and rentals. The positive results for Park and Recreation Service Revenue were partially offset by the reduction in city attorney, public works, and planning revenue. These revenues are very difficult to budget since receipts depend on the timing of development projects within the City.
Duetoactualspendingbeinglessthanfinalbudget,theGeneralFundcompletedtheyearwitha$3.0million favorable variance. The timing of public works and engineering capital project spending is the primary reason driving General Fund expenditures coming in under the budget. Approximately $1.4 million in projected capital improvement projects were not spent this year and are expected to carry over into the following year. In addition, $0.7 million of budget savings for public works and engineering were realized because of delay in filling vacant positions including Maintenance & Facilities
Superintendent and Maintenance Worker I/II/III.
The Police department contributed a budget savings of $0.6 million due to vacancies for a Senior Administrative Assistant and a Community Service Officer, for which $183,000 was set aside to receive additionalservicesfromtheSheriff'sDepartment,buttheCityhasnotbeenabletoarrangeforthisenhanced service level yet.
An additional budgetary savings of approximately $0.5 million were realized from the planning services because of vacancies and timing of professional services and Contract services (Cost Recovery) primarily due to implementation delays of the Downtown Precise Plan and Housing Element related to a CEQA lawsuit and hiring of a legislative advocacy firm.
The City management actual expenditures came under budget by $0.2 million largely due to unspent Fire Fuel Reduction Incentive program allocations. The Fire Fuel Reduction Incentive program is relatively new reimbursement based pilot grant program funded by Measure R which has not experienced the utilization rates initially anticipated.
The various budget savings were partially offset by the Park and Recreation expenditures which exceeded budget by $0.3 million because of the costs associated with increased demand for recreation services. Expenditures for the administrative services also came over budget due to temporary staffing and additional contribution of $50,000 to the retiree health trust.
Table 5 summarizes the results of the Final Adjusted Budget compared to the final Actual results for the fiscal current Fiscal Year. The complete schedule, which includes additional detail, as required, is included in the Required Supplementary Information section following the notes to the financial statements.
TABLE 5: GENERAL FUND FINAL BUDGET AND ACTUAL
The discussion thus far has only touched upon certain significant transactions and events during the current Fiscal Year with respect to capital assets. Overall, the carrying value of capital assets—original cost minus accumulated depreciation remained reduced approximately $3.6 million from the previous year. The City’s capital assets for governmental activities as of June 30, 2025, amounted to $106.6 million (net of accumulated depreciation). This investment in capital assets includes land, buildings, improvements, machinery and equipment, park facilities, roads, and bridges, and work in progress.
June 30, 2025June 30, 2024$ Change
and
As shown in Table 6 above, the combined total addition to capital assets was approximately $4.0 million offset by the current year’s depreciation of $3.6 million. However, that does not completely capture the substantial amount of capital investment activity that occurred in 2025. Work in progress added about $3.8 million in capital assets which are offset by a reduction of $4.8 million in transfers to depreciable capital asset category as these assets were put into operation during the year. Many of the completed and ongoing capital projects are related to city-wide transportation and drainage improvement.
Major additions to Work in progress during FY 2024-25 included: $2.2 million in San Pablo Creek Culvert Repair,$0.7millionindrainageimprovementprojects,$0.1millioninStreetimprovementprojects(Annual Pavement projects, traffic signal improvement, cross walk improvement), and $0.7 million in facilities improvement (HVAC replacement, windows replacement, exterior painting).
Infrastructure recorded an addition of $4.4 million consisting of $1.5 million in federal aid projects related to seismic retrofit of bridges, and $2.6 million related to drainage improvements (Storm drain repair and Culvert Repair) including $2.5 million for the San Pablo Creek Culvert Repair, and $0.3 million for completed Street improvement projects.
Detailed information regarding composition and activity in capital assets is provided in Note 6 to the financial statements.
As of June 30, 2025, the total outstanding long-term obligation balance was approximately $40.0 million. The combined balance outstanding decreased by $2.1 million from the prior year due to scheduled principal payments made during the current Fiscal Year. The City’s total long-term debts and obligations as summarized in Table 7 below.
(amounts expressed in thousands)
Approximately 87 percent of the total debt balance is attributable to voter-approved General Obligation Bonds issued to fund road and drainage projects. General obligation (GO) bonds are debt instruments issued by the City to raise funds for public works. The source of repayment is a special additional ad valorem property tax that is levied solely to address the outstanding debt. The Certificate of Participation (COP) is a lease financing transaction that was entered into to pay for the cost of City Hall. The current obligation represents the refunding of an earlier transaction, and it is repaid by the General Fund. Further details related to outstanding debt can be found in Note 9 of the financial statements.
The local economic health is tied to the regional, state, and national economies which are difficult to anticipate given the uncertainty created by current global events such as tariffs, trade conflicts, and geopolitical concerns.
The City of Orinda is responsible for providing essential services required by its citizens. The City’s ability to provide a high level of services to its citizens depends upon balancing expenditure growth with what is occurring to City revenue.
The challenge is that the City only collects a small portion of the total property taxes paid by property owners, while retail/commercial land uses are significantly outnumbered by residential properties. The City Council and community have recently adopted the Downtown Precise Plan and an updated Housing Element and Safety Plan, which are components of the City General Plan. The implementation of these long-range planning efforts, which are heavily influenced by changes in State Laws, will help guide Orinda’s development in the future. However, there are no current developments that will significantly increase the number of residences and assessed value on the base property tax.
In the last decade, the City’s property tax experienced a robust average annual growth of 8 percent. More recently, the housing market has been slowed by high mortgage rates, housing shortage, and rapid price increases following the pandemic. Property tax revenues in next year’s budget are forecast to grow at a slower pace than has been realized in recent years. Sales tax growth is also projected to slow down in FY 2025-26, as continued inflation and tariff concerns dampens consumer confidence and demand.
With the collection of the new Measure R Add-On Sales tax that began in April 2021, the City is embarking on new initiatives to address priority needs when the tax measure was presented to the voters. The initial focus is on addressing the risks posed by wildfires and disaster response and preparedness Other critical priorities include critical storm drainage repairs and improvements and continued maintenance of the public roadways. Higher service levels on fire fuel mitigation and vegetation management over the next two years have been incorporated in the biennial budget.
The adopted Biennial Budget also reflects continued investment in public safety, including contracting for a dedicated sworn position to work with the community, schools, and enhancing the City’s disaster planning efforts. Resources have also been made available for technology and tools that result in improved public
safety, as well as the safety of police officers.
The City's labor agreement with Teamsters Local 856 expired on June 30, 2025. Since then, the City has signed a new three-year agreement with the bargaining unit which includes annual raises in base salary of 5% in July 2026, 4% in July 2027, and 3% in July 2028. The fiscal effects of this new contract were not completely accounted for in the biennial budget adopted in June 2025 for FY 2025-26 and 2026-27. The portion attributable to Fiscal Year 2025-26 was appropriated via appropriation in July 2025. During the Fiscal Year 2025-26, the financial impact of that agreement for Fiscal Year 2026-27 will be brought to City Council, as part of the appropriation process.
AttheendofthecurrentFiscalYear,theunassigned(unrestricted)fundbalancenetofreservesintheGeneral Fund was $6.9 million. The City has appropriated $4.2 million of this amount in the Fiscal Year 2025-26 budget. The City will continue to monitor the impacts of inflation while balancing revenues and expenditures, including the need for additional ongoing staffing resources as well as strategic one-time expenditures aimed at addressing stormwater infrastructure, roadways, and City facilities.
This financial report is designed to provide a general overview of the City’s finances for all those with an interest in the government’s finances. Questions concerning any information provided in this report or requests for additional financial information should be directed to:
City of Orinda Attention: Finance Department
22 Orinda Way Orinda, CA 94563
(925) 253-4220
This page intentionally left blank
This page intentionally left blank
This page intentionally left blank
June 30, 2025
of Activities
For the year ended June 30, 2025
114,315,605 $ Net (Expense) Change in Net Revenue and Program Revenues
22,754,932
Governmental Fund Financial Statements
Proprietary Fund Financial Statements
Fiduciary Fund Financial Statements
This page intentionally left blank
Major funds are defined generally as having significant activities or balances in the current year.
ThefundsdescribedbelowweredeterminedtobeMajorFundsbytheCityforfiscalyear2024-25.Individualother governmental funds may be found in the Supplemental Section.
GeneralFund -TheGeneralFundistheCity’sprimaryoperatingfund.Itaccountsforallfinancialresourcesofthe general government, except those required to be accounted for in another fund.
WilderCommunityFacilities(CFD) - AccountsforrevenuesreceivedfromparcelsintheDistrictandexpenditures associated with maintenance of public playfields and police services
Gas Tax Fund - Accounts for the excise tax used for street maintenance and related capital projects.
This page intentionally left blank
Governmental Funds
June 30, 2025
LIABILITIES, DEFERRED INFLOWS OF RESOURCES AND FUND BALANCES
Reconciliation of the Governmental Funds Balance Sheet to the Government-Wide Statement of Net Position
June 30, 2025
Amounts reported for governmental activities in the statement of net position are different because:
Capitalassetsusedin governmentalactivitieswerenotcurrent financialresources.Therefore,theywerenotreportedinthe GovernmentalFundsBalanceSheet.Exceptfortheinternalservice funds reported below, the capital assets were adjusted as follows:
Internalservicefundswereusedby managementtochargethecosts ofcertainactivities,suchasinsurance,toindividualfunds.The assetsandliabilitiesoftheInternalservicefundswereincludedin governmentalactivitiesintheGovernment-WideStatementofNet Position. 5,330,226
Unavailablerevenuesrecordedinthefundfinancialstatements resulting from activities in which revenues were earned but were not availablearereclassifiedasrevenuesintheGovernment-Wide Financial Statements. 938,417
IntheGovernment-WideFinancialStatements,deferredemployer contributionsforpensionandOPEB,certaindifferencesbetween actuarialestimatesandactualresults,andotheradjustments resultingfromchangesinassumptionsandbenefitsaredeferredin the current year.
Long-termassetsand liabilitieswerenot dueand payableinthe current period. Therefore, they were not reported in the
Position of Governmental Activities 114,315,605 $
This page intentionally left blank
For the year ended June 30, 2025
Funds
Major Funds
5,061,697
1,355,415
325,927
32,461,995
1,189,379
514,033
463,645
1,423,382
2,144,629
5,156,262
1,271,525
129,785
3,233,455
1,635,000 2,005,000
1,314,243 1,504,587
5,845,529 27,853,518
Statement of Revenues, Expenditures and Changes in Fund Balances Governmental Funds (Continued)
For the year ended June 30, 2025
BALANCES:
(1,374,013)
Reconciliation of the Statement of Revenues, Expenditures, and Changes in Fund Balances of Governmental Funds to the Government-Wide Statement of Activities
For the year ended June 30, 2025 Net Change in Fund Balances - Total Governmental Funds 4,066,363 $
AmountsreportedforgovernmentalactivitiesintheGovernment-WideStatementof Activities were different because:
Governmentalfundsreportedcapitaloutlayasexpenditures.However,inthe Government-WideStatementofActivities,thecostofthoseassetswasallocatedover theirestimatedlivesasdepreciationexpense.Thiswastheamountofcapitalassets recorded in the current period, net of the amount related to internal service funds.
3,233,455 Disposals of capital assets (71,005)
Depreciationexpenseon capitalassetswasreportedin theGovernment-Wide StatementofActivities,butdidnotrequiretheuseofcurrentfinancialresources. Therefore,depreciationexpensewasnotreportedasexpendituresinthegovernmental funds, net of the amount related to internal service funds. (7,517,707)
Accruedcompensatedleavepaymentswerereportedasexpendituresin the governmentalfunds,howeverexpenseisrecognizedintheGovernment-Wide Statement of Activities based on earned leave accruals. (75,065)
Debtproceedsprovidecurrentfinancialresourcestogovernmentalfunds,butissuing debtincreasedlong-termliabilitiesintheGovernment-WideStatementofNetPosition. Repaymentofdebtwasanexpenditureingovernmentalfunds,buttherepayment reduced long-term liabilities in the Government-Wide Statement of Net Position.
OPEBexpense/(income)isreportedin theGovernment-WideStatementofActivities doesnotrequiretheuseofcurrentfinancialresources,andthereforeisnotreportedas expenditures or revenues in governmental funds. 44,005
Unavailablerevenuesrecordedin thefundfinancialstatementsresulting fromactivities inwhichrevenueswereearnedbutwerenotavailablearereclassifiedasrevenuesin the Government-Wide Financial Statements. (931,113)
Internalservicefundswereusedbymanagementtochargethecostsofcertain activities,suchasinsuranceandfleetmanagement,toindividualfunds.Thenet revenue of the internal service funds was reported with governmental activities.501,325
Change in Net Position of Governmental Activities 1,467,261 $
Proprietaryfundsrecognizeoperatingrevenuesandexpensesseparatelyfromnonoperatingitems.Theinternal servicefundsaretheCity'sonlyproprietaryfunds,andincludechargestotheCity'sotherfundsforservicesas operatingrevenue.Operatingexpensesincludeitemssuchasdepreciationoncapitalassets,administrativeexpenses, andinsuranceasoperatingexpenses.Allotherrevenuesandexpensesnotmeetingthesedefinitionsarereportedas nonoperating items.
This page intentionally left blank
Statement of Net Position
Proprietary Funds
June 30, 2025
Current Assets: Cash, cash equivalents, and investments4,364,249 $ Prepaids items and deposits15,326
Proprietary Funds
For the year ended June 30, 2025
Proprietary Funds
For the year ended June 30, 2025
CASH FLOWS FROM OPERATING ACTIVITIES:
OF OPERATING INCOME (LOSS) TO NET CASH PROVIDED BY (USED IN) OPERATING ACTIVITIES:
This page intentionally left blank
FIDUCIARY
FiduciaryfundsareusedtoaccountforassetsheldbytheCityasanagentorintrustforindividuals,private organizations,andothergovernments.ThefinancialactivitiesofthesefundsareexcludedfromtheEntity-wide financial statements, but are presented in separate Fiduciary Fund financial statements.
This page intentionally left blank
June 30, 2025
For the year ended June 30, 2025
This Page Left Intentionally Blank
For the Year Ended June 30, 2025
The basic financial statements of the City of Orinda (the “City”) have been prepared in conformity with Generally Accepted Accounting Principles (GAAP) as it applies to government units. The Governmental Accounting Standards Board (GASB) is the accepted standard-setting body for establishing governmental accounting and financial reporting principles. The more significant of the City's accounting policies are described below.
The City is legally separate and fiscally independent with means it can issue debt, set and modify budgets and fees, and sue or be sued. These financial statements present the government and its component unit entities for which the government is considered to be financially accountable. Blended component units, although legally separate entities, are in substance, part of the government’s operations and so data from these units are combined with data of the primary government.
The financial statements of the primary government of the City of Orinda include the activities of the City as well as the City of Orinda Facilities Financing Corporation (the “Corporation”), which is controlled by and dependent on the City. While the Corporation is a separate legal entity, its financial activities are integral to those of the City, and its financial activities have been aggregated and merged (termed “blending”) with those of the primary government of the City in the accompanying financial statements.
The City of Orinda Facilities Financing Corporation was formed under the laws of the State of California for the purpose of providing financial assistance to the City in financing the acquisition and improvement of public buildings, equipment, and facilities. The City Council serves as the Board of the Corporation. Although the Corporation is a separate legal entity from the City, it is reported as if it were part of the primary government, because its sole purpose is to be a financing entity for the City. The Corporation does not issue separate basic financial statements.
The Statement of Net Position and Statement of Activities display information about the reporting government as a whole. They include all funds of the reporting entity except for fiduciary funds. The statements distinguish between governmental and business-type activities. Governmental activities generally are financed through taxes, intergovernmental revenues, debt issuance and other non- exchange revenues. Business-type activities are financed in whole or in part by fees charged to external parties for services. The City has no business-type activities as of June 30, 2025.
For the Year Ended June 30, 2025
Continued
B. Basis of Presentation, Continued
Fund Financial Statements
Fund financial statements of the reporting entity are organized into funds, each of which is considered to be a separate accounting entity. Each fund is accounted for by providing a separate set of self- balancing accounts that constitute its assets, deferred outflows of resources, liabilities, deferred inflows of resources, fund balance, revenues, and expenditure/expenses. Funds are organized into three major categories: governmental, proprietary (business type), and fiduciary. An emphasis is placed on major funds within the governmental and proprietary categories. A fund is considered major if it is the primary operating fund of the City or meets the following criteria:
a. Total assets plus deferred outflows of resources, liabilities plus deferred inflows of resources, revenues, or expenditures/expenses of that individual governmental or proprietary fund are at least 10 percent of the corresponding total for all funds of that category or type; and
b. Total assets plus deferred outflows of resources, liabilities plus deferred inflows of resources, revenues, or expenditures/expenses of the individual governmental fund or proprietary fund are at least 5 percent of the corresponding total for all governmental and proprietary funds combined.
The funds of the reporting entity are described below:
Governmental Funds
General Fund
The General Fund is the primary operating fund of the City and is always classified as a major fund. It is used to account for all activities except those legally or administratively required to be accounted for in other funds.
Special revenue funds are used to account for the proceeds of specific revenue sources that are legally restricted to expenditures for certain purposes. Most special revenue funds of the City are categorized as ''nonmajor governmental funds" since they do not meet the criteria individually as a major fund. For the fiscal year ended June 30, 2025, the Wilder Community Facilities District (CFD), and Gas Tax Funds are considered major funds.
Capital project funds are used to account for resources restricted for the acquisition or construction of specific capital projects or items. The reporting entity includes five capital project funds which are used to account for the acquisition of capital assets with transfers made from the General Fund and other fund sources. For the fiscal year ended June 30, 2025 the City Capital Projects Fund is considered a non-major fund.
Debt service funds are used to account for the collection of tax proceeds and the payment of debt services.
For the Year Ended June 30, 2025
Continued
B. Basis of Presentation, Continued
Proprietary Funds
Enterprise (Business-Type) Fund
Enterprise funds are used to account for business-like activities provided to the general public. These activities are financed primarily by user charges and the measurement of financial activity focuses on net income measurement similar to the private sector. The City has no enterprise funds.
The internal service funds are used to account for the financing of goods or services provided by one department to other departments of the City, on a cost reimbursement basis. These funds are rolled into the governmental activities for the government-wide statements of net position and activities. The City use these funds to account for the costs associated with information systems, building maintenance, vehicle replacement and risk management.
Fiduciary funds (not included in government-wide statements)
Fiduciary Funds
Fiduciary funds are used to account for resources held for the benefit of parties outside of the government. Fiduciary funds are not reported in the government-wide financial statements because the resources of those funds are not available to support the City’s own programs. The accounting used for the fiduciary funds is much like that used for proprietary funds.
For the Year Ended June 30, 2025
Continued
B. Basis of Presentation, Continued
The City maintains one type of fiduciary fund. The Custodial Funds report resources, not in a trust that are held by the City for other parties outside of the City’s reporting entity. The Geologic Hazard Abatement Districts (GHAD) Custodial Fund accounts for monies held for the GHAD, an agency to which the City provides accounting and investing services, which is not held in a trust.
Major and non-major funds
The funds are further classified as major or non-major as follows: Fund Brief
Major:
General Fund
Wilder Community Facilities (CFD)
Gas Tax fund
Non Major:
Primary operating fund of the City.
AccountsforrevenuesreceivedfromparcelsintheDistrictandexpenses associated with maintenance of public playfields and police services.
Accountsfortheexcisetaxusedforstreetmaintenanceandrelatedcapital projects.
Special Revenue FundsUsedtoaccountforproceedsofspecificsourcesthatarerestrictedor committed for expenditures for specific purposes.
Capital Projects Funds
Debt Service Funds
UsedtoaccountfortransfersfromtheGeneralFundandExpenditures relatedtoinfrastructureimprovements,aswellastoaccountforspecific capital improvements.
Accountsforthecollectionoftaxproceedsandthepaymentofdebtservice for the 2014 and the 2016 General Obligation Bonds.
For the Year Ended June 30, 2025
Continued
C. Measurement Focus and Basis of Accounting
Measurement focus is a term used to describe "which" transactions are recorded within the various financial statements. Basis of accounting refers to "when" transactions are recorded regardless of the measurement focus applied.
Measurement Focus
On the government-wide Statement of Net Position and the Statement of Activities, both governmental and business-type activities are presented using the economic resources measurement focus as defined below.
In the fund financial statements, the current financial resources measurement focus or the "economic resources" measurement focus is used as appropriate:
a. All governmental funds utilize a current financial resources measurement focus. Only current financial assets and liabilities are generally included on their balance sheets. Their operating statements present sources and uses of available spendable financial resources during a given period. These funds use fund balance as their measure of available spendable financial resources at the end of the period.
b. The proprietary fund (business-type utilize) an economic resources measurement focus. The accounting objectives of this measurement focus are the determination of operating income, changes in net position (or cost recovery), financial position, and cash flows. All assets and liabilities (whether current or noncurrent) associated with their activities are reported. Proprietary fund equity is classified as net position. The City has four internal service funds which are included in the Government-wide Statements. The City has no enterprise funds.
c. The fiduciary fund financial statements are reported using the economic resources measurement focus and the accrual basis of accounting. Revenues are recorded when earned and expenses are recorded when liability is incurred, regardless of the timing of related cash flows. Property taxes are recognized as revenues in the year for which they are levied. Grants and similar items are recognized as revenues as soon as all eligibility requirements imposed by the provider have been met.
These basic financial statements are presented on an economic resources measurement focus and the accrual basis of accounting. Accordingly, all of the City's assets, deferred outflows of resources, and liabilities, deferred inflows of resources, including capital assets, as well as infrastructure assets, and long-term liabilities, are included in the accompanying Statement of Net Position. The Statement of Activities presents changes in net position. Under the accrual basis of accounting, revenues are recognized in the period in which they are earned while expenses are recognized in the period in which the liability is incurred.
For the Year Ended June 30, 2025
Continued
C. Measurement Focus and Basis of Accounting, Continued
Certain types of transactions are reported as program revenues for the City in three categories:
Charges for services
Operating grants and contributions
Capital grants and contributions
Certain eliminations have been made in regards to interfund activities, payables and receivables. All internal balances in the Statement of Net Position have been eliminated except those representing balances between the governmental activities and the business-type activities, which are presented as internal balances and eliminated in the total primary government column. In the Statement of Activities and Changes in Net Position, internal service fund transactions have been eliminated; however, those transactions between governmental and business-type activities would not be eliminated. The following interfund activities have been eliminated:
Due to/from other funds
Advances to/from other funds
Transfers in/out
The City applies all applicable GASB pronouncements for certain accounting and financial reporting guidance.
Governmental Fund Financial Statements
Governmental fund financial statements included a Balance Sheet and a Statement of Revenues, Expenditures and Changes in Fund Balances for all major governmental funds and non-major funds aggregated. An accompanying schedule is presented to reconcile and explain the differences in fund balance as presented in these statements to the net position presented in the government-wide financial statements. The City has presented all major funds that met the applicable criteria.
All governmental funds are accounted for on a spending or current financial resources measurement focus and the modified accrual basis for accounting. Accordingly, only current assets and current liabilities are included on the Balance Sheet. The Statement of Revenues, Expenditures and Changes in Fund Balances presents increases (revenues and other financing sources) and decreases (expenditures and other financing uses) in fund balance. Under the modified accrual basis of accounting, revenues are recognized in the accounting period in which they become both measurable and available to finance expenditures of the current period.
Revenues are recorded when received in cash, except that revenues subject to modified accrual are recognized when due. The primary revenue sources accrued by the City are property tax, sales tax, franchise taxes, special assessments, intergovernmental revenues and other taxes. Expenditures are recorded in the accounting period in which the related fund liability is incurred.
For the Year Ended June 30, 2025
Continued
C. Measurement Focus and Basis of Accounting, Continued
Deferred inflows of resources - unavailable revenues arise when potential revenues do not meet both the measurable and available criteria for recognition in the current period. In subsequent periods, when both revenue recognition criteria are met the deferred inflows of resources – unavailable revenue is removed and revenue is recognized.
Unearned revenues arise when the government receives resources before it has a legal claim to them, as when grant monies are received prior to incurring qualifying expenditures. In subsequent periods when the government has a legal claim to the resources, the unearned revenue is removed and revenue is recognized.
The Reconciliation of the Fund Financial Statements to the Government-Wide Financial Statements is provided to explain the differences created by the integrated approach of GASB Statement No. 34.
All proprietary and fiduciary funds utilize the accrual basis of accounting. Under the accrual basis of accounting, revenues are recognized when earned and expenses are recorded when the liability is incurred or the economic asset is used.
Cash and Investments
For the purpose of the Statement of Net Position, cash and cash equivalents includes all cash accounts, savings accounts, certificates of deposits of the City, and the investment in the State of California fund called the Local Agency Investment Fund (LAIF) which is available for immediate withdrawal. For the purpose of the proprietary fund Statement of Cash Flows, cash and cash equivalents include all demand and savings accounts, investment in LAIF, and certificates of deposit or short-term investments with an original maturity of three months or less. Restricted cash is not considered a cash equivalent.
Investments are carried at fair value except for short-term U.S. Treasury obligations with a remaining maturity at the time of purchase of one year or less. Those investments are reported at amortized cost.
During the course of operations, numerous transactions occur between individual funds that may result in amounts owed between funds. Those related to goods and services type transactions are classified as due to/from other funds. Short-term interfund loans are reported as interfund receivables and payables. Interfund receivables and payables between funds within governmental activities are eliminated in the Statement of Net Position.
In the government-wide statements, receivables consist of all revenues earned at year-end and not yet received. Allowances for uncollectible accounts receivable are based upon historical trends and the periodic aging of accounts receivable. Major receivable balances in the government-wide and fund receivable balances in the fund financial statements are substantially the same for the City.
For the Year Ended June 30, 2025
Continued
In the fund financial statements, material receivables in governmental funds include revenue accruals such as sales tax, transfer tax, franchise tax, and grants and other similar intergovernmental revenues since they are usually both measurable and available. Non-exchange transactions collectible but not available are deferred in the fund financial statements in accordance with modified accrual, but not deferred in the government-wide financial statements in accordance with the accrual basis. Interest and investment earnings are recorded when earned only if paid within 60 days since they would be considered both measurable and available.
All capital assets are valued at historical cost or estimated historical cost if actual is unavailable, except for donated capital assets which are recorded at their estimated acquisition value at the date of donation. Estimated historical cost was used to value the majority of the assets for which cost was not available.
Prior to July 1, 2002, governmental funds' infrastructure assets were not capitalized. These assets have been valued at estimated historical cost.
Depreciation of all exhaustible capital assets is recorded as an allocated expense in the Statement of Activities, with accumulated depreciation reflected in the Statement of Net Position. Depreciation is provided over the assets' estimated useful lives using the straight-line method of depreciation.
The range of estimated useful lives by type of assets is as follows:
Land, easement, and right of way N/A
Building, grounds and improvements10-39
City’s capitalization policy is as follows:
Restricted assets include cash and investments that are legally restricted as to their use.
The accounting treatment of long-term debt depends on whether the assets are used in governmental fund operations or proprietary fund operations and whether they are reported in the governmental-wide fund financial statements.
All long-term debt to be repaid from governmental and business-type resources is reported as liabilities in the government-wide statements. The long-term debt consists primarily of a Certificate of Participation (COP) and General Obligation bonds.
For the Year Ended June 30, 2025
Continued
D. Assets, Deferred Outflows/Inflows of Resources, Liabilities, and Equities, Continued
Long-term debt for governmental funds is not reported as liabilities in the fund financial statements. The debt proceeds are reported as other financing sources and payment of principle and interest reported as expenditures. The accounting for a proprietary fund is the same in the fund statements as it is in the government-wide statements.
The City's policies regarding paid time off permit employees to accumulate earned but unused general leave. In lieu of vacation and sick leave, employees accrue general leave of nineteen (19) days during the first year of employment, increasing by one (1) day for each subsequent year of employment, up to a maximum accrual of twenty-five (25) days of general leave. General leave begins accruing on the first (1st) day of the month following the date of employment Employees can accrue general leave up to a maximum of 480 hours. Upon termination, the accumulated general leave will be paid to the employee at their current rate of regular pay. Once a year, employees who have accrued over 160 hours of general leave may elect to cash out a maximum of forty (40) hours of their accrued general leave. A balance of no less than 160 hours must remain after cash out. Compensated absences liability is recorded in the government-wide statements.
The changes in compensated absences during the current fiscal year were as follows:
Balance as of June 30, 2024 (restated)
Net increase/ (decrease)
Balance as of June 30, 2025Current
Fair value is defined as the price that would be received to sell an asset or paid to transfer a liability in an orderly transaction between market participants at the measurement date. The City categorizes its fair value measurements within the fair value hierarchy established by generally accepted accounting principles. The fair value hierarchy categorizes the inputs to valuation techniques used to measure fair value into three levels based on the extent to which inputs used in measuring fair value are observable in the market.
Level 1 inputs are quoted prices (unadjusted) in active markets for identical assets or liabilities.
Level 2 inputs are inputs – other than quoted prices included within level 1 – that are observable for an asset or liability, either directly or indirectly.
Level 3 inputs are unobservable inputs for an asset or liability.
If the fair value of an asset or liability is measured using inputs from more than one level of the fair value hierarchy, the measurement is considered to be based on the lowest priority level input that is significant to the entire measurement.
For the Year Ended June 30, 2025
Continued
The preparation of the financial statements in conformity with generally accepted accounting principles (GAAP) requires management to make estimates and assumptions that affect the reported amounts of assets and liabilities and disclosure of contingent assets and liabilities at the date of the financial statements and the reported amounts of revenues and expenses during the reporting period. Actual results could differ from those estimates.
State of California ("State") Constitution Article XIII provides for a maximum general property tax rate statewide of $1.00 per $100 of assessed value. Assessed value is calculated at 100% of market value as defined by Article XIII. The State Legislature has determined the method of distribution of receipts from the $1.00 levy among the counties, cities, school districts and other districts. Counties, cities and school districts may levy such additional tax rate as is necessary to provide for voter approved debt service. The county uses the following calendar to assess properties, and to bill for, collect, and distribute property taxes.
Lien Dates
January 1
Levy Dates July 1
Due Dates
50% on November 1
50% on February 1
Unsecured
January 1
July 1
July 1
Delinquent as of December 10 April 10 August 31
The term "unsecured" refers to taxes on personal property other than real estate, land and buildings. Secured taxes are secured by liens on the property being taxed.
The City is part of the Teeter Plan. The Teeter Plan allows California counties to finance property tax receipts for local agencies by borrowing money to advance cash to each taxing jurisdiction (including the city) in an amount equal to the current year's delinquent property taxes. In exchange, the counties receive the penalties and interest on the delinquent taxes when collected.
The sales tax levied in the city of Orinda is 9.75% of taxable sales within the City of which 2.0% is allocated to the City. The sales tax is collected by the State and remitted to the City. State makes advances based on estimates with quarterly settlements since the City receives the sales tax approximately one to three months after collection by vendors. Sales taxes collected by the State in June and July (which represent sales for May and June) and received by the City in July and August have been accrued and are included under the caption "Accounts Receivable". The 9.75% sales tax includes some transportation funds which are allocated to the City pursuant to street/pavement needs as approved by the Contra Costa Transportation Authority (CCTA). It also includes a 1.0% add-on tax approved by the Orinda voters in November 2020. The add-on tax (Measure R) sunsets in 2041.
For the Year Ended June 30, 2025
Continued
G. Revenues, Expenditures, and Expenses, Continued
Other Revenues
Other revenues as realized by the City include recreation fees, planning fees, public works/engineering fees, franchise taxes, property transfer taxes, vehicle license fees and vehicle and parking fines.
Expenditures / Expenses
In the government-wide financial statements, expenses are classified by function for governmental activities.
In the fund financial statements, expenditures are classified as follows:
Governmental Funds-By Character: Current (further classified by function)
Capital Outlay
Debt Service
In the fund financial statements, governmental funds report expenditures of financial resources.
Permanent reallocations of resources between funds of the reporting entity are classified as interfund transfers. For the purposes of the Statement of Activities, which consists of consolidated governmental funds, all interfund transfers between individual governmental funds have been eliminated.
The City of Orinda adopts a biennial budget on or before June 30 for the ensuing two fiscal years for all funds. This budget is prepared on a modified accrual basis. In developing the biennial budget, City departments analyzed existing service levels and potential services in light of the strategic priorities and financial constraints and modified their proposed budgets accordingly. The City's operating budget summarizes planned expenditures and revenues for all City departments and programs. The detail is structured to summarize each department's costs by type, division and funding sources.
The biennial budget process sets forth planned expenditures and revenues for two consecutive fiscal years. Year 1 and 2 expenditure and revenue plans are presented to Council in a single document. At the conclusion of the biennial budget review and deliberation process, Year 1 of the biennial budget is approved and appropriated by Council, which sets the level of authorized funding for the fiscal year. The Year 2 budget is also approved but is subject to mid-cycle review and appropriation action in the following year. Funds not expended in Year 1 do not automatically roll into Year 2. During the mid- cycle review, staff proposes changes (if any). At that time, Council will consider the proposed changes and recommendations. At the conclusion of the deliberations, the Council will approve and appropriate funds for Year 2 of the budget.
In addition to the annual budget process, the Council reviews expenditures and revenues at the mid- year and makes changes as needed. The legal level of budgetary control has been stablished at the fund level.
For the Year Ended June 30, 2025
Continued
The following funds had expenditures in excess of appropriations in fiscal year 2024-25:
In addition to assets, the statement of net position will sometimes report a separate section for deferred outflows of resources. This separate financial statement element, deferred outflows of resources, represents a consumption of net assets that applies to a future period(s) and so will not be recognized as an outflow of resources (expense/expenditure) until then.
In addition to liabilities, the statement of net position will sometimes report a separate section for deferred inflows of resources. This separate financial statement element, deferred inflows of resources, represents an acquisition of net assets that applies to a future period(s) and so will not be recognized as an inflow of resources (revenue) until that time.
In 2025, the City adopted new account standards in order to confirm with the following Government Accounting Standards Board Statements:
GASB Statement No. 101, Compensated Absences - The objective of this Statement is to better meet the information needs of financial statement users by updating the recognition and measurement guidance for compensated absences. That objective is achieved by aligning the recognition and measurement guidance under a unified model and by amending certain previously required disclosures. The City restated its beginning compensated absence balances and its current year accounting and disclosures as part of implementation of this Statement.
GASB Statement No. 102, Certain Risk Disclosures - The objective of this Statement is to provide users of government financial statements with essential information about risks related to a government’s vulnerabilities due to certain concentrations or constraints. The City implemented the requirement of this statement during the current fiscal year. It resulted in no disclosure.
For the Year Ended June 30, 2025
A. Fund Accounting Requirements
The legally required funds used by the City include the following:
Gas tax
Transportation impact
Drainage impact
Library
Park dedication
Tree mitigation
State Law - included in Special Revenue
Local ordinance - included in Special Revenue
Local ordinance - included in Special Revenue
Local ordinance - included in Special Revenue
Local ordinance - included in Special Revenue
Local ordinance - included in Special Revenue
Community Facility EndowmentLocal ordinance - included in Special Revenue
General Plan Surcharge
State of CA Grants
Recycling
SLES (AB 3229)
Light and landscaping districts
Local ordinance - included in Special Revenue
Local ordinance - included in Special Revenue
State Law - included in Special Revenue
State Law - included in Special Revenue
Local ordinance - included in Special Revenue
Wilder Community Facilities DistrictLocal ordinance - included in Special Revenue
Stormwater (NPDES)
Affordable Housing
CCTA (Contra Costa Transportation Authority)
TDA Grants
State Law - included in Special Revenue
State Law - included in Special Revenue
County proposition - included in Special Revenue
State Law - included in Special Revenue
Road Maintenance - Garbage Co.Local ordinance - included in Special Revenue
Federal Grants
Field Maintenance Surcharge
Facility Improvement Surcharge
Permit Technology Surcharge
Federal law - included in Special Revenue
Local ordinance - included in Special Revenue
Local ordinance - included in Special Revenue
Local ordinance - included in Special Revenue
The City's policy, as well as the California Government Code, requires that a financial institution secure deposits by pledging securities in an undivided collateral pool held by a depository regulated under state law. The market value of the pledged securities in the collateral pool must equal at least 110% of the total amount deposited by the public agencies. California law requires financial institutions to secure public deposits by pledging first trust deed mortgage notes having a value of 150% of the secured public deposits, and letters of credit issued by the Federal Home Loan Bank of San Francisco having a value of 105% of the secured deposits. The City may waive collateral requirements for cash deposits, which are fully insured up to $250,000 by the Federal Deposit Insurance Corporation (the "FDIC"). It is the City's practice not to waive the collateral requirements.
For the Year Ended June 30, 2025
Continued
C. Revenue Restrictions
The City has various restrictions placed over certain revenue sources by state or local agencies. The primary restricted revenue sources include:
Revenue Source
Gas tax
Legal Restrictions to Use
Street purposes
CCTA tax (part of sales tax)Street purposes
Assessment districts
Development impact fees
Library assessment
Lighting, landscaping, and community facilities
Transportation, drainage and park capital projects
Library service supplement
Supplemental law enforcementPolice
Tree mitigation
Stormwater
Grants
Recycling
Tree replacement
Pollution control
Federal or State projects
Recycle efforts
Road maintenance - Garbage Co.Street purposes
Field Maintenance SurchargeSports field improvements
Facility Improvement SurchargeRecreation facility improvements
Permit Technology SurchargePermit system improvements
A. Policies
The California Government Code requires California banks and savings and loan associations to secure the City's cash deposits by pledging securities as collateral. This Code states that collateral pledged in this manner shall have the effect of perfecting a security interest in such collateral superior to those of a general creditor. Thus, collateral for cash deposits is considered to be held in the City's name.
The City follows the practice of pooling cash and investments of all funds, except for funds required to be held by fiscal agents under the provisions of bond indentures. Interest income earned on pooled cash and investments is allocated on a quarterly basis to the various funds based on average daily cash and investment balances. Interest income from cash and investments with fiscal agents is credited directly to the related fund.
The City maintains a cash deposit and investment pool that is available for use by all funds. It is not used for the deferred compensation plans.
For the Year Ended June 30, 2025
Continued
The City had the following cash and investments at June 30, 2025:
Reconciliation to Financial Statements:
Governmental Funds Balance Sheet:
Cash, cash equivalents and investments44,867,718 $
Restricted Cash2,839,694
Subtotal47,707,412
Internal Service Funds:
Cash, cash equivalents and investments4,364,249
Custodial Funds:
Cash, cash equivalents and investments4,433,049
Total cash and investments56,504,710 $
Statement of Net Position:
Cash, cash equivalents and investments49,231,967 $
Restricted cash2,839,694
Statement of Fiduciary Net Position:
Custodial Funds - cash, cash equivalents and investments4,433,049 56,504,710 $
The City is a participant in the Local Agency Investment Fund (LAIF) that is regulated by California Government Code Section 16429 under the oversight of the Treasurer of the State of California. The City reports its investment in LAIF at the fair value amount provided by LAIF, which is the same as the value of the pool share. The balance is available for withdrawal on demand, and is based on the accounting records maintained by LAIF, which are recorded on an amortized cost basis. For withdrawals of $10 million or more, one day prior notice to LAIF is required. Included in LAIF’s investment portfolio are collateralized mortgage obligations, mortgage-backed securities, other asset- backed securities, loans to certain state funds, United States Treasury Notes and Bills, and floating rate securities issued by federal agencies, government-sponsored enterprises, and corporations. At June 30, 2025, these investments matured in an average of 248 days.
At June 30, 2025, the City's deposits were $21,126,063 which was collateralized or insured with securities held by the pledging financial institutions in the City's name.
For the Year Ended June 30, 2025
Continued
C. Investment Authorized by the California Government Code and the City’s Investment Policy City Investment Policy
The City is authorized by State statutes and in accordance with the City's investment policy to invest in the following:
Authorized Investment Type
Securities of the U.S. Government, or its agencies
Certificates of Deposit (of Time Deposits) placed with commercial banks and/or savings and loan companies not to exceed maximum allowed by FDIC per institution
Local Agency Investment Fund (State Pool) Demand Deposits
Passbook Savings Account Demand Deposits not to exceed the maximum allowed by FDIC per institution
Shares of beneficial interest issued by Diversified Management Companies (Mutual funds). No more than 10% in any one mutual fund
Money Market Demand Accounts
Bankers Acceptances, maximum of 180 days (maximum 30% of pool with 1 agency)40%
Commercial Paper, maximum 270 days of Prime Quality (not more than 10% of outstanding paper of an issuing corporation)
Medium-term corporate notes, maximum of 5 years
California Government Code also allows investments in the following:
Repurchase agreements1 yearnonenonenone
Reverse repurchase agreements92 daysnone20%none
Negotiable certificates of deposit5 yearsnone30%none
Bonds issued by local agencies5 yearsnonenonenone
State warrants, treasury notes, and bonds5 yearsnonenonenone
Mortgage securities5 yearsAa2/AA20%none
Supranationals5 yearsAA30%10%
Asset-Backed Securities5 yearsAA20%5%
The City's criteria for selecting investments are, in order of priority: (1) Safety, (2) Liquidity, and (3) Yield. All applicable investments are required to have an AA rating or higher. The City's investments comply with established policy.
For the Year Ended June 30, 2025
Interest rate risk is the risk that changes in economic markets will adversely affect the fair value of an investment. Generally, the longer the maturity of an investment, the greater the sensitivity of its fair value to changes in market interest rates. One of the ways that the City manages its exposure to interest rate risk is by purchasing a combination of shorter term and longer term investments and by timing cash flows from maturities so that a portion of the portfolio is maturing or coming close to maturity evenly over time as necessary to provide the cash flow and liquidity needed for operations.
Information about the sensitivity of the fair values of the City’s investments (including investments held with fiscal agents) to market interest rate fluctuations is provided by the following table that shows the distribution of the City’s investments by maturity:
Generally, credit risk is the risk that an issuer of an investment will not fulfill its obligation to the holder of the investment. This is measured by the assignment of a rating by a nationally recognized statistical rating organization. Presented below is the City of Orinda’s actual Standard and Poor’s rating as of June 30, 2025 for each investment type:
For the Year Ended June 30, 2025
Continued
E. Disclosures Relating to Credit Risk, Continued
Investment income shall accrue solely to the General Fund except where required by law, in which case interest shall accrue to other funds based upon the fund's proportionate ratio of balances to total pooled cash. Investment income shall not be credited to individual reserve accounts, except where required by law.
The City portfolio value fluctuates in an inverse relationship to any change in interest rate. Accordingly, if interest rates have risen, the portfolio value will have declined. If interest rates have fallen, the portfolio value will have risen.
Under the current accounting standard, the portfolio for year-end reporting purposes is treated as if it were all sold. Therefore, fund balance must reflect the portfolio's change in value. These portfolio value changes are unrealized unless sold. The City's policy is to buy and hold investments until their maturity dates.
F. Concentration of Credit Risk
None of the City’s investments in the securities of any individual issuers represent 5% or more of total government-wide investments as of June 30, 2025.
The City categorizes its fair value measurements within the fair value hierarchy established by generally accepted accounting principles. The hierarchy is based on the valuation inputs used to measure fair value of the assets. Level 1 inputs are quoted prices in an active market for identical assets; Level 2 inputs are significant other observable inputs; and Level 3 inputs are significant unobservable inputs.
For the Year Ended June 30, 2025
Continued
G.
The following is a summary of the fair value hierarchy of the fair value of investments of the City as of June 30, 2025:
Investment By Fair Value Level:
U.S. Treasury Notes4,110,394 $ (A)
U.S. Government Agency Securities3,179,063 (A)
Medium-Term Corporate Notes2,694,567 (A)
Asset-Backed Securities1,373,613 (A)
Supranational 380,187 (A)
Total By Fair Value Level11,737,824
Investment Measured at Amortized Cost: Money Market554,281
Investment Exempt from Fair Value Hierarchy: Local Agency Investment Fund22,332,457 (B)
Total Investments34,624,562
Cash on Hand and Cash in Bank21,880,148
Total Cash and Investments56,504,710 $
Notes:
(A)ThevaluationmethodforLevel2inputsaresignificantotherobservableinputs.Theseinputs include:a)Quotedpricesforsimilarassetsinactivemarkets;b)Quotedpricesforidenticalor similarassetsinmarketsthatarenotactive;andc)Inputsotherthanquotedpricesthatare observable for an asset.
(B)TheLocalAgencyInvestmentFund(LAIF)thevaluationmethodisbasedonthefairvalue factor,providedbytheTreasureroftheStateofCalifornia,whichiscalculatedasfairvalue divided by the amortized cost of the investment pool.
Accounts receivable for the governmental activities consist of various reimbursements, taxes and fees. At June 30, 2025 accounts receivables consists of the following:
For the Year Ended June 30, 2025
In 2012, the City contributed a parcel of land and received a note in the amount of $2,050,000 from Eden Irwin Way, LLC for the development of Monteverde Senior Apartments (Development), a rental housing development for affordable senior units. The loan, funded from the Affordable Housing Loan, is noninterest bearing, except in the event of default. The entire balance of the loan is payable in full upon the fifty-fifth (55th) anniversary of the date upon which the City issues the final certificate of occupancy, December 2069. The entire outstanding balance of the loan shall be fully due and payable (i) upon the transfer of all or any part of the development or interest therein other than a transfer permitted without City consent, (ii) a financing encumbrance without City consent, (iii) or any case of default as outlined in the agreement.
During the fiscal year ending June 30, 2025 the City did not have any additional loan transactions involving City assets.
Capital asset activities for the year ended June 30, 2025, were as follows:
For the Year Ended June 30, 2025
Continued
Depreciation expense was charged to the functions/programs of the governmental activities of the primary government as follows:
Capital assets held by the government's internal services funds are charged to the various functions based on their usage of the assets 208,504
Accounts payable in the governmental funds are composed of payables to various vendors during the normal course of business. As of June 30, 2025, the most significant payables reported in the General Fund and Gas Tax fund are $1,105,705 payable to Contra Costa County Treasurer, and $1,246,959 payable to Radius Earthworks Inc. for the 2024 Pavement rehabilitation Project, respectively.
A. Interfund Transfers
With Council approval, resources may be transferred from one City fund to another. Transfers between funds during the fiscal year ended June 30, 2025 were as follows:
A: To move revenues from the fund in which it is legally required to collect them into the fund which legally
B: To fund capital projects
C: To correct prior year revenue
For the Year Ended June 30, 2025
Continued
B. Due to/from Other Funds
These balances represent short-term loans between funds for cash shortages or expenditures and are expected to be reimbursed within one year. The composition of due to/from balances at June 30, 2025 consisted of the following:
1,088,670 $
Legal Debt Margin: The City is subject to a debt limit that is 15% of the total assessed value of property, net of exempt real property. At June 30, 2025, that amount was 365,198,057 and total debt subject to limitation was $34,834,361 which is 9.54% of the limit.
The City's debt issues and transactions are summarized below and discussed in detail thereafter.
Original IssueBalance at Balance atCurrent Type of Obligation AmountJune 30, 2024RetirementsJune 30, 2025Portion
2015 Refunding Certificates of Participation, 2% to 5.0%, due 7/1/2035
2014 General Obligation Bonds, Series A
2016 General Obligation Bonds, Series A
In September 2005 Certificates of Participation relating to the City Offices Project totaling $9,800,000 were issued pursuant to Resolution No. 50-05 which approved lease financing of the new city offices. Lease payments are to be paid pursuant to a site lease between the City and the Orinda Facilities Financing Corporation (Corporation), which was formed under laws of the State of California for the purpose of providing financial assistance to the City in financing the acquisition, construction and improvement of public buildings, equipment and facilities.
For the Year Ended June 30, 2025
The City entered into a lease with the Corporation (site lease) and agreed to leaseback the new City offices site (facilities lease) after the completion of the City offices. At the end of the lease in 2035, the offices will belong to the City, thus, the offices are assets of the City as a "lease-purchase". Payments are made from the General Fund.
As provided in Section 4(b)(iii) of the Continuing Disclosure Agreement for the 2015 Refunding COP, the City is providing an update of "City Financing Information - General Fund Revenues - Summary of Revenue Sources" for the period ending June 30, 2025.
Fund Key Revenues
Property Taxes Sales Tax
Franchise Taxes
2024-2025 Revenue Percent of Total
10,308,788 $ 62% 5,061,697 30% 1,355,415 8%
16,725,900 $
In July 2015, the City issued $7,945,000 in 2015 Refunding Certificates of Participation with interest rates ranging from 2% to 5%. The proceeds were used to repay $8,030,000 of the City’s outstanding 2005 Certificates of Participation. The reacquisition price of the 2015 Certificates was less than the net carrying amount of the old debt by $85,000. As result, total debt service payments over 20 years was reduced by $1,135,690 and obtained an economic gain (difference between the present values of the debt service payments on the old and new debt) of $833,769. The Certificates are payable from any source of available funds of the City. The financing covenants contain events of default that require the revenue of the City to be applied by the Trustee as specified in the terms of the agreement if any of the following conditions occur: default on debt service payments; the failure of the City to observe or perform the conditions, covenants, or agreement terms of the debt; bankruptcy filing by the City; or if any court or competent jurisdiction shall assume custody or control of the City
2015 Refunding Certificate of Participation
PrincipalInterest
2026385,000 $ 175,319 $
2027395,000 163,619
2028405,000 151,619
2029415,000 139,059
2030430,000 125,588
2031-20352,420,000 359,000
2036545,000 10,900
Total4,995,000 $ 1,125,104 $
Premium, net of amortization123,890 5,118,890 $
For the Year Ended June 30, 2025
In March of 2015, the City issued General Obligation Bonds, Election of 2014, Series A, in the amount of $10,000,000. The Bonds are the first series of bonds to be issued from an aggregate authorized amount of $20,000,000 duly approved by at least two-thirds of the voters voting on Measure J at an election held on June 3, 2014 to provide funds to repair failing roads and storm drains, restore and upgrade other roadways and storm drains, fix potholes, and improve safety on the City's public streets. The Bonds bear interest at 2.0% - 4.0% and are due semi-annually on March 1 and September 1 commencing September 2, 2015. Principal payments are due annually on September 1 through 2035. The Bonds are payable from a special ad valorem property tax rate the City is authorized by the voter approval of Measure J and obligated to levy as described in the financing documents, for the payment of principal and interest on the Bonds when due. The taxes are collected by Contra Costa County and distributed to the City.
2014 General Obligation Bonds, Series A
PrincipalInterest
2026380,000 $ 173,263 $
2027405,000 157,563
2028430,000 144,088
2029455,000 131,888
2030480,000 117,863
2031-20352,820,000 346,775
2036660,000 11,138
Total5,630,000 1,082,576 $
Premium, net of amortization187,228
5,817,228 $
In April of 2017, the City issued General Obligation Bonds, Election of 2014, Series B, in the amount of $10,000,000. These Bonds are the second series of bonds to be issued from an aggregate authorized amount of $20,000,000 of bonds duly approved by at least two-thirds of the voters voting on Measure J at an election held on June 3, 2014. The Bonds were issued to provide funds to repair failing roads and storm drains, restore and upgrade other roadways and storm drains, fix potholes and improve safety on the City’s public streets. The Bonds bear interest at 1.4% - 5.0%. Interest payments are due semi-annually on March 1 and September 1 commencing September 1, 2017. Principal payments are due annually on September 1 through 2037. The Bonds are payable from a special ad valorem property tax rate the City is authorized by the voter approval of Measure J and obligated to levy as described in the financing documents, for the payment of principal and interest on the Bonds when due. The taxes are collected by Contra Costa County and distributed to the City.
For the Year Ended June 30, 2025
Continued
PrincipalInterest
2026355,000 $ 304,900 $ 2027385,000 286,400
2028425,000 268,275
2029450,000 250,775
2030485,000 232,075
2031-20352,910,000 890,975
2036-20383,400,000 206,013
Total8,410,000 2,439,413 $ Premium, net of amortization363,752
8,773,752 $
In April of 2017, the City issued General Obligation Bonds, Election of 2016, Series A, in the amount of $25,000,000. These Bonds are the first and only series of bonds to be issued in an aggregate authorized amount of $25,000,000 of bonds duly approved by at least two-thirds of the voters voting on Measure L at an election held on June 7, 2016. The Bonds were issued to provide funds to repair failing roads and storm drains, restore and upgrade other roadways and storm drains, fix potholes and improve safety on the City’s public streets. The Bonds bear interest at 1.4% - 5.0%. Interest payments are due semi-annually on March 1 and September 1 commencing September 1, 2017. Principal payments are due annually on September 1 through 2037. The Bonds are payable from a special ad valorem property tax rate the City is authorized by the voter approval of Measure L and obligated to levy as described in the financing documents, for the payment of principal and interest on the Bonds when due. The taxes are collected by Contra Costa County and distributed to the City.
PrincipalInterest
20261,080,000 $ 748,550 $ 20271,055,000 695,175
20281,110,000 641,050
20291,205,000 589,200
20301,290,000 539,300
2031-20357,460,000 1,913,950
2036-20385,720,000 355,600
Total18,920,000 5,482,825 $
Premium, net of amortization1,323,381
20,243,381 $
For the Year Ended June 30, 2025
Government-Wide Statements
Equity is classified as net position and displayed in three components:
a. Net investment in capital assets - Consists of capital assets including restricted capital assets, net of accumulated depreciation and reduced by the outstanding balances of any bonds, mortgages, notes, or other borrowings that are attributable to the acquisition, construction, or improvement of those assets.
b. Restricted net position - Consists of net position with constraints placed on the use either by (1) external groups such as creditors, grantors, contributors, or laws or regulations of other governments; or (2) law through constitutional provisions or enabling legislation.
c. Unrestricted net position - All other portions of net position that do not meet the definition of "restricted" or "net investment in capital assets.
Fund Balances for governmental funds are reported in classifications that comprise a hierarchy based primarily on the extent to which the government is bound to honor constraints on the specific purposes for which amounts in those funds can be spent. The City Council, as the highest level of decision-making authority of the City, has the power to commit and rescind the commitment of fund balances through resolutions. The Council has designated certain members of management staff to assign fund balances. Those staff members can assign fund balances when the City intends to use those funds for specific projects/purposes. These captions apply only to Fund Balance classifications:
Nonspendable fund balances are those amounts that cannot be spent because they are either not in spendable form, or are legally or contractually required to be maintained intact.
Restricted fund balances are those amounts that should be reported as restricted when constraints placed on the use of resources are either externally imposed by creditors, grantors, contributors, or laws and regulations of other governments; or imposed by law through constitutional provisions or enabling legislation.
Committed fund balances are those amounts that cannot be used for any other purpose unless the government removes or changes the specified use by taking the same type of action it employed to previously commit those amounts.
Assigned fund balances are those amounts that are constrained by the government's intent to be used for specific purposes, but are neither restricted nor committed, except for stabilization arrangements.
Unassigned fund balances are those residual funds that have not been assigned to other funds, are not nonspendable, restricted, committed, or assigned to specific purposes. The General Fund should be the only fund that reports a positive unassigned fund balance amount.
It is the policy of the City to spend funds in order from restricted to unassigned, as listed above.
For the Year Ended June 30, 2025
On June 1, 2024 the City Council adopted Resolution 25-21 which provides for an updated policy related to reserves. It continued to be based on an analytical framework developed by the Government Finance Officers Association (GFOA). The tool applies local judgement examining the range of reserves an agency may need based on eight areas of financial risk. These criteria for Contingency and Emergency can be summarized in three key categories: Cash Flow Needs, Economic Uncertainty, and Emergency Disaster Reserves. After review and consultation by the citizen Finance Advisory Committee it was recommended to increase targeted General Fund Emergency and Contingency reserve balance to 50% of the subsequent fiscal year general fund budgeted expenditures.
The emergency / contingency reserve is $9,143,421 as of June 30, 2025 and per the policy this is shown as an unassigned balance as required by accounting standards. The City has met the stated target based on 50% of the adopted Fiscal Year 2025-26 general fund budget. In the table that follows additional designations have also been made within the “unassigned category” to add additional information.
The City Council policy also established a target goal of $850,000 for future capital projects pertaining to road and slope stabilization. As of June 30, 2025, the Road Stabilization Capital Project Fund has a fund balance of $987,000, surpassing the Council's target.
Detailed classifications of the City’s fund balances, as of June 30, 2025, are stated below:
For the Year Ended June 30, 2025
10. NET POSITION AND FUND BALANCES, Continued
As of June 30, 2025, the following funds had negative fund balances/net positions. All deficits are expected to be repaid by future revenues.
Major Fund:
Wilder CFD Special Revenue Fund(627,708) $
Non-Major Governmental Funds:
TDA Grant(3,348)
Risk Management Internal Service Fund(453,120)
Balance at June 30, 2025(1,084,176) $
The employees of the city accumulate retirement benefits through three defined contribution plans with the ICMA Retirement Corporation. The city makes bi-weekly contributions to a 401(a) plan for each regular employee working a minimum of 20 hours per week. The base contribution by the city for all eligible employees is 13%. In addition, for unrepresented employees the city will match up to a 3% employee contribution for a maximum of 16%. Vesting occurs over a three-year period, with the exception of those employees over 50 years old who are fully vested from the first month of employment. The benefit terms are established by the City Council in accordance with the most current memorandum of understanding between the City and the General Employees bargaining unit. The Plans are administered and held in trust for the exclusive benefit of participants and are not assets of the city.
Balance at June 30, 202410,808,443 $ Contributions2,266,796 Loans, netDisbursements, net(862,803) Earnings1,463,266
Balance at June 30, 202513,675,702 $
For the Year Ended June 30, 2025
For the fiscal year ended June 30, 2025, employees had an option of participating in a deferred compensation plan where contributions are from employee earnings at a maximum of 25% of earnings. For employees represented by Teamsters Local No.856, the city will match up to 3% of an employee contribution, provided the total contributions do not exceed the IRS limit. The Plan provides for the deferral of a portion of the employee's compensation until retirement, termination, or certain other events. Under Internal Revenue Code 457, the amounts deferred under a deferred compensation plan maintained by a state or local government must be held in a trust (or custodial account or annuity contract) for the exclusive benefit of plan participants and their beneficiaries. The assets are not considered assets of the City, thus have been excluded from these financial statements.
Balance at June 30, 2024$7,737,838 Contributions426,661 Loans, netDisbursements, net(1,181,756)
Earnings816,881
Balance at June 30, 2025$7,799,624
Plan Description – The City administers a defined-benefit post-employment healthcare plan. In fiscal year 2019-20 the City established an irrevocable exclusive agent multiemployer benefit trust which is administered by Public Agency Retirement Services (PARS). The trust is used to accumulate and invest assets necessary to reimburse retirees. No separate financial reports are issued by PARS for the OPEB plan.
Benefits Provided – The following is a summary of Plan benefits by employee group as of June 30, 2025:
Integrated medical/prescription drug coverage is provided through CalPERS under the Public Employees' Medical and Hospital Care Act (PEMHCA). Employees can choose from a variety of HMO and PPO options providing comprehensive medical and prescription drug coverage. For purposes of its contract with PEMHCA, the City uses a statutory schedule to determine its monthly contribution on behalf of each active employee. The statutory amount is $157 for 2024 and $158 for 2025, and will be indexed by the Medical CPI each year thereafter.
For the Year Ended June 30, 2025
A. General Information about the City’s Other Post Employment Benefit (OPEB) Plan, Continued
Post-Retirement Coverage
The City offers the same medical plans to its retirees and surviving spouses as to its active employees, with the exception that once a retiree becomes eligible for Medicare, he or she must join a Medicare HMO or a Medicare Supplement plan, with Medicare becoming the primary payer.
Hired prior to 11/1/2019
Hired on or after 11/1/2019
Benefit types provided
City Cap*
PEMHCA minimum employerPEMHCA minimum employer contribution under “unequal method”contribution under “unequal method”
*The City's contribution was $157 per month in 2024 and $158 per month in 2025
Employees Covered by Benefit Terms – Membership in the plan consisted of the following at the measurement date of June 30, 2025:
Actuarial Methods and Assumptions – The City’s total OPEB liability used to calculate the net OPEB liability was determined by an actuarial valuation that was rolled forward using standard update procedures to determine the total OPEB liability as of the measurement date based on the following dates, actuarial methods and assumptions:
Actuarial Assumptions
Valuation Date
Measurement Date
Actuarial Cost Method
Actuarial Assumptions:
Discount Rate
Inflation
Payroll Growth
Mortality Rate
June 30, 2025 June 30, 2025
Entry Age, Level Percent of Pay
Themortalityassumptionsarebasedonthe2021CalPERSMortalityfor MiscellaneousandSchoolsEmployeestablecreatedbyCalPERS.CalPERS periodicallystudiesmortalityforparticipatingagenciesandestablishes mortalitytablesthataremodifiedversionsofcommonlyusedtables.This tableincorporatesmortalityprojectionasdeemedappropriatebasedon CalPERS analysis.
For the Year Ended June 30, 2025
B. Net OPEB Liability, Continued
The long-term expected rate of return (LTROR) on OPEB plan investments of 6.00% was determined by PARS and US Bank using a building-block method in which best estimate ranges of expected future real rates of return (expected returns, net of OPEB plan investment expense and inflation) are developed for each major asset class. These ranges are combined to produce the long-term expected rate of return by weighting the expected future real rates of return by the target asset allocation percentage and by adding expected inflation.
The discount rate of 6.00% is based on the long-term rate of return. It was determined that the LTROR was an appropriate basis for selection of the discount rate based on the results of a cross-over test performed by the plan’s actuaries, Foster & Foster Actuaries and Consultants, as of the valuation date, which shows the plan assets, together with expected future contributions, will be sufficient to pay all expected future benefits.
C. Changes in Net OPEB Liability
The changes in the net OPEB liability/(asset) were follows:
D. Sensitivity of the Net OPEB Liability to Changes in the Discount Rate and Healthcare Cost Trend Rates
The following presents the net OPEB liability of the City, as well as what the City's total OPEB
would be if it were calculated using a discount rate that is 1-percentage-point lower or 1- percentagepoint higher than the current discount rate:
For the Year Ended June 30, 2025
Continued
D. Sensitivity of the Net OPEB Liability to Changes in the Discount Rate and Healthcare Cost Trend Rates, Continued
The following presents the net OPEB liability of the City, as well as what the City's net OPEB liability would be if it were calculated using healthcare cost trend rates that are 1-percentage-point lower or 1percentage-point higher than the current healthcare cost trend rates:
E. OPEB Expenses and Deferred Outflows/Inflows of Resources Related to OPEB
For the year ended June 30, 2025, the City recognized OPEB expense of $44,005. At June 30, 2025, the City reported deferred inflows of resources related to OPEB from the following sources:
Amounts reported as deferred inflows of resources related to OPEB will be recognized as part of OPEB expense as follows:
For the Year Ended June 30, 2025
The City purchases its insurance through the Municipal Pooling Authority (MPA) of Northern California of which the City is a member.
The following is a summary of coverage as of June 30, 2025:
weapons
(Police Dept.)250,000 3,000
Auto-physical damage (other)250,000 2,000
Workers' compensation Statutory LimitNo deductible
The total coverage includes the City's deductible, the portion underwritten by MPA and other participating public agency insurance pools and the portion underwritten by other insurance companies.
Management believes such coverage is sufficient to preclude any significant uninsured losses to the City. Settled claims have not exceeded this insurance coverage in any of the past three fiscal years.
The City is a defendant in lawsuits arising in the normal course of business. The MPA is providing coverage for litigation against the City; however some litigation costs are covered by the City's insurance fund, where the City has provided additional reserves. As of June 30, 2025, the risk management fund had a deficit net position of $453,120.
Grant programs
The City participates in several federal and state grant programs. These programs have been audited when required by the City's independent accountants in accordance with the provisions of the federal Single Audit Act as amended and applicable State requirements. No cost disallowances were proposed as a result of these audits. However, these programs are still subject to further examination by the grantors and the amount, if any, of expenditures that may be disallowed by the granting agencies cannot be determined at this time. The City expects such amounts, if any, to be immaterial. Participating Cities' Total Deductible (City Portion)
For the Year Ended June 30, 2025
The City’s restatements, other than those changes within the financial reporting entity, are composed of the following:
1. Error correction:
a. $215,734 – adjustment to correct the over-depreciation of equipment in previous years within the internal service funds.
b. ($4,297,475) – reversal of the amount previously reported as construction in progress in the statement of net position , which should have been classified as a repair and maintenance expense instead.
2 Change in accounting estimate ($61,828) – due to implementation of the requirements of GASB 101 –Compensated Absences.
Summary of the restatements are as follows:
Units Affected by Restatements of Beginning Balances
Required Supplementary Information
For the year ended June 30, 2025
of Changes in the Net OPEB Liability and Related Ratios - Last 10 Fiscal Years*
Notes to Schedule:
Required Supplementary Information
For the year ended June 30, 2025
Schedule of OPEB Contributions - Last 10 Fiscal Years*
Fiscal Year Ended June 30,20202021
Notes to Schedule
Valuation DateJuly 1, 2019July 1, 2021
Measurement DateJune 30, 2020June 30, 2021
Actuarial Cost MethodEntry Age, Level Percent of Pay Entry Age, Level Percent of Pay
Actuarial Assumptions
Mortality RateMortality rates were based on the RP- 2014 Employee and Healthy Annuitant Mortality Tables for Males or Females, as appropriate, projected using a generational projection based on 100% of scale MP2016 for years 2014 through 2029, 50% of MP2016 for years 2030 through 2049, and 20% of MP-2016 for 2050 and thereafter. 6.00% for 201920, decreasing to 4.5% for 2021-22 and Healthcare Trend Rates after.
*Fiscal year 2018 was the 1st year of implementation.
The mortality assumptions are based on the 2017 CalPERS Mortality for Miscellaneous and Schools Employees table created by CalPERS. CalPERS periodically studies mortality for participating agencies and establishes mortality tables that are modified versions of commonly used tables. This table incorporates mortality projection as deemed appropriate based on CalPERS analysis
July 1, 2022
June 30, 2022
June 30, 2023
June 30, 2023
June 30, 2023
June 30, 2024
June 30, 2025
June 30, 2025
The mortality assumptions are based on the 2017 CalPERS Mortality for Miscellaneous and Schools Employees table created by CalPERS. CalPERS periodically studies mortality for participating agencies and establishes mortality tables that are modified versions of commonly used tables. This table incorporates mortality projection as deemed appropriate based on CalPERS analysis
The mortality assumptions are based on the 2021 CalPERS Mortality for Miscellaneous and Schools Employees table created by CalPERS. CalPERS periodically studies mortality for participating agencies and establishes mortality tables that are modified versions of commonly used tables. This table incorporates mortality projection as deemed appropriate based on CalPERS analysis.
The mortality assumptions are based on the 2021 CalPERS Mortality for Miscellaneous and Schools Employees table created by CalPERS. CalPERS periodically studies mortality for participating agencies and establishes mortality tables that are modified versions of commonly used tables. This table incorporates mortality projection as deemed appropriate based on CalPERS analysis.
The mortality assumptions are based on the 2021 CalPERS Mortality for Miscellaneous and Schools Employees table created by CalPERS. CalPERS periodically studies mortality for participating agencies and establishes mortality tables that are modified versions of commonly used tables. This table incorporates mortality projection as deemed appropriate based on CalPERS analysis.
Schedule of Revenues, Expenditures and Changes in Fund Balances - Budget and Actual General Fund
For the year ended June 30, 2025
Amounts
Schedule of Revenues, Expenditures and Changes in Fund Balances - Budget and Actual General Fund (Continued)
For the year ended June 30, 2025
FUND BALANCES:
SOURCES (USES):
Budgeted Amounts
Schedule of Revenues, Expenditures and Changes in Fund Balances - Budget and Actual Wilder CFD
For the year ended June 30, 2025
REVENUES:
FUND BALANCES: Beginning of year (1,374,013)
(627,708) $
Schedule of Revenues, Expenditures and Changes in Fund Balances - Budget and Actual Gas Tax
For the year ended June 30, 2025
Budgeted Amounts
REVENUES: Taxes
REVENUES OVER (UNDER)
1,234,749 $
For the year ended June 30, 2025
TheannualbudgetadoptedbytheCityCouncilprovidesforthegeneraloperationoftheCity.It includes proposed expenditures and the means of financing them.
TheCityoperatesunderthegenerallawsoftheStateofCalifornia("State")andannuallyadoptsa budgettobeeffectiveJuly1oftheensuingfiscalyearforGeneral,SpecialRevenueandCapitalProjects Funds.Thelegallevelofbudgetarycontrolhasbeenestablishedatthefundlevel.Budgetsaresubjectto apublichearingbeforetheyareadoptedbytheCityCouncil.Budgetsarepreparedonthemodified accrualbasisandareconsistentwithaccountingprinciplesgenerallyacceptedintheUnitedStatesof America.
Allannualappropriationslapseatfiscalyear-end.BudgetssubmittedtotheCityCouncilincludeboth proposedappropriationsandthemeansoffinancingthem.TheCityCouncilapprovestotal appropriations on a fund-by-fund basis.
TheCityManagerisauthorizedtotransferbudgetappropriationswithinthesamefundinconformance withtheadoptedpoliciessetbytheCityCouncil.Additionalappropriationsorinterfundtransfersnot includedintheoriginalbudgetresolutionsrequireapprovalbytheCityCouncil.Budgetedamounts represent original budget adjusted for supplemental appropriations during the year.
This page intentionally left blank
The General Fund is the City’s primary operating fund. It accounts for all financial resources of the general government, except those required to be accounted for in another fund. The General Fund is composed of the following:
General Purpose Fund - Accounts for most discretionary resources except those that require separate accounting for local, state or federal reporting and accountability purposes. Primary sources of General Purpose Fund revenue include property tax, sales tax, franchise fees, parks and recreation fees, as well as transfers in from other funds for eligible uses.
Add-On Sales Tax (Measure R) Fund - Accounts for all revenue received from Measure R which was approved by the voters in November 2020 and collected beginning April 1, 2021. The tax has a 20 year sunset (March 31, 2041). This measure replaced the tax levied under Measure L and consists of a local 1 cent add-on sales tax. Expenses are appropriated separately as part of the City Council adoption of the Budget.
This page intentionally left blank
General Fund
June 30, 2025
DEFERRED INFLOWS OF RESOURCES AND FUND BALANCES
Combining Statement of Revenues, Expenditures and Changes in Fund Balances General Fund
For the year ended June 30, 2025
Combining Statement of Revenues, Expenditures and Changes in Fund Balances
General Fund (Continued)
For the year ended June 30, 2025
FINANCING SOURCES (USES):
For the year ended June 30, 2025
SOURCES (USES):
For the year ended June 30, 2025
Budgeted Amounts
For the year ended June 30, 2025
BALANCES:
Budgeted Amounts
Nonmajor Special Revenue Funds:
TransportationImpact- Accountsforthefeeimposedonnewdevelopmenttohelpfundconstructionofexpansionof roads, bikeways, sidewalks, and traffic signals.
DrainageImpact- Accountsforthefeeimposedonnewdevelopmenttohelpfundacitywidedrainagestudyand preparation of a drainage master plan.
LibraryFund -Accountsforthevoterapprovedspeciallibraryparceltaxrevenueusedtoprovideadditionalhoursof operation at the Orinda library.
ParkDedicationFund -Accountsforthefeeimposedonnewdevelopmenttoprovidefundingfornewparklands, facilities, and rehabilitation of existing parks and facilities.
TreeMitigationFund - Accountsforfeeschargedtodeveloperswhenconstructionrelatedactivitymayremoveor destroy a protected tree.
CreekMitigationFund -Accountsforfeeschargedtodeveloperswhenconstructionrelatedactivitymayaffectthe creek system in the City.
RecyclingFund- AccountsfortheCaliforniaRecycleandRecoverygrantusedtopromoterecyclingofbeverage containers.
SupplementalLawEnforcement(SLES)Fund- AccountsforfundsreceivedfromtheState'sCOPSprogramforfrontline municipal police services.
AssessmentDistrictsL-42,M-9,M-11Fund- Thesefundsaccountfortherevenuereceivedfrombenefitedproperties and the associated expenses to operate and maintain street lights and common areas.
StormwaterFund- AccountsforfeescollectedbytheCountyandpassedthroughtotheCityforactivitiesnecessary to comply with stormwater program elements.
TDA Grants Fund - Accounts for State grant monies focused on projects addressing construction of pedestrian and bicycle improvements, including master plans and education programs
GeneralPlanSurchargeFund -AccountsforfeesaddedasasurchargetoPlanningPermitsandusedtofundupdates of the General Plan including the required Housing Element.
Nonmajor Special Revenue Funds (Continued):
FieldMaintenanceSurchargeFund- AccountsforuserfeescollectedfromParksandRecreationfieldandsports program participants and used to fund field maintenance improvements.
FacilityImprovementSurchargeFund -AccountsforuserfeescollectedfromParksandRecreationclassand program participants and used to fund facility maintenance improvements.
PermitTechnologySurchargeFund -Accountsforsurchargecollectedfromapplicationsforpermitssubmittedto Development Services and used to fund Permit System costs.
Affordable Housing Fund - This fund Accounts for costs associated with monitoring the City’s affordable housing.
AccessibilityComplianceSpecialRevenueFund- AccountsfortheSB1186feecollectedunderGovernmentcode section4467whichisusedtofacilitatecompliancewithconstructionrelatedaccessibilityrequirementsandfor training and retention of certified access specialists in the city.
FederalGrantsSpecialRevenueFund -Accountsforgrantrevenuesreceivedandtheexpendituresoffederalgrant monies.
WilderFacilitiesEndowmentFund -AccountsforrevenuesreceivedinlumpsumfromtheDeveloperofWilderto support expenses prior to the full implementation of the Community Facilities District.
RoadMaintenanceFund- Accountsforfeesfromthefranchisedgarbagehaulerbasedonastudyoftheallocated impactonstreetmaintenancefromgarbage/recyclingvehicles.Theexpendituresareformaintenanceofpublic
CCTA(contracostatransportationauthority)Fund -Thisfundaccountsforthevoterapprovedtransportationsales taxusedforvoterapprovedtransportationprogramsandprojectsasadministeredbytheContraCosta Transportation Authority.
Nonmajor Capital Project Funds:
CityCapitalProjectsFund- ThisfundaccountsfortransfersfromtheGeneralFundandexpendituresrelatedto infrastructure improvements funded primarily from one-time sources of revenue.
OakspringsAssessmentDistrictImprovementsFund- AccountsforactivitiesrelatedtotheOakspringsAssessment District improvements.
StateGrantsFund- Accountsforgrantrevenuesmadeavailablebytheplanninganddevelopmentofprojectsthat promote sustainable communities
Other Grants Fund - Accounts for the grant revenue received from BART for improving access ramps.
RoadStabilization- Accountsforactivitiesrelatedtounpredictableroadfailuresduetoerosionorotherearthmoving events.
Nonmajor Debt Service Funds:
RoadBonds2016DebtServiceFund- Accountsforthecollectionsoftaxproceedsandthepaymentsofdebtservice for the 2016 General Obligation Bonds.
RoadBonds2014DebtServiceFund- ThisfundAccountsforthecollectionoftaxproceedsandthepaymentofdebt service for the 2014 General Obligation Bonds.
This page intentionally left blank
Nonmajor Governmental Funds
June 30, 2025
Nonmajor Governmental Funds
June 30, 2025
Special Revenue Funds
Nonmajor Governmental Funds
June 30, 2025
Combining Statement of Revenues, Expenditures and Changes in
Nonmajor Governmental Funds
For the year ended June 30, 2025
SOURCES (USES):
Special Revenue Funds
Park DedicationTree MitigationCreek MitigationRecycling
Statement of
For the year ended June 30, 2025
SOURCES (USES):
Special Revenue Funds
For the year ended June 30, 2025
Capital Project FundsDebt Service Funds
2,402
527,853
52,233
1,519,431
88,256
489,014
105,340
92,397
59,738
521,133
829,677
Schedule of Revenues, Expenditures and Changes in Fund Balances - Budget and Actual Transportation Impact
For the year ended June 30, 2025
REVENUES:
FUND BALANCES:
Schedule of Revenues, Expenditures and Changes in Fund Balances - Budget and Actual Drainage Impact
For the year ended June 30, 2025
REVENUES:
FUND BALANCES: Beginning of year 1,060,337 End of year 970,690 $ Budgeted Amounts
Schedule of Revenues, Expenditures and Changes in Fund Balances - Budget and Actual Library
For the year ended June 30, 2025
Budgeted Amounts
FUND BALANCES:
Schedule of Revenues, Expenditures and Changes in Fund Balances - Budget and Actual Park Dedication
For the year ended June 30, 2025
REVENUES:
FUND BALANCES:
959,309 $ Budgeted Amounts
Schedule of Revenues, Expenditures and Changes in Fund Balances - Budget and Actual Tree Mitigation
For the year ended June 30, 2025
Schedule of Revenues, Expenditures and Changes in Fund Balances - Budget and Actual Creek Mitigation
For the year ended June 30, 2025
REVENUES:
4,285 $ Budgeted Amounts
4,111
Schedule of Revenues, Expenditures and Changes in Fund Balances - Budget and Actual Recycling
For the year ended June 30, 2025
BALANCES:
Schedule of Revenues, Expenditures and Changes in Fund Balances - Budget and Actual Supplemental Law Enforcement S.L.E.S.F.
For the year ended June 30, 2025
Budgeted Amounts
REVENUES:
FUND BALANCES:
Schedule of Revenues, Expenditures and Changes in Fund Balances - Budget and Actual Assessment District L-42
For the year ended June 30, 2025
REVENUES:
FUND BALANCES:
Schedule of Revenues, Expenditures and Changes in Fund Balances - Budget and Actual Assessment District M-9
For the year ended June 30, 2025
Budgeted Amounts
REVENUES:
FUND BALANCES: Beginning of year (1,093)
Schedule of Revenues, Expenditures and Changes in Fund Balances - Budget and Actual Assessment District M-11
For the year ended June 30, 2025
REVENUES:
FINANCING SOURCES (USES):
BALANCES:
Schedule of Revenues, Expenditures and Changes in Fund Balances - Budget and Actual Stormwater
For the year ended June 30, 2025
Budgeted Amounts
FUND BALANCES:
Schedule of Revenues, Expenditures and Changes in Fund Balances - Budget and Actual TDA Grants
For the year ended June 30, 2025
BALANCES:
Beginning of year (129,101)
End of year (3,348) $ Budgeted Amounts
Schedule of Revenues, Expenditures and Changes in Fund Balances - Budget and Actual General Plan
For the year ended June 30, 2025
REVENUES:
FUND BALANCES:
281,283 $ Budgeted Amounts
Schedule of Revenues, Expenditures and Changes in Fund Balances - Budget and Actual Field Maintenance Surcharge
For the year ended June 30, 2025
Budgeted Amounts
Schedule of Revenues, Expenditures and Changes in Fund Balances - Budget and Actual Facility Improvement Surcharge
For the year ended June 30, 2025
Budgeted Amounts
REVENUES:
FUND BALANCES:
Schedule of Revenues, Expenditures and Changes in Fund Balances - Budget and Actual Permit Technology Surcharge
For the year ended June 30, 2025
Budgeted Amounts
REVENUES:
BALANCES:
Schedule of Revenues, Expenditures and Changes in Fund Balances - Budget and Actual
For the year ended June 30, 2025
FUND BALANCES: Beginning of year 2,194,720 End of year 2,198,183 $ Budgeted Amounts
Schedule of Revenues, Expenditures and Changes in Fund Balances - Budget and Actual
Accessibility Compliance
For the year ended June 30, 2025
Schedule of Revenues, Expenditures and Changes in Fund Balances - Budget and Actual Federal Grants
For the year ended June 30, 2025
with Final Budget ActualPositive OriginalFinalAmounts(Negative)
REVENUES:
(3,127,744) EXPENDITURES:
OTHER FINANCING SOURCES (USES):
FUND BALANCES: Beginning of year (51,942) End of year - $ Budgeted Amounts
Schedule of Revenues, Expenditures and Changes in Fund Balances - Budget and Actual
Wilder Facilities Endowment
For the year ended June 30, 2025
BALANCES:
Schedule of Revenues, Expenditures and Changes in Fund Balances - Budget and Actual Road Maintenance
For the year ended June 30, 2025
REVENUES:
FUND BALANCES:
Beginning of year 2,019,862 End of year 2,993,731 $ Budgeted Amounts
Schedule of Revenues, Expenditures and Changes in Fund Balances - Budget and Actual Contra Costa Transportation - CCTA
For the year ended June 30, 2025
REVENUES:
EXPENDITURES:
FUND BALANCES: Beginning
year 1,383,952 End of year 1,527,154 $ Budgeted Amounts
Schedule of Revenues, Expenditures and Changes in Fund Balances - Budget and Actual City Capital Projects
For the year ended June 30, 2025
REVENUES:
OTHER FINANCING SOURCES (USES):
5,728,622 End of year 4,617,104 $ Budgeted Amounts
Schedule of Revenues, Expenditures and Changes in Fund Balances - Budget and Actual Oaksprings Assessment District Improvements
For the year ended June 30, 2025
REVENUES:
Schedule of Revenues, Expenditures and Changes in Fund Balances - Budget and Actual State Grants
For the year ended June 30, 2025
Amounts
BALANCES:
Statement of Revenues, Expenditures and Changes in Fund Balances - Budget and Actual Other Grants
For the year ended June 30, 2025
SOURCES (USES):
Schedule of Revenues, Expenditures and Changes in Fund Balances - Budget and Actual Road Stabilization
For the year ended June 30, 2025
Amounts
EXPENDITURES:
BALANCES:
Schedule of Revenues, Expenditures and Changes in Fund Balances - Budget and Actual Road Bonds 2014 Debt Service
For the year ended June 30, 2025
REVENUES:
FUND BALANCES:
Beginning of year 1,094,484 End of year 1,171,460 $ Budgeted Amounts
Schedule of Revenues, Expenditures and Changes in Fund Balances - Budget and Actual Road Bonds 2016 Debt Service
For the year ended June 30, 2025
REVENUES:
FUND BALANCES: Beginning of year 1,536,862 End of year 1,668,234 $ Budgeted Amounts
This page intentionally left blank
Information Systems Fund - Accounts for activities related to the City’s computer system and related software.
BuildingMaintenanceFund- Accountsforactivitiesrelatedtothemaintenanceandcapitaloutlaysrequiredto maintain the City facilities.
VehiclesReplacementFund -AccountsforactivitiesrelatedtotheCity’sreplacementofvehiclesandmotorized equipment.
Risk Management Fund - Accounts for activities related to unfunded claims and litigation losses.
This page intentionally left blank
Combining Statement of Net Position
Internal Service Funds
June 30, 2025
NET POSITION
Combining Statement of Revenues, Expenses and Changes in Net Position
For the year ended June 30, 2025
NONOPERATING REVENUES (EXPENSES):
AND TRANSFERS:
For the year ended June 30, 2025
FLOWS FROM OPERATING ACTIVITIES:
CASH FLOWS FROM NONCAPITAL FINANCING ACTIVITIES:
RECONCILIATION OF OPERATING INCOME (LOSS) TO NET CASH PROVIDED BY (USED IN) OPERATING ACTIVITIES:
Adjustments to reconcile operating income (loss) to net cash provided by (used in) operating activities:
cash provided by (used in) operating activities
This page intentionally left blank
ThispartoftheCityofOrinda'sannualcomprehensivefinancialreportpresentsdetailedinformationasa contextforunderstandingwhattheinformationinthefinancialstatements,footnotes,andrequired supplementary information says about the City's overall financial health.
These schedules contain trend information to help the reader understand how the
TheseschedulescontaininformationtohelpthereaderassesstheCity'sabilityto generaterevenues.Propertytaxes,salesandusetaxes,chargesforservices, significant revenue sources.
Theseschedulescontaininformationtohelpthereaderassesstheaffordabilityof additional debt in the future.
Theseschedulesofferdemographicandeconomicindicatorstohelpthereader understand the environment within which the City's financial activities take place.
Theseschedulescontainserviceandinfrastructuredatatohelpthereader understandhowtheinformationintheCity'sfinancialreportrelatestotheservices the City provides and the activities it performs.
Sources:Unlessotherwisenoted,theinformationintheseschedulesisderived fromtheannualcomprehensivefinancialreportsfortherelevantyear.Thefiscal year2013reportwastheCity'sfirstAnnualComprehensiveFinancialReport, thereforeinformationisavailablebeginningwiththeyearendedJune30,2013for the financial trend schedules.
City of Orinda Net Position By Component Ten Fiscal Years (Accrual basis of accounting)
Source: City of Orinda Finance Department. The City has no Business Type activities to report.
Year Ended June 30,
City of Orinda
Ten Fiscal Years Changes in Net Position (Accrual basis of accounting)
City of Orinda Fund Balances, Governmental Funds
Ten Fiscal Years
(Modified accrual basis of accounting)
Other Governmental Funds:
City of Orinda
Changes in Fund Balances, Governmental Funds
Ten Fiscal Years
(Modified accrual basis of accounting)
Source: City of Orinda Finance Department
City of Orinda
Assessed Value of Taxable Property
For the last ten fiscal years
* Homeowner Property Tax Relief Exemption is not reflected in the City Net Taxable Assessed Value.
** California cities do not set their own direct tax rate. In 1978 the voters of the State of California passed Proposition 13 which limited property taxes to a total maximum rate of 1% based upon the assessed value of the property being taxed. Each year, the assessed value may be increased by an inflation factor (limited to a maximum of 2%). With few exceptions, property is only reassessed at the time that it is sold to a new owner. At that point, the new assessed value is reassessed at the purchase price of the property sold. The assessed valuation data currently available with respect to the actual market value of taxable property and is subject to the limitations described above.
Total Direct Rate is the weighted average of all individual direct rates applied by the City and excludes revenue derived from aircraft.
Source: Contra Costa County Assessor Combined Tax Roll
City of Orinda
City of Orinda
Property Tax Levies and Collections For the last ten fiscal years
Collected within the Fiscal Year of the Levy
Total Collections to Date
Note 1: Amounts above do not include special tax levied for Library services and GO Bonds debt service and property tax in lieu of vehicle license fee.
Note 2 : Amounts are reported and collected under the Teeter Plan in which all taxes are distributed to the City in the year of the levy with the County retaining any interest or penalties on uncollected balances.
Source : Contra Costa County Auditor-Controller's Office
City of Orinda
Schedule of Top 25 Principal Sales Tax Remitters
Current Year and Nine Years Ago (listed in alphabetical order)
2024 2015 (represents 78.03% of total sales tax) (represents 77.32% of total sales tax)
76 Orinda
Benefit Marketing
BevMo
Casa Orinda
Chevron
CVS Pharmacy
Energy Comm
Europa Hofbrau
Fourth Bore Tap Room & Grill
Keepcool Usa Llc
Maria Tenaglia Design
Mash Gas & Food 5
McDonnell Nursery
Nation's Giant Hamburgers
Orinda Country Club
Orinda Hardware & Rental
Orinda Motors
P & M Window Co
Parker Thatch
Rite Aid
Safeway
76 Orinda
Barbacoa Restaurant
BevMo
Casa Orinda
Chevron
CVS Pharmacy
Energy Comm
Europa Hofbrau
Fourth Bore Tap Room & Grill
Insight Resource Group
La Piazza
McCaulou's
McDonnell Nursery
Morrison's Jewelers
Nation's Giant Hamburgers
Orinda Country Club
Orinda Hardware & Rental
Orinda Motors
P & M Window Co
Rite Aid
Safeway
Shell Shell
Siam Orchid Thai Restaurant
Siemens Westinghouse Power
Szechwan Restaurant
Siam Orchid Thai Restaurant
Table 24 Restaurant
Village Inn Café
Note: The lists are arranged in alphabetical order which is a requirment under California law for Retail Sales Tax information. Disclosure of actual sales tax by permittee is also confidential.
Allocations Adjusted for Economic Data
Period: January Thru December
Source : State Board of Equalization, California Department of Taxes and Fees Administration , State Controller's Office, The HdL Companies
City of Orinda
Direct and Overlapping Tax Rates
For the last ten fiscal years
(Rate per $100 of assessed value)
Rates (2)
(1) In 1978, California voters passed Proposition 13, which sets the property tax rate at a 1.00% fixed amount. In addition to the 1.00% fixed amount, property owners are charged taxes as a percentage of assessed property values for the payment of voter approved bonds.
(2) Overlapping rates are those of local and county governments that apply to property owners within the City. Not all overlapping rates apply to all property owners.
(3) The City's share of 1% levy is based on the City's share of the general fund tax rate area with the largest net taxable value within the City. ERAF tax shifts may not be included in ratio.
(4) City's Total Direct Rate is the weighted average of all individual direct rates applied by the City and excludes revenue derived from aircraft. Beginning in 2013-14 the Total Direct Rate no longer includes revenue generated from the former redevelopment tax rate areas. Challenges to recognized enforceable obligations are assumed to have been resolved during 2012/13. For the purposes of this report, residual revenue is assumed to be distributed to the City/Agency in the same proportions as general fund revenue.
Source : Contra Costa County Assessor 2013/14 - 2022/23 Tax Rate Table and HdL Coren & Cone
City of Orinda
Ratios of Net General Bonded Debt Outstanding
For the last ten fiscal years
Note: Details regarding the city ʹs oustanding debt can be found in the notes to the financial statements.
(1)This is the general bonded debt , net of original issuance discounts and premiums.
(2) This is the amount restricted for debt service principal payments
(3)See the Schedule of Assessed Value of Taxable Property for property value data.
(4)Population are disclosed on Demographic and Economic Statistics table.
Assesed Value
5,835,129,469 1.2%975
6,172,625,746 3.4%2,898
6,537,156,590 3.0%2,772
6,904,577,718 2.7%2,632
7,369,358,656 2.3%2,589
7,748,564,991 2.3%2,502
8,133,060,130 2.0%2,365
8,838,781,553 1.8%2,297
9,378,490,455 1.5%2,195
9,738,614,860 1.5%2,065
City of Orinda
Ratios of Net General Bonded Debt Outstanding
For the last ten fiscal years
Note: Details regarding the city ʹs oustanding debt can be found in the notes to the financial statements.
(1)This is the general bonded debt , net of original issuance discounts and premiums.
(2)This is the amount restricted for debt service principal payments
(3)See the Schedule of Assessed Value of Taxable Property for property value data.
(4)Population are disclosed on Demographic and Economic Statistics table.
This page intentionally left blank
City of Orinda
Legal Debt Margin Information
For the last ten fiscal years
debt applicable to limit (General
*Homeowner Property Tax Relief Exemption is not reflected in the City Net Taxable Assessed Value.
Note: The Government Code of the State of California provides for a legal debt limit of 15% of gross assessed valuation. However, this provision was enacted when assessed valuation was based upon 25% of market value. Effective with the 1981-82 fiscal year, each parcel is now assessed at 100% of market value (as of the most recent change in ownership for that parcel). The computations shown above reflect a conversion of assessed valuation data for each fiscal year from the current full valuation perspective to the 25% level that was in effect at the time the legal debt margin was enacted by the State of California for local governments.
Source : City of Orinda Finance Department
City of Orinda Direct and Overlapping Debt
As of June 30, 2025
208,375,469 (2)
*Homeowner Property Tax Relief Exemption is not reflected in the City Taxable Assessed Valuation.
(1)The percentage of overlapping debt applicable to the City is estimated using taxable assessed property value. Applicable percentages were estimated by determining the portion of the overlapping district's assessed value that is within the boundaries of the City by the district's toal taxable assessed value. Includes debt repaid through voter approved tax indebtedness. It excludes mortgage revenue, tax allocation bonds, interim financing obligations, non-bonded capital lease obligations.
(2)Excludes tax and revenue anticipation notes, enterprise revenue, mortgage revenue and non-bonded capital lease obligations.
to 2024-25 Assessed Valuation:
Source: California Municipal Statistics, Inc.
City of Orinda
Demographic and Economic Statistics
For the last ten years
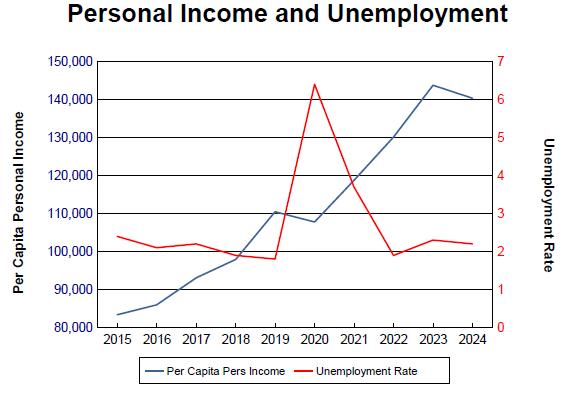
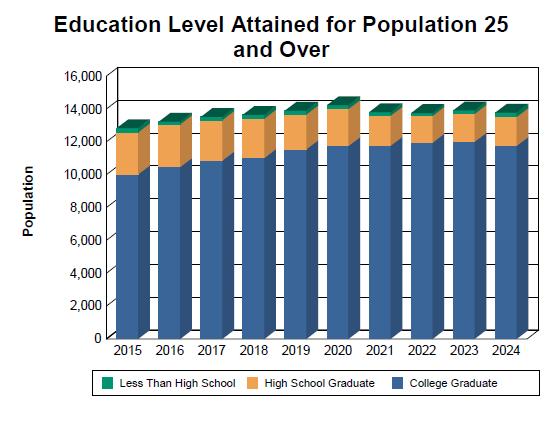
Sources: Population: California State Department of Finance Unemployment Data: California Employment Development Department Income, Age and Education Data: - US Census Bureau, most recent American Community Survey
City of Orinda
Capital Asset Statistics by Function Last Ten Years
Fiscal Year Ended June 30,
* Police services are provided pursuant to an agreement with the Contra Costa County Sheriffs Office
** Fire, water, and sewer services are provided by Special Districts which are separate from the City.
*** Streetlights in the City are owned and maintained by PG&E
Source : City of Orinda Finance Department
This page intentionally left blank
City of Orinda
Operating Indicators by Function Last Ten Fiscal Years
** Police services are provided pursuant to an agreement with the Contra Costa County Sheriffs Office
*** Starting January 2019, City entered into an MOU and began to maintain and schedule Orinda Union School District (OUSD) sports fields during non-school hours.
**** Fire, water, and sewer services are provided by Special Districts which are separate from the City.
Source : City of Orinda Finance Department
Source: City of Orinda Finance Department
City of Orinda Principal Employers
Note: the number of employees is based on permanent employees only