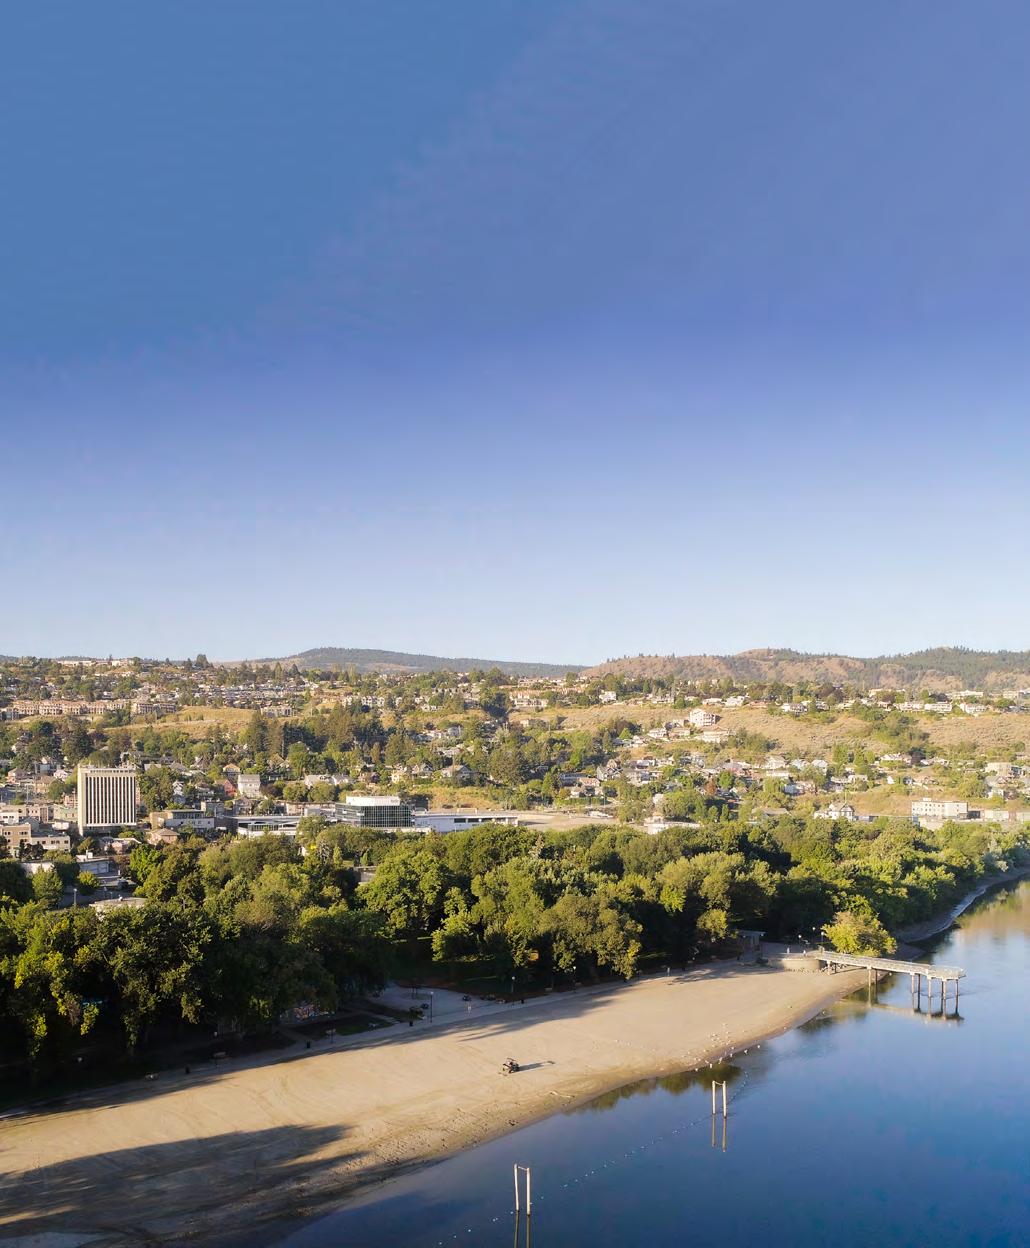
Kamloops is located within the ancestral lands of the Tk’emlúps te Secwépemc peoples. Tk’emlúps, which means “where the rivers meet”, has been an important centre of trade routes for centuries. The Secwépemc developed a unique culture that was totally self-sufficient pre-European contact through the seasonal use of natural resources.i As we face the challenges of climate change together, we have the opportunity to learn from traditional ecological knowledge to understand local climate impacts and foster sustainable ways of living that have long been practised on these lands.
“Our Land”, Tk’emlúps te Secwẻpemc, accessed March 22, 2021, https://tkemlups.ca/profile/history/our-land/.
CLIMATE CHANGE: A CALL TO ACTION
Local Context
The City of Kamloops is committed to building a healthy and sustainable community. A place with clean air and pristine drinking water where residents can walk, bike, or roll to access their daily needs; where wildlife and nature thrive; where local food systems provide nourishment; and where secure, green jobs support a vibrant local economy.
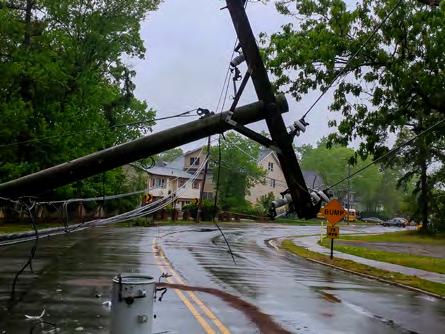
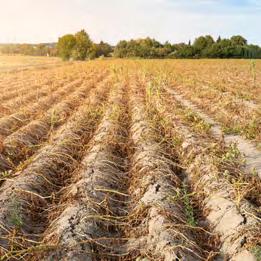
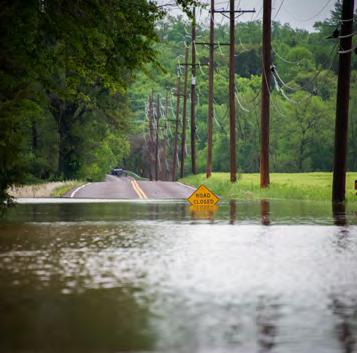
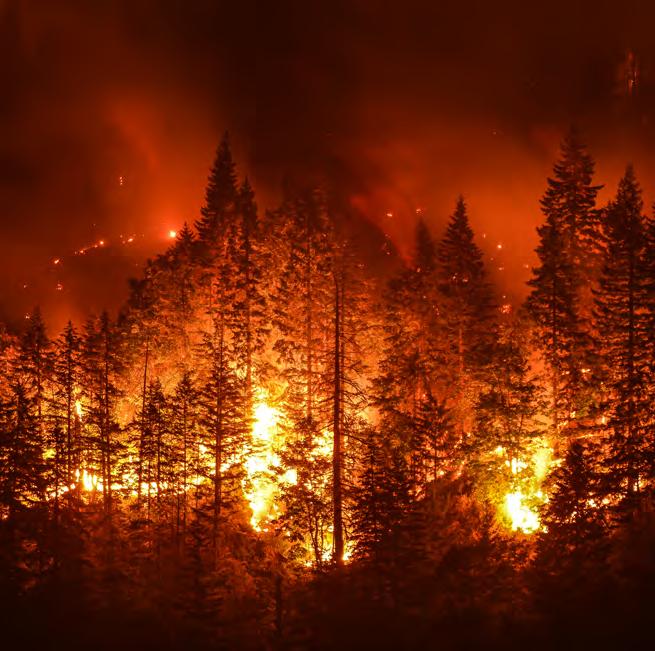
Unfortunately, climate change threatens this future, and many of its impacts are already being felt, including increasing extreme summer heat waves and droughts, more frequent and intense wildfires, seasonal flooding, warmer winter temperatures leading to pine beetle infestations, changes to stream flow affecting salmon populations, and stresses to natural ecosystems and agriculture. Climate scientists predict that these impacts will only intensify as average global temperatures continue to rise.
But the worst impacts of climate change are not inevitable. By working together as a community and with all levels of government, we can minimize our greenhouse gas (GHG) emissions that contribute to climate change and increase our resilience to its impacts. This plan is a call to action, and it will require municipal, public, and private collaboration to combat climate change.
WHY ACT NOW?
Climate change is the result of excess GHGs being emitted into the earth’s atmosphere from human activity such as cutting down carbon-absorbing forests for agriculture and urban development and burning fossil fuels such as oil, gas, and coal. As these gases accumulate, more heat is trapped in our atmosphere. Human activities are already estimated to have caused approximately 1.0°C of global warming above pre-industrial levels.i As of 2021, the previous six years have included all of the warmest years on record.
The Intergovernmental Panel on Climate Change (IPCC) has underscored that global temperature rise must stay below 1.5°C by drastically reducing GHG emissions and balancing remaining emissions through carbon sinks (e.g. oceans, plants, and soils) to achieve net-zero emissions by 2050.ii This is necessary to avoid the most catastrophic impacts of climate change, such as multi-metre sea level rise, large-scale species extinctions, and extreme weather events at a frequency and intensity that would be very difficult to adapt to. This target is especially important for Canada, which, because of its northern latitude, is experiencing a rate of warming approximately twice the global average. Kamloops, along with the rest of the world, must act now and do its part to avoid the worst impacts of climate change.
Climate change is happening at global and local scales and is the greatest threat to environmental and human health of our times. RISE LIMIT
1.5°C
“Global Warming of 1.5°C. An IPCC Special Report on the impacts of global warming of 1.5°C,” IPCC, 2018, https://www.ipcc.ch/sr15/chapter/spm/. ii Ibid.
Foundations for Climate Action
Since signing the BC Climate Action Charter in 2007, the City has undertaken a number of climate action initiatives, including the following:
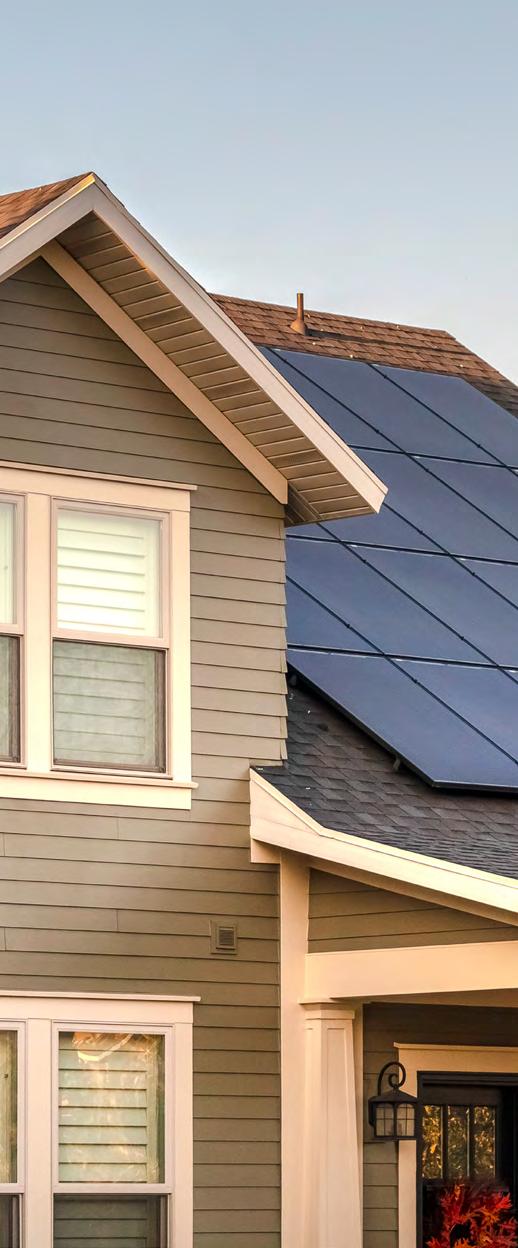
2016: 24 kW solar system installed on the West Highlands Community Centre
2016: Inaugural Green Living Expo
2011: Installation of universal water meters complete
2010: Sustainable Kamloops Plan
2012: Airshed Management Plan
SUPPORTING PLANS
2013: Corporate Energy and Emissions Management Plan
2013: Food and Urban Agriculture Plan
2013: Agricultural Area Plan
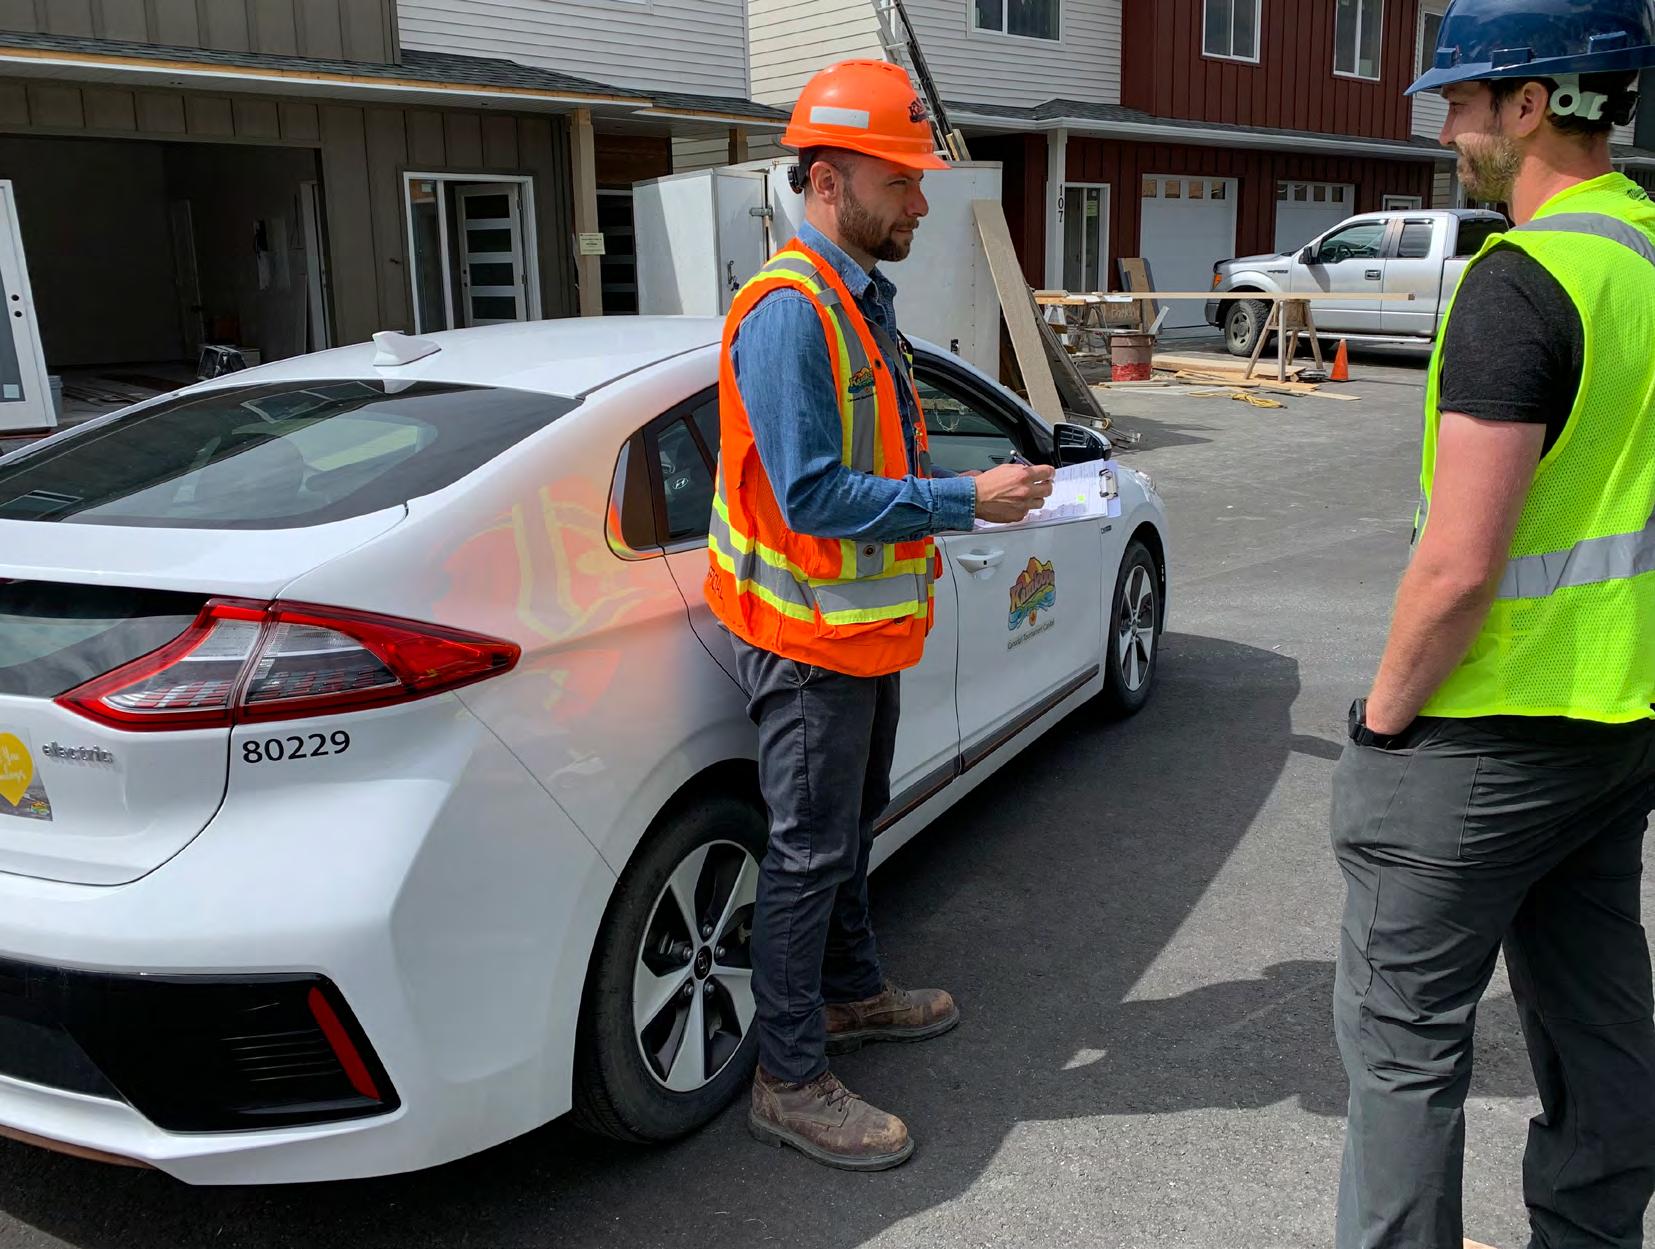
2018: City acquires first electric fleet vehicles
2018: Xget’tem’ Trail multi-use path complete
2019: BC Energy Step Code implementation strategy adopted
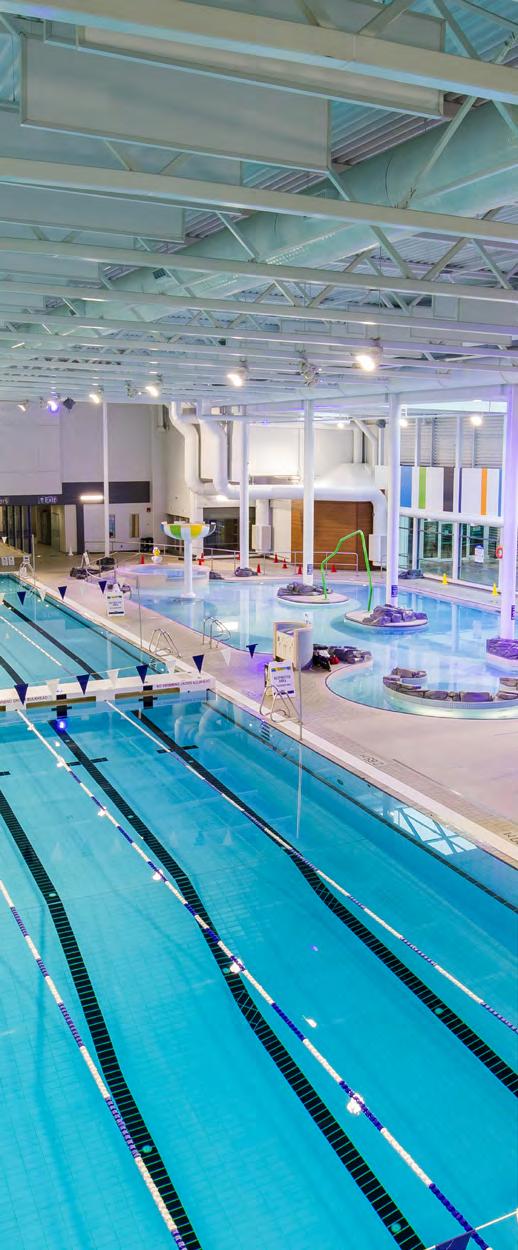
2020: Major infrastructure and energy efficiency improvements at Canada Games Aquatic Centre
2021: Curbside organics collection pilot
2021: City has 11 electric fleet vehicles
2020: Electric Vehicle and E-Bike Strategy
2020: Downtown Transportation Choices Strategy
2020: Transit Future Action Plan
2018: Transportation Master Plan
2018: Official Community Plan
2016: Urban Forest Management Strategy
Planning Process
The Community Climate Action Plan was developed through a community engagement process involving the public, key stakeholders, the CCAP Advisory Group, and City Council.
PHASE 1
UNDERSTANDING THE PRESENT
(October 2018– February 2019)
Phase 1 consisted of background research and collecting baseline information to understand Kamloops’ community energy and emissions profile and to explore opportunities for action.
PHASE 2 PHASE 3 PHASE 4
EXPLORING THE FUTURE
(March 2019–March 2020)
Phase 2 involved developing preliminary emissions reductions strategies and actions in collaboration with internal stakeholders. Upon Council’s request, this evolved into developing bolder options to enable Kamloops to contribute to international efforts to limit global warming to 1.5°C.
CHOOSING OUR FUTURE
(April–November 2020)
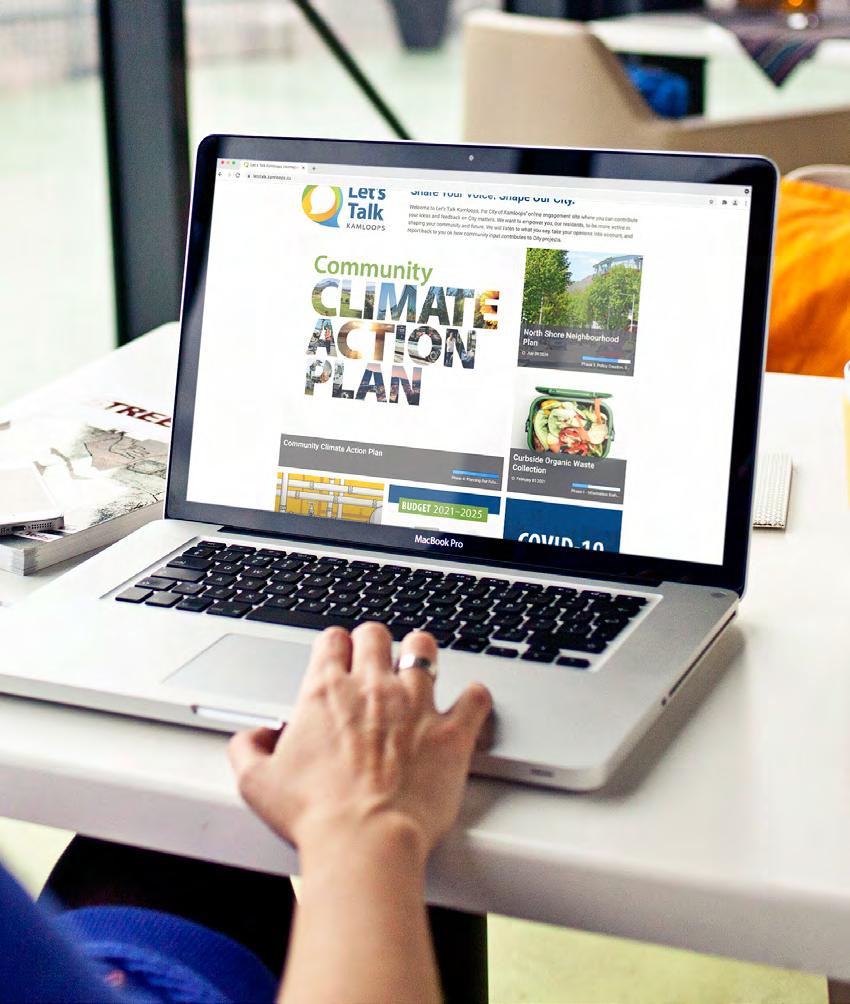
Phase 3 saw further development of the Big Moves strategy options, following which, community and stakeholder input was sought through a series of engagement activities, including a survey and discussion forum on LetsTalk.Kamloops.ca/ClimateAction.
PLANNING OUR FUTURE
(December 2020–June 2021)
Phase 4 consisted of refinement to the Big Moves and the development of a draft plan based on internal staff, public, stakeholder, and Council feedback along with detailed emissions modelling of proposed strategies. Further public and stakeholder engagement was conducted in preparation for presenting the plan to Council for adoption in June 2021.
Concurrent to the City’s CCAP process, Tk’emlúps te Secwépemc have also been developing a Community Energy Plan. This presents an opportunity to build upon partnerships, collaborate on climate action projects and initiatives, and share insights at Community to Community Forums that will help both communities to reduce emissions, mutually benefit from sustainable economic development, and adapt to climate change.
Public Engagement Highlights
The City thanks everyone who took time to learn about the plan and share their feedback. This input ultimately shaped and strengthened the CCAP and reflects the many voices heard throughout the project.
262+ participants at in-person and virtual engagement sessions
2,947 unique visitors to the Let’s Talk Climate Action page
532 survey responses
924 89% viewed climate change as a somewhat or very serious problem comments contributed
Visit LetsTalk.Kamloops.ca/ClimateAction for more information on the engagement process and feedback received.
OBJECTIVES & TARGETS
The Kamloops City Council Resolution that was adopted on June 25, 2019, stated:
Therefore be it resolved that Kamloops City Council:
a) set a strategic goal for reducing community greenhouse gas emissions that is in line with Kamloops’ portion of global efforts to keep global temperature rise to 1.5°C
b) mandate staff, through the work on the Community Climate Action Plan, to outline a series of actions that would reduce greenhouse gas emissions in Kamloops to align with the global efforts to keep global temperature rise to 1.5°C
In response, 8 Big Moves and 24 strategies were created, which have the potential to reduce community GHG emissions at a pace consistent with Council’s resolution. Further, a set of short-, medium-, and long-term actions to implement the Community Climate Action Plan’s (CCAP’s) Big Moves were identified along with interim and long-term targets to help focus local commitment towards clear and measurable outcomes.
2024
undertake all short-term actions
BY 2030 BY 2050
reduce community GHG emissions by at least 80% compared to 2007 BY
reduce community GHG emissions by at least 30% compared to 2007
The 2030 interim target accounts for the lead time required to implement the short- and medium-term actions and for their emissions reductions to take effect.
The CCAP sets a pathway to reduce community emissions by up to 80% by 2050. While a target of reaching net-zero emissions by 2050 (i.e reducing emissions to as close to zero as possible and absorbing remaining emissions through carbon sinks) is recommended by the IPCC, the City currently has limited jurisdiction over some key emissions sources, principally heavy-duty transportation and existing buildings. As future technology and policy solutions emerge, there will be opportunities to address these emissions and update the target.
CURRENT & PROJECTED EMISSIONS
Key Emissions Sources in Kamloops
Understanding where our emissions are coming from is key for identifying emissions reductions opportunities. An inventory of GHG emissions was undertaken using data from internal sources and external sources such as BC Hydro, FortisBC, ICBC, BC Transit, and Statistics Canada. While emissions come from a variety of GHGs (e.g. methane and nitrous oxide), they are reported in tonnes of carbon dioxide equivalent (tCO2e), which is a standard measure that converts any non-CO2 GHGs to an equivalent measure based on their global warming potential.
Emissions Drivers and Status
SECTOR
Land Use Land use planning influences transportation and buildings emissions through:
• More compact, complete, and connected neighbourhoods with access to shopping, work, school, and recreation have decreased energy demands.
• Mixed-use development (i.e. residential and commercial), providing access to daily needs amenities.
• Connectivity of transit and active transportation infrastructure.
• Location of new growth in core and urban areas with limited growth in suburban and rural areas.
Transportation
Major influences on transportation emissions include:
• Mode share of transit, carpooling, car sharing, cycling, and walking, which is affected by access to and availability of supporting infrastructure.
• Vehicle size with compact vehicles being generally more fuel-efficient.
• Fuel type as the average electric vehicle (EV) is currently four times more efficient than a gas or diesel-powered vehicle. In BC, EVs are fuelled with low-carbon electricity.
Walkability can serve as a proxy for close access to daily needs. In Kamloops:
• Downtown and the North Shore have the highest walkability. Densification in the Core sector is occurring at a more rapid pace than projected by the City’s Official Community Plan.
• Westsyde, Brocklehurst, and Valleyview have moderate walkability scores due to the commercial corridors being along arterial roads.
• Aberdeen, Juniper Ridge, and Batchelor Heights have very low walkability scores due to the absence of local amenities.
Kamloops is a car-intensive community:
• In 2017, 88% of all trips in Kamloops occurred by car compared to 5% for transit and 7% for active modes.
• Trucks and SUVs were the most common passenger vehicle in the City, comprising 60% of all registered vehicles.
• In 2019, 191 EVs and 712 hybrid vehicles were registered in Kamloops.
SECTOR KEY DRIVERS
Buildings Emissions in buildings are primarily influenced by:
• Energy sources used with natural gas (a fossil fuel) having far higher emissions than electricity and renewable energy.
• Building size and type with smaller homes and units that share walls being more thermally efficient.
• Building age, design, and efficiency as energy efficiency requirements have increased over time.
• Space and water heating types and efficiency as these are major consumers of energy.
• Construction components, which can have varying levels of embodied carbon.
The following are trends for buildings in Kamloops:
• In 2017, buildings in Kamloops used 5,428,358 GJs of natural gas (63%) and 3,219,623 GJs of electricity (37%).
• There has been a sustained surge in medium- to high-density multi-family development since 2016.
• The average new single, detached home in Kamloops is 2,650 sq. ft., over 70% larger than homes built prior to 1976.
• Family size is shrinking, and Kamloops has a particularly high share of households with a single person (28%) and couples without children at home (33%), which leads to high per capita emissions.
• The rate of house demolition is very low—0.05%—meaning that very few older homes are being replaced by more efficient new homes.
• Some steps of the BC Energy Step Code will be adopted in 2022, which will require higher energy efficiency standards in new construction.
Solid Waste Emissions from solid waste are influenced by:
• Quantity of organic matter (i.e. paper, wood, textiles, and food waste) decomposing in the landfill, where it becomes methane, a potent GHG.
• Organics collection and waste diversion programs.
• Collection and conversion of methane gas.
In Kamloops, solid waste management trends include:
• In 2019, 0.73 tonnes per capita of waste was landfilled.
• Approximately 38% of residential waste disposed of in the landfill is organic matter.
• The City has a residential curbside pickup service for garbage and recycling as well as a program for multi-family and commercial businesses.
• The City is implementing a residential organics collection program, establishing a curbside service before expanding to include multi-family buildings.
• The Mission Flats Landfill has some methane collection in place.
Projected Future Emissions
PROJECTED EMISSIONS REDUCTIONS AND REMAINING EMISSIONS, 2007–2050
EmissionsReductions
Reductions
to
(primarily
weigh
Projected emissions reductions from the 2007 baseline (612,000 tCO2e) by 2050:
Existing City, provincial, and federal government policies and plans:
222,000 tCO2e (36.3% REDUCTION)
430,750 tCO2e
TOTAL REDUCTIONS FROM 2007 BASELINE (70% REDUCTION)
Additional reductions from CCAP Big Moves strategies:
208,750 tCO2e (34.1% REDUCTION)
Existing City, federal, and provincial commitments will not result in sufficient reductions to meet the 80% by 2050 target; therefore, significant additional actions from the CCAP’s Big Moves are required. Combined, total reductions of 70% are projected. This leaves a 10% gap to meet the target, which could be accounted for by future solutions for medium- and heavy-duty transportation emissions or government legislation requiring fuel switching and retrofits of existing building stock.
Overview of factors driving projected emissions reductions:
PROVINCIAL AND FEDERAL CLIMATE COMMITMENTS
Government of BC
• Emissions reduction targets: 40% by 2030, 60% by 2040 and 80% by 2050 (below 2007 levels)
• 2018 CleanBC Plan priorities:
- setting EV sales mandates
- increasing renewable natural gas supply
- reducing emissions from landfills
- supporting building energy retrofits
Government of Canada
• Target: net-zero carbon emissions by 2050 (legislation pending)
• 2020 A Healthy Environment and a Healthy Economy climate plan priorities:
- clean energy and technology
- financial support for electric vehicles, building retrofits, and ecosystem restoration
- increasing the federal carbon tax
LAND USE:
Official Community Plan projections for residential growth in higher-density areas of the city, particularly in the downtown core and neighbourhood centres, support transportation and buildings emissions reductions. The Big Moves propose to further limit emissions from developments in suburban and rural areas.
BUILDINGS:
Implementation of the BC Energy Step Code will support new building efficiency improvements, while higher efficiency technologies and incentives from the provincial and federal governments will make it easier and less costly to construct and retrofit more efficient buildings. The Big Moves will accelerate energy efficiency improvements proposed by the BC Energy Step Code, increase the use of electric space and water heating in all buildings, and provide additional support for retrofits. However, buildings already constructed will still comprise the majority of the city’s building stock and associated emissions in 2050.
TRANSPORTATION:
Significant emissions reductions will primarily be achieved through provincial and federal supports for electric vehicles (EVs) and low-carbon fuel standards. The Big Moves will further facilitate the transition to EVs while enabling the use of sustainable and active transportation modes. Medium- and heavy-duty transportation are projected to account for the largest proportion of remaining emissions in 2050 unless cost-effective technologies for electrification are developed or the use of renewable fuels increases.
SOLID WASTE:
The Big Moves will further advance the objectives of the Thompson-Nicola Regional District Solid Waste Management Plan to divert methane-generating materials from the landfill, with additional actions to reduce waste. Despite this, emissions are expected to remain by 2050 as a result of waste already disposed in the landfill that will continue to decompose into methane.
KAMLOOPS’ 8 BIG MOVES
The Big Moves outline ambitious strategies that will have the biggest impact towards achieving our community’s 80% emissions reduction by 2050 target.
BIG MOVE 1:
Low-Carbon Development
Promoting compact, mixed-use development supported by sustainable transportation options.
BIG MOVE 5:
Zero-Waste/Circular Economy
Enhancing waste reduction, diversion, upcycling, and reuse.
BIG MOVE 2:
Car-Light Community
Facilitating the increased uptake of walking, cycling, carpooling, and transit.
BIG MOVE 6:
Renewable Energy
Supporting localized renewable energy production and use.
BIG MOVE 3:
Zero-Emissions Transportation
Supporting zero-emission vehicle use.
BIG MOVE 4:
Zero-Carbon Homes & Buildings
Ensuring all buildings maximize energy efficiency and use low-carbon energy sources.
BIG MOVE 7:
Municipal Climate Leadership
Taking the lead in shifting to zero-carbon facilities and fleets and applying a climate lens to planning and decision-making.
BIG MOVE 8:
Healthy Urban Ecosystem
Preserving ecosystems and using green infrastructure to provide carbon sequestration and climate resilience.
TARGET
The Big Moves will reduce greenhouse gas emissions and can also benefit our community’s health, economy, environment, and quality of life.
Co-Benefits
ENHANCED LIVABILITY from increasing access to sustainable transportation infrastructure, green spaces, and daily amenities.
GREEN ECONOMY AND INNOVATION
through creating local jobs in construction and retrofits, waste upcycling, renewable energy generation, and research and development.
IMPROVED PUBLIC HEALTH as a result of promoting a more active and connected community.
ECOSYSTEM PRESERVATION from restoration projects, the use of native plants and promoting development in existing neighbourhoods.
IMPROVED AIR QUALITY due to less vehicle tailpipe emissions and combustion of natural gas.
IMPROVED WATER QUALITY by reducing run-off to the rivers by using green infrastructure and trees that absorb rainfall.
INCREASED CARBON SEQUESTRATION from preserving grasslands and increasing the tree canopy.
ENHANCED RESILIENCE to climate change impacts through green infrastructure, high-performance buildings, and backup renewable energy sources.
Emissions Reductions
Each of the 24 strategies within the Big Moves has been modelled for its potential annual emissions reductions by 2050 under the following sectors:
personal transportation medium- and heavy-duty transportation
residential buildings
institutional, commercial, and industrial (ICI) buildings
solid waste
Very High
20,000 tCO2e and above
Moderate
1,000–9,999
Enabling
strategies that have not been modelled but are necessary to enable emissions reductions in other areas The estimated total annual reductions are specified along with a descriptor to show the relative scale of projected reductions (i.e. very high, high, moderate, etc.).
The relative scale of a strategy’s emissions reduction potential is not necessarily an indicator of its importance or priority. Achieving the City’s emissions reductions goals will require contributions, both large and small, from every emissions source in our community.
High
10,000–19,999 tCO2e
Supporting strategies with modest emissions reductions that have not been modelled
Economic Considerations
The financial impacts of climate change are rising globally as weather-related disasters like floods, storms, and wildfires are becoming more frequent, more extreme, and more expensive. In Canada, catastrophic weather events totalled over $18 billion in insured losses between 2010 and 2019, and there were triple the number of catastrophic events than in the 1980s. In 2018, an estimated $615 million was spent on fire management and suppression operations in BC, with significant additional costs associated with evacuations, property losses, declining tourism, and impacts on agriculture from the devastating wildfire season.ii
Insurers and taxpayers share the costs of recovering from severe weather damage. For every dollar of insurance claims paid to households and businesses, governments are spending much more to repair the damage to public infrastructure.iii The cost from the impacts of uncontrolled climate change has been estimated to equate to at least 5% of global GDP, yet studies consistently show it would cost less to make the deep emission cuts needed to avoid the worst impacts.iv Therefore, investments in reducing emissions and increasing resilience today will limit the future costs borne by our society.
Actions to mitigate the impacts of climate change will require investments by the City, residents, businesses, institutions, and developers, many of which will also boost the local economy. Some investments are easier to predict in the short term (e.g. the current price premium to purchase an electric vehicle [EV]). However, given rapid technological advancements, changes in energy prices, evolving legislation and funding from other levels of government, cost estimates are difficult to project out to 2050.
Economic considerations have been included for all strategies within the Big Moves, with high-level estimates included only for the most current-day approximations.
Through the municipal budget process, specific actions will require a detailed business case at the time of implementation, which will provide an opportunity to evaluate these with the most up-to-date costs, personnel requirements, available grants, and other identified funding sources.
“Experts warn, Canada must act now to head off rising costs of climate change,” Canadian Institute for Climate Choices, December 3, 2020, https:// climatechoices.ca/news/experts-warn-canada-must-act-now-to-head-off-rising-costs-of-climate-change/.
ii Jennie Wang and Katharine Strong, “British Columbia’s forest fires, 2018,” Statistics Canada, May 29, 2019, https://www150.statcan.gc.ca/n1/pub/16-508x/16-508-x2019002-eng.htm.
iii “Severe Weather Caused $2.4 Billion in Insured Damage in 2020,” Insurance Bureau of Canada, January 18, 2021, http://www.ibc.ca/on/resources/mediacentre/media-releases/severe-weather-caused-$2-4-billion-in-insured-damage-in-2020.
iv Matthew Bramley “Why should Canada act on climate?,” The Globe and Mail, Dec. 14, 2010, https://www.pembina.org/op-ed/2139.
LOW-CARBON DEVELOPMENT
BIG MOVE 1: LOW-CARBON DEVELOPMENT
How and where new development occurs is one of the most important determining factors that influence a community’s carbon emissions.
Low-density residential development located far from a city’s core results in higher emissions due to greater car use and environmental impacts from land clearing, habitat fragmentation, and creating impervious surfaces.
When people live close to their daily needs—jobs, schools, healthcare, food, leisure, etc.—they don’t need to drive as much, and enabling transit use, cycling, and walking leads to residents’ saving on transportation costs and improved health, livability, and community connectedness.
Building upon the recent increase in multi-family housing in Kamloops, low-carbon development strategies focus on prioritizing increased housing density located near amenities, services, and jobs, with access to sustainable transportation options. This Big Move addresses emissions from buildings and transportation in several ways, including
promoting mixed-use development within existing neighbourhoods to provide more daily needs close to home, increasing housing types and availability through residential suites and infill, and ensuring that any new peripheral developments meet higher standards of building efficiency and support the use of electric vehicles (EVs). Encouraging growth in existing serviced areas instead of undeveloped lands on the city’s periphery, while respecting the Aberdeen Growth Management Boundary, reduces the cost of building and maintaining new infrastructure. Shifting to more efficient and compact land use also preserves more land for agriculture, recreation, and ecological conservation, which enhances carbon sequestration and climate change adaptation.
By 2050, 90% of residents can access their daily needs and efficient transit within a 10-minute walk or roll.
GOAL:
1A - Ten-Minute City ACTIONS:
To support the integration of daily needs amenities in existing neighbourhood centres and, wherever possible, to concentrate housing near existing and proposed transit, cycling, and walking networks.
ECONOMIC CONSIDERATIONS:
• Providing incentives for infill development is more equitable and reflective of service provision and infrastructure costs. A shift from peripheral singlefamily development to higher-density urban housing results in relative reductions in City infrastructure and service costs.ii For instance, if multi-family units were to account for 40% of new construction (3,890 units) by 2050, this would result in City infrastructure and service cost savings of $8.7 million per year.iii
• Households in higher-density areas spend, on average, 25% less on transportation due to better access to transit and active transportation infrastructure. This represents a savings of $3,600 per year in Kamloops, which increases disposable income and consumer spending.iv
• Increasing access to daily needs has the potential to reduce inequities in the community by improving walkability for all.
• Housing affordability provisions will be necessary to mitigate the impacts of gentrification on lowerincome households.
Identify priority areas to support infill projects that further increase housing density, mixed uses, and access to transit and active transportation infrastructure in existing neighbourhood centres.
Increase incentives to promote infill development (e.g. revitalization tax exemptions and reduced development cost charges [DCCs]).
Increase availability of affordable market housing options that also contribute to higher density (e.g. density bonus for rental-only multi-family buildings).
PROJECTED ANNUAL GHG REDUCTIONS BY 2050:
This level of emissions reductions relies on 90% of new development being infill.
1B - Diverse Housing Solutions
GOAL:
To support additional housing opportunities on residential lots.
ECONOMIC CONSIDERATIONS:
• Residential suites can provide a source of income for homeowners and add value to homes while increasing the availability of rental housing.
• Small-lot residential infill can provide more affordable housing options within existing neighbourhoods.
• Encouraging developers to build legal residential suites at the time of construction will increase costs incrementally, as many new single-family developments are already including basic servicing needed for suites (e.g. plumbing and a wet bar).
ACTIONS:
Promote the development of legal residential suites when new homes are being constructed in areas where suites are permitted.
Promote ground-oriented housing such as townhouses, row houses, multi-plexes, and small lot residential infill.
Review secondary suite policy and consider guidelines for permitting a secondary suite and an accessory dwelling unit (e.g. carriage suite or garden suite) on a single-family lot in designated areas.
PROJECTED ANNUAL GHG REDUCTIONS BY 2050:
This level of emissions reductions would be expected if 3,000 suites are built (i.e. 25% of new units being suites).
1C - Green New Neighbourhoods
GOAL:
To require that all new buildings and neighbourhoods in suburban and rural greenfields meet higher sustainable development standards.
ECONOMIC CONSIDERATIONS:
• Reducing GHG emissions intensity of construction could result in construction cost premiums of between 2.85% and 3.24%.v For example, according to the NRCan LEEP Costing Tool for Kamloops, purchasing a central air source heat pump instead of a gas furnace results in an incremental cost of approximately $4,000–$7,000 per unit without incentives.
• There will be some incremental costs to installing electric vehicle (EV) charging infrastructure at the time of development, but this is more affordable than retrofitting EV stations at a later time.
• Higher DCCs will increase the recuperation of higher capital costs associated with new peripheral developments such as new booster pumping stations.
• Limiting natural gas servicing will avoid costs of adding gas lines and ensure that only electric space and water heating systems and appliances are installed at time of development.
ACTIONS:
Require developers to meet a higher BC Energy Step Code step than regulated and/or meet a specified GHG intensity.
Require developers to install one charging station (capable of Level 2 charging) for every two stalls of off-street parking in single-family developments, in addition to any city-wide EV-ready policy.
Increase DCCs for developments in peripheral areas (suburban and rural) to address the costs of required service upgrades or extensions.
Explore regulatory options to limit new natural gas servicing in favour of all-electric power and/or on-site renewable energy.
PROJECTED ANNUAL GHG REDUCTIONS BY 2050:
This level of emissions reductions would require avoiding natural gas servicing to new developments, ensuring that electricity or renewable energy is used.
5,450 tCO2e (High)
TOTAL BIG MOVE 1
PROJECTED ANNUAL EMISSIONS REDUCTIONS
( t CO 2e ) BY 2050, BY SECTOR
25,350
Low-carbon development strategies will reduce emissions across a variety of sectors through enabling future development to be more compact and connected to local amenities by active transportation infrastructure and transit. Buildings emissions will be reduced through increasing density, with multi-family buildings, duplexes, and residential suites having lower energy demands per unit than single-family homes. Some infill development will replace older, inefficient buildings with new buildings built to higher energy efficiency standards. Requiring new developments in suburban and rural greenfields to meet higher standards of building efficiency and support the use of EVs will reduce emissions from buildings and transportation, and help mitigate the impacts of being located further from jobs and services.
“Managing Urban Sprawl: Reconsidering Development Cost Charges in Canada,” Smart Prosperity Institute, January 2012, https://institute. smartprosperity.ca/sites/default/files/managing-urban-sprawl.pdf.
ii “Settlement Pattern and Form with Service Cost Analysis,” Halifax Regional Municipality, April 2005, https://usa.streetsblog.org/wp-content/uploads/ sites/5/2015/03/Halifax-data.pdf.
iii “CCAP Economic Analysis Summary,” City of Kamloops.
iv Ibid.
v Ibid.
CAR-LIGHT COMMUNITY
BIG MOVE 2: CAR-LIGHT COMMUNITY
In 2017, 66% of Kamloops’ greenhouse gas (GHG) emissions came from transportation, with the majority (49%) coming from passenger vehicles.
Reaching the CCAP targets will require a significant shift to transit, cycling, walking, car sharing, and carpooling. While cars can be convenient, they have many hidden costs, from air pollution and vehicle collision mortalities to the space required and high cost to build and maintain roadways and parking amenities. By contrast, active modes of transportation (walking and cycling) have a net benefit to society.
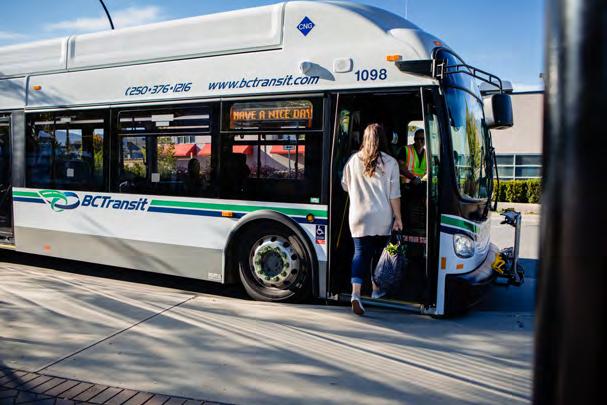
This Big Move lays out the actions to become a car-light community, where people of all ages and abilities can safely and conveniently get around without needing to own a vehicle. In the future, most Kamloops residents will live close to their daily needs, with reliable and frequent transit service, protected bike lanes, and sidewalks to connect all key destinations. E-bikes are already helping to displace some trips that are made using larger
vehicles due to their efficiency, assistance with hills, and in the case of cargo E-bikes, storage capacity. Micro-mobility devices, such as E-scooters, are also emerging as potential transportation solutions that can be easily complemented by transit for longer distances (i.e. carried onto buses and used to get around at a destination). Programs and incentives will support the transition to sustainable transportation modes, and for those who need a car, carpooling and car sharing offer lower-carbon options, especially when zero-emissions vehicles (ZEVs) are used. With less private vehicle traffic, streets will be safer and some can be redesigned to prioritize socializing, active transportation, and green space. Owning and operating fewer vehicles increases household disposable income, while active transportation use also improves physical and mental health, lowers air pollution, reduces parking demand, and minimizes road maintenance costs.
By 2050, 50% of trips in Kamloops are to be by active transportation and transit.
2A - Active Mobility
GOAL:
To enable the safe, secure, and efficient transport of people and goods using active transportation modes.
ECONOMIC CONSIDERATIONS:
• City investments in active transportation infrastructure could require up to $1 million/year of funding (in addition to current budget).i
• Increasing access to active transportation infrastructure reduces reliance on private motorized vehicles and decreases household transportation costs.
• Lively, walkable neighbourhood centres and separated bike lanes are good for local businesses, with studies showing retail sales increase with new bike lanes.ii
• Lower air pollution and increased physical activity due to using active modes of transportation can result in healthcare cost savings.
ACTIONS:
Build out a connected active transportation network by 2030, starting with completing connections along north–south and east–west corridors, followed by filling in any gaps to ensure key feeder connections to core routes.
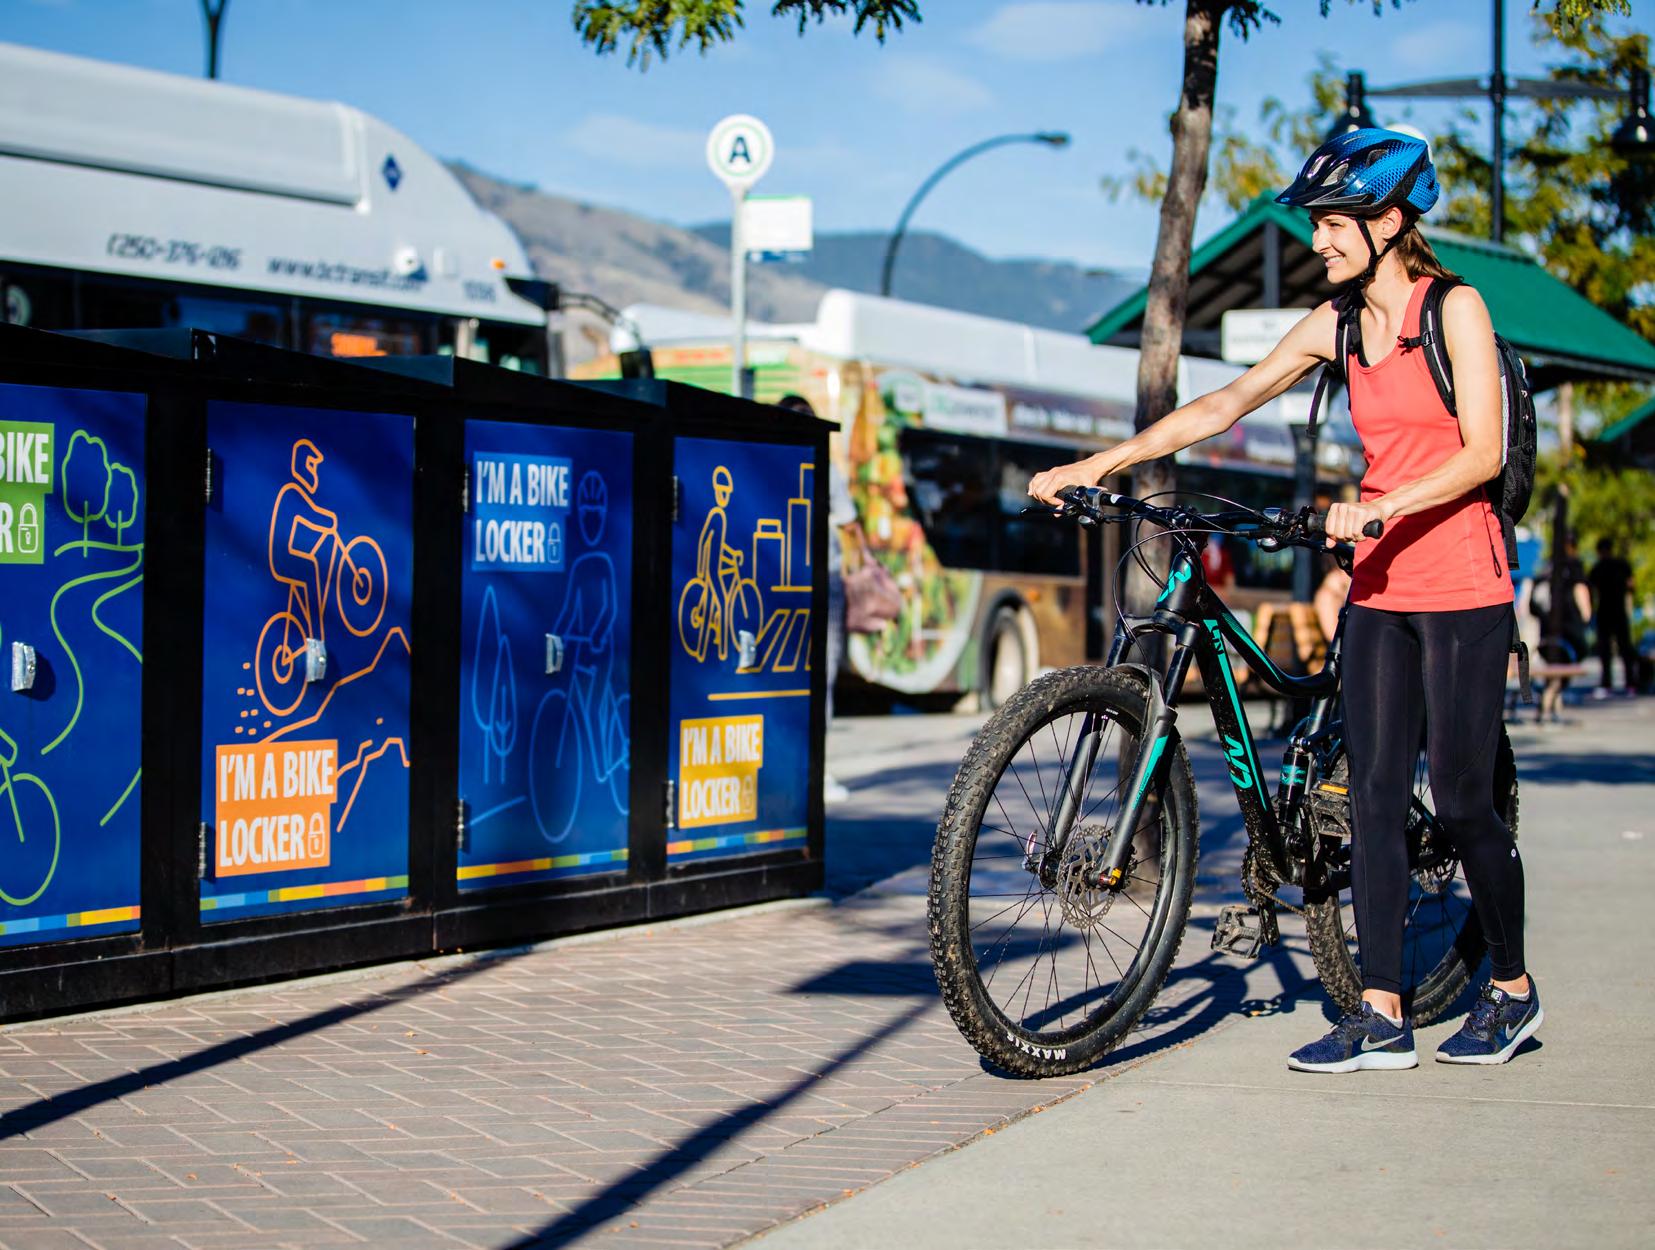
Increase the availability of publicly accessible, secure, end-of-trip bike storage amenities in major neighbourhood centres and other key destinations.
Develop and implement an incentive program for E-bike/cargo bike purchases as per the Electric Vehicle (EV) and E-Bike Strategy.
PROJECTED ANNUAL GHG REDUCTIONS BY 2050:
5,000
GOAL:
2B - Optimize Transit Service ACTIONS:
To optimize transit service to support low-carbon development and land use goals.
ECONOMIC CONSIDERATIONS:
• Accelerating transit infrastructure and amenity improvements would require $250,000/year (in addition to current budget).iii
• Families whose children benefit from increased access to bus services or active transportation options will spend less than transporting children to school by personal vehicles.
• Optimized transit service can open up employment opportunities for those who cannot drive or for whom car ownership is cost prohibitive.
Improve infrastructure and amenities (e.g. seating, pads, shelters, and real-time bus arrival information) to encourage transit use.
Identify light rail transit (LRT) rights-of-way to be reserved for future iterations of the transit network (i.e. the sequential development of future HOV lanes to be replaced by bus only lanes and eventual LRT development).
Develop a Frequent Transit Strategy with BC Transit that explores options such as electric bus rapid transit (eBRT) to connect higher-density areas and key destinations.
PROJECTED ANNUAL GHG REDUCTIONS BY 2050:
2C - Shared Streets
GOAL:
To create street space that is accessible to all ages and abilities, enhances pedestrian safety and comfort, and prioritizes active transportation.
ECONOMIC CONSIDERATIONS:
• Local businesses may benefit from increased foot and cycle traffic in pedestrian-friendly areas.
• Reduced road widths can slow traffic and create economic vibrancy in commercial areas.
ACTIONS:
Pursue opportunities to convert select street space (temporarily at first) into areas that prioritize pedestrianonly or pedestrian-friendly areas with public amenities such as trees and gardens, seating, art installations, and bike parking and with vehicle access limited to local residents, businesses, and emergency vehicles.
Identify suitable streets to implement reduced road width initiatives that contribute to traffic calming and convert space for community benefit (e.g. active transportation infrastructure, parks, community gardens, daycares, or affordable housing).
Implement low-traffic neighbourhood projects that extend pedestrian zones to multiple urban blocks (with emergency vehicle access only).
PROJECTED ANNUAL GHG REDUCTIONS BY 2050:
GOAL:
2D - Transportation Demand Management ACTIONS:
To decrease trips by single-occupancy vehicles by facilitating the uptake of sustainable transportation options (i.e. transit, carpooling, car sharing, cycling, and walking) and reducing the need to travel.
ECONOMIC CONSIDERATIONS:
• TDM measures can defer or avoid the need for costly road expansion projects, reduce congestion delays, and make roads safer. Estimates have shown returns on investment of up to $9 per every dollar invested in TDM measures.iv TDM measures are included in the City’s Downtown Transportation Choices Strategy adopted in 2020.
• Employer investments could include end-of-trip amenities such as bike storage, showers, and lockers, which may be offset by improved health and productivity of employees.
• By reducing the need for travel and promoting collaborative office environments, employers can reduce the amount of office space needed, which would result in real estate savings. Flexible work arrangements can also save employers money by reducing absenteeism and boosting productivity of employees.v
Strategically promote targeted neighbourhood transportation demand management (TDM) programs to residents (e.g. promote uptake of new active transportation infrastructure or increased transit service levels to reduce localized congestion areas and avoid road widening).
Develop and promote TDM measures for employers city-wide, including facilitating the use of sustainable transportation options and reducing the need for travel (i.e. through virtual meetings, flexible work hours, and work-from-home options).
Review Parking Management Plan (to be completed in 2021) measures to encourage the use of sustainable transportation options as active transportation infrastructure and transit service levels improve.
PROJECTED ANNUAL GHG REDUCTIONS BY 2050:
2E - Kamloops Car Share
GOAL:
To reduce the number of privately-owned vehicles in the city through membership-based car sharing services.
ECONOMIC CONSIDERATIONS:
• There are various potential models for establishing a car sharing service. Some are run by private companies or cooperatives, while others have been supported by municipalities through allocating select City fleet vehicles for community use outside of work hours.
• Households could save thousands of dollars annually in car ownership and maintenance costs if a car sharing membership enables them to not own a car or decrease the number of vehicles they own.
ACTIONS:
Explore business models for car-share options and prioritize opportunities to integrate plug-in hybrid and EVs into car sharing fleets.
Encourage the use of established car sharing services in new developments in higher-density urban areas to reduce parking space requirements.
PROJECTED ANNUAL GHG REDUCTIONS BY 2050:
TOTAL BIG MOVE 2
PROJECTED ANNUAL EMISSIONS REDUCTIONS
( t CO 2e ) BY 2050, BY SECTOR
100% TransportationPersonal
11,500
Emissions reductions primarily result from the strategies reducing reliance on personal vehicles and their associated fossil fuel use. Remaining emissions from gas powered vehicles will be further reduced by transitioning to EVs, as outlined in Big Move 3.
“CCAP Economic Analysis Summary,” City of Kamloops.
ii Eric Jaffe, “The latest evidence that bike lanes are good for business,” Medium online, September 5, 2019, https://medium.com/sidewalk-talk/the-latestevidence-that-bike-lanes-are-good-for-business-f3a99cda9b80.
iii “CCAP Economic Analysis Summary,” City of Kamloops.
iv “Transportation Cost Savings Calculator,” Mobility Lab, accessed March 10, 2021, https://mobilitylab.org/calculators/.
v “OSH Answers Fact Sheets: Flexible Work Arrangements,” Canadian Centre for Occupational Health and Safety, last modified March 31, 2021, https:// www.ccohs.ca/oshanswers/psychosocial/flexible.html.
ZERO-EMISSIONS TRANSPORTATION
BIG MOVE 3: ZERO-EMISSIONS TRANSPORTATION
Two-thirds of Kamloops’ community GHG emissions in 2017 were from the use of gas- and diesel-powered vehicles.
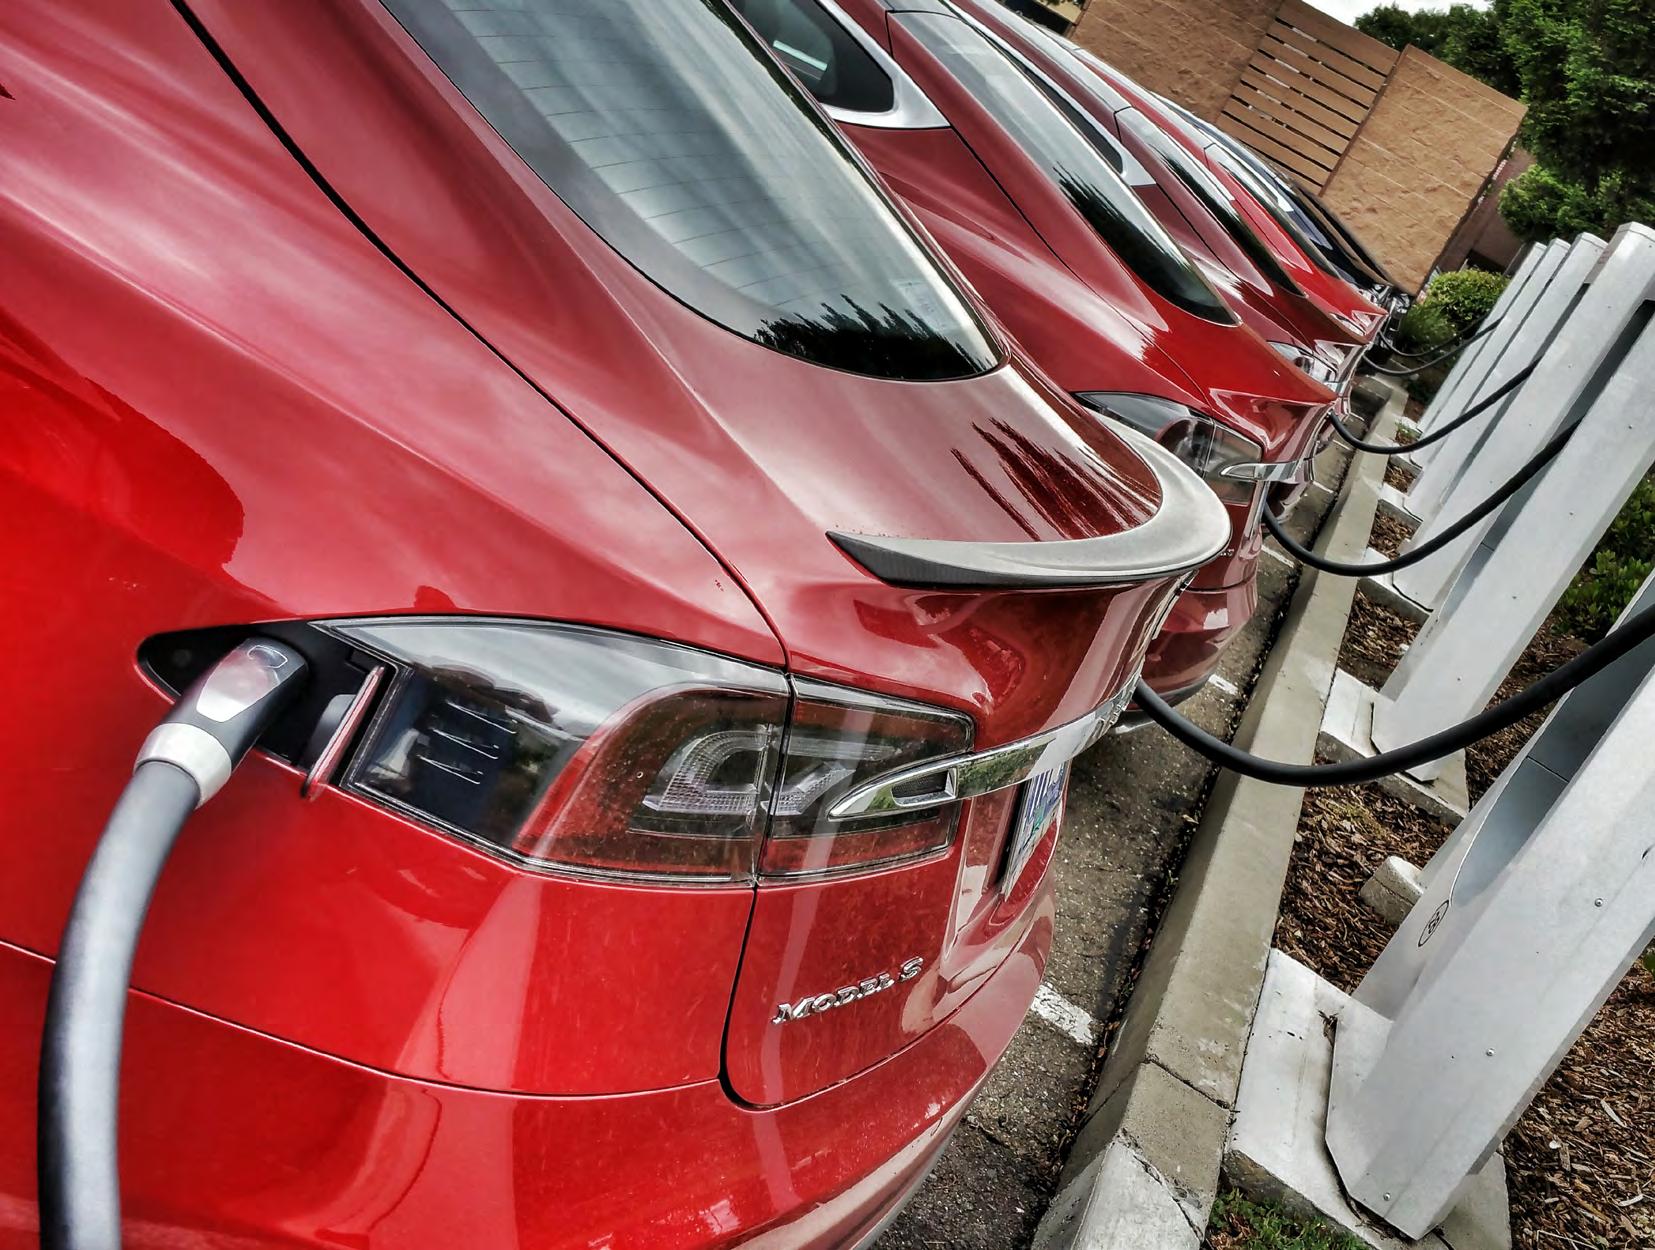
Reliance on personal vehicles will eventually be reduced through the changes in neighbourhood design and improvements to transit and active transportation that are prioritized in this plan. In the meantime, ZEVs do not produce tailpipe emissions as they have electric motors that are powered by batteries or hydrogen-based fuel cells. While electric vehicles (EVs) require electricity for battery recharging, BC’s electrical grid is mostly supplied by low-carbon hydroelectricity. The number of ZEVs in Kamloops is rising rapidly, and they are supported by provincial sales targets regulations that require that by 2040, all new passenger vehicles sold in BC be zero emissions. Other initiatives, such as BC Transit’s commitment to buying only electric buses starting in 2023, will help to drive innovation and demand for zero-emissions medium- and heavy-duty vehicles.
This Big Move outlines strategies to facilitate the transition to zero-emissions light-, medium-, and heavyduty vehicles. There is still a purchase cost premium for EVs compared to their gas-powered counterparts; therefore, incentives may be important until cost parity is reached, which is anticipated within the next few years. Increasing access to charging amenities and outreach on the benefits of EVs (e.g. reduced operating and maintenance costs) could encourage faster uptake. While technologies for electrification of medium- and heavy-duty vehicles currently lag behind passenger vehicles, there are opportunities to support their adoption (e.g. through encouraging the use of electric delivery vans and E-cargo bikes for urban freight delivery). These strategies will result in reduced carbon and noise pollution, which will improve our air quality and health.
By 2050, 85% of kilometres driven by Kamloops-registered passenger vehicles will be by zero-emissions vehicles.
3A - Zero-Emissions Light-Duty Vehicles
GOAL:
To support the transition to zero-emissions transportation choices.
ECONOMIC CONSIDERATIONS:
• City investments in community-based EV and E-Bikes initiatives are estimated at $240,000/year and help address barriers such as access to home charging.i
• To establish an EV charging network would cost $20,000/year ($600,000 amortized over 30 years; City-owned and/or private sector incentives).ii
• Currently, there is a cost premium to purchase an EV over a comparable gas-powered vehicle (approximately 9% for light-duty vehicles). Electric versions of light-duty vehicles are projected to reach cost parity by as early as 2026. Used EVs will also increase in availability.
• Being more efficient and having fewer moving parts, the cost to maintain EVs is up to 40% lower than for gas-powered vehicles.
• In 2050, the average household cost to operate and maintain a vehicle will be nearly $3,000 less than it is in 2020, as a result of increased EV ownership.iii
ACTIONS:
Implement the City’s EV and E-bike Strategy, prioritizing support for home, workplace and public EV charging infrastructure.
Encourage private sector investment in new EV charging infrastructure.
PROJECTED ANNUAL GHG REDUCTIONS BY 2050:
3A - Zero-Emissions Light-Duty Vehicles
3B - Zero-Emissions Mediumand Heavy-Duty Vehicles
3C - Low-Carbon Urban Freight Delivery
5,000 tCO2e (Moderate)
3B - Zero-Emissions Medium- and Heavy-Duty Vehicles
GOAL:
To support institutional, commercial and industrial fleets’ transition to zero-emissions vehicles and equipment.
ECONOMIC CONSIDERATIONS:
• Presently, electric medium- and heavy-duty vehicles have a much higher cost premium than light-duty electric vehicles, and electric options for some heavy-duty uses are not available. However, a wide range of electric options are projected to be cost competitive within 5–10 years, depending upon vehicle type, due to declining battery costs, lower fuel and maintenance costs, and improved functionality.iv
ACTIONS:
Implement EV and E-bike Strategy actions that encourage the electrification of commercial fleets.
Promote the use of renewable, low-carbon fuels (e.g. biofuel, hydrogen, and fuel cell technology) in municipal or commercial fleets, where electrification options are not available or feasible.
PROJECTED ANNUAL GHG REDUCTIONS BY 2050:
3A - Zero-Emissions Light-Duty Vehicles
3B - Zero-Emissions Mediumand Heavy-Duty Vehicles
3C - Low-Carbon Urban Freight Delivery
Transportation - Personal Transportation - Medium- and Heavy-Duty
20,000 tCO2e (Very High)
GOAL:
3C - Low-Carbon Urban Freight Delivery ACTIONS:
To encourage the shift to zero-emissions delivery vehicles within the urban core and neighbourhood town centres as the demand for home deliveries increases.
ECONOMIC CONSIDERATIONS:
• City incentives or support in establishing an urban freight logistics hub may make the adoption of low-carbon delivery modes more feasible for freight companies.
• Private companies that invest in electric delivery vehicles and/or cargo bikes will have lower operational and maintenance costs.
Identify low-carbon urban freight and last-mile delivery logistics opportunities as part of the proposed Truck Route Study to reduce traffic and encourage the adoption of smaller and cleaner delivery vehicles, including electric cargo vans and cargo bikes.
Develop zero-emissions delivery zones in select commercial areas of the city and incentivize the use of smaller, cleaner vehicles (e.g. e-cargo bikes, electric delivery vans) for last-mile delivery.
- Personal Transportation - Medium- and Heavy-Duty
3,500 tCO2e (Moderate)
TOTAL BIG MOVE 3
PROJECTED ANNUAL EMISSIONS REDUCTIONS
( t CO 2e ) BY 2050, BY SECTOR
28,500
For emissions modelling purposes, it was assumed that the majority of light-duty vehicles would be for personal transportation use. Substantial emissions reductions are to be achieved from residents transitioning to electric vehicles. Although much of this will be facilitated through provincial and federal policies, actions in this Big Move will speed up the scale of EV adoption. Medium- and heavy-duty vehicles emissions will also decrease, although the technological challenges of electrification and lack of alternatives for some heavy-duty vehicle types mean that it will likely be more difficult to transition the majority of these vehicles by 2050.
“CCAP Economic Analysis Summary,” City of Kamloops.
ii Ibid.
iii Ibid.
iv “Race to zero: How manufacturers are positioned for zero-emission commercial trucks and buses in North America,” The International Council on Clean Transportation, October 29, 2020, https://theicct.org/publications/canada-race-to-zero-oct2020.
BIG
MOVE 4: ZERO-CARBON HOMES & BUILDINGS
Buildings account for 29% of GHG emissions in Kamloops and are the second largest source after transportation. Homes have been growing in size, with residential energy consumption increasing concurrently in recent decades.
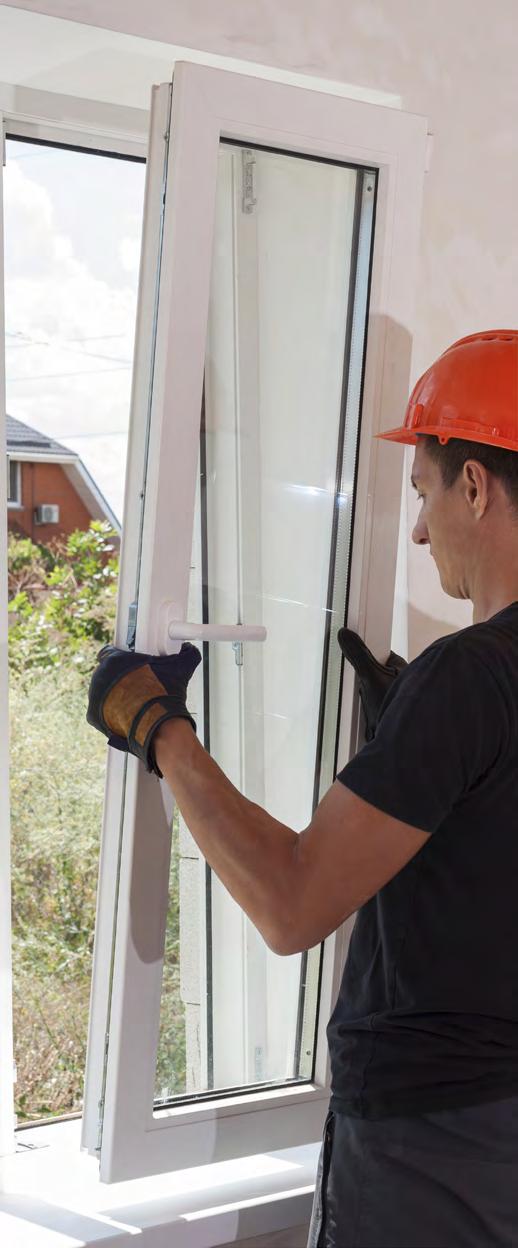
However, high-performance, energy-efficient buildings can be built cost-effectively while simultaneously improving indoor air quality, health, comfort, and resilience to the effects of climate change, such as extreme weather events. In BC, the Energy Step Code outlines a schedule of increasing steps of energy efficiency leading to all new buildings being “net-zero energy ready” by 2032 or sooner. In addition to high-efficiency new buildings, most existing buildings will need to be retrofitted, and electrification of heating systems, primarily through cold climate heat pump technologies, will be critical to reaching zero emissions.
In Kamloops, switching heating systems from natural gas (a fossil fuel mostly comprised of methane) to
electricity (primarily from hydropower in BC) or other renewable energy sources will be the largest contributor to reducing emissions in most buildings. This Big Move aims to leverage the Energy Step Code’s increasing efficiency standards to reduce energy consumption while spurring innovation in building design and increasing the use of low carbon energy systems and high-performance building materials. Existing homes and buildings will need to be retrofitted at a rapid pace, backed by incentives and supporting programs. This scale of construction and retrofit activity will boost the local economy by creating green jobs in construction, energy efficiency equipment and material sales, and energy advising services.
All new homes and buildings in the community will be net-zero energy ready by 2030 and zero carbon by 2040. Retrofitting 2% of existing dwelling units per year to achieve, on average, 50% GHG emissions reductions per unit.
GOAL:
4A - New Homes and Buildings - Community-Wide ACTIONS:
To support the transition to high-performance, energy-efficient, and zero-carbon homes and buildings.
ECONOMIC CONSIDERATIONS:
• Reducing the GHG emissions intensity of construction could result in cost premiums of between 2.85% and 3.24%.i
• The economic impact of measures to reduce the emissions intensity of new construction could be over $20 million per year and stimulate the local green building industry.ii
• Requiring larger than average homes to pursue greater energy efficiency or the use of low-carbon energy sooner than the rest of the market will help drive innovation and identify the most cost-effective practices ahead of wider-scale applications.
Develop a strategy to implement the higher steps of the BC Energy Step Code in advance of the provincial schedule allowing for alternative compliance pathways (e.g. lower steps for developments using a low-carbon energy system and/or meeting a specified GHG intensity). Include provisions for new single-family homes with larger than average floor areas (e.g. ≥ 325 m2) to exceed standard requirements.
Develop municipal incentive programs that “top up” existing government and utility-based rebate programs for high-performance buildings and low-carbon energy systems, etc.
Build local capacity in high-performance construction and low-carbon energy systems in partnership with the building industry and TRU.
PROJECTED ANNUAL GHG REDUCTIONS BY 2050:
13,500
GOAL:
4B - Existing Homes and Buildings - Community-Wide ACTIONS:
To support rapid and large-scale retrofits to existing homes and buildings that result in energy efficiency improvements and switching to low-carbon energy sources.
ECONOMIC CONSIDERATIONS:
• A key barrier to retrofitting homes and buildings is the long payback periods typical of more substantial energy efficiency improvements.
• Provincial retrofit rebates could be up to $14,800 per household,iii with additional federal grants of up to $5,000,iv based on 2021 programs. Municipal top-up incentives further benefit homeowners.
• Energy-efficiency retrofits can decrease energy bills and lead to healthier homes with better ventilation and thermal comfort levels. Based on 2019 Kamloops average household spending on energy, a 50% improvement in energy efficiency post-retrofit will result in average savings of $970 per year.v
• Retrofits add value to homes. According to the 2020 CHBA Homebuyer Preferences Study, home efficiency was the second most mentioned “must have” when buying a home in Canada.
• Large-scale retrofit activity will create local employment opportunities and generate substantial economic activity, estimated at $96 million per year.vi
Develop incentives, financing tools, and marketing campaigns to encourage and promote residential and ICI building retrofits.
Partner with education and capacity-building organizations (e.g. TRU and the Canadian Home Builders’ Association [CHBA] Central Interior) to provide industry training on low-carbon energy systems, such as heat pump technology and installation, and develop local case studies and demonstration projects.
PROJECTED ANNUAL GHG REDUCTIONS BY 2050:
4A - New Homes and Buildings
4B - Existing Homes and Buildings
81,800
- Residential Buildings - ICI
TOTAL BIG MOVE 4
PROJECTED ANNUAL EMISSIONS REDUCTIONS
( t CO 2e ) BY 2050, BY SECTOR
25% Buildings - ICI
95,300
75% Buildings - Residential
Emissions reductions from zero-carbon homes and buildings are the most substantial of all of the Big Moves. Emissions reductions in new buildings will require going above and beyond the BC Energy Step Code’s energy efficiency measures (these emissions are accounted for under existing policies), largely through the integration of low-carbon space and water-heating systems. Retrofitting existing buildings represents the largest single opportunity to meet the CCAP targets but also a substantial challenge, as this would require enabling legislation for all existing residential, institutional, commercial, and small to medium industrial buildings to be retrofitted with low-carbon energy systems and energy efficiency measures by 2050.
“CCAP Economic Analysis Summary,” City of Kamloops.
ii Ibid.
iii “Rebate Search Tool,” CleanBC Better Homes, accessed March 18, 2021, https://betterhomesbc.ca/rebate-search-tool/.
iv “Greener Homes,” Government of Canada, last modified March 16, 2021, https://www.nrcan.gc.ca/science-and-data/funding-partnerships/fundingopportunities/funding-grants-incentives/our-action-starts-home-home-energy-retrofit-initiative/23230.
v “CCAP Economic Analysis Summary,” City of Kamloops.
vi Ibid.
BIG MOVE 5: ZERO-WASTE/ CIRCULAR ECONOMY
Landfills take up valuable land and emit methane, a potent GHG, while the process of collecting and disposing of waste and recyclables also emits GHGs. The consumption of new products has environmental impacts from extraction, manufacturing, and transportation, and plastic waste, including microplastics, is harming ecosystems and human health.
To minimize these impacts, a circular economy aims to prevent waste by designing products to be durable and repairable and to repurpose end-of-life materials through enhanced upcycling and resource recovery processes.
Emissions related to waste make up 5% of baseline community emissions in Kamloops, mainly from methane produced when organic materials break down in the anaerobic landfill environment. This Big Move would see reduced waste entering the landfill, enhanced diversion, and, importantly, the
beneficial end use of organic materials such as compost or biofuels. Strategies also seek to spur research and innovation and create opportunities for local enterprises that contribute towards the growth of a circular economy. Repurposing materials and upcycling can keep more value in the local economy, while waste reduction and diversion measures reduce the need for landfill expansion.
To reduce waste sent to the landfill by 50% by 2028 and by 90% by 2050.
GOAL:
5A - Local Organics Collection and Processing ACTIONS:
To reduce and capture all kitchen and yard waste for beneficial end use.
ECONOMIC CONSIDERATIONS:
• The City is establishing organics collection processes, including applying for grant funding to reduce set-up costs. The diversion of organics will free up landfill space estimated to be worth $1 million per year.
• It is estimated that edible food waste costs the average Canadian household $1,100 per year.i Campaigns that educate on meal planning, food processing, and proper food storage save residents money.
• The Kamloops Food Bank has diverted 18 million pounds of perishable food from the landfill since 2007.ii While long-term solutions to poverty are needed, food recovery programs provide immediate food needs for people.
Implement a residential organics collection program, establishing a curbside service before expanding to include multi-family buildings.
Support the Thompson-Nicola Regional District’s implementation of an organics disposal ban (e.g. by requiring collection of commercial organics).
Deliver food waste reduction campaigns and support food recovery programs that redistribute food to people in need.
Evaluate landfill gas capture rates and potential uses post implementation of organics collection.
PROJECTED ANNUAL GHG REDUCTIONS BY 2050:
6,100
5B
5B - Waste Reduction and Diversion
GOAL:
To reduce waste and prioritize the diversion of methane-generating materials (i.e. cardboard and paper, yard, wood waste) from entering the landfill.
ECONOMIC CONSIDERATIONS:
• Potential City investments will be identified through the development of a Waste Reduction Strategy.
• Fee structures can be adjusted to incentivize diversion, with savings realized through extending the service life of the landfill.
• Residents and businesses can save money through waste reduction and reuse.
ACTIONS:
Develop a City Waste Reduction Strategy with measurable targets for each waste stream (e.g. construction and demolition, yard waste, plastics, paper/cardboard, and metals).
Support the Thompson-Nicola Regional District’s implementation of a landfill disposal ban on recyclable materials, (e.g. require all cardboard to be recycled).
PROJECTED ANNUAL GHG REDUCTIONS BY 2050:
20,500
tCO2e
5C - Circular Economy Research and Innovation
GOAL:
To reduce the use of non-renewable resources, promote materials reuse, and support regenerative business models.
ECONOMIC CONSIDERATIONS:
• Developing circular economy initiatives such as local repair, reuse, and upcycling business opportunities can help support the local economy and create green jobs for people with a variety of skills and abilities.
• Repurposing materials and upcycling keeps more value in the local economy.
• Turning a waste product into a resource can save companies money through reduced disposal fees and improved efficiency.
ACTIONS:
Support circular economy initiatives that keep products and materials in use, such as repair hubs, and upcycling and resource recovery social enterprises that generate added value out of salvaged materials.
Facilitate discussions with local industries and stakeholders to determine whether waste or by-products of one industry can be productively utilized by another industry.
PROJECTED ANNUAL GHG REDUCTIONS BY 2050:
*While not modelled for this strategy, advancing research and facilitating collaboration that result in waste reduction, diversion, and reuse solutions enables emissions reductions in the waste sector.
- Local Organics Collection and Processing
- Waste Reduction and Diversion
- Circular Economy Research and Innovation
TOTAL BIG MOVE 5
PROJECTED ANNUAL EMISSIONS REDUCTIONS
( t CO 2e ) BY 2050, BY
SECTOR
26,600
Strategies to collect and process organics, plus reduce and divert waste, will lower emissions by significantly reducing the amount of methane-producing materials in the landfill. Circular economy research and innovation may enable further waste reduction and beneficial end use opportunities that support emissions reductions, both locally and throughout supply chains.
“Food Waste in Canadian Homes in 2020,” Love Food Hate Waste Canada, accessed February 22, 2021, https://lovefoodhatewaste.ca/get-inspired/foodwaste-in-2020/.
ii “2020 By the Numbers”, Kamloops Food Bank, accessed March 17, 2021, https://www.kamloopsfoodbank.org/about-us/.
100% Solid Waste
BIG MOVE 6: RENEWABLE ENERGY
The use of energy derived from fossil fuels, such as natural gas and gasoline, is a major contributor to the climate crisis. In contrast, renewable energy sources such as wind, hydropower, geoexchange/geothermal, and solar have far fewer GHG emissions associated with their production.
In Kamloops, the grid supply from BC Hydro is 97% hydroelectricity; however, locally produced renewable energy can offer resilience to disruptions and help to offset the small amount of carbon in grid electricity to achieve net-zero emissions. Waste heat can also be captured from sewer lines, industrial processes, and energy-intensive buildings (e.g. laboratories and data centres) and used to heat nearby buildings, which offsets fossil fuel consumption.
This Big Move supports increasing the local use and generation of renewable energy along with research and development for low-carbon technologies. Developing decentralized energy sources to support a flexible and efficient grid is expected to become more important as electricity demands increase due to the installation of heat pumps in buildings and the switch to EVs. Increasing local renewable energy generation and storage can also buffer peak demands and make the grid more resilient. Working to develop local industry capacity in the clean energy sector creates green jobs that support the transition to a low-carbon economy.
To increase the generation and use of local, low-carbon, renewable energy sources.
6A - Residential and Neighbourhood Scale Energy
GOAL:
To support the development of low-carbon, renewable energy systems at building and neighbourhood scales.
ECONOMIC CONSIDERATIONS:
• The cost of local energy is a key driver of the cost competitiveness of solar generation. Electricity rates in BC are currently among the lowest in North America,ii which makes the economics of solar generation challenging. However, as solar installation costs continue to decline and utility rates continue to increase, the financial viability of solar power will improve.
• The economics of solar generation is also influenced by project location, size, energy rate structures (e.g. “time of day” pricing), and the availability of rebate programs. A relatively cost-effective option in Kamloops is solar pool heating, which can displace natural gas pool heater usage and reduce energy bills.
• Incentives, bulk purchasing, and financing programs will reduce economic barriers to purchasing renewable energy technologies.
ACTIONS:
Promote opportunities for on-site renewable energy generation at building scale (e.g. solar PV/thermal systems and geoexchange).
Explore incentives, bulk purchase programs and financing models (e.g. PACE) to support the adoption of renewable energy technologies.
Support not-for-profit or cooperative renewable energy initiatives (e.g. a community solar garden).
Explore opportunities for incorporating low-carbon energy distribution at neighbourhood scale (e.g. district energy system).
PROJECTED ANNUAL GHG REDUCTIONS BY 2050:
10,000
6B - Renewable Energy Innovation
GOAL:
To position Kamloops as a clean energy research, technology, and manufacturing hub to support BC’s low-carbon transition.
ECONOMIC CONSIDERATIONS:
• Increasing resilience reduces the costs related to energy network disruptions.
• Supporting local industry capacity in the clean energy sector will create new green jobs and economic activity, positioning Kamloops to leverage these emerging trends:
- In 2018, clean energy technology accounted for 1.7% of Canada’s GDP, and employed 120,650 people.iii
- From 2015–2019, Canadian companies invested $9.2 billion in renewable energy technologies, including wind, solar, and biofuel.
- The Government of BC is committed to making residential natural gas consumption cleaner by putting a minimum requirement of 15% to come from renewable gas by 2030iv, which will require significant investment in biofuel production.
ACTIONS:
Investigate waste-to-energy opportunities from organic waste or other available feedstock.
Support research, start-ups, and technology innovation (e.g. flexible smart grid technology and electric vehicle [EV] battery reuse/recycling).
PROJECTED ANNUAL GHG REDUCTIONS BY 2050:
(Moderate) 6A - Residential and Neighbourhood Scale Energy
3,500
7% TransportationMedium- and Heavy-Duty
TOTAL BIG MOVE 6
PROJECTED ANNUAL EMISSIONS REDUCTIONS
( t CO 2e ) BY 2050, BY SECTOR
13,500
56% Buildings - ICI
The emissions reductions from residential- and neighbourhood-scale energy are expected to be achieved through residential buildings and some institutional, commercial, and industrial (ICI) buildings adopting renewable energy technologies. Renewable energy innovation could generate renewable energy fuels for medium- and heavy-duty transportation, which is important for addressing these emissions in the short term as there are anticipated delays in electrification technologies for heavy-duty vehicles. Smart grid technology could also address emissions from ICI buildings by reducing electrical loads and potential for gas peaking.
“The Economics of Solar Power in Canada,” Canada Energy Regulator, last modified September 29,2020, https://www.cer-rec.gc.ca/en/data-analysis/ energy-commodities/electricity/report/solar-power-economics/index.html.
ii “Comparison of Electricity Prices in Major North American Cities,” Hydro Quebec, Q3 2020, http://www.hydroquebec.com/data/documents-donnees/ pdf/comparison-electricity-prices.pdf.
iii “Energy and the economy,” Government of Canada, last modified October 6, 2020, https://www.nrcan.gc.ca/science-data/data-analysis/energy-dataanalysis/energy-facts/energy-and-economy/20062.
iv “Clean BC,” Province of British Colombia, last modified March 2019, https://blog.gov.bc.ca/app/uploads/sites/436/2019/02/CleanBC_Full_Report_ Updated_Mar2019.pdf.
37% Buildings - Residential
MUNICIPAL CLIMATE LEADERSHIP
BIG MOVE 7: MUNICIPAL CLIMATE LEADERSHIP
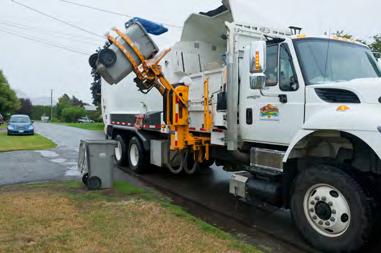
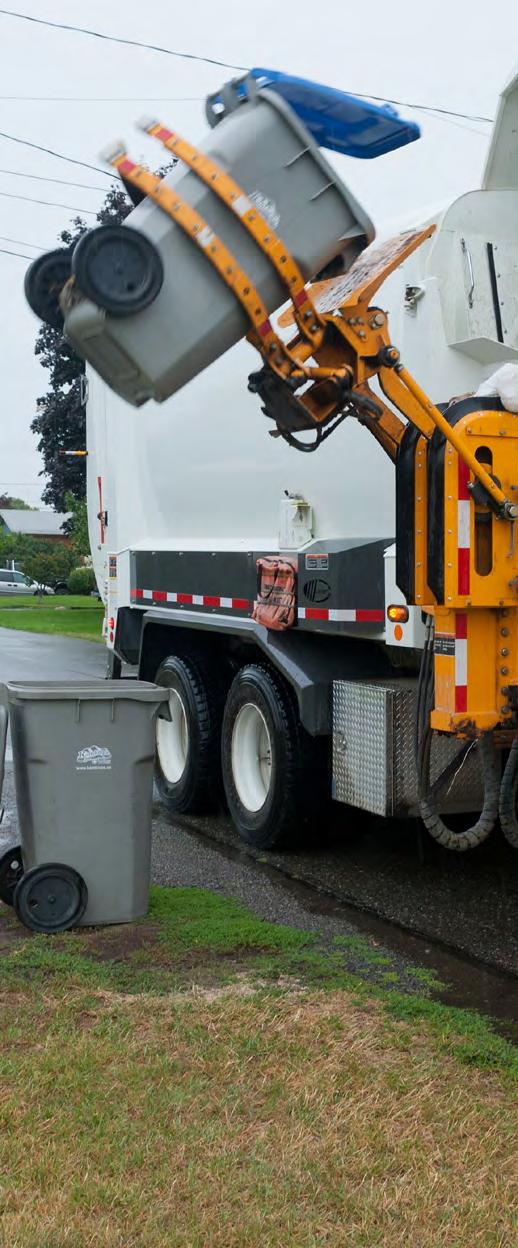
Municipal operations generate GHG emissions, primarily from the use of fossil fuels (i.e. natural gas, gasoline, and diesel) to heat civic buildings and to power fleet vehicles that deliver services, such as garbage and recycling collection, to our community.
Reducing these emissions is critical for showing leadership, demonstrating the use of low-carbon technologies in a local context, and motivating stakeholders and the public to take action at the community scale.
Municipal climate leadership strategies commit the City to a goal of becoming zero-carbon by switching to cleaner, low-carbon energy sources and improving the energy efficiency of buildings, infrastructure, and fleet vehicles. To support this, it will be necessary to integrate climate action into strategic decision making and budgeting processes and to build staff capacity to meet emissions reduction targets. The City can act as
a catalyst for local action by making investments that will stimulate the green building and energy economy in Kamloops while also realizing savings (e.g. reduced operating costs of electric fleet vehicles).
Using creative and engaging communications, the City will help the community understand how it can support emissions reductions targets and inspire local actions big and small to reduce our collective carbon footprint. It will also be important to foster collaborations with Tk’emlúps te Secwépemc that enhance understanding of traditional ecological knowledge and Indigenous perspectives on environmental conservation and climate change.
The City of Kamloops will reduce carbon emissions from municipal operations by 40% by 2030 and 100% by 2050.
GOAL:
7A - Zero-Carbon Civic Operations ACTIONS:
To decarbonize municipal operations by improving the efficiency of civic facilities, fleet, and infrastructure and transitioning to low-carbon energy sources.
ECONOMIC CONSIDERATIONS:
• The cost of retrofitting civic facilities is estimated at $1 million per year (on average) and electrifying City fleet vehicles and electric vehicle charging infrastructure at $1.1 million/year over 15 years.i
• Annual net fuel cost savings of $1.4 million are estimated once the entire fleet has been converted to electric, with a 40% decrease in maintenance costs.ii
Develop and implement corporate energy and emissions policies and strategies to increase energy efficiency and phase out fossil fuel use in new and existing civic buildings and infrastructure.
Develop and implement a Green Fleet Strategy that reduces overall vehicle use, prioritizes the use of zero-emissions fleet vehicles and/or renewable transportation fuels, and includes provisions for reducing emissions from tools and equipment.
Develop programs and end-of-trip amenities to encourage employees to use transit, low-carbon, and active transportation modes for commuting and work-related travel.
PROJECTED ANNUAL GHG REDUCTIONS BY 2050:
8,000 tCO2e (Moderate)
7B -
Climate Governance
GOAL:
To incorporate climate action decisionmaking tools and policies to ensure all City department work plans and capital and operating budgets are aligned with the corporate emissions reductions targets.
ECONOMIC CONSIDERATIONS:
• Adding carbon reduction considerations into budgeting and purchasing processes reflects wider societal costs.
• Reducing municipal carbon emissions mitigates future costs incurred from increasing provincial and federal carbon taxes.
ACTIONS:
Embed climate action considerations into the supplemental budget request process and, where possible, identify related metrics (i.e. key performance indicators).
Establish a carbon budget framework, internal carbon price, and/or other tools that apply a climate lens to budget planning and decision making and support accountability for meeting corporate emissions reduction targets.
Review and update the Sustainable Procurement Policy.
PROJECTED ANNUAL GHG REDUCTIONS BY 2050:
*This strategy was not modelled for emissions reductions but it is necessary to enable emissions reductions in other areas. For example, establishing processes that integrate climate action criteria into decision-making will help drive emissions reductions in municipal operations.
7C - Communicating Climate Action
GOAL:
To engage residents on the actions they can take to address climate change and reduce emissions at home, at school and in the workplace.
ECONOMIC CONSIDERATIONS:
• City communications may be the primary way that residents and businesses learn about actions they can take and available programs and economic incentives to support them.
• Education on climate action can be integrated into existing outreach programs delivered by the City.
• Educational initiatives from the City aim to reduce economic barriers to participation (e.g. hosting free, family-friendly events in locations accessible by transit and presenting directly to community organizations and businesses upon request whenever feasible).
ACTIONS:
Develop and deliver campaigns that educate about climate change and how residents and businesses can reduce GHG emissions, including partnerships with the arts community (e.g. theatre, film, and art exhibits on climate action).
Partner with education providers to deliver campaigns on climate action that foster a culture of sustainability amongst youth (e.g. supporting curriculum development with School District No. 73).
PROJECTED ANNUAL GHG REDUCTIONS BY 2050:
*This strategy has not been modelled, but engaging the community on all aspects of climate action will help motivate businesses and residents to take actions that lead to emissions reductions.
TOTAL BIG MOVE 7
PROJECTED ANNUAL EMISSIONS REDUCTIONS
( t CO 2e ) BY 2050, BY SECTOR
8,000
While the emissions from municipal operations are a small percentage of overall community-wide emissions, the City has an important role to play in demonstrating leadership for local climate action. The projected emissions reductions result from switching to low-carbon energy sources and improved efficiency of City-owned buildings and fleet vehicles.
Buildings - ICI
HEALTHY URBAN ECOSYSTEM
BIG MOVE 8: HEALTHY URBAN ECOSYSTEM
An ecosystem is a community of living organisms, such as plants, animals, and microbes, that interact with one another and with non-living components of their environment, such as air, water and minerals. Healthy ecosystems can help address climate change by sequestering carbon (e.g. in the leaves of trees and the roots and soil of native grasslands).
The use of green infrastructure can buffer climate impacts. Healthy soils and rain gardens absorb rainfall and help prevent flooding and erosion, while trees and other vegetation provide urban cooling through evaporation and shade. Native plants have important cultural and spiritual significance for local Secwépemc peoples and increasing their use helps to restore local ecosystems.
Kamloops is surrounded by a diverse mix of grasslands and dry forest interspersed with wetlands, seasonal streams, the North and South Thompson Rivers, and Kamloops Lake, which provides habitats for a large
variety of insects, birds, and wildlife. Urban ecosystems include natural areas found in our extensive system of parks, waterways, and riparian corridors as well as landscaped features such as street trees and gardens. This Big Move focuses on strategies to enhance urban ecosystems through diverse means that range from tree planting to regenerative agriculture and the use of green infrastructure, which can also improve carbon sequestration and increase resilience to climate change impacts. Residents will also benefit from increased interactions with nature and the life-supporting services, such as air and water purification, that it provides.
To enhance and restore urban ecosystem health to improve carbon storage capacity and resilience to climate change.
8A - Urban Ecosystems for Climate Resilience
GOAL:
To enhance our urban ecosystem’s carbon storage capacity while supporting biodiversity and resilience to climate change.
ECONOMIC CONSIDERATIONS:
• Estimated incremental cost to increase the urban forest canopy target from 20% to 30% is $75,000/year.
• Every dollar invested in trees returns $2–$5 in benefits.ii
• The City maintains nearly 16,000 trees in parks and on boulevards, with an estimated value of $6.7 million.iii
• Trees increase property values and are good for business, creating more attractive and comfortable residential and commercial areas.
• Enhancing resilience to climate change can reduce the potential financial and health impacts of extreme weather events.
ACTIONS:
Set a new target of 30% by 2050 while continuing current progress towards increasing the city’s tree canopy cover to 20% by 2036.
Integrate broader local ecosystems (e.g. grasslands) and climate change adaptation considerations into an update of the Urban Forest Management Strategy, which currently focuses on trees.
Provide public education to encourage landscaping and gardening using native species, plants that attract pollinators, integrated pest management, and Firesmart landscaping practices in wildland/urban interface areas.
PROJECTED ANNUAL GHG REDUCTIONS BY 2050:
*While not modelled, urban ecosystems make important contributions to energy and emissions reductions, including providing passive solar cooling through shading and acting as carbon sinks. Kamloops’ urban forest sequesters an estimated 43,460 tonnes of CO2e annually and stores over one million tonnes of CO2e.
8B - Protect and Heal Nature
GOAL:
To protect, enhance, and restore ecosystem health.
ECONOMIC CONSIDERATIONS:
• Ecosystem protection and restoration can cost-effectively enhance the provision of ecosystem services such as erosion control, soil water retention, and water purification.
• Kamloops has an ideal climate to support regenerative agriculture, which can result in healthier soil that is more resilient to drought and floods and leads to higher yields.
ACTIONS:
Undertake ecosystem restoration projects on City-owned land (e.g. wetland restoration and creation of wildlife habitat using native plants).
Encourage investments in local biodiversity conservation projects that also support carbon sequestration (i.e. grasslands conservation, native tree plantings).
Support regenerative agricultural practices that increase soil carbon storage (e.g. through education and partnering on pilot projects on City-owned land).
PROJECTED ANNUAL GHG REDUCTIONS BY 2050:
*This strategy was not modelled for emissions reductions but healthy grasslands and forests effectively capture and store carbon dioxide through photosynthesis. Regenerative agricultural practices that promote soil health and regeneration also increase its carbon sequestration and storage capacity.v
8C - Green Infrastructure
GOAL:
To utilize green infrastructure techniques to enhance green space; stormwater management; and air, soil, and water quality.
ECONOMIC CONSIDERATIONS:
• The cost to enhance green space, stormwater management, and urban tree mediums with ongoing infrastructure upgrades and maintenance is estimated at $100,000/year (in addition to current budget).vi
• Green infrastructure-based storm water management systems can reduce capital costs for developers, including lower costs for site grading, paving, and smaller or eliminated piping and retention facilities.vii
• Green infrastructure can decrease the costs of damage to property and infrastructure from climate change impacts (i.e. when its use decreases potential flood damage from extreme precipitation events).
ACTIONS:
Undertake new green infrastructure pilot projects to trial emerging techniques (e.g. more cost-effective ways of ensuring adequate soil volumes for optimal plant growth) and integrate successful measures into infrastructure and development projects on public lands.
Update street standards to incorporate requirements for street trees, native vegetation, sufficient soil volumes, and other green infrastructure to promote long-term plant health, urban cooling, and rain water retention.
Update the City’s Landscape Guidelines to ensure that landscaping developed on City rights-of-way (e.g. boulevards) use green infrastructure technologies, support the City’s tree canopy goals and use sufficient soil volumes and native vegetation where appropriate.
PROJECTED ANNUAL GHG REDUCTIONS BY 2050:
*This strategy was not modelled as it is expected to have modest GHG reductions. However, trees, green roofs, and vegetation can help reduce urban heat island effects by shading building surfaces, deflecting radiation from the sun, and releasing moisture into the atmosphere, which reduces energy consumption and associated emissions.
TOTAL BIG MOVE 8
PROJECTED ANNUAL EMISSIONS REDUCTIONS
( t CO 2e ) BY 2050, BY SECTOR
SUPPORTING
The emissions reductions resulting from this Big Move have not been modelled as the focus of these strategies is on improving carbon sequestration and the capacity to adapt to climate change impacts such as heat waves and flooding.
“CCAP Economic Analysis Summary,” City of Kamloops.
ii “Urban Forests,” BC Climate Action Toolkit, accessed March 15, 2021, https://www.toolkit.bc.ca/Plan-Do/Urban-Forests.
iii “Urban Forest Management Strategy,” City of Kamloops, October 2016, https://www.kamloops.ca/sites/default/files/docs/our-community/ urbanforestmanagementplan.pdf.
iv Ibid.
v Christopher J. Rhodes, “The Imperative for Regenerative Agriculture,” Science Progress 100, no.1 (2017): 80–129.
vi “CCAP Economic Analysis Summary,” City of Kamloops.
vii “Green Infrastructure Cost-Benefit Resources,” United States Environmental Protection Agency, last modified November 12, 2020, https://www.epa.gov/ green-infrastructure/.
Big Moves Emissions
ADVOCACY
The City has limited jurisdiction over some key measures to reduce emissions. Therefore, the City will need to continue to advocate to the Province and other levels of government, utility companies, and key stakeholders, where appropriate, to boost emissions reductions in the following areas:
TRANSPORTATION:
Strengthen zero-emission vehicle mandates for light-, medium-, and heavy-duty vehicles and to maintain targeted electric vehicle incentive programs. [MOTI, MOECCS, TC, NRCAN]
Support BC Transit’s Low-Carbon Fleet Program and the Ministry of Education’s transition to electric school buses. [BCT, MOECCS, SD73]
Create regulations regarding the use of micro-mobility devices (e.g. E-scooters and electric hoverboards). [MOTI, TC]
BUILDINGS:
Strengthen low-carbon building regulations for new buildings (e.g. introducing greenhouse gas intensity limits, embodied carbon emissions limits, and mandatory energy labelling/benchmarking). [MOECCS, AGMH, NRCAN]
Enhance access to building energy use data to inform community retrofit program design, incentives, and marketing. [BCH, FBC, NRCAN]
Strengthen retrofit policies, programs, and incentives, including longer-term commitments to sustain consumer awareness and demand.
[AGMH, NRCAN]
Promote and incentivize local renewable energy generation. [MOECCS, NRCAN, BCH, FBC, BCSEA]
WASTE:
Implement measures to reduce single-use items and plastics use, including federal and provincial legislation banning certain items. [MOECCS, ECCC]
Advance circular economy research and innovation. [MOECCS, ECCC, TRU]
See page 72 for a key to acronyms.
EQUITY & CLIMATE JUSTICE
Climate change will affect people differently, with those who are already disadvantaged by poverty and inequality often contributing less to emissions but bearing the brunt of its impacts. For example, the increasing number of days with extreme heat will leave those without air conditioning more susceptible to heat stroke, while seniors on a set income may find themselves having to prioritize increased cooling costs against other basic necessities.
In seeking to remedy the disproportionate burden of climate change on the most vulnerable, climate justice refers to implementing actions to reduce greenhouse gas emissions and enhance adaptation to climate change in a way that is fair and just. Likewise, measures to enhance equity recognize that an individual may need different supports in order to maintain fairness and accessibility within a community. The Community Climate Action Plan (CCAP) presents both opportunities and challenges for advancing equity and climate justice, which will be crucial to consider upon implementation.
While the root causes of inequality and poverty must be tackled by all levels of governments, actions to mitigate emissions locally can contribute to addressing social issues in our community, including by:
• Creating a compact, complete and connected community with access to daily lifestyle needs by providing active transportation infrastructure for all ages and abilities and by improving transit service.
• Supporting community renewable energy projects such as solar panels on social housing units that reduce energy bills and generate local employment.
• Developing social enterprises that create jobs for people with a variety of skills and abilities (e.g. the ASK Wellness mattress recycling program, which diverts 85% of mattress materials from landfill while reducing barriers to employment).
• Undertaking “thin streets” initiatives that free up municipal land for community purposes, such as the development of daycares or affordable housing.i
Key challenges where attention will be needed to enhance equitable outcomes include:
• Ensuring affordable housing options are available as redevelopment and infill projects coupled with population growth may contribute to increasing rent and property prices. Actions to increase rental housing availability and some affordability provisions have been included in the CCAP, but further work will be necessary to determine and mitigate potential impacts on housing affordability.
• The transition to EVs, which have a cost premium. Even when cost parity is reached, buying a new or used vehicle may not be attainable for many; therefore, additional support for income-qualifying households should be advocated for. The primary goal should remain to reduce car dependency and increase access to amenities and employment through transit and active transportation networks that are accessible to all.
• Retrofits may be cost prohibitive for low-income homeowners, while tenants can have little control over energy efficiency improvements that would benefit their health and reduce energy bills. Current programs that provide resources and incentives to low-income households to improve energy efficiency (e.g. Energy Conservation Assistance Program) will need to be promoted and expanded upon.
The City of Kamloops Social Plan and the Housing Affordability Strategy will provide guidance for addressing social considerations through the implementation of CCAP actions. In addition, the City of Kamloops Accessibility and Inclusion Plan outlines how to make the built environment more accessible, improve accessible transportation options, and enhance accessible employment opportunities. Furthermore, the City will work with community partners to ensure information about climate action and incentive programs is available to people of all ages, abilities, and income levels.
“Thin Streets: Turning Asphalt into Affordable Housing,” The Citizen’s Handbook, accessed March 10, 2021, https://citizenshandbook.org/thinstreets.pdf.
IMPLEMENTING CLIMATE ACTION
Effective implementation is key to achieving the Community Climate Action Plan’s (CCAP’s) emissions reduction targets. It will require contributions from across all municipal departments and strategic integration of CCAP actions into plans, bylaws, corporate, and departmental policies. A climate lens will need to be applied to capital planning and annual budget approval processes.
While the City is primarily responsible for implementing the CCAP, partnerships and advocacy with regional, provincial, and federal governments and collaboration with utilities; BC Transit; Tk’emlúps te Secwépemc; TRU; and local private, public, and social sector organizations will be necessary for many of the proposed actions. Successful implementation also depends on active participation by local citizens, community groups, and businesses. By working together and doing our part to support climate action, we can help ensure a sustainable and resilient community for future generations.
The following Big Moves Implementation Chart assigns a priority level for each strategy based on greenhouse gas (GHG) reductions, ease of implementation, municipal authority, and City and stakeholder costs (see Appendix B for the full analysis). For each action, the City department leading implementation has been identified as well as supporting departments or external agencies. Each action has also been assigned a short-, medium- or long-term initiation timeline, which refers only to when the action is to be commenced. While some actions may be completed within a finite time period, others will require ongoing implementation to ensure their contributions to emissions reductions continue to be realized over the lifetime of the plan.
KEY - LEAD AND SUPPORT DEPARTMENT OR AGENCY
AGMH Attorney General and Ministry responsible for Housing
ALC Agricultural Land Commission
ASK ASK Wellness
BCH BC Hydro
BCSEA BC Sustainable Energy Association
BCT BC Transit
CAO Administration, including External Relations and Communications and Community Engagement
CHBACI Canadian Home Builders’ Association Central Interior
CO Civic Operations Department
CPS Community and Protective Services Department
CS Corporate Services Department
DES Development, Engineering, and Sustainability Department
ECCC Environment and Climate Change Canada
FBC FortisBC
KCBIA Kamloops Central Business Improvement Association
KCC Kamloops Chamber of Commerce
KFB Kamloops Food Bank
KFPC Kamloops Food Policy Council
KFR Kamloops Fire Rescue
MOECCS Ministry of Environment and Climate Change Strategy
MOTI Ministry of Transportation and Infrastructure
NA Neighbourhood Associations
NRCAN Natural Resources Canada
NSBIA North Shore Business Improvement Association
SD73 School District No. 73
SICA Southern Interior Construction Association
TC Transport Canada
TRU Thompson Rivers University
TNRD Thompson-Nicola Regional District
TteS Tk’emlúps te Secwépemc
VK Venture Kamloops
BIG MOVE 1:
LOW-CARBON DEVELOPMENT
1A
Identify priority areas to support infill projects that further increase housing density, mixed uses, and access to transit and active transportation infrastructure in existing neighbourhood centres.
Increase incentives to promote infill development (e.g. revitalization tax exemptions and reduced development cost charges [DCCs]).
Increase availability of affordable market housing options that also contribute to higher density (e.g. density bonus for rental-only multi-family buildings).
Promote the development of legal residential suites when new homes are being constructed in areas where suites are permitted.
Promote ground-oriented housing such as townhouses, row houses, multi-plexes and small lot residential infill.
Review secondary suite policy and consider guidelines for permitting a secondary suite and an accessory dwelling unit (e.g. carriage suite or garden suite) on a single-family lot in designated areas.
Require developers to meet a higher BC Energy Step Code step than regulated and/or meet a specified GHG intensity.
Require developers to install one charging station (capable of Level 2 charging) for every two stalls of off-street parking in single-family developments, in addition to any city-wide EV-ready policy.
Increase DCCs for developments in peripheral areas (suburban and rural) to address the costs of required service upgrades or extensions.
Explore regulatory options to limit new natural gas servicing in favour of all-electric power and/or on-site renewable energy.
BIG MOVE 2:
CAR-LIGHT COMMUNITY
2A
2B
Build out a connected active transportation network by 2030, starting with completing connections along north–south and east–west corridors, followed by filling in any gaps to ensure key feeder connections to core routes.
Increase the availability of publicly accessible, secure, end-of-trip bike storage amenities in major neighbourhood centres and other key destinations.
Develop and implement an incentive program for E-bike/cargo bike purchases as per the Electric Vehicle (EV) and E-Bike Strategy.
Improve infrastructure and amenities (e.g. seating, shelters, and real-time bus arrival information) to encourage transit use.
Identify light rail transit (LRT) rights-of-way to be reserved for future iterations of the transit network (i.e. the sequential development of future HOV lanes to be replaced by bus only lanes and eventual LRT development).
Develop a Frequent Transit Strategy with BC Transit that explores options such as electric bus rapid transit (eBRT) to connect higher-density areas and key destinations.
BIG MOVE 2:
CAR-LIGHT COMMUNITY CONTINUED
2C - Shared Streets
1,000 Low
Pursue opportunities to convert select street space (temporarily at first) into areas that prioritize pedestrian-only or pedestrian-friendly areas with public amenities such as trees and gardens, seating, art installations, and bike parking and with vehicle access limited to local residents, businesses, and emergency vehicles. DES CO, KCC, KCBIA, NSBIA
Identify suitable streets to implement reduced road width initiatives that contribute to traffic calming and convert space for community benefit (e.g. active transportation infrastructure, parks, community gardens, daycares, or affordable housing).
Implement low-traffic neighbourhood projects that extend pedestrian zones to multiple urban blocks (with emergency vehicle access only).
Strategically promote targeted neighbourhood transportation demand management (TDM) programs to residents (e.g. promote uptake of new active transportation infrastructure or increased transit service levels to reduce localized congestion areas and avoid road widening).
DES CO, KFR, NA
DES KFR, NA
DES CPS, NA
2D - Transportation Demand Management
2,500 Medium
2E - Kamloops Car Share 1,000 Medium
Develop and promote TDM measures for employers city-wide, including facilitating the use of sustainable transportation options and reducing the need for travel (i.e. through virtual meetings, flexible work hours, and work-from-home options).
Review Parking Management Plan (to be completed in 2021) measures to encourage the use of sustainable transportation options as active transportation infrastructure and transit service levels improve.
Explore business models for car-share options and prioritize opportunities to integrate plug-in hybrid and EVs into car sharing fleets.
Encourage the use of established car sharing services in new developments in higher-density urban areas to reduce parking space requirements.
DES KCC, KCBIA, NSBIA
CPS DES, KCBIA, NSBIA
DES CO, KCBIA, NSBIA, VK
DES NA
BIG MOVE 3:
ZERO-EMISSIONS TRANSPORTATION 3
3A -
3C -
Implement the City’s EV and E-bike Strategy, prioritizing support for home, workplace and public EV charging infrastructure.
private sector investment in new EV charging infrastructure.
Implement EV and E-bike Strategy actions that encourage the electrification of commercial fleets.
Promote the use of renewable, low-carbon fuels (e.g. biofuel, hydrogen, and fuel cell technology) in municipal or commercial fleets, where electrification options are not available or feasible.
Identify low-carbon urban freight and last-mile delivery logistics opportunities as part of the proposed Truck Route Study to reduce traffic and encourage the adoption of smaller and cleaner delivery vehicles, including electric cargo vans and cargo bikes.
Develop zero-emissions delivery zones in select commercial areas of the city and incentivize the use of smaller, cleaner vehicles (e.g. e-cargo bikes, electric delivery vans) for last-mile delivery.
ZERO-CARBON HOMES & BUILDINGS
4A
4B - Existing
Develop a strategy to implement the higher steps of the BC Energy Step Code in advance of the provincial schedule allowing for alternative compliance pathways (e.g. lower steps for developments using a low-carbon energy system and/or meeting a specified GHG intensity). Include provisions for new single-family homes with larger than average floor areas (e.g. ≥ 325 m2) to exceed standard requirements.
Develop municipal incentive programs that “top up” existing government and utility-based rebate programs for high-performance buildings and low-carbon energy systems, etc.
Build local capacity in high-performance construction and low-carbon energy systems in partnership with the building industry and TRU.
Develop incentives, financing tools, and marketing campaigns to encourage and promote residential and ICI building retrofits.
Partner with education and capacity-building organizations (e.g. TRU and the Canadian Home Builders’ Association [CHBA] Central Interior) to provide industry training on low-carbon energy systems, such as heat pump technology and installation, and develop local case studies and demonstration projects.
TRU, CHBACI, SICA
DES TRU, CHBACI, SICA
ZERO-WASTE/CIRCULAR ECONOMY
5A -
5B -
5C -
Implement a residential organics collection program, establishing a curbside service before expanding to include multi-family buildings.
Support the Thompson-Nicola Regional District’s implementation of an organics disposal ban (e.g. by requiring collection of commercial organics).
Deliver food waste reduction campaigns and support food recovery programs that redistribute food to people in need.
Evaluate landfill gas capture rates and potential uses post implementation of organics collection.
Develop a City Waste Reduction Strategy with measurable targets for each waste stream (e.g. construction and demolition, yard waste, plastics, paper/cardboard, and metals).
Support the Thompson-Nicola Regional District’s implementation of a landfill disposal ban on recyclable materials (e.g. require all cardboard to be recycled).
MOECCS
DES
TNRD
Support circular economy initiatives that keep products and materials in use, such as repair hubs, and upcycling and resource recovery social enterprises that generate added value out of salvaged materials. CO DES, VK, ASK
Facilitate discussions with local industries and stakeholders to determine whether waste or by-products of one industry can be productively utilized by another industry.
TNRD, KCC
BIG MOVE 6:
RENEWABLE ENERGY
6A -
6B -
Promote opportunities for on-site renewable energy generation at building scale (e.g. solar PV/ thermal systems and geoexchange).
Explore incentives, bulk purchase programs and financing models (e.g. PACE) to support the adoption of renewable energy technologies.
Support not-for-profit or cooperative renewable energy initiatives (e.g. a community solar garden). DES CPS, BCSEA
Explore opportunities for incorporating low-carbon energy distribution at neighbourhood scale (e.g. district energy system).
Investigate waste-to-energy opportunities from organic waste or other available feedstock. DES CO
Support research, start-ups, and technology innovation (e.g. flexible smart grid technology and electric vehicle [EV] battery reuse/recycling).
MUNICIPAL CLIMATE LEADERSHIP
7B -
7C - Communicating Climate Action
Develop and implement corporate energy and emissions policies and strategies to increase energy efficiency and phase out fossil fuel use in new and existing civic buildings and infrastructure.
Develop and implement a Green Fleet Strategy that reduces overall vehicle use, prioritizes the use of zero-emissions fleet vehicles and/or renewable transportation fuels, and includes provisions for reducing emissions from tools and equipment.
Develop programs and end-of-trip amenities to encourage employees to use transit, low-carbon, and active transportation modes for commuting and work-related travel.
Embed climate action considerations into the supplemental budget request process and, where possible, identify related metrics (i.e. key performance indicators).
Establish a carbon budget framework, internal carbon price, and/or other tools that apply a climate lens to budget planning and decision making and support accountability for meeting corporate emissions reduction targets.
Review and update the Sustainable Procurement Policy.
Develop and deliver campaigns that educate about climate change and how residents and businesses can reduce GHG emissions, including partnerships with the arts community (e.g. theatre, film, and art exhibits on climate action).
Partner with education providers to deliver campaigns on climate action that foster a culture of sustainability amongst youth (e.g. supporting curriculum development with School District No. 73).
HEALTHY URBAN ECOSYSTEM
8A - Urban Ecosystems for Climate Resilience
8B - Protect and Heal Nature
Supporting High
8C - Green Infrastructure
Supporting Medium
Set a new target of 30% by 2050 while continuing current progress towards increasing the city’s tree canopy cover to 20% by 2036.
Integrate broader local ecosystems (e.g. grasslands) and climate change adaptation considerations into an update of the Urban Forest Management Strategy, which currently focuses on trees.
Provide public education to encourage landscaping and gardening using native species, plants that attract pollinators, intergrated pest management, and Firesmart landscaping practices in wildland/urban interface areas.
Undertake ecosystem restoration projects on City-owned land (e.g. wetland restoration and creation of wildlife habitat using native plants).
Encourage investments in local biodiversity conservation projects that also support carbon sequestration (i.e. grasslands conservation and native tree plantings).
Support regenerative agricultural practices that increase soil carbon storage (e.g. through education and partnering on pilot projects on City-owned land).
Undertake new green infrastructure pilot projects to trial emerging techniques (e.g. more cost-effective ways of ensuring adequate soil volumes for optimal plant growth) and integrate successful measures into infrastructure and development projects on public lands.
Supporting Low
Update street standards to incorporate requirements for street trees, native vegetation, sufficient soil volumes, and other green infrastructure to promote long-term plant health, urban cooling, and rain water retention.
Update the City’s Landscape Guidelines to ensure that landscaping developed on City rights-of-way (e.g. boulevards) use green infrastructure technologies, support the City’s tree canopy goals and use sufficient soil volumes and native vegetation where appropriate.
MEASURING & REPORTING PROGRESS
Annually Every 5 Years
An annual CCAP Progress Report will be prepared and presented to Council outlining:
progress on actions
successes and lessons learned
new actions
annual and total investment
Every five years*, it is recommended that a more comprehensive review be conducted and reported, including:
community emissions inventory of transportation, buildings, and waste sectors
calculation of key performance indicators
progress update on GHG emissions reduction targets
full review of actions to assess progress and identify gaps to achieving CCAP goals and targets
targeted internal and external stakeholder dialogues on actions (existing and new)
*Approximate - subject to data availability.
Ongoing
Implementation timelines can be updated as part of the CCAP’s reporting cycle to reflect changes to funding, staffing levels, or emerging community issues that may have impacts on the timing of each action. As new technology and government regulations emerge, the CCAP must evolve and adapt to leverage the opportunities. New actions may be added or existing actions modified as technologies and market conditions change over time. The City will continue to engage the public, stakeholders, and subject matter experts to understand factors influencing implementation, and provide support wherever possible to ensure actions can be implemented efficiently and equitably.
BIG MOVES ART PROJECT
City staff presented to a Grade 9 art class from Westsyde Secondary School on the draft CCAP in April 2021, to enhance understanding of the Big Moves and what we could expect to see in Kamloops upon implementation. The class then undertook a project whereby each student explored the themes of one or more Big Moves, interpreting what it means to them through art. The students also shared their perspectives on what they like about the Big Move and how it would shape what Kamloops will look like in 2050. For each Big Move, one artwork was selected to be featured on the following pages. All other submissions are shown below. The City thanks all participants for sharing their creative and critical reflections on how the plan speaks to them as youth in our community.
- Brighton Dalton
- Connor Goeujon
- Chance Lavoie
- Gizzel Davoren
- Cheyenne
- Emma Walker
- James Dusange
- Kai Mohammed Ali
- Lily Watkinson
- Carly
- Kruz Dhaliwal
- Lily Watkinson
- Evangelina Raymer
- Ella
BIG MOVE 1: LOW-CARBON DEVELOPMENT
“I think that a lowcarbon society will become very important in the near future, so it reflects that we will devise more buildings and live together in a way that is kind to the earth.”
- Kayori Kiya
BIG MOVE 2: CAR-LIGHT COMMUNITY
“I think it would be interesting to have everything you need within walking distance. I hope that there are more alternative motives of transportation like bikes, electric cars, and electric/eco-friendly buses. I believe our city can start to change our ways and turn ecofriendly.”
- Mya Strutz
“In the future, Kamloops will be more colourful with lower gas emissions. I reflected scenery in the windshield to show the Kamloops environment and how the vehicle helps protect the environment.”
- Ryder Elliott
“Zero Carbon Homes would reduce the gas emissions from housing. I don’t want to watch the world get worse from climate change, and know what it was like to live here when we still had time to stop it from happening.”
- Lara Johnson
BIG MOVE 5: ZERO-WASTE/CIRCULAR ECONOMY
“I believe that we can live in a place with zero waste and a circular economy. My art shows compost which creates zero waste and gives back to the earth. Like a circle we take from the planet and give back, but if we don’t give back then the circle is broken.”
- Emily Peters
BIG MOVE 6: RENEWABLE ENERGY
“I incorporated solar panels, which gets particles from the sun then it turns into electricity that can power appliances in homes. In the light bulb there’s many trees that help with keeping the air clean.”
- Maddy Waters
BIG MOVE 7: MUNICIPAL CLIMATE LEADERSHIP BIG MOVE 8: HEALTHY URBAN ECOSYSTEM
“City workers should be the first ones through the “doorway” so they can be examples for the rest of Kamloops. The person can also represent all of Kamloops walking towards a better, brighter future. It shows that this future is possible, that there’s an open door we can walk through if we work together.”
- Sage McCabe
“This is Arrowleaf Balsamroot, a native wildflower commonly found in dry and sunny valleys. It was used for food and medicine by the First Nations people in southern British Columbia such as the Thompson and Nicola Valleys. It symbolizes a healthy urban ecosystem by filtering CO2 from the air.”
- Seth McRae
Appendix A: Glossary
ACTIVE TRANSPORTATION: walking, cycling, and other non-motorized, human-powered modes of travel.
ADAPTATION AND MITIGATION: mitigation measures are those actions taken to reduce and curb greenhouse gas (GHG) emissions while adaptation measures are those taken to reduce the vulnerability to the effects of climate change.
BIODIVERSITY: the variety and variability of life on earth. Biodiversity can be measured at the genetic, species, and ecosystem levels. Biodiversity is essential to healthy and well-functioning ecosystems and the provision of ecosystem services like water filtration and soil development. For example, biodiverse landscaping refers to the process of landscaping with a wide variety of plant species that may also provide habitat for other species (such as birds).
BIOFUEL FACILITY: a facility where a combustive fuel converted from biomass (plant/algae material, animal waste, etc.) is produced. Biofuel is a source of renewable energy. For example, a biofuel facility in the City of Surrey converts organic waste into renewable natural gas, which is then used to fuel the waste collection trucks used to deliver organic waste to the facility (City of Surrey, 2020).
CARBON ACCOUNTING: the processes of inventorying and measuring amounts of carbon dioxide or GHGs emitted by an entity. Carbon accounting can provide a factual ground for carbonrelated decision making and monitoring the impact of GHG reduction strategies over time.
CARBON PRICING: accounts for the social cost of climate change and helps to derisk projects from future climate-related uncertainties such as escalating provincial/federal carbon tax and global market shifts, which encourages better long-range investments.
CARBON SEQUESTRATION: the process of carbon dioxide being naturally captured from the atmosphere and stored through biological, chemical, and physical processes. The main natural carbon sinks are plants, the ocean and soil. For example, plants utilize and store carbon dioxide through photosynthesis, with some of this carbon transferred to the soil when they die and decompose.
CARRIAGE SUITE: a self- contained, two -storey dwelling unit that is separate from, subordinate in size to, and accessory to the principal dwelling. A carriage suite shall have a footprint that is no greater than 80 m2 and shall not have more than 95 m2 of residential living space.
CLIMATE GOVERNANCE: purposeful mechanisms and measures aimed at steering a system or entity towards preventing, mitigating, or adapting to the risks posed by climate change.
DENSITY BONUS: a tool that offers developers the opportunity to create a level of density that surpasses the allowable floor area ratio permitted in the Zoning Bylaw in exchange for community amenities such as parks or affordable housing. Typically, density bonuses are used in designated zones where higher density is desired.
DEVELOPMENT COST CHARGES (DCCS):
fees imposed on residential, commercial, and industrial uses for the purpose of providing funds to assist the City with paying the capital costs of providing, constructing, altering, improving, or expanding sewage, water, drainage, parkland, and roadway facilities, excluding off-street parking facilities, to directly or indirectly service the development for which the charges are imposed.
ECOSYSTEM RESTORATION: the process of assisting the recovery of an ecosystem that has been damaged or disturbed. The goal is to help restore normal ecosystem function. Examples of this include revegetation or habitat restoration.
ECOSYSTEM SERVICES: benefits to humans provided from ecosystem function. They include provisioning services (such as food or timber), regulating services (such as carbon sequestration by plants), cultural services (such as recreation), and supporting services (such as water cycling or soil creation).
ENERGY STEP CODE: the BC Energy Step Code is currently a voluntary provincial standard that provides an incremental and consistent approach to achieving more energy-efficient buildings that go beyond the requirements of the base BC Building Code. It does so by establishing a series of measurable, performance-based energy-efficiency requirements for construction that builders can choose to build to and that communities may voluntarily choose to adopt in bylaws and policies.
DECARBONIZE: to remove or reduce carbon e.g. decarbonize a home by replacing gas-powered systems and appliances with low-carbon, electric-powered alternatives).
EMBODIED CARBON EMISSIONS: occur when building materials are produced, shipped, and assembled to construct a new building or renovate an existing one. They also occur over the life of the building as materials are replaced and at the end of a building’s life to demolish it and transport the materials to a landfill or recycling depot.
ENERGY EFFICIENCY: eliminating energy waste by using less energy to perform the same task.
FOSSIL FUELS: are non-renewable energy sources formed by the anaerobic decomposition of organic material such as plants and animals that lived millions of years ago. Examples include petroleum, diesel, natural gas, and coal.
GARDEN SUITE: a self- contained, one -storey dwelling unit that is separate from, subordinate in size to, and accessory to the principal dwelling. In Kamloops, a garden suite shall have a total floor area of not more than 80 m2 in area.
GEOEXCHANGE: a low-carbon heating and cooling system, which is sometimes referred to as a “ground-sourced heat pump”, that draws heat from the ground in the cooler months and distributes it through a building and conversely draws heat from the building in the warmer months and sends it back into the ground.
GLOBAL WARMING POTENTIAL: a measure of a GHG’s ability to trap heat in the atmosphere over a 100-year time horizon compared to carbon dioxide (CO2). For example, methane’s global warming potential is 25 times higher than carbon dioxide.
GHG: an acronym for greenhouse gas, which is any gas that absorbs and emits radiant energy and causes the greenhouse effect. GHGs cause climate change by trapping heat, and they also contribute to respiratory disease from smog and air pollution. Examples of GHGs include carbon dioxide, methane, nitrous oxide, and fluorinated gases.
GREENHOUSE GAS INTENSITY (GHG i): a measure of emissions associated with a building determined by the total amount of energy supplied to a building by type over a specified period, multiplied by the energy’s carbon intensity, and then divided by the building area (e.g. kg CO2e/m2/year).
GREENFIELD: an undeveloped or agricultural tract of land that may have potential for urban development, including commercial, residential, and industrial uses, and may be used for recreational purposes by residents.
GREEN INFRASTRUCTURE: water management practices that use natural vegetative systems and green technologies to protect, restore, or mimic
natural water processes. Examples include rainwater harvesting, rain gardens, bioswales, and permeable pavements.
GREENSPACE: public or private land that contains a significant cover of vegetation. It can be landscaped with lawns and shrubs or it may consist of natural features.
GREEN STREET STANDARDS: a stormwater management approach that incorporates vegetation, soil, and engineered systems to slow, filter, and cleanse stormwater runoff from impervious surfaces (such as paved streets and sidewalks). Traditional street construction directs stormwater into impervious infrastructure (e.g. gutters, drains, and pipes) that discharge directly into surface waters, rivers, and streams. Green streets capture and retain rainwater where it falls and naturally filters it before it makes its way into local waterways.
HEAT PUMP TECHNOLOGY: electric heating and cooling device that extracts heat from one place and transfers it to another. Heat pumps offer a highly efficient, low-carbon option to regulating temperature in homes and buildings.
IMPERVIOUS SURFACES: surfaces that are water resistant (such as concrete or highly compacted dirt). Urban areas tend to have high proportions of impervious surfaces due to buildings, roads, and other development, which prevents the natural soaking of rainwater into the ground and gradual seeping into streams. Instead, rainwater accumulates and flows rapidly into storm drains and other stormwater management systems, which carries pollutants to water systems or causes increased erosion during high rainfall events.
INFILL: development or redevelopment on vacant or underutilized parcels of land within existing urban areas of the city. Infill development often increases densities while using infrastructure and existing community services more efficiently. Examples
include redeveloping surface -level parking lots at shopping centres, refurbishing existing buildings for new uses, and redeveloping large residential lots to accommodate more units.
INTENSIFICATION: the development of a property, site, or area at a higher density than currently exists through redevelopment; the development of vacant and/or underutilized lots within previously developed areas; infill development; and the expansion or conversion of existing buildings.
INTERGOVERNMENTAL PANEL ON CLIMATE CHANGE
(IPCC): an intergovernmental body of the United Nations, which is mandated to provide the world with objective information regarding the understanding of the scientific basis of the risk of climate change. They do not conduct original research but rather reviews scientific literature and provides comprehensive assessments, reports, and methodologies.
INTERNAL CARBON PRICE: a value voluntarily set by an organization that internalizes the economic cost of carbon emissions by incorporating it into financial decision making based on the GHG emissions generated by a process or project.
LOW-CARBON ENERGY SYSTEM: a system that primarily uses low-carbon energy sources to provide heating, cooling, and hot water for a building.
MEDIUM- AND HEAVY-DUTY VEHICLES: truck classifications widely used in industry. Mediumduty trucks are used for a variety of lighter duty applications, and weigh between 19,000 and 33,000 lbs. Heavy duty are primarily used for long-haul transportation and weigh more than 33,000 lbs.
MIXED-USE: the combination of more than one use (such as residential, commercial, industrial, or institutional uses) in the same building or development.
MULTI-FAMILY RESIDENTIAL: a development where the building or buildings on a lot are used for two or more dwellings in accordance with the regulations for multi-family residential use specified in the City’s Zoning Bylaw.
NET-ZERO ENERGY READY: Net-zero energy buildings produce as much clean energy as they consume. They are up to 80% more energy efficient than a typical new buildings and use on-site (or near-site) renewable energy systems to produce the remaining energy they need.
PHOTOVOLTAIC (PV) SOLAR ENERGY: the conversion of light into electricity. The process utilizes materials that exhibit the PV effect. It is the primary method of converting sunlight into energy—it is the type of solar produced by rooftop panels.
REGENERATIVE AGRICULTURE: a system of farming practices that aims to rehabilitate and enhance a farm’s ecosystem, which improves the resource. It focuses on soil health, water management, and fertilizer use. Techniques include low- or no-till practices (tilling erodes soil and releases CO2), planting diverse species, and rotating crops.
RENEWABLE ENERGY: energy derived from natural processes and replenished at a rate equal to or faster than the rate at which it is consumed. Examples of renewable energy include solar, wind, renewable natural gas, geoexchange, and hydroelectricity.
RENEWABLE NATURAL GAS (RNG): biogas that is captured and purified from the decomposition of organic material. It is interchangeable with conventional natural gas, though it is considered lowcarbon and more sustainable.
RESILIENCY: the capacity to quickly recover from difficulties/damage and return to the original form or state. For example, ecosystem resiliency refers to the capacity of an ecosystem to respond to disturbance by resisting damage and recovering quickly.
RETROFIT: retrofitting refers to the addition of new technology or features to an older system. In the context of low-carbon buildings, a retrofit consists of installing technology that reduces the carbon emissions of a building (e.g. replacing a gas furnace with a heat pump and upgrading to high-performance insulation or windows).
SECONDARY SUITES:
a second dwelling unit having a total floor area of not more than 90 m² and having a floor space less than 40% of the habitable floor space of the principal building. It must be located within the principal building of a residential occupancy containing only one other dwelling unit. It must be located in and be part of the building, which is a single real estate entity.
SMART GRID TECHNOLOGY: an electricity network that can cost-effectively integrate the behaviour and actions of all users connected to it—generators, consumers, and those that do both— in order to ensure an efficient, sustainable power system with low losses and high levels of quality and security of supply. A smart grid employs innovative products and services together with intelligent monitoring, control, communications, and self-healing technologies.
TRADITIONAL ECOLOGICAL KNOWLEDGE:
the collective knowledge of Indigenous groups on local resources and traditions, used to sustain and adapt themselves to the environment over time and passed on from one generation to the next.
TRANSPORTATION DEMAND
MANAGEMENT: the application of strategies and policies to reduce travel demand, promote efficient use of existing transportation resources, and provide a cost-effective alternative to increasing capacity of the transportation network.
URBAN HEAT
ISLAND:
an urban area that is warmer than its surrounding natural land cover. Trees and vegetation offer natural cooling effects through shading and water evaporation. As vegetation is replaced by asphalt and concrete, these surfaces absorb more heat, which causes ambient temperatures to rise. Waste heat from vehicles and buildings may further contribute to the heat island effect. Increasing urban vegetation (such as adding parkland and street trees) can help reduce urban heating.
ZERO-EMISSION VEHICLES (ZEV): vehicles with motors that are powered by on-board batteries or hydrogen-based fuel cells rather than gas-powered internal combustion motors and that produce no tailpipe emissions. The large majority of ZEVs in use today consist of battery electric vehicles, although hydrogen-based fuel cell vehicles (FCVs) are emerging with a potential role in some heavy-duty transport, marine, and industrial applications.
Appendix B: Implementation Priorities Methodology and Analysis
A framework was developed to prioritize strategies by five key implementation factors, which were weighted according to the table below. A prioritization score out of 10 for each strategy was developed. Priorities were then assigned a category by score: Very High >7.5 | High 6.5–7.5 |
TABLE 1: Scoring Criteria for Each Implementation Factor
SCORE:
1
2
Annual projected emission reductions between 0 and 4,999 tCO2e by 2050.
3
Annual projected emission reductions between 5,000 and 19,999 tCO2e by 2050.
Considered difficult to implement, with a high probability of resistance or other barriers.
The City has very little authority to enact or enforce relevant measures or policies, and must rely mostly on lobbying or partnerships.
There is a potentially substantial cost for residents or businesses within the City.
Direct cost to the City is over $100,000/year.
Annual projected emission reductions above 20,000 tCO2e by 2050.
Considered potentially problematic to implement, with some work needed to get buy-in and/or unclear implications.
Considered relatively simple to implement, with obvious beneficial implications and existing buy-in.
The City may have authority, but the process is complex or the authority is shared or only indirectly held by the City.
The City has clear authority to enact or enforce relevant measures or policies, and the process is relatively simple.
There is some cost, which may be fully or partially offset by potential savings. There may be a net benefit of $1,000 or less per household.
There are few or no costs for residents and/or there is net benefit of $1,000 or more per household.
Direct cost to the City is under $100,000/year.
Direct cost to the City is under $100,000 (one-time cost). May also be a net benefit to the City.
TABLE 2: Results of Implementation Priorities Analysis
1 - Low-Carbon Development
TABLE 2: Results of Implementation Priorities Analysis Continued
5 - Zero-Waste/Circular Economy
Priority scores can be updated periodically, as future developments may change how a strategy scores against the original criteria (e.g. senior government funding becomes available decreasing the cost to the City).
Appendix C: Summary of Energy and Emissions Modelling Methodology
Community-scale energy and emissions modelling was completed to understand the greenhouse gas (GHG) and energy implications of future emissions scenarios based on existing City, provincial, and federal policies and plans as well as the emissions reductions that could result from the actions specified within the Community Climate Action Plan (CCAP). This document provides an overview of the methodology and key datasets used for modelling the three key community emissions source sectors (transportation, buildings, and waste) and for developing land use scenarios that were subsequently utilized within transportation and buildings emissions modelling. The reference year for all baseline modelling data was 2017. All future emissions scenarios based on existing City, provincial, and federal policies and plans and the CCAP’s Big Moves were modelled out to 2050. For a full description of the steps taken to complete the modelling for each emissions sector, visit Kamloops.ca/ClimateAction.
SECTOR OVERVIEW KEY DATASETS
Land Use
Land use modelling for the CCAP involved an estimation of the location, type, and scale of future development in the city under differing land use scenarios. While emissions from land use were not modelled outright, outputs from growth modelling directly influenced two key emissions source sectors: transportation and buildings. All land use modelling prepared for this project involved theoretical outcomes based on assumed development patterns and best available information to develop scenarios that can be used to evaluate emissions outcomes.
Transportation
Transportation modelling for this plan involved an estimation of fossil fuels combusted by on-road vehicles registered in the City of Kamloops, including light-duty vehicles such as passenger cars, SUVs, and light-duty trucks and medium- and heavy-duty vehicles such as transit vehicles, delivery trucks, and long-haul trucks. The development of the baseline model and forecasting was guided by the Federation of Canadian Municipalities and ICLEI Canada’s (2014) PCP Protocol: Canadian Supplement to the International Emissions Analysis Protocol and, where needed, the World Resources Institute’s (2018) Global Protocol for Community-Scale Greenhouse Gas Emission Inventories: An Accounting and Reporting Standard for Cities.
• Municipal datasets such as land use plan designation polygons, zoning polygons, recent building and demolition permits
• Growth modelling completed for the City’s Official Community Plan (OCP)
• Employment and population projections produced for the Transportation Master Plan (TMP)
• BC Assessment data (specifically, information pertaining to the actual use of parcels and commercial and residential floor areas)
• Transportation modelling previously completed for the OCP and the TMP
• 2007 trip diary study prepared for the City of Kamloops
• Provincial Community Energy and Emissions Inventory (CEEI) from 2007, 2010 and 2012
• Extracts from Climate Action Secretariat’s provincial fleet model
• Fleet information from BC Transit
• Land use modelling completed earlier in this project
• Emissions factors from BC Ministry of Environment’s (2018) B.C. Best Practices Methodology for Quantifying Greenhouse Gas Emissions
SECTOR OVERVIEW
Buildings
Buildings modelling involved using building archetypes with typical energy use intensity (EUI) in kWh/m² for different sectors. These archetypes were applied to current building floor areas to determine total consumption, which was aligned with community-wide utility data. Changes in floor area and EUI for different sectors could then be projected for future years. Emissions were determined using standard emissions factors for the energy types being used.
KEY DATASETS
• Community-wide utility electricity and natural gas consumption data obtained through the provincial CEEI initiative
• Floor area projections (see Land Use section above)
• Building archetype EUIs developed by BC Hydro
• Emissions factors from the B.C. Best Practices Methodology for Quantifying Greenhouse Gas Emissions.
Solid Waste Waste modelling was based on the US Environmental Protection Agency’s (EPA) Landgem model, which models methane generation from the characterization of waste and mass of waste disposed over time. The model was adapted to allow for changes to waste characterization, in order to calculate the impact of waste reduction policies. Further spreadsheet analysis was performed on the Landgem results to determine the impact of landfill gas collection and calculate GHG emissions.
• Population data and projections from BC Stats and the City of Kamloops
• City of Kamloops landfill disposal rates
• TNRD Solid Waste Management Plan (SWMP)
• City of Kamloops Solid Waste Composition Study (2006)
• Landfill gas collection rate from City of Kamloops