2022 Kamloops Green Infrastructure Research Project Report
City of Kamloops
Green Infrastructure Project Report
Jovan Kaila, Natural Climate Solutions Analyst
December 2022
ACKNOWLEDGMENTS
The author acknowledges that this project was conducted on Tk'emlúps te Secwépemc territory, situated within the unceded ancestral lands of the Secwépemc Nation. We honour and respect the people, the territory, and the land that houses our community.
Funding for this initiative is provided by the Pacific Institute for Climate Solutions’ internship program.
This project was conducted under the mentorship of the City of Kamloops Climate and Sustainability Division staff.
The opinions and recommendations in this report and any errors are those of the author and do not necessarily reflect the views of the City of Kamloops, or the Pacific Institute for Climate Solutions.
PURPOSE
The purpose of this project is to advance the implementation of the City of Kamloops’ Community Climate Action Plan (CCAP) by undertaking research on green infrastructure (GI) best suited for the Kamloops climate and topography. The goal of this research is to identify key challenges surrounding GI in our region, evaluate projects completed to date, and identify recommendations on what next steps the City of Kamloops could take to support implementation of further GI projects. This was done by engaging with the staff and public stakeholders to gain a better understanding of the barriers and benefits surrounding GI.
This report is divided into three chapters. Chapter 1 will offer a general overview of the types of GI and best practices from other jurisdictions. Chapter 2 will discuss key findings from primary research conducted through site visits, surveys, focus groups, and interviews. Chapter 3 will cover recommendations and next steps for the City of Kamloops.
CONTEXT
The Intergovernmental Panel on Climate Change (IPCC) states that human activity has already caused an increased warming trend that has resulted in a rise of approximately 1ºC of global warming above pre-industrial levels. To avoid the most catastrophic impacts of climate change, we must not surpass a 1.5ºC rise in global warming.1 The impacts of climate change are already experienced on a local and global scale. In British Columbia, this has resulted in an increase in extreme weather events such as wildfires, summer heat waves, droughts, and intense flooding. These impacts also negatively affect our natural environments and agriculture. To combat the impacts of climate change requires co-operation from all levels of government and our communities to decrease greenhouse gas (GHG) emissions and build climate resiliency.2
The City of Kamloops’ CCAP was adopted by City Council on June 29, 2021 the hottest day in Kamloops’ recorded history with a temperature high of 47.3ºC. This plan was created with the goal of “…reducing community greenhouse gas emissions that is in line with Kamloops’ portion of global efforts to keep global temperature rise to 1.5ºC”. 3 This plan aims to reduce emissions by 30% by 2030 and by 80% by 2050 in comparison to 2007 levels, while also increasing community resilience to climate change impacts. To accomplish this, the CCAP outlines 8 “Big Moves”, 24 strategies, and 66 actions to meet the community’s climate targets.
This project focuses on Big Move 8: Healthy Urban Ecosystem, the objective of which is “To enhance and restore urban ecosystem health to improve carbon storage capacity and resilience to climate change.”4 Strategy 8C Green Infrastructure has the following actions that this research hopes to inform:
▪ Undertake new green infrastructure pilot projects to trial emerging techniques (e.g. more cost-effective ways of ensuring adequate soil volumes for optimal plant growth) and integrate successful measures into infrastructure and development projects on public lands.
1 IPCC. (2018) “Global Warming of 1.5°C. An IPCC Special Report on the impacts of global warming of 1.5°C”, online: https://www.ipcc.ch/sr15/chapter/spm/
2 City of Kamloops. (June 29, 2021) “Community Climate Action Plan”, online: https://www.kamloops.ca/sites/default/files/docs/cityofkamloops_communityclimateactionplan_june2021_final_0.pdf, p. 3.
3 Ibid, p. 7.
4 Ibid, p. 15.
▪ Update street standards to incorporate requirements for street trees, native vegetation, sufficient soil volumes, and other green infrastructure to promote long-term plant health, urban cooling, and rain water retention.
▪ Update the City’s Landscape Guidelines to ensure that landscaping developed on City rightsof-way (e.g. boulevards) use green infrastructure technologies, support the City’s tree canopy goals and use sufficient soil volumes and native vegetation where appropriate
Chapter 1: Background Research
As per the Community Climate Action Plan, the City of Kamloops is looking into the use of green infrastructure (GI) to help create a healthy urban ecosystem.
GREEN INFRASTRUCTURE DEFINITION
‘Green infrastructure’ is a vague term however, as it is defined and used differently by the world’s governments. Green infrastructure needs to have its own definition in the context of its use by the City of Kamloops for it to be effectively implemented. Understanding other definitions and uses of green infrastructure can help achieve this.
Green Infrastructure Definition – Environmental Protection Agency (EPA), USA
Green infrastructure within the United States is used for the purpose of stormwater management. Green infrastructure is used to store stormwater and filter its runoff of pollutants. The EPA defines green infrastructure as “measures that use plant, soil, or permeable surfaces to store, infiltrate, or evapotranspirate stormwater and reduce stormwater flow to sewer systems and surface water”. 5
Green Infrastructure Definition – European Environment Agency (EEA)
The EEA does not focus on stormwater management and has a broader definition for green infrastructure. The EEA states that green infrastructure must be strategically planned. Green infrastructure is defined as being “strategically planned natural and man-made green structures, designed to deliver a wide range of ecosystem services.” Green infrastructure is also stated to be “designed to maintain and deliver health benefits to humans”. 6 Green infrastructure in Europe is more focused on health benefits for humans and ecological benefits.
Green Infrastructure Vision for Kamloops
As Kamloops is attempting to use green infrastructure to create a healthy urban ecosystem, its definition for green infrastructure should be a combination of both the EPA’s and the EEA’s definitions. As Kamloops has recently had flooding issues, and as the effects of climate change will cause more frequent extreme rainfall events,7 it is necessary that green infrastructure be implemented to manage stormwater and its runoff.
The CCAP’s Big Move 8 aims to enhance and restore ecosystems, and thus green infrastructure should also be made to benefit all members of an ecosystem. An example could be that green infrastructure that integrates plants and trees would include co-benefits from ecosystem services such as air purification for humans, while also providing habitat for local wildlife. In
5 United States Environmental Protection Agency. (2022, March 31). What is Green Infrastructure? Retrieved from EPA: https://www.epa.gov/green-infrastructure/what-green-infrastructure
6 European Environment Agency. (2022). Green Infrastructure. Retrieved from European Environment Agency: https://www.eea.europa.eu/themes/biodiversity/green-infrastructure
Kamloops, green infrastructure should be multifunctional to maximize its ecological and societal benefits.
Green infrastructure in Kamloops could be defined as a connected, multifunctional system designed to mitigate climate change impacts while enhancing ecosystem functions and their benefits for human society.
GREEN INFRASTRUCTURE TYPES
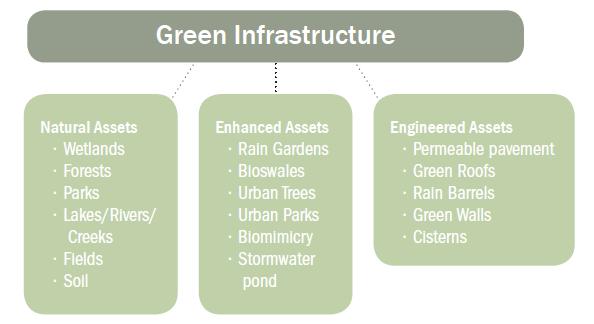
Green infrastructure can be divided into three types: natural assets, enhanced assets, and engineered assets:
Natural assets include natural vegetation and can be found naturally in the environment.
Enhanced assets also consist of natural vegetation but are managed and enhanced by human infrastructure to work in urban environments.
Engineered assets are designed and constructed by humans and sometimes do not have vegetation as a part of their design.
The site visits, interviews and focus groups for this project primarily focussed on enhanced and engineered assets.
1: Green Infrastructure Types8
8 Municipal Natural Assets Initiative. (2022). About MNAI/What is Green Infrastructure? Retrieved from MANI.ca: https://mnai.ca/what-is-green-infrastructure/
Chart
The following tables lists forms of green infrastructure that can be used in Kamloops and their types.9
Table 1: Overview of Major Green Infrastructure Types
1A: Natural Assets: Green Infrastructure Form Natural Asset Description
Stream Daylighting Stream daylighting is recreating or uncovering natural waterways buried as a result of urbanization. These waterways are most beneficial if vegetation is included alongside them.
1B: Enhanced Assets: Green Infrastructure Form
Asset Description
Rain Garden Areas of shallow depressions, collect and filter stormwater through layers of mulch, soils and plants.
Planter Boxes Urban rain gardens with vertical walls and open or closed bottoms. They collect and absorb runoff from streets, sidewalks, and parking lot. They’re good for areas with limited space.
Bioswales Essentially rain gardens placed in long, narrow spaces, often along curbs or in parking lots.
Green Streets/Alleys Created by integrating green infrastructure into street design. Bioswales, planter boxes woven into street or alley design.
Green Roofs Roofs covered with growing vegetation that enable rainfall infiltration and evapotranspiration of stored water. Cost effective in dense areas
Urban Tree Canopy Trees absorb stormwater in leaves and branches. Large canopy is formed; enough to cover roads.
9 City of Vancouver. (2019). Appendix B - GRI Typologies. Retrieved from Vancouver.ca: https://vancouver.ca/files/cov/one-watergri-typologies.pdf
Rainwater Tree Trench
Plastic cells filled with soils are built under sidewalks for tree roots to grow into. Rainwater running down trees into the trenches are stored in the soil or are taken up by the trees. Provide rainwater storage and street tree support.
Blue-Green Roofs Blue roofs designed with vegetation to help store water are blue-green roofs
Engineered Wetlands
Infiltration Trenches
Absorbent Landscapes
Artificial wetlands installed in parks designed to use the same process that natural wetlands use to clean and absorb rainwater runoff
Ditches filled with permeable soil that collect rainwater and allow it to be stored within the ground. Typically built along roads and sidewalks
Vegetated areas designed to absorb and retain large amounts of rainfall without creating a pond. Can be as simple as uncompacted topsoil.
Green Walls Vegetation planted on the walls of houses and buildings. These can reduce the interior heat of the buildings as well as absorb pollutants emitted by buildings.
1C: Engineered Assets: Green Infrastructure Form
Permeable Pavements
Downspout Disconnection
Rainwater Harvesting
Non-Potable Systems
Engineered Asset Description
Infiltrate, treat, and/or store rainwater where it falls. Can be made of pervious concrete, porous asphalt, or interlocking pavers. Useful where flooding or icing is a problem
Rerouting drainage pipes from storm sewers into rain barrels, cisterns and permeable areas. Can be used to store stormwater or allow stormwater to infiltrate soil.
Rainwater harvesting systems reduce stormwater pollution by slowing runoff and collecting rainfall for later use. Range from backyard rain barrels to nets that capture dew and fog.
Same as rainwater harvesting, but only collects non-potable water. These systems collect, store, treat and supply water for non-drinking uses (i.e., irrigation). Water is sourced from groundwater, rainwater, and wastewater from showering, irrigation, toilet flushing, etc.
Dry Wells Underground storage container with perforations that allow rainwater absorbed within the ground to be stored and released.
Soakways Pit in the ground filled with gravel or plastic crates that filter water coming in through a pipe connected to a house or area that experiences large amounts of runoff.
Floodable Spaces
Blue Roofs
White Roofs
Floodable spaces are spaces designed with a depression that will fill with water during heavy rain and drain out slowly through an outlet. The space can be used for recreation as well.
Temporarily store rainwater before releasing it into the sewer system. Helps to reduce flooding and pipe overflow. Water can be stored in slow drains and weighted trays.
White roofs are simply roofs with white shingles. The white shingles absorb less heat than darker colours, keeping homes cooler and mitigating the urban heat island effect.
BENEFITS OF GREEN INFRASTRUCTURE
Green infrastructure is a multifunctional tool, having benefits beyond aesthetic appeal. Implementation of green infrastructure has been found to have economic and social benefits in addition to its ecological benefits. The implementation of green infrastructure in Kamloops can only benefit the city and its people.
Environmental Benefits
The benefits of green infrastructure are strongest ecologically and most green infrastructure is geared toward stormwater runoff reduction. Green infrastructure can reduce peak discharge rates and help induce ground charge (storage of runoff in the ground). Bioretention cells can reduce runoff flows by up to 97% in small to medium storm events, and green roofs can reduce runoff by up to 50%.10 Water quality can improve as well, with runoff water being filtered by green infrastructure to remove solids and heavy metals. The town of Okotoks, Alberta uses a 3600 square meter rain garden of permeable soils and native plants. This rain garden stores, filters, and manages stormwater in Okotoks. It has increased Okotoks’ water quality and decreased the flow rate of water into the local river system, decreasing its flooding risk 11
Green infrastructure can help make Kamloops’ air cleaner by absorbing particulate matter. Vegetation along roadsides can reduce pollutant presence behind the vegetation barrier. Green walls on buildings can reduce nitrogen dioxide concentrations by up to 40% and reduce particulate matter concentration up to 60% in streets.12 Large trees on both sides of a street, called a tree canopy, can reduce the dispersion and mixing of air pollutants. Vegetation also directly removes carbon dioxide from the atmosphere during the day during respiration and can store carbon dioxide below ground. Most forms of green infrastructure will take in carbon dioxide, reducing its presence in the atmosphere. Direct absorption and sequestration of carbon dioxide can help reduce the greenhouse effect and Kamloops’ GHG emissions.
Green infrastructure also has a cooling effect, which can help mitigate the effects of heat waves and the increasingly hot summers.13 Green infrastructure does often involve plants and trees, which provide shade that reduce air and surface temperature. Increasing the number of green spaces (like parks) can provide a further cooling effect due large amounts of shade and evapotranspiration occurring. Green infrastructure has a cooling effect on buildings as well, reducing the interior heat and the energy consumption of the building. Buildings near parks can reduce energy consumption by up to 10%.14 Green walls and roofs reflect sunlight better than regular walls and roofs, preventing buildings from absorbing as much heat. They provide cooling and insulation, reducing energy costs and increasing comfort. Depending on the conditions of both the building and the vegetation, green walls and roofs together can have an energy savings of 32% to 100% and
10 Demuzere, M., Orru, K., Heidrich, O., Olazabal, E., Geneletti, D., Orru, H., . . . Faehnle, M. (2014, December 15). Mitigating and adapting to climate change: multi-functional and multi-scale assessment of green urban infrastructure. Retrieved from ScienceDirect: https://www.sciencedirect.com/science/article/pii/S0301479714003740
11 Green Municipal Fund. (2018). Case Study: Okotoks proves natural stormwater management works. Retrieved from Green Municipal Fund: https://www.victoria.ca/EN/main/residents/water-sewer-stormwater/stormwater/rainwater_rewards_program.html
12 Demuzere, M., Orru, K., Heidrich, O., Olazabal, E., Geneletti, D., Orru, H., . . . Faehnle, M. (2014, December 15) Mitigating and adapting to climate change: multi-functional and multi-scale assessment of green urban infrastructure. Retrieved from ScienceDirect: https://www.sciencedirect.com/science/article/pii/S0301479714003740
13 Boston, A. (2022, July 5). Cities need to embrace green innovation now to cut heat deaths in the future. Retrieved from TheConversation: https://theconversation.com/cities-need-to-embrace-green-innovation-now-to-cut-heat-deaths-in-the-future185101
14 Ibid.
decrease interior temperatures by up to two degrees Celsius.15 Green walls and roofs also increase in effectiveness in hotter and drier climates (provided they receive regular maintenance), making them well suited for Kamloops.
Social Benefits
Green infrastructure largely involves the use of plants, which have aesthetic appeal but also social/psychological benefits for humans. The presence of plants and green spaces increases people’s participation in physical, leisure, and social activities. More green spaces offer more locations for people to meet and have events. The presence of green infrastructure can encourage more active travel like biking and walking, especially when integrated with active transportation infrastructure. Plants and green spaces have an aesthetic appeal that make people more likely to spend time outdoors, and their presence is linked to increased relaxation, comfort, and satisfaction in people. Increasing the number of green spaces in Kamloops will also mean people have better access to green spaces. Easy access to green spaces makes physical activity more likely and a lower likelihood of obesity. The presence of green spaces also lower anxiety disorders and depression rates.
Green infrastructure types such as rain gardens and green roofs can encourage community gardening activities. Making people stewards of their environments increases social connection outdoors and can instill a sense of responsibility and self-efficacy. Community involvement in green infrastructure management provides more opportunities for the public to learn about climate change, its effects and how it can be mitigated. A better public understanding of climate change and the means used to fight it will help make future implementation of climate change measures easier.
Economic Benefits
Green infrastructure can reduce or remove the costs of stormwater treatment. As green infrastructure absorbs, stores and filters stormwater, stormwater pipes and sewer systems are placed under less strain. This reduces the costs of operating and implementing these systems and can even remove the need for them entirely. As an example, the town of Gibsons, B.C. has used a local pond system to act as their stormwater management system. This has allowed them to bypass the need for a traditional pipe-and-sewer based stormwater management system that would have cost $3.5-$4 million.16 The implementation of green infrastructure can also reduce flooding, preventing damage to buildings and infrastructure. Green infrastructure overall is also cheaper to install and maintain. Dedicated green infrastructure sectors can also contribute to job creation and GDP. In Ontario, the green infrastructure sector alone was responsible for 122,000 jobs and the contribution of $8 billion in GDP.17
Green roofs, green walls, and green spaces can decrease energy consumption costs. The cooling effects of these types of green infrastructure can reduce electricity and natural gas usage in buildings and helps dampen interior temperature variation.
15 Ibid.
16 Drescher, M., & Mollame, L. (2020, June 17). How investing in green infrastructure can jump-start the post-coronavirus economy. Retrieved from TheConversation: https://theconversation.com/how-investing-in-green-infrastructure-can-jump-start-the-postcoronavirus-economy-139376
17 Ibid.
Overall, implementing green infrastructure is beneficial socially, economically, and environmentally. The economic benefits will reduce the costs of climate change mitigation. The environmental benefits will make Kamloops’ a healthier and greener place to live, and the social benefits can make Kamloops’ citizens happier and more mindful of their community and climate change. Green infrastructure is well worth the investment.
PROVINCIAL AND FEDERAL FUNDING OPPORTUNITIES
There are several programs run by both the provincial and federal governments offering grants for green infrastructure projects. The federal government is investing more than $903,000,000 into green infrastructure projects across the country. Most of these grant programs are closed and not currently accepting applications but are likely to open again in future and thus have been listed here.
Federal Programs:
• Green and Inclusive Community Buildings Program – Will provide $100,000 to $3,000,000 in funding for repairs, retrofits, and upgrades of existing community buildings and for the construction of new community buildings. A second round of applications has been announced, but no date yet.
• Natural Infrastructure Fund – Closed but may re-open. This $200,000,000 program is open to projects that use natural/hybrid infrastructure (green infrastructure) to protect the natural environment, support healthy and climate-resilient communities, and promote economic growth and jobs.
Provincial Programs:
• Adaptation, Resilience, and Disaster Mitigation Program – This program will fund flood mitigation projects. Many types of green infrastructure can help prevent flooding and are eligible under this program. They will fund up to one third of a project. The first round of applications closed October 11, 2022.18
• Environmental Quality Program – This program will help fund a variety of projects, including those related to increasing stormwater management. Stormwater management is the primary purpose of many green infrastructure types and are eligible to be funded by this program. Applications are currently closed but are likely to open again in the future.
These programs work with any kind of green infrastructure and are an excellent fit for Kamloops. Green infrastructure implementation projects can be partially or fully funded by these programs and should be kept track of so that applications can be made prior to any deadlines.
GREEN INFRASTRUCTURE CASE STUDIES: B.C. MUNICIPALITIES
Green infrastructure is mentioned in the sustainability plans of many larger municipalities in B.C. Larger municipalities such as Vancouver or Surrey have green infrastructure play a more substantial role, with specific plans and policies set in place to maximize their use of green infrastructure. Smaller municipalities closer to Kamloops such as Vernon or Kelowna do mention green infrastructure but detailed plans were not available, with the topic to be further researched.
18 Government of British Columbia. (2022). Adaptation, resilience and disaster mitigation program. Retrieved from gov.bc.ca: https://www2.gov.bc.ca/gov/content/safety/emergency-management/local-emergency-programs/financial/ardmp
Green Infrastructure in the City of Vancouver
Vancouver has a large, detailed plan specifically for green infrastructure. Their green infrastructure plan is focused largely on reducing stormwater runoff and preventing flooding. Referred to as ‘green rainwater infrastructure’, the City of Vancouver’s Rain City Strategy is designed to capture and clean Vancouvers average annual rainwater.19 To do this, Vancouver is investing in:
• Bioswales
• Rain gardens
• Green roofs
• Rainwater tree trenches
• Subsurface infiltration
• Downspout disconnections
• Non-potable systems
• Absorbent landscaping
• Permeable pavement
City of Vancouver’s Targets
With the implementation of ‘green rainwater infrastructure’, Vancouver hopes to increase its resilience to climate change. As extreme weather events increase in frequency and precipitation set to increase due to climate change, Vancouver wishes to make sure its infrastructure can withstand the increase in stormwater.20
Increasing the quality of water is also a goal Vancouver hopes to have its ‘green rainwater infrastructure’ achieve, as well as providing equitable water access. Green infrastructure’s ability to filter water can help provide easier access to clean drinking water for lower income individuals, as well as helping to increase the quality of water available. Vancouver also hopes to lower utility costs for water for citizens, using rainwater collections and non-potable systems to recycle water.
Vancouver hopes to catch and clean 90% of its annual stormwater volume. Light showers (24mm per 24 hours) are 70% of Vancouver’s rainfall and are specifically being targeted. Management of 100% of rainwater falling on impervious surfaces is targeted to prevent flooding and pooling.
Public Engagement
The City of Vancouver informed the public of its ‘green rainwater infrastructure’ implementation via open houses, workshops, surveys, and educational events such as guest lectures at universities. A mailing list was created to send citizens their Rain City Strategy and a newsletter was used to provide news and updates on green infrastructure implementation. For professional associations in the development industry, green infrastructure was advertised using newsletters. Workshops were held for professionals in the development and engineering industries where learning activities were held to help industry professionals learn more about green infrastructure, its benefits,
19 City of Vancouver. (2019, November 5). Rain City Strategy. Retrieved from Vancouver.ca: https://vancouver.ca/files/cov/raincity-strategy.pdf 20 Ibid.
and its implementation (including barriers and opportunities). A survey specifically for industry professionals was created and distributed, with 1419 responses collected.21
The public were also engaged with workshops, as well as an open house. Three workshops and an open house in March of 2018 comprised the bulk of Vancouver’s public engagement. The open house played a promotional video to introduce projects and info boards for greater detail. Samples of green infrastructure were present, with reading materials to help further educate. Workshops explored how green infrastructure could be used on a variety of different buildings and in and around homes. Walking tours of buildings and other sites with green infrastructure were also given. Through partnerships with universities and other organizations, Vancouver was able to present its Rain City Strategy at 17 speaking events, 28 public events and 12 universities.
Green Infrastructure in Surrey
Unlike the City of Vancouver and many other cities in North America, green infrastructure in Surrey is centered around biodiversity conservation. Surrey has a Green Infrastructure Network (GIN) that is planned to comprise 3900 acres of interconnected natural areas. The GIN is defined as ‘an interconnected system of natural areas and open space that conserves ecosystems and functions, while providing benefits to both wildlife and people’. In Surrey, green infrastructure is taken literally and is entirely vegetation; no permeable pavements or other similar types of green infrastructure are used.
Surrey’s Targets
Surrey’s GIN has 3 core targets: preserving large core habitat areas, ensuring connectivity between habitat areas, and providing a diversity of habitat features throughout the city. This will be done by creating habitat hubs, corridors, and sites. Hubs will be large (>10Ha) habitat areas for a diversity of species that help with wildlife dispersal and will provide refuge for species less tolerant of human disturbance. Sites will be small habitat patches (<10Ha) for species that are more tolerant of humans and may have smaller ranges of movement. Corridors will be linear habitat areas connecting sites and hubs to encourage movement between habitat areas. They will also allow wildlife to move without moving through human populated areas. Surrey’s optimal target is to establish and protect 90% of the proposed GIN area and increase populations of all species to greater than 20% of the baseline population.22
Surrey also means for the increased biodiversity and greenspace to provide ecosystem services for people. Ecosystem services can have economic, social, and cultural benefits. Plants and trees can filter air and soil of pollutants. Wetlands and trees reduce the impacts of runoff from heavy rains, and trees will also create shade to reduce the urban heat island effect. Surrey’s optimal target is to have 75% of the city’s land to be permeable and increase the tree canopy by over 40%. 23
21 City of Vancouver. (2019). Appendix E - Engagement Summary. Retrieved from Vancouver.ca: https://vancouver.ca/files/cov/one-water-engagement-summary.pdf
22 City of Surrey. (2011, April). City of Surrey Ecosystem Management Study. Retrieved from Surrey.ca: https://www.surrey.ca/sites/default/files/media/documents/EcosystemManagementStudy.pdf
23 Ibid.
Public Engagement
Surrey has had minimal public engagement so far but is planning to create school programs to educate about the GIN and the importance of biodiversity. Plans for elementary and high schools to have visits to natural areas are also in place, with a target of 4 visits per year per grade. To increase the awareness of the general public, Surrey has set a target to have more than 300 events per year to promote the awareness about biodiversity at all levels.
Surrey’s existing public engagement on biodiversity and the GIN is through community centres, with posts on news boards and information in locally distributed newsletters. Surrey also participated in a country-wide nature observation contest to increase biodiversity awareness and was able to gain 1,645 participants.
Green Infrastructure in Victoria
Victoria is also a municipality that is focused on stormwater management. The City of Victoria has begun using green infrastructure such as:
• Rain gardens
• Green roofs
• Bioswales
• Tree cells
• Permeable pavement
The City of Victoria is using green infrastructure with the goal of increasing their resiliency to extreme climate events, reduce the costs of infrastructure, and to keep their urban and natural environments healthy24 .
Victoria has strongly supported their stormwater infrastructure, passing legislation to turn it into its own utility with its own fees. Victoria’s stormwater utility incentivizes construction of green infrastructure on private property by offering credits and lower utility fees for residents with green infrastructure on their property.25 The size of the utility fee is dependent on the impact the property has on the stormwater system, calculated by the total size of impermeable surfaces on the property. Using municipality approved forms of green infrastructure can result in up to 50% off a resident’s utility fee.
Residents who implement green infrastructure reduce their property’s impermeable surfaces, lowering their utility fee. Residents who already had green infrastructure became eligible for a credit. Victoria further incentivizes green infrastructure on private land by offering rebates for installation costs. The City also has a rebate and credits program for Multi-Family, Business and Institutional Properties, which has resulted in a number of developers implementing green infrastructure.
24 City of Victoria. (2022). Stormwater Management. Retrieved from Victoria.ca: https://www.victoria.ca/EN/main/residents/watersewer-stormwater/stormwater.html
25 City of Victoria. (2022). Rainwater Rewards Program. Retrieved from Victoria.ca: https://www.victoria.ca/EN/main/residents/water-sewer-stormwater/stormwater/rainwater_rewards_program.html
Green Infrastructure in Kamloops
The following City of Kamloops’ bylaws and guidelines provide great support for the construction and protection of green infrastructure:
Tree Protection Bylaw provides strict guidelines and punishments for tree cutting and management in Kamloops. Tree cutting requires permits and site plans that must be approved by the city, and trees over five meters in height and 10cm in diameter cannot be cut down by citizens. The bylaw requires two trees to be planted for every tree cut down, and these replacements must be maintained for at least one year. As trees are a vital part of green infrastructure, this bylaw supports all currently planted trees in the city but also trees that may be planted in future as a part of any green infrastructure projects.
Urban Forest Management Strategy protects, enhances, and expands Kamloops’ urban forest. This strategy is built on the understanding that trees provide environmental, social, health and economic benefits. It sets goals to manage urban trees to maximize these benefits by updating existing standards and bylaws. The strategy recommends increasing the city’s tree canopy and encourages absorbent landscaping under trees. The use of green infrastructure such as bioswales or rain gardens can help meet these goals.
The Official Community Plan (OCP) has many guidelines that support the implementation of green infrastructure in the construction of public and private property. Kamloops’ OCP specifically mentions green infrastructure when discussing site designs, saying that new site designs must show the capacity for vegetation or green infrastructure, and encouraging green roofs on public buildings. The OCP lays down guidelines saying that site plans should have on-site stormwater management, which can be achieved by implementing bioswales, rain gardens, and other forms of green infrastructure. Site designs are also meant to be able to curb the heat island effect and enhance habitat values for animals. Bioswales and rain gardens are multi-functional and can meet all three guidelines. The OCP mentions that public sites should have landscaping where possible, which can be achieved through green infrastructure.
Chapter 2: Primary Research
SITE VISITS
Site visits were performed on multiple locations in Kamloops where GI had been implemented on public lands. These visits were done to determine the current condition of the GI in Kamloops and how well they have been maintained. Site visits of several streets were undertaken in October, and some follow-up visits were made to observe snowy conditions in November.
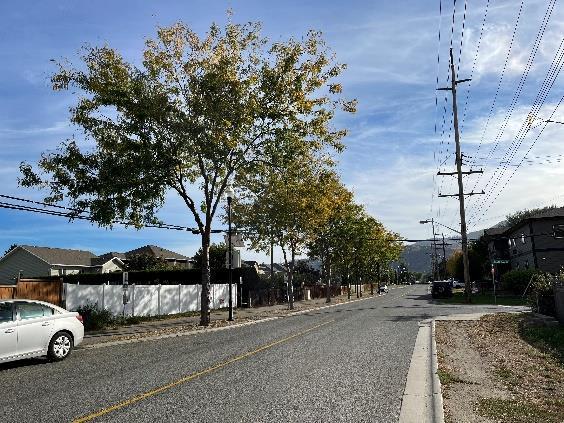
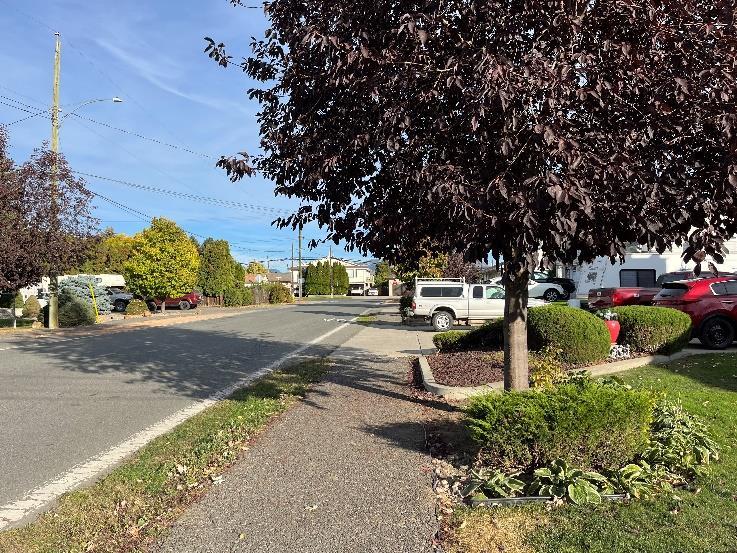
Site Visits – Singh Street
The green infrastructure on Singh Street consists of trees and a multi-use pathway. Singh Street was evaluated by a visual examination of the green infrastructure.
The trees on Singh Street looked to be in good condition, but there were several stretches where no trees were present –it was unclear whether there were gaps in where they had been planted or if some had not survived. There were no trees near the large field on Singh Street. The multi-use pathway had some basic signage, and we were unsure whether it was the typical width compared to current multiuse path standards.
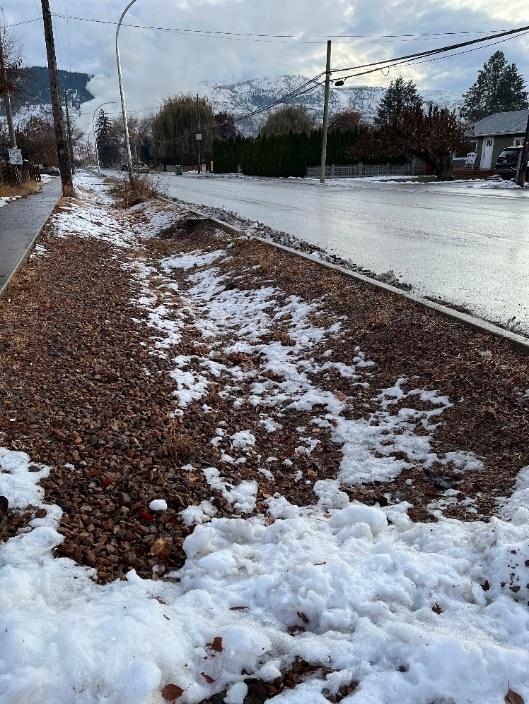
Site Visits – Windbreak Street
The Windbreak project began in 2014 and comprises the eastern section of Windbreak Street that intersects Parkcrest Avenue and Tranquille road. Rock pits, bioswales and trees were implemented to help with water drainage. Bioswales had curb cutouts for water to move in and swales with trees planted in them had the same species (calipers). Irrigation pipes were installed under bioswales to help with water drainage. Rock pits were filled with Arizona shale.
This site was evaluated in the fall by the number and conditions of the swales. The majority were grass swales (only two were gravel), which were quite deep but poorly maintained. Grass swales often had dead/dying grass, and the curb cutouts were clogged with weeds or other debris that could partially inhibit water drainage from the road into the swale. Some grass swales had high concentrations of weeds. There were few established trees, 4 on the north end and 2 on the south end. The trees were in good condition. In general, the swales were poorly maintained, but visual inspection alone could not determine their effectiveness.
The swales were observed again on November 14, 2022, to see the impact of snowfall. Swales on windbreak were filled with snow, but the cutouts were relatively unobstructed.
Site Visits – Fleetwood Avenue
The Fleetwood project comprises the portion of Fleetwood Avenue that intersects Crestline and Schreiner, on both sides of the street. The project began in 2009 and comprised rock pits, perforated drainpipes, a porous asphalt sidewalk and a landscaped boulevard, with the goal of improving drainage. The rock pits were installed with slotted covers and perforated barrels inserted in the pits (their appearance is similar to manhole covers), and the rock pits overflow into a nearby soccer field.
This site was evaluated primarily by resident interviews. The first interview on the western end of the street, returned significant detail on the results of the project. According to the first interviewee, who had lived there for several years prioir to the project implementation, Fleetwood used to flood every spring, with water coming up to the base of people’s homes, including their own. The interviewee
confirmed that no flooding has occurred at Fleetwood since the implementation of green infrastructure. They thought that the green infrastructure has made a big difference and the resident is18atisfyied with the work done. The resident did confirm that pooling did occur during heavy rain events in driveways, but also says that the pooling only occurs in front of two houses where the owners at the time of the project’s construction refused any green infrastructure in front of their home. The owners of these houses are no longer the same as when the project started.
The porous sidewalk is still working. The resident said that plant and trees were poorly chosen, and the city overspent on the trees planted as there were to many and they ended up removing about half of them. The resident also complained that the city does not do enough to maintain the street, and that there is a section of road that has been eroded down by six inches, which becomes a hazard during snowfall. The resident does maintain the porous sidewalk by shoveling and does do some maintenance of the landscaping.
The second interview on Fleetwood was on the eastern end of the street. The resident said that water used to flood the street up to his home before the green infrastructure project, and that it had not happened since. However, the resident believes that rainfall has not been heavy enough to really test the infrastructure. The resident confirmed that there had been no pooling on the road since the project was finished, but that there was still pooling at the corner of Fleetwood and Schreiner Street. The resident believes that the strip of grass placed between the sidewalk and road should be removed, as no one waters it, and it is not maintained by the city. The resident pruned a city tree once and was fined for tampering with city property. They removed the plants that were put by the City as they did not like the selection, and plant their own seasonal flowers there. They have continued to maintain some plants and a tree that are on city property.
Fleetwood is maintained by residents, with some periodic City maintenance of larger boulevard trees, but the infrastructure implemented has worked to reduce flooding.
Site Visits – Richmond Avenue
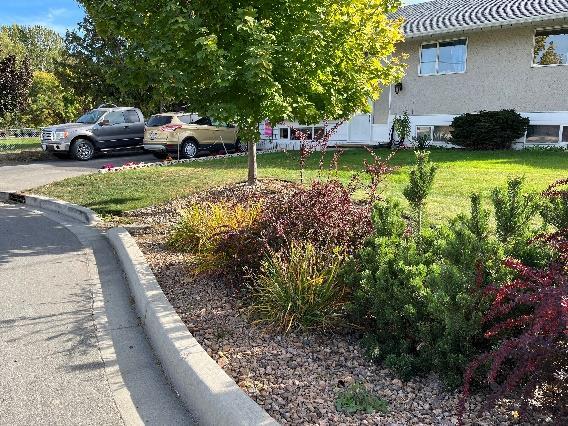
This project began in 2016. The purpose was simply to implement bioswales along Richmond Avenue, and the road was tilted slightly to one side to help water drain into the swales. Swales had a surface of sod and were filled with bush plants. Residents were given four trees to choose from for swales outside their homes: Tatarian maple, Japanese tree lilac, emerald queen maple, or shantung maple. Some swales were solely made of grass, by resident request. Swales have a curb cutout for water to drain into the swale. The individual swales were rated on a 5-point scale. A 5-point swale would have no weeds, clean curb cutouts, alive and healthy plants, many plants, and would be clean (no garbage thrown in). A 1-point swale would have many dead plants, many weeds, heavily clogged curb cutouts, and garbage strewn within the swale. One point was deducted for having a grass only swale, as they are less effective than plants for interception of water.
Most swales on Richmond were only somewhat well maintained. Many swales had weeds present, with some of the plants in the swale clearly dead or dying. Most grass only swales had grass dying or missing close to the curb, potentially from being driven and parked on by vehicles. Poorly maintained swales had clogged curb cutouts that could prevent water from entering the swale and had trash thrown within. A typical swale had a few dying plants, several healthy plants, some weeds and an unclogged curb cutout.
One resident was interviewed. This resident had not known the purpose of the swales until we informed them but had lived in the area long enough to remember the swales being constructed. The resident confirmed that no pooling occurs in the street or on any driveways. They had also observed that the swales effectively held onto water during storm events. The resident does maintain their swale, weeding it and watering the plants. The resident was satisfied with the swales and did not mention any improvements.
The swales in Richmond are acceptably maintained by the residents and are successful in reducing flooding and pooling.
Swales were observed on November 14, 2022. The swales were filled with snow and residents appeared to have shoveled snow from their driveways into the swales
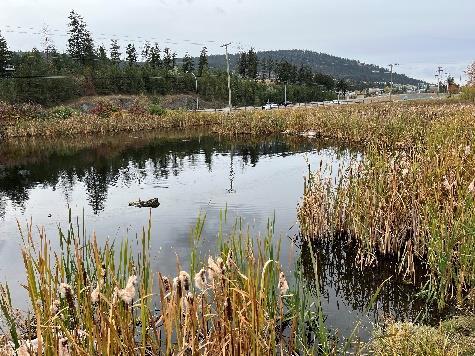
Site Visits – Dufferin Wetland
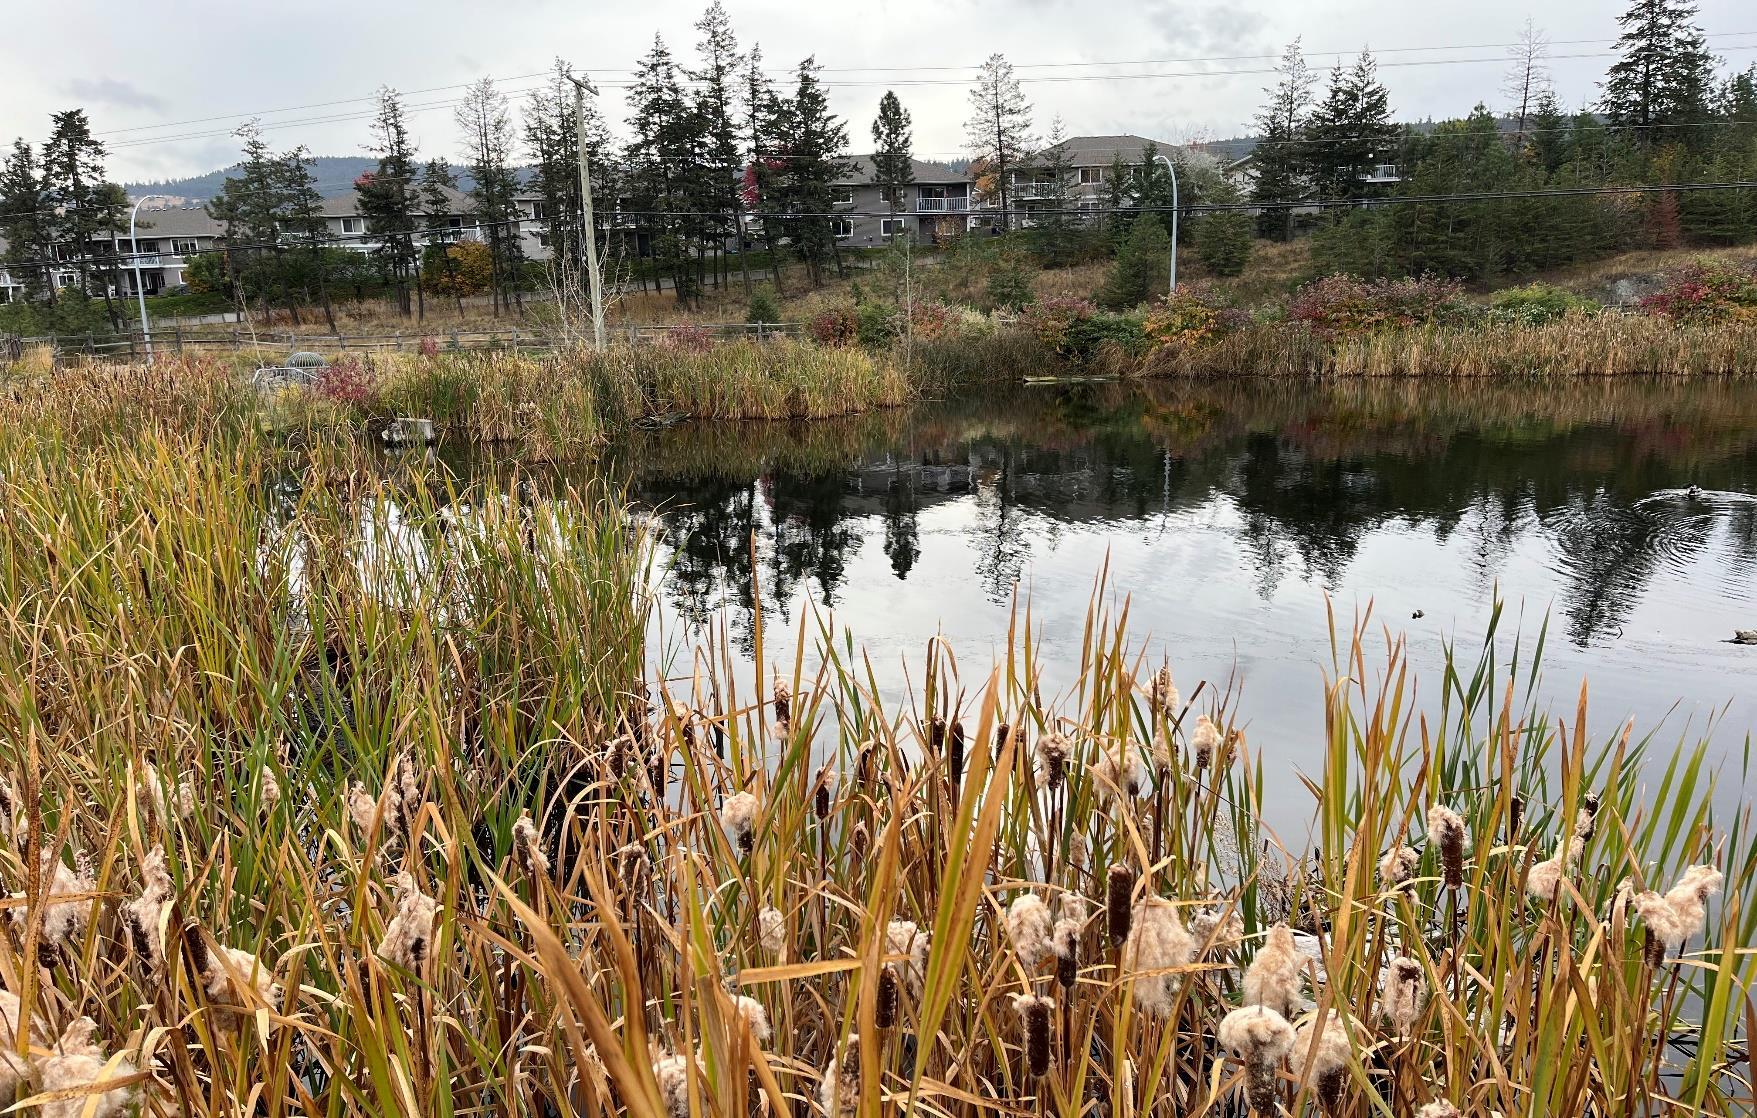
The Dufferin Wetland finished its restoration in 2016. The purpose was to restore the wetland that had previously existed in the 1800s and use it for stormwater retention. The wetland was evaluated by an interview with two Parks staff involved with the planning, implementation, and maintenance of the wetland. The wetland is supported by a supply of ground water and an inflow from a creek.
The wetland’s ecosystem is mostly untouched by humans; all animal life arrived naturally. The wetland has attracted ducks, geese, frogs, turtles, swallows, and a muskrat. The plant life includes cattails, shrubs, bullrushes, trees and sedges. The wetland is home to many invertebrate species as well and is estimated to be 10-15 feet deep at its deepest point. The wetland has been monitored by Thompson Rivers University for water quality and invertebrate diversity. It is a healthy, functioning ecosystem on par with natural ecosystems such as McQueen Lake. The wetland is closed off to
humans; it cannot be walked into/through, apart from for some supervised educational or scientific activities (i.e. taking water samples).
As a stormwater retention service, the wetland works very well. Before its restoration, the area below Dufferin used to flood during heavy rainfalls, with a notable flooding occurring in the Laval Crescent area in 2014. Since the wetland’s implementation, it has not flooded once, even during heavy rainfalls comparable to the one that occurred in 2014. The wetland acts as a natural sponge, absorbing stormwater, raising its own water level by multiple feet, and then slowly releasing the stormwater. Stormwater release can occur over 1-2 weeks and is released into the surrounding landscape. The released stormwater is filtered as well, having been tested and found to be a higher quality.
The wetland also has value for education and social purposes. The wetland is next to an elementary school and is used to educate the children on ecosystems and animals. TRU also uses the wetlands to take water and invertebrate samples for testing. Nature groups also make use of the wetlands, coming to help maintain it. The wetland has a trail that wraps around its borders and a covered picnic area, which attracts residents to use it for physical and social activity.
The Dufferin Wetland has been found to be a great success.
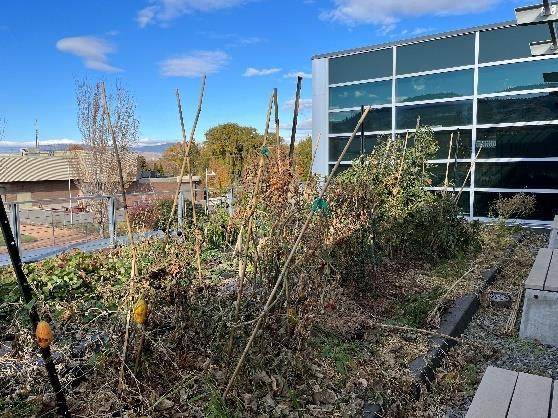
Site Visits – KCWQ
The Kamloops Centre for Water Quality was commissioned in 2005 and incorporated green infrastructure as part of the LEED Gold design. The KCWQ has a permeable pavement in the parking lot, a green roof and a wetland. The KCWQ was evaluated by an interview with the site’s chief operator.
The permeable pavement of the KCWQ has been in service since 2005 and still works. The pavement does absorb water, and during light rainfall events there is no pooling or run off. The pavement cannot handle heavy rainfall events. During heavy rainfall events, pooling of water and flooding of the parking lot has occurred on the western side of the parking lot, rather than draining to the drainage ditch north of the parking lot. It is possible that the pavement is clogged, as it has not been maintained since it was implemented. It is likely that maintenance of the pavement will result in better performance during heavy rainfalls.
The green roof has permeable tiles and drains installed, as well as irrigation. The permeable tiles are underlaid with gravel and other permeable materials to help with irrigation. The roof does not have any pooling of
water. The green roof was maintained until 2016 by Kamloops’ Parks department, when maintenance stopped, and the irrigation was disconnected. The green roof has not been maintained since then and has died, becoming mostly weeds. Some staff maintain a summer vegetable garden on one half of the green roof space.
The KCWQ wetland play a part in the KCWQ’s water treatment. During hot temperatures, less clean water is directed into the wetlands, where it has a resident time before flowing out. During normal and cold conditions, water recirculates in the plant before being directed out to the wetland. The wetland is maintained by Kamloops’ Parks department. Maintenance is reactive and consists of trimming plants to prevent any growth up the building. KCWQ operators also maintain the wetland. Their maintenance consists of clearing the wetland’s drain of obstructions. The wetland has never overflown or flooded. The wetland absorbs rainwater and wastewater from the plant well and has provided habitat for wildlife - mainly ducks and occasionally beavers. The wetland is not large, and the plants are densely packed.
The KCWQ’s green infrastructure has started to fail. While all green infrastructure still functions to some degree, the lack of maintenance has resulted in decreased effectiveness.
STAFF INTERVIEWS
City of Kamloops staff were interviewed to gain information on the implementation of previous green infrastructure projects in Kamloops, as well as recommendations for future projects. Three city employees (one design engineer and two utilities engineers) shared the benefits, challenges, and improvements to implementing green infrastructure in Kamloops, which are summarized below.
GREEN INFRASTRUCTURE TYPES
There are two main types of green infrastructure that have been implemented in Kamloops, retention and detention types. Retention green infrastructure holds water indefinitely with no piped outlet. This water is typically planned to be use through evaporation, evapotranspiration or infiltration. Detention green infrastructure holds water and slowly releases it, usually allowing the water to be used by surrounding vegetation.
GREEN INFRASTRUCTURE LOCATIONS
Several green infrastructure projects have been implemented in the Brocklehurst and North Shore areas of Kamloops. The land in these neighbourhoods is flat and these neighbourhoods lack stormwater piping, making them ideal for green infrastructure such as swales Sloped streets and some groundwater issues make it more difficult to implement swales in certain neighbourhoods, but other types of green infrastructure can be found on higher elevations. These are all the neighbourhoods with green infrastructure projects implemented:
Neighbourhood
Westsyde
Project
Swales
Mount Dufferin Dufferin Wetlands
Upper Sahali Gamble Pond
Brocklehurst Swales, Rock Pits, Permeable Sidewalk
North Shore Swales
Aberdeen West Highlands Pond
Juniper Ridge Dog Park (Doubles as detention pond)
BENEFITS OF GREEN INFRASTRUCTURE PROJECTS
Green infrastructure’s biggest advantage over typical pipe infrastructure is cost. Green infrastructure is:
• Cheaper to construct
• More cost effective
• Inexpensive to add into existing infrastructure plans
• Supportive of existing storm systems by taking up water and reducing stress on pipes
• Prevents upgrades for storm systems, saving money
• Aesthetically pleasing
Additionally, green infrastructure reduces the speed and volume of runoff during rain/flooding events. Citizens have also expressed an appreciation for bioswales, as they enforce a clear barrier between sidewalks and roads, making pedestrians feel safer.
CHALLENGES OF GREEN INFRASTRUCTURE
Green infrastructure implementation has some challenges as well. The most agreed upon challenges are that green infrastructure projects are not evaluated or maintained often enough. Homeowners sometimes not wanting, or removing, green infrastructure are also challenges. Effective green infrastructure sometimes must be replaced with less efficient green infrastructure due to homeowner pushback (for example, they want something more aesthetically pleasing). The geography of Kamloops can make green infrastructure implementation difficult, as some forms are not stable on sloped ground. Any green infrastructure relating to stormwater drainage into rivers requires provincial approval, which can set a project back by one year.
Other challenges include:
• Porous pavement could become ineffective if clogged with snow removal materials (grit, sand)
• Irrigation costs have gone up
• Green infrastructure projects are not consistent due to different plants being used, differing soil types, etc.
• The placement of underground utilities can make it difficult to use trees in some projects.
• Low funding for larger-scale green infrastructure projects
• Citizens could inadvertently damage unknown green infrastructure projects
• Educating citizens on green infrastructure requires dedicated staff capacity
• Hard to be aware of problems with implemented green infrastructure projects if citizens don’t complain about them
• Zoning bylaws can get in the way
• Hard to build green infrastructure projects proactively
GREEN INFRASTRUCTURE TRAINING IDEAS
The staff interviewed offered these ideas to increase green infrastructure training for employees:
• Training on the future impacts of climate change, the types of impacts, and how they can be mitigated, in particular that the frequency of intense rainfall events is expected to increase
• Additional knowledge sharing on what is available in terms of green infrastructure technology
• More training on the consequences of high summer water usage
IDEAS FOR IMPROVEMENTS
These suggestions were given to improve the implementation of green infrastructure in Kamloops:
• A stormwater/green infrastructure utility to allow for more autonomy
• Better incentives/harsher penalties for low/high water usage, and public education on the consequences of increased water usage
• More informed communication with citizens when green infrastructure projects are implemented and completed
• Non-potable water should be collected and reused when possible
• More proactive green infrastructure implementation
• Oil and grit separators as a part of green infrastructure projects, to reduce contaminants
RESEARCH SUGGESTIONS
The interviewed employees requested that these areas be researched for the sake of more efficient green infrastructure and green infrastructure implementation:
• Research into a link between water conservation, water meter usage, and stormwater volume
• Research into the different lenses different stakeholders have when viewing green infrastructure
• Research in the Liquid Waste Management Plan, its effect on the environment, and its perspective on water quality
• Evaluate green infrastructure projects implemented to date to determine what worked, what didn’t work, and how future green infrastructure should be handled
• Research the perspective citizens have on green infrastructure before and after its implementation in their neighbourhoods
LANDSCAPE ARCHITECT FOCUS GROUP
Introduction
A group of landscape architects and engineers who had experience working in Kamloops and those who had experience working across Canada were invited to participate in a focus group to provide insight on how landscape architects view and interact with green infrastructure in their projects. This focus group received three participants, who will be referred to as Participant A, B and C.
Demographics
Participant A: A landscape architect in Kamloops for the McElhanney engineering and land surveying firm. This participant also held a master’s degree and had published a study on trees as a part of stormwater GI.
Participant B: A landscape architect intern in Kamloops who has experience working for the City of Kamloops and other municipalities across Canada.
Participant C: An engineer for the McElhanney engineering and land surveying firm with a masters in Stormwater design and is the head of the GI department. Based in Vancouver
Use and Training in Green Infrastructure
All participants had courses on green infrastructure and its implementation as a part of their bachelor’s or master’s degrees. Some also took additional elective courses on GI design while working on their degrees. Participant B took every available GI course offered at their university. All participants sought out further professional training after obtaining employment, taking courses geared towards practicing professionals at SFU and the University of Victoria, as well as attending seminars on GI. The participants all began the use of green infrastructure in their projects at the beginning of their careers.
Green Infrastructure Use in Kamloops
When asked about what types of GI they had used in Kamloops, the participants all agreed that GI was difficult to use due to it not being a priority in many projects. In Kamloops, their projects have been primarily engineering focused with GI seen as an added layer. Participants agreed that supportive municipal policies and education were the biggest obstacles to an optimal implementation of GI in Kamloops. Many of their clients did not have full understandings of GI and its benefits, leading them to devote the least amount of time and money to its implementation. Participant B noted that GI that had already been included in the initial plans was often the first part of a project to be cut when saving time and/or money was necessary.
Participant B and C found that it was difficult to convince clients to add on GI during and after the planning stage of a project. Unless the municipality already had requirements for GI, clients would resist its implementation, seeing it as unnecessary. The participants agreed that when GI was implemented in a project, it was often as an added benefit of something they were already putting in, rather than the focus.
Benefits and Challenges of Green Infrastructure
Participants agreed that the greatest benefit of GI is that it often has co-benefits. Many forms of GI can provide multiple benefits for climate resilience, stormwater management, shade, aesthetic appeal, etc. Participant A emphasized that GI’s ability to synergize with existing grey infrastructure networks as a benefit. The participants agreed that green infrastructure increased the resale values of property in the area. Participants also noted that the presence of GI in a neighbourhood made it more walkable and bikeable.
When asked about the challenges of GI implementation, participants A and C said that competing for space with other departments was a large barrier. The participants said different departments are often competing for space for their own projects, and GI projects are often left behind. Completed projects also prevent GI construction, the participants agreed. As an example, participant A mentioned that having a boulevard that looks fit for street trees could not be used due to underground utilities. Participant A said that Kamloops sloped ground and arid climate also presents a challenge, as it makes it hard for plants to survive and increases maintenance needs.
Participants agreed that money and education are also massive challenges. Participant B mentioned that convincing clients that GI is worth the money is very difficult, as most people are unaware of the environmental and financial benefits. Participants agreed that many clients do not properly account for the costs and benefits of GI, and thus it is not considered as strongly as it should.
Participant C mentioned a good example from the City of Vancouver that is using soil cells, tree trenches to direct stormwater along, accompanied by educational plaques and permeable pavement for bike lanes. https://vancouver.ca/streets-transportation/richards-street-upgrades.aspx
Plant and Tree Selection
When asked about their selections for plants and trees, participants noted that it would be good to see more native plants, but that the preference of the client takes precedence despite the preferences not always being ideal. How difficult a plant is to maintain also affects plant choices, and the availability of plants – native plants are often not easily available. ‘Messy’ plants (i.e., a plant with fruits) often cannot be used as they increase maintenance.
Participant A emphasized the structure of trees for managing run off in a landscape as the largest deciding factor. Trees with a canopy and trunk structure that maximize water funneling to the ground are ideal. Participants A and B agreed that trees have the biggest benefits for GI and are the most visible GI structure. Trees are not good for filtration and should be accompanied by native shrubs as an understory. Participants agreed that trees should be selected first, as they take up the most physical space and often need to be planned around.
Clients and Green Infrastructure
Participants agreed that GI was unlikely to be brought up by clients during the design process unless using green infrastructure was strictly mentioned from the beginning (usually as a municipality requirement according to participant A). The participants all agreed that they would note opportunities as they saw them and bring them to the clients at the end of the project if there is space, time and money left over. This is unlikely unless the project is focused on GI and depends on the client’s attitude to GI.
Participants agreed that municipal clients will generally reject GI additions due to space and budget constraint, which are the two main reasons GI gets cut out of projects. Municipalities are generally unwilling to pay construction and/or maintenance costs. Municipalities may also cut GI if it has already been incorporated into the design due to conflicts with other departments.
Convincing clients to tweak existing plans is noted as being difficult. Participant B noted that clients often see the term ‘infrastructure’ and worry about costs, making convincing them of the benefits difficult. GI can generally only be added in if the construction costs are minimal. Participant C noted that bringing up the cost effectiveness of stormwater GI compared to conventional pipes can sometimes work and that some municipalities are realizing the enormous cost benefits of this approach.
When asked about GI maintenance and who is responsible for it, participant C said that there is generally an agreement in the contract that the contractor who installed the GI will maintain it for 1-2 years following construction. After the contract runs out, municipalities may maintain it themselves or contract it out again. Homeowners maintaining GI is questionable, as there are many variables that will influence whether a person will dedicate time to maintain something that does not always have easily visible benefits.
RESIDENT SURVEYS
Surveys were hand-delivered to homes on the streets of interest. Residents were provided with prepaid envelopes to send in completed surveys.
Fleetwood Avenue Survey Results
The surveys were delivered into the 24 homes on the north and south sides of Fleetwood Avenue. There was one in-person survey conducted.
Of the 24 households, 11 (46%) responded to the survey. All respondents were homeowners, and three (27% of) respondents had moved into the neighbourhood after the green infrastructure had been added. 73% of respondents were aware of the purpose of the green infrastructure prior to the survey.
Graph 1: Resident’s Observed Frequency of Flooding on Fleetwood Avenue Pre and Post Implementation of Green Infrastructure.
When participants were asked whether they noticed flooding or pooling of water still occurring, 36% responded ‘yes’. Pooling of water was noted to still occur at the corner of the intersection between Fleetwood and Schreiner. One resident had not answered this question.
Graph 2: Resident’s Frequency of Maintenance of Boulevard Landscaping
• 73% of respondents maintain the landscaping on a weekly or bi-weekly basis • 18% rarely or never do maintenance
Graph 3: Resident’s Perceived Difficult of Maintenance of Boulevard Landscaping
• 55% of residents find it relatively easy or easy to maintain the landscaping
• 36% find it somewhat difficult or difficult to maintain; 9% do not maintain it.
Graph 4: Resident’s Satisfaction Levels with Project Components
City's Communication at time of Project Implementation
Overall Green Infrastructure Project
Permeable Sidewalk
Plants/Trees used in Landscaping
• 80% of respondents were satisfied or very satisfied with the City’s communication at the time of the project
• Only 30% were satisfied or very satisfied with the overall project, and 40% were very dissatisfied or dissatisfied with it
• 50% of respondents were satisfied or very satisfied with the permeable sidewalk
• Only 20% were satisfied with the plants/trees selected, and 40% were very dissatisfied or dissatisfied with them
Survey Comments
Participants of the survey were asked to elaborate on their satisfaction/dissatisfaction with the project components.
Project component Reasons for high satisfaction Reasons for low satisfaction
Plant/tree selection - aesthetic appeal - ease of maintenance - plants/trees difficult to maintain - too much of the maintenance responsibility falls on the homeowners - the City does not do enough maintenance
Permeable sidewalk - the permeable sidewalk’s ability to withstand the weather and remain unbroken since its implementation
Overall Project - aesthetic appeal of the plants and trees used in landscaping, - 7 (64%) of participants strongly disliked the grass strip implemented. Participants expressed that it was difficult and not worth the effort of maintaining
Highlights
• The survey results indicate that the implementation of green infrastructure on Fleetwood Avenue has been successful in decreasing flooding frequency, with 8 out of 11 participants indicating that they have never seen flooding since its implementation 15 year ago.
• Residents also have a high level of effort put into maintaining the green infrastructure, with nearly three quarters of participants performing weekly or bi-weekly maintenance and a combined 55% of participants finding maintenance to be easy or relatively easy.
• Satisfaction with the plant/tree selection leans towards dissatisfied/neutral, as 64% of participants dislike the need for maintenance.
• Satisfaction with the permeable sidewalk is high, but satisfaction with the overall project is lower, likely due to the maintenance required by residents.
Richmond Avenue Survey Results
The survey was delivered to the 16 homes on the south side of Richmond Avenue. Of the 16 households, 9 (56%) responded to the survey. Eight respondents were homeowners, and one was a renter. Four (25%) of respondents had moved into the neighbourhood after the green infrastructure was implemented. Only two (22%) of respondents knew the purpose of the green infrastructure prior to the survey.
Gravel Only 0%
Gravel with trees/plants 78% Grass only 11% Grass with trees/plants 11%
Gravel Only Gravel with trees/plants Grass only Grass with trees/plants
• 89% of swales had trees and plants, with 78% having gravel and 11% (1) having grass
• 11% (1) of swales had grass only
Graph 1: Types of Swales Present on Richmond Avenue
Graph 2: Resident’s Observed Frequency of Flooding on Fleetwood Avenue Pre and Post Implementation of Green Infrastructure
2-5 times/year
Once/year or less
When participants were asked if they noticed pooling of water still occurring, 44% of respondents said ‘yes’. Respondents indicated that pooling still occurred on the south side of the avenue. One resident did not answer this question.
3: Resident’s Frequency of Maintenance of Swales
• 78% of respondents maintain swales on a weekly or bi-weekly basis
• 22% of respondents maintain swales on monthly basis
Graph
Graph 4: Resident’s Perceived Difficulty of Maintenance of Swales
• 67% of respondents found maintenance to be easy or relatively easy
• 33% of respondents found maintenance to be difficult or somewhat difficult
Graph 5: Resident’s Satisfaction Level with Project Components
Overall Green Infrastructure Project City's Communication at time of Project Implementation
Plants/Trees used in Landscaping
• 5 out of 9 respondents were satisfied or very satisfied with the City’s communication regarding the project; 3 residents did not live on Richmond Street at the time of the project in 2016 and 1 respondent was very dissatisfied.
• 7 out of 9 respondents were satisfied with the overall project; one respondent did not answer, and one respondent was very dissatisfied.
• 6 out of 9 respondents were satisfied or very satisfied with the plant/tree selection; 2 were dissatisfied and 1 had not plants or trees.
Survey Comments
Participants of the survey were asked to elaborate on their satisfaction/dissatisfaction with the project components.
Project component
Reasons for high satisfaction
Reasons for low satisfaction
Plant/tree selection - aesthetic appeal - low maintenance - too many plants - too few trees - low city maintenance
Overall Project - aesthetic appeal of the swales - usefulness in keeping water off the street - easily maintained - swales are too susceptible to weeds
Highlights
• The survey results indicate the swales on Richmond Avenue were unsuccessful at reducing flooding, with 6 out of 9 respondents indicating that they have observed flooding since the project’s implementation.
• Richmond Avenue has a high level of resident maintenance, with 78% of respondents performing weekly or bi-weekly maintenance and 67% of respondents finding maintenance to be easy or relatively easy.
• Respondents are highly satisfied with the green infrastructure project, with 7 out of 9 respondents indicating satisfaction with the overall project and 6 out of 9 respondents being satisfied with the plant/tree selection.
Windbreak Street Survey Results
The survey was delivered to the 21 homes on the east side of Windbreak Street. Eight households (38%) responded to the survey. All respondents were homeowners, and four (50% of) respondents had moved into the neighbourhood after the green infrastructure had been added. 25% of respondents were aware of the purpose of the green infrastructure prior to the survey.
Graph 1: Types of Swales Present Adjacent to Participants’ Homes on Windbreak Street
Grass with trees/plants
Only 50%
Gravel with trees/plants
Only Gravel with trees/plants Grass only Grass with trees/plants
• 50% of the swales on Windbreak had only gravel
• 37% of the swales had only grass, and 13% of swales had grass with trees/plants
• There were no swales on Windbreak that had gravel and trees/plants
Graph 2: Residents’ Observed Frequency of Flooding on Fleetwood Avenue Pre and Post Implementation of Green Infrastructure
5+times/year
2-5 times/year
Observation Frequency of Flooding
Once/year or less
Gravel
Gravel
When participants were asked whether they noticed flooding or pooling of water still occurring, 50% responded ‘yes’. Pooling of water was noted to still occur inside of the swales after heavy rains (as is their intended function), and at the swale’s curb access when obstructed. One resident did not answer this question.
Graph 3: Resident’s Frequency of Maintenance of Swales
• 63% of respondents maintain swales on a weekly or bi-weekly basis
• 37% of respondents rarely or never do maintenance
Graph 4:
Resident’s
Perceived Difficulty of Maintenance of Swales
Windbreak Street Difficulty of Maintenance
• 12% of respondents find it easy to maintain the swales
• 51% of respondents find it somewhat difficult or difficult to maintain
Graph 5: Resident’s Satisfaction Level with Project Components
Plants/Trees used in Landscaping
Dissatisfied
Neutral
Satisfied
Very Satisfied
N/A
No Answer
• 25% of respondents were very dissatisfied with the City’s communication at the time of the project; 50% of respondents were either neutral or did not live in the neighbourhood at the time.
• 38% of respondents were neutral towards the overall project, and 50% were either dissatisfied or very dissatisfied with it.
• 50% of respondents did not have any plants or trees in their swales, and 50% of respondents were dissatisfied or very dissatisfied with the plant/tree selection.
Survey Comments
Participants of the survey were asked to elaborate on their satisfaction/dissatisfaction with the project components.
Project component
Reasons for high satisfaction
Reasons for low satisfaction
Plant/tree selection - ease of maintenance - plants/trees difficult to maintain - plants/trees are messy
- not enough City maintenance
Overall Project - aesthetic appeal of the swales
- usefulness in keeping water off the street
- usefulness as a place to dump snow shoveled off sidewalks and driveways
- 100% of respondents dislike the need for maintenance
- 25% of respondents dislike that the swales limit street parking
Highlights
• The survey results indicate that the implementation of green infrastructure on Windbreak Street has had mixed success in decreasing flooding frequency, with 4 out of 8 respondents indicating that flooding has not been seen since its implementation.
• Windbreak street has a high level of resident maintenance, with 63% of respondents maintaining the green infrastructure on a weekly or bi-weekly basis.
• Maintenance on Windbreak Street is seen as difficult by residents, with 51% of respondents indicating that maintenance is somewhat difficult or difficult.
• Reception to the green infrastructure is mixed on Windbreak Street, with 50% of respondents leaning towards dissatisfied or very dissatisfied.
• 38% of respondents indicated that the difficulty of maintenance is in part due to children from the nearby school damaging the swales by throwing garbage in them and riding bike through the swales.
River Road Survey Results
The survey was delivered to 7 homes on the west side of River Road. 3 households (43%) responded to the survey. Two respondents were homeowners, and one was a renter. Two respondents had moved into the neighbourhood after the green infrastructure’s implementation. Two respondents were aware of the green infrastructure’s purpose prior to the survey. All swales on River Road are gravel swales with trees/plants.
Graph 1: Resident’s Observed Frequency of Flooding Pre and Post Implementation of
Infrastructure
When participants were asked if they noticed flooding or pooling of water still occurring, two responded with ‘yes’. Pooling of water was noted to still occur on the sidewalk on the east side of the street.
2: Resident’s Frequency of Maintenance of Swales
• There is an equal split between respondents who perform maintenance weekly, monthly and rarely.
Graph
Graph 3: Resident’s Perceived Difficulty of Maintenance of Swales
• The majority (67%) of respondents find maintenance to be difficult.
Graph 4: Resident’s Satisfaction Level with Project Components
Overall Green Infrastructure Project City's Communication at time of Project Implementation
Plants/Trees used in Landscaping
Dissatisfied
Very Satisfied
N/A
No Answer
• Respondents are equally split between dissatisfaction and neutrality towards the City’s communication when the project was implemented 6 years ago.
• Respondents are equally split between dissatisfaction, neutrality, and satisfaction towards the overall project.
• 2 of the 3 respondents were satisfied or very satisfied with the plant/tree selection.
Survey Comments
Participants of the survey were asked to elaborate on their satisfaction/dissatisfaction with the project components.
Project component
Reasons
for high satisfaction
Reasons
for low satisfaction
Plant/tree selection - aesthetic appeal - low maintenance - not enough City maintenance - too much resident maintenance
Overall Project - aesthetic appeal of the swales - usefulness in keeping water off the street - not enough City maintenance - too much resident maintenance
Highlights
• Survey results indicate the swales did not succeed in reducing flooding with 2 of 3 respondents observing flooding after implementation of green infrastructure.
• Respondents on River Road find maintenance to be difficult.
• Respondents on River Road are satisfied with the plant/tree selection.
• Respondents are split on being satisfied and dissatisfied with the green infrastructure project.
Chapter 3: Recommendations
RESEARCH RECOMMENDATIONS
• Consult residents before implementing green infrastructure to gain insight on resident preferences for trees and plants.
• Research the perspectives and education held by citizens and developers on green infrastructure
• Research the conditions of City neighbourhoods prior and after green infrastructure construction to determine what can be improved on
• Research into the different perspectives of stakeholders on green infrastructure.
• Research plants native to Kamloops that can be used in green infrastructure and their availability.
• Investigate the effectiveness and maintenance needs of permeable pavements during winter weather conditions
• Investigate the construction plans of previous green infrastructure projects in Kamloops to help develop standards and guidelines for future projects.
RECOMMENDATIONS FOR CITY STAFF TRAINING
• Increased training on the effects and causes of climate change.
• Training on water usage and its consequences.
• Enrollment in online green infrastructure and stormwater courses at the following universities: UBC, SFU, and the University of Victoria.
• Research into online certifications regarding green infrastructure training.
POLICY RECOMMENDATIONS
• The creation of a stormwater utility
• Increased incentives and disincentives for low-and-high-water use
• New bylaws setting standards and guidelines for the use of green infrastructure in Kamloops
• New bylaws giving green infrastructure higher priorities when conflicting with other bylaws (such as zoning bylaws).
• Research incentives for residents and developers to construct green infrastructure on their property
• Research incentives for residents to maintain green infrastructure implemented by the City.
• Look to incorporate green infrastructure in related plans (plans for parks, urban forests, etc.)
• Run bulk purchasing programs for rain barrels
• Require continued City maintenance on all City constructed green infrastructure projects for a minimum 3-year period.
• Look into public events to increase education on the value of green infrastructure.
• Use existing or future green infrastructure projects as ‘display’ pieces for developer and homeowner education.
• Increase funding for green infrastructure projects.
GI CONSTRUCTION RECOMMENDATIONS
• Install irrigation in swales (this can be temporary until plants are established e.g. 3 years)
• Increase the use of trees in applicable forms of green infrastructure to maximize co-benefits
• Maximize the use of native plants in green infrastructure
• Research and use species that offer the most co-benefits (shade, pollinator friendly, aesthetic appeal, low maintenance, etc.)
• Construction of non-potable systems on City buildings to increase the collection and reuse of non-potable water.
• Require the use of oil-and-grit separators in green infrastructure projects.
• Increase the use of permeable pavement on City property, including integration with active transportation infrastructure.
• Increase the use of green roofs on City property
• Plan trial projects for the use of green infrastructure not implemented in Kamloops, such as:
o Blue roofs
o White roofs
o Blue-green roofs
o Green walls
o Rain gardens
o Soakways
o Floodable spaces
o Planter boxes
CONCLUSION
The use of green infrastructure in Kamloops has a promising future. Future green infrastructure projects can greatly help Kamloops achieve the Community Climate Action Plan’s Big Move 8: Healthy Urban Ecosystem and increase Kamloops’ progress towards achieving climate and sustainability goals. The greatest obstacle to green infrastructure’s success in Kamloops has been a lack of maintenance and public awareness of its value. Public education, the creation of bylaws and the use of incentives will allow the City of Kamloops to use green infrastructure to its greatest effect in securing a green future.
REFERENCES
Boston, A. (2022, July 5). Cities need to embrace green innovation now to cut heat deaths in the future. Retrieved from TheConversation: https://theconversation.com/cities-need-toembrace-green-innovation-now-to-cut-heat-deaths-in-the-future-185101
City of Kamloops. (2017, December 12). A Bylaw For the Managment and Protection of Trees Within the City of Kamloops. Retrieved from kamloops.civicweb: https://kamloops.civicweb.net/document/73525/BL_501.pdf?handle=7B8690AD14664B2FA81EE748E982404D#:~:text=No%20Person%20shall%20 Cut%20Down,Boulevards%20or%20other%20City%20Lands
City of Surrey. (2011, April). City of Surrey Ecosystem Management Study. Retrieved from Surrey.ca: https://www.surrey.ca/sites/default/files/media/documents/EcosystemManagementStudy.pdf
City of Surrey. (2014, October 20). Plan Surrey - Official Community Plan. Retrieved from Surrey.ca: https://flipbook-surrey-ca.cld.bz/Official-Community-Plan-Bylaw-No-18020
City of Surrey. (2022). Biodiversity Conservation in Surrey. Retrieved from Surrey.ca: https://www.surrey.ca/renovating-building-development/land-planningdevelopment/environmental-protection/biodiversity
City of Surrey. (2022). Citizen Science. Retrieved from Surrey.ca: https://www.surrey.ca/renovating-building-development/land-planningdevelopment/environmental-protection/biodiversity-conservation/citizen-science
City of Surrey. (2022). Official Community Plan. Retrieved from Surrey.ca: https://www.surrey.ca/renovating-building-development/land-planning-development/landuse-planning/official-community-plan
City of Vancouver. (2019). Appendix B - GRI Typologies. Retrieved from Vancouver.ca: https://vancouver.ca/files/cov/one-water-gri-typologies.pdf
City of Vancouver. (2019). Appendix E - Engagement Summary. Retrieved from Vancouver.ca: https://vancouver.ca/files/cov/one-water-engagement-summary.pdf
City of Vancouver. (2019, October 8). Appendix F - Transformative Directions and Action Plans Retrieved from Vancouver.ca: https://vancouver.ca/files/cov/one-water-action-plans.pdf
City of Vancouver. (2019, November 5). Rain City Strategy. Retrieved from Vancouver.ca: https://vancouver.ca/files/cov/rain-city-strategy.pdf
City of Victoria. (2022). Rainwater Rewards Program. Retrieved from Victoria.ca: https://www.victoria.ca/EN/main/residents/water-sewerstormwater/stormwater/rainwater_rewards_program.html
City of Victoria. (2022). Stormwater Management. Retrieved from Victoria.ca: https://www.victoria.ca/EN/main/residents/water-sewer-stormwater/stormwater.html
City of Victoria. (2022). Stormwater Utility. Retrieved from Victoria.ca: https://www.victoria.ca/EN/main/residents/water-sewer-stormwater/stormwater/stormwaterutility.html
Ciy of Kamloops. (2018, April 17). Official Community Plan (KAMPLAN) Bylaw No. 46-1. Retrieved from kamloops.civicweb: https://kamloops.civicweb.net/filepro/documents/10752/?preview=82296
Conway, T. M., Khan, A., & Esak, N. (2020, December). An analysis of greeninfrastructure in municipal policy: Divergent meaning and terminology in the Greater Toronto Area. Retrieved from ScienceDirect: https://www.sciencedirect.com/science/article/abs/pii/S0264837720302064
Demuzere, M., Orru, K., Heidrich, O., Olazabal, E., Geneletti, D., Orru, H., . . . Faehnle, M. (2014, December 15). Mitigating and adapting to climate change: multi-functional and multi-scale assessment of green urban infrastructure. Retrieved from ScienceDirect: https://www.sciencedirect.com/science/article/pii/S0301479714003740
Diamond Head Consulting. (2014, January). Biodiversity Conservation Strategy. Retrieved from Surrey.ca: https://www.surrey.ca/sites/default/files/media/documents/Surrey_BCS_Report.pdf
Drescher, M., & Mollame, L. (2020, June 17). How investing in green infrastructure can jump-start the post-coronavirus economy. Retrieved from TheConversation: https://theconversation.com/how-investing-in-green-infrastructure-can-jump-start-the-postcoronavirus-economy-139376
European Environment Agency. (2022). Green Infrastructure. Retrieved from European Environment Agency: https://www.eea.europa.eu/themes/biodiversity/green-infrastructure
Government of British Columbia. (2022). Adaptation, resilience and disaster mitigation program. Retrieved from gov.bc.ca: https://www2.gov.bc.ca/gov/content/safety/emergencymanagement/local-emergency-programs/financial/ardmp
Government of British Columbia. (2022). Investing in Canada Infrastructure Program - British Columbia - CleanBC Communities Fund. Retrieved from gov.bc.ca: https://www2.gov.bc.ca/gov/content/transportation/funding-engagement-permits/fundinggrants/investing-in-canada-infrastructure-program/green-infrastructure/cleanbc-communitiesfund
Government of British Columbia. (2022). Investing in Canada Infrastructure Program - British Columbia - Green Infrastructure - Environmental Quality. Retrieved from gov.bc.ca: https://www2.gov.bc.ca/gov/content/transportation/funding-engagement-permits/fundinggrants/investing-in-canada-infrastructure-program/green-infrastructure/environmental-quality
Government of Canada. (2022, October 12). Green infrastructure programs. Retrieved from Canada.ca: https://www.nrcan.gc.ca/climate-change/green-infrastructure-programs/19780
Green Municipal Fund. (2018). Case Study: Okotoks proves natural stormwater management works. Retrieved from Green Municipal Fund: https://www.victoria.ca/EN/main/residents/watersewer-stormwater/stormwater/rainwater_rewards_program.html
Kim, J. (2018). Exploring green infrastructure benefits at house and neighborhood scale: case study of Illinois, USA. Landscape and Ecological Engineering, 165-174.
Matsler, M. A., Meerow, S., Mell, I. C., & Pavao-Zuckerman, M. A. (2021, October). A 'green' chameleon: Exploring the many disciplinary definitons, goals, and forms of "green infrastructure". Retrieved from ScienceDirect: https://www.sciencedirect.com/science/article/pii/S0169204621001080
McLean, A. (2021, August). Tree Protection Bylaws in British Columbia. Retrieved from Raincoast.org: https://www.raincoast.org/wp-content/uploads/2021/08/tree-protectionbylaws-in-bc-2021.pdf
MNAI. (2018, February). Towards a Collaborative Strategy for Municipal Natural Asset Management: Private Lands. Retrieved from MNAI.ca: https://mnai.ca/media/2021/10/reportmnaifeb7.pdf
Municipal Natural Assets Initiative. (2022). About MNAI/What is Green Infrastructure? Retrieved from MANI.ca: https://mnai.ca/what-is-green-infrastructure/
Municipal Natural Assets Initiative. (2022). Developing Levels of Service for Natural Assets. Retrieved from MNAI.ca: https://mnai.ca/media/2022/01/MNAI-Levels-of-Service-Neptis.pdf
Nieuwenhuijsen, M. J. (2021). Green Infrastructure and Helath. Annual Review of Public Health, 317328.
Ontario Green Infrastructure Coalition. (2021). What Is Green Infrastructure? Retrieved from Green Infrastructure Ontario Coalition: https://greeninfrastructureontario.org/what-is-greeninfrastructure/
Town of GIbsons. (2021). Gibsons Natural Asset Management Journey. Retrieved from Gibsons.ca: https://gibsons.ca/sustainability/natural-assets/gibsons-natural-asset-management-journey/
United States Environmental Protection Agency. (2022, March 31). What is Green Infrastructure? Retrieved from EPA: https://www.epa.gov/green-infrastructure/what-green-infrastructure
Zbigniew, G. J., McPhearson, T., Matsler, M. A., Groffman, P., & Pickett, S. T. (2022). What is green infrastructure? A study of definitions in US city planning. Frontiers In Ecology and the Environment, 152-160.