

2018 Community Health Assessment
Amarillo
Executive Summary
COMMUNITY HEALTH ASSESSMENT: FINDINGS AND RECOMMENDATIONS
Background
Community health assessments have been used for years in health care sectors to highlight community issues and consider possible solutions for the gaps identified. In 1996, the Institute of Medicine noted that “assessment” was a core public health function and should be pursued by local health departments1. The Public Health Accreditation Board (PHAB) has also noted the importance of community health assessments (CHA) as an underpinning and required element of accrediting local health departments to provide a testament to quality and effective agency.2
In the summer of 2018, the City of Amarillo Department of Public Health (COADPH) commissioned AscentHealth Consulting (AHC) to perform a CHA using commonly accepted research methods of collecting information. These methods included a random-digit dialed telephone survey, analyzing trends by comparing similar data from prior years’ surveys, reviewing existing secondary data sources, convening focus groups and polling key informants for opinions on health/access/priorities. Once these activities were completed, AHC summarized all data into cogent, concise recommendations for moving forward with project planning. This CHA is designed to provide focus for solutions that will impact community health metrics over time. These recommendations and subsequent efforts will require commitment and community consensus: hospitals, providers, government, nonprofit agencies and private industry must all collectively address these areas of concern. Stakeholders must work together to leverage existing and future resources, whether they are financial or human capital.
In this report, AHC is providing both findings of our research efforts and our recommendations on areas of concern. These concerns should drive the current and future healthcare prioritizations of the Amarillo/Potter/ Randall communities.
Collection Methods and Research Design
To accomplish the mechanics of this CHA, several instruments were designed and implemented to gather the necessary data. These instruments were created to provide both qualitative and quantitative metrics. These instruments included:
• Random-digit dial telephonic survey (using national Behavioral Risk Factor Surveillance System as well as locally-directed questions for comparison from prior surveys)
• Key informant survey (an emailed instrument to community leaders for input)
• Focus groups (interviews with end users of the health care system within Amarillo)
• Community health data scan (secondary, publicly available data review)
These tools provided the needed data to accurately and uniquely show the current “snapshot” of Amarillo’s health and the challenges that exist. These challenges, once identified, begin to describe areas of concern— issues that must be confronted to improve the health of Amarillo.
CHA Findings and Areas of Concern
The following findings are a summary of areas of concern—metrics and indicators that are negatively compared to either previous baseline data or state and national comparators. Many of the assessed data points are positive and/or show improvement when compared to other counties, Texas or the U.S. These data are all included in the CHA and can be referenced both in the 2018 study, as well as previous studies.
Areas of concern, however, are highlighted in this Findings and Recommendations Report. Populations “at risk”, comparative rankings, and statistical increases or decreases when compared to the margin of error are all discussed as priorities requiring focus and intervention. The areas of concern show assessed community health weaknesses to be considered and addressed by stakeholders. In many communities, these areas of concern are the basis and beginning point for a community health improvement plan (CHIP).
Community Health Data Scan - Areas of Concern
County Health Rankings3 show significant disparity between Potter and Randall Counties
• Table below shows published rankings for reporting Texas counties for 2018 using published datasets to populate listed indicators.
• Data examples include mortality, healthcare providers per capita, teen pregnancies, STD/STI rates, employment, education and many others.
• The higher the number, the worse the indicator ranked against Texas counties.
• Ranking system described in County Health Ranking publications is below:
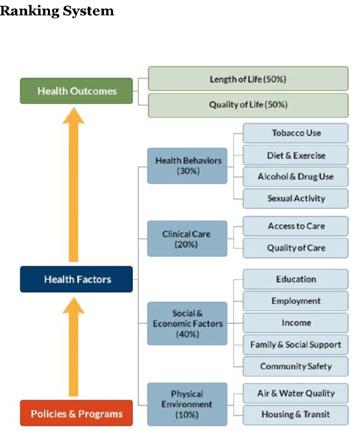
This chart compares rankings of Potter and Randall counties among the 254 counties in Texas, by indicator. (Lower number indicates more positive ranking.)
Random Digit Dial Telephone Survey - Areas of Concern
General state of health is fair or poor
• 24% of respondents are “at risk” as “fair” or “poor”, reported worse than Texas at 22.2% and US at 17.7%.
Obesity is increasing
• 70.5% of respondents report being overweight or obese (higher than Texas at 68.6% and the US at 64.6%.
• Obesity self-report increased from 29% in 2013 to 37% in 2018.
Diabetes is increasing
• 21% have been or are currently diagnosed with diabetes in the Amarillo area in 2018 compared to 10.5% in the US and 15.5% in Texas in 2015.
• Residents reporting diabetes in the Amarillo area increased from 11% in 2013 to 21% in 2018.
Reports of Heart Attack are increasing
• 8% reported having had a heart attack in the Amarillo area compared to 4.3% in US and 6.1% in Texas.
• Resident reports doubled from 4% in 2013 to 8% in 2018.
Reports of Stroke are increasing
• 6% reported stroke diagnosis in Amarillo area compared to 3.1% in US and 4.9% in Texas.
• Amarillo area reported 2% in 2013; 6% in 2018.
Reports of Smoking are increasing; attempts to quit are decreasing
• 47% “at risk” for having smoked 100 or more cigarettes, compared to 40.7% in US and 39.2% in Texas.
• Personal smoking cessation efforts are decreasing: 44% denied attempts to quit smoking in 2013; 63% denied attempts in 2018.
Reports of Pap test history are decreasing
• 92% reported history of pap test in 2013 survey; decreased to 83% in 2018.
• 8% in 2013 reported no test; doubled to 16% in 2018.
Respondents’ reports of seeking mental/behavioral health services increasing
• 12% of respondents reporting seeking mental health services in 2013; increasing to 17% in 2018.
Responsibilities for caregiving for elderly is increasing
• 10% of residents reported caregiving responsibilities in 2013, and this number increased to 14% in 2018.
Reported prenatal care for those pregnant (in last five years) is very low:
• 72% reported no prenatal care for their own pregnancy or the pregnancy of a household member occurring in the past five years.
• More research is needed to confirm this number.
Key Informant Survey - Findings
Overall health rating by respondents:
• 2.74/5 score reported as a Likert scale rated between “Neutral” and “Less Healthy”
Ranking of top three agency/organizations responsible for providing health solutions:
1. Government agencies
2. Nonprofit organizations
3. Hospitals
Top three populations’ healthcare needs not being addressed adequately:
• Mental/behavioral health patients
• Un-/under-insured
• Low-income
Top three health issues facing the community:
• Mental/behavioral health concerns
• Substance abuse
• Obesity (tie)
• Access to care (tie)
Risk factors (top three) to be changed or modified
• Lack of health education
• Mental/behavioral healthcare access challenges
• Nutrition and physical activity
Resources needed to address risk factors
• Additional health education
• Affordable care access
• Governmental financing for community health
• Community collaboration
Top 3 most important health issues facing children
• Primary care access
• Access to mental/behavioral health services
• Nutrition/physical exercise
Top 4 children’s health issues, ranked
1. Food insecurity/hunger
2. Access to care
3. Access to mental/behavioral health (tie)
4. Teen pregnancy (tie)
Top 4 pediatric healthcare specialists needed in Amarillo
• Counseling/psychology
• Psychiatry
• Neurology
• Pulmonology
Top 3 most important health issues facing adults (ages 19-64)
• Obesity
• Mental/behavioral health
• Access to care
Top 3 adult health issues, ranked
1. Access to health insurance
2. Access to primary care
3. Access to mental health services
Top 3 adult healthcare specialists needed in Amarillo
• Counseling/psychology
• Psychiatry
• Neurology
Top 3 most important health issues facing senior adults
• Access to primary care
• Chronic disease prevention and treatment
• Mental/behavioral care access
Top 3 senior adult health issues, ranked
1. Access to primary care
2. Chronic disease prevention and treatment
3. Food security/nutrition
Top 3 senior adult healthcare specialists needed in Amarillo
• Gerontology
• Counseling/psychology
• Navigation specialist
Top 3 OVERALL health issues and priorities to be addressed in next 1-3 years
• Mental/behavioral healthcare access
• Affordable access to care
• Substance abuse
Focus Groups - Findings
Un- and Under-insured Residents
• Access to care is a reported concern.
◦ “I can’t get in to the doctor for days, so I go to the ER.”
• Insurance is difficult to obtain.
◦ “This is a wealthy country. Everyone should have insurance.”
• Education on existing resources appears lacking.
◦ “Make information available about programs, like flu shots, sooner. I watch the news. I don’t buy the newspaper. A lot of things we find out by word of mouth, but it’s often the wrong information.”
◦ “I live on the north side. A lot of things are not advertised there. They don’t target the 79107 area. We miss a lot of information. I would like to have more information about medical care and meetings in the community.”
Mothers of Pre-term or Low-birthweight Babies
• Access to care and navigation challenges persist.
◦ “I didn’t know anything.” (4 women agreed with this statement.)
◦ “I didn’t get prenatal care until I was six months pregnant. I was young and scared.”
◦ “I didn’t find out I was pregnant until I was seven months.”
◦ “I got care at five months.”
◦ “A lot of people don’t know about these community programs. Many are income-based and people don’t think they will qualify. Head Start, for example.”
◦ “WIC has a program for parents of 3- to 4-year-olds that people don’t know about. I wish I had known about it.”
◦ “I wish I had been given more postpartum information.”
◦ “The Nurse/Family Partnership helps educate you in the first year of the baby’s life. It’s only for first-time moms. It’s helpful.”
• Health education, and particularly sex education, is a topic of concern.
◦ “Everyone makes mistakes. People judge you for your mistakes.”
◦ “More education for fathers and what to do – especially teen dads.”
◦ “More open about birth control. Kids should be able to go to their parents for help.”
◦ “We need more education about STDs and HIV. People don’t know you can get these even if you’re on birth control.”
◦ “People need to know how to have the birth control / sex conversation. Growing up, that was offlimits in my home.”
Substance abusers/opioid users group:
• Addiction is complex and resources are scarce.
◦ “I was addicted to opioids for eight years. My entire family’s addicted to opioids. It’s still an active addiction with them. And I’ve got almost six months clean. They just took over. It took over my entire life. So, I’m glad we’re here.”
◦ “I’ve been a user for 23 years. I’ve been clean and sober for five now – five months. I’ve just been in and out of treatment centers and stuff like that to try to cope with the – what I’ve been struggling with.”
◦ “I had several different programs, but the one that has stuck and the most recently helped is I went through the ARAD program. The one that they had for me for the shelter and not the new one. I also got help at Narcotics Anonymous and Another Chance House. So, those three programs are what worked for me.”
• Substances, illegal and legal, are readily accessible.
◦ “Go to the doctor. Go to the Emergency Room. Go to the local corner house. Go to the guy in the car – wherever.”
◦ “I was about 15. Experimenting with them, you know. Basically, I was raised around drugs. Not to put it off on nobody, but I mean, the mindset was easy access. I didn’t have to go anywhere else to get it. And then that just escalated into this becoming my lifestyle. Then, I basically turned to the streets to find comfort. It just became my lifestyle, you know. I graduated from the streets to prison, of course. Being in prison, you learned more, coped with different people, and just gradually educated. It was the lifestyle.”
Substance abuse professionals:
• Opioids can be a gateway drug; escalation is frequent.
◦ “I have a female in the jail that started opioids when they were prescribed by a doctor. Her use went up the chain until she was a full-blown addict on other stuff. I see long-term heroin use in some males that have been in and out of the jail for decades. One started heroin at age 15.”
◦ “When they start, it’s oxycodone or marijuana, then they move up the chain. Then, one to two times with meth and they’re done (addicted). With heroin, I know one guy who started when he
was hanging out with a friend smoking marijuana and someone gave him a hit of heroin. He was 15 and has been addicted ever since.”
Refugee/Immigrant population:
• Mental/behavioral health concerns exist in Refugee communities too.
◦ “TPC (Texas Panhandle Centers) is great. But sometimes people don’t feel safe talking to a case manager or there’s a communication barrier and people get the wrong idea.”
◦ “Depression is just thought of as sadness. People in my culture tell you you’re fine. At Catholic Charities, we have a plan if we know a refugee has a problem when they come here.”
◦ “People (refugees) worry that the interpreter may not keep their information confidential. It may take two or three sessions to gain trust.”
◦ “There’s shame about telling people what they’ve been through. Makes it harder to find out what is going on.”
◦ “In one case, the person was depressed, had PTSD, had been tortured and had many mental health problems. Although he was twitchy, he said, ‘I’m OK because I’m here now and I’m safe.’”
• Health education, particularly around nutrition, is needed for refugee communities.
◦ “ The health department does a great job with home visits, screenings, immunizations. It’s all good.”
◦ “We need to approach each group with pieces of information. Maybe a group lecture at churches in a flexible setting. Have people within the communities invite others, rather than the case manager inviting them.”
◦ “Here, we use our car a lot, but where I came from everyone walked everywhere – to the grocery store, to the post office. There’s a lack of places here where you walk with others. Now I walk my neighborhood. I encourage others to go to the park, the zoo and the canyon – to be in nature. People miss that from home. Sports are good for young people. We need to have fun and don’t just worry. When you get a job it takes up most of your time.”
◦ “There is more meat here, and more vegetables where I came from. People get chubbier here with an American diet.”
◦ “A lot of refugees like the sugary snacks here. The ingredients in the drinks here are not the same as they had back home – they are worse for you here. But they love the sweet and attractive drinks and how plentiful they are. The food here is mostly processed. We cook meat with corn flour here and fresh vegetables are hard to get here.”
Endnotes
1 Institute of Medicine. 1988. The Future of Public Health. Washington, DC: The National Academies Press. https://doi.org/10.17226/1091
2 PHABoard Accreditation Standards and Measures. Retrieved on September 8, 2018. URL: http://www.phaboard.org/accreditation-process/public-health-department-standards-and-measures/
3 County Health Rankings comparison tool. Retrieved on September 8, 2018. URL: http://www.countyhealthrankings.org/app/texas/2018/compare/snapshot?counties=48_375%2B48_381
Community Data Scan
COMMUNITY DATA SCAN
Background
This chapter of the community health assessment (CHA) includes information consisting of secondary data (publicly available) for background and context. This information is vital as it provides additional insight when combined with the primary data collected (telephone survey, key informant and focus group data) to paint a larger picture. A community health scan or “environmental scan” is a snapshot of other assessment sources outside of this sampling frame but provides other organizations’ summaries and results to broaden the overall understanding of health metrics, both quantitative and qualitative.
While intended to be thorough and inclusive, this data scan is not exhaustive but represents the commonlyreferenced and known assessments available to City of Amarillo Public Health Department. Any omissions or reports not referenced are accidental and inadvertent.
Methods and Results
The community health scan method for secondary data collection includes national, state and local data sets that are performed annually or on an assessment cycle and are readily available on the internet for reference. These datasets are reviewed from reputable sources to include national governmental sites, statewide agencies and local non-profit organizations. Each data source was reviewed for summary and conclusive statements regarding each assessment project. Data sources included in this CHA are:
• County Health Rankings
• United Way Community Status Report
• UT Population Health Infant Mortality Rates
Researchers review each dataset for outliers or metrics that fall outside averages across other years or trends. The outliers are reported and highlighted to illustrate potential areas of concern or negative trends. Priority concerns are noted and discussed as potential areas of concern requiring community action for improvement.
County Health Rankings Summary
The County Health Rankings (CHR) report is an annual report using standardized, publicly available data points to objectively and quantitatively measure the health of every county in the United States (see Appendix A for link to CHR comparison data). This report is sponsored and funded by the Robert Wood Johnson Foundation, the largest public health philanthropic organization in the U.S. The research is performed by the University of Wisconsin and is recognized as a premier health measure report.
Table 1 is a comparison, using the web query tool on the CHR, of Potter and Randall Counties with the Texas metrics included. Each data set referenced has either a percentage, number or rank for each metric and is crossreferenced with the selected county or Texas.
Several indicators listed in Table 1 are of concern when comparing Potter to Randall counties. These differences are stark and highlight vastly different health outcomes based on county of residence. To begin, the health outcomes ranking (among 254 Texas counties) for Potter County is 200 versus the Randall ranking of 27. Health behaviors rankings again with a dramatic difference, Potter being much worse: 238 vs. 29. Rates of smoking, obesity, sexually-transmitted diseases and teen births are all more prevalent in Potter residents with statistically
significant differences. Potter County has more uninsured and more instances of preventable hospitalizations than Randall. With the exception of preventable hospitalizations, Potter trends listed above are all worse than the Texas average.
These examples illustrate true disparity and underscore the need to focus on the northern portion of the Amarillo Metropolitan Statistical Area (MSA) targeting public health interventions for those most at risk.

TABLE 1. COUNTY HEALTH RANKING COMPARISON OF POTTER, RANDALL AND TEXAS.

United Way Report: Health
The United Way (UW) of Amarillo and Canyon conducts community needs assessments and releases them to the public for review and consideration (see Appendix A for 2017 Community Status Report link). These are used particularly for guidance in potential grant programs and projects funded by the agency.
The UW focuses on three main areas of concern: education, health and income instability. For the purposes of this CHA, only the health topics and data trends are included. Additional details on the other focus areas can be found at https://www.unitedwayama.org/sites/unitedwayama.org/files/United-Way-Community-Status-Report2017-final.pdf
The UW report hit several highlights that contrast Potter and Randall counties’ health metrics. Of particular note to UW was cancer, heart disease and stroke, diabetes, and first trimester care for expectant mothers. As an example, cancer rates are tracked and reported to compare between Potter and Randall counties while benchmarking against other communities, along with statewide data. Statewide data is somewhat aged as the years lag—these data points are from 2011-2015. Figure 1 below shows total cancer rates for both Potter and Randall counties are worse than Texas and almost always higher than Lubbock.

FIGURE 1. CANCER DEATHS IN TEXAS AND POTTER, RANDALL, AND LUBBOCK COUNTIES.
Heart disease and stroke metrics don’t fare much better. In Figure 2 we see that both heart disease and stroke rates are higher than Texas and Lubbock (excepting Lubbock in 2014) with Potter rates again much higher than the comparators. Rates in Potter County, along with Texas, rose for three years in a row.
FIGURE 2. HEART DISEASE AND STROKE DEATH RATES—POTTER, RANDALL, LUBBOCK AND TEXAS.

Diabetes as a chronic condition is of concern for many reasons. While it can be a controllable chronic condition, many who suffer with diabetes ignore the long term effects which can ultimately lead to death. While diabetes attacks all socioeconomic strata, ethnicities and other social determinants, death rates in Potter continue to highlight disparity, as seen below in Figure 3.
Another metric reported by UW is first trimester prenatal care for expectant mothers. Prenatal care is important to introduce in the first trimester to improve birth outcomes. Many industrialized nations use prenatal care as a predictor of the communities’ overall health status. UW identified risk when comparing first trimester prenatal care in Figure 4. Potter County ranked lowest in care received in the first trimester; Randall ranked highest with Texas and Lubbock in between. Again, we see the graphic representation of health disparity between the two counties. In Randall County, almost 75% of mothers receive needed care in the first trimester, but Potter lags at only just over 50%.
FIGURE 3. DIABETES DEATH RATES—POTTER, RANDALL, LUBBOCK AND TEXAS.

FIGURE 4. FIRST TRIMESTER CARE—POTTER, RANDALL, LUBBOCK AND TEXAS.

UT Population Health Infant Mortality Report
The University of Texas Center for Population Health recently released a web-based geographic information system (GIS) searchable map with underlying data on infant mortality rates by zip code. This dataset is derived from all birth records in Texas from 2011-2015 and is reported in infant mortality rate as deaths per 1,000 live births. These rates are a compilation of all years in the reported range. The rates are also broken into ethnicity of “All”, “White”, “Black”, “Hispanic”. The reported state of Texas average rate for the timeframe is 5.48 deaths per 1,000 live births.
The following graphs are the zip codes within the Potter/Randall/City of Amarillo area that exceed the state average for infant mortality. As illustrated below, several zip codes with several ethnicity subsets are of concern, sometimes as much as triple the state rate of infant mortality.
Zip Code 79102
The area just north of I-40, east of downtown Amarillo has an overall infant mortality rate above the state average. Figure 5 shows the mortality rate at 6.73 per 1,000 live births with all ethnicities showing concerns for infant mortality.
5: 79102 ALL

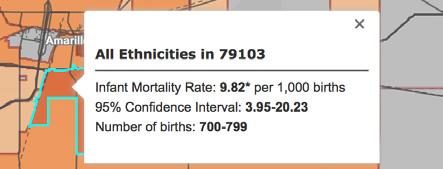
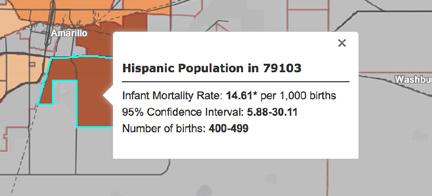
Zip code 79103 (Figure 6) has a much higher mortality rate than the state average; at 9.82 it is not quite double the Texas rate. This is for all ethnicities. Figure 7 shows the disparity for the same zip code for Hispanic residents at almost triple the state average (14.61 per 1,000 births).
6: 79103 ALL
FIGURE
FIGURE
The 79104 zip code is the area northeast of downtown Amarillo. This area shows an 18.36 rate for all ethnicities, almost 3.5 times the state rate. When looking at Hispanic deaths in Figure 9 for the same zip code, the rate lowers to 15.05, still much higher than the Texas average.


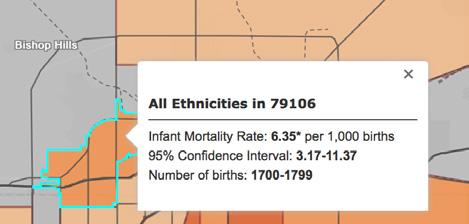
When considering the western portion of the city of Amarillo in zip 79106, the overall infant mortality rate is just slightly higher than the state average, registering at 6.35 for all ethnicities. Figure 10 shows this rate along with a large cohort of births in the sample.
FIGURE 7: 79103 HISPANIC
FIGURE 8: 79104 ALL
FIGURE 9: 79104 HISPANIC
FIGURE 10: 79106 ALL
The 79107 zip code, while not as starkly disparate as other Amarillo MSA zips, shows a higher rate when compared to Texas for every ethnicity reported. Black, Hispanic, and White all have higher infant mortality rates than the state average in this zip. While not as high as other zip comparators in the Amarillo area, it is of concern that each ethnicity shows disparity. Figures 11-14 outline the applicable rates, confidence intervals and numbers of births across the sample timeframes.
FIGURE 11: 79107 ALL
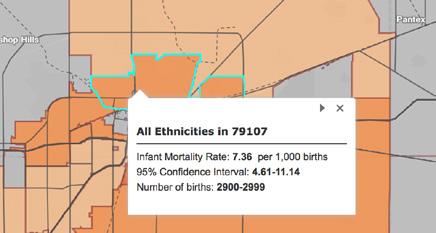
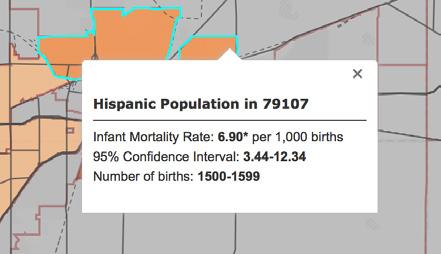
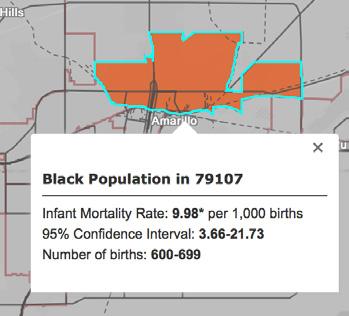

FIGURE 12: 79107 HISPANIC
FIGURE 13: 79107 BLACK
FIGURE 14: 79107 WHITE
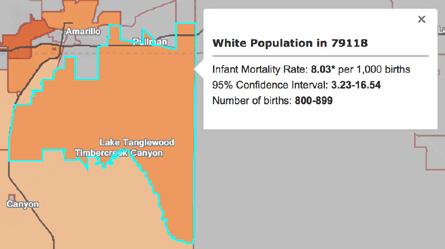
Figures 15 and 16 show the 79118 zip code representing southern portions of Potter county and the northern portions of Randall county. The “All ethnicity” designation is 7.44 per 1,000 births, with white ethnicity showing 8.03 per 1,000. This is one of the few instances where the white sample increases over the average.
FIGURE 15: 79118 ALL

FIGURE 16: 79118 WHITE
2017 Annual Texas STD Surveillance Report
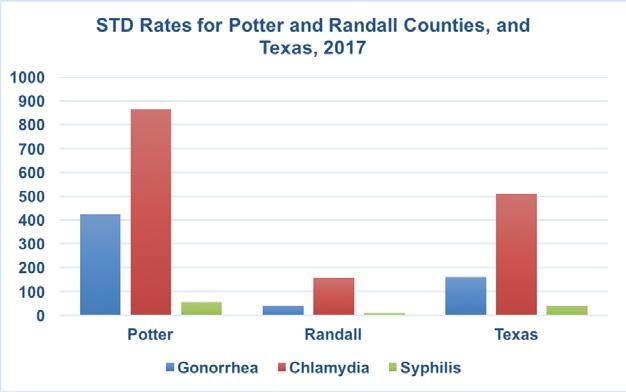
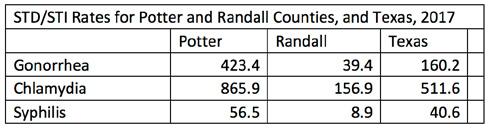
Every year, the Texas Department of State Health Services publishes a report regarding STD surveillance for every county in the state. That surveillance is based on reporting by laboratories, healthcare facilities and individual physicians to the state health department. Of note, the report records both total numbers of cases as well as case rates. Rates are used to understand the prevalence of disease compared to other populations, not just the level of incidence in a single group. As such, the following graph (Figure 17) illustrates the case rate for the three reported STDs in Texas, Potter and Randall counties. The rate is calculated as the number of cases per 100,000 population.
Figure 17 shows that Potter county continues its disparity in cases of STDs when compared to Texas and Randall County.
FIGURE 17: STD RATES FOR POTTER/RANDALL/TEXAS, 2017
Data Scan Conclusion
This data scan illustrates several disparities outlined by community data sources. These sources, while publicly available, have been summarized and reviewed for outlier or identified areas of concern based on statistical or generalized information. This review is intended to capitalize on the previous community efforts, categorize prior conclusions or observations and leverage prior investment to propel the overall community health assessment process for COADPH and stakeholders. This data scan is not meant to be exhaustive, but indicative of prevalent concerns from prior and current sources.
Telephone Survey
Survey Dates: June 11-29, 2018
Table
Table
Table
Table 82:
Table
Table 85:
Table
Table 87:
Table 88:
Table 93:
Table
Table
INTRODUCTION
The City of Amarillo Department of Public Health (COADPH) designed this telephone survey using prior survey instruments and convening a survey committee to review, edit and approve the focus areas and specific questions to be asked. This 2018 survey was conducted from June 11-29, 2018 and follows a similar design of previous surveys conducted by the University of North Texas Survey Research Center (see Appendix B for complete survey questionnaire). The results of this survey are intended to provide an analysis of health indicators of residents living in the larger statistical area of Potter and Randall counties, as well as the City of Amarillo, Texas. Prior community health assessment (CHA) surveys are referenced in this project to assist in baseline analysis and provide trends over time. Some historical questions are repeated and included as a comparison with prior years’ survey results. This survey also cites comparisons to national and state surveys conducted by the Center for Disease Control (CDC) where available.
Specific areas and topics covered by this telephone survey include:
• Access to health care;
• Treatment patterns and experiences for both children and adults;
• Residents’ health status, and;
• Residents that are labeled as “At Risk.”
The report is divided into five sections:
1. Introduction
2. Methodology
3. Sample Characteristics
4. Findings
5. Conclusions
The telephone survey portion of this CHA serves as a primary data collection instrument to randomly assess the resident population regarding the selected health indicators. Limitations to this survey include a limited number of questions researched due to cost of survey method, limited time for each participant to complete the survey and the increasing cost of mobile number liss available to researchers. Another limitation is the difference between some timeframes of questions: For instance, some questions were asked nationally in prior years, but not 2018. When applicable, prior survey years are noted when compared to 2018 data. In lay terms, the questions are “apples to apples,” but the apples were picked, on occasion, from different seasons.
METHODOLOGY
Sample
The primary objective in drawing the sample was to get a representative sample of Potter and Randall County residents as a whole. We estimate that 39 percent of the residents of Potter County and 39 percent of the residents of Randall County live in a household where a respondent could not be contacted via a landline and therefore, the contracted surveyors called both landlines and cell phones to reach those who cannot be contacted through landline telephone. It was therefore important that both landline and cellphone sampling frames were used in this study.
A random digit dialing (RDD) methodology was used for each sampling frame. RDD was used as the method of sample generation because it offers the best coverage of active telephone numbers, and it reduces sample bias. The RDD method ensures that unlisted telephone numbers will be included in the sampling frame, and the sample will be as current as possible, thus maximizing the probability that new residents will be included. While initial quotas were set to be reflective of the adult population, some weighting was applied to different groups in order to ensure accuracy.
Phone numbers for the cell phone frame were dialed manually to comply with FCC regulations.
Questionnaire
The survey instrument for the 2018 survey was designed by COADPH staff, the community health assessment (CHA) committee, and compared to previous instruments. The instrument used in the 2018 survey incorporated many of the questions used in the 2007, 2010 and 2013 survey so that comparisons of the results of the two surveys could be made. Some questions from 2013 were removed to make room for additional questions that were added. The Behavioral Risk Factor Surveillance System (BRFSS) is commissioned by the CDC for nationwide rollout. Since several of the questions in this questionnaire were copied directly from the BRFSS, it offers an opportunity to compare several local findings to state and national findings, although not every question can be compared by the same sampling year (See Appendix A for a copy of the questionnaire).
Data Collection
The contractor’s trained interviewers administered the survey. Training for all interviewers consisted of three basic elements. First, interviewers were informed about details of the survey. Such items such as the reasons for doing the survey, the concept of a random sample, and the administration of the survey were discussed. Second, telephone-interviewing methods were presented. The interviewer’s approach, methods of conducting and interview, interviewing problems, and standard procedures were covered. Finally, the trainees were familiarized with the questionnaire. Each question was discussed and the specific instructions on the questionnaire were explained. The interviewers were provided with written material on the interviewing process, and they were instructed to conduct several practice interviews.
All interviewing was conducted from the contractor’s telephone bank in Salt Lake City, Utah. An experienced telephone supervisor was on duty at all times to supervise the administration of the sample, monitor for quality control, and handle any other contingencies. Shifts of interviewers were used throughout the day and evening, both weekdays and weekends. Telephone numbers in the sample were tried, at most, six times (deleting bad numbers or Do Not Call requests), from noon local time until 9 p.m. all on different days of the week. Numbers were re-randomized daily and after each pass, where we then updated the calling schedule. Interviews were conducted between June 11 and June 29. When examining the household status, a number of cellphone only, landline only and dual-use households were interviewed. The classification was an important component of the weighting methods described in the next section.
*Due to rounding, numbers may not add up perfectly
Analysis and Reporting
The data file was analyzed using SPSS. All findings are weighted findings and sample sizes unless noted otherwise. Frequency distributions for each survey questions and demographic characteristics were developed and reported. Cross-tabulations of each question by selected demographic characteristics were then calculated.
The data are presented in tabular form with some descriptive comments and only preliminary interpretation and evaluation. The objectives were to secure overall perceptions and to identify particular health concerns for detailed evaluation by COADPH and the community at large. The analysis of the data involved two steps. First, the observed frequencies or percentages for each question were calculated. These frequencies are displayed in the report as the percent responding “yes” or “no” or “excellent,” “good,” “fair,” or “poor” to a question.
Upon completion of the first step, each question was then cross-tabulated with the eight descriptive characteristics indicated below. In order to ensure enough responses for valid cross tabulations, demographic categories with a small number of responses were combined with other categories where noted below:
• Age
• Gender
• Ethnicity (Asian, Native Hawaiian/Other Pacific Islander, American Indian/Alaska Native, and Other were combined)
• Language of the interview
• Have children under 18 living in the household
• Education (less than high school and some high school were combined)
• Income (two highest categories were combined for comparison purposes
• County
The eight characteristics comprise a set of independent variables that could help to explain variations among the responses of the respondents. In those instances where differences between demographic groups were statistically significant, the findings are detailed in tables or in text. If no demographic differences are discussed, one can assume that there were no differences between demographic groups on the question addressed.
As a final note on the demographic characteristics: the tabulated numbers might not always add up to 100% because different respondents are weighted differently to accurately mimic the population of Amarillo. This makes results and analysis more precise and reliable when estimating the overall population of Amarillo. We weight surveys based on age, gender, area, zip code, ethnicity, etc. That weighting can magnify or minimize response counts when “drilled down” to demographic breakdowns of questions. While this is a researched, wellestablished scientific approach to survey data collection, the percentages can add to less than 100% on certain questions.
SAMPLE GROUPS
SAMPLE CHARACTERISTICS
FINDINGS
Access to Health Care
Question 2: General Health
FIGURE
1: RESPONDENT STATE OF HEALTH (2007-2018)

TABLE 1: PERCENT AT RISK - GENERAL STATE OF HEALTH
• Respondents were asked about the general quality of their health and whether they considered it to be: excellent, very good, good, fair, or poor. Respondents who said that their health was fair or poor were labeled as “At Risk.”
• Compared to the national (17.7%) and statewide average (22.2%), Amarillo Service Area (24%) has a slightly higher proportion of residents that are “At Risk.”
• 75% of Amarillo residents cite their health as good or better, with 17% of residents citing their health as Excellent, 29% as Very Good, and 29% as Good. About 25% of Amarillo’s residents fall into the “At Risk” group, with 8% of residents citing their health as Poor and 16% citing their health as Fair.
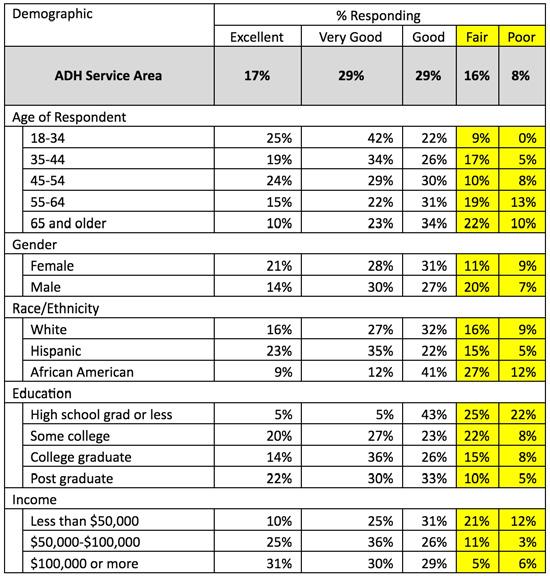
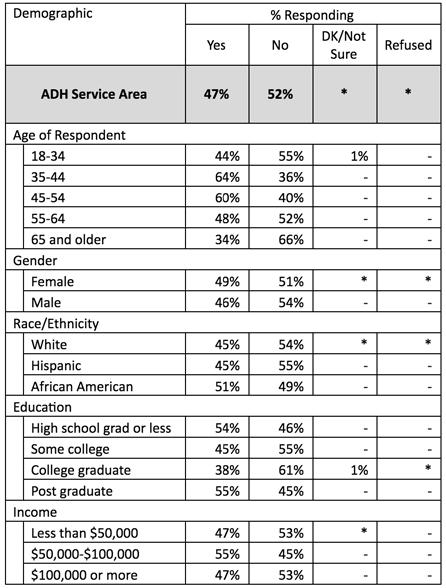
TABLE 3: TOP “AT RISK” GROUPS - STATE OF HEALTH
• The percentage of respondents who reported that their health was either Fair or Poor (“at risk”) decreased as education and income increased, and generally, increased as age increased. The highest groups reporting that their health was either Poor or Fair were high school grads or less education (47%), African Americans (39%), and respondents making less than $50,000 annually (33%).
Question 3: Do you have Health Coverage?
FIGURE 2: HEALTH CARE COVERAGE (2007-2018)

TABLE 4: PERCENT AT RISK - HEALTH CARE COVERAGE
• Respondents were asked if they had Healthcare Coverage. Respondents who said they did not have healthcare coverage were labeled as “At Risk.”
• 84% of Amarillo Service Area residents cited that they do have healthcare coverage, while only 14% of the residents stated that they did not have healthcare coverage.
• Compared to the national (12.1%) and state (14.5%) average, Amarillo (14%) has a relatively similar proportion of residents that are considered “At Risk” for healthcare coverage.
• The groups that were most likely to be considered “At Risk” for a lack of healthcare coverage were 18-34-year-olds (35%) and Hispanics (31%).
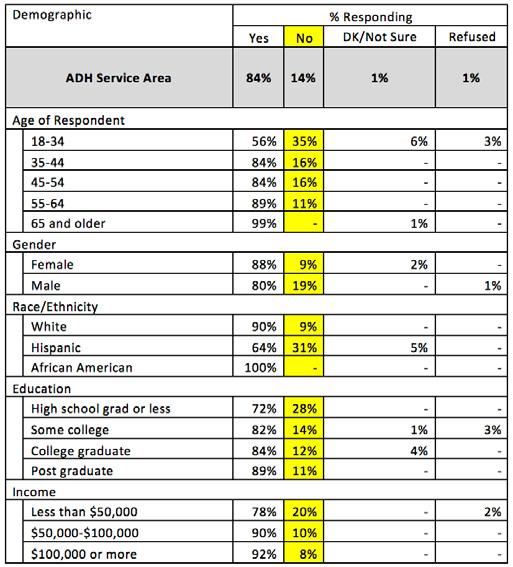
TABLE 6: TOP “AT RISK” GROUPS – HEALTH CARE COVERAGE
Question 4: Primary Health Insurance Provider (n=340)
TABLE 7: AMARILLO PRIMARY HEALTH INSURANCE PROVIDER BY DEMOGRAPHIC
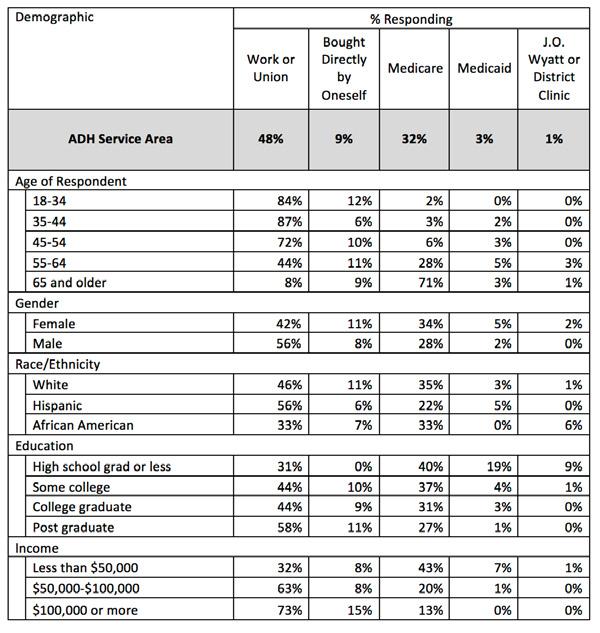
• Respondents that said they had healthcare coverage were then asked who their healthcare provider was. 48% of residents said that they receive their healthcare coverage from Work or a Union, and 32% of residents stated that their healthcare coverage is provided through Medicare.
Question
5:
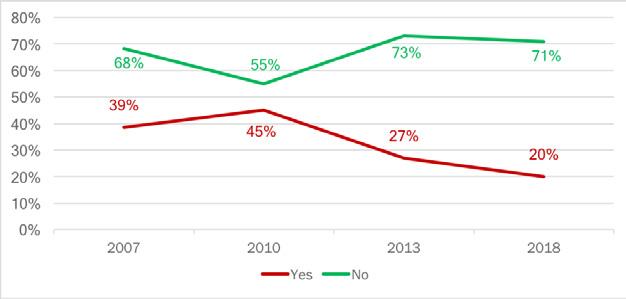
Do you have one person you think of as your primary physician?
FIGURE 3: PRIMARY PHYSICIAN (2007-2018)

• Respondents were asked if they have one person that they consider to be their primary physician.
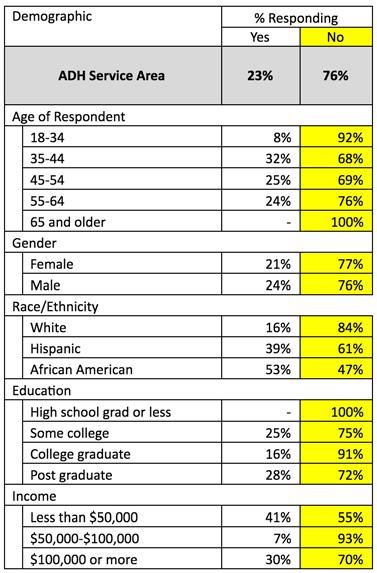
• 71% of Amarillo’s residents responded that they do have one person they consider to be their primary physician, while 28% of residents responded that they do not have one person they consider to be their primary physician.
• Respondents age 18-34 (64%) were the most likely to respond that they did not have one person they considered to be their primary physician. Hispanics (45%) and people with a high school degree or less education (58%) were also more likely to report not having one person they consider to be their primary physician.

Question 6: Was there a time in the past twelve months where you needed to see a doctor, but could not due to costs?
FIGURE 4: NEEDED TO SEE DOCTOR BUT COULD NOT DUE TO COST
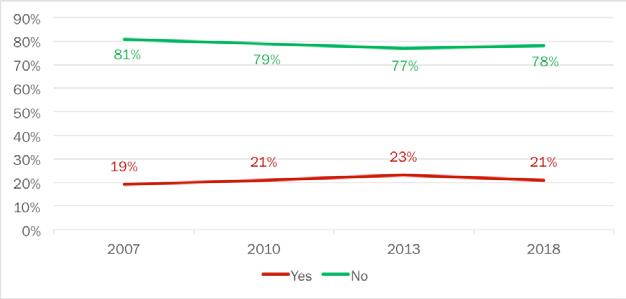
TABLE 9: PERCENT AT RISK - NEEDED TO SEE DOCTOR BUT COULD NOT DUE TO COST
• Respondents were asked if there was a time in the past 12 months where they needed to see a doctor but could not due to cost. Those who responded “yes” were considered “At Risk.”
• Compared to national (13.2%) and statewide (14.2%) data, Amarillo Service Area (21%) had a higher proportion of residents who needed to see the doctor but could not due to cost.
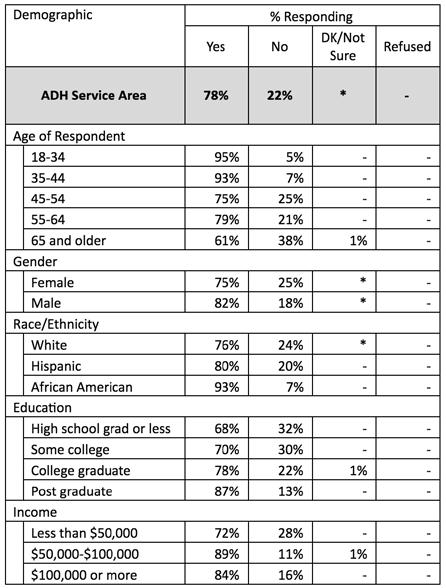
• 78% of Amarillo residents stated that there was no time in the past 12 months in which they could not see the doctor due to cost.
• 21% of residents reported that there was a time in the past 12 months in which they could not see a doctor due to cost.
TABLE 10: NEEDED TO SEE DOCTOR BUT COULD NOT DUE TO COST BY DEMOGRAPHIC
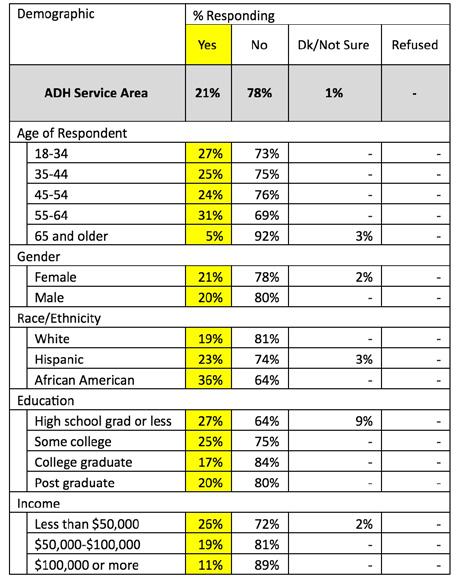
TABLE 11: TOP “AT RISK” GROUPS – NEEDED TO SEE DOCTOR BUT COULD NOT DUE TO COST
• African Americans are the most “At Risk” with 36% of that group reporting they could not see a doctor in the past 12 months due to cost.
• 55- to 64-year-olds (31%), high school graduates or less education (27%), 18- to 34-year-olds (27%), and people who make less than $50,000 annually (26%) also have a high proportion of people in the “At Risk” group.
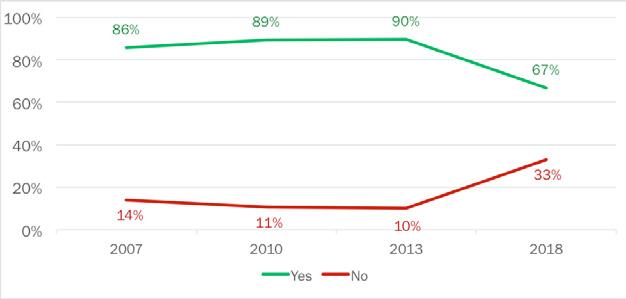
Question 7: Does your spouse or partner have health insurance?
FIGURE
5: SPOUSE OR PARTNER HAS HEALTH INSURANCE (2007-2018)
• Respondents were asked if their partner or spouse has health insurance.
• 79% of Amarillo residents who have a partner or spouse cite that their spouse or partner does have health insurance.
• 21% of respondents said that their partner did not have health insurance.
12: SPOUSE OR PARTNER HAS HEALTH INSURANCE BY DEMOGRAPHIC
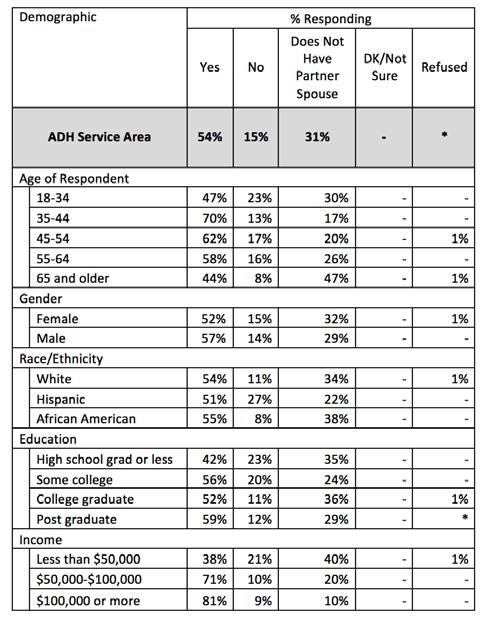
• Of residents with partners or spouses, Hispanics are the highest proportion of residents with partners who do not have healthcare coverage (27%).
Question 8: Is their insurance through… (n=219)
TABLE 13: SPOUSE OR PARTNER HEALTH INSURANCE PROVIDER BY DEMOGRAPHIC

• Of Amarillo Service Area residents whose spouse has health insurance, 62% of partners or spouses get their insurance through their place of employment or union.
• 23% of spouses or partners receive their healthcare through Medicare.
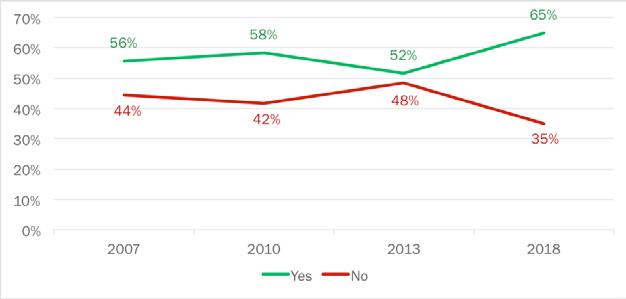
Question 9: Do you have health insurance for your children 18 or younger living in your household?
FIGURE 6: CHILDREN HAVE HEALTH INSURANCE (2007-2018)
• Respondents were asked if they had healthcare for their children. Figure 6 shows what proportion of Amarillo Service Area residents who have children, have healthcare for them.
• 67% of Amarillo residents who have children, have some form of healthcare coverage for them.
• 33% of residents said that they do not have healthcare coverage for their children.
• There was over a 20 point drop off between 2013 and the 2018 data. This can be attributed to the passage and enforcement of the Affordable Care Act or lack of Medicaid expansion, as well as the different styles of weighting between surveys. The 2013 data is more heavily weighted to younger age demographics and the 2018 data is weighted to represent an older-male demographic.
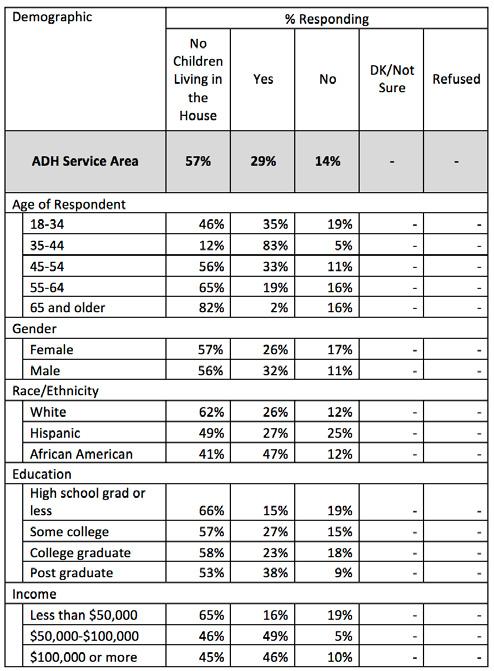
• 57% of Amarillo residents reported that they do not have a child living in the house.
• 83% of residents age 35-44, have insurance for their children.
Question 10: Is this insurance primarily through… (n=117)
TABLE 15: CHILDREN HEALTH CARE PROVIDER BY DEMOGRAPHIC

• Among residents in the Amarillo Service Area who have children and have health insurance for them, they primarily get their insurance for the child through their place of employment or union (67%).
Question 11: If you or an adult member of your household are in need of healthcare, which of the following would you most likely use?
TABLE 16: TYPE OF HEALTH CARE MOST LIKELY TO USE BY DEMOGRAPHIC

• 59% of Amarillo Service Area residents said that if they or an adult member of their household needed healthcare, they would go to a private doctor.
• 19% of residents stated that they would use Urgent Care Centers if they or an adult member of their household needed healthcare.
TREATMENT PATTERNS
Adults
Question 12: Some people visit a doctor or a clinic for a checkup even though they are feeling healthy. Have you ever done that for yourself?
FIGURE 7: VISITED DOCTOR FOR CHECKUP (2007-2018)
• Respondents were asked if they visited a doctor or a clinic for a checkup even though they were feeling healthy.
• 65% of Amarillo Service Area residents cited that they have gone to the doctor or clinic for a checkup even though they felt healthy. This is up 13 points from 2013 (52%).
• Those people who do not go to their doctor or clinic, even when they feel healthy were classified as “At Risk.”
TABLE 17: VISITED DOCTOR FOR CHECKUP BY DEMOGRAPHIC

TABLE 18: TOP “AT RISK” GROUPS – VISITED DOCTOR FOR CHECKUP
“At Risk” Groups
• Residents with a high school diploma or less education are the highest proportion of residents who are “At Risk” (67%).
• Other groups who have a high proportion of residents who are “At Risk” are residents age 18-34 (47%), residents who make less than $50,000 (41%), Males (39%), and African Americans (37%).
Question 13: Was your most recent checkup… (n=261)
FIGURE 8: MOST RECENT CHECKUP (2007-2018)

• Of respondents who said that they have gone to see the doctor, even when they have felt healthy, we then asked them how long it has been since their last checkup.
• 81% of residents who have gone to get a checkup even though they felt healthy report that their last checkup was less than 12 months ago. 12% of residents report that their last checkup was less than two years ago, and 7% said it has been longer than two years since their last checkup.
• Respondents who have had a checkup in the past 12 months is up three points since 2013 (2013: 78%, 2018: 81%) and respondents who have not have a checkup in over two years is down six points since 2013 (2013: 13%, 2018: 7%).
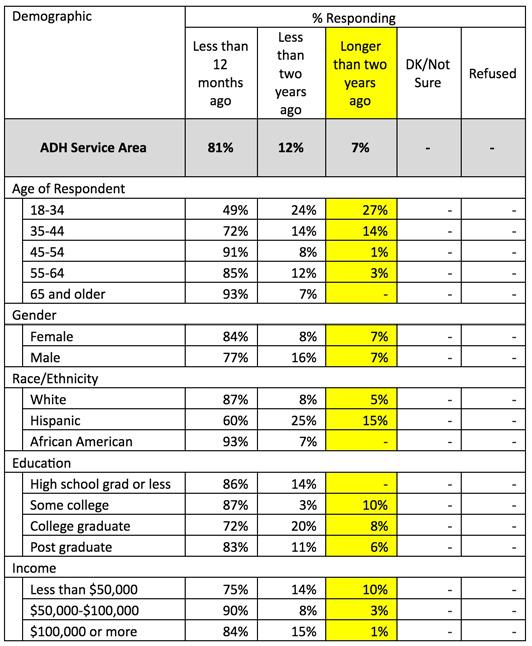
TABLE 20: TOP “AT RISK” GROUPS – MOST RECENT CHECKUP Top “At Risk” Groups
• Respondents were listed “At Risk” if they have not been to the doctor for a checkup in over two years.
• Seven percent of people who have gone to a doctor or clinic for a checkup even though they were healthy have not been in over two years. Residents age 18-34 had the highest proportion of residents “At Risk” (27%). Hispanics (15%), residents age 35-44 (14%), resident who have completed some college course work (10%), and residents who make less than $50,000 annually (10%) also have a decent size proportion of residents “At Risk.”
Question 24: A flu shot is an influenza vaccine injected into your arm. In the past 12 months, have you had a flu shot?
TABLE 21: PERCENT AT RISK – FLU VACCINATION IN PAST 12 MONTHS
• Respondents were asked if they have had an influenza vaccine injected into their arm in the past 12 months. “At Risk” groups are defined as groups who have not had a flu shot in the past 12 months.
• Compared to the national (58.3%) and statewide average (47.5%), Amarillo Service Area (43%) has a slightly lower proportion of residents that are “At Risk.”
• 57% of Amarillo residents cite that they have received a flu shot in the past 12 months, while 43% have said that they have not received a flu shot in the past 12 months.

TABLE 23: TOP “AT RISK” GROUPS – FLU VACCINATION IN PAST 12 MONTHS
• Respondents who are age 18-34 had the highest proportion of people “At Risk” (71%).
• Hispanics (61%), residents with a high school diploma or less education (60%), respondents age 35-44 (49%), respondents age 45-54 (49%), and college graduates (49%) also have a high proportion of “At Risk” residents.
Question 25: A vaccine to prevent the human papillomavirus or HPV infection is available and is called the cervical cancer or genital warts vaccine, HPV shot, have you ever had an HPV vaccination?

• Respondents were asked if they have ever received an HPV vaccination.
• 90% of respondents stated that they have not had an HPV vaccination, while 3% have stated that they have received the vaccination.
• Those who made more than $100,000 annually have the highest proportion of respondents that have had at least one HPV vaccination (10%).
TABLE 24: HAD HPV VACCINE BY DEMOGRAPHIC
Question 26: How many shots did you receive? (n=13)
TABLE 25: NUMBER OF HPV VACCINE SHOTS RECEIVED
HPV
• Of respondents who have received an HPV vaccination, 38% were unsure of how many vaccinations they have received.
• 23% of respondents have received either one or three shots in the series.
Question 27: How long has it been since you last visited a dentist or a dental clinic for any reason? Including visits to dental specialists, such as orthodontists?
FIGURE 9: LAST VISITED DENTIST (2007-2018)
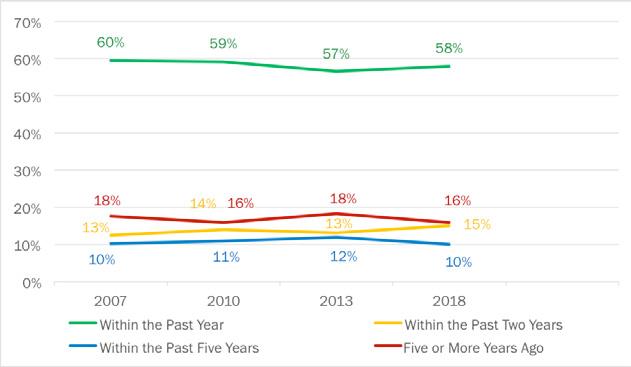
• Respondents were asked how long it has been since they last visited a dentist or dental clinic for any reason. The respondents were asked if it has been within the past year, within the past two years, within the past five years, or five or more years.
• 58% of Amarillo residents cite that their last dental visit was within the past year, 16% of residents state that it has been longer than five years since their last dental visit, 15% said their last dental visit was less than two years ago, and 10% of residents said that their last dental visit was within the past five years.

• 77% of respondents who make more than $100,000 annually have been to the dentist in the past year.
• 40% of respondents who have a high school degree or less education have not been to a dentist in the past five years.
TABLE 26: LAST VISITED DENTIST BY DEMOGRAPHIC
Question 28: If you or an adult member of your household are in need of dental care which of the following would you most likely use?
TABLE 27: TYPE OF DENTAL CARE MOST LIKELY TO USE BY DEMOGRAPHIC

• Respondents were asked if they or an adult member of the household needed dental care, where they would go to get the dental care.
• 79% of respondents said that they would go to a private dentist and 11% said that they would go to the J.O. Wyatt or Dental Clinic.
Children
Question 14: If a child living with you needed healthcare, which of the following would you most likely use? (n=175)
TABLE 28: TYPE OF HEALTH CARE MOST LIKELY TO USE (CHILD) BY DEMOGRAPHIC

• Respondents were asked if the child living with them needed healthcare where they would take them to receive that care.
• 65% of Amarillo Service Area residents said that they would take a child in need of healthcare to a private doctor, and 10% said they would take the child to an Urgent Care Center.
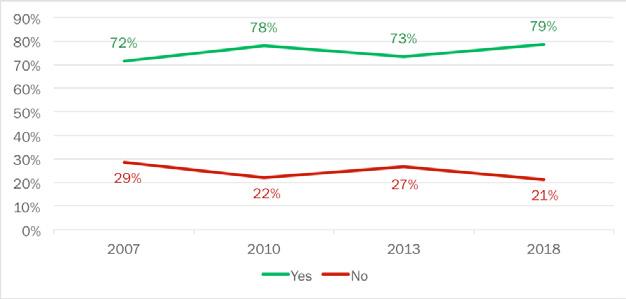
Question 15: Have you or another adult member in the household sought healthcare for a child within the past two years? (n=123)
FIGURE 10: SOUGHT HEALTH CARE FOR CHILD IN PAST TWO YEARS (2007-2018)

• Respondents were asked if they or another adult member in the household sought healthcare for a child in the past two years.
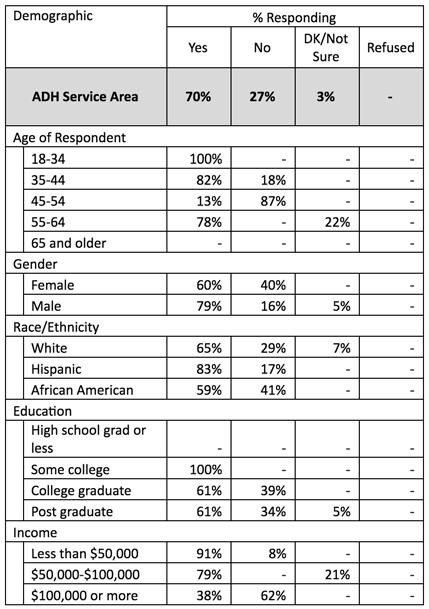
• 74% of Amarillo residents cite that they or another adult member of their household has sought healthcare for a child within the past two years, while 24% said that they have not sought healthcare for a child in the past two years.
• 74% of adults who have sought healthcare for child in the past two years is up two points since 2013 (2013: 72%, 2018: 74%)
• Adults who have not sought healthcare for a child within the past two years is down four points since 2013 (2013: 28%, 2018: 24%).
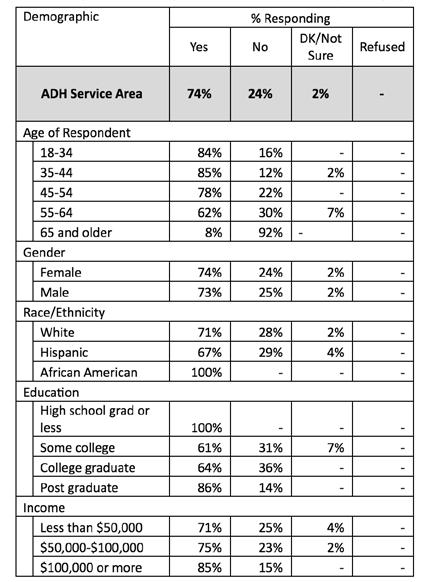
• Of respondents who have sought healthcare for a child, residents with a high school diploma or less education, and African Americans have the highest proportion of individuals seeking out healthcare for a child, both being at 100%.
Question 16: Did you experience any of the following when you sought healthcare for the child? (n=91)
TABLE 30: EXPERIENCE WHEN SEEKING HEALTH CARE FOR CHILD BY DEMOGRAPHIC

• Respondents stated that when they attempted to get healthcare for a child from the source listed in Question 14, 16% said they were unable to get an appointment when they needed one. 12% said that the cost was too high.
Question 17: What type of specialist did your child need? (n=8)
TABLE
31: SPECIALIST NEEDED FOR CHILD
• Of respondents who said that their child needed a specialist, 25% said that their child needed either a pediatrician, ENT, or Primary Practice doctor. 13% said the child needed either an Athletic doctor or Neurologist.
Question 18: Did any of the following reasons prevent you from getting the healthcare you needed for your child? (n=91)
TABLE 32: REASONS THAT PREVENTED GETTING THE HEALTH CARE YOUR CHILD NEEDED BY DEMOGRAPHIC
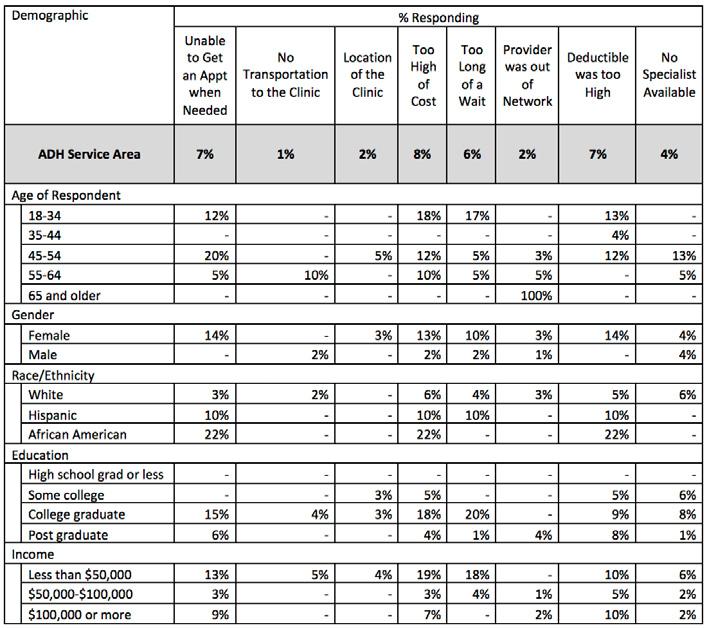
• Respondents who sought healthcare for a child but could not were asked what reasons prevented them from getting that healthcare.
• 8% of respondents cited that the cost of care was too high, while 7% said either they were unable to get an appointment when needed or that their deductible was too high.
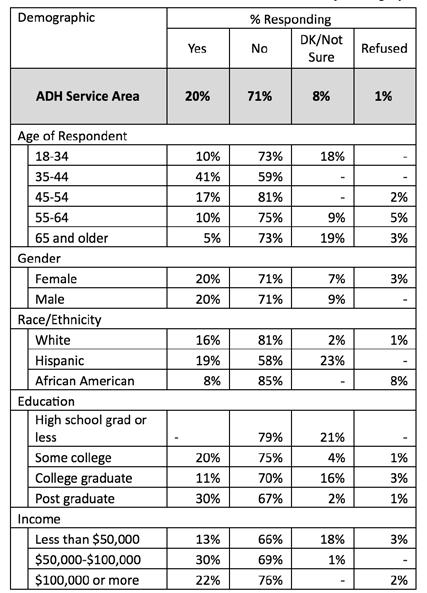
Question 19: Has a doctor, nurse, medical assistant, or school representative told you within the past twelve months that one of your children needed vaccinations? (n=175)
FIGURE 11: CHILD NEEDED VACCINATION IN PAST 12 MONTHS (2007-2018)
• Respondents were asked if a doctor, nurse, medical assistant, or school representative told them within the past 12 months that their children needed vaccinations.
• 71% of Amarillo Service Area residents stated that they have not been told that their child needs vaccinations, while 20% of residents have been told that their child needs vaccinations.
• The proportion of respondents who have answered that their child does not need vaccinations is down two points from 2013 (2013: 73%, 2018: 71%).
• The proportion of residents who said their child does need vaccinations is down seven points from 2013 (2013: 27%, 2018: 20%).
Question
20: Did your child receive the vaccinations? (n=35)
FIGURE 12: CHILD GOT NEEDED VACCINATIONS (2007-2018)
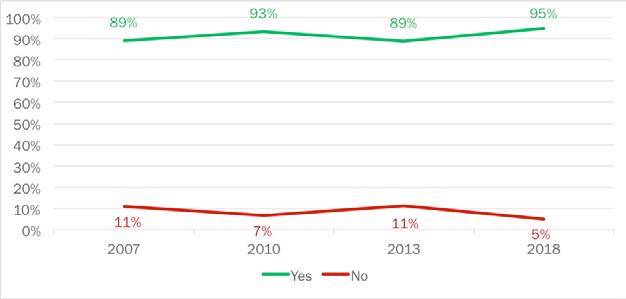
• Respondents who answered that they have been told that their child needed vaccinations in Question 19 were then asked if the child received them.
• 95% of Amarillo residents cite that their child did receive the vaccinations they needed, while 5% said the child has not yet received the vaccinations.
• The proportion of respondents who have gotten the vaccinations their child needed is up six points from 2013 (2013: 89%, 2018: 95%), while the proportion who have not yet gotten their children vaccinated is down six points from 2013 (2013: 11%, 2018: 5%).

Question 21: Where did you go to get your child immunized? (n=33)
TABLE 35: FACILITY WHERE CHILD GOT IMMUNIZED BY DEMOGRAPHIC
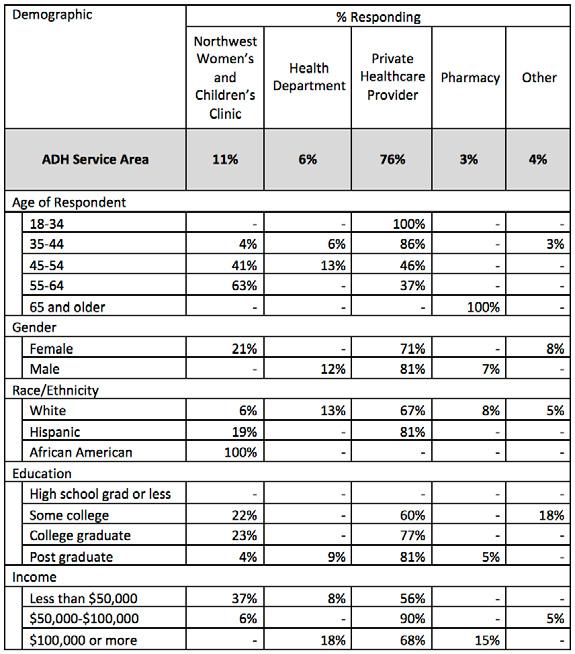
• When asked where they got their child vaccinated, 76% of Amarillo Service Area residents who did get their child vaccinated got them vaccinated at a Private Healthcare Provider.
Question 22: Has a doctor, nurse or other healthcare professional EVER said that the child has asthma? (n=91)
TABLE 36: BEEN TOLD CHILD HAS ASTHMA
Top “At Risk” Groups
• Respondents were asked if they have been told that the child in their house has asthma.
• 76% of Amarillo residents cite that the child in their household does not have asthma while 23% of residents said that their child has been diagnosed with asthma.
• The “At Risk” group was defined as those residents who have been told that their child has asthma.
• African Americans have the highest “At Risk” proportion with 53% citing that the child in their household has been diagnosed with asthma. Residents who make less than $50,000 annually (41%), Hispanics (39%), residents age 35-44 (32%), and residents making more than $100,000 annually (30%) also have high “At Risk” proportions.
Question 23: Does the child still have asthma? (n=21)
TABLE 38: DOES CHILD CURRENTLY HAVE ASTHMA BY DEMOGRAPHIC
• Respondents who had a child diagnosed with asthma were then asked if the child still had asthma.
• 70% of residents stated that the child still has asthma, while 27% said that the child does not have asthma.
Health Issues
Q29-30: Body Mass Index
FIGURE 13: RESPONDENT BMI CLASSIFICATION (2007-2018)

TABLE 39: “AT RISK” BMI NATIONAL AND STATE COMPARISONS
• Respondents were asked about their height and weight. Based on their responses, we calculated the respondent’s BMI according to the CDC’s formula.
• Compared to the national average (64.6%) and statewide average (68.6%), Amarillo Service Area has a slightly higher “At Risk” population. The “At Risk” group is defined as those people who are overweight or obese as classified by their BMI.
TABLE
40: DISTRIBUTION OF BMI IN AMARILLO
Mass Index: Amarillo
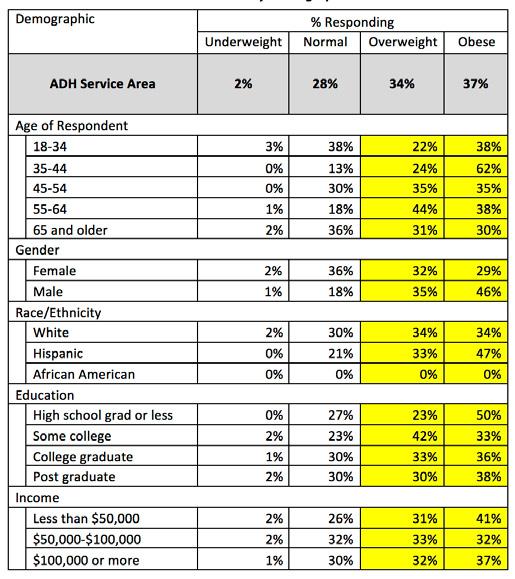
• In the Amarillo Service Area, 28% of respondents were Healthy, 34% were Overweight, and 37% were Obese.
• Of those people who were in the “At Risk” group, those people who were 35-44 years of age were the highest at risk group 86% of them reporting that they were either obese or overweight.
• 55-64 year-olds (82%), Males (81%), Hispanics (80%), and people with some college education (75%) also have a notably high “At Risk” proportion.
TOP “AT RISK” GROUPS – STATE OF HEALTH
TABLE 42:
BMI Self Perception vs Actual: Do you consider yourself to be overweight, underweight, or about the right weight?
TABLE 43: BMI ACTUAL AND PERCEIVED COMPARISONS
• Respondents were asked if they thought they were overweight, underweight, or about the right weight to define their self-perception of weight. We also asked respondents their height and weight to calculate their actual BMI.
• The group of residents who had the most accurate self-perception of their weight were those people who have a healthy weight. Almost four-in-five people who are at a healthy weight also thought they were at a healthy weight (79.2%).
• The group of respondents who were the least accurate at predicting their own BMI were those people who were overweight. About half of respondents correctly predicted their BMI (48%), while approximately half thought they were about the right weight when, in fact, they were overweight (49.6%).
Question 34: During the past month, other than your regular job, did you participate in any physical activities or exercises such as running, calisthenics, golf, gardening, or walking for exercise?
FIGURE 14: PARTICIPATED IN PHYSICAL ACTIVITY IN PAST MONTH (2007-2018)

TABLE 44: PERCENT AT RISK – PARTICIPATED IN PHYSICAL ACTIVITY IN PAST MONTH
• Respondents were asked if they participated in exercise outside of their jobs. Respondents who said that they did not exercise outside of work were labeled as “At Risk.”
• 78% of Amarillo Service Area residents cited that they do exercise outside of their jobs, while only 22% of residents stated that they do not exercise outside of their job.
• Compared to the national (23.3%) and state (27.4%) average, Amarillo Service Area (22%) has a lower proportion of people who are “At Risk” for a lack of physical activity.
Question 32: During the past twelve months have you tried to lose weight?
FIGURE 15: TRIED TO LOSE WEIGHT IN PAST 12 MONTHS (2007-2018)
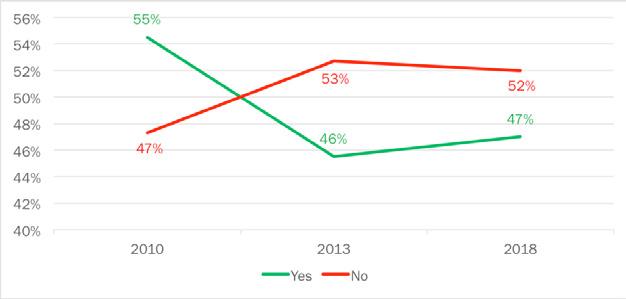
• Respondents were asked if they have tried to lose weight in the past 12 months.
• 52% of Amarillo residents cite that they have not tried to lose weight in the past 12 months, while 47% of residents said they have tried to lose weight in the past 12 months.
• Residents age 65 or older have the highest proportion of individuals who have not tried to lose weight (66%).
• Residents age 35-44 have the highest proportion of individuals who have tried to lose weight.
Question 33: How did you try to lose weight? (n=191)
TABLE 47: WEIGHT LOSS METHODS USED IN PAST 12 MONTHS
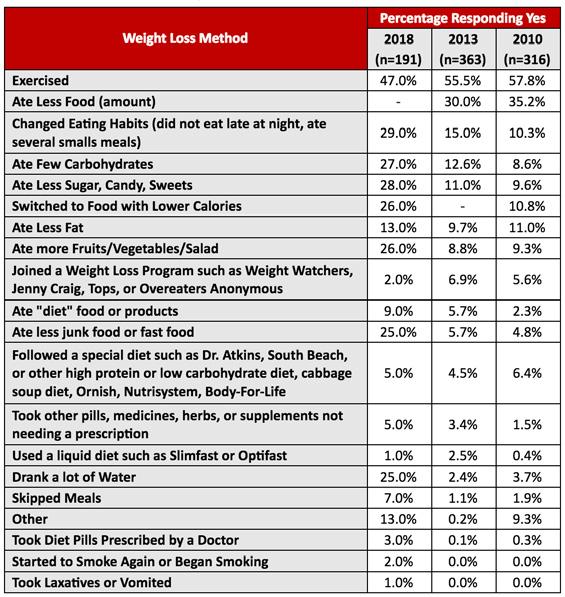
• Of the respondents who have tried to lose weight, most of them exercised more (47%).
• Changing eating habits (29%), eating less sugar, candy and sweets (28%), and eating fewer carbohydrates (27%) were also popular weight loss methods among respondents.
Question
35:
How often in the past 12 months would you say you were worried or stressed about having enough money to buy nutritious meals? Would you say you were worried or stressed?
FIGURE 16: WORRIED OR STRESSED ABOUT HAVING MONEY FOR NUTRITIOUS MEALS (2013-2018)

• Respondents were asked how often in the past 12 months they have been worried about having enough money for nutritious meals. The respondents were asked if they are always, usually, sometimes, rarely, or never worried about having enough money for nutritious food.
• 14% of residents cited that they are always worried about having enough money for food, 4% of residents are usually worried about having enough money for nutritious meals, 14% of residents are sometimes worried about having money for nutritious meals, 18% of residents are rarely worried about having money for nutritious meals, and 47% of residents are never worried about having enough money for nutritious meals.
• There was a four-point increase from 2013 in the respondents who said they were always worried about having nutritious meals (2013: 10%, 2018: 14%).
• There was also a three-point decrease from 2013 in the number of respondents who are usually worried about having money for nutritious meal (2013: 7%, 2018: 4%).
• Respondents who have never worried about having money for nutritious meals has increased four points from 2013 (2013: 43%, 2018: 47%).

• Respondents who had a high school diploma or less education had the highest proportion of residents who are always worried about having enough money for nutritious meals (46%).
• Respondents who make more than $100,000 annually have the highest proportion of residents who are never worried about having enough money for nutritious meals (75%).
Question 36: Have you ever been told by a doctor that you have diabetes?
FIGURE
17: BEEN TOLD YOU HAVE DIABETES (2007-2018)

TABLE 49: PERCENT AT RISK – BEEN TOLD YOU HAVE DIABETES
• Respondents were asked if they have ever been told by a doctor that they have diabetes. Respondents are considered “At Risk” if they have been told that they have diabetes.
• Compared to the national (10.5%) and statewide average (15.5%), Amarillo Service Area (21%) has a notably higher proportion of residents who are “At Risk.”
• 79% of Amarillo residents stated that a doctor has not told them that they have diabetes.
• About 21% of Amarillo’s residents fall into the “At Risk” group with respondents citing that a doctor has told them that they have diabetes.
TABLE 50: BEEN TOLD YOU HAVE DIABETES BY DEMOGRAPHIC

TABLE 51: TOP “AT RISK” GROUPS – BEEN TOLD YOU HAVE DIABETES
• Respondents age 65 or older have the highest proportion of “At Risk” individuals (36%).
• Respondents age 55-64 (29%), respondents who make less than $50,000 annually (29%), respondents who have some college experience (28%), and females (24%) also have high proportions of “At Risk” individuals.
Question 37: Was this when you were pregnant?
TABLE 52: DIABETES WHILE PREGNANT BY DEMOGRAPHIC

• 79% of respondents who stated they have diabetes also reported that this was not while they were pregnant.
• 17% of respondents said that they only had diabetes when they were pregnant.
Question 38: Have you ever been told by a doctor that you have pre-diabetes or borderline diabetes?
TABLE 53: BEEN TOLD YOU HAVE PRE-DIABETES OR BORDERLINE DIABETES BY DEMOGRAPHIC

Top “At Risk” Groups
• Respondents were asked if they have ever been told that they have pre-diabetes or borderline diabetes. Respondents who said that they have been told they have prediabetes or are borderline diabetic are considered “At Risk.”
• 82% of Amarillo residents said that they have not been told that they have pre-diabetes or are borderline diabetic. About 18% of Amarillo’s residents fall into the “At Risk” group.
• Respondents with a high school diploma or less education have the highest proportion of “At Risk” respondents (39%).
• Respondents age 65 or older (31%), females (25%), residents age 55-64 (22%), and residents who make less than $50,000 annually (21%) also have a larger proportion of “At Risk” individuals.
Question 39: Have you ever been told by a doctor that you have suffered a heart attack?

FIGURE 18: BEEN TOLD YOU HAD A HEART ATTACK (2007-2018)
TABLE 55: PERCENT AT RISK – BEEN TOLD YOU HAD A HEART ATTACK
Heart Attack
• Respondents were asked if a doctor has ever told them that they have suffered a heart attack. Respondents who said they have been told they have had a heart attack were labeled as “At Risk.”
• Compared to the national (4.3%) and statewide average (6.1%), Amarillo Service Area (8%) has a slightly higher proportion of residents that are “At Risk.”
• 92% of Amarillo residents have not been told by a doctor that they have had a heart attack, while 8% of respondents have been told that they have had a heart attack.

• Respondents who are 65 or older have the highest proportion of “At Risk” respondents (16%).
• Respondents who have a high school diploma or less education and respondents who make less than $50,000 annually also have a decent size proportion of “At Risk” respondents (11%).
Question 40: Have you ever been told by a doctor that you have coronary heart disease?
FIGURE 19: BEEN TOLD YOU HAVE CORONARY HEART DISEASE OR ANGINA (2007-2018)
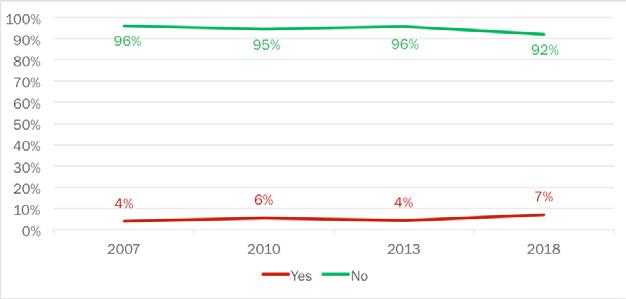
TABLE 57: PERCENT AT RISK – BEEN TOLD YOU HAVE CORONARY HEART DISEASE OR ANGINA
• Respondents were asked if they have been told by a doctor that they have coronary heart disease or angina. Figure 19 shows the answers to this question since 2007.
• Of Amarillo residents surveyed, 92% state that they have never been told by a doctor that they have coronary heart disease or angina, while 7% report that they have.
• The number of respondents claiming that their doctor has diagnosed them with coronary heart disease or angina has risen from 4% in 2013 to 7% in 2018. This is close to a 50% rise.
• Compared to the ADH service area, only 4% of Americans have been diagnosed with coronary heart disease or angina, while 6.2% of Texans have been told they have coronary heart disease or angina.
TABLE 58: BEEN TOLD YOU HAVE CORONARY HEART DISEASE OR ANGINA BY DEMOGRAPHIC

TABLE 59: TOP “AT RISK” GROUPS – BEEN TOLD YOU HAVE PRE-DIABETES OR BORDERLINE DIABETES Top “At Risk” Groups
• Those older than 65 (16%) and white persons (10%) have the highest proportion of “At Risk” respondents.
Question 41: Have you ever been told by a doctor that you have suffered a stroke?
FIGURE 20: BEEN TOLD YOU SUFFERED A STROKE (2007-2018)

TABLE 60: PERCENT AT RISK – BEEN TOLD YOU SUFFERED A STROKE
• Respondents were asked if they have been told by a doctor that they have suffered a stroke. Figure 20 shows the responses above.
• Of Amarillo residents surveyed, 91% state that they have never been told by a doctor that they have suffered a stroke, while 6% report that they have.
• The number of respondents claiming that their doctor has diagnosed them with stroke has risen four percentage points from 2013 (2013: 2%, 2018: 6%).
• Compared to the ADH service area, only 3.1% of Americans have been diagnosed with a stroke, while 4.9% of Texans have been told they have suffered a stroke.
TABLE 61: BEEN TOLD YOU SUFFERED A STROKE BY DEMOGRAPHIC

TABLE 62: TOP “AT RISK” GROUPS – BEEN TOLD YOU SUFFERED A STROKE Top “At Risk” Groups
• The largest “At Risk” group in Amarillo is African Americans, with 18% of respondents claiming that a doctor has told them that they have suffered a stroke.
Question 42: Have you smoked at least 100 cigarettes in your entire life?
FIGURE 21: SMOKED AT LEAST 100 CIGARETTES IN ENTIRE LIFE (2007-2018)

TABLE 63: PERCENT AT RISK – SMOKED AT LEAST 100 CIGARETTES IN ENTIRE LIFE Smoked at Least 100 Cigarettes in
• Respondents were asked if they have smoked at least 100 cigarettes in their lifetime. Figure 21 shows the responses above.
• Of Amarillo residents surveyed, 47% of respondents have smoked at least 100 cigarettes in their lifetime, while 52% state that they have not smoked 100 cigarettes.
• The number of respondents claiming that they have not smoked 100 cigarettes dropped from 58% in 2013 to 52% in 2018.
• In 2015, 40.7% of Americans and 39.2% of Texans claimed to have smoked over 100 cigarettes, and 47% of Amarillo residents in 2018 state that they have smoked that many cigarettes.
TABLE 64: SMOKED AT LEAST 100 CIGARETTES IN ENTIRE LIFE BY DEMOGRAPHIC

65: TOP “AT RISK” GROUPS – SMOKED AT LEAST 100 CIGARETTES IN ENTIRE LIFE
• The most significant “At Risk” group in Amarillo are high school grads or less education with 74% of respondents claiming that they have smoked at least 100 cigarettes.
TABLE
Question 43: Do you currently use chewing tobacco, snuff, or snus every day, some days, or not at all?
FIGURE 22: CURRENTLY USE CHEWING TOBACCO (2007-2018)

• Respondents were asked if they currently use any form of smokeless tobacco (chewing tobacco, snuff, snus), and if they do, the frequency in which they use it. Figure 22 shows the responses above.
• Of Amarillo residents surveyed, a strong majority (95%) of respondents claim that they do not currently use chewing tobacco. However, a total of 5% do use smokeless tobacco (3% every day and 2% some days).
• The number of respondents claiming that they do not use smokeless tobacco dropped from 96% in 2013 to 95% in 2018, while current users rose from 3% to 5% from the same time-period.

TABLE 67: TOP “AT RISK” GROUPS – STATE OF HEALTH
• The most significant “At Risk” group in Amarillo are 18-34 year-olds and those earning over $100,000 annually, with 12% of those groups claiming that they use smokeless tobacco.
Question 44: During the past 12 months, have you stopped smoking or using tobacco products for one day or longer because you were trying to quit?
FIGURE
23: TRIED TO QUIT SMOKING IN PAST 12 MONTHS (2007-2018)

• Respondents were asked if they have tried to quit using tobacco products for a day or longer to absolve the habit altogether. Figure 22 shows the responses above.
• Of Amarillo residents surveyed, 63% claim that they have not tried to quit using tobacco in the past 12 months, while only 31% have made an effort to not use tobacco for at least a day.
• The number of respondents claiming that they have tried to quit using tobacco products has decreased dramatically from 2013 to 2018 as 56% (a 25% decrease) of the population surveyed claimed that they attempted to quit tobacco in 2013.

• The groups that have attempted to quit at the highest rate include white respondents (37%), residents who have completed some college or have an associate’s degree (38%) and those making more than $100,000 annually (39%).
• The highest rates of not trying to quit using tobacco products appear in the youngest group, 18-34 year-olds (74%), and the oldest group, 65+ year-olds (72%).
Question
45: Have you ever had a mammogram? (n=210)
FIGURE 24: EVER HAD A MAMMOGRAM (2007-2018)

• Respondents in the ADH service area were asked if they ever had a mammogram in their lifetime. The results are listed above in Figure 24.
• In 2018, 74% of women in Amarillo say that they have had a mammogram, and only a quarter of respondents have not had a mammogram.
• With 74% of respondents claiming that they have had a mammogram, the reported number of women who have had a mammogram has increased by 10% from 2013.
• The number of women that have had a mammogram has risen at a steady pace from 2007 to 2013.
• In 2018, there was a significant increase in women that have had mammograms.
TABLE 69: EVER HAD A MAMMOGRAM BY DEMOGRAPHIC

TABLE 70: TOP “AT RISK” GROUPS – EVER HAD A MAMMOGRAM
Question 46: When was your last mammogram? (n=155)
FIGURE
25: TIME SINCE LAST MAMMOGRAM (2007-2018)

• Respondents were asked when their last mammogram was. The respondents were asked if their last visit was within the past year, within the past two years, within the past three years, three to five years ago, and five or more years ago.
• 63% of Amarillo women cite that they had their last mammogram within the past year.
• 15% of women cited that they had a mammogram within the past two years, 11% said five years or more, 6% three to five years, and 5% have had a mammogram within the past three years.
• There was a four-point increase in the proportion of respondents who have had a mammogram in the past year (2013: 59%, 2018: 63%). There was also a four-point decrease in the proportion of respondents whose last mammogram was in the past two years (2013: 19%, 2018: 15%), however, the proportion of women who haven’t had a mammogram in the past five years increased by two points (2013: 9%, 2018: 11%).
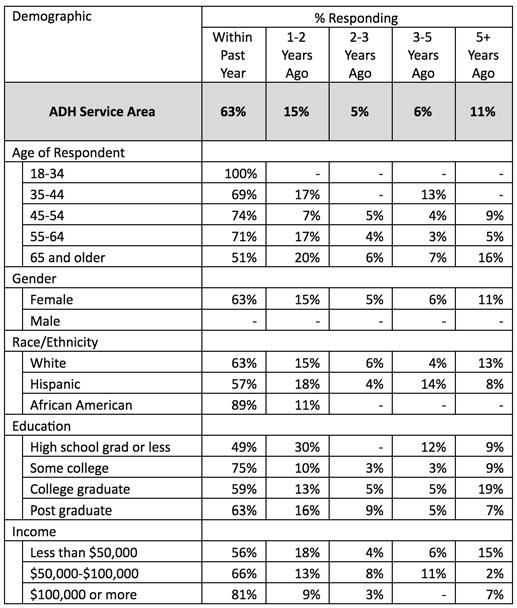
• African American respondents have the highest proportion of women who have had a mammogram within the past year (89%).
• Of women who have not had a mammogram in the past five years, college graduates make up the largest portion of respondents (19%).
◦ Note that most physicians recommend having your first mammogram at the age of 40 unless prior family history supports so. This can attribute to the 100% of respondents in the 18-34 age category have had a mammogram in the past year.
Question 47: Have you ever had a pap test? (n=210)
FIGURE 26: EVER HAD A PAP TEST (2007-2018)
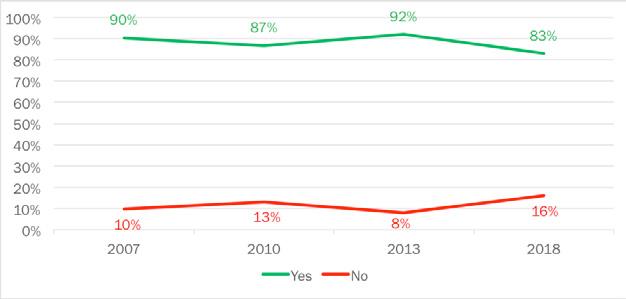
• Respondents were asked if they have ever had a pap test. Respondents who said that they have never had a pap test were labeled as “At Risk.”
• 83% of Amarillo women cite that they have had a pap test, while 16% of women said that they have never had a pap test.
• There was a nine-point decrease in the proportion of women who have had pap test since 2013 (2013: 92%, 2018: 83%), while there was an eight-point increase in the proportion of women who have not had a pap test (2013: 8%, 2018: 16%).
TABLE 72: EVER HAD A PAP TEST BY

TABLE 73: TOP “AT RISK” GROUPS – EVER HAD A PAP TEST
Top “At Risk” Groups
• 37% of women age 18-34 have never had a pap test, this could be because there was a high concentration of people who were younger than 21 surveyed, which is the normal age to begin getting a yearly pap test.
• High school graduate or less (28%), Hispanics (22%), residents who make less than $50,000 a year (20%), residents who are 65 or older (19%), and residents with a college degree (19%) also have a large proportion of residents who are considered “At Risk.”
Question 48: When was your last pap test? (n=174)
FIGURE 27: TIME SINCE LAST PAP TEST (2007-2018)
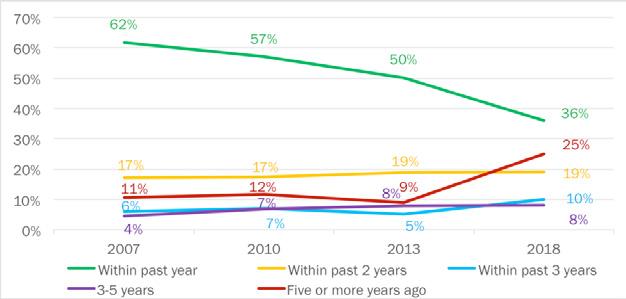
• Respondents were asked when their last pap test was. The respondents were asked if their last pap test was within the past year, within the past two years, within the past two years, within the past three years, three to five years ago, or more than five years.
• 36% of Amarillo women cite that their last pap test was performed within the past year. 25% of Amarillo women said that their last pap test was five or more years ago, 19% of women said that their last pap test was within the past two years, 10% of women said that their last pap test was performed within the past three years, and 8% of women said it has been three to five years since their last pap test was done.
• There was a 14-point drop in the proportion of residents who have received a pap test within the past year from 2013 (2013: 50%, 2018: 36%).
• In addition, there was an increase of 16 points among residents who have not had a pap test in the past five years from (2013: 9%, 2018: 25%).
• This can be attributed to the difference in age group sample size. Amarillo has aged quite a bit since 2013, with younger generations moving to larger cities.
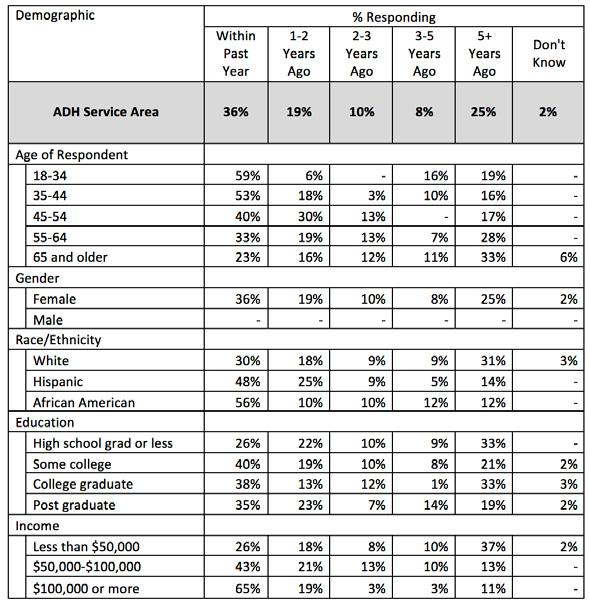
• Women who make over $100,000 per year have the largest proportion of residents who have had a pap test in the past year (65%).
• Residents who make less than $50,000 per year have the largest proportion of residents who have not had a pap test in five years (37%).
Question
49: Have you ever been tested for HIV?
FIGURE 28: EVER BEEN TESTED FOR HIV (2007-2018)

• Respondents were asked if they were ever tested for HIV.
• 56% of Amarillo residents cite that they have not been tested for HIV, while 41% of the respondents said that they have been test for HIV.
• There was an eight-point drop in the proportion of respondents who have not had an HIV test since 2013 (2013: 64%, 2018: 56%), while there was a five-point increase in the proportion of residents who have had an HIV test since 2013 (2013: 36%, 2018: 41%).

• Respondents who are age 18-34 have the highest proportion of residents who have had an HIV test (62%).
• Respondents who have a high school diploma or less education have the highest proportion of residents who have never had an HIV test (78%).
Question 50: Not including blood donations, when was your last HIV test?
TABLE 76: TIME SINCE LAST HIV TEST
• Respondents were asked when their last HIV test was, not including blood donations.
• 24% of respondents said that their last HIV test was done within the past four years, 17% of respondents said that their last test was done five to nine years ago, and 15% of respondents said that their last HIV was done 10 to 14 years ago.
Question 51: Where did you have your last HIV test? (n=113)
TABLE 77: LOCATION OF LAST HIV TEST BY DEMOGRAPHIC

• Respondents were asked where their last HIV test was performed.
• 44% of Amarillo Service Area residents said that their last HIV test was performed at a private doctor or HMO Office, and 11% of respondents said their last HIV test was performed at the hospital.
Question 52: Were the results of your HIV test positive, indicating that you have HIV? (n=116)
TABLE 78: RESULTS OF HIV TEST BY DEMOGRAPHIC

• Respondents were asked about the results of their HIV test. Respondents were asked if the test was positive, which indicated you had HIV, or negative.
• 100% of Amarillo Service Area residents responded that they had negative results on their HIV test.
Question 53: Have you or a member of your household sought mental health care services in the last 2 years?
FIGURE 29: YOU OR MEMBER OF HOUSEHOLD SOUGHT MENTAL HEALTH CARE IN PAST TWO YEARS (2007-2018)
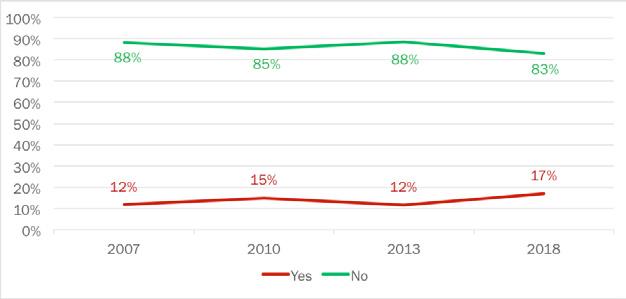
• Respondents were asked if they or a member of their household sought mental health services in the past two years.
• 83% of Amarillo residents said that they have not sought out mental healthcare in the past two years, while 17% of residents said that they have sought out mental health services in the past two years.
TABLE 79: HAVE YOU OR MEMBER OF HOUSEHOLD SOUGHT MENTAL HEALTH CARE IN PAST TWO YEARS BY DEMOGRAPHIC
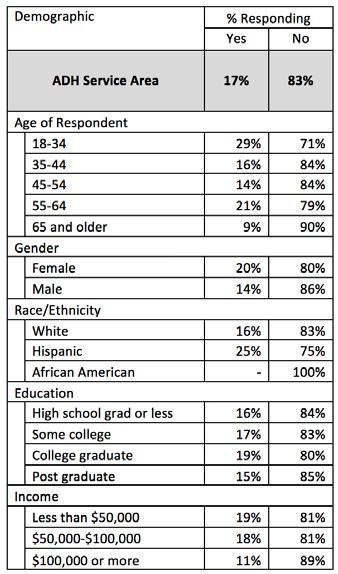
• Respondents who are age 18-34 have the highest proportion of residents who reported that they have sought mental health services for themselves or a member of their household.
• African American respondents have the highest proportion of residents who have not sought mental healthcare services in the past two years.
Question 54: If you or an adult member of your household were/are in need of mental healthcare, which of the following would you most likely use?
TABLE 80: TYPE OF MENTAL HEALTH CARE LIKELY TO USE BY DEMOGRAPHIC

• Respondents were asked if they ever needed mental healthcare, which facility they would use. Respondents were asked if they would use Texas Panhandle Centers, Private Providers, J.O. Wyatt Clinic, or another source.
• 60% of respondents said that they would use a private provider for mental health healthcare, while 14% of residents said that they would use Texas Panhandle Centers to handle their mental healthcare.
Question 55: Did you experience any of the following when you sought mental health care? (n=68)
FIGURE 30: PROBLEMS WHEN SEEKING MENTAL HEALTH CARE (2007-2018)
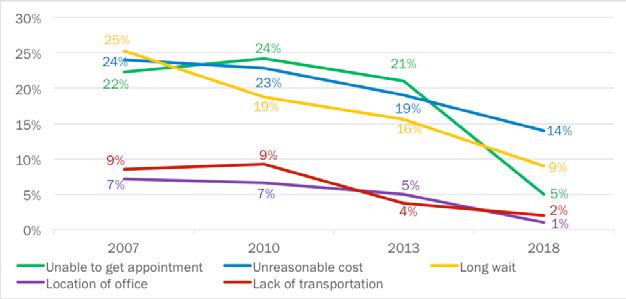
• Respondents were asked if they experienced any of the following problems when they sought mental health care: unable to get an appointment, the costs were unreasonable, there was a long wait, if the location of the office was inconvenient, or if there was a lack of transportation to the facility.
• There was a five-point drop since 2013 in the proportion of respondents who were unable to get mental healthcare due to high costs (2013: 19%, 2018: 14%). In addition, there was also a seven-point drop since 2013 in the proportion of respondents who were unable to get mental healthcare due to long wait times (2013: 16%, 2018: 9%).

• Respondents age 45-54 have the highest proportion of residents who were unable to get mental healthcare due to the cost being too high (50%).
• Respondents age 35-44 have the highest proportion of residents who were unable to get mental healthcare due to too high of a deductible.
Question 56: Did you experience any of the following when you sought mental care for a child? (n=175)
TABLE 82: PROBLEMS WHEN SEEKING MENTAL HEALTH CARE FOR CHILD BY DEMOGRAPHIC

• Respondents were asked if they experienced any of the following when they sought mental care for a child: unable to get an appointment, the costs were unreasonable, there was a long wait, if the location of the office was inconvenient, or if there was a lack of transportation to the facility.
• 4% of respondents said that cost was an issue for finding mental healthcare for a child, while 3% of residents did not know where to go for mental healthcare.
• Respondents with a high school diploma or less education have the highest proportion of residents who said that the cost of mental healthcare was too high (11%).
• Respondents who were 18-34 have the highest proportion of residents who said that they did not know where to go to get a child mental healthcare (11%).
Question 57: Are you a family caregiver of someone that is elderly (age 65 or older)?
FIGURE 31: RESPONDENT IS CAREGIVER FOR ELDERLY PERSON (2007-2018)

• Respondents were asked if they are a family caregiver of someone that is elderly.
• 86% of Amarillo Service Area residents said that they are not a family caregiver of someone that is elderly, while 14% of residents said that they were a caregiver of someone who is elderly.
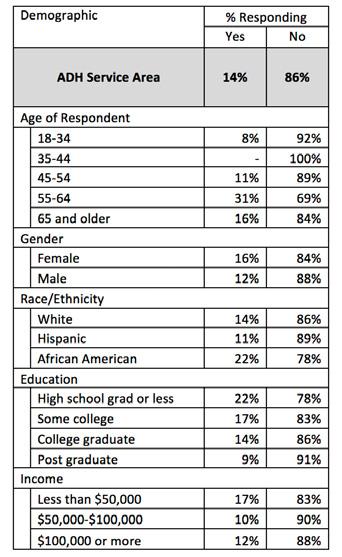
• The category of respondents ages 55-64 has the highest proportion of residents who said they are a caregiver for an elderly person (31%).
• The category of respondents ages 35-44 has the highest proportion of residents who said they are not a caregiver for an elderly person (100%).
Question 58: Does that family member (from above) have significant memory problems? (n=56)
FIGURE 32: FAMILY MEMBER HAS SIGNIFICANT MEMORY PROBLEMS (2007-2018)

• Respondents were asked if the elderly person they are a caregiver to has significant memory problems. Respondents were labeled “At Risk” if they answered that the elderly person they are taking care of does have significant memory problems.
• 64% of respondents said that the elderly person they are a caregiver to does not have significant memory problems, while 31% said that the elderly person they are a caregiver to does have significant memory problems.
TABLE 84: FAMILY MEMBER HAS SIGNIFICANT MEMORY PROBLEMS BY DEMOGRAPHIC
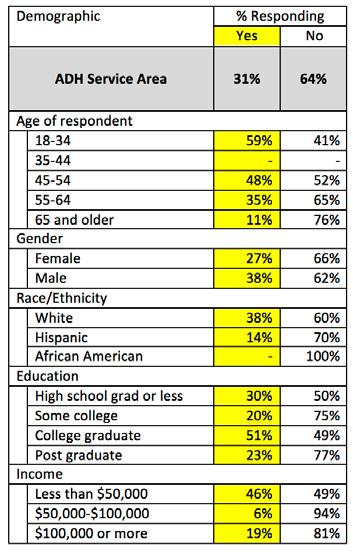
TABLE 85: TOP “AT RISK” GROUPS – FAMILY MEMBER HAS SIGNIFICANT MEMORY PROBLEMS Top “At Risk” Groups
• The category of respondents ages 18-34 has the highest proportion of residents who are identified as “At Risk” for having a family member with significant memory problems (59%). College graduates (51%), respondents ages 45-54 (48%), residents who make less than $50,000 a year (46%), White respondents (38%), and Males (38%) also have significantly high proportions of residents “At Risk.”
Question 59: What are some specific needs that are not being met for you as a caregiver that you wish you could have assistance? (n=56)
TABLE 86: CAREGIVER NEEDS BY DEMOGRAPHIC
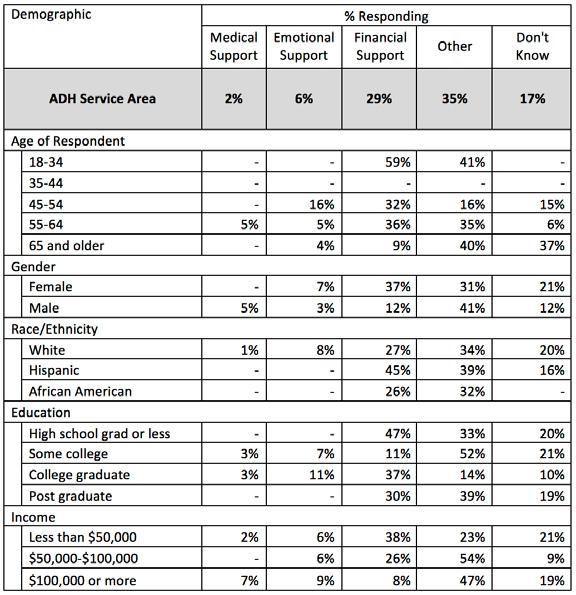
• Respondents were asked what are some specific needs that are not being met for them as a caregiver that they wish they could have assistance for.
• 29% of respondents stated that they wish they could have financial support.
• The category of respondents who are 18-34 have the highest proportion of residents who wish they could have more financial support (59%).
Question 60: If you or someone in your household has been pregnant in the last 5 years, did you/they go to the doctor to receive prenatal care?
TABLE 87: VISITED DOCTOR WHILE PREGNANT BY DEMOGRAPHIC

Top “At Risk” Groups
• Respondents were asked if they or someone in their household has been pregnant in the last five years, and if they went to the doctor to receive prenatal care. Respondents who answered no were labeled “At Risk.”
• 72% of Amarillo Service Area residents said that if they or a family member in their household was pregnant in the past five years, that person did not receive prenatal care. 12% of residents did get prenatal care for themselves or a family member of their household.
• Respondents age 55-64 have the highest proportion of residents “At Risk” (87%).
• African Americans (85%), respondents with a college degree (77%), respondents who make less than $50,000 a year (77%), and respondents 65 or older (76%) also have very high proportions of residents “At Risk.”
Question 61: How many visits to the doctor while pregnant?
TABLE 89: NUMBER OF VISITS TO DOCTOR WHILE PREGNANT
Visits
• Respondents from Question 60 who said they or someone in their household had been pregnant in the last five years were asked how many doctor visits they made during their pregnancy.
• 20% of Amarillo Service Area respondents said the pregnant person from their household visited the doctor’s office one to four times while they were pregnant, while 26% of respondents reported that they either visited the doctor between 10 to 14 times or 15 to 19 times while they were pregnant.
Question 62: In the past 12 months, have you used illicit or street drugs?
TABLE 90: ILLICIT DRUG USAGE IN PAST 12 MONTHS BY DEMOGRAPHIC
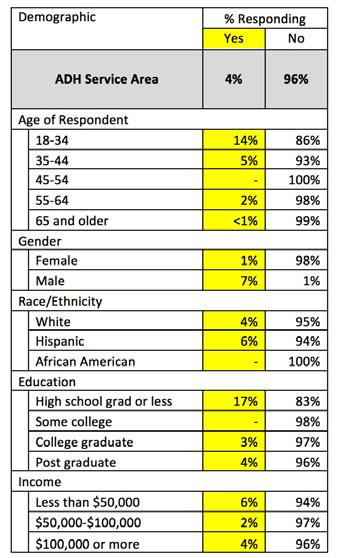
• Respondents were asked if they used illicit or street drugs at any point in the past 12 months. If a respondent said they have, they were classified as “At Risk.”
TABLE 91: TOP “AT RISK” GROUPS – ILLICIT DRUG USAGE IN PAST 12 MONTHS
• 96% of respondents said that they have not used any illicit or street drugs during the past 12 months, while 4% said that they have used illicit or street drugs during the past 12 months.
• Respondents with a high school diploma or less education have the highest proportion of residents who are “At Risk” (17%).
• Respondents age 18-34 (14%), Males (7%), Hispanics (6%), and respondents who make less than $50,000 a year (6%) also have a small proportion of residents who are “At Risk.”
Question 63: Has anyone in your household used illicit or street drugs?
TABLE 92: HOUSEHOLD ILLICIT DRUG USAGE BY DEMOGRAPHIC

Top “At Risk” Groups
• Respondents were asked if anyone in their household has used illicit or street drugs. Any respondent who responded yes was labeled as “At Risk.”
• 96% of Amarillo Service Area residents said that no one in their household has used illicit street drugs, while 2% said that someone in their household has used illicit street drugs.
• The most “At Risk” group of respondents is residents 18-34 years of age (6%).
Question 64: During the past 30 days, how many days per week or per month did you have at least one drink of any alcoholic beverage?
TABLE 94: DAYS OF ALCOHOLIC CONSUMPTION PER MONTH
• Respondents were asked during the past 30 days, how many days per week or per month did they have at least one drink.
• 30% of Amarillo Service Area residents have consumed at least one drink one to two days per month, while 18% of residents have consumed at least one drink three to five days during the past 30 days.
Question 65: During the past 30 days, on the days when you drank, about how many drinks did you drink on the average?
TABLE 95: DRINKS OF ALCOHOL CONSUMED PER MONTH
• This question is in reference to the number of drinks consumed in the past 30 days by Amarillo residents.
• 39% of residents limit their drinks to only one to two per month and 25% of respondents drink three to five drinks per month.
• Only 6% of those surveyed state that they have not consumed any drinks in the past 30 days
Question 66: During the last 30 days, what is the largest number of drinks you had on any occasion?
• This question asks what the largest number of drinks that Amarillo residents consumed on any occasion in the past 30 days.
• A plurality of respondents (32%) claim that the most they drank in one sitting was only one drink, while 22% state that two drinks was the most that they consumed on any occasion.
• Drinking more than five drinks in one sitting is usually considered “binge drinking.” 20% of Amarillo residents admitted to binge drinking at least once in the past 30 days.
• Only 8% of respondents claim to not have drank any amount of alcohol in the past 30 days.
Question 67: During the past 30 days, how many times have you driven when you’ve had perhaps too much to drink?
TABLE 97: NUMBER OF TIMES DRIVING WHILE UNDER THE INFLUENCE OF ALCOHOL
• This question concerns the number of times in the past 30 days in which a respondent has had too much to drink and operated a motor vehicle at the same time.
• 87% of Amarillo residents claim to have never driven under the influence of alcohol in the past 30 days.
• 8% of respondents have driven once after having too much to drink, and 5% of people have driven twice while under the influence.
• No respondent claimed to have driven more than two times after drinking too much.
Question 68: How many prescriptions for an opioid did you have in the last 12 months?
TABLE 98: OPIOID PRESCRIPTIONS IN PAST 12 MONTHS
Opioids
• This question addresses the levels of opioid use and prescriptions in the city of Amarillo.
• A strong majority (81%) of Amarillo residents state that they have not been prescribed opioids in the past 12 months.
• Of the respondents, only 13% had one prescription in the past 12 months, and even fewer (2%) have had two prescriptions.
Question 69: In the past 12 months, were you diagnosed with an STD?
TABLE 99: DIAGNOSED WITH STD BY DEMOGRAPHIC
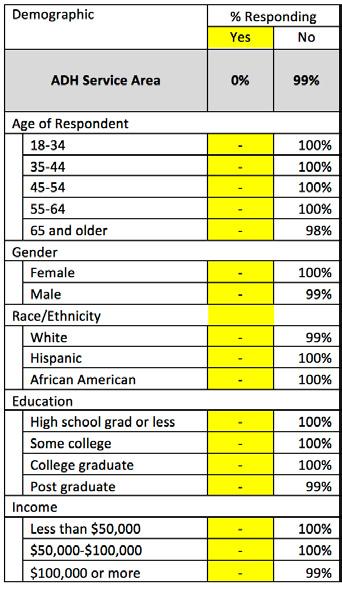
• Residents of Amarillo did not report contracting any STDs in the past 12 months.
Question 70: Which STDs did you contract? (n=0)
TABLE 100: TYPE OF SEXUALLY TRANSMITTED
• Residents of Amarillo did not report contracting any STD’s in the past 12 months.
Question 71: Where do you meet your sexual partners?
TABLE 101: LOCATION WHERE YOU MEET SEXUAL PARTNERS
• This question concerns the location where Amarillo residents meet their sexual partners.
• A plurality of respondents claim that they are currently in a monogamous relationship (45%) and do not actively seek other sexual partners.
• Of the remaining answers, 12% of people state that they meet new sexual partners through mutual friends, and only 5% of people responded saying that bars and clubs is their primary location to meet sexual partners.
• People who meet their sexual partners on apps are the smallest group, with only 2% of Amarillo residents stating that they log on to dating apps to meet sexual partners.
Q71: Where do you meet your sexual partners?
TABLE 102: DEMOGRAPHIC DETAIL – LOCATION WHERE YOU MEET SEXUAL PARTNERS

Question 72: Do you regularly use condoms during sex?
TABLE 103: REGULAR CONDOM USAGE BY DEMOGRAPHIC
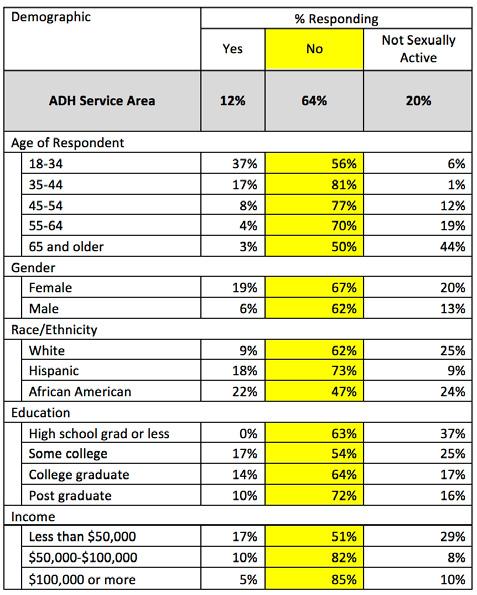
TABLE 104: TOP “AT RISK” GROUPS – REGULAR CONDOM USAGE Top “At Risk” Groups
• This question addresses the proportion of Amarillo residents who do and do not regularly use condoms during sex.
• 64% of respondents state that they do not often use condoms during sex, while only 12% of residents do.
• More people state that they are not sexually active (20%) than that they use condoms during sex (12%).
• Condom usage appears to decrease as age increases.
• 19% of women report that they use condoms during sex; over three times more than men (6%).
• The highest “At Risk” groups are those making more than $100,000 a year (85%) and between $50,000 and $100,000 a year (82%).
CONCLUSIONS
Below are a few of many conclusions found from the survey results. A total of 404 participants engaged in this survey. Of those participants, 48% were male and 52% were female, and they were split evenly between both Potter and Randall Counties.
Seventy-five percent of respondents reported that their state of health was either excellent, very good, or good. Twenty-four percent reported their health was either fair or poor and were considered “At Risk.” Sixty-five percent of the respondents reported getting a checkup even though they felt healthy. Thirty-five percent of the respondents reported not getting a checkup even though they felt healthy and are considered “At Risk.”
Eighty-four percent of the respondents had some kind of health care coverage. Fourteen percent did not and were considered “At Risk.” The most “At Risk” group is 18- to 35-year-olds, with 35% of them responding that they did not have any form of health care coverage.
Amarillo Service Area (43%) has a slightly lower proportion of residents that are considered “At Risk” because they have not had a flu vaccination in the past 12 months compared to the national (58.3%) and statewide average (47.5%). The top three most “At Risk” groups within Amarillo are 18- to 34-year-olds (71%), Hispanics (61%), and those with high school or less education (60%).
Eighty-three percent of respondents claim that they or a member of their household sought mental healthcare in the last two years. African American respondents have the highest proportion of residents who have not sought mental healthcare for themselves or a household member in the past two years (100% of respondents).
Seventy-eight percent of respondents said that they did participate in physical activities or exercises in the past 12 months. Of the 47% of respondents that have tried to lose weight over the past 12 months, 47% of them said that they exercised, and 29% of respondents said that they changed their eating habits.
Respondents were asked if they had ever had certain examinations. Seventy-four percent of female respondents reported having had a mammogram. Eighty-three percent of female respondents reporting having a Pap test. Forty-one percent of all respondents had been tested for HIV.
The data in this report can be used as a benchmark for the community compared to National and Texas surveys. It can also be used as a benchmark for future survey comparisons.
Key Informant Survey
KEY INFORMANT SURVEY
Background
This community health needs assessment (CHA) chapter includes information consisting of primary data collected from key informants (KI) in the form of an online survey (see Appendix C for survey questionnaire). The City of Amarillo Department of Public Health (COADPH) convened a workgroup consisting of thought leaders, academic health experts, board of health representatives, public health officials and others to consider the KI survey elements and questions. The committee reviewed potential questions, edited for content and style and prioritized the information to be queried by a larger KI group.
Due to the survey type, questions were limited to enhance the potential completion percentages and chosen to maximize participation. Prior surveys in other communities, priorities from the planning committee, consultation with survey contractors and staff guidance all contributed to the final survey product that was deployed.
Methods
The KI recipient list was populated using the “snowball sampling” approach (also known as “chain” or “referral” sampling) where potential participants are given the opportunity to name potential key informants to be included. This approach is used to capture known KIs as well as broadening the scope of expertise beyond individual researchers’ or administrators’ scope of connections. COADPH initiated the list, then convened the committee to include names of additional informants/participants. Once the list was created, email addresses were linked.
The survey instrument was loaded into SurveyMonkey, an online survey service. The questions were arranged by topic, and the survey was timed. Once the survey structure was completed, an email was sent to 165 potential KIs with a link to the online survey. Additional email reminders, with the survey link, were sent to increase participation. Out of 165 potential respondents, 105 participated in the survey. The overall response rate for the KI survey was 63.6%. Not all respondents answered every question; some questions have fewer responses and are noted in the heading.
The following results are charts with case counts (or responses coded for convenience), along with summaries where applicable, for the KI survey instrument. Many of the questions are “free form” or text boxes used to garner specific input without researcher influence or instrument bias; however, categorizations were performed in addition to the rote respondent data. Both methodologies are used in this report—direct observation and researcher categorization for simple analysis.
Results
The first question of the KI survey asked the occupation of the respondents. Q1 shows that almost 74% of respondents were in the health care or nonprofit organization fields. Education represented almost one fifth of the group; “other” being the variations of uncategorized choices.

Question 2 asks respondents to rank the overall health of the community on a Likert scale of 1-5. The weighted average answer was 2.74 out of 5. This score falls between “neutral” and “less healthy”.

The next question, Q3, was designed to determine the opinions of key informants on which agencies or organizations bear the burden of providing solutions or programs to address health needs. The survey provided a list of choices and participants were asked to select all that apply. The vast majority of respondents (92%) reported that government/public health agencies bore this responsibility. This was the highest-scoring selection.

Question 4 asks what populations are being inadequately served by local health care providers. The top four answers, from a list provided, were, in order: individuals with mental health concerns, un/underinsured, lowincome poor and homeless. Each of these answers were selected by over 50% of the respondents answering this question.

The KI survey committee also wanted to assess a “quality of life” metric with an open-ended question on what could be done for improvement. Question 5 lists recommendations and suggestions on how to address quality of life. These answers are verbatim and are tabulated with unedited free text lists. Also included is a chart of coded and categorized responses.


Question 6 asks for the top three most important health issues facing the community. Each issue is coded, categorized and tallied. The chart below represents the total numbers of each health issue listed.
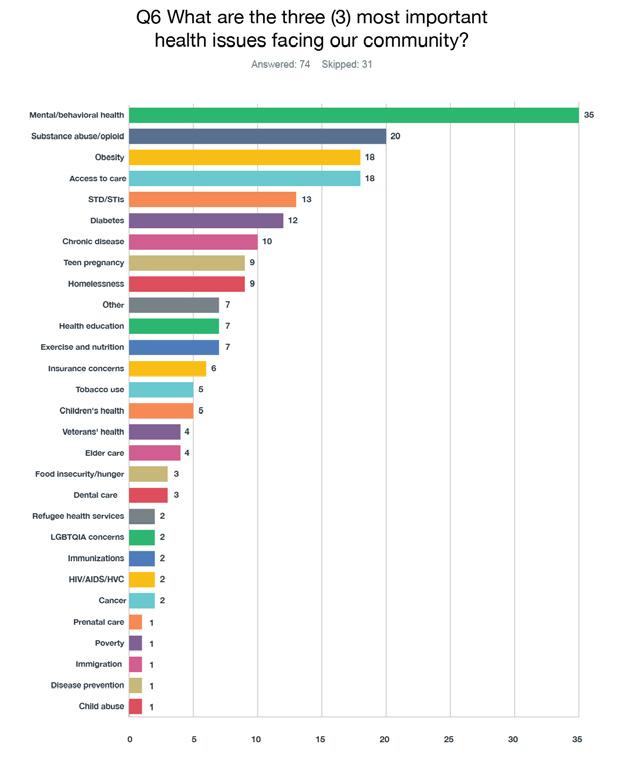
Question 7 on the KI survey asks what risk factors can be changed or modified to address previous concerns and issues. Again, these risk factors are coded, categorized and tallied. Question 8 follows up by asking what resources are necessary to address the risk factors mentioned. The answers were rich in data and context, but to add clarity, responses were coded and added into the Question 8 chart to augment the free text input.
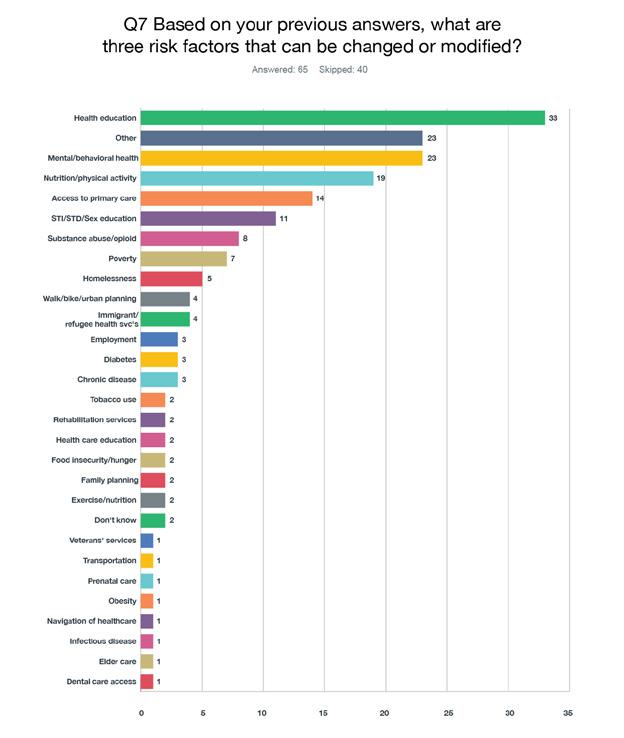


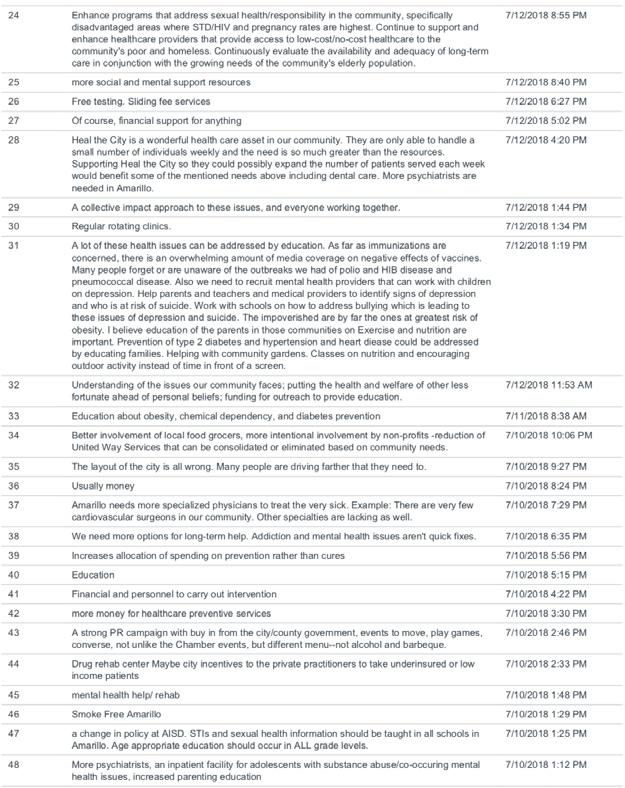

The next question begins to address children’s needs in Amarillo. Again, Question 9 asks for three important health issues facing children in the community. The responses are tabulated and referenced exactly as reported.

The tenth question (Q10) is a ranking question. The results are the weighted average and describe the highest rank. For instance, “Food security” ranked as the highest priority. Opioid abuse ranked lowest in the issues for children in this question.

Question 11 asks specifically what type of pediatric specialist the respondents would like to see added in Amarillo. These answers were coded, categorized and charted below.
Psychiatry/Counseling/Psychology are referenced frequently (27 out of 61 responses, or 44.3% of responses).
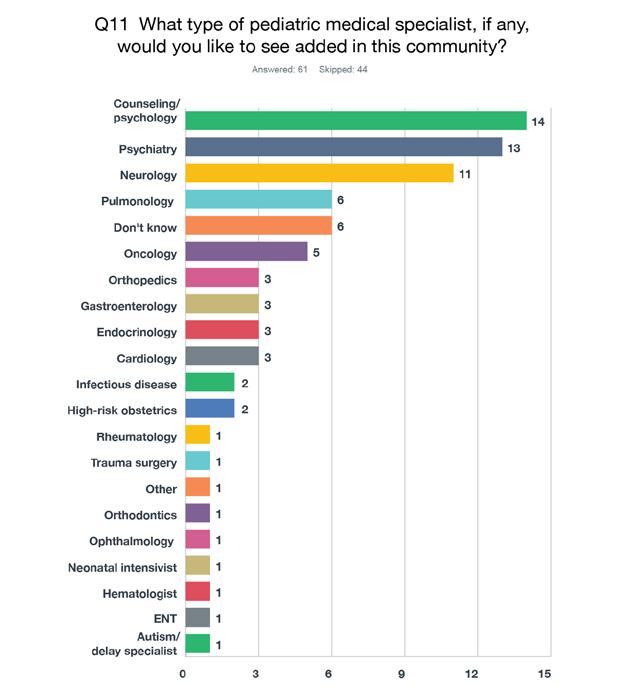
The next question moves to the important issues for adults, specifically ages 19-64. These responses were coded, categorized and charted below.
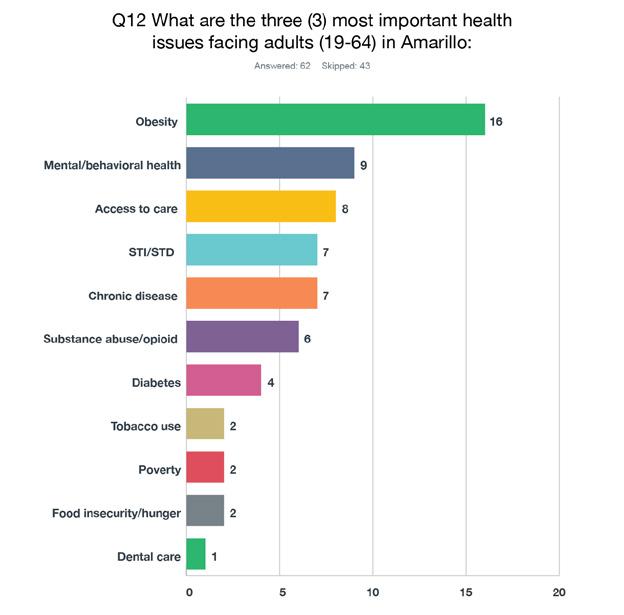
Question 13 asks respondents to rank possible issues for adults. The rankings are weighted, so the higher the reported chart number, the more important the issue was according to the participants. Health care access represents the top three answers (access for health insurance, primary care and mental health services).

The following table illustrates the percentage of respondents ranking each factor by rank number. For instance, 19.75 of respondents ranked “Access to health insurance” with a #1.

Question 14 asks about adding medical specialists for adults. This question had fewer answers overall, but the mental health/psychiatry trend continued. Twenty-one out of fifty (42%) reported that Amarillo should add psychiatry/mental health services for adults in Amarillo.
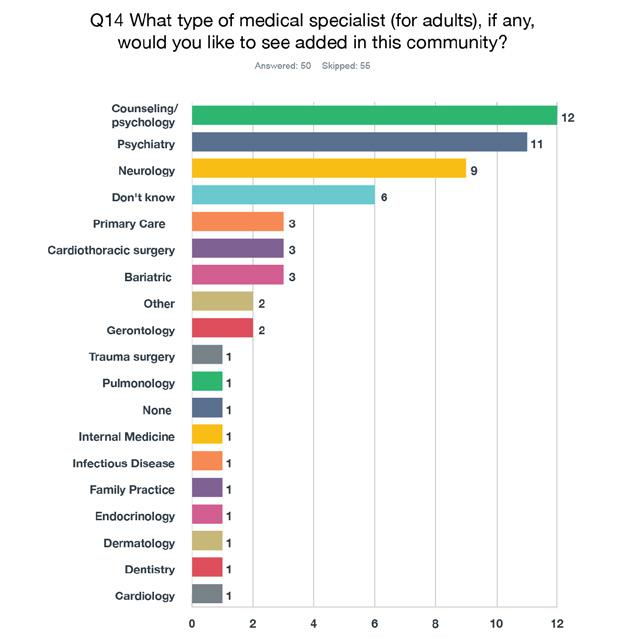
As could be expected, the next question asks about the issues facing seniors in Amarillo. Similar to previous questions, Question 15 asks for the three top issues and provides answers in free text form. Those answers were again coded, categorized and reported in the chart below.
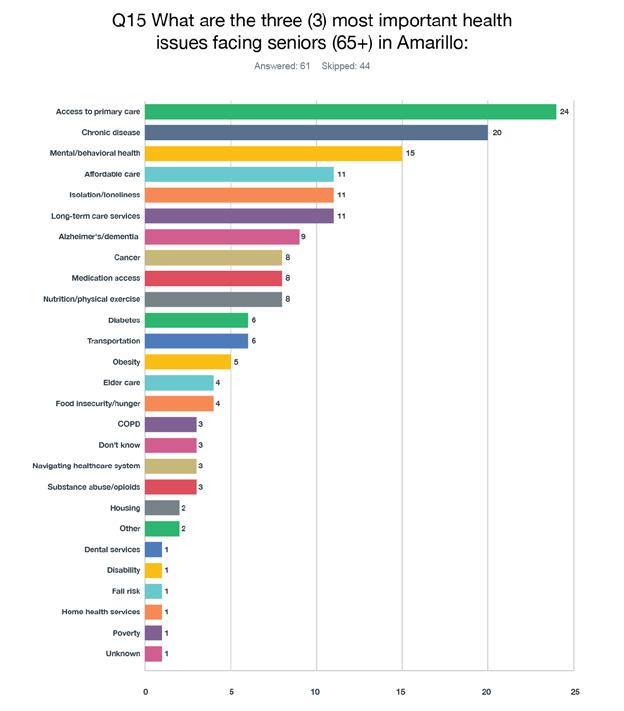
Question 16 is another ranking question that asks for issues for seniors. As before, the weighted average will show a higher number, indicating a higher ranking in priority. For seniors, the respondents ranked access to primary care, chronic disease management and food insecurity/hunger as the top three issues. Also, a table is included to show the percentage of respondents’ rankings by issue; for instance, 40% of respondents ranked “Access to primary care” as their number one issue.
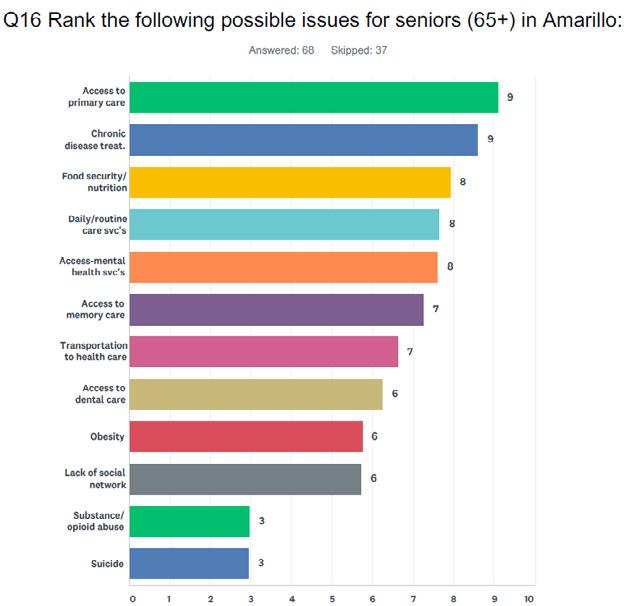

Question 17 asks a repeat question, only focused on seniors, for medical specialists to be added. Predictably, geriatrics were of interest to the group. However, this question had fewer responses than previous open-ended questions with only 41 responses. Those answers are coded and charted below.

The KI survey was designed so that as respondents moved through the questions, they began narrowing their input with the type and topic of questions. As such, the final questions focus more on next steps and future suggestions. Question 18 asks about one- to three-year priorities for Amarillo. Sixty-three respondents answered this question and provided open-ended answers that are tabulated on the next page. Also, answers were coded and categorized for ease of use. Both charts are descriptive as both summary data and contextual explanation.
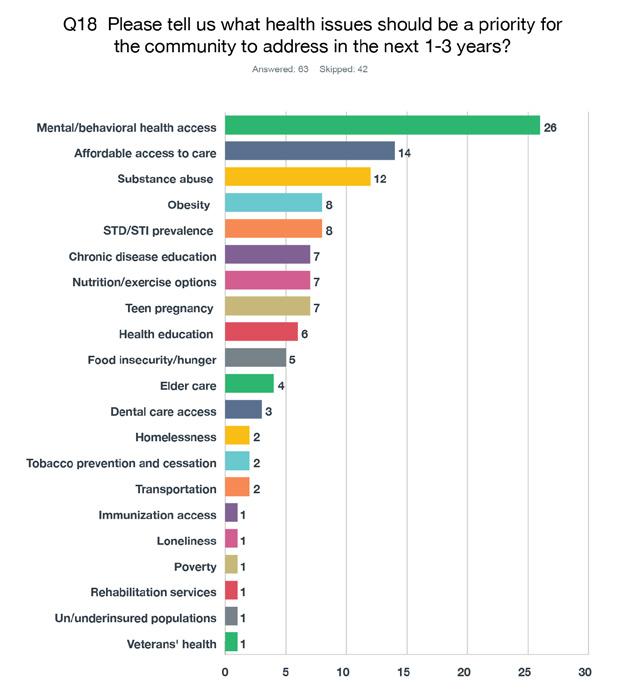


Question 19 asks about specific partnerships that COADPH could pursue to address the CHA results. This question provides direct input by KIs to offer opportunities for public health officials to address gaps and explore interventions with traditional and non-traditional partners.
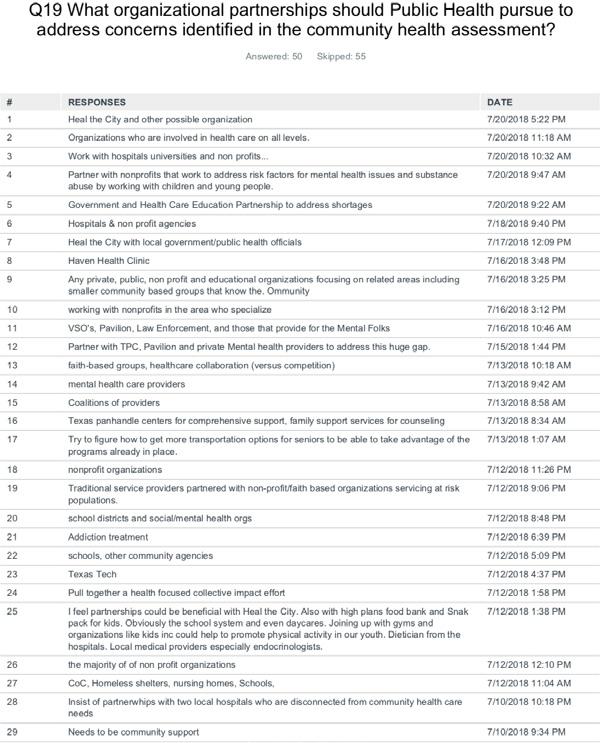
Finally, Question 20 asks about concerns that each respondent was unable to previously address. Only 25 respondents took the opportunity to provide input on this question.

Focus Groups
FOCUS GROUPS
Background
This chapter of the community health assessment (CHA) includes information from discussions with members of specific populations within the community, who provided qualitative information about healthcare topics:
• Persons lacking adequate health insurance – uninsured or under-insured
• Mothers of pre-term or low-birthweight babies
• Opioid use from the perspective of former users
• Opioid use from the perspective of professionals who work with users
• Refugee health
Participants in the focus groups were recruited by the Public Health Department staff, except where noted. All sessions were conducted in the Board Room of the Amarillo Central Library and were facilitated by AscentHealth Consulting staff. A set of questions were developed for each focus group, and participation in each group was good (see Appendix D for focus group facilitator questions). Participants were offered a meal and $50 for their attendance and participation. Participants agreed to be audiotaped for the purpose of accurately preparing this written report, however, to encourage candid discussion, they were assured that their names would not appear in this report and the recording would not be distributed.
Results
Focus Group #1 – Un- and Under-Insured Persons
The first focus group included 9 individuals who either did not have health insurance or were underinsured. They were recruited by Public Health Department staff members and two people who were early recruits participating in the session. The session was conducted at Amarillo’s Central Library on July 30, 2018. The following is a slightly edited version of the conversation with these participants. Please note that each new paragraph indicates a different person is speaking.
1. What does being healthy mean to you and how does a person get to be healthy and stay that way?
< Diet and exercise.>
< Well-being check-ups.>
< I don’t exercise. I know I’m supposed to.>
< Eat a balanced meal.>
< Eat vegetables; eat meat in different portions; eat sweets – a balanced meal.>
2. When you need to see a doctor or other healthcare professional, are you always able to see one?
< No. (Several people responded.)>
< Sometimes.>
< They’ll only work on me if I quit smoking. I need a hernia surgery, and they won’t operate unless I’ve
quit for a month. I’ve been smoking for 50 years. It’s not easy to quit.>
< I can’t get in to the doctor for days, so I go to the ER.>
< I used to go to J.O. Wyatt, but now I go to Texas Tech. It’s harder to get in to Texas Tech.>
3. Do you have a primary care doctor? Why or why not?
< Lots of primary care doctors want you to bring all your medical records before they will see you.>
< No, no one will accept me even with insurance.>
< I haven’t looked.>
< I have a nurse practitioner.>
< I don’t like the doctor they sent me to at Tech for my hernia. I didn’t like his opinion.>
4. Do you have insurance? If not, how what steps might you take to find insurance?
< Yes.>
< No.>
< I’m under a program for women. I can see a doctor with no co-pay, but I have to pay for medications. It helps.>
5. Have you found it difficult to get healthcare services for yourself or your family? How?
< Getting medical records is hard. One doctor sent them to me on a disk. I had to find an affordable place to print out 50 pages.>
< You have to ask if they take Medicare and Medicaid. They will tell you they don’t take Medicare and Medicaid. You have to go back to find out who will see you. Doctors move locations – you have an appointment and you get there and no one is there.>
< Or they take limited numbers of Medicare patients.>
< I don’t know what Medicare pays for. It throws me for a loop.>
< A primary care physician has to refer you for Medicaid.>
< You can’t ever get in the same day.>
6. What are the most important healthcare services that you ARE NOT getting?
< Dental.>
< I go to Texas Tech Family Medicine. I’m not getting good care. I see a different doctor every time. They didn’t tell me when I needed to get a mammogram.>
< I’m 26 and I’ve never gotten a mammogram.>
< The city has a dental clinic at the Civic Center sometimes, but we don’t get any information about it ahead of time.>
< Preventive medicine is non-existent for me because I don’t have health insurance. I haven’t seen a doctor in decades. I don’t have any big problems. I would have gone to the ER if I needed something.>
< Dental.>
< Eye care.>
< I sometimes go to the ER when my hernia is killing me. I need to get the surgery, but I don’t like the doctor.>
7. How do your healthcare providers treat you? Do you feel you are treated differently in any way because of your financial situation?
< Yes.>
< I’ve heard of that happening to other people, but it doesn’t happen to me.>
< No.>
< No.>
8. What services or places have helped you the most with your healthcare? How have they helped you?
- Why do you feel they have helped you more than others?
< My nurse practitioner is at Hillside Medical Center. She took more time to do the assessment and ran needed tests. I thought I had a cold. She diagnosed me with full-blown asthma with bronchitis. She took her time with me.>
< I went to Women’s Health Associates for issues with weight loss. I saw a woman who helped me as much as possible. I didn’t get the issue taken care of, but she did as much as she could.>
< No one really helps. They give you different medications. No one sent my daughter to a gastroenterologist to find out why she was losing weight.>
9. What does the community need to do to improve healthcare for people like you and your friends and neighbors?
< More clinics that accept Medicare and Medicaid.>
< More staff.>
< More physicians who care. It’s not the quantity, it’s the quality.>
< The VA offered to take me in and get my medications without a charge. But I will still go to my primary care physician in San Antonio because he has all my records.>
< I’m pleased with the doctors I have. I haven’t had to be referred to others.>
< I had a friend who was pregnant with twins. She couldn’t find an OB/GYN that would see her.>
< There is only one OB/GYN practice other than Tech that takes Medicaid. They have a quota.>
10. Do you experience any challenges with transportation when it comes to getting your healthcare needs met?
- Challenges with your job?
- Challenges with knowledge or understanding about medical topics?
< My job will let me off to see the doctor.>
< Doctors don’t explain what’s going on. After I had my son, Northwest Texas Hospital said I owed them money. But I gave them my Medicaid information. I don’t understand why I have to pay now.>
< I have to take the city bus to the doctor. I have to leave early and hope it doesn’t break down.>
11. If you could change anything about the way you get your healthcare needs met, what would it be?
- Can you think of any services you would get if you had insurance or could buy any exam or procedure?
< Have a more personal relationship with my doctor. At Texas Tech, there are too many doctors, and you have to make a request if you want to see the same doctor. Then, you’ll have to wait two to three weeks to be seen.>
< Sometimes I have an appointment scheduled and have to wait two to three hours to be seen. And then I find out the doctor’s not in or is on vacation. I have to reschedule and can’t be seen for two more months.
< The receptionists are sometimes rude.>
< Dental. (3 responses.)>
< I’d get an MRI on my shoulder.>
< Colonoscopy, prostate exam and rotator cuff repair.>
< Eye care.>
< One doctor insisted I had gout. I said I knew I didn’t have gout. He gave me medication for gout anyway. I don’t go there any more.>
< An optometrist costs $65 for a check-up, but the frames are expensive. One optician found some glass that fit my existing frames. That was a blessing.>
< Once my daughter went on disability, they took my son off Medicaid. They said something about “buy-in” but I don’t know what that means.>
12. What services do you want for your family that you don’t currently have?
< Life insurance. I have six kids. They won’t let you have the whole family on one policy, and I can’t afford multiple policies.>
< Good medical, dental and eye care insurance.>
< Once you reach a certain age, they kick you off your parents’ insurance.>
< My vision changes every time I go to the eye doctor. A lot of insurance will charge you two times for exams for glasses and then contact lenses.
13. Let’s go around the room and give each of you the chance to tell us anything else that you thought of or wanted to mention.
< I live on the north side. A lot of things are not advertised there. They don’t target the 79107 area. We miss a lot of information. I would like to have more information about medical care and meetings in the community.>
< When they sold the hospital, the funds were supposed to be used for an epidemiological study in low-income neighborhoods. Good nutrition is absolutely important. The safety net is important – food stamps and SNAP. People have been disenrolled in programs and it’s impacted hundreds of low-income individuals and families here.
< I can always go to the VA. Medicare pays for everything. I’m not worried.>
< Make information available about programs, like flu shots, sooner. I watch the news. I don’t buy the newspaper. A lot of things we find out by word of mouth, but it’s often the wrong information.>
< Put things on the internet. Create an event on Facebook.>
< Put information on billboards.>
< You could send a postcard, like they do to tell you there’s a sex offender in your neighborhood. And like the information about school supplies – I’ve seen that for months.>
< This is a wealthy country. Everyone should have insurance.>
< Some doctors shove their opinion down your throat.>
< They told me my son should get a flu shot because he had asthma. I told them I didn’t want it for him or for myself. They don’t listen. I finally agreed to get the flu shot and I got the flu three times that year.>
< We need better healthcare here. I think about going to Lubbock. We shouldn’t be taking in other people when we can’t help the people who are here.>
< Doctors don’t take enough time to explain stuff.>
< I heard your more prone to get the flu when you’ve had the shot.>
Focus Group #2 – Mothers of Pre-Term or Low Birthweight Babies
The second focus group included 14 women who had delivered pre-term or low birthweight babies. They were recruited by Public Health Department staff members. The session was conducted at Amarillo’s Central Library on July 31, 2018. The following is a slightly edited version of the conversation with these participants. Please note that each new paragraph indicates a different person is speaking.
1. Before you were pregnant, what did you know about prenatal care? … in other words, how to care for yourself while you are pregnant?
< I didn’t know anything. (4 women agreed with this statement.)>
< Taking your multivitamin to prevent low iron.>
< To eat healthy.>
2. During your pregnancy did you receive any information about pregnancy and childbirth? (e.g. Medications, food/nutrition, what you can/cannot have during pregnancy, prenatal vitamins.)
- Where did you get your information?
- What type of education helped you the most? (e.g. Through the doctor’s office, friends, family, brochures, etc.)
< I got information from CareNet Pregnancy Center and other pregnancy places.>
< I was told to take vitamins and not drink as much caffeine.>
< They gave me my options: adoption, abortion.>
3. Did you consider yourself healthy before your pregnancy?
- Did you make any lifestyle changes before or during your pregnancy? (Probe, if needed: Quit smoking, drinking, etc.)
Answered “healthy” = 7
Answered “not healthy” = 6
< I took a child development class in high school where I learned. (6 indicated they had taken the class.)>
<WIC taught me how to cook healthy.>
< I stopped eating hot Cheetos, seafood and pasta.”
< I stopped partying and drinking.>
< I got shots to develop the baby’s lungs.>
4. Did you receive regular prenatal care during your pregnancy?
- If not, what kept you from getting care?
- If so, how did you select your healthcare provider?
Note: All participants indicated they had received some prenatal care. They were all covered by Medicaid and all went to a hospital for delivery.
< I didn’t get prenatal care until I was six months pregnant. I was young and scared.>
< I didn’t find out I was pregnant until I was seven months.>
< I got care at five months.>
< Second month.>
5. For those of you who received prenatal care during your pregnancy, how far along were you when you called to make an appointment and how soon did you get an appointment after you made the call?
< Month 2.>
< After miscarrying twice, I went to the ER and found out I had a weak cervix.>
< I got an appointment a couple of days after I called.>
< I got an appointment about a week after I called.>
6. Do you think your insurance status affected your care? If so, in what way?
< Yes, they were rude and didn’t treat me the same as others. I was younger, and they didn’t think I knew anything.>
< I had to pay before I could be seen, but otherwise, I didn’t get different care.>
7. How did your healthcare providers treat you? Did you feel you were treated differently in any way because of your financial situation?
< The doctor was kind, but the staff looked down on me because I didn’t have (private) insurance.>
< My doctor stayed on top of things and treated me good. But I did see differences in how Medicaid patients were treated by others. The nurses treated me different. Even the questions they asked me were different – they were more stern and aggressive. They did take their time – I wasn’t just a box they checked off.>
< I waited longer in the waiting room than others.>
< Even the drugs were different (for Medicaid patients.)>
8. During your pregnancy, what good things happened to you and what went well?
- Who helped you?
- What free services have you found to be helpful?
- Was it easy for you to navigate social services, if you needed them? What would make that easier?
< During my third pregnancy, I got shots and surgery to strengthen the cervix, so I didn’t have another miscarriage.>
< Being on WIC was good. They taught me what to eat and how to take care of myself. (Several participants agreed.)>
< I don’t think they do this anymore, but I had a lactation specialist come to my house to help me.>
< Food stamps helped me eat healthier.>
< I got help with my utilities while I was in bed and didn’t have an income.>
< The United Way helped when I ran out of milk. WIC referred me to them. >
< It’s easy to find services through churches.>
< I got a list of resources from CareNet Pregnancy Center. You can get car seats from CareNet and the hospitals, classes, formula. CareNet has two or three locations. I heard about them because they do free pregnancy tests and free sonograms. They are pro-life.>
9. During your pregnancy, were there things that happened to you that weren’t good?
- What did you need that you didn’t get? (e.g. Support from family, financial support, healthcare services, etc.)
< Heartburn.>
< Rumors. I was a young mother at school, and everyone talks about you.>
< I fainted, and I fell asleep in traffic because I was anemic.>
Note: All indicated they were supported by their families, including financial support when their families could help.
10. Looking back, what were your biggest challenges during pregnancy and childbirth?
< Drinking glucose.>
< I had to give blood samples for 16 hours one time and I couldn’t eat during that.>
< During my first pregnancy, I hemorrhaged at home and was bleeding out. I showered and laid with my legs up. The ER doctor finally saw us at 3 p.m. The nurse was rude. They couldn’t get a blood sample and stuck me many times.>
< I was so young. They treat you differently. Like, they asked me four times: Do you know who the father is? Are you sure?>
< My OB was sweet, very nice. But the nurses were not as nice. Some were hard on me. They kept asking me to get a flu shot. They’d ask if I wanted to give up the baby. They weren’t listening to me. They kept asking and trying to hound it on me. I felt they didn’t think I was responsible enough.>
< Morning sickness.>
< 46 hours in labor.>
< Contractions.>
< They pushed on my stomach after delivery, and it hurt more than the contractions.>
< After 40 hours, I was only dilated to a 5, so they did a C-section. I was uncomfortable with the idea of it. The spinal epidural didn’t work, so they put me to sleep for the emergency C-section. They didn’t fully explain why they were doing it. My husband didn’t have a good job. I would tell them I was in pain, but they wouldn’t give me anything because the insurance wouldn’t pay.>
< I would Google and watch videos.>
< I had a C-section at age 16. It was scary. I was in the hospital for nine days, and my baby left before me.>
< My first pregnancy was breech. I had an emergency C-section. I got pregnant two more times and lost both babies. I was diagnosed with a weak cervix and had surgery and then bedrest for the next pregnancy. It was hard. After the last birth, I had no choice but to have my tubes tied.>
11. What went well for you during pregnancy and childbirth?
< I had a healthy baby.>
< The hospital helped.>
< I told them I didn’t want an epidural, and I has happy that I didn’t get it.>
< My water broke in the morning and I went to the hospital at night. They gave me something to keep the contractions going. I had lost a lot of fluid. I got an epidural and at 10:01 p.m. had the baby. My doctor helped. I was young and scared and in pain. The nurse put a ball between my legs, and it was very uncomfortable. When the doctor came in, he took it away. I just wanted to lay in the bed the way I wanted. I was glad the doctor listened to me.>
< My doctor sent me a rose after the delivery. It felt great.>
12. What were the hardest parts after delivery? Is there anything you needed that you didn’t get?
< Sleep. I was scared to go to sleep because I was worried for my baby.>
< Too much company.>
< I had to wait before insurance would pay for more pain medication. I felt I got nicked in the spine when the epidural failed.>
< They forced me to walk before I was ready.>
< One nurse was kind to me and one was not. I was scared to say or do anything. I was not sure if it was supposed to be that way.>
< One of my daughters married young and had her children when she was young. The other was unmarried when she delivered. The way my unmarried daughter was treated was very different from the married one. The nurses would talk to her like she was doing something wrong. She would tell them she wanted to wait until her boyfriend – the baby’s father – came, and they would tell her it didn’t matter if he was there. On the other hand, they were kind and helpful to my married daughter.>
13. After the birth of your child, what were the most important factors in your success as a mother?
< Breastfeeding.>
< The milestone meetings.>
< I was an older mom, and they told me I couldn’t breastfeed.>
< My kids went to Opportunity School because I wanted to be sure they got a good start. They have a program called Parents as Teachers, and it was helpful.>
< The Parents as Teachers program came to my high school and taught us about how our kids were developing.>
< At Palo Duro (High School), we had Child Development class. They made us wear a pregnancy suit that was heavy and pressed on the bladder. We took home a baby that cried more than my own baby.>
14. What does this community do well for expecting mothers?
< CareNet Pregnancy Center is great. They have so many classes. They give you onesies and blankets for coming to class. They build you up.>
< The Downtown Women’s Center and United Way help with baby needs. Also Martha’s Home.>
< You can call 2-1-1 and Family Support Services to get lots of resources and help. You can stay in houses with other teen moms.>
15. What does this community need to do better to support expecting mothers?
< Be more caring and supportive.>
< Everyone makes mistakes. People judge you for your mistakes.>
< More education for fathers and what to do – especially teen dads.>
< More open about birth control. Kids should be able to go to their parents for help.>
< There should be more education on types of birth control. The doctors and nurses didn’t help me know about the differences.>
< They should talk about postpartum depression. The Depo (Depo-Provera) shot made my depression worse. No one had asked if I had depression.>
< My implant made me gain 70 pounds. It makes you angry. I gained so much weight.>
< We need more education about STDs and HIV. People don’t know you can get these even if you’re on birth control.>
< The Nurse/Family Partnership helps educate you in the first year of the baby’s life. It’s only for firsttime moms. It’s helpful.>
< We need more advertising for these programs.>
< We need to tell moms they can still have a good life, even after they have kids. They need to go to college and continue on.>
< Palo Duro and Caprock (high schools) are getting rid of parent programs.>
< Workforce Solutions will offer you scholarships, but they don’t tell you that before you enroll in college.>
< A lot of people don’t know about these community programs. Many are income-based and people don’t think they will qualify. Head Start, for example.>
< WIC has a program for parents of 3- to 4-year-olds that people don’t know about. I wish I had known about it.>
< When I had my baby, I got a big bag full of information. It was overwhelming. It would be better to get a little bit at a time.>
16. Let’s go around the room and give each of you the chance to tell us anything else that you thought of or wanted to mention.
< I wish I had been given more postpartum information.>
< People need to know how to have the birth control / sex conversation. Growing up, that was off-limits in my home.>
< I wish I had known more about how to take care of myself.>
< People need to be told not to stop living because you have a baby. Go to college.>
< I started out in government apartments with $50 rent and saved a lot of money living there for two years. Then, I bought a home and have now bought a bigger home. Kids need to know that takes time, but it can be done.>
< I work with kids who are like I was. I tell them to go to school. It makes a difference.>
< Workforce Solutions can give you lots of help – classes, transportation, etc. I wish I had known about it.>
< I’m a single mom with two boys. I try to help others. I tell them don’t stop trying and don’t rely on a man.>
< I think people in healthcare should treat young people the same.>
< Everyone needs a support system. The mom of one of my friends put all of us friends on birth control. Her daughter got the shot, and the rest of us got the pill. Everyone on the pill got pregnant. The shot is better.>
< I’m glad there is more information today. Everyone needs to try to get more education and find ways to go to college.>
Facilitator asked: Where should you go to get birth control?
< School>
< Haven Health – they will give you birth control, but they don’t tell you the differences between the types.>
< I’d like information on the Public Health Department’s Facebook page.>
< Parents need resources to be able to talk to kids.>
< I’d rather be with my peers in a group setting to learn together.>
Focus Group #3 – Opioid Users
The third focus group included nine people who had used opiates. They were recruited by Public Health Department staff members, who reached out to local nonprofit organizations. The session was conducted at Amarillo’s Central Library on Aug. 1, 2018. The following is a slightly edited version of the conversation with these participants. Please note that each new paragraph indicates a different person is speaking.
Participants generally said they had tried many substances, but indicated the following as their drugs of choice:
• Hydrocodone
• Opioids
• Hydrocodone/morphine/all other drugs but heroin and LSD
• Heroin/meth
• Alcohol/meth and other drugs
• Everything except intravenous drugs
Introductions:
< I was on hydrocodone for six years because of my back pain and arthritis when I had multiple injuries in my body. So, I’ve been on several different kind of opioids, and I just don’t like them, so I don’t take them. I’ve lived with the pain.>
< I was addicted to opioids for eight years. My entire family’s addicted to opioids. It’s still an active addiction with them. And I’ve got almost six months clean. They just took over. It took over my entire life. So, I’m glad we’re here.>
< I’ve been a user for 23 years. I’ve been clean and sober for five now – five months. I’ve just been in and out of treatment centers and stuff like that to try to cope with the – what I’ve been struggling with.>
< I started out with alcohol. I was a meth user for 15 years. I’ve been clean – it’ll be seven years next month.>
< I lost a husband five years ago. He was a drug addict and alcoholic. And I’m struggling with my children. We did drugs.>
<I have siblings and my sons, too, are addicted to weed. But I›m afraid of other drugs. I›ve done weed when I was a teenager. Being a parent, you just kinda choose. And for me, it was to raise my kids well. Be able to pass a drug test. Get a job and stuff. Just being positive, try to find some research.>
<I’ve been on drugs since I was 10. Did them all except for shooting up. I’ve been clean from that for, I guess, nine years now trying to help my brothers and sisters with not doing drugs. I raised my sister’s kids. I’m just here to help other people try, anyways, because nobody can really be helped unless they want it.>
< I started off using ketamine and Myonal when I was 12 years old. And alcohol. I’ve been addicted to everything, basically, except for heroin. I think heroin and acid are the only things I haven’t done. Meth was my main drug of choice. But I always would substitute for something else when I would try to stop. So, drinking. Then eventually I did get addicted to pain pills – hydrocodone, Dilantin, morphine, whatever. So that’s closest to opioids, but I’ve never done heroin that’s why I don’t have any experience with that. But I’ve also been addicted to crack cocaine and benzyls. I have been clean for three and a half years now.>
< I have all kinds of experience in this role. I work at a transitional housing organization, so all my guys have substance use disorder. And I myself was a drug user for 18 years on methamphetamine and
heroin. I’ve done every drug under the sun more than once. I’ve overdosed four times. So, I’ve got plenty of experience.>
1. How did you begin taking opioids/drugs? *Opioids include prescription drugs (like Oxycodone and Hydrocodone), illegal drugs (like heroin) and synthetic drugs (like fentanyl).
< Oh, I started that off when I was 17. I had a surgery that they had to go in and remove an inch of my colon. And the doctor gave me 250 or 350 hydrocodone pills a month for 18 months. And after that once they quit prescribing them to me, I went to the streets to start getting them. And then, the hydrocodone weren’t strong enough. So, then I would switch to oxycodone. And then, those are really expensive. So, I switched to heroin because it was cheaper, and it was stronger and lasted longer.>
< I have a similar experience. I started off with a surgery, gallbladder removed. And it was prescribed while I was attempting to recover. And just being an addict period, it’s just not good for me to be put on stuff like that. I hadn’t experienced it before. And so, I liked how it felt – hydrocodone. When I ran out I did the exact same thing. I would, actually, go to the doctor and come up with excuses and the reasons why – back problems. All of a sudden, I was trying to get them from the doctor. And then, if I couldn’t, I would go to the street and get them as well. The same thing – oxycodone, is it? And I didn’t really like that very much. I liked Dilaudid. That’s another painkiller, by the way. I would just eat them to make them work faster.>
<And then the oxycodone you could crush up and liquefy and shoot up.>
< I was a meth user. So, I used the meth when I was 12, 13. And I would just substitute it like I would just stay high. Meth was my drug of choice. So, I liked to be up here but sometimes you want to get back down here when you’re up for too long and that’s kind of how I started.>
< Opioids didn’t bring me down, but they made me want to tweak and do stuff, and meth was kind of the opposite. Meth brought me down, so I didn’t want to do anything. And then opioids, actually brought me up.>
< I was about 15. Experimenting with them, you know. Basically, I was raised around drugs. Not to put it off on nobody, but I mean, the mindset was easy access. I didn’t have to go anywhere else to get it. And then that just escalated into this becoming my lifestyle. Then, I basically turned to the streets to find comfort. It just became my lifestyle, you know. I graduated from the streets to prison, of course. Being in prison, you learned more, coped with different people, and just gradually educated. It was the lifestyle.>
< I didn’t know for a while if I was addicted to the drugs or the lifestyle.>
< As victims or enablers, you can’t help others if you don’t get the things you need. I was addicted to a bad environment. You have to try to find the real source of the problem. We have to be there for each other, make a choice, become stronger – part of life and growth. Being there for one another sets a different tone. You reach out. You’re healthy. You get the help you need, and you continue to make those changes. You’re doing it every day. You make a choice, and you live according to it. You become stronger for one another. When we’re weak, the other one’s stronger. I started at a young age. In the classes they’ve told me, most of the times that’s where I, actually, stopped growing. I didn’t mature to other levels. And it’s not so much that I achieved much so far in life, but I’ve experienced all the things that I can come back and relate to now and what’s made me stronger in those areas. My sister came to me and told me to start with a fresh foundation – it’s a new day. I just hope that everybody gets what they need to get through the day.>
2. How have you obtained your opioid/drug prescriptions? Other drugs?
< Legally.>
< Illegally.>
< Both.>
< However. Wherever. Whatever.>
< However.>
< Go to the doctor. Go to the Emergency Room. Go to the local corner house. Go to the guy in the car –wherever.>
< You just lie – lie and make an offer to somebody else who has the prescription.> <Especially, veterans. Veterans all have a prescription to opioids.>
< I got hydrocodone for about $10 a pill. That’s how much they’re worth on the street.>
<And we pay a lot.>
< I didn’t say I paid $10 a pill. I said I sold them for $10.>
3. Did you have a primary care doctor who gave you prescriptions for opioids or sent you to a specialist for help in recovering from drug use?
< Yes.>
< Yes.>
< Yes.>
< So, my doctor also sent me to a psychiatrist who gave me a prescription for Suboxone, and I was on that for two years. It helped, but it was also a synthetic opioid.>
4. What factors make getting drugs easy or hard?
< It’s not hard at all.>
< I don’t know if there’s any factors that make it easy or hard. It’s just life – it became part of life and how I had to live it. It wasn’t really a choice. So, it’s just what I had to do every day to make it through the day.>
< Other people get up every day and their mind says, “I’m gonna get up and take a shower and go to work or work out,” whatever. But the mindset of an addict is they go to sleep – if they go to sleep –thinking about how they’re going to get their next fix. That’s all your state of mind.>
< Like you wake up thinking, “Hey, I need to get some breakfast, so I can have some fuel for the day.” I woke up thinking, “Oh, I need this and this (drugs) so I can make it through my day.>
< It’s just like normal people would need food as how I needed drugs. I just needed that to live.>
< From my personal experience, it’s harder to get opioids than it is to get the other drugs.>
< Oh, yeah. Because people run out of opiates, and it’s a controlled substance. And doctors are starting to crack down on people.>
< You resort to heroin, and it’s easy to get. You can get it on the Boulevard on every corner.>
< I had someone approach us at Walmart. I was clean at that time. I was like, “I’m in Walmart.” Like I was shocked.>
< At the local bars, they knew – they just, automatically, just come up to you, “Hey, you want some of this?”>
5. What was the worst part of your experience with opioids or other drugs?
< The nausea and the stomach cramping on hydrocodone were bad. After I was on hydrocodone for six years, I told my doctor, “I need some more.” He said, “No. I’m not giving you anymore.” I’m like, “Why?” He said, “You can get addicted to it.” And I thought, “Well, you should have thought about that six years ago.”>
< But, you know, I mean since then, um, I’ve gone to a couple of different doctors. And my pain is so unbearable sometimes that I can’t sleep. Every opioid they gave me made me have horrible, horrible nightmares of the devil chasing me and he was red in my dream. And the nausea was bad. I thought,
you know, “If you can’t give me something that’s not going to give me all these bad side effects, then I might not take these drugs.” But the doctors get aggravated with me because I did not want to take opioids and I tell them, “No. I need something for the pain, but I don’t want opioids.” And they tell me, “Deal with it, then.” >
< Which is crazy. I actually had a doctor say that to me, too. I’d say, you know I’m an addict. I don’t want you to give me morphine. And they were, basically, like, “Well, if you don’t – if we don’t give this to you, you’ll not get anything.” I mean, how are you going to tell an addict that? I’m telling you I don’t want it, but it’s either that or double the pain.”>
<Back in the day you could take some pills and you wouldn’t get some of these side effects. Now, the doctor says either take this or deal with your pain.>
< … and suffer. Or you get addicted to all the stuff with all these other side effects, you know. So, either way you’re going to be hurting.>
< Two stories to relate to these experiences with drugs – one would be my first overdose where I stayed awake for six weeks on meth and cocaine. And at the end of the six weeks, I checked three heads of acid. We were at the farm and none of my friends would call the paramedics. But my brother was there, and he ended up going when we met the paramedics. And I remember they dragged me to the ambulance. I told him, “Brother, I’m in the clouds.” I could feel like I was just floating in the sky like my body was no longer attached. And on the ambulance ride back my bowels evacuated, my bladder evacuated, and I was dead. And then got revived and was in a coma for seven days. And when I got out of the coma, I had to learn how to walk and talk again because I could no longer form my words, and I didn’t have the stability in my body. So that was probably my first worst experience, and then my last worst experience was my last overdose. I’d gotten to the point that I really didn’t care if I lived or died anymore. And so, I just wanted to see how much I could do. So, I did a gram and a half shot of meth followed by a gram shot of heroin. And the people that I was with left me for dead, took my wallet and the keys to my truck. And left me in the hotel room, and had the maid not come through to do a room clean, I would have been dead. She found me blue in the face. And called the paramedics, and when I woke up, I had all the tubes down my throat. And when they finally got the tubes out to where I could breathe and talk, the first thing I did was call someone that I knew to have my reserve bottle of hydrocodone, and they brought me 300 hydrocodone that I took. As soon as they got there, I took a good 20 or 30 of them. And continued to take them until they released me from the hospital. And then went right back to it. So those were probably my two worst experiences with drugs.>
< My worst experience was my kids telling me they never wanted to talk to me again.>
< Mine was when I quit completely, and my last drug was crack cocaine. I was on there maybe three weeks straight. And my daughter’s Dad left me, my sister wasn’t there. It was just me and my daughter, and it was really late at night. She was asleep. I had a crack load, just a table full of crumbs all over the place, and now I can just imagine. But I started seeing shit. I started seeing cops. I started seeing my landlord right in front of me. And I started seeing him talking to cops. And I ran to my daughter’s room.
I’m seeing blue lights there. And picked up the phone and called her dad and told him, “Come here,” and, “They’re here for me. They’re taking me.” And I grabbed everything to flush it down the toilet. That was it for me. He came in there and started yelling at me, “What’s wrong with you? There ain’t nobody here.” I was all curled up, scared out of my mind. And that was it. That was the end for me. I mean, I never had a death experience or anything like that. But to me that was a wake-up call. I was going to lose my daughter. I guess it was just in my mind. And I didn’t want that anymore, didn’t want it.>
<My experience was a spiritual warfare thing, where I’d encountered, demons, I’d say. And the people around me were speaking Latin, like really speaking Latin. And it was just crazy. I’ll never forget it.>
< I’d say withdrawals. You feel like you’re dying. Meth clinics don’t help. I see fewer people able to kick heroin.>
< I see less and less people get clean off heroin than I do any other drug. That’s the drug that I see most people that are addicted to not be able to get out of it.>
< I agree. And not just the physical but the emotional. The depression that follows it. And the complete loneliness and the emptiness would be one of the worst parts. Not so much the physical and the pain. But the pain emotionally. >
< I came to fill the void with drugs. It makes you have a selfish mentality. I OD’d and then when I came out of it, there wasn’t anything else for me. If you’re tired of living one way, you need to do something else.>
< I was living in this crack house, and there was nothing in there but this stain-covered mattress. And I remember there was a struggle with a guy beating on a pregnant woman, and they’re shooting up. And I started thinking to myself. I was like, “Man, I’ve only got two choices here. I can either kill myself or I can change.” And it was at that point that I finally decided to change.>
6. Have you received help? If so, what services worked well for you?
< While I was in and out of prison, I’ve always held onto the spiritual aspect, and I’m trying to get that kind of help more in line to my lifestyle now. If you feed it, that’s what you’ll become. So, there are other avenues to be able to get help like Celebrate Recovery. First, you have to know that you need it.>
< I had several different programs, but the one that has stuck and the most recently helped is I went through the ARAD program. The one that they had for me for the shelter and not the new one. I also got help at Narcotics Anonymous and Another Chance House. So, those three programs are what worked for me.>
< I’ve gotten help outside of Amarillo as well, I’ve been to the Pavilion many, many times, like at least 30 times and every time was to detox. They give you these little strips you put under your tongue, but never has a detox helped me in Amarillo or out of Amarillo. It’s funny because when I got locked up in jail – they don’t give you nothing to detox. But, I happened to detox, and I didn’t die. Detox never really worked for me. If you’re not ready then, you’re not really truly ready, rock bottom ready, none of these programs are going to help but, when you are ready, yes, programs like ARAD, the DWC program and Another Chance House, all those places will help. And yet, I’m with him, the spiritual aspect of it is so important because that’s the only thing that replaces that emptiness inside of you. If not, you’re going to start seeking something else to replace it. That’s the way addiction works. We use one thing, we’re always substituting something for something else, you know what I mean? But also, I’m a firm believer in the 12-step programs whether it be AA, NA, CA – we don’t have that here – but Celebrate Recovery, whatever it is that you choose to go through. I truly believe that is the only way. That’s my personal opinion.>
< And a lot of these places here in Amarillo, they can help in some ways but, like she says, if you don’t want it, it’s not going to work and a lot of people – a lot of the drug people that are out there in the streets – don’t have the money for these classes or AA meetings or you know, resources to help them. They charge their families or them or whoever to put them in these places. You know, my sister went to Lubbock, spent $500 and for nothing because, she got out and started doing the same again. So, honestly, I didn’t use nothing – nothing helped me. I didn’t go to classes, I didn’t talk to people or AA or anything like that. I did it myself, at home with my daughter’s dad. We got back together. He’s the one that helped me. I had to stay away from my whole family. I couldn’t be around them because, they were doing it and I wanted to do it with them. So, you have to stay away from the people that you were doing it with because you’re just going right back to it. It’s not easy to quit when you’re still hanging around with the same people and doing the same thing with them.>
< Those are the ones that are like, “Okay, let’s go together.” I mean, being the one that hasn’t really done much (drugs), sometimes you want to go get lost with them, just to be with them. So, I’ve tried to say to my sister, okay, we’re going to church. [Laughs]. If we can do that together. I mean, because I didn’t want to get mixed up in all that when she was prostituting and when she was really lost, a lot of people didn’t know I had an older sister, so they would think that it was me because I went to school here, and they would think that I was out there on the streets because we look so much alike. The only thing that saved me is church. I went to every program: NA, AA, prison, none of that worked for me, none of it.>
7. What are the biggest challenges to becoming sober and staying sober?
< Staying away from the people that you care about. I mean, the people you use with, essentially, it’s like a bond of friendship. It’s not really, but especially when it’s family, you have to distance yourself
from those people and love them from afar, and that’s difficult to do.>
< Getting sober is easy, it’s –>
< Staying – yeah. It’s true.>
< Staying sober, that’s the challenge. And, that’s where having a good support group and, I believe, it’s a very comprehensive package. It’s not just about not using, you have to actually work on the entirety of your life – financial status, job status, education, friends, parents, all your relationships, friendships. It’s a total life makeover, you can’t just focus on not using because if you’re just not using, then you’re just a dry drunk or a dry addict, and life’s not fun that way, and so, you don’t ever get better. If you’re not getting better, then the chances of relapse are much greater, so you have to have a complete overhaul, I believe, in your life and there are multiple facets to that, that help you move forward and continue to grow.>
< I think, starting at rock bottom is extremely hard. They call it being comfortable in your own shape you know, and you’ve given up on yourself.>
< Gets to desperation.>
< It’s hopeless. When you’re hopeless and you’ve given up on yourself, you don’t even believe that the help’s going to work. And, it’s probably because you’ve tried it numerous times and failed because that’s what addiction is.>
< Addiction is being powerless, it’s not being able to stop. Not knowing what Step One is going to be. You don’t know where to start – you’re trapped. When I got out of jail – I was in jail for four months and I got out on probation and went to the Downtown Women’s Center, I knew that if I didn’t do that, I may not have stayed clean because I needed a safe environment with people that had good intentions – nothing but the intentions for me to do good. Yes, I could get a lot of guys or certain people to help me you know, but they want something in return. People that just genuinely have no other motive but to help you, and they have been experienced in this, they know what they’re doing and they step by step by step help you get to a place like where I am today, and that’s an amazing place. But like I said, the journey of a thousand miles begins with one step, and that’s important, that first step but also knowing what you’re doing, being experienced with people like us knowing how to help us rebuild our foundation. And like I said, I still 100 percent believe in the spiritual aspect of it – without my higher power, I would’ve never, ever, ever turned my life around – there’s no way.>
8. What does this community need to do to help people with opioid and other drug addiction?
< You need to get to the root of the problem just like what I was saying you know, they can push you to go into programs, but addicts need counseling. There’s a reason that we’re using, it’s not just because they want to be high, very few.>
< I think, as far as the community is concerned, just maybe a little bit more awareness about the disease of addiction. Also, I think, when we’re not speaking to each other but we’re speaking to the nonaddicted population, if we use terms more like ‘person in recovery’ rather than ‘addict’ because there’s a stigma attached to the term ‘addict’ or ‘alcoholic’ and when people hear that they just think, “Oh well, you’re worthless or you’re this or you’re that,” and so, I think just public awareness of what the disease is and what it does and, where it takes people in their minds, that would be a huge help because then, there would be a little bit more outreach for those that do need help and want help and don’t know where to turn, there would more places to turn. If the community-at-large was more aware of the actual situation that problem would end. I think using terms like ‘person with substance use disorder’ is more beneficial because it has less stigma attached to it.>
< I think, Amarillo would do good like, Lubbock is real big on sober living houses and stuff like that like, once you’ve gone through a program and you’ve graduated and you’re done and you have a place that you can go, like a sober living environment, where you can go after you’re done with that to where you’re around a bunch of people, so you’re not just going straight back into the same life you knew – >
< Yeah, and most people like me – I’m a felon now because of my addiction, and it’s hard to get housing, it’s hard to get jobs. So, like an affordable sober living house – housing where you can live and it’s not so expensive that you can’t afford it. I feel like that would be something good.>
< Or, even employment turn-around programs that would hire cons or felons, instead of them going back to the streets selling and doing and all that stuff. I mean, it’s hard for them to turn around – I say ‘them’ because I ain’t ever been in prison – I’ve been in jail but I ain’t ever been in prison. Thank God, I didn’t sink to that level. I had stole money from my boyfriend or my daughter’s dad but, other than that I worked for it. I didn’t pay a car payment or something like that, but I’ve never gone to where I’ve stolen somebody else’s property or money or stuff like that, and I’ve never done all that, thank God. But I didn’t have to, I stole it from the person that I was in a relationship with. But, my thing is, people look at an application and if you lie on the application, they’re going to deny it you know, because, “Oh felony. Oh no, we don’t want that. He stole, he’s going to do it again.” They don’t give people second chances, they say they do, but they really don’t. And so, the people turn back to stealing and doing drugs all over again.>
< So, I think we need more places like Another Chance House. It’s total transitional living, you start off, and they gradually add responsibility into your life until you can finally transition into your own life and become self-sufficient. We have job coaches and counselors and case workers, and it’s a full package whenever you get there. I mean, you start off in a dorm, and you work your way into a private room, and you work your way into a transitional house and step by step by step, gradually your rent increases and gradually your responsibilities increase and then, your freedom also increases as your responsibilities increase. It really is an amazing program. We have four different programs. Our shelter program, our transitional living program, our veteran program and our long-term living program for our veterans. Each program works a little bit different, but it’s just for men. We do have some that’s just straight out of jail, we have a lot that are straight off the streets. To get into the veteran side, they have to go through the VA. But on the non-veteran side you have to call in every day to get it, and right now, we have about a two-month waiting list. Whoever consistently calls every day – and we do keep logging them – and whoever is showing the persistence to call every day and they really want it, those are the people that get called in for the interviews to go through the program because they’ve shown the desire that they really want to make a change in their lives.
< Call every day, if you really want this, they don’t have time for people who don’t really want it, because there are people dying waiting for a bed that would give anything for that chance to recover. A lot of people call because they are sleeping on the streets, and they don’t want to be there anymore, and they just want a free ride. And so, we get a lot of people that call like that, but they are the ones that typically only call once or twice, and then they give up on it and they move on to another way of trying to live. The ones that really want it call every day and will show the persistence.>
< Those are the ones that are at rock bottom. The other ones just aren’t there yet.>
< Well see, that’s what I’m talking about – that program would actually be really, really good for women and men. >
< Facilitator: So, are there a lot of programs in Amarillo like that for men and women?>
< Yeah, they got one called ‘The Cottage’, isn’t it?>
< The Haven House and – >
< Downtown Women’s Center. Oh my God, it’s the most amazing program ever.>
<See, if they had more stuff like that for more people then, it would help.>
< Definitely, we need to expand the recovery community again. We’re going to have to because more and more people are becoming addicted, and it’s just becoming an epidemic. So, we’re going to have to expand, regardless. And then, you can’t go to Amarillo College now and do substance abuse counseling because they’ve done away with it. So, how many substance abuse counselors are we going to have here in Amarillo now if you can’t go to school for it here?>
< So, have you ever heard of lay-therapy? That’s basically, what we’re doing in AA and NA. We’re being each other’s therapist. I sponsor two people. And then, on the top of that, it’s hard to even go to school to do something to help other people because you have a record, but, it’s so ironic that it’s really only people like us that can help people like us because you have to experience it.>
9. What would make this community safer related to opioid and other drug use?
< First off, not prescribing it.>
< They’re trying, the doctors are trying to get down on it because they say that a lot of people are getting addicted.>
< Well, I know the new in-patient ARAD, the one over at Medi-Park they’re doing medication-assisted therapy, and public awareness classes on the opioid crisis. Maybe just a little bit more awareness would be a big help if more people would know about it and are able to attend it, that would be a big help.>
10. What services are needed to help people with problems related to opioid and other drug use?
< What we need is either to get ARAD to where they can take insurance or some sort of other funding that would allow them to bring some people in without it costing $15,000 a month.>
< I agree with that. You always have to send people to Lubbock to get treatment, we don’t have a treatment center and then, all of a sudden we get a treatment center here, and it’s for people who have money. Well, I’m sorry, but most people that are rock bottom or dying from drug addiction don’t have money.>
<So, that program is no benefit to us. It doesn’t help.>
< It’s not a benefit to the real people who are – you know, if you’re still at a job and you’re maintaining, you have insurance you’re probably not going to stay clean.>
< In Lubbock, they have two difference facilities. They have Dove Tree and Managed Care. Managed Care is the one that’s publicly funded, and people without money can actually go to. I actually went through the program once, and I did really well after my first attempt there for a while, but I just wasn’t ready. But, if we had some sort of publicly funded treatment center here for people to go to without having to pay a lot to get help, that would be tremendous. And then, to be able to follow it up with a place like Another Chance House so people can get in once they complete their treatment, then they can go into the transitional living and re-learn the living skills. So, it would be a process, and then, after they get done with that they’d have the aftercare classes that just follow up with you through your years of recovery so you’re continuously connected to a program that would allow you to continue through your recovery.>
11. Did you ever overdose or use opioids to attempt suicide? If so and if you are willing to share your story, please tell us about the situation.
< I couldn’t cope with everybody else’s opinion of me. And, I just got fed up with it and said, “Okay, I can’t live around you so, I’ll see how this affects you, and this is to let you all know this is where I’m at.” And until that point, you got the attention of what I was looking for and it opened the eyes to see other enemies come after that, you know? I’ve tried all that, “You’re tired of this?” That was just it.>
12. Let’s go around the room and give each of you the chance to tell us anything else that you thought of or wanted to mention.
< My first boyfriend that I was pregnant with, I went to see him, and I said I’ll be in front whenever you want. I don’t remember a lot. I just remember putting the spoon in his mouth, so he wouldn’t swallow his tongue and calling the ambulance. Just to see him go through that and it’s scary to see somebody that you love. I just don’t really ask too many questions about what they (family and friends who use drugs) are doing because I don’t really know what it is, and I don’t really want to know.>
< Well, as a mother and grandmother and a great grandmother, I haven’t seen death. I know my kids are broken up from drugs. I was an alcoholic because I heard that if you drink you feel good, you hear music, you enjoy it. That’s a lie. Because, when I was going through my divorce, I was in the bottle like there was no tomorrow. My drinking was from 10 in the morning to 4 o’clock next morning and if you didn’t stay up drinking with me, I’d say, “You’re not a drinker, get out of my way.” So, I went to Alcoholics Anonymous, and I went to drug classes with my kids. I kept telling them the one thing that stuck in my mind, “If you want to quit, you’ve got to do it for yourself and don’t hang around with the same people and please, don’t bring the problems.” I have a saying, and these two remember it, “When you get up in the morning, look in the mirror and say ‘I love myself. Do I feel good about myself?”>
< Well, I’m just honored to be here, and I hope that what we’ve all had to say today, whatever program you all go to and you all advocate for, that you benefit the community in a positive way.>
< I don’t understand – maybe that I’m just an old woman and I don’t get out very much, but hydrocodone was not as big a problem as what the opioids are, right? Am I right?
< Facilitator: Hydrocodone is an Opioid.>
< It is an opioid? They were?>
<Facilitator: Yes.>
< Well then, I have nothing more to add. I was working full-time, I’d take pain pills and muscle relaxers every four hours, every day, every day, every day for six years, and I could work circles around 20-yearolds. But then, all of a sudden they (pills) just quit, and I could never understand why they took away the hydrocodone and replaced it with something even more addicting, it seemed like to me. But, I don’t know, I get confused.>
Focus Group #4 – Professionals Who Work with Opioid Users
The fourth focus group included three professionals who work with opioid users. They were recruited by Public Health Department staff members, who reached out to the Downtown Women’s Center and the Potter County Sheriff’s Department. The session was conducted at Amarillo’s Central Library on Aug. 1, 2018. The following is a slightly edited version of the conversation with these participants. Please note that each new paragraph indicates a different person is speaking.
1. Why do you think Amarillo was rated in 2016 as the 13th highest city in America for opioid abuse by Castlight Health, Inc.?
< It may seem surprising to us because we don’t see as much opiate use in the homeless population, so we don’t deal with it a lot.>
< Some do come in to the shelter with that addiction. We do see some opioids.>
< I see a lot of heroin in jail.>
< Amarillo is a cesspool for drugs. If they want to stay sober, they can’t stay here. It’s a big deal.>
2. Tell us about a typical case of opioid use disorder that you see here in Amarillo.
< We don’t see a lot of women (at the Downtown Women’s Center) on opiates because they don’t seek assistance as much. I’m not sure about the accessibility of opiates.>
< I have a female in the jail that started opioids when they were prescribed by a doctor. Her use went up the chain until she was a full-blown addict on other stuff. I see long-term heroin use in some males that have been in and out of the jail for decades. One started heroin at age 15.>
< It typically starts with an injury. They get them from the doctor who keeps prescribing them. One guy told his doctor, “This isn’t working for me.” The doctor said, “This has been working and I don’t know what to tell you.” A lot of doctors in Amarillo are shutting off opioids – stopped prescribing them in the past year or two because of the publicity. I hope doctors will change.>
3. In your experience, what types of opioids – prescription (like Oxycodone and Hydrocodone), illegal (like heroin) or synthetic (like fentanyl) – do you see most in Amarillo? And how do people get typically get these drugs?
< Doctors now want to give Tramadol, but in 2014, it was classified as a narcotic.>
< I see more heroin – anything they can buy on the street – anything for a high.>
< Veterans have a lot of prescriptions they can sell. They can get anything they want at the VA if they ask – refills whether they ask or not.>
< They spend a lot of time at slot machine places and on the street with people they know.>
4. Over the time you have been helping people with opioid addiction, have you seen any changes in:
- How people get the drugs?
- Which drugs they use more – prescriptions or illegal drugs (heroin)?
- The strength of the drugs that are available?
< It often starts with a trip to the ER or the doctor. Then, they need more, so they go places they normally wouldn’t go.>
< Lots of girls here get addicted to meth.>
< When they start, it’s oxycodone or marijuana, then they move up the chain. Then, one to two times with meth and they’re done (addicted). With heroin, I know one guy who started when he was hanging out with a friend smoking marijuana and someone gave him a hit of heroin. He was 15 and has been addicted ever since.>
< They call it ‘shoot-up euphoria’. The metabolism in the brain takes over and you’re out of control –just searching for the next high.>
< It’s important to understand the root causes, which are often trauma, sexual abuse trauma (both men and women), abuse or neglect and unhealthy relationships/domestic abuse. They feel pain and then they try something to ease that pain.>
< In the gap between getting out of jail and finding a job, they are very vulnerable to using. It causes recidivism – a revolving door at the jail. We encourage people to continue therapy after jail. But when they are in jail, no one comes to see them – they have no support and nowhere to go, no safe person to be with after they leave jail. There is a big gap between jail and healthy living. The transitional living places could start the process before they get out of jail. Most providers don’t come to the jail. If people have spent 15-20 years on drugs, they need connections or they won’t stay sober. Many of them have mental health issues and are self-medicating. While they are in the jail, Texas Panhandle Centers (TPC) will put them on medications. But then, there’s a gap in their meds after they leave the jail. When they get out and need psych meds, they only have a one- or two-week supply. If they miss their intake appointment with TPC, they don’t have meds to see them through. If I had a lot of money and benefactors, I would have a resource center for incarcerated people.>
5. What types of services are available in Amarillo for those who want to recover from opioid use?
- What are some of the factors that keep people from seeking help?
<ARAD – Both parts, shelter program and residential treatment center>
<Downtown Women’s Center>
<Texas Panhandle Centers>
<Alcoholics Anonymous / Narcotics Anonymous / Celebrate Recovery>
<Lydia Day>
<ACADA>
<Serenity House (Plainview)>
<Managed Care (Lubbock)>
<Life Challenge>
<Victory Outreach Christian Recovery Home>
<Pavilion at Northwest Texas Hospital>
<Biofeedback program>
<Veterans programs>
< There are not enough programs here.>
< Transportation is a challenge.>
< The ARAD shelter program is more well-rounded. It offers wrap-around services with transportation, food and shelter.>
< Some of the factors that keep people from getting help are pride, shame, stigma. Often, they don’t know where to go for help. If they aren’t homeless, there’s a fear of it getting out. Their situation got out of hand, and they are afraid of other people knowing about it.>
< The question is how to reach into their world. It must come from the individual – they have to be ready. Some are ready for help but don’t want others to know. It would be good if they had a connection to a doctor who could help them taper off – someone who would preserve their privacy and confidentiality.>
< We need well-rounded services. Licensed professional counselors want you to tell them about your childhood. Clinical social workers want to know what you need now. It takes connections to find help. I try to provide people with my connections, but I don’t have all the connections. If people don’t have a relationship with someone who will try to make their life better, they are out of luck.>
< Normal folks get on a prescription and don’t even know they are addicted. But their life starts to fall apart. They were fine before the car wreck. There’s a large population that doesn’t get noticed and a lot don’t know to get help. They don’t know who to ask, so they ask the doctor who is prescribing them.>
< Some doctors feel responsible for their patients’ addiction. But if they would help, their liability would go down. Most doctors don’t care. A lot of doctors don’t know what options are available for people to get help.>
< I don’t think doctors can ignore this anymore. It’s all over the news – prescription abuse. At some point there’s not an excuse anymore. It’s very clear we have an opioid epidemic in the U.S.>
< It’s a cop-out if doctors don’t help. Do they want to help patients or just get paid?>
6. What are the situations or crisis points that bring opioid users to you for help?
< When they start losing things – jobs, family, jail, CPS takes their kids … 15th time in jail.>
< The jail programs for substance use are voluntary. Inmate must apply to get into a small group. All of these people have made a decision to do something different.>
7. What types of therapies work best, in your opinion? Why?
- Are there enough of these types of therapy available here?
< At the Downtown Women’s Center, everyone must be in counseling. We do trauma counseling because if you can process the trauma, you can focus on recovering and gaining the life skills to live clean and sober.>
< It takes a while to get the drugs out of your system. People need long-term care and tools to stay sober.>
< There are never enough programs. There is a type of trauma therapy that works, but what does work, no one can afford.>
< Trauma therapy reprocesses the trauma and brings down the intensity levels. EMDR is very helpful, but we have few therapists in Amarillo who are trained to do it. A lot of clinics elsewhere get the
importance of EMDR and train all their staff. EMDR is a short-term therapy – it takes about six months. There are small numbers of people who have been helped with it here. It is recognized by the VA, but no one there does it. It’s expensive to train people to do EMDR.>
< Trauma therapy is huge. We lose people – we have a small window to get people help. They can only sit in their own skin for so long before we lose them.>
8. What are some of the issues people face as they begin and continue recovery?
< Getting a job. Skills for a job. Learning to connect with healthy people – family or church. Learning to rebuild relationships. How they feel about themselves and dealing with the ongoing issues that got them into drug use.>
< It takes a lot of work to stay clean and sober. It takes a long time to recover. The Downtown Women’s Center program is two years. After graduation at DWC, 86% stay in recovery.>
< I know a young man who started on opioids at age 15 and he’s now 25. It took him a year to get into the heart of addiction. Then, it’s taken a long time to recover. He’s gone through paying lots of fees, losing his driver’s license, fixing relationships. If you’re involved in addiction, it can take a long time to clean up your mess.>
<At the Downtown Women’s Center, we help them start cleaning up their mess from Day One. We encourage college. Parenting classes to reconnect with their kids. This affects mom and children – the cycle needs to be broken.>
9. For people who are dependent on opioids, what related healthcare issues do they experience?
<Lots of stomach issues because of the pills>
<Nutritional deficiencies>
<Diabetes>
<Damage to the liver>
10. What, if any, effects on our local workforce do you see from opioid use?
< Accidents on the job, calling in sick, more doctors’ appointments.>
11. How would you characterize the opioid problem among teens in Amarillo?
< My son said you could get any drugs you wanted at any time, just walking down the hall at school. Students offer to sell pills to each other.>
12. What could Amarillo do to help more people who are addicted to opioids?
< Decrease the stigma.>
< More places to get help. In Amarillo, we don’t have as many services or resources. ARAD is phenomenal, but it’s not for everyone. Then we have ACADA and that’s it. In Lubbock, there is no stigma. It seems like everyone is in recovery. They have huge meetings. It’s a different culture there.>
13. Please tell us about a successful case of an opioid user who has recovered.
< I had a successful case with a person who was weaned off drugs and also received trauma therapy.>
< One case got off opioids and other drugs and had quite a bit of sobriety. When she hit bottom, it wasn’t like everyone else. She just got that she needed help, and she wanted to connect with her daughter better.>
14. Let’s go around the room and give each of you the chance to tell us anything else that you thought of or wanted to mention.
< The AA/NA meetings at Moss Lane are good. They are open all day long – early to late. It’s a safe place for fellowship. Unfortunately, there is a lot of smoking there and that deters some. It would be nice if all
AA/NA meetings were nonsmoking.>
< Oxford House is a men’s transitional living facility in Lubbock. They have a representative who comes to Amarillo to make people aware of their services.>
Focus Group #5 – Refugees
The fifth focus group included six refugees. They were recruited by Public Health Department from Catholic Charities, and five are currently engaged in working with other refugees. All spoke English well. The participants came to the U.S. from the following countries: Thailand, Yugoslavia/Bosnia/Croatia, Iraq, Thailand/Burma, Rwanda, and Congo. The session was conducted at Amarillo’s Central Library on August 3, 2018. The following is a slightly edited version of the conversation with these participants. Please note that each new paragraph indicates a different person is speaking.
1. When you first got to the US, did you receive the medical care you needed? If no, why not?
All six said they had received the medical care they needed.
< I got a health screening and was referred to doctors.>
< I was on Medicaid for eight months. Then I got a job and had health insurance.>
2. Women—have you received women’s healthcare services since your arrival? Ex. Annual exams, mammograms, Pap test, family planning services
All four women answered “yes.”
< I struggled with getting dental care. It’s way cheaper overseas.>
< Many refugees have dental needs at first because their background does not include oral hygiene. The delay in getting insurance here is a problem.>
< It’s expensive to get dental insurance and many health insurances don’t cover it. Some people have never had dental care because of their background. They have no training and no insurance.>
< When I first came here, I didn’t get dental care.>
3. Do you have health insurance? If no, why?
- Have you received information on how to get and use healthcare services in the U.S.?
< Generally, people are 100% healthier here. Especially if they have insurance, whether it’s through Medicaid or an employer. There are lots of people in the gap. You can go to District Clinic but many are not eligible.>
< Usually people who work at small places, like the Country Club, restaurants and hotels, don’t have insurance. If you’re covered by insurance, things go well. But many don’t have it.>
< If your employer offers health insurance, the employer pays the majority, and you can choose dental. Some people can’t afford it.>
< In many cases, people (refugees) are saved from death because of the treatment they got here.>
< People need to be educated about things like going to the ER versus Urgent Care. You get a big bill at the ER.>
< I got an orientation when I came here.>
< I got good information on policy, personal hygiene, safety and where to go for healthcare.>
< I got an orientation within three months of coming here.>
< I got lots of orientation – too much. The problem is that where people come from – city or refugee camp – makes a difference in how much they understand about these things. They get an orientation before they arrive here, then a cultural orientation when they arrive.>
< Communication can be a problem. In 2016, lots of people were coming here. Many people from villages in Uganda. Many don’t even have a toothbrush. When we landed in Florida, the hotel was horrible. The case manager told us how to take a shower. We must tell them (refugees) everything because they need to know a lot. Communication can be a problem. They want to know why they should have a mammogram. Village people don’t think they need these things. They just want to go to the doctor when they are sick, not for prevention. They need trusted people to tell them about preventive tests.>
4. How do you describe what it means to be healthy?
< To be healthy – to feel good – no problems with body and mind – 100% functioning.>
< Exercise – eat health – get shots (immunizations).>
5. What do you need to become more healthy?
< In our daily life, we need information and education, so people can be aware and how to prevent or overcome problems.>
< We must be able to tell about a problem early. Refugees are not open enough to discuss everything because they come from a different way of treatment. It takes time to comprehend everything. Their priority is existence – kids in school, jobs. Then worry about health and insurance.>
< We need to encourage refugees to be open to telling us what’s really going on. Maybe not at the first appointment, but when they are more adjusted, it’s easier.>
< They need to learn to go to the doctor when the problem starts. For example, when one tooth is affected, it can affect more.>
< I had a relative with high blood pressure who waited too long to get care.>
< We just need to educate new refugees to tell the doctor. They need to know they now have a good chance to be taken care of.>
< Some refugees are physically healthy, but not mentally healthy. They are scared.>
< If they had more information, they could handle a lot of health problems better. We need to tell them things like if their breasts are hurting, they need to tell a doctor and not wait.>
< When they first get here, they are adjusting to lots of things. Then, two or three months after arrival, they are ready to hear more information. Like going to the doctor for a well child checkup. After the initial health screening, they should go in about two months later for another visit and to learn and tell about any problems they may have.>
< The problem is how to make it attractive enough (to go to the doctor two months later) when they work all the time.>
< The health department does a great job with home visits, screenings, immunizations. It’s all good.>
< We need to approach each group with pieces of information. Maybe a group lecture at churches in a flexible setting. Have people within the communities invite others, rather than the case manager inviting them.>
< They ask their questions at the churches and schools. Then the answers spread by word of mouth. For example, all the people who are from Congo know each other and messages spread within large families.>
6. Do you or your family members exercise regularly? If so, what do you do for exercise?
< I don’t at all. It depends on the family. No Burmese exercise.>
< Some of the youth do because they see it on social media and they play soccer.>
< I sometimes do jumping jacks or jump rope.>
< Those who work at Tyson do a lot of lifting and have pain in their hands. This exercise is not good because it doesn’t exercise dormant muscles.>
< Exercise is a culture. The new generation understands it’s important.>
< Most people with diabetes and high blood pressure don’t exercise.>
< When people come to the U.S., there are more opportunities to exercise. Here, it’s OK to ride a bike or play with your kids outside. In other countries, it’s not acceptable.>
< Here I ride my bike with my kids, but I didn’t do that overseas. I maybe just would swim with friends.>
< Here, we use our car a lot, but where I came from everyone walked everywhere – to the grocery store, to the post office. There’s a lack of places where you walk with others. Now I walk my neighborhood. I encourage others to go to the park, the zoo and the canyon – to be in nature. People miss that from home. Sports are good for young people. We need to have fun and don’t just worry. When you get a job it takes up most of your time.>
< They aren’t familiar with the environment here, and we have to tell them about the lakes – they can be tragic.>
< I believe exercise doesn’t happen in a gym. I run outside.>
7. Do you have a doctor that you see for your illnesses or checkups?
< Yes, and our clients see a primary care doctor.>
8. Do you eat healthy meals, and have you received any education or information about eating healthy since you’ve been in the US?
- Can you get the type and amount of food you need for your family?
< My mother has diabetes. I take her to education classes. It’s difficult for her to change her diet. People in my culture don’t think they can survive without rice two or three times a day. The doctor says to eat more meat and vegetables, less rice. But mom says no. Mentally, she doesn’t feel satisfied without rice.>
< Rice is a necessity. We put eat it with hot dogs and hamburgers. Love of rice is passed down through the generations. We feel withdrawal when we don’t have rice.>
< There is more meat here, and more vegetables where I came from. People get chubbier here with an American diet.>
< A lot of refugees like the sugary snacks here. The ingredients in the drinks here are not the same as they had back home – they are worse for you here. But they love the sweet and attractive drinks and how plentiful they are. The food here is mostly processed. We cook meat with corn flour here and fresh vegetables are hard to get here.>
< It’s harder to cook here. The food doesn’t taste right. Water and food taste bad.>
< Here, I work two jobs, so I must eat fast food, and it’s not healthy. I try to cook healthy food, but I can’t do it every day. It’s too hard here.>
< We live by a Burmese store. Some of the food from Asia is not fresh. Some is affordable and some is not.>
< You have to have a schedule. Eat vegetables and fruit. Limit fries.>
< Many African refugees eat fried corn flour. It makes them fat and it’s expensive.>
< People are stuck in their culture. I miss going to family events with lots of food. I go to other cities here to get Middle Eastern food.>
< We need to train older people about nutrition. I can’t tell where healthy food is in the grocery store here. The milk doesn’t taste like at home. Here, the whole milk and meat adds a lot of fat. We need more education.>
< After Ramadan (holy month of fasting), people eat more and get fat.>
9. Has anyone helped you with mental health issues in the US? Is your mental health better or worse since your arrival?
< TPC (Texas Panhandle Centers) is great. But sometimes people don’t feel safe talking to a case manager or there’s a communication barrier and people get the wrong idea.>
< Depression is just thought of as sadness. People in my culture tell you you’re fine. At Catholic Charities, we have a plan if we know a refugee has a problem when they come here.>
< People (refugees) worry that the interpreter may not keep their information confidential. It may take two or three sessions to gain trust.>
< There’s shame about telling people what they’ve been through. Makes it harder to find out what is going on.>
< In one case, the person was depressed, had PTSD, had been tortured and had many mental health problems. Although he was twitchy, he said, “I’m OK because I’m here now and I’m safe.”>
< Sometimes it’s not mental illness, just stress. Through counseling and talking, things will be OK. Mothers are very sensitive. They can help other women to prevent problems with their children. Moms together can train each other and talk and help each other. Some churches help. Refugees need to know it will be OK. They need a professional counselor and to learn that what’s happening to them also happens to many.>
< The biggest challenge is interpreting. People don’t want the interpreter to be someone from their community because they are afraid their information will spread. They need someone they can trust.>
< The trust issue and language barrier have been problems for one of my clients with mental health issues. There’s a truck driver who translates in her dialect for her at doctor’s appointments. He is on the road a lot, so it’s hard to schedule times when everyone can be there. But she fears others knowing about her issues. She is afraid of judgment or that she will be exposed.>
< There’s also a problem between males and females – they don’t want the opposite sex to translate for them. We try to get whoever is best for the client.>
< Some don’t speak a dialect that we have a good interpreter for. The Rohingya are a special case. They have been so traumatized, and there aren’t many who speak their language.>
10. Now, I’m going to ask you a series of question about whether or not you think the following things affect your health or the health of your family:
- Transportation – your ability to get around Amarillo
- Housing – the place where you live
- Education – the amount of education you have
- Jobs - the work you and your family members do for pay
< Transportation. Yes! It’s a big thing. Patients don’t go to the doctor because they don’t have transportation. There’s a bus from Eastridge, but it’s hard to get around.>
< Amarillo is impossible without a vehicle. For us to get people to the doctor, the staff has to provide transportation or volunteers or Medicaid. If Medicaid provides it, then the client must speak English.>
< Recently, one client had to go to a specialist in Lubbock. We have to take them or ask someone from the community to take them. One of our clients paid someone $400 to take them to Lubbock and back.>
< Housing. One lady was in an apartment with no air conditioning and it was very hot. She didn’t know
how to communicate with the manager.>
< The refugee agencies don’t put clients in bad apartments. But after the program is over, we can’t control where they live. For people who came from a refugee camp, any apartment is like a castle.>
< Education. Kids are amazing. They go to school but are often not encouraged by their families. They get behind, then skip school. Then they don’t feel they have a future. The adults must go to work (rather than get further education). For the young generation, education is OK.>
< I came from Africa and I speak French and Swahili. I’m working to become a citizen. Some people can’t communicate about transportation to tell someone where they are and where they want to go.>
< When people come here as young people, they are OK. Teens get into ESL at Crockett to learn English, and it’s more challenging. Adults, most come with an education, but no one here considers your education. You must go back to school, and it’s a big challenge. I know a dentist who was trained in his home country. Now he has to start over as a dental assistant.>
< There’s a big problem when kids learn English before their parents because kids start interpreting for their parents, and then the parents don’t learn English.>
< We have a list of ESL classes but no transportation to get there. We need one place where you could go for ESL, get child care, take citizenship classes. In the first 48 hours here, about all you learn to do is sign your name – maybe.>
< If a high school student only got some education in a refugee camp, algebra is too hard and there’s no hope to catch up. The test – STAAR – is too hard, and if you don’t pass, you don’t graduate. When kids are hopeless, they skip school and think they might as well go to work at Tyson.>
< Those with no previous education just give up. Others just keep going. There’s no system that’s accessible for adult education, especially as a beginner student.>
< If you speak English, you can go to college and can get financial assistance. But if you have a family and children, you must go to work. If you’re single and no family, you can go to Amarillo College. You can continue your education at AC if you speak English, are eager to learn and have no kids – or you have family support.>
11. Let’s go around the room and give each of you the chance to tell us anything else that you thought of or wanted to mention.
< It would be good to have a place like an outreach center for people with all languages to get help.>
< Some clients must go to Lubbock for healthcare. It’s hard to get transportation.>
< The (refugee) community needs more help in every aspect – and long-term help.>
< Mothers and women need more help.>
Appendices
Appendix A: Community Data Scan
- Robert Wood Johnson County Health Rankings (CHR) and Roadmaps comparison data link: http://www. countyhealthrankings.org/app/texas/2018/compare/snapshot?counties=48_375(48_381
- United Way of Amarillo and Canyon Community Status Report – Health Section P. 13 – link: https://www. unitedwayama.org/sites/unitedwayama.org/files/United-Way-Community-Status-Report-2017-final.pdf
Appendix B: Telephone Survey Questionnaire
Q1: Are you eighteen years or over?
1. Yes ........................................................................................................................... CONTINUE
2. No/All Other .......................................................................................................... TERMINATE
Q2: Would you say that in general your health is:
1. Excellent
2. Very Good
3. Good
4. Fair
5. Poor
6. Don’t Know/Not Sure
7. Refused
Q3: Do you have any kind of health care coverage, including health insurance, prepaid plans such as a Health Maintenance Organization (HMO), or government plans such as Medicare?
1. Yes
2. No
3. Don’t Know/Not Sure
4. Refused
IF Q3:1 ASK
Q4: Is your health insurance primarily:
1. Health Insurance through someone’s work or union (includes HMO)
2. Health Insurance bought directly by yourself or family
3. Medicare, a government plan that pays healthcare bills for people aged 65 years and over and some disabled people
4. Medicaid or public aid
5. Insurance through J.O. Wyatt or a District Clinic
6. Other RECORD VERBATIM RESPONSE
7. Don’t Know/Not Sure
8. Refused
Q5: Do you have ONE person you think of as your personal doctor or healthcare provider?
1. Yes
2. No
3. Don’t Know/Not Sure
4. Refused RECORD VERBATIM RESPONSE
Q6: Was there a time in the past twelve months when you needed to see a doctor, but could not because of cost?
1. Yes 2. No 3. Don’t Know/Not sure 4. Refused
Q7: Does your spouse or partner have health insurance? 1. Yes 2. No
3. Does not have spouse or partner
4. Don’t Know/Not Sure
5. Refused
IF Q7:1 ASK
Q8: Is that insurance primarily:
1. Health Insurance through someone’s work or union (includes HMO)
2. Health Insurance bought directly by yourself or family
3. Medicare, a government plan that pays healthcare bills for people aged 65 years and over and for some disabled people
4. Medicaid or public aid
5. Insurance through J.O. Wyatt or a District Clinic 6. Other___
7. Don’t Know/Not Sure
8. Refused
Q9: Do you have health insurance for your children age 18 years or younger living in your household?
1. No children living in household 2. Yes 3. No 4. Don’t Know/Not Sure 5. Refused
IF Q9:2 ASK
Q10: Is that insurance primarily:
1. Health insurance through someone’s work or union (includes HMO) 2. Health insurance bought directly by yourself or family 3. Medicaid or public aid
4. CHIP (Children’s Health Insurance Program)
5. Other RECORD VERBATIM RESPONSE
6. Don’t Know/Not Sure
7. Refused
Q11: If you or an adult member of your household are in need of healthcare, which of the following would you most likely use?
1. Private Doctor
2. J.O. Wyatt or District Clinic
3. Hospital Emergency Room
4. Urgent Care Center
5. Other RECORD VERBATIM RESPONSE
6. Would not use any source
7. Don’t Know/Unsure DNR
8. Refused DNR
Q12: Some people visit a doctor or clinic for a checkup even though they are feeling healthy. Have you ever done that for yourself?
1. Yes
2. No
3. Don’t Know/Not Sure
4. Refused
IF Q12:1 ASK
Q13: Was your most recent checkup…
1. Less than twelve months ago
2. Less than two years ago
3. Longer than two years ago
4. Don’t Know/Not Sure
5. Refused
Q14: If a child living with you needed healthcare which of the following would you most likely use?
1. Private Doctor
2. J.O. Wyatt or District Clinic
3. Hospital Emergency Room
4. Urgent Care Center
5. Other RECORD VERBATIM RESPONSE
6. Would not use any source
7. Don’t Know/Unsure DNR
8. Refused DNR
IF Q14:2,3,4 DO NOT ASK
Q15: Have you or an adult in your household sought healthcare for a child from that source Q14 Punch within the past two years?
1. Yes
2. No
3. Don’t Know/Not Sure
4. Refused
Q16: Did you experience any of the following when you sought health care for your child? ACCEPT MULTIPLE RESPONSE
1. Unable to get appointment when I needed one
2. Lack of transportation to the provider’s office or clinic
3. Location of the provider’s office or clinic
4. Unreasonable cost of services
5. Too long of a wait
6. Provider was out of network
7. Deductible was too high
8. No specialist was available
IF Q16:8 ASK
Q17: What type of specialist did your child need? RECORD VERBATIM RESPONSE
IF Q15:1 ASK
Q18: Did any of the following reasons prevent you from getting health care for your child? STATED, ACCEPT MULTIPLE RESPONSE
1. Unable to get appointment when I needed one
2. Lack of transportation on the provider’s office or clinic
3. Location of the provider’s office or clinic
4. Unreasonable cost of services
5. Too long of a wait
6. Provider was out of network
7. Deductible was too high
8. No specialist was available
IF Q9:2,3,4 DO NOT ASK
Q19: Has a doctor, nurse, medical assistant, or school representative told you within the past 12 months that one of your children needed vaccinations?
1. Yes
2. No
3. Don’t Know/Unsure
4. Refused
IF Q19: 1 ASK
Q20: Did your child receive the vaccinations?
1. Yes 2. No
3. Don’t Know/Not Sure 4. Refused
IF Q20:1 ASK
Q21: Where did you go to get your children immunized?
1. Northwest Women’s and Children’s Clinic
2. Health Department
3. Private healthcare provider
4. Pharmacy
5. Other RECORD VERBATIM RESPONSE
6. Don’t Know/Unsure DNR
7. Refused DNR
IF Q15:1 ASK
Q22: Has a doctor, nurse or other health professional EVER said that the child has asthma?
1. Yes
2. No
3. Don’t Know/Not Sure
4. Refused
IF Q22:1 ASK
Q23: Does the child still have asthma?
1. Yes
2. No
3. Don’t Know/Not Sure
4. Refused
Q24: A flu shot is an influenza vaccine injected into your arm. During the past 12 months, have you had a flu shot?
1. Yes
2. No
3. Don’t Know/Not Sure
4. Refused
Q25: A vaccine to prevent the human papillomavirus or HPV infection is available and is called the cervical cancer or genital warts vaccine, HPV shot, IF FEMALE, SAY GARDASIL OR CERVARIX; IF MALE, SAY GARDASIL. Have you ever had an HPV vaccination?
1. Yes
2. No
3. Doctor, refused when asked
4. Don’t Know/Not Sure
5. Refused
IF Q25:1 ASK
Q26: How many shots did you receive? RECORD EXACT NUMBER
Q27: How long has it been since you last visited a dentist or a dental clinic for any reason? Including visits to dental specialists, such as orthodontists…
1. Within the past year (anytime less than 12 months ago)
2. Within the past 2 years (1 year but less than 2 years ago)
3. Within the past 5 years (2 years but less than 5 years ago)
4. Five or more years ago
5. Never
6. Don’t Know/Not Sure
7. Refused
Q28: If you or an adult member of your household are in need of dental care which of the following would you most likely use?
1. Private Dentist
2. J.O. Wyatt or Dental Clinic
3. Hospital Emergency Room
4. Other RECORD VERBATIM RESPONSE
5. Would not use any source
6. Don’t Know/Unsure
7. Refused DNR
Q29: How tall are you without shoes?
1. RECORD EXACT NUMBER
2. Don’t Know/Not Sure
3. Refused
Q30: How much do you weigh without clothes or shoes? (If you are currently pregnant, how much did you weigh before your pregnancy?)
1. RECORD EXACT NUMBER
2. Don’t Know/Not Sure
3. Refused
Q31: Do you consider yourself now to be: IF PREGNANT, ASK: What did you consider yourself to be before you were pregnant?
1. Overweight
2. Underweight
3. About the right weight
4. Don’t Know/Not Sure
5. Refused
Q32: During the past twelve months have you tried to lose weight?
1. Yes
2. No
3. Don’t Know/Not Sure
4. Refused
IF Q32:1 ASK
Q33: How did you try to lose weight?
ROTATE TOP TO BOTTOM BOTTOM TO TOP ACCEPT MULTIPLE RESPONSES
1. Ate Less food (amount switched to foods with lower calories)
2. Ate less fat
3. Ate fewer carbohydrates
4. Exercised
5. Skipped meals
6. Ate “diet” foods or products
7. Used a liquid diet formula such as Slimfast or Optifast
8. Joined a weight loss program such as Weight Watchers, Jenny Craig, TOPS, or Overeaters Anonymous
9. Followed a special diet such as Dr. Atkins, South Beach, other high protein or low carbohydrate diet, cabbage soup diet, Ornish, Nutrisystem, Body-for-Life
10. Took diet pills prescribed by a doctor
11. Took other pills, medicines, herbs, or supplements not needing a prescription
12. Started to smoke or began to smoke again
13. Took laxatives or vomited
14. Drank a lot of water
15. Ate more fruits, vegetables, salads
16. Ate less sugar, candy, sweets
17. Changed eating habits (didn’t eat late at night, ate several small meals a day)
18. Ate less junk food or fast food
19. Other RECORD VERBATIM RESPONSE
20. Don’t Know/Not Sure
21. Refused
Q34: During the past month, other than your regular job, did you participate in any physical activities or exercises such as running, calisthenics, golf, gardening, or walking for exercise?
1. Yes
2. No
3. Don’t Know/Not Sure
4. Refused
Q35: How often in the past 12 months would you say you were worried or stressed about having enough money to buy nutritious meals? Would you say you were worried or stressed:
1. Always
2. Usually
3. Sometimes
4. Rarely
5. Never
6. Not Applicable
7. Don’t Know/Unsure DNR 8. Refused DNR
Q36: Have you ever been told by a doctor that you have diabetes? 1. Yes 2. No
Don’t Know/Not Sure
Refused
IF Q36:1 ASK
Q37: Was this only when you were pregnant?
Yes
No 3. Don’t Know/Not Sure
Refused
Q38: Have you ever been told by a doctor that you have pre-diabetes or borderline diabetes?
Yes
No
Don’t Know/Not Sure
Refused
Q39: Has a doctor, nurse or other health professional ever told you that you had a heart attack, also called a myocardial infarction?
Yes
No 3. Don’t Know/Not Sure
Refused
Q40: Has a doctor, nurse or other health professional ever told you that you had angina or coronary heart disease?
Yes
No 3. Don’t Know/Not Sure 4. Refused
Q41: Has a doctor, nurse or other health professional ever told you that you had a stroke? 1. Yes 2. No 3. Don’t Know/Not Sure 4. Refused
Q42: Have you smoked at least 100 cigarettes in your entire life? NOTE: 5 packs = 100 cigarettes
1. Yes
2. No
3. Don’t Know/Not Sure
4. Refused
Q43: Do you currently use chewing tobacco, snuff, or snus every day, some days, or not at all? (NOTE: Snus rhymes with “goose‟ (Swedish for snuff sold in small pouches that are placed under the lip against the gum.)
1. Everyday
2. Some days
3. Not at all
4. Don’t Know/Not Sure
5. Refused
IF Q42:1 OR Q43:1 ASK
Q44: During the past 12 months, have you stopped smoking or using tobacco products for one day or longer because you were trying to quit using tobacco?
1. Yes
2. No
3. Don’t Know/Not Sure
4. Refused
Q45: During the past 30 days, how many times have you driven when you’ve had perhaps too much to drink?
1. RECORD VERBATIM RESPONSE
2. None
3. Don’t Know/Not Sure
4. Refused
IF WOMAN; ASK Q46-Q49
Q46: A mammogram is an x-ray of each breast to look for breast cancer. Have you ever had a mammogram?
1. Yes
2. No
3. Don’t Know/Not Sure
4. Refused
IF Q46:1 ASK
Q47: How long has it been since you had your last mammogram?
1. Within the past year (anytime less than 12 months ago)
2. Within the past 2 years (1 year but less than 2 years ago)
3. Within the past 3 years (2 years but less than 3 years ago)
4. Within the past 5 years (3 years but less than 5 years ago)
5. 5 or more years ago
6. Don’t Know/Not Sure
7. Refused
IF Q47:2 ASK
Q48: A Pap test is a test for cancer of the cervix. Have you ever had a Pap test?
1. Yes
2. No
6. Don’t Know/Not Sure
7. Refused
IF 48:1 ASK
Q49: How long has it been since you had your last Pap test?
1. Within the past year (anytime less than 12 months ago)
2. Within the past 2 years (1 year but less than 2 years ago)
3. Within the past 3 years (2 years but less than 3 years ago)
4. Within the past 5 years (3 years but less than 5 years ago)
5. 5 or more years ago
6. Don’t Know/Not Sure
7. Refused
Q50: Have you ever been tested for HIV, including testing fluid from your mouth? Do not count tests you may have had as part of a blood donation.
1. Yes
2. No
3. Don’t Know/Not Sure
4. Refused
IF Q50:1 ASK
Q51: Not including blood donations, in what month and year was your last HIV test? EXCLUDE RESPONSE IF BEFORE JANUARY 1985
1. RECORD EXACT MONTH AND YEAR
2. Don’t Know/Not Sure
3. Refused
IF Q50:1 ASK
Q52: Where did you have your last HIV test — at a private doctor or HMO office, at a counseling and testing site, at a hospital, at a clinic, in a jail or prison, at a drug treatment facility, at home, or somewhere else?
1. Private Doctor or HMO Office
2. Counseling and Testing Site
3. Hospital
4. Health Department Clinic
5. Jail or Prison (or other correctional facility)
6. Drug Treatment Center
7. At Home
8. Somewhere else
9. Don’t Know/Not Sure
10. Refused
Q53: Were the results of your HIV test positive, indicating that you have HIV?
1. Yes
2. No
3. Don’t Know/Not Sure
4. Refused
Q54: Have you or a member of your household sought mental health care services in the last 2 years?
1. Yes
2. No
3. Don’t Know/Not Sure
4. Refused
Q55: If you or an adult member of your household were/are in need of mental healthcare, which of the following would you most likely use?
1. Texas Panhandle Centers, community mental health center
2. Private Provider
3. J.O. Wyatt Clinic
4. Other RECORD VERBATIM RESPONSE
5. Don’t Know/Unsure
6. REFUSED DNR
Q56: Did you experience any of the following when you sought mental health care?
ROTATE TOP TO BOTTOM BOTTOM TO TOP ACCEPT MULTIPLE RESPONSES
1. Unable to get appointment when I needed one
2. Lack of transportation to the provider’s office or clinic
3. Location of the provider’s office or clinic
4. Unreasonable cost of services
5. Too long of a wait
6. Didn’t know who to call or where to go
7. Provider was out of network
8. Deductible was too high
9. No specialist was available
Q57: Did you experience any of the following when you sought mental care for a CHILD?
1. Unable to get appointment when I needed one
2. Lack of transportation to the provider’s office or clinic
3. Location of the provider’s office or clinic
4. Unreasonable cost of services
5. Too long of a wait
6. Didn’t know who to call or where to go
7. Provider was out of network
8. Deductible was too high
9. No specialist was available
Q58: Are you a family caregiver of someone that is elderly (age 65 or older)? 1. Yes 2. No
3. Don’t Know/Not Sure 4. Refused
IF Q58:1 ASK
Q59: Does that family member have significant memory problems that causes you concern? 1. Yes 2. No
3. Don’t Know/Not Sure
4. Refused
IF Q59:1 ASK
Q60: Please identify specific needs that are not being met for you as a caregiver that you wish you could have assistance.
Medical support 2. Emotional support 3. Financial support 4. Other RECORD VERBATIM RESPONSE
5. Don’t Know/Not Sure
6. Refused
Q61: If you or someone in your household has been pregnant in the last 5 years, did you/they go to the doctor to receive prenatal care?
1. Yes 2. No 3. Don’t Know/Not Sure
4. Refused
IF Q61:1 ASK
Q62: How many visits?
1. RECORD EXACT NUMBER 2. Don’t Know/Not Sure
3. Refused
Q63: In the past 12 months, have you used illicit or street drugs?
1. Yes
2. No
3. Don’t Know/Not Sure
4. Refused
Q64: Has anyone in your household used illicit or street drugs?
1. Yes
2. No
3. Don’t Know/Not Sure
4. Refused
Q65: During the past 30 days, how many days per week or per month did you have at least one drink of any alcoholic beverage such as beer, wine, a malt beverage or liquor?
1. Days per week_____
2. Days in the past 30 days_____
3. No drinks in past 30 days
4. Don’t Know/Not Sure
5. Refused
Q66: One drink is equivalent to a 12-ounce beer, a 5- ounce glass of wine, or a drink with one shot of liquor. During the past 30 days, on the days when you drank, about how many drinks did you drink on the average?
1. Drinks per week_____
2. Drinks in the past 30 days_____
3. No drinks in past 30 days
4. Don’t Know/Not Sure
5. Refused
Q67: During the last 30 days, what is the largest number of drinks you had on any occasion?
1. Number of drinks_____
2. Don’t Know/Not Sure
3. Refused
Q68: How many prescriptions for an opioid did you have in the last 12 months? (Examples of prescription opioids are fentanyl, oxycodone – also known as OxyContin, hydrocodone – also known as Vicodin, codeine and morphine.)
1. Number of prescriptions_____
2. Don’t Know/Not Sure
3. Refused
Q69: In the past 12 months, were you diagnosed with an STD?
1. Yes
2. No
3. Don’t Know/Not Sure 4. Refused
IF Q69:1 ASK
Q70: Which one(s): 1. Gonorrhea / GC 2. Chlamydia / CT 3. HIV 4. Syphilis 5. Other___
Q71: Where do you meet your sexual partners? 1. Monogamous relationship 2. Bars/clubs 3. Apps 4. Social media sites
Through friends
Other___
Q72: Do you regularly use condoms during sex?
Yes
No
Not sexually active
Don’t Know/Not Sure
Refused
And now I have just a few more questions for demographic purposes only….
Q73: In what year were you born? RECORD EXACT FOUR DIGIT RESPONSE; RECODE INTO CATEGORIES
1. 18-24 2. 25-34 3. 35-44 4. 45-54 5. 55-64 6. 65-74 7. 75 or over 8. Refused DNR
Q74: Are you Hispanic or Latino?
Yes
No 3. Don’t Know/Not Sure
Refused
Q75: Which of the following would you say is your race? (Check all that apply)
1. White
2. Black or African American
3. Asian
4. Native Hawaiian or Other Pacific Islander
5. American Indian or Alaska Native
6. Other (specify) _________
7. Don’t Know/Not Sure
8. Refused
Q76: What is the last grade in school you completed?
1. Less Than High School
2. Some High School
3. High School Grad
4. Some College
5. College Grad or More
6. Don’t Know/Not Sure
7. Refused
Q77: What was your total household income last year?
1. Less than $15,000
2. $15,001 - $25,000
3. $25,001 - $50,000
4. $50,001 - $75,000
5. $75,001 - $100,00
6. Over $100,000
7. Don’t Know/Not Sure
8. Refused
Q78: Sex: BY OBSERVATION
1. Male
2. Female
Q79: Zip-Code PRE-CODE
1. 79101
2. 79102
3. 79103
4. 79104
5. 79106
6. 79107
7. 79108
79109
79110
79111
79118
79119
79121
79124
Q80: County PRE CODE
Q81: Interview Method: PRE-CODE
Potter
Randall
Cell
Landline
Appendix C - Key Informant Survey Questionnaire

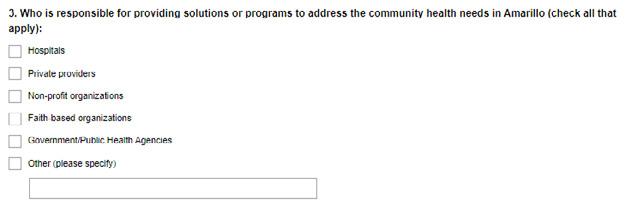


Appendix D - Focus Group Facilitator Questions
Focus Group #1 – Un- and Under-Insured Persons
1. What does being healthy mean to you and how does a person get to be healthy and stay that way?
2. When you need to see a doctor or other healthcare professional, are you always able to see one?
3. Do you have a primary care doctor? Why or why not?
4. Do you have insurance? If not, how what steps might you take to find insurance?
5. Have you found it difficult to get healthcare services for yourself or your family? How?
6. What are the most important healthcare services that you ARE NOT getting?
7. How do your healthcare providers treat you? Do you feel you are treated differently in any way because of your financial situation?
8. What services or places have helped you the most with your healthcare? How have they helped you?
- Why do you feel they have helped you more than others?
9. What does the community need to do to improve healthcare for people like you and your friends and neighbors?
10. Do you experience any challenges with transportation when it comes to getting your healthcare needs met?
- Challenges with your job?
- Challenges with knowledge or understanding about medical topics?
11. If you could change anything about the way you get your healthcare needs met, what would it be?
- Can you think of any services you would get if you had insurance or could buy any exam or procedure?
12. What services do you want for your family that you don’t currently have?
13. Let’s go around the room and give each of you the chance to tell us anything else that you thought of or wanted to mention.
Focus Group #2 – Mothers of Pre-Term or Low Birthweight Babies
1. Before you were pregnant, what did you know about prenatal care? … in other words, how to care for yourself while you are pregnant?
2. During your pregnancy did you receive any information about pregnancy and childbirth? (e.g. Medications, food/nutrition, what you can/cannot have during pregnancy, prenatal vitamins.)
- Where did you get your information?
- What type of education helped you the most? (e.g. Through the doctor’s office, friends, family, brochures, etc.)
3. Did you consider yourself healthy before your pregnancy?
- Did you make any lifestyle changes before or during your pregnancy? (Probe, if needed: Quit smoking, drinking, etc.)
4. Did you receive regular prenatal care during your pregnancy?
- If not, what kept you from getting care?
- If so, how did you select your healthcare provider?
5. For those of you who received prenatal care during your pregnancy, how far along were you when you called to make an appointment and how soon did you get an appointment after you made the call?
6. Do you think your insurance status affected your care? If so, in what way?
7. How did your healthcare providers treat you? Did you feel you were treated differently in any way because of your financial situation?
8. During your pregnancy, what good things happened to you and what went well?
- Who helped you?
- What free services have you found to be helpful?
- Was it easy for you to navigate social services, if you needed them? What would make that easier?
9. During your pregnancy, were there things that happened to you that weren’t good?
- What did you need that you didn’t get? (e.g. Support from family, financial support, healthcare services, etc.)
10. Looking back, what were your biggest challenges during pregnancy and childbirth?
11. What went well for you during pregnancy and childbirth?
12. What were the hardest parts after delivery? Is there anything you needed that you didn’t get?
13. After the birth of your child, what were the most important factors in your success as a mother?
14. What does this community do well for expecting mothers?
15. What does this community need to do better to support expecting mothers?
16. Let’s go around the room and give each of you the chance to tell us anything else that you thought of or wanted to mention.
17. Where should you go to get birth control?
Focus Group #3 – Opioid Users
1. How did you begin taking opioids/drugs? *Opioids include prescription drugs (like Oxycodone and Hydrocodone), illegal drugs (like heroin) and synthetic drugs (like fentanyl).
2. How have you obtained your opioid/drug prescriptions? Other drugs?
3. Did you have a primary care doctor who gave you prescriptions for opioids or sent you to a specialist for help in recovering from drug use?
4. What factors make getting drugs easy or hard?
5. What was the worst part of your experience with opioids or other drugs?
6. Have you received help? If so, what services worked well for you?
7. What are the biggest challenges to becoming sober and staying sober?
8. What does this community need to do to help people with opioid and other drug addiction?
9. What would make this community safer related to opioid and other drug use?
10. What services are needed to help people with problems related to opioid and other drug use?
11. Did you ever overdose or use opioids to attempt suicide? If so and if you are willing to share your story, please tell us about the situation.
12. Let’s go around the room and give each of you the chance to tell us anything else that you thought of or wanted to mention.
Focus Group #4 – Professionals Who Work with Opioid Users
1. Why do you think Amarillo was rated in 2016 as the 13th highest city in America for opioid abuse by Castlight Health, Inc.?
2. Tell us about a typical case of opioid use disorder that you see here in Amarillo.
3. In your experience, what types of opioids – prescription (like Oxycodone and Hydrocodone), illegal (like heroin) or synthetic (like fentanyl) – do you see most in Amarillo? And how do people get typically get these drugs?
4. Over the time you have been helping people with opioid addiction, have you seen any changes in:
- How people get the drugs?
- Which drugs they use more – prescriptions or illegal drugs (heroin)?
- The strength of the drugs that are available?
5. What types of services are available in Amarillo for those who want to recover from opioid use?
- What are some of the factors that keep people from seeking help?
6. What are the situations or crisis points that bring opioid users to you for help?
7. What types of therapies work best, in your opinion? Why?
- Are there enough of these types of therapy available here?
8. What are some of the issues people face as they begin and continue recovery?
9. For people who are dependent on opioids, what related healthcare issues do they experience?
10. What, if any, effects on our local workforce do you see from opioid use?
11. How would you characterize the opioid problem among teens in Amarillo?
12. What could Amarillo do to help more people who are addicted to opioids?
13. Please tell us about a successful case of an opioid user who has recovered.
14. Let’s go around the room and give each of you the chance to tell us anything else that you thought of or wanted to mention.
Focus Group #5 – Refugees
1. When you first got to the US, did you receive the medical care you needed? If no, why not?
2. Women—have you received women’s healthcare services since your arrival? Ex. Annual exams, mammograms, Pap test, family planning services
3. Do you have health insurance? If no, why?
- Have you received information on how to get and use healthcare services in the U.S.?
4. How do you describe what it means to be healthy?
5. What do you need to become more healthy?
6. Do you or your family members exercise regularly? If so, what do you do for exercise?
7. Do you have a doctor that you see for your illnesses or checkups?
8. Do you eat healthy meals, and have you received any education or information about eating healthy since you’ve been in the US?
- Can you get the type and amount of food you need for your family?
9. Has anyone helped you with mental health issues in the US? Is your mental health better or worse since your arrival?
10. Now, I’m going to ask you a series of question about whether or not you think the following things affect your health or the health of your family:
- Transportation – your ability to get around Amarillo
- Housing – the place where you live
- Education – the amount of education you have
- Jobs – the work you and your family members do for pay
11. Let’s go around the room and give each of you the chance to tell us anything else that you thought of or wanted to mention.