Final Presentation

SURFACE CLEANER
Charlene, Deepak Instructor/ Karen Proctor
Agenda
• Business Case
• Market Analysis
• Design Goal
• Primary Packaging Design
• Secondary Packaging Design
• Ecoimpact Analysis
• Conclusion

2
Manuf. MethExtrusion Blow Molded


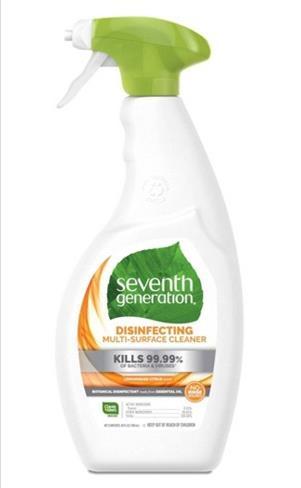
Oz)26 Weight empty
MaterialHDPE
Dimensions(LxWxD)
Bottle Volume (LxWxD) (cu in)
Actual volume of the bottle to overflow (cu in)51.26 Volume Product per label(cu in)46.92 Headspace (%)8.47 Dec TypePressure Sensitive Label Label Dimension (L x H) (in)3.19x4.50 Pack/Prod Ratio (lb /fl oz))
Cube
Weight
Material
Dimensions(DxH)
Pack/Prod Ratio (lb/fl.oz)
HDPE material 0.115 lb Bottle Sprayer PP material 0.055 lb
Label
Business Case Product CMUM (Fl.
(lb)0.115
(inches)4.25 x 2.5x9.25
98.28125
0.004423077
Utilization [%]47.74054054
(lb)0.055
PP Manuf. MethInjected molded
(inches)3.25x2.5x1.25
0.002115385
Label (2 pieces) Pressure Sensitive
Business Case
RSC box C flute 16.7802 lb
Box TypeRSC
Weight (filled) (lb)16.7802
Weight (empty) (lb)0.6
FluteC
Sq in Material (sq in)871.82

ECT (lbs/in)32
Arrangement4x2x1
Total bottles in the box8
OD (in)9x10.5x11
Dec TypeFlexo
Pack/Prod Ratio (lb/total cmums per case)0.0029086
Pack/Prod Ratio (sq in/total cmums per case)4.1914423
Bottles/Pallet512
Total CMUM / pallet13312
Cases/ Pallet64
Total weight of cases on pallet (lb)1073.9328
Selling Unit Volume (cu in/pallet)50320
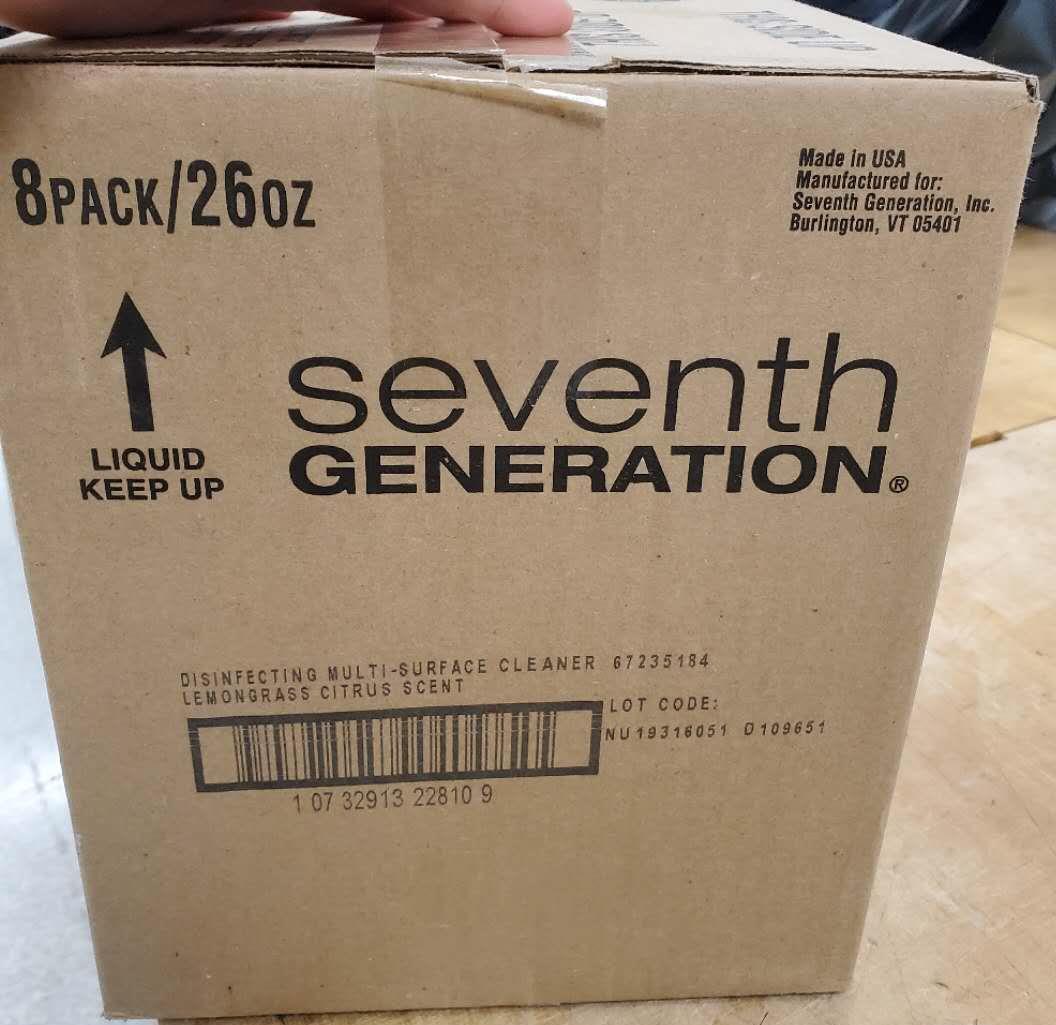
Transport Pallet Volume
*(TPV) (cu in)99840
Cube Utilization [%]50.4
Deepak

8
Shelf Visibility
Market Analysis
Increase the sustainability of packaging can be the crucial mission of the packaging
Attitudes toward surface cleaning products, July 2018
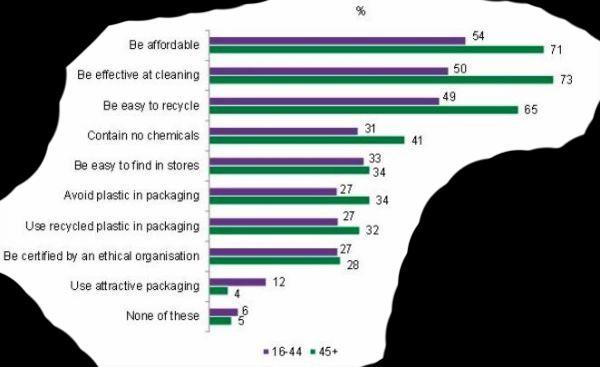
Base: 1,945 internet users aged 18+ who use surface cleaner
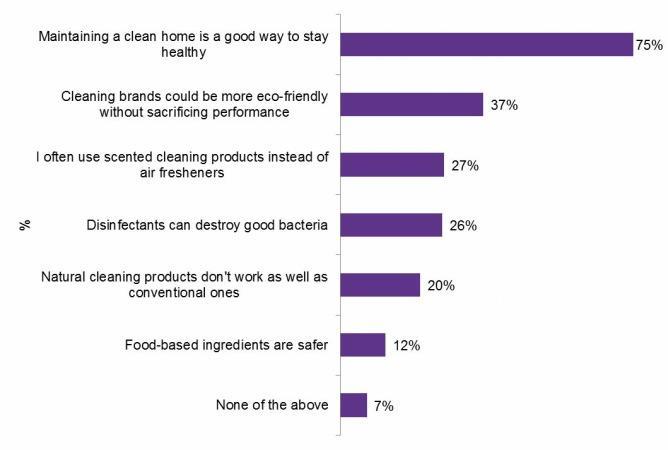
Ideal attributes of an eco-friendly product, by age, March 2019
Base: 1,939 internet users aged 16+ who have bought household care products in the last 6 months
From Mintel
Market Analysis
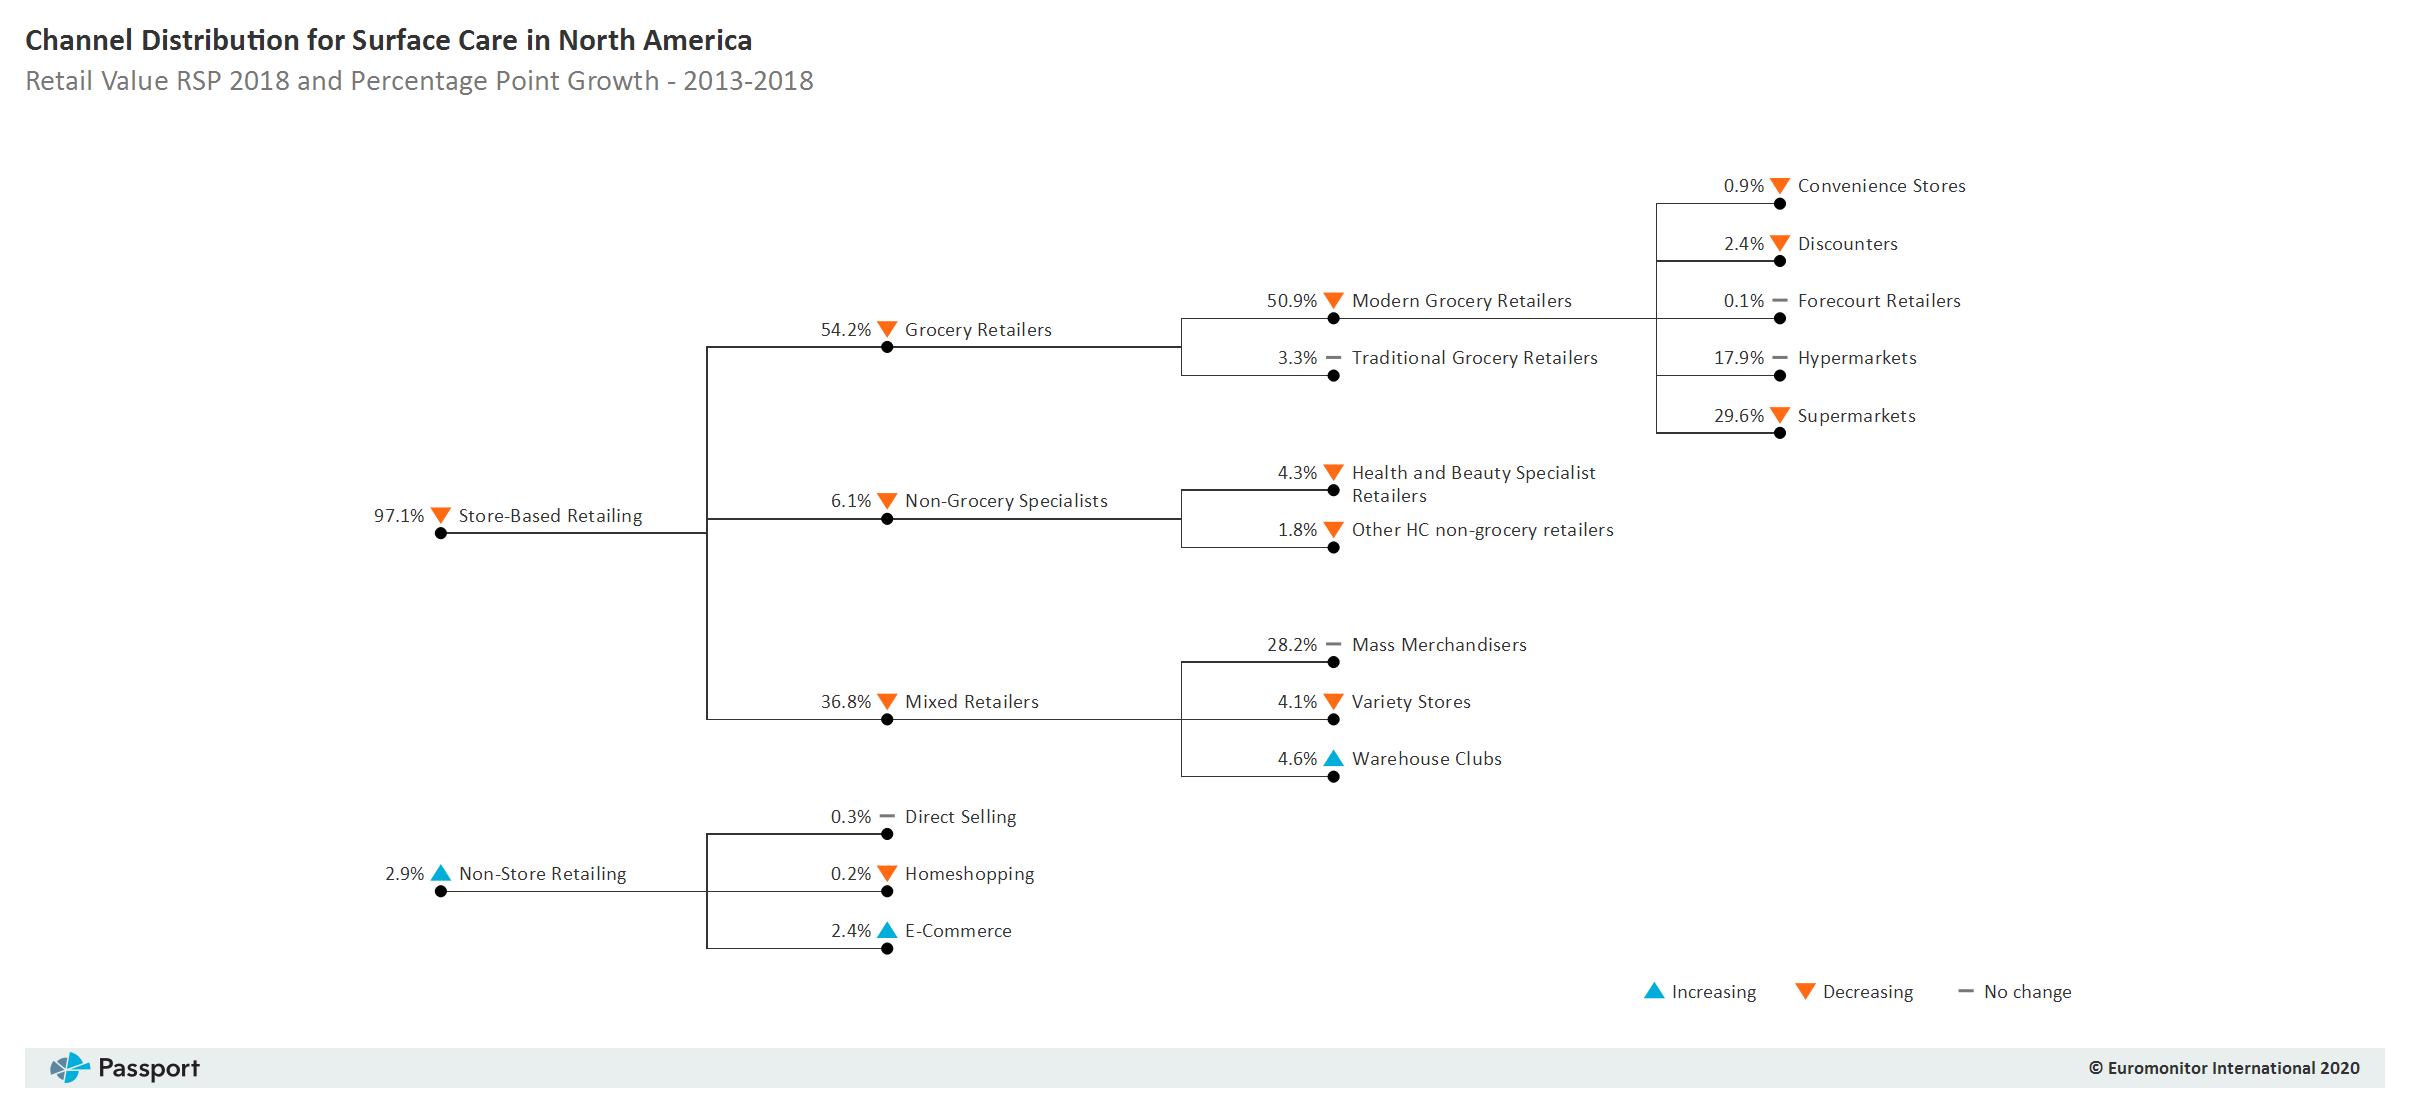
The packaging design should be used for the E-commerce (Lighter weight and better cube utilization )
Where do you primarily obtain information about the following health/ wellness topics?

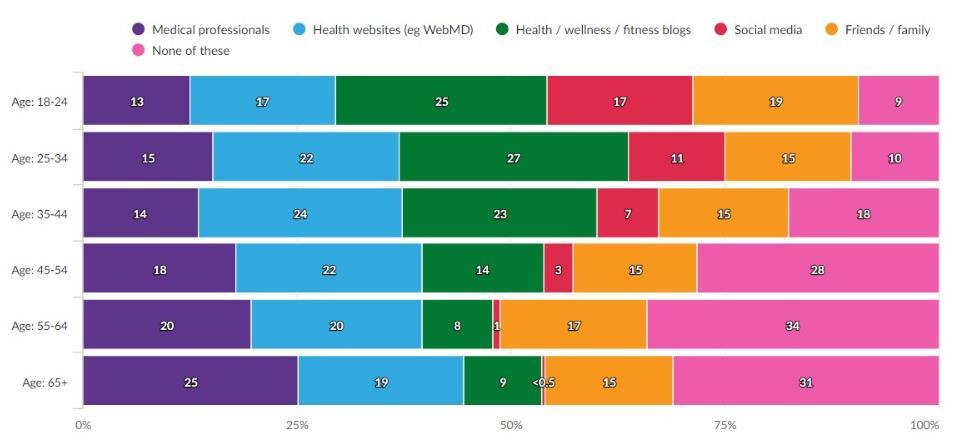
Health website + Blog
Male:36% Female:41%
18-24: 42% 25-34: 49% 35-44: 47% 45-57: 36% 55-64 :28% 65+ : 28% Health website + Blog
Mintel
From
Market Analysis
Market Analysis
Target market
1. women
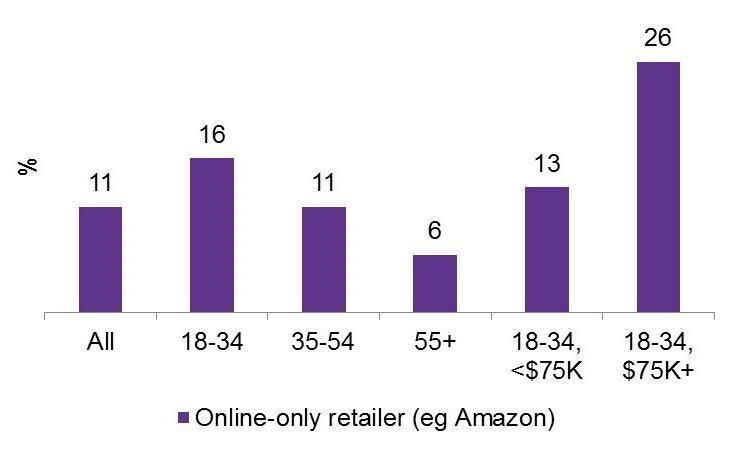
2. 18-34 years old
3. Good economic condition
From Mintel
Deepak
SWOT
1. Uses 100% PCR materials in the packaging.
2. Recyclable Packaging.
3. Ingredient transparency.
4. Fragrance made from real ingredients without overpowering.
S W
1. Expensive than its competitors
2. Less visible on shelf as compared to Its competitors (Methods, Berkeley Green).
3. For Surface cleaner, doesn’t have strong brand recall

4. Less fragrance
1. Working on Improvements to make the pumps recyclable.
2. Size of eco-consumerism is increasing
1. Mrs. Meyer has ergonomic design
2. Competitors are also switching to the biobased packaging and PCR contents
O T
10
Opportunity Statement
1. The sprayer: be reusable (design refill bottle)
2. The bottle: - better ergonomic design
- more cubical
- lighter and sustainable material
- Unique shape increase shelf visibility
3. Label : - replace to shrink label

- more color
4. Product: - Reduce the volume
Project Objective


Design a more eco-friendly packaging Increase the profit Decrease the cost Increase the repurchased rate Better user experience
Consumer
Cube Utilization Increase 4% Pallet Area Usage GHG Value FFC Value Increase 7% Decrease 5% Increase 7% Cmum Shipped Per Pallet
Design Goal
Design Scope
In Scope
Primary packaging
• Material
• Structural design
• Graphic design
Secondary design
• Material • Sustainability evaluation
• Cube utilization
• Pack to product ratio
• CO2 emission
• Fossil fuel consumption
• End of life
Out of Scope
Tertiary packaging
Primary Packaging Design

Design and Use of the packaging
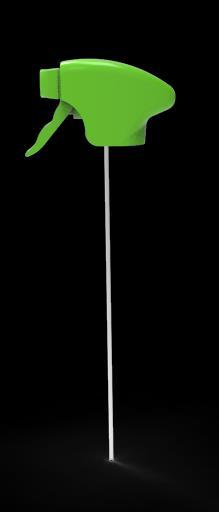
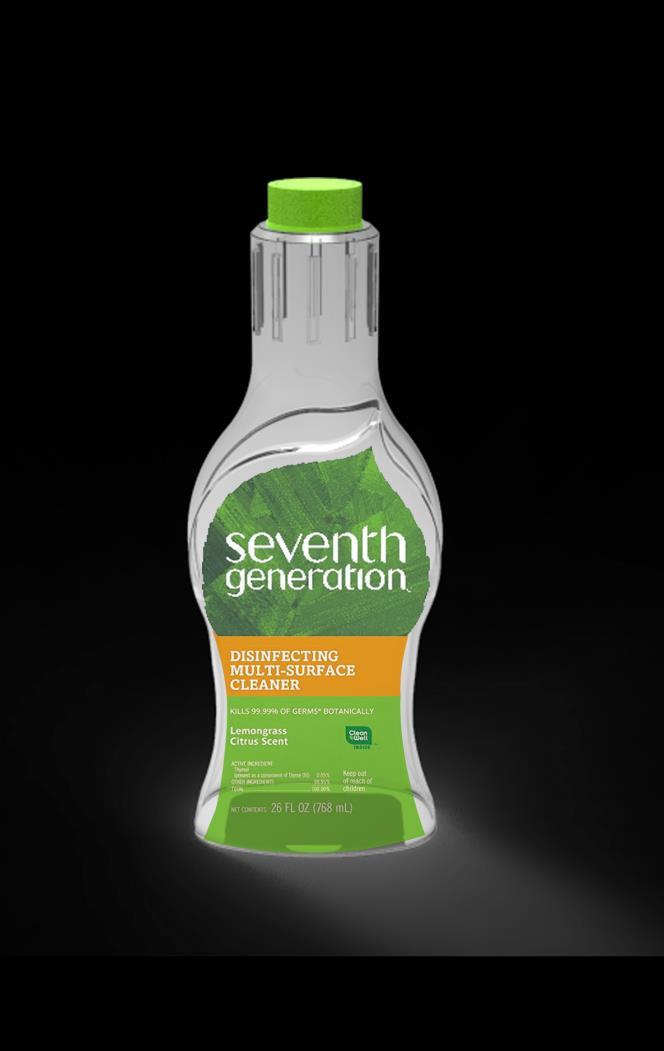
Next-Gen refill bottle
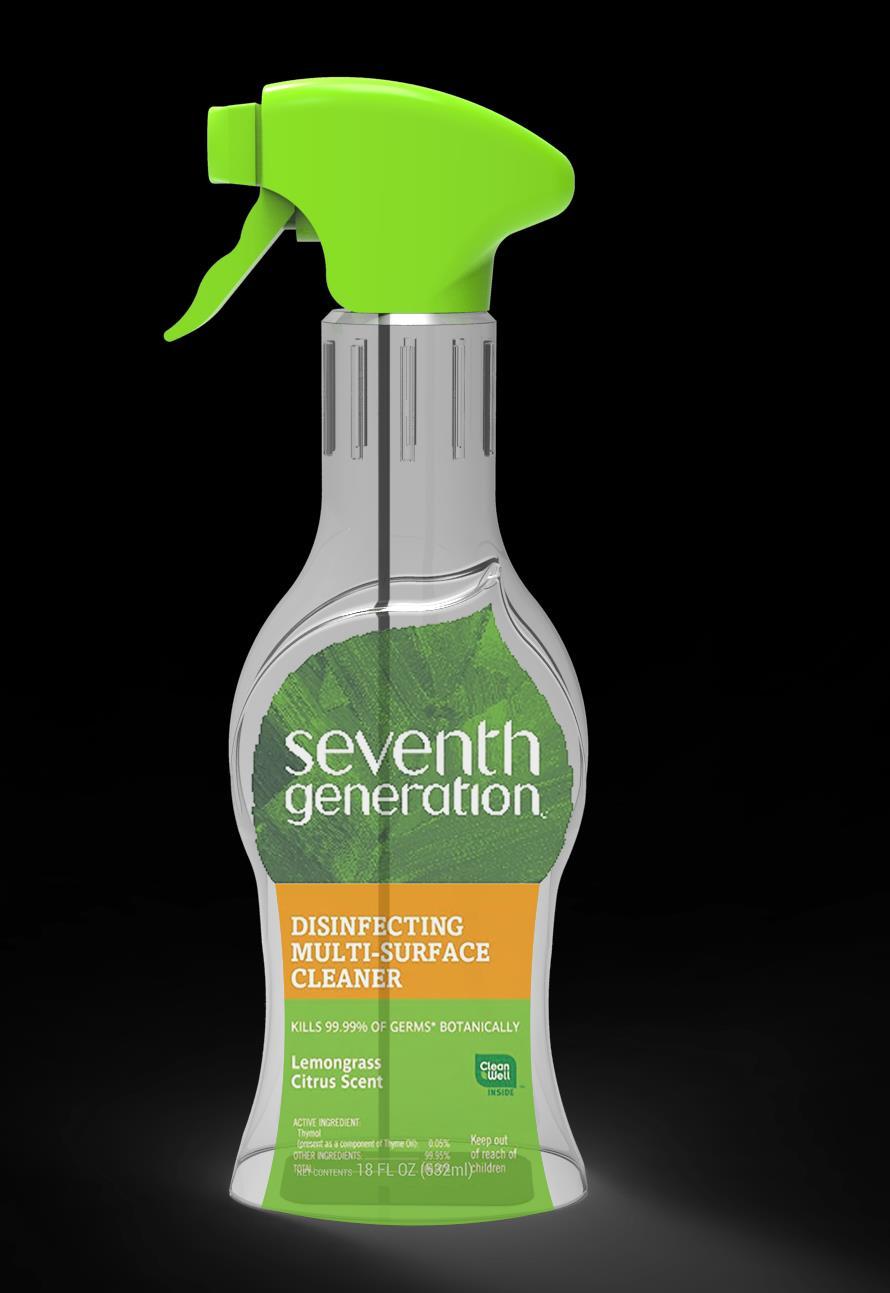
Premium look
Unique shape
Engraving neck
Seven generation identity
Big label
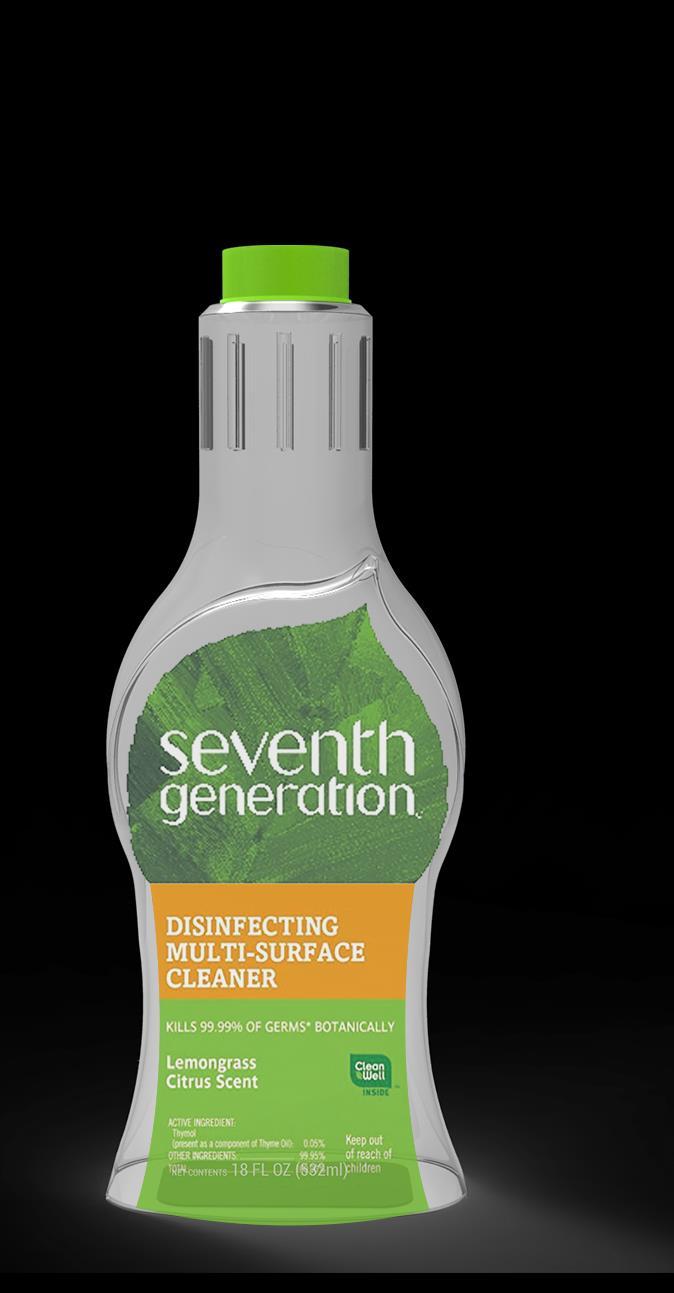
16
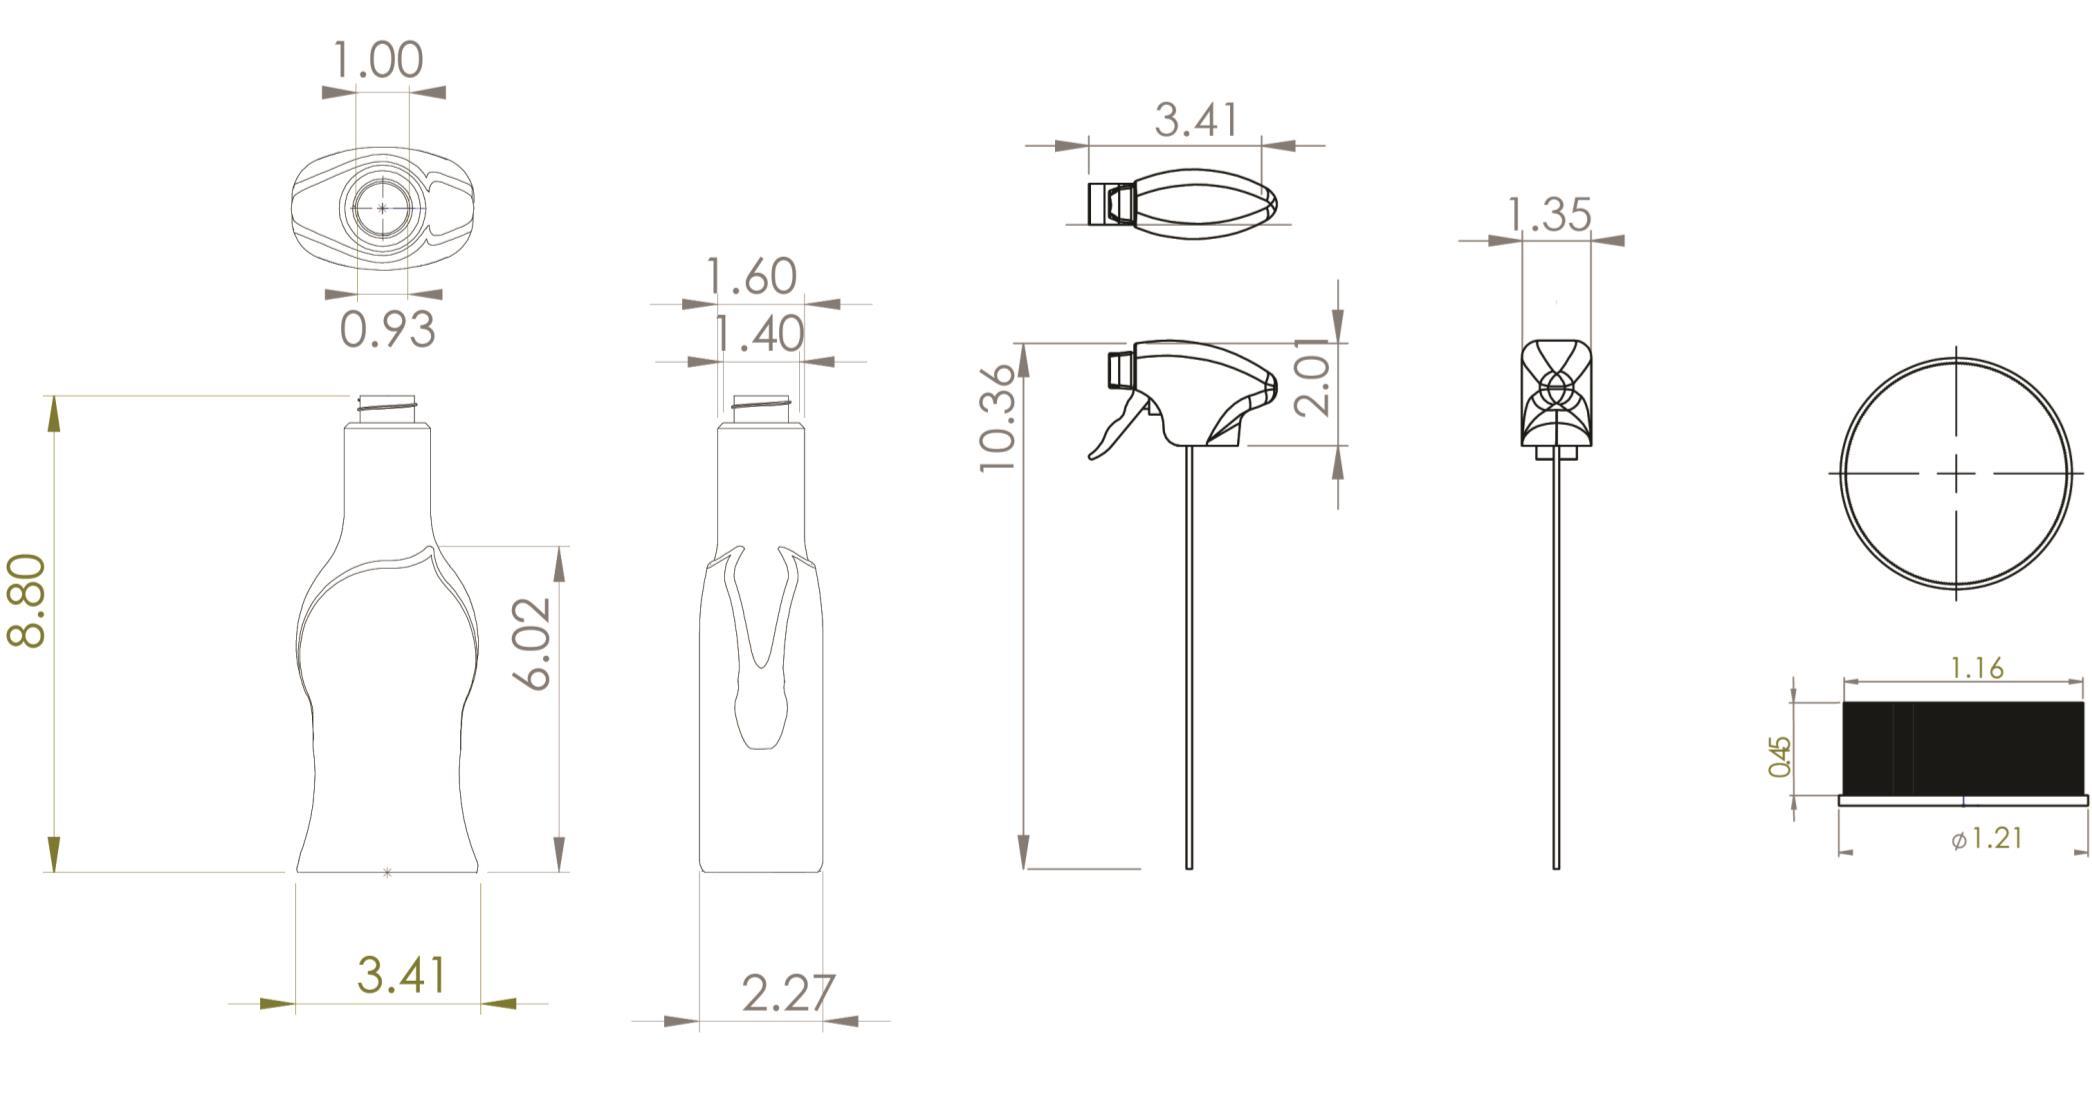
17 Bottle Trigger Cap Packaging demission- components
Unit :Inches
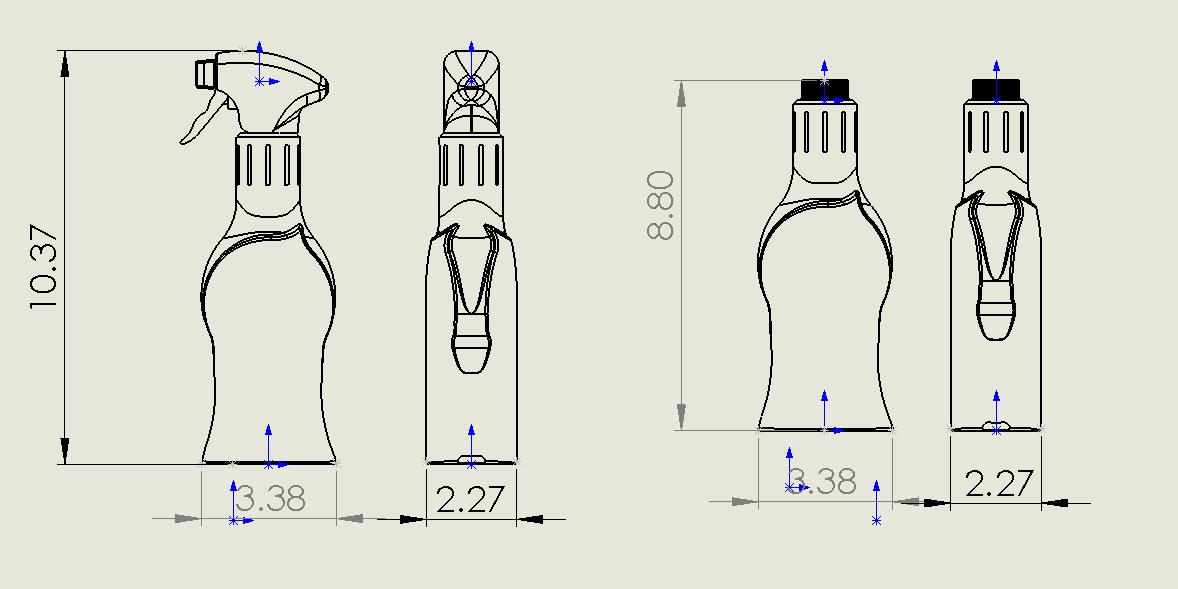
18
Packaging dimension- assemble
Buying DecisionBetter User Experience
Easy to hold
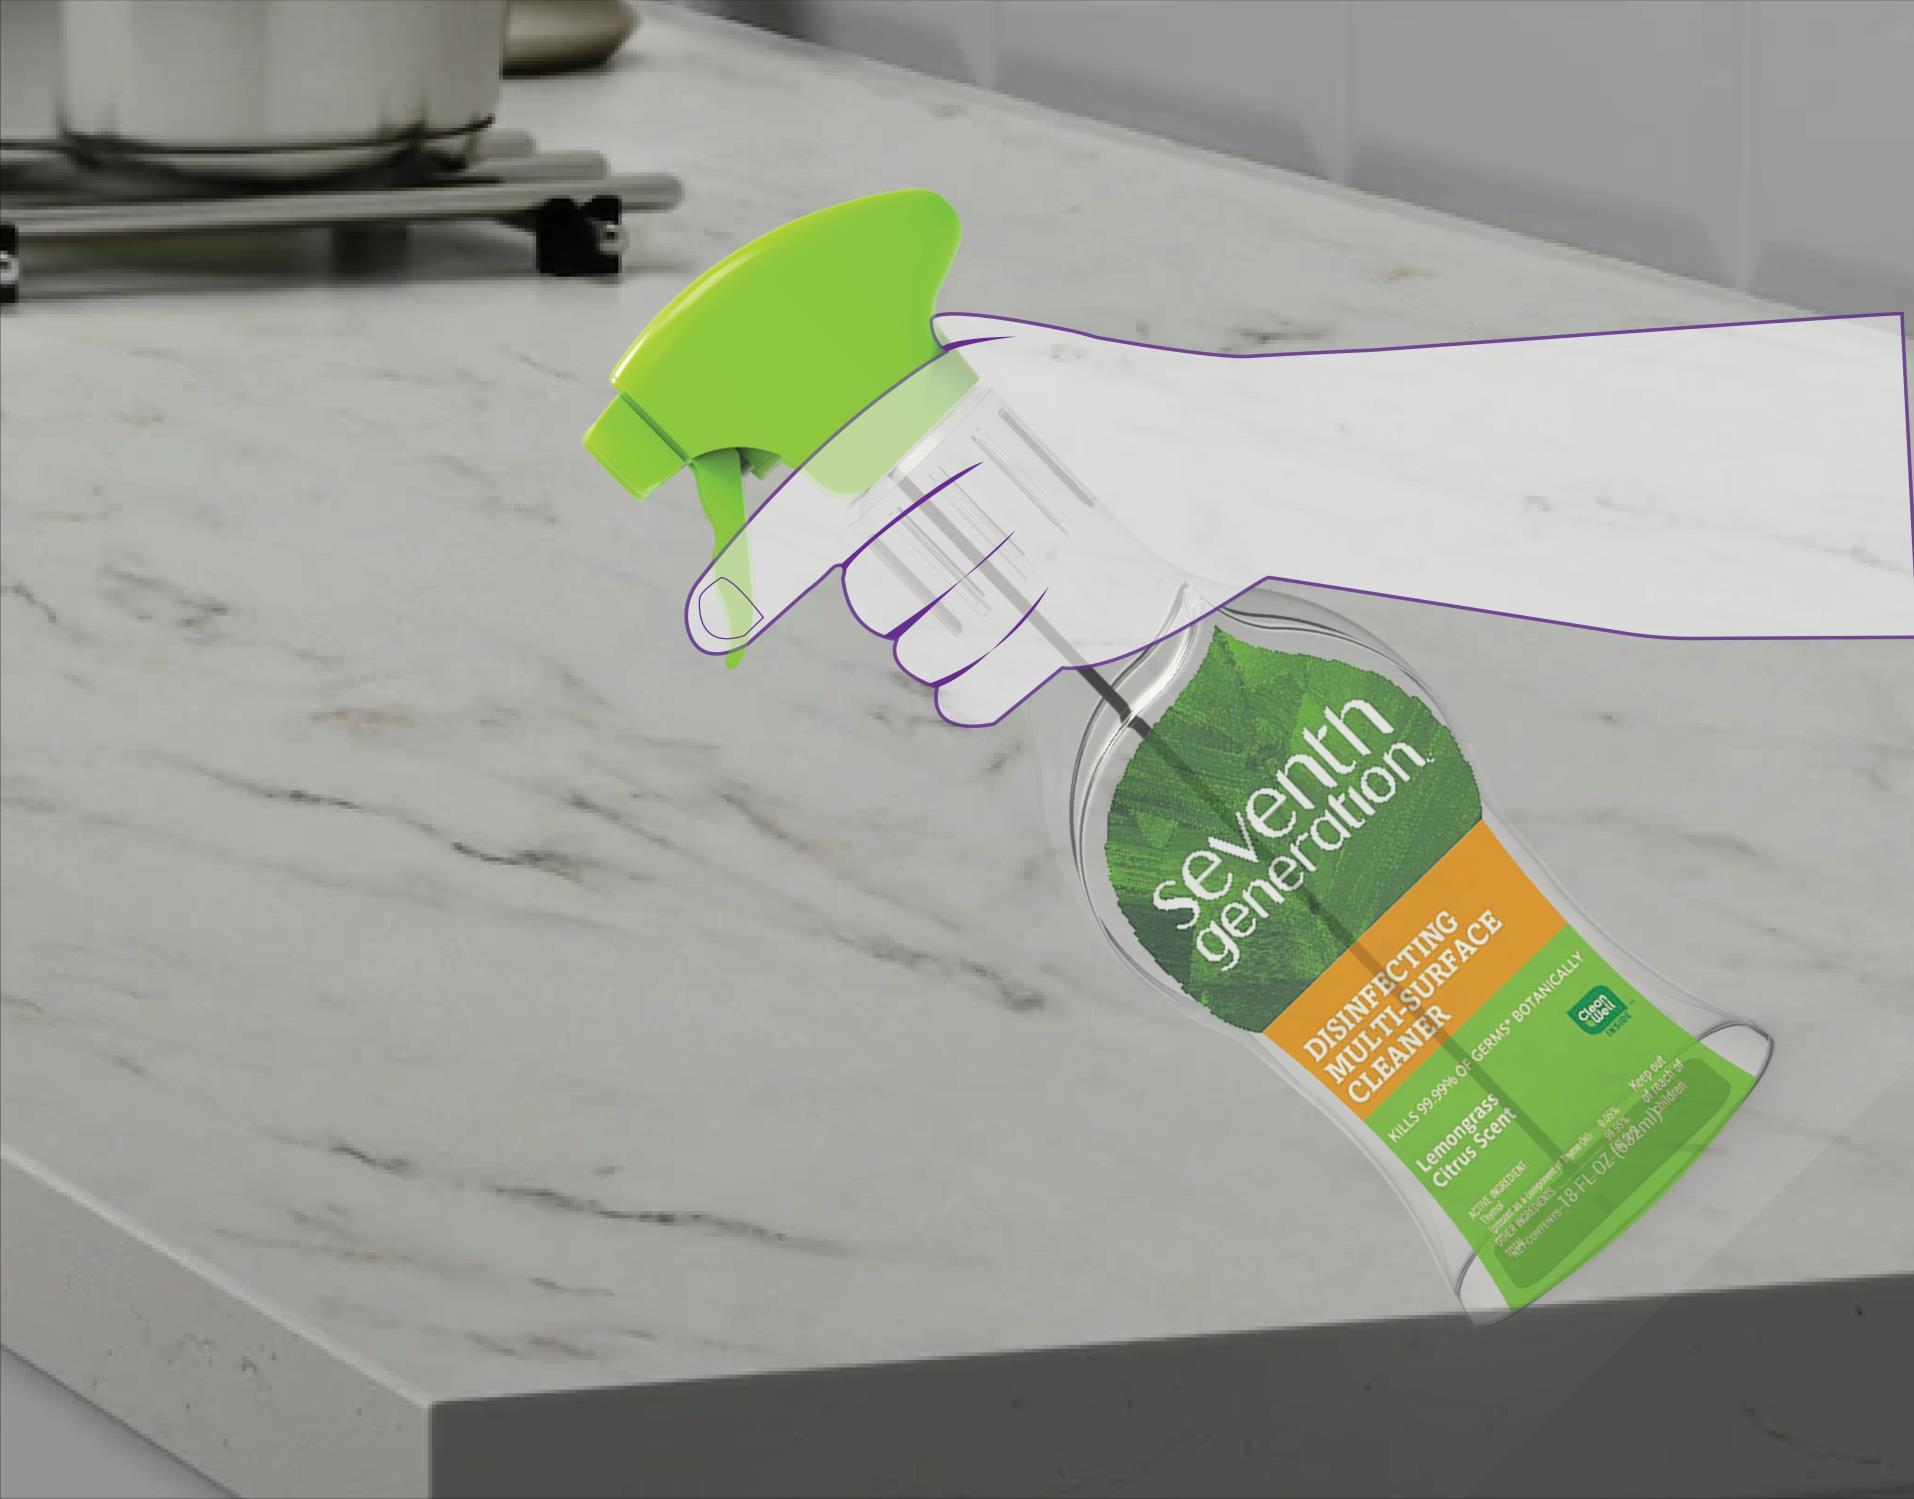
Lighter weight
Universal design
(Left and right hand)
Buying DecisionEasy to refill
Next-Gen refill bottle


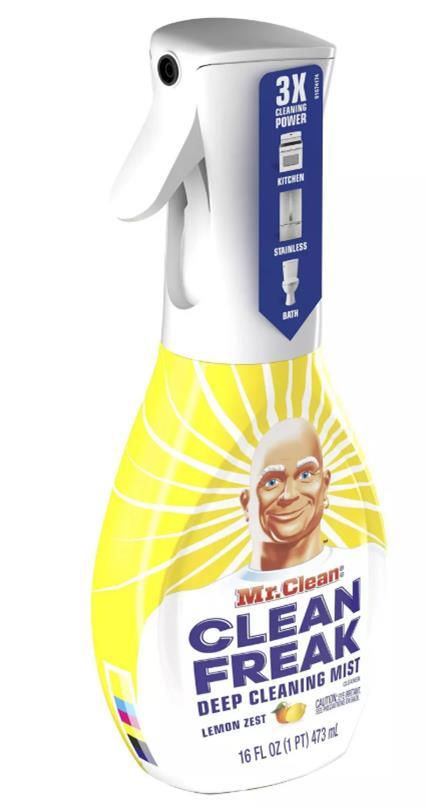
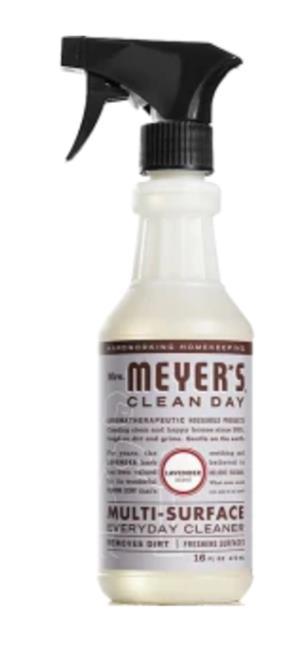
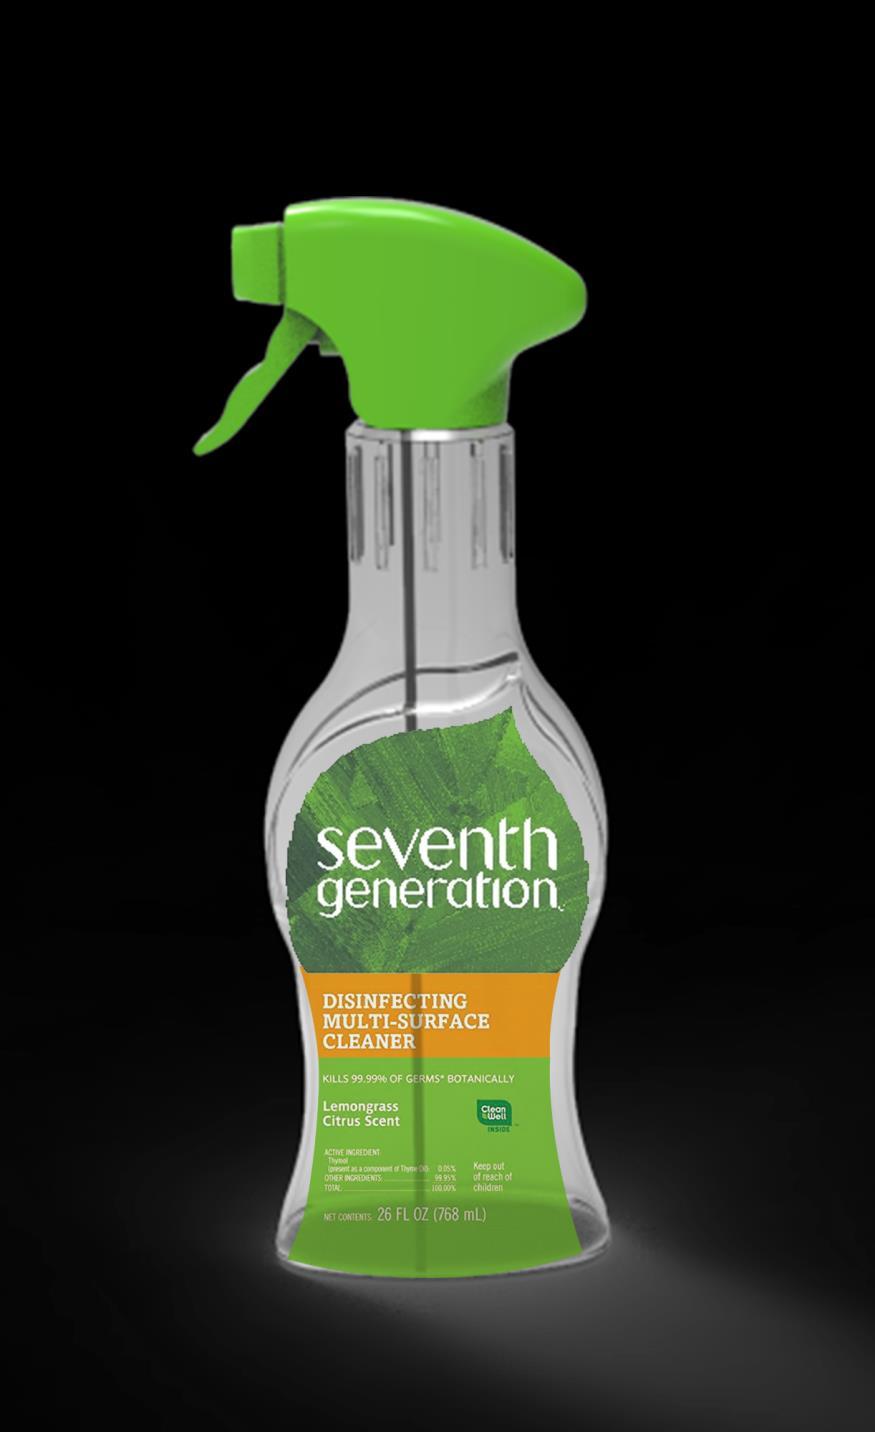
Buying DecisionCompletive Price
Cheaper than the competitor

21
$0.17
$0.24
$0.311
18oz Approx
16oz
16oz
$0.15
18oz Approx
Buying DecisionBetter Shelf Visibility

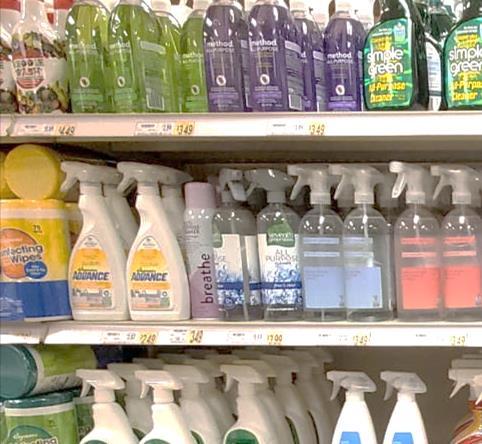


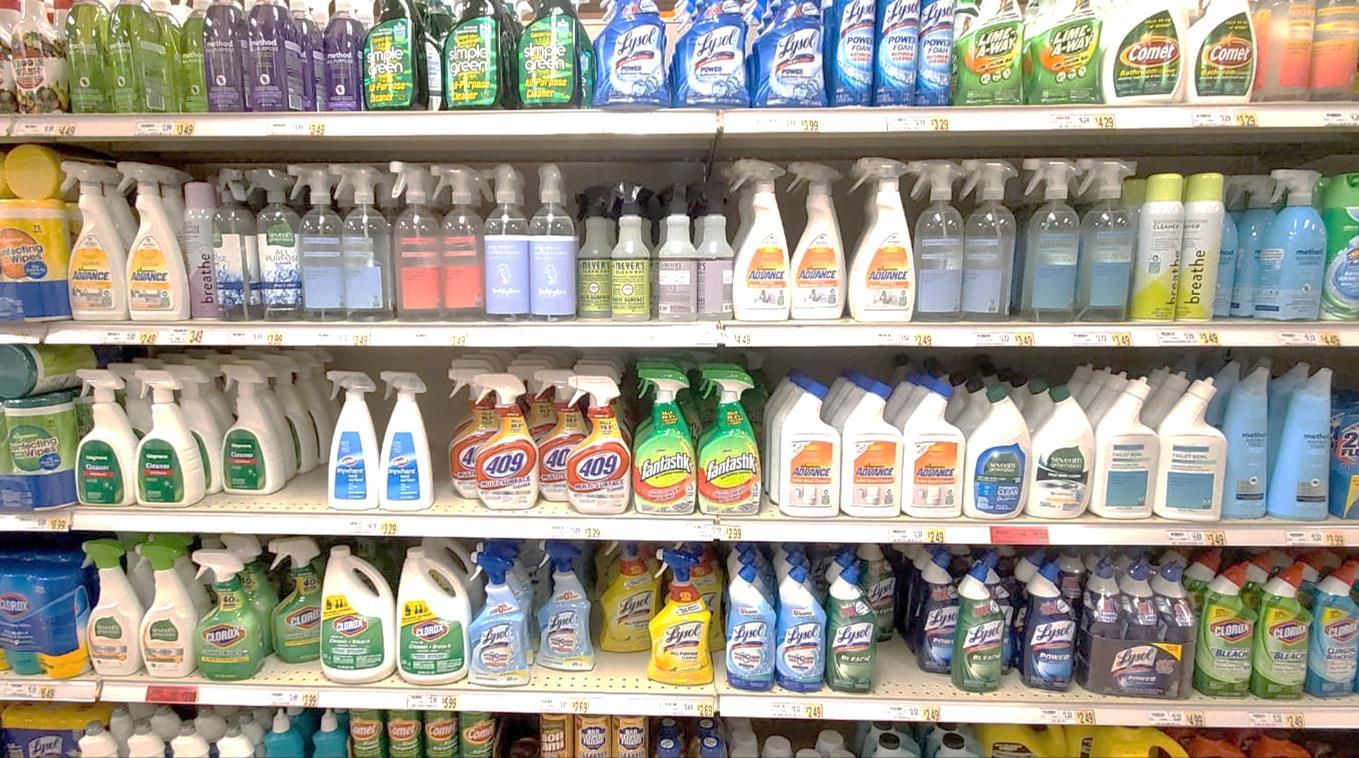
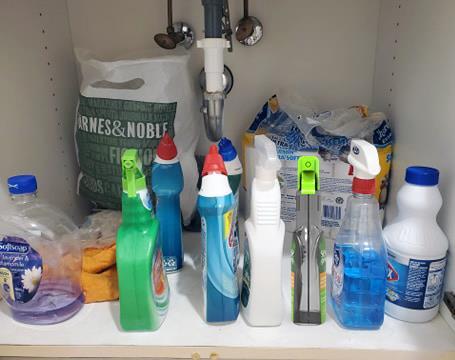
Buying DecisionEasy to Storage
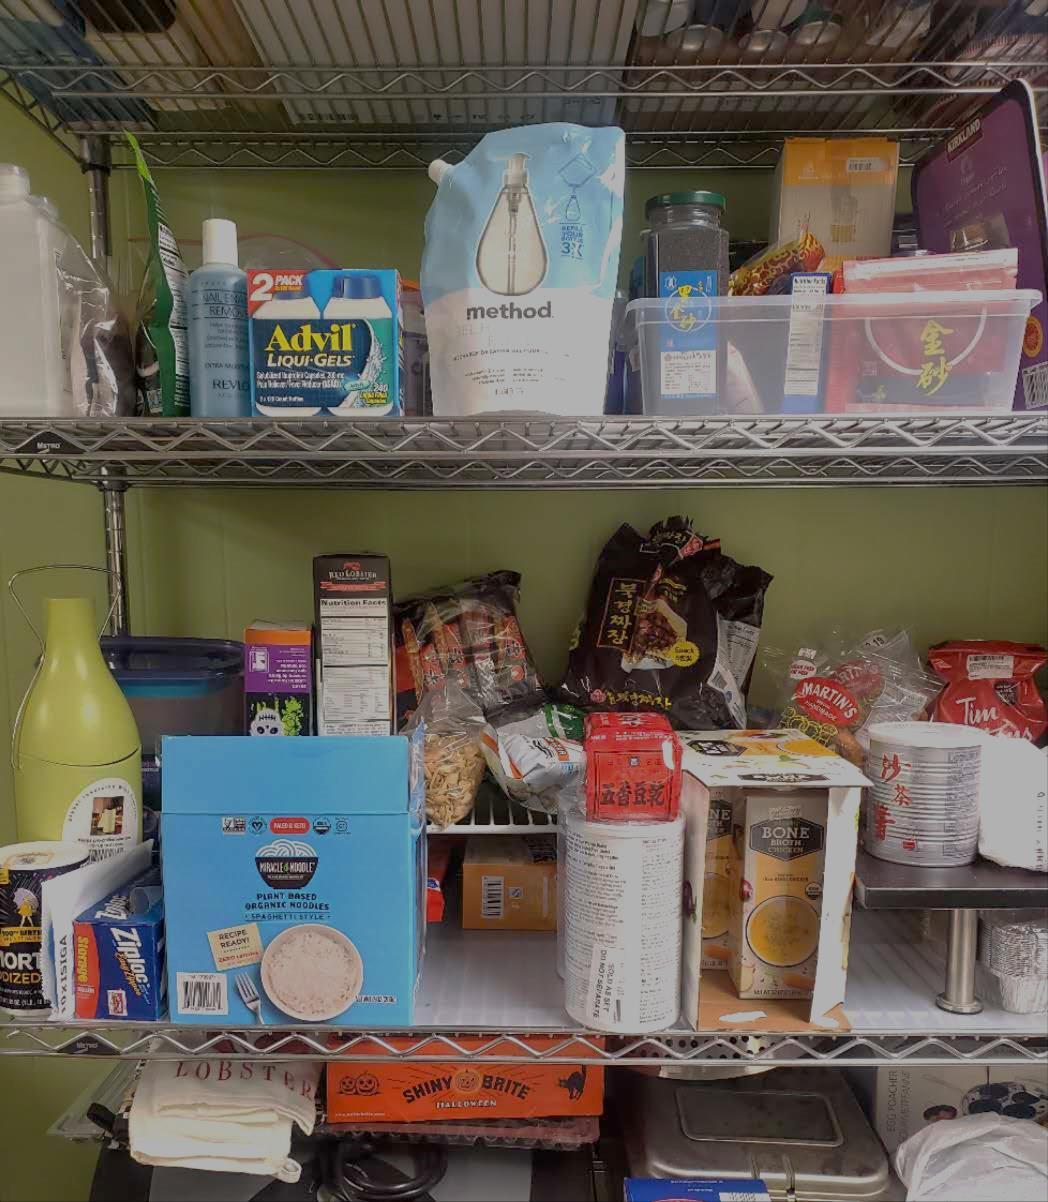
Less storage space
Next- Gen Refill bottle storage


23
Spray bottle storage
Buying DecisionEasy to Recycle (End of life)
PP (Injection Molded)
Reuse with the NEXT GEN bottle


PCR PET (Injection Blow Molded)- Recyclable
Shrink Label – Recyclable


ORIGINAL BOTTLE NEW DESIGNED BOTTLE Product CMUM (Fl. Oz) 26 18 Weight empty (lb) 0.115 0.04 Material HDPE PET Manuf. Meth Extrusion Blow Molded Injection Blow Molded Dimensions(LxWxD) (inches) 4.25 x 2.5x9.25 3.41 x 2.27 x 8.8 Bottle Volume (LxWxD) (cu in) 98.28125 68.11816 Actual volume of the bottle to overflow (cu in) 51.26 33.62 Volume Product per label(cu in) 46.92 32.484 Headspace (%) 8.47 3.48 Dec Type Pressure Sensitive Label shrink label Label Dimension (L x H) (in) 3.19x4.50 3.25 x3.8 Pack/Prod Ratio (lb /fl oz)) 0.004423077 0.00222 Cube Utilization [%] 47.74054054 47.8 25
eco spreadsheet
Primary packaging


SPRAY HEAD BOTTLE CAP Weight (lb) 0.055 0.01 Material PP PP Manuf. Meth Injected molded Injected molded Dimensions(DxH) (inches) 3.25x2.5x1.25 0.45 x 1.16 Pack/Prod Ratio (lb/fl.oz) 0.002115385 0.00055 26 Primary packaging eco spreadsheet
New Design Value
Consumer
▪ Better user experience
▪ Cheap and easy use refill bottle
▪ Eye catching appearance
▪ Less storage space
Sustainability Company
▪ Sell the less products of each packaging with higher price
▪ Downsizing strategy increase the repurchase rate
▪ Long term will decrease the cost and increase profit
▪ 100%PCR
▪ Reuse the trigger
▪ Clearly recycle instruction on the label
Secondary Packaging Design

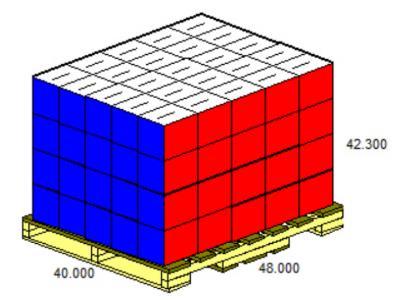
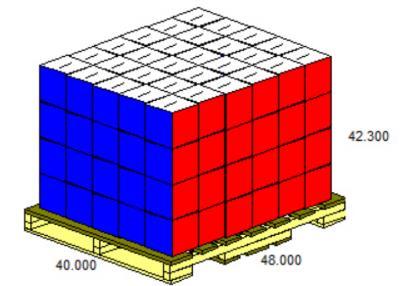
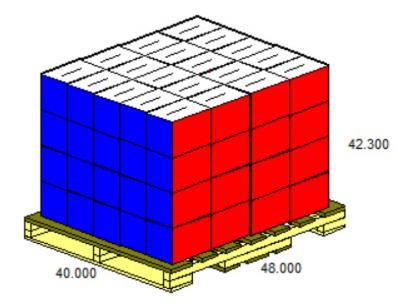
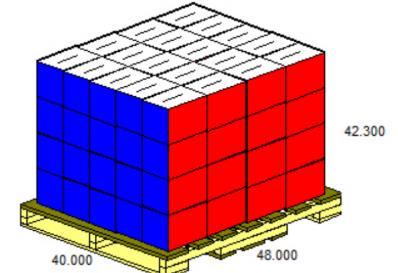

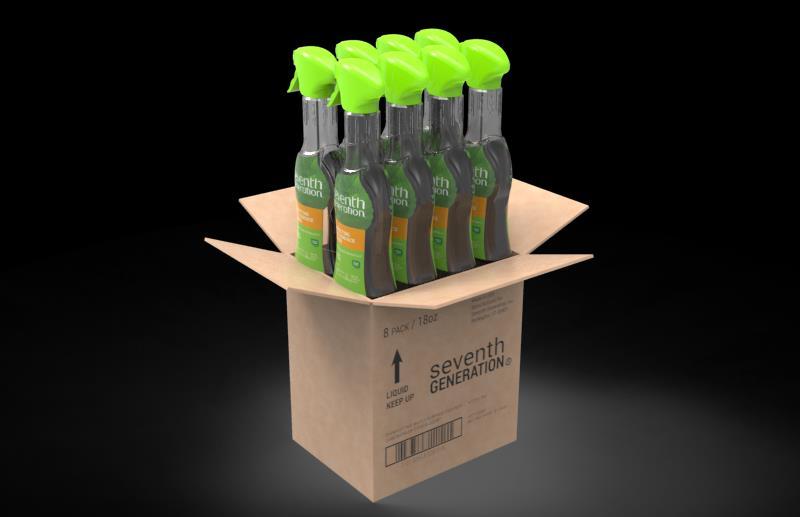
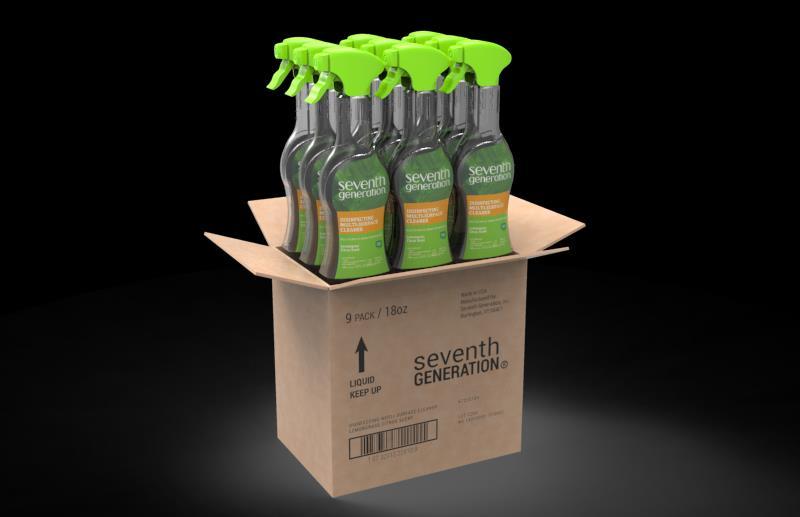
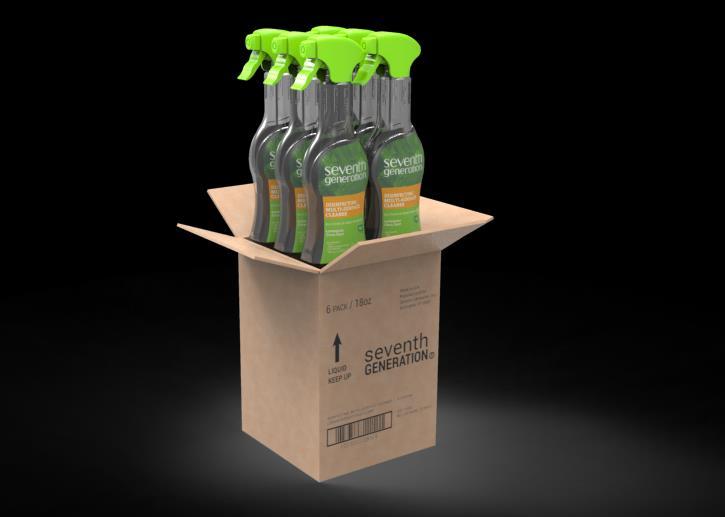
Bottle/ Case 8 8 6 9 Case/ Layer 16 25 30 20 Layer/ Load 4 4 4 4 Case/ Load 64 100 120 80 Bottle/ Load 512 800 720 720 Cube Used (%) 66.4 84.6 78.6 77.9 Area Used (%) 80.3 87.2 81.0 80.3
13
Spray Head BottleDesign and CAPE Report
8 bottles case shows it has better result of cube used and area used on load.
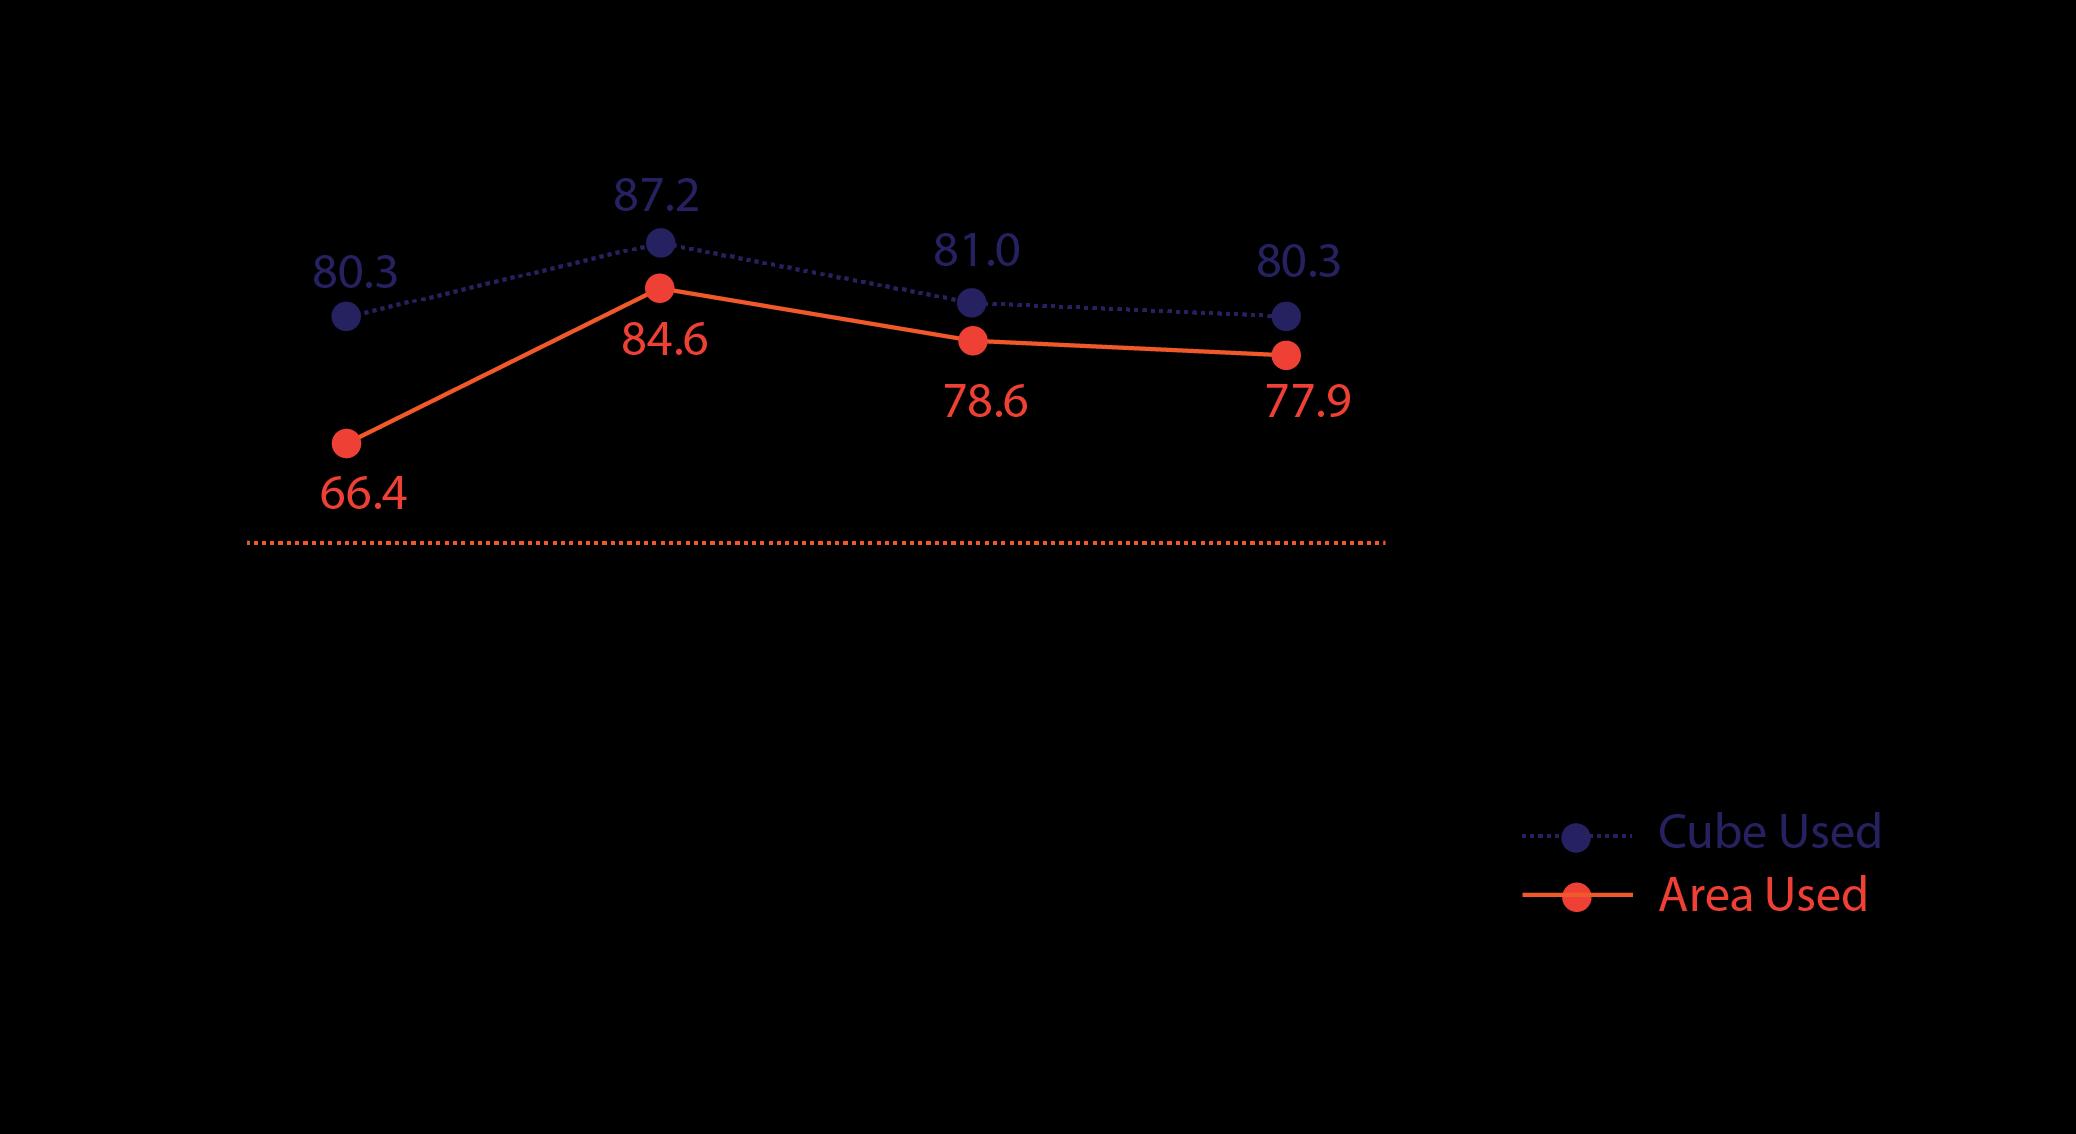
Spray Head Bottle- CAPE Report
30
Spray Head Bottle –Eco Spreadsheet Analysis
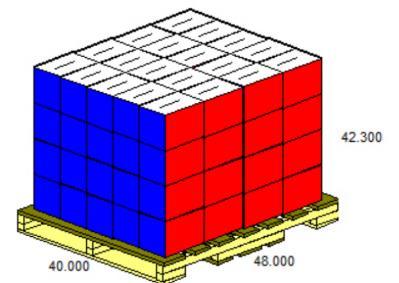


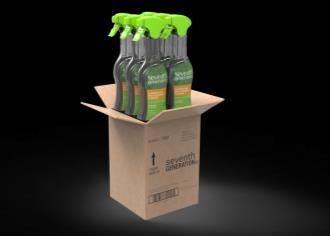
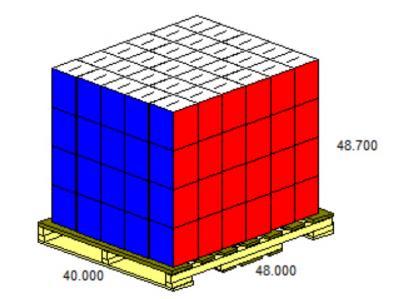

Original packaging 8 bottles 6 bottles 9 bottles Box Type RSC RSC RSC RSC Weight (filled) (lb) 16.7802 10.75 8.06 12.0963 Weight (empty) (lb) 0.6 0.54 0.53 0.56 Flute C C C C Sq in Material (sq in) 871.82 609.73 532.29 661.35 ECT (lbs/in) 32 32.00 32.00 32 Arrangment 4x2x1 4x2x1 3x2x1 3x3x1 Total bottles in the box 8 8 6 9 OD (in) 9x10.5x11 9.3x7.2x10.8 7.2x7.2x10.8 10.7x7.2x10.8 Dec Type Flexo Flexo Flexo Flexo Pack/Prod Ratio (lb/total cmums per case) 0.0029086 0.002917 0.002963 0.002963 Pack/Prod Ratio (sq in/total cmums per case) 4.1914423 4.23 4.93 4.08 Bottles/Pallet 512 800 720 720 Total CMUM / pallet 13312 14,400 12960 12,960 Cases/ Pallet 64 100 120 80 Total weight of cases on pallet (lb) 1073.9328 1,075.00 967.2 967.704 Selling Unit Volume (cu in/pallet) 50320 54,494.53 49045.07 49,045.07 Transport Pallet Volume *(TPV) (cu in) 99840 99,840.00 99840 99,840.00 Cube Utilization [%] 50.4 54.58 49.12 49.12
31 15
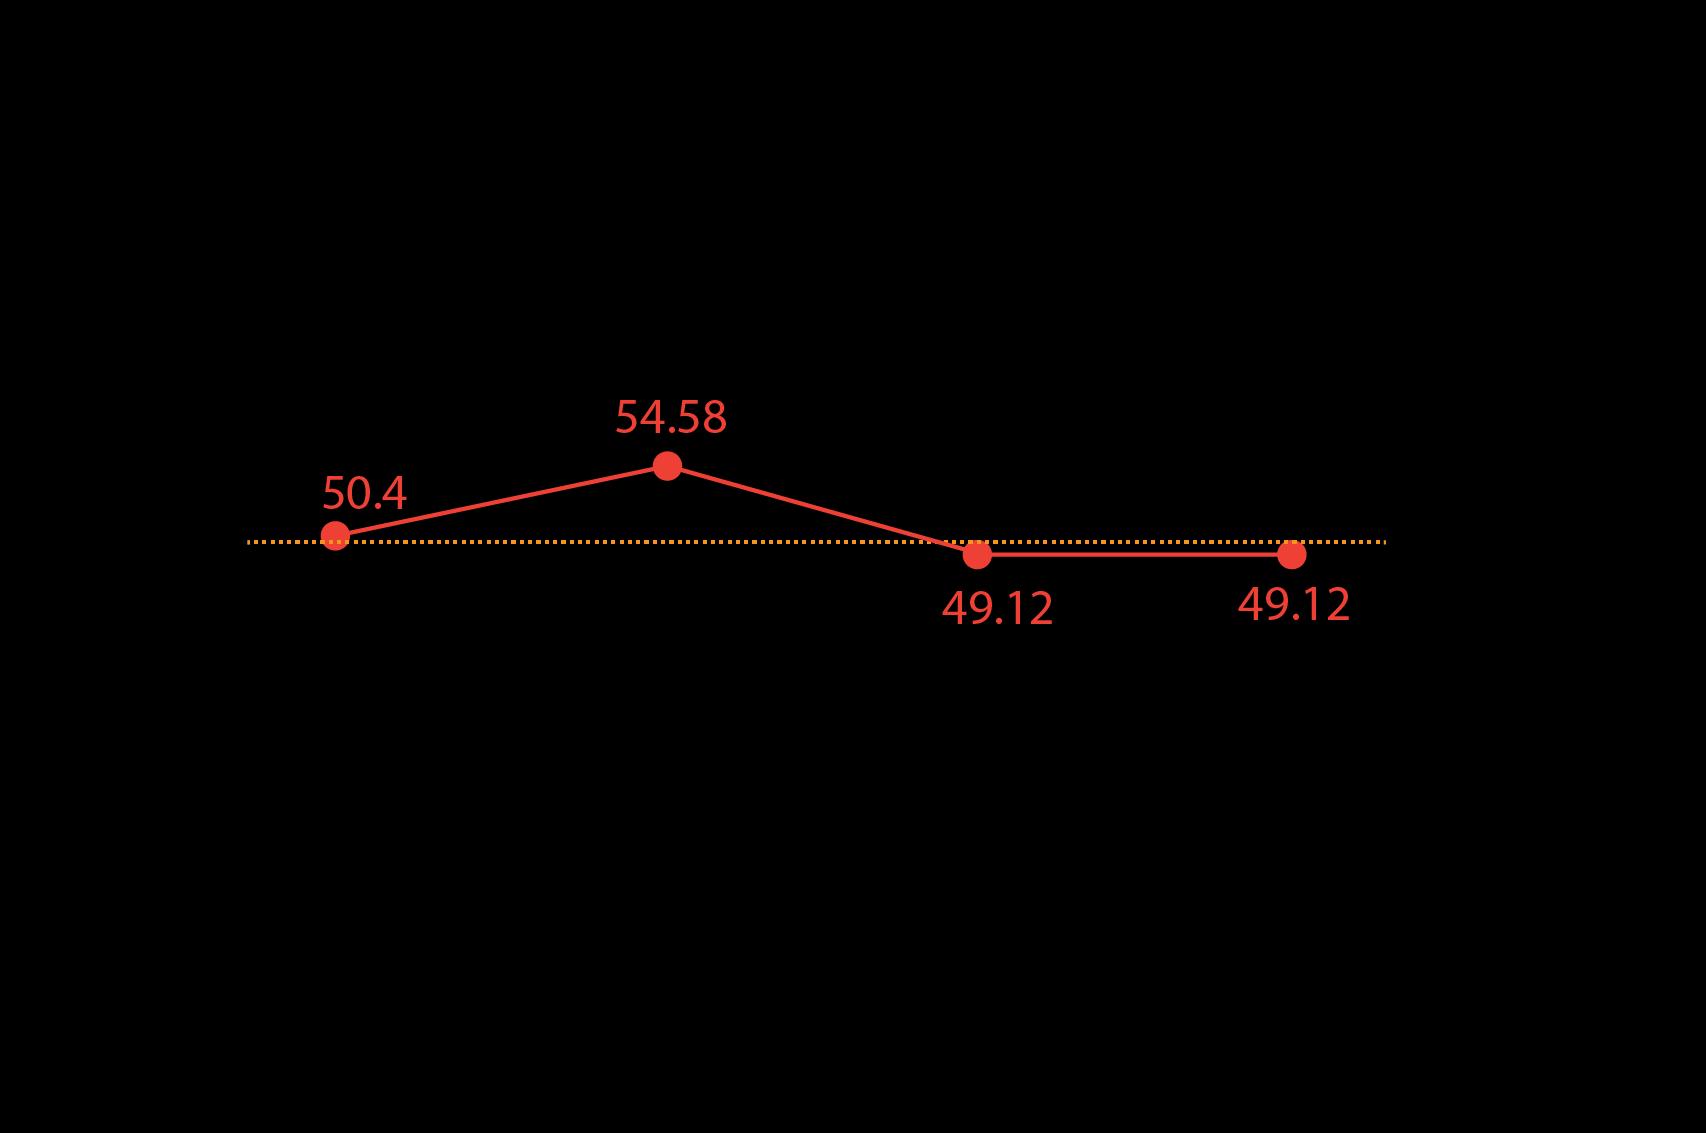
Spray Head Bottle- Cube Utilization Comparison 32
Spray head BottleCompression Strength


Humidity Level: 70%
Crossed stores for 120 Days
Internal support 10 lbs
Pallets 2 High
Partition Type 0

Flute C Flute
Ring Crush ETC 32.2
Burst Test :150
Material combination: 33-26-33


Original 8 bottles 6 bottles 9 bottles Empty Strengths 428.0 431.7 403.7 449.4 Static Strengths 428.0 431.7 403.7 449.4 Dynamic Strengths 167.5 168.9 158.6 175.4 Loads high 3.7 4.1 4.9 3.8 Safety Margin 96.9% 119.8% 172.0% 104.5%
17
All new design pass the standardization of the compression test
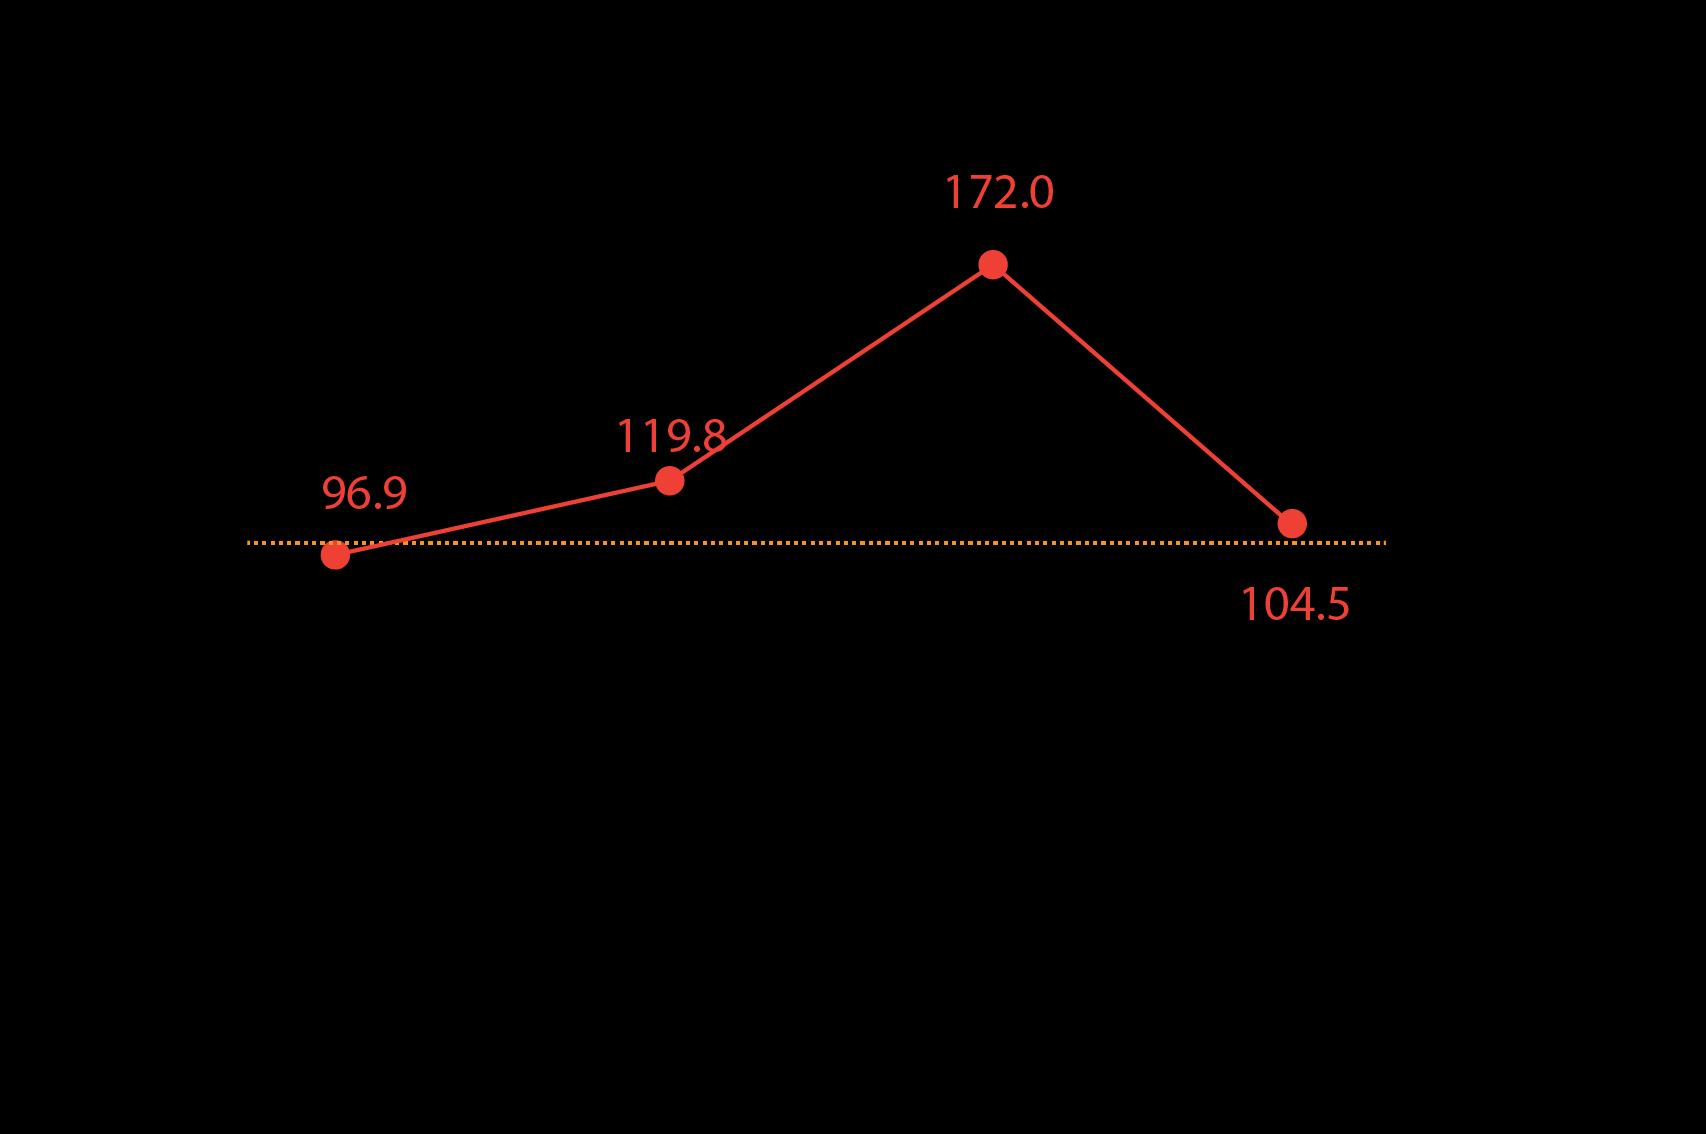
Spray Head Bottle- Safety Margin Comparison 34

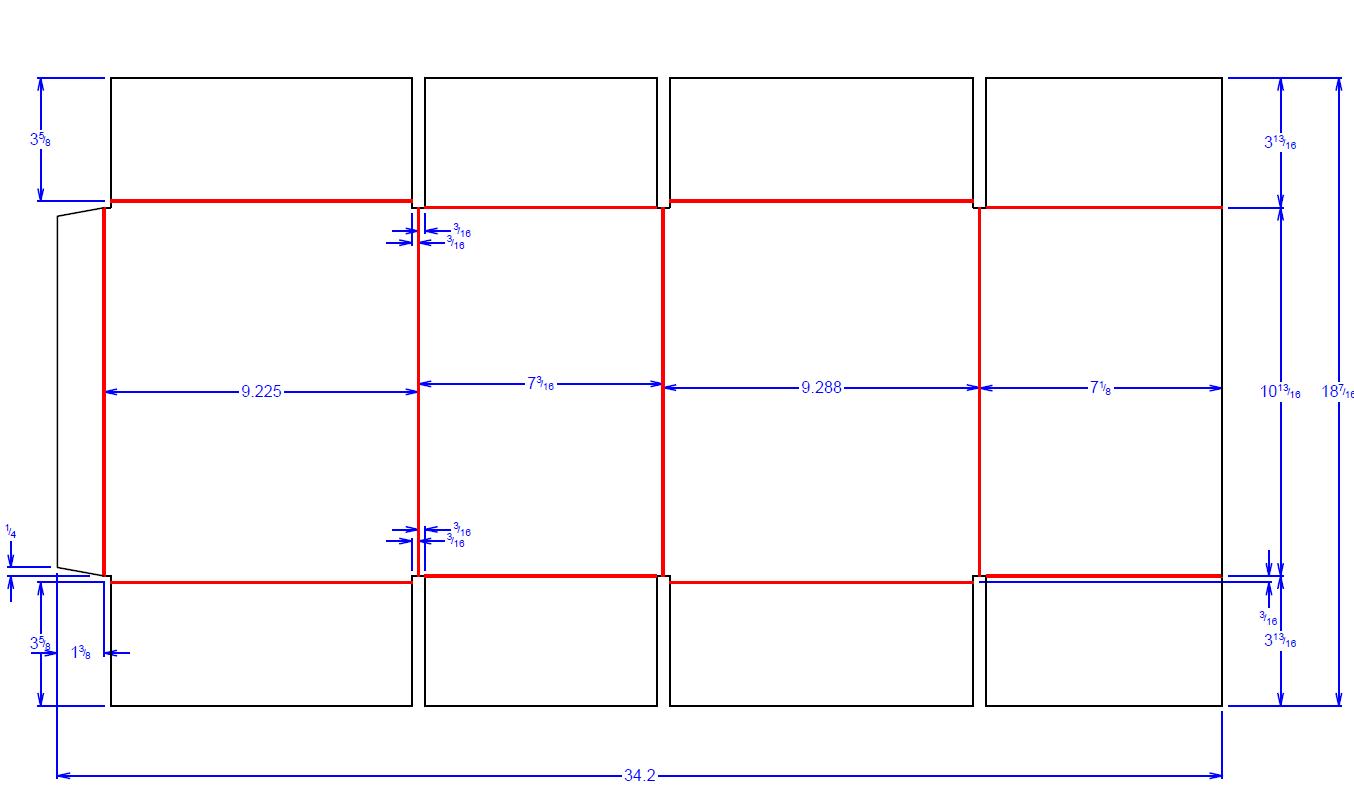

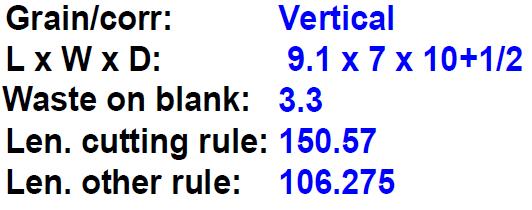
Spray Head Bottle ArtiosCAD Specification Sheet 35
Next-Gen Refill BottleDesign and CAPE Report


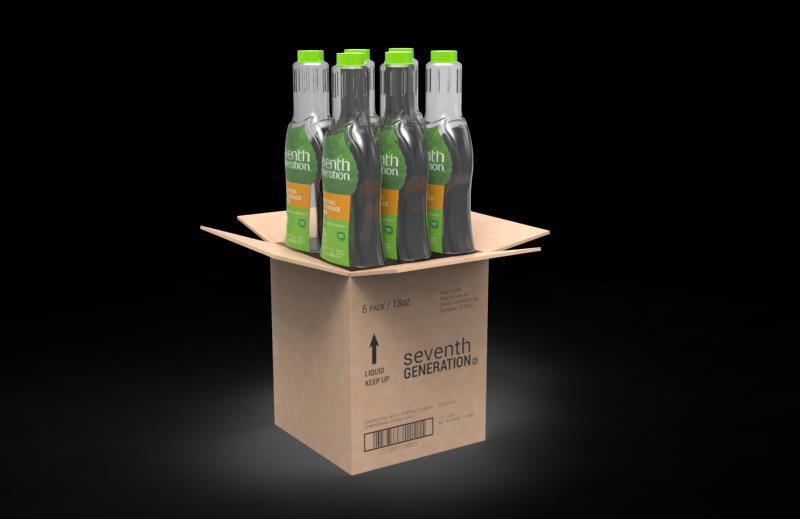
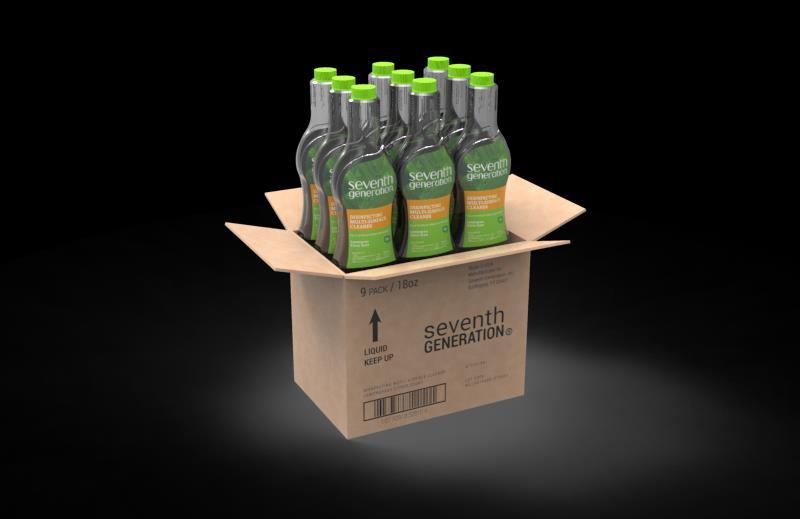


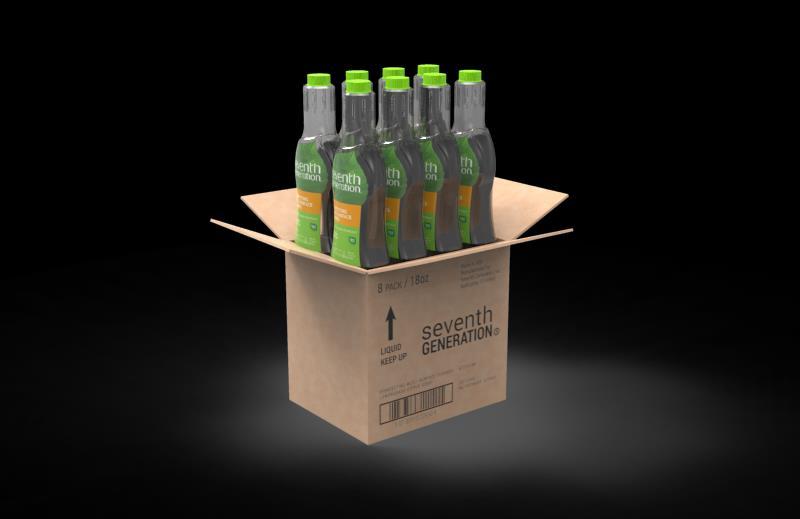

Bottle/ Case 8 8 6 9 Case/ Layer 16 25 30 20 Layer/ Load 4 4 4 4 Case/ Load 64 100 120 80 Bottle/ Load 512 800 720 720 Cube Used (%) 66.4 72.1 67.1 66.4 Area Used (%) 80.3 87.2 81.0 80.3
36
8 bottles case shows it has better result of cube used and area used on load.
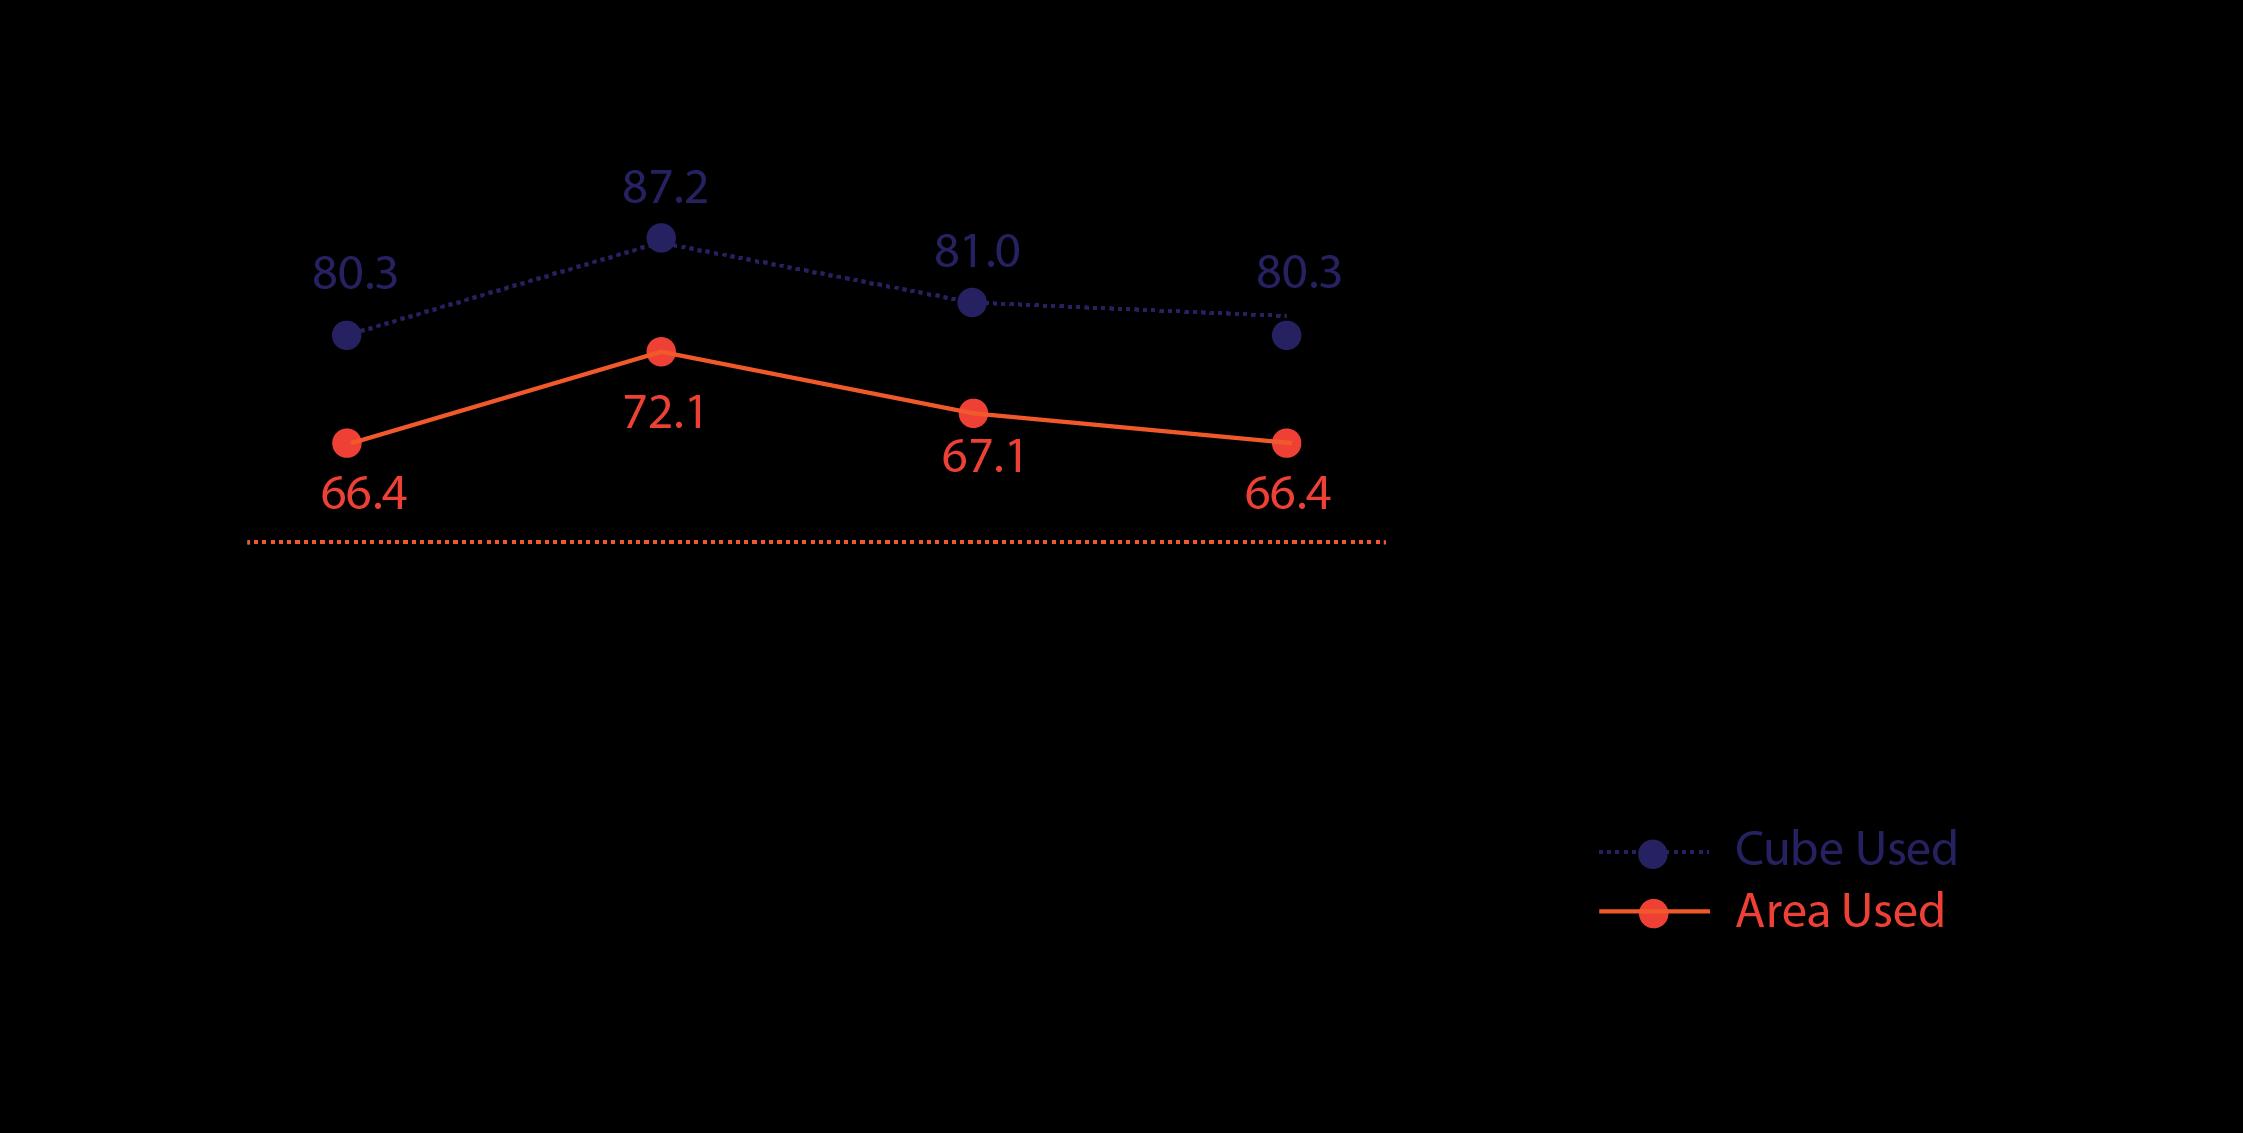
Next-Gen Refill Bottle- CAPE Report
37
Next-Gen Refill BottleEco Spreadsheet Analysis


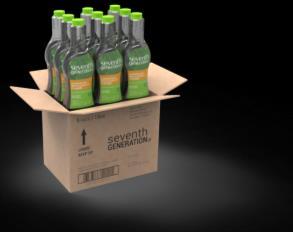

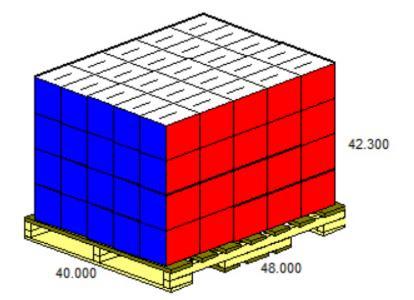


Deepak Oringinal packaging 8 bottles 6 bottles 9 bottles Box Type RSC RSC RSC RSC Weight (filled) (lb) 16.7802 9.86 7.51 11.0413 Weight (empty) (lb) 0.6 0.53 0.52 0.55 Flute C C C C Sq in Material (sq in) 871.82 555.01 484.29 602.15 ECT (lbs/in) 32 32.00 32.00 32 Arrangment 4x2x1 4x2x1 3x2x1 3x3x1 Total bottles in the box 8 8 6 9 OD (in) 9x10.5x11 9.3x7.2x9.2 7.2x7.2x9.2 10.7x7.2x9.2 Dec Type Flexo flexo flexo flexo Pack/Prod Ratio (lb/total cmums per case) 0.0029086 0.068470 0.069530 0.068156 Pack/Prod Ratio (sq in/total cmums per case) 4.1914423 3.85 4.48 3.72 Bottles/Pallet 512 800 720 720 Total CMUM / pallet 13312 14,400 12960 12,960 Cases/ Pallet 64 100 120 80 Total weight of cases on pallet (lb) 1073.9328 986.00 901.2 883.304 Selling Unit Volume (cu in/pallet) 50320 54,494.53 49045.07 49,045.07 Transport Pallet Volume *(TPV) (cu in) 99840 99,840.00 99840 99,840.00 Cube Utilization [%] 50.4 54.58 49.12 49.12 38

Next-Gen Refill Bottle- Cube Utilization Comparison 39
Next-Gen Refill BottleCompression Strength


Humidity Level: 70%
Crossed stores for 120 Days
Internal support 10 lbs
2 High
Type 0
Flute C Flute
Ring Crush ETC 32.2
Burst Test :150
Material combination: 33-26-33


Original 8 bottles 6 bottles 9 bottles Empty Strengths 428.0 411.2 403.7 428.0 Static Strengths 428.0 411.2 403.7 428.0 Dynamic Strengths 167.5 161.3 158.6 167.5 Loads high 3.7 4.0 5.1 3.7 Safety Margin 96.9% 117.4% 179.1% 100.4%
25
Pallets
Partition
All new design pass the standardization of the compression test
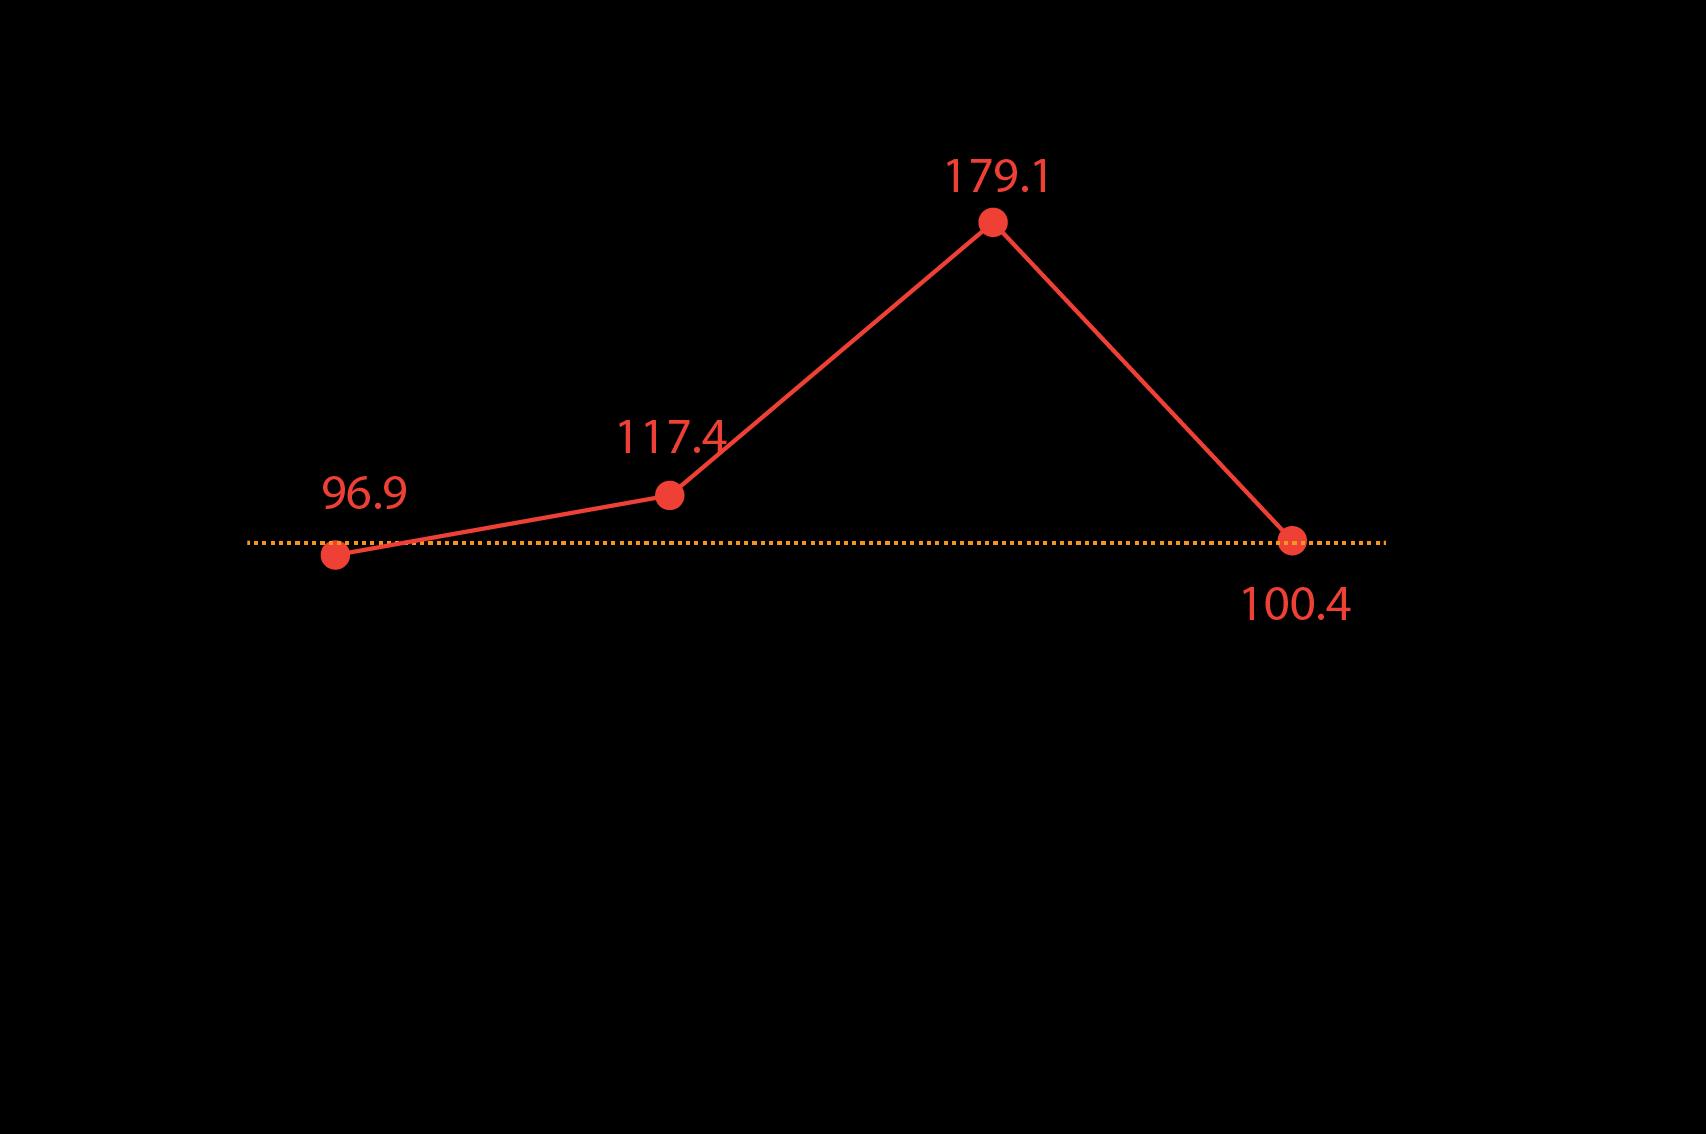
Next-Gen Refill Bottle- Safety Margin Comparison 41
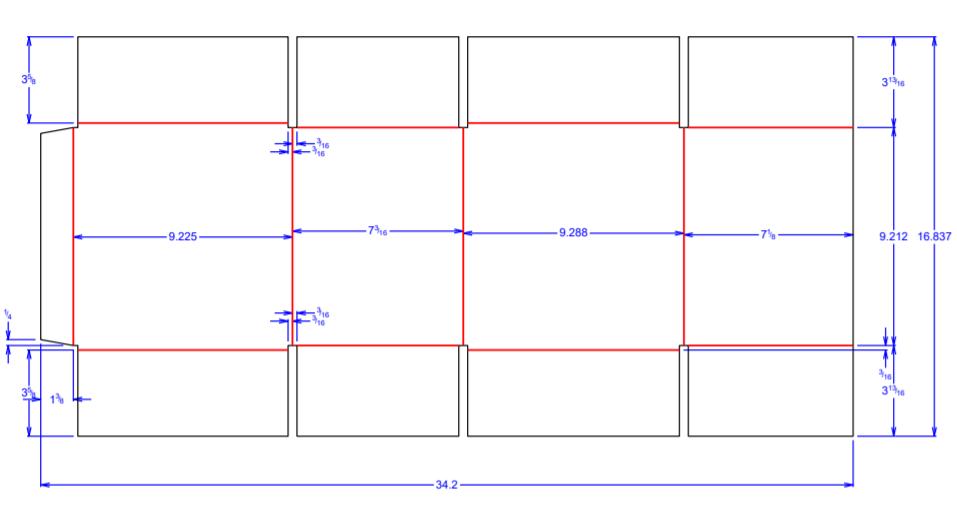
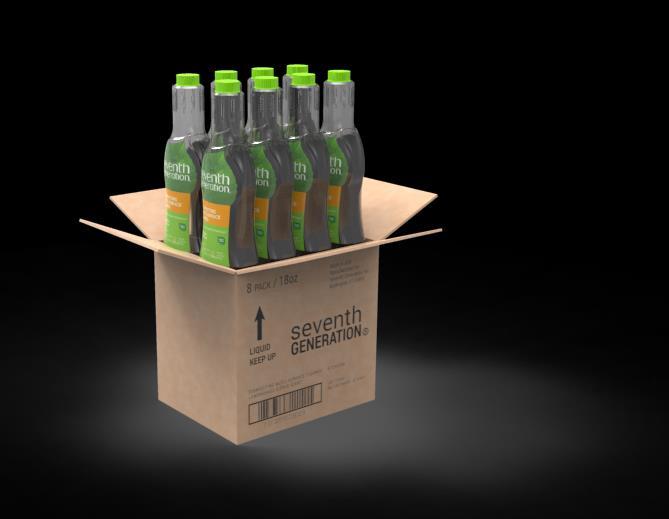


Next-Gen Refill Bottle- ArtiosCAD Specification Sheet 42
New Design Value
Sustainability Company
Consumer ▪ Easy to recycle ▪ Lighter weight ▪ Transport efficiency ▪ Save the cost by better cube utilization ▪ Use less material ▪ Less environmental impact ▪ Less material consumption
Eco-Impact Analysis

Ecoimpact Analysis


Ecoimpact Analysis
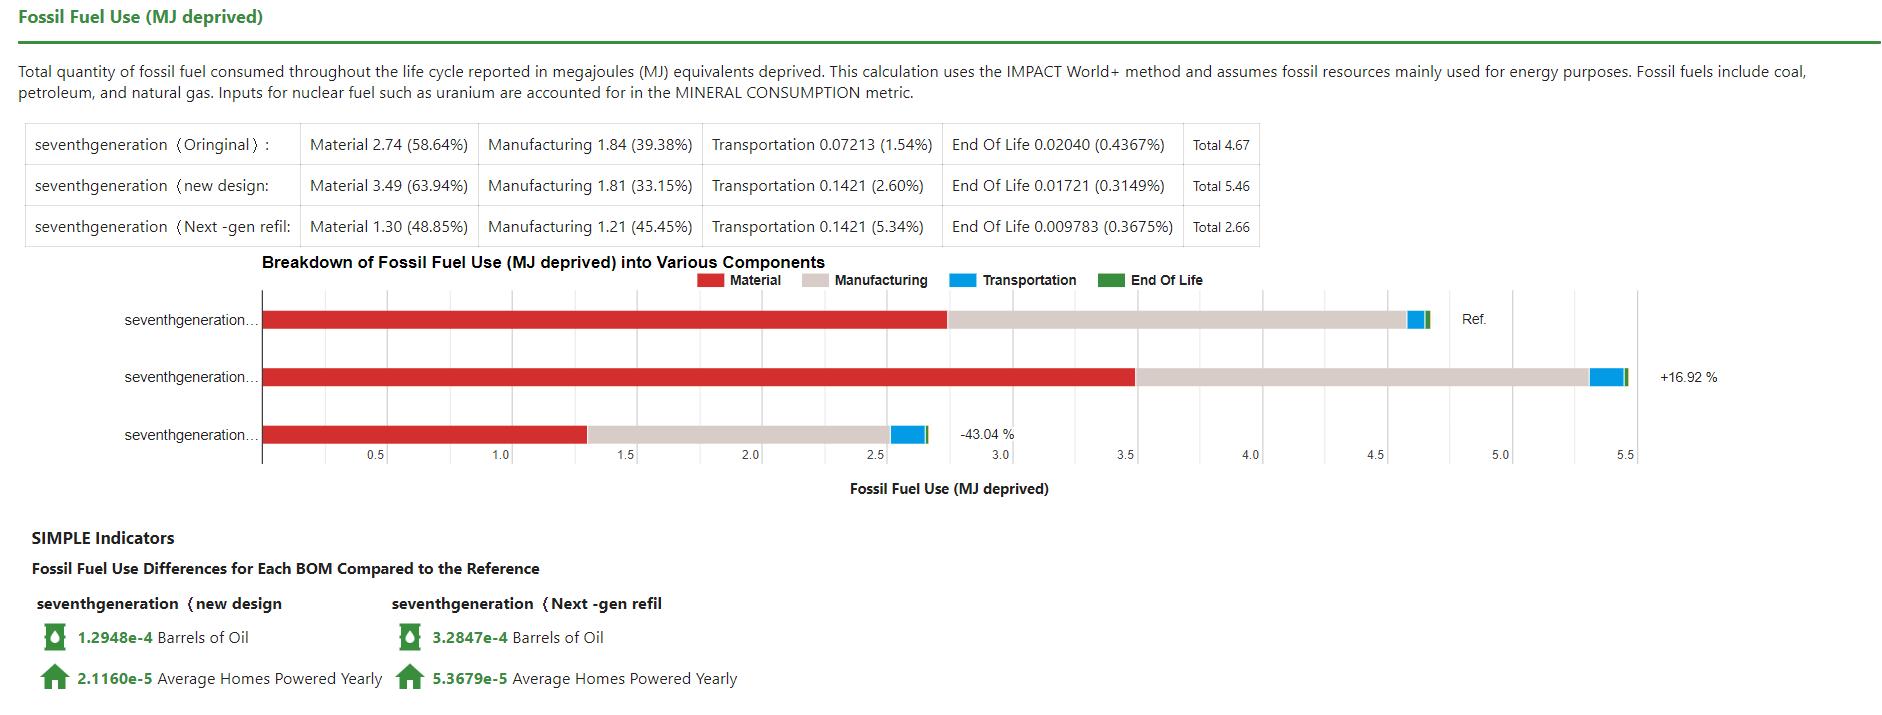
46
Ecoimpact Analysis
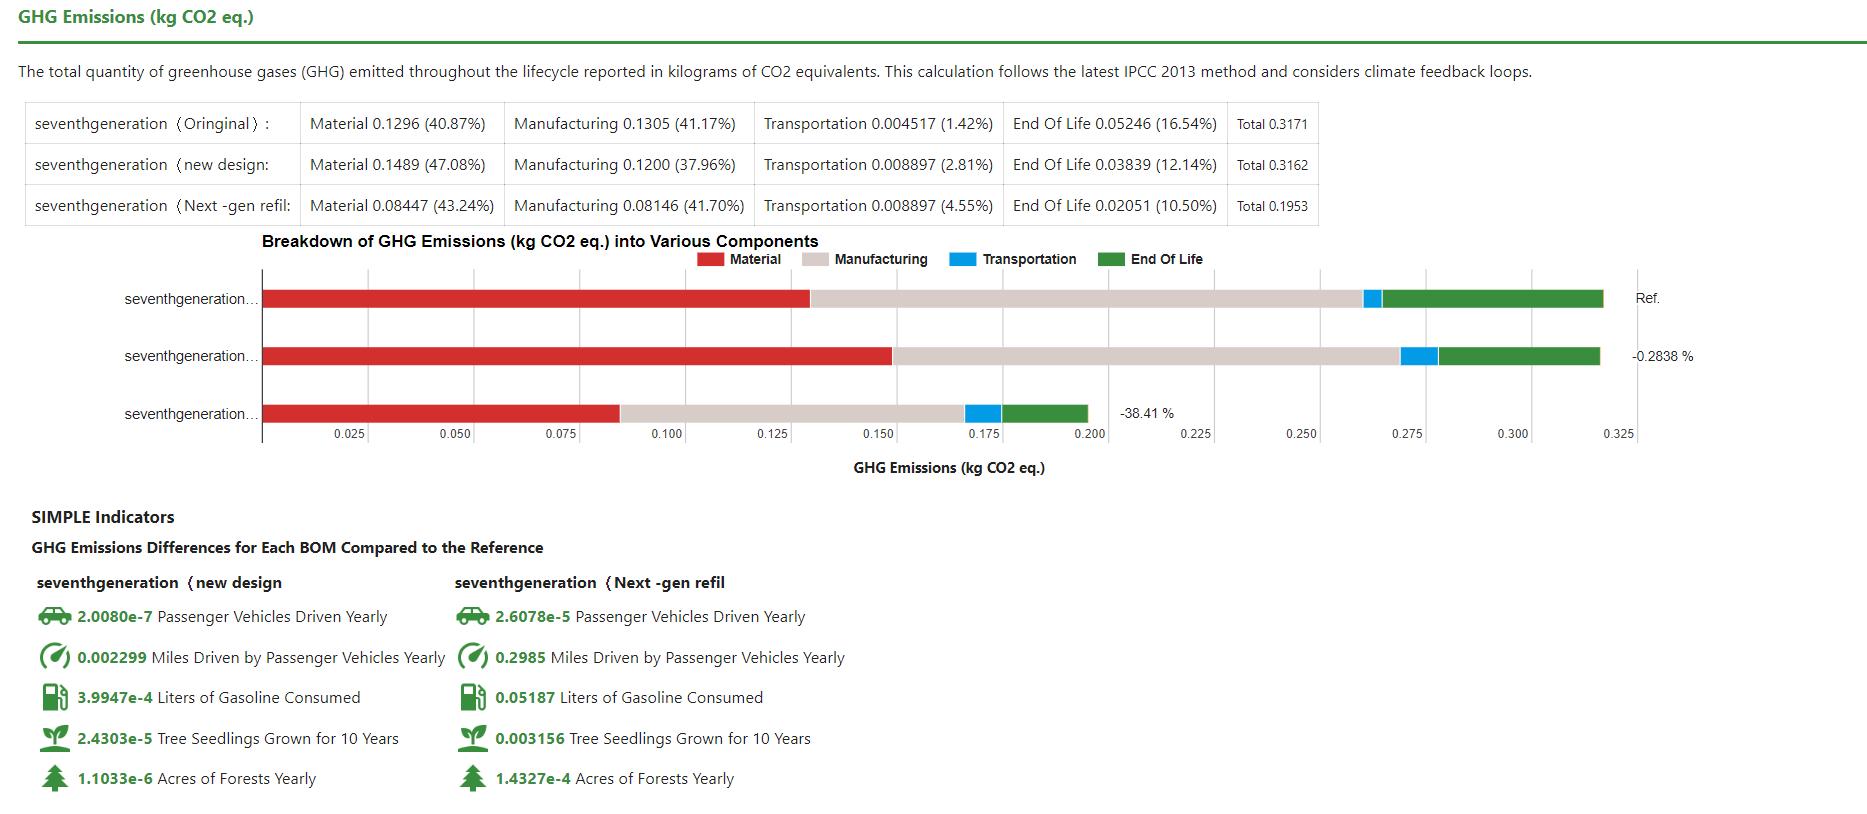
New Original Refill
Design Goal Report
Cube Utilization Increase 4.5% Pallet Area Usage GHG Value FFC Value Increase 7.2% Decrease 38.4% Increase 7.5% Cmum Shipped Per Pallet Decrease 43.04%
What’s For Next?
WE ARE ALMOST THERE! BUT BEFORE THAT…..
• Redesigning the scorecard and Providing Practical Rankings.
• Considering Other Refill Strategies Like, Concentrates or a Pouch Refill Package.


• Running The Distribution Tests Based on ISTA 3A.
• Analyzing The Test Results, If Approved then move to next step; If not, then optimizing the structure of the package.

49


