Constructive Paper Cushion
Presenter: Charlene Feng
Rochester Institute of Technology
Instructor: Dr. Changfeng Ge

Committee: Dr. Alexis Rich, Dr. Kyle Dunno
May 10th, 2023
01 02 03 04
Design
1
Agenda
Introduction
Testing Analysis
2
Introduction 01
Material Comparison
Plastic Cushion
- Foam Cushion
• Durability, Perfect Cushion
Properties
• Reusable
• Light weight
• Moist Resistant
• Low cost (Most common used)
• Low recyclability
Paper Cushion
- Corrugated Cushion
• Versatile (Easy to fabric/ shape)
• Limited reusability
• Not moisture-resistant
• High recyclability
• Biodegradable
3
Origami
Origami is a traditional Japanese art of paper folding. The word "origami" comes from two Japanese words, "ori" which means "folding," and "kami" which means "paper."
Benefit of Origami
Easy to produce.
Improve Paper Cushion
• Durability
• Stiffness
• Compressibility
• deployable performance
• Lightweight
4
02
Design 5
Design Method Folding method
• Stability:
• Uniform flat surface
• Strength
• Deployable
• Compactness
• Scalability
• Deployable
• Compactness
• Scalability
• Stability
6
Box Fold Accordion Fold Miura-Ori Fold
Design Method
Design Geometry
Flute height
Increase flute height to increase maximum displacement and decrease maximum stress in both static pressure and drop tests (Zhang, 2014).
Arc radius of the flute
Increase the arc radius of the flute to increase maximum displacement and decrease maximum stress in static pressure test(Zhang, 2014).
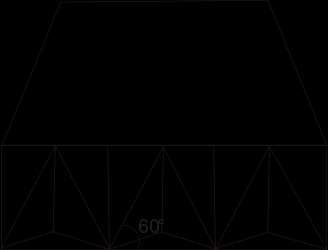
Flute angle
The optimal flute angle for maximum stress and maximum displacement is 60° for both static pressure and drop tests (Zhang, 2014).
Optimal geometry for paper cushion: The flute should have a 60° angle.
7
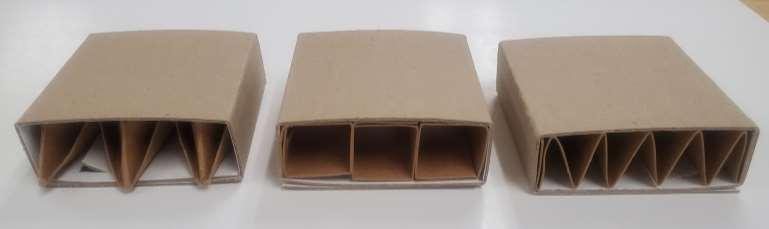
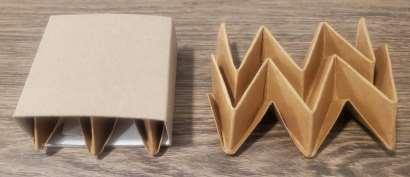
Design Result
8
Left to right Miura Ori-fold, Tube, Zig- zag
Design Result

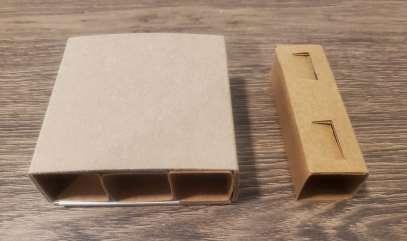
Design 1- Cube Pipe
9
Cube Pipe Structure
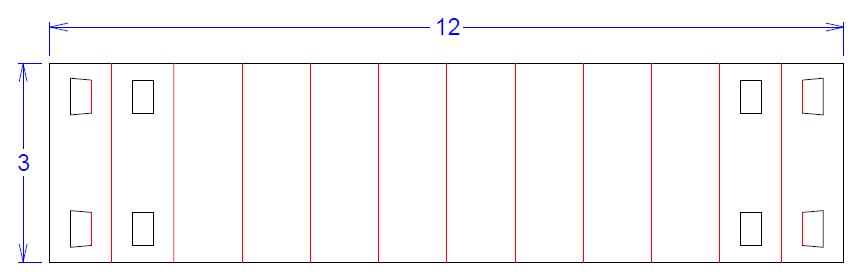
Cube Pipe Die-line
Design Result Design 1- Cube Pipe
Flute arc angle: 90-degree
16 supporting point

10
Design Result
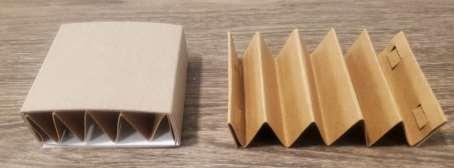
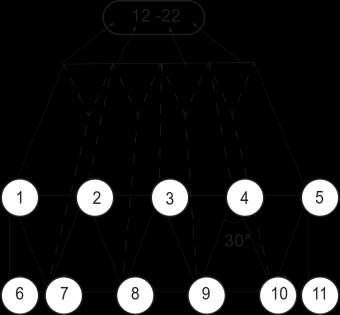
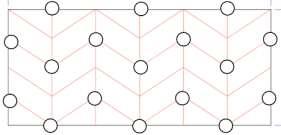
Design 2- Zig-Zag
Zig-Zag Die-line
11
Zig-Zag Structure
Design Result Design 2- Zig-Zag
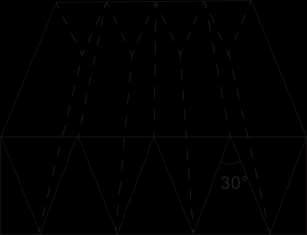
Flute arc angle: 30-degree
22 supporting point
12
Design Result
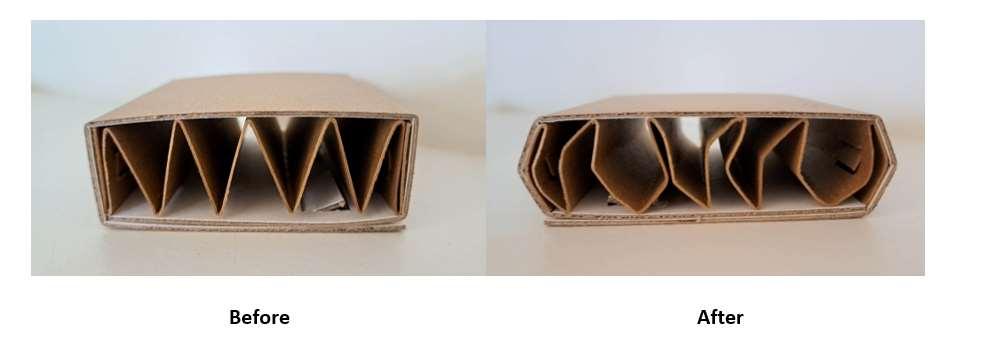
Design 3- Miura-Ori Fold
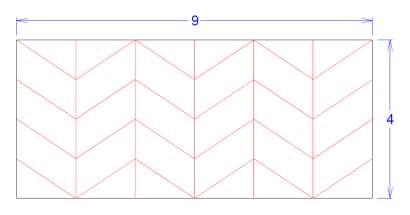
Miura-Ori Structure
Miura-Ori Die-line
13
Design Result
Design 3- Miura-Ori Fold
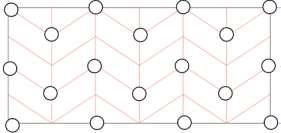
Flute arc angle: 60-degree
34 supporting point
Mountain fold
Valley fold
14
03
Testing 15
Testing method
• ASTM D3575
• Compression Cushion Test
Testing Set Up
• Testing device : Instron 5567
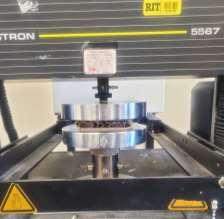
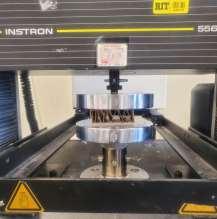
• Environmental condition: Temperature: 21.5 °C/ Humidity: 30.6%
16
Hypothesis
Cushion performance within three design
Miura-Ori Fold Zig-Zag Cube Pipe
17
> >
Testing Result
Specimen 1- Cube Pipe
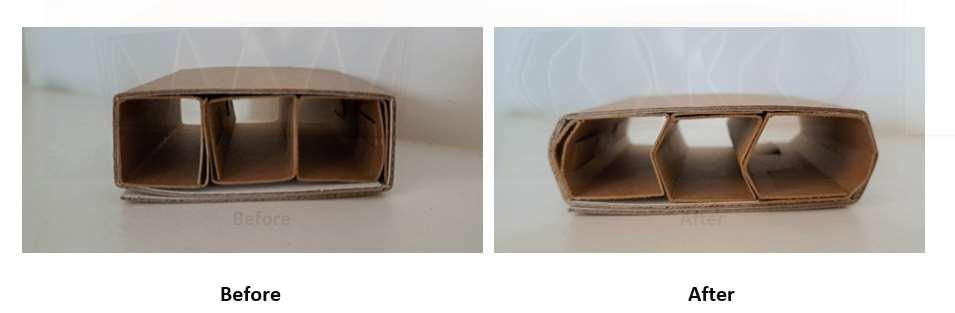
Table 4.1
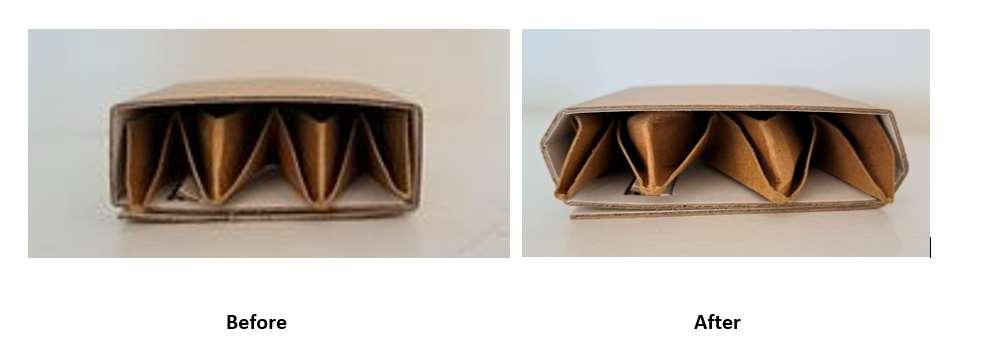
Muria-Ori Fold: Cushion Height Difference
18
Specimen 1 Specimen 2 Specimen3 Specimen4 Specimen5 Average Before 1” 1” 1” 1” 1” 1” After 0.875” 0.875” 0.85” 0.875” 0.938” 0.882”
Testing Result
Specimen 1- Cube Pipe
19
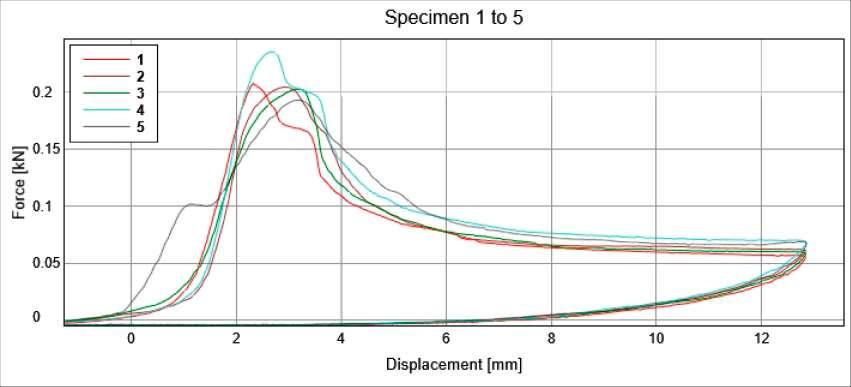
Compressive displacement at Maximum Force [mm] Compressive strain (Displacement) at Maximum Force [%] Compressive stress at Maximum Force [MPa] Maximum Force [kN] Energy at Maximum Force [J] 1 2.23 9.14 0.04 0.21 0.16 2 2.90 11.42 0.04 0.20 0.24 3 3.14 12.36 0.03 0.20 0.30 4 2.66 10.47 0.04 0.24 0.22 5 3.18 12.52 0.03 0.19 0.37 Avg 2.82 11.18 0.036 0.21 0.26
Table 4.2
Cube Pipe Compression Testing Result
Testing Result Specimen 1- Cube Pipe
20
Figure 4.2
Cube Pipe Compression Testing Result
Testing Result
Specimen 1- Cube Pipe
21
Displacement (mm) Energy Absorption (J) Specimen 1 Specimen 1 Specimen1 Specimen1 Specimen1 Average 0.500 0.000 0.003 0.003 0.001 0.013 0.004 1.000 0.009 0.009 0.014 0.006 0.050 0.017 1.500 0.035 0.025 0.039 0.023 0.100 0.044 2.000 0.098 0.074 0.091 0.078 0.162 0.100 2.500 0.189 0.160 0.173 0.178 0.241 0.188 2.820 0.290 0.259 0.270 0.295 0.331 0.289
Table 4.3
absorption during Compression testing
Cube Pipe: Energy
Testing Result
1- Cube Pipe
22
0.000 0.050 0.100 0.150 0.200 0.250 0.300 0.350 0.5 1 1.5 2 2.5 2.82 Anergy absorption (J) Dispasment (mm) Specimen 1 Specimen 2 Specimen 3 Specimen 4 Specimen 5 Average
Specimen
Figure 4.3 Cube Pipe: Energy absorption during Compression testing
Testing Result
Specimen 2- Zig-Zag
23
Specimen 1 Specimen 2 Specimen3 Specimen4 Specimen5 Average Before 1” 1” 1” 1” 1” 1” After 0.938” 0.938” 0.938” 0.875” 0.938” 0.925”
Table 4.4
Muria-Ori Fold: Cushion size difference
Testing Result
Specimen 2- Zig-Zag
24
Compressive displacement at Maximum Force [mm] Compressive strain (Displacement) at Maximum Force [%] Compressive stress at Maximum Force [MPa] Maximum Force [kN] Energy at Maximum Force [J] 1 3.22 12.68 0.04 0.24 0.33 2 2.84 11.18 0.04 0.24 0.25 3 3.08 12.13 0.04 0.24 0.32 4 3.36 13.23 0.04 0.22 0.30 5 3.54 13.93 0.04 0.23 0.36 Avg 3.21 12.63 0.04 0.23 0.31 Table
4.5 Zig-Zag Compression Testing Result
Testing Result Specimen 2- Zig-Zag
25
Figure 4.5
Zig-Zag Compression Testing Result
Testing Result
Specimen 2- Zig-Zag
Table 4.6
Zig-Zag: Energy absorption during Compression testing
26
Displacement (mm) Energy Absorption (J) Specimen 1 Specimen 1 Specimen1 Specimen1 Specimen1 Average 0.5 0.000 0.003 0.003 0.001 0.003 0.002 1 0.003 0.010 0.017 0.008 0.010 0.009 1.5 0.021 0.031 0.045 0.021 0.022 0.028 2 0.076 0.081 0.102 0.053 0.055 0.073 2.5 0.168 0.169 0.197 0.123 0.130 0.157 3 0.265 0.225 0.278 0.221 0.246 0.247 3.21 0.330 0.250 0.320 0.300 0.360 0.312
Testing Result Specimen 2- Zig-Zag
27
Figure 4.6
0.000 0.050 0.100 0.150 0.200 0.250 0.300 0.350 0.400 0.5 1 1.5 2 2.5 3 3.21 Anergy absorption (J) Displacement (mm) Specimen 1 Specimen 2 Specimen 3 Specimen 4 Specimen 5 Average
Zig- Zag: Energy absorption during Compression testing
Testing Result
Specimen 3- Miura-Ori Fold
28
Specimen1 Specimen2 Specimen3 Specimen4 Specimen5 Average Before 1” 1” 1” 1” 1” 1” After 0.875” 0.938” 0.938” 0.875” 0.938” 0.913”
Table 4.7
Muria-Ori Fold: Cushion size difference
Testing Result
Specimen 3- Miura-Ori Fold
29
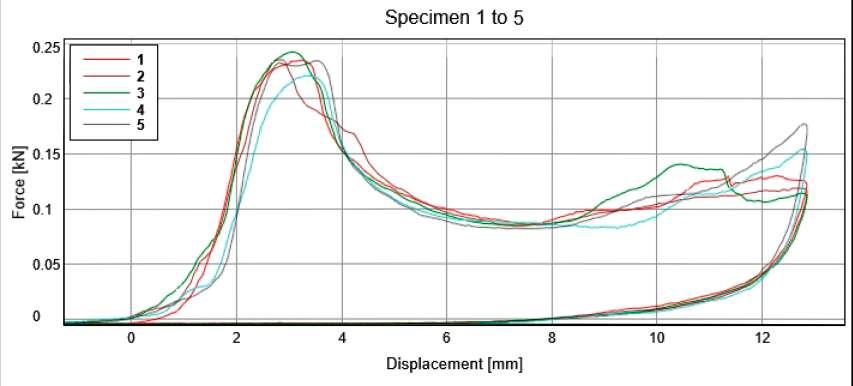
Compressive displacement at Maximum Force [mm] Compressive strain (Displacement) at Maximum Force [%] Compressive stress at Maximum Force [MPa] Maximum Force [kN] Energy at Maximum Force [J] 1 12.72 50.10 0.08 0.45 3.58 2 12.71 50.02 0.06 0.36 3.41 3 12.74 50.16 0.07 0.38 3.15 4 12.76 50.23 0.07 0.42 2.98 5 9.88 38.90 0.07 0.42 2.29 Avg 12.16 47.88 0.07 0.41 3.08 Table
4.8
Muria-Ori Compression Testing Result
Testing Result

Specimen 3- Miura-Ori Fold
30
Figure 4.8
Muria-Ori Compression Testing Result
Testing Result
Specimen 3- Miura-Ori Fold
Muria-Ori Fold: Energy absorption during Compression testing
31
Displacement (mm) Energy Absorption (J) Specimen 1 Specimen 1 Specimen1 Specimen1 Specimen1 Average 1 0.010 0.010 0.008 0.005 0.005 0.007 2 0.035 0.034 0.024 0.016 0.016 0.025 3 0.105 0.109 0.073 0.052 0.051 0.078 4 0.285 0.249 0.188 0.150 0.140 0.202 5 0.490 0.474 0.388 0.297 0.315 0.393 6 0.745 0.789 0.678 0.507 0.605 0.665 7 1.103 1.126 1.016 0.807 0.960 1.002 8 1.503 1.459 1.363 1.152 1.343 1.364 9 1.907 1.799 1.723 1.502 1.720 1.730 10 2.308 2.150 2.082 1.851 2.109 2.100 11 2.728 2.501 2.430 2.203 2.526 2.477 12.16 3.580 3.410 3.150 2.570 2.980 3.080
Table 4.9
Testing Result
Specimen 3- Miura-Ori Fold
32
Figure 4.9
0 0.5 1 1.5 2 2.5 3 3.5 4 1 2 3 4 5 6 7 8 9 10 11 12.16 Anergy absorption (J) Dispasment (mm) Specimen 1 Specimen 2 Specimen 3 Specimen 4 Specimen 5 Average
Muria-Ori Fold: Energy absorption during Compression testing
04
Analysis 33
34
Cube-Pipe Zig-Zag Muria-Ori Paper Used [sq. in.] 42 36 36 Supporting Points 16 22 34 RadiusArc [°] 90 30 60 Max. Force Displacement [mm] 2.82 3.21 12.16 Max. Force [MPa] 0.036 0.04 0.07 Max. Force [kN] 0.21 0.23 0.41 Energy at Max. Force [J] 0.36 0.31 3.08
Analysis
Table 5.1
Constructive Paper Cushion Comparison
35
Analysis
Figure 5.1
2.82 0.036 0.21 0.36 3.21 0.04 0.23 0.31 12.16 0.07 0.41 3.08 0 2 4 6 8 10 12 14 Max. Force Displacement [mm] Max. Force [MPa] Max. Force [kN] Energy at Max. Force [J] Cube-Pipe Zig-Zag
Constructive Paper Cushion Comparison
Muria-Ori
Conclusion
• The folding angle and number of supporting points are critical considerations when designing a constructive paper cushion.
• The Muria Ori fold offers superior cushioning and energy absorption, reducing product damage and returns while improving customer satisfaction. It's a sustainable and cost-effective option due to its exceptional performance with minimal material usage.
• Future research should enhance cushion curves' energy absorption and sustainability while minimizing limitations. Dynamic cushion tests and applying the cushion to real products can improve understanding of its constructive cushion property and enhance product protection and cost-effectiveness.
36
Q A &
Do you have any questions ?
37
THANK YOU

38