


Chautauqua County Housing Market Assessment and Development

In 2023, The Chautauqua County Partnership for Economic Growth (CCPEG) engaged MRB Group to assist in the development of a countywide Housing Market Assessment and Development Strategy. The intention of this study is to provide insights tothe existing housing stock and market conditions, as well as current and future anticipated gaps. These insights, combined with stakeholder input, provided the foundation for the development of actionable strategies to address housing gaps and needs in the County.
This study was developed to help housing providers, municipalities, Chautauqua County agencies, and not-for-profit organizations identify solutions and prepare for future development that will ultimately meet the needs of the community’s residents. It summarizes existing housing initiatives in the County, provides demographic and economic data, provides data-rich information on the current housing stock and real estate market, and offers strategies and recommendations for Chautauqua County and its partners to encourage and facilitate housing solutions that align with local priorities. Recommendations from this study will be used to guide housing policy decisions, encourage public-private collaborations, and be an instrumental tool for leveraging future funding opportunities.
In addition to receiving guidance from the Project Steering Committee, MRB Group gained insights from a variety of stakeholders. This engagement included:
• Stakeholder agency interviews
• Municipal leadership interviews
• Developer interviews
Project Steering Committee
Crystal Surdyk
Vincent DeJoy
Gina Paradis
Josiah Lamp
Colleen Meeder
Mark Geise
Staff
Project Manager: Rebecca Wurster
Nathan Aldrich
Director of Development, City of Jamestown
Director of Planning and Development, City of Dunkirk
Executive Director, Chautauqua County Land Bank
Director of Housing and Community Development, Chautauqua Opportunities
Mayor, Village of Sherman
Deputy County Executive for Economic Development, Chautauqua County
Planning Coordinator, Department of Planning & Development
Economic Development Coordinator, Department of Planning & Development

Chautauqua County sees a healthy and well-functioning housing market as critical to the vibrancy of communities, well-being of residents, and future economic development. The County envisions such a market to be one that is diverse enough to meet the needs of all residents, from young families to seniors and across income levels, and yet aligns with the character and vision of local communities throughout the County. Optimally, this means a combination of homeownership and rental units throughout the County, developed at various density and cost levels to best fit within existing communities. In conducting this study, key themes emerged regarding housing needs and dynamics in Chautauqua County: affordability, aging housing stock, and rental availability and quality.
The nature of housing affordability has shifted in recent years. In the past, general perception has been that “middle class” households could generally afford market rate housing, and that housing affordability was only a concern for “poor” households. However, as housing costs and market rates have risen, this is no longer the case.
Households that spend more than 30% of annual income on housing, including rent, mortgage, and basic utilities, are considered cost burdened. Therefore, a household can comfortably afford housing that costs below this 30% threshold. Housing affordability funding and assistance programs tend to utilize Area Median Income (AMI), as calculated by the US Department of Housing and Urban Development (HUD), to qualify households or development projects for assistance. Often, these programs are benchmarked to 80% or 60% of AMI. In Chautauqua County, AMI for a 4-person household in 2023 was $76,300, making 80% of AMI $61,040 and 60% of AMI $46,300. Community members individually earning less than 80% AMI on average include teachers, childcare workers, social workers, construction workers, and in many cases seniors (aged 65+) 1
• Roughly half of renters in Chautauqua County are cost burdened.
• Over 40% of Chautauqua County households earn less than the annual income needed to comfortably afford the average rental unit, including rent and utilities.
• Approximately 53% of Chautauqua County households earn less than the annual income needed to comfortably afford homeownership, including mortgage and utilities.
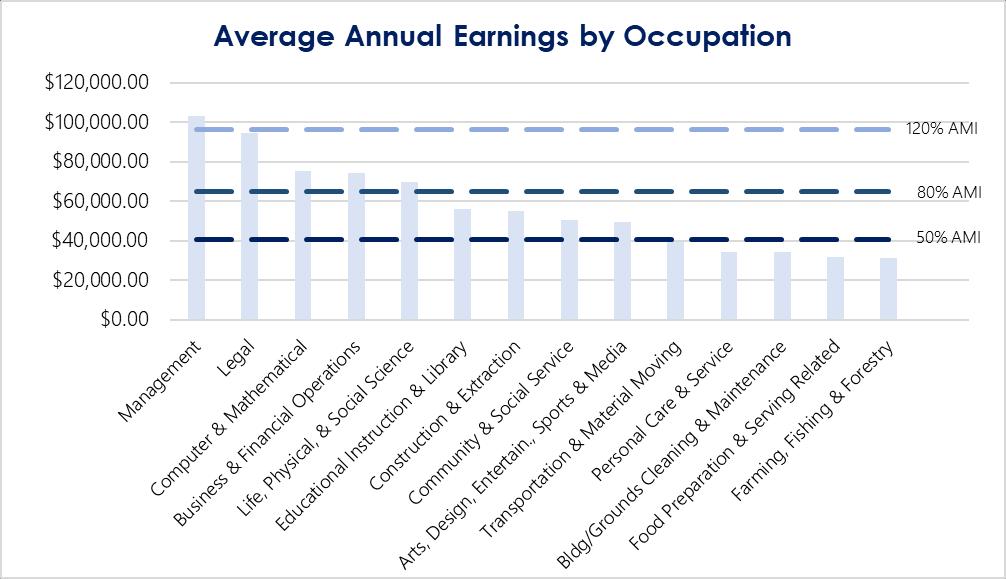
• 58% of occupations in Chautauqua County pay annual wages under 50% of AMI. The types of jobs earning under this threshold include transportation and material moving; personal care and service (e.g. barbers, home health aides, childcare workers, manicurists, etc.); building and grounds cleaning and maintenance; food preparation and serving related; and farming, fishing, and
1 62.8% of households with a householder over age 65 earned less than $60,000 in 2022. (Source: American Community Survey 5-year Estimates)
forestry Single-earner households in these occupations would not be able to comfortably afford the average rental unit, and are highly likely to be cost burdened. Two income households in these occupations are likely to fall into the 80%-120% of AMI category
• 27% of occupations in Chautauqua County pay annual wages between 60% and 80% of AMI. The types of jobs earning under this threshold include educational instruction and library occupations; construction and extraction occupations; community and social service occupations (e.g. counselors, social workers, probation officers, human service workers); and arts, design, entertainment, sports, and media occupations. Single-earner households in these occupations may be able to comfortably afford the average rental unit. However, these households only be able to afford homeownership at below average home values, which could be associated with low quality and high maintenance costs.
• Jobs that earn, on average, between 80% and 120% of AMI make up a small fraction of jobs (7%), and are concentrated in legal occupations; computer and mathematical occupations; business and financial operations occupations; and life, physical, and social science occupations. Households in this income range are less likely to be cost burdened as renters, but homeownership could still be difficult, especially at the lower end of this range.
As evidenced above, housing affordability is a challenge that impacts a broad range of households in Chautauqua County. Current homeowners are far less likely to be cost burdened, but renting or buying in the current market has become far more challenging and less affordable for many households across income levels.
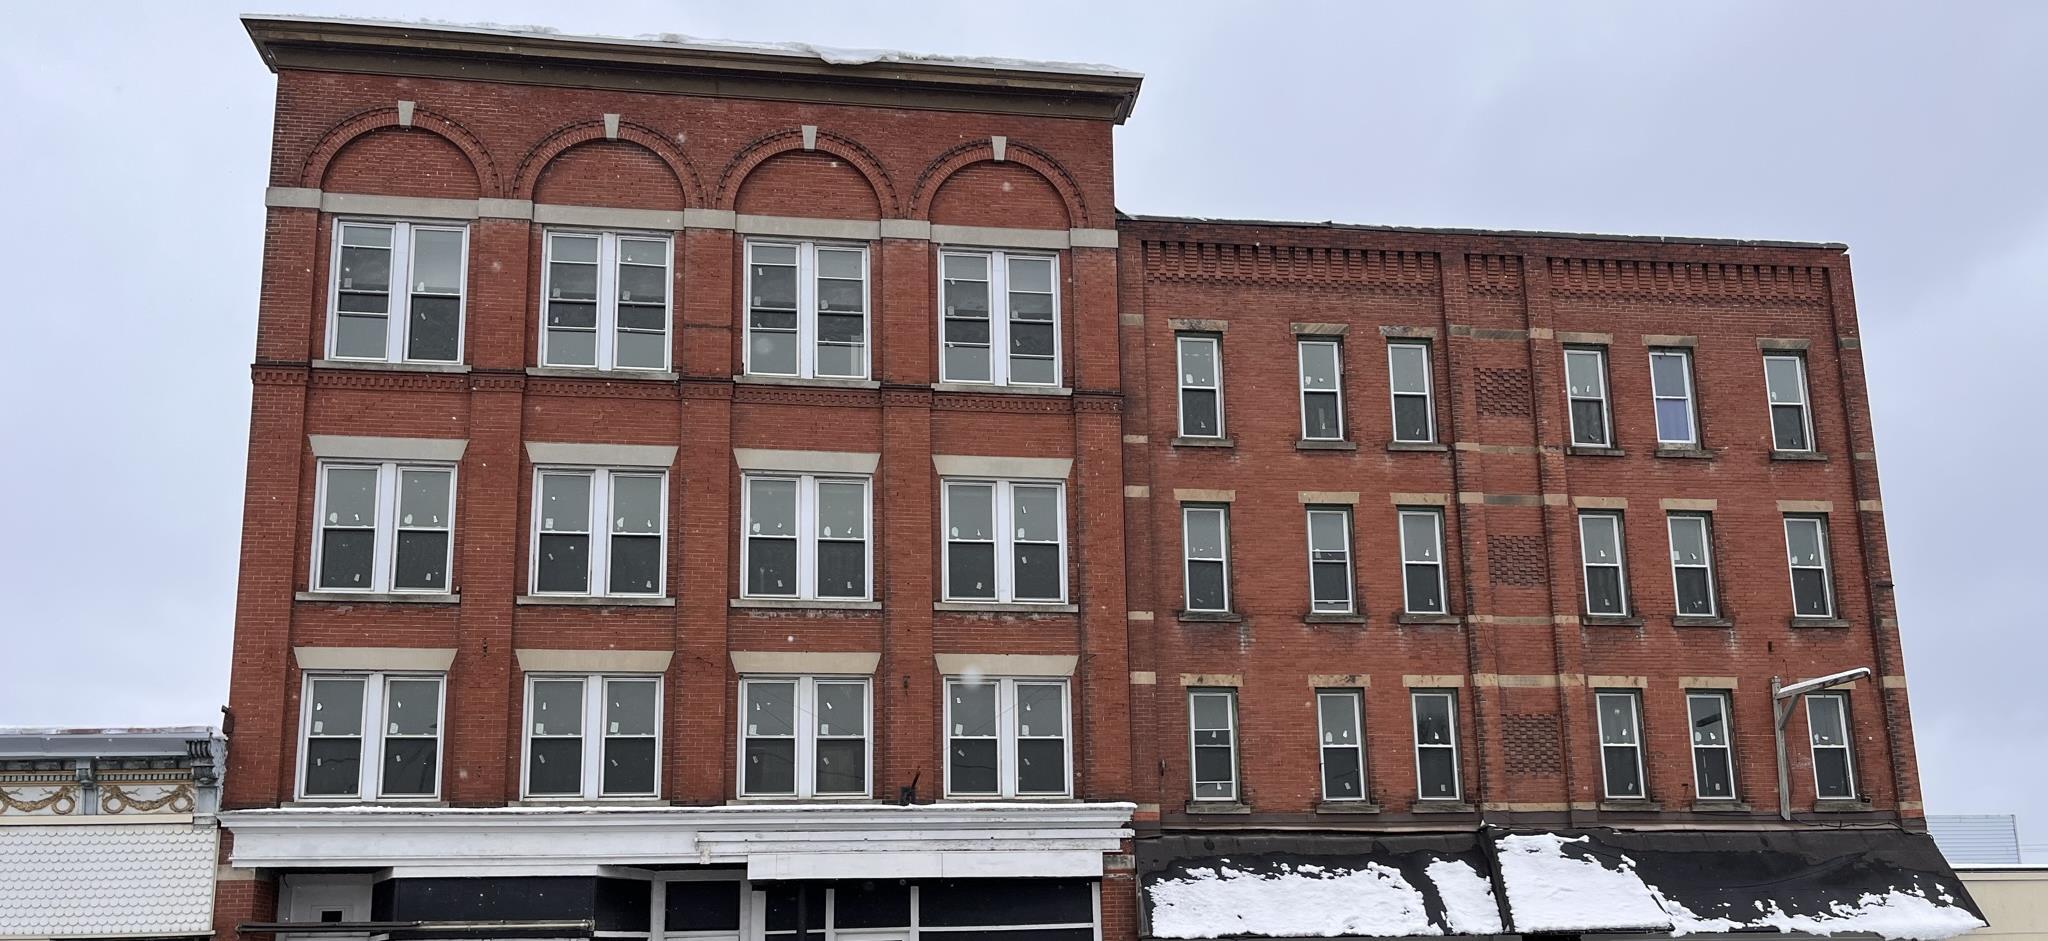
Over 38% of housing units in Chautauqua County were built prior to 1940, including 46.1% of units in Dunkirk and a staggering 54.8% in Jamestown, compared to 31.4% of housing units in New York State overall. Best practice assumes that 3% of units built prior to 1940 are functionally obsolete, thus requiring more maintenance and upgrading. These units are also unlikely to have complete modern amenities, such as energy efficiency measures and modern electrical service. Homes built before 1940 also have a 70-80% chance of containing lead paint (compared to a 40% chance for units built after 1970). In particular, Jamestown is designated as a high-risk area for lead exposure by New York State, and Chautauqua County has the 6th most incidents of lead poisoning in children in the State.
Addressing safety, code compliance, and maintenance of older homes and rental units will benefit residents, the real estate market, home values, and the economy in the long run. These homes also contribute to community character, so rehabilitating and renovating them (to the extent possible) provides an opportunity to stabilize neighborhoods without jeopardizing character.
Local municipal leaders and community agencies identified increasing cost and decreasing quality of rental housing units as a challenge for County residents. In some areas, it is suspected that outside investors are converting rental units into short-term rentals and seasonal housing, exacerbating rental supply challenges. In other areas, it is believed that many local landlords are unable or unwilling to invest in
County
rental properties due to rising costs (including interest rates) and diminishing returns. Agencies also report that there is a need for stronger verification of rental unit characteristics (such as accessibility) and landlord reliability, particularly when it comes to housing vulnerable and special populations. Issues of quality and verification could be addressed by ongoing efforts within the County related to inspections and codes. However, stronger communication and partnership with landlords, as well as more structured tenant supports, could go a long way as well.
The first chapter of this study provides implementation strategies and recommendations for CCPEG, Chautauqua County, its municipalities, and other partners to address current and future housing needs. These strategies are based on a thorough analysis, outlined in the remaining chapters, of the existing housing stock and the needs of current and future residents. An understanding of market conditions and communities’ priorities provides grounding for the strategies, which are organized into four overarching goal areas: 1) improving housing quality and diversity, 2) addressing the housing needs of special populations, 3) affordability for the workforce, and 4) enhancing land management tools and resources to improve housing quality and access. Not every strategy will be the right solution for every municipality in Chautauqua County. Community nuances will need to be considered as local leaders facilitate the right strategies in their communities.
Despite challenges in the housing market, the County’s ongoing economic development efforts pave the way for a better quality of life by supporting economic growth and community vibrancy. Organizations like the Chautauqua County Industrial Development Agency and Chautauqua County Partnership for Economic Growth support and promote projects that bring economic opportunities to the County via business expansion, financial assistance, infrastructure development, as well as enhanced quality of life via more vibrant public spaces and new entertainment and recreational activities. As the County’s network of economic and community partners succeeds in attracting and retaining people in the community, the need for quality, safe, affordable, and accessible homes will grow. The County’s economic health hinges on attracting individuals for the workforce, providing employment for those individuals, ensuring they have quality housing, and promoting community development that supports their overall well-being.
County Housing Market Analysis and Development
CCPEG, as a driver of this study, will take a lead or partnering role in many of the actions outlined in this plan, including:
Lead Engage with trade organizations, such as regional home builders associations, to build new relationships with developers and familiarize them with Chautauqua County.
Lead Engage with employers to identify private-public partnership opportunities for housing development and/or employerassisted housing programs (e.g. shared pre-development costs, collaborative grant applications, matching down payment/rehab grants, etc.).
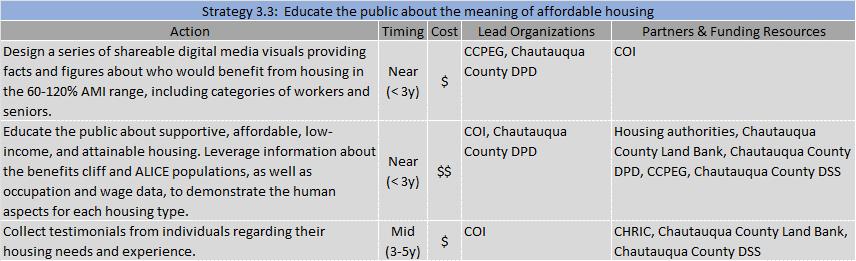
Lead Design a series of shareable digital media visuals providing facts and figures about who would benefit from housing in the 60120% AMI range, including categories of workers and seniors.
Lead Identify vacant and underutilized sites and buildings in areas within and near downtowns, villages, hamlets, and main streets. Assess viability of these sites for housing development, as well as pre-development work that would be needed.
Facilitate Work with communities to identify areas of the County that might qualify for and benefit from the establishment of a historic district and/or concentrated efforts to map historic register eligible buildings.
Facilitate Identify available sites over 10-acres in proximity to downtowns and hamlets, then coordinate with property owners on preplanning and marketing of those sites for potential micro-development. Ensure appropriate zoning and infrastructure capacity as part of pre-planning.
Facilitate Market sites in hamlets and downtown-adjacent areas for multi-family and townhome development.
Facilitate Identify sites between 1 and 5 acres for new multi-family development and begin predevelopment work to ensure streamlined environmental review, permitting processes, and access to infrastructure. Consider zoning updates, infrastructure planning and engineering, and conducting archeological and environmental studies.
Facilitate Identify potential gap funding or cost reduction resources, particularly for any development that involves rental or owneroccupied units for households making less than 120% of the AMI.
Facilitate Continue to explore and pursue recommendations of the Code Enforcement in Chautauqua County Options for Improvement report, particularly those related to court enforcement and the code enforcement workforce pipeline.
Partner Explore the use and promotion of incentives like RPTL 444a and residential state and federal historic tax credits as a means of incentivizing rehabilitation investments by owners of historic homes.
Partner Review Chautauqua County IDA's Unified Tax Exemption Policy and update as needed to support multi-family and mixed-use development.
Partner Assist municipalities seeking development to submit for certification as Pro-Housing Communities to better leverage key discretionary NYS funding programs (e.g. Downtown Revitalization Initiative, NY Main Street, Market NY, etc.).
Partner Identify vacant and underutilized sites and buildings in areas within and near downtowns, villages, hamlets, and main streets. Assess viability of these sites for housing development, as well as pre-development work that would be needed.
Partner Facilitate the development of a HUD compliant modular home development that is family-oriented and in a safe location near employment opportunities. Incorporate accessibility considerations so that the development could serve people with disabilities, seniors, and low-income families.
Partner Support community agencies in identifying and assessing underutilized or vacant properties that might be appropriate for conversion to emergency housing (e.g. un- or under-utilized multi-family, hotels or motels, nursing homes, medical facilities, etc.), particularly for whole families and/or women with children. Further, partner in accessing funding and establishment of such shelters.
Partner Work with County and local municipal staff to identify areas ideal for this type of development, as well as vacant properties within those areas.
Partner Educate the public about supportive, affordable, low-income, and attainable housing. Leverage information about the benefits cliff and ALICE populations, as well as occupation and wage data, to demonstrate the human aspects for each housing type.
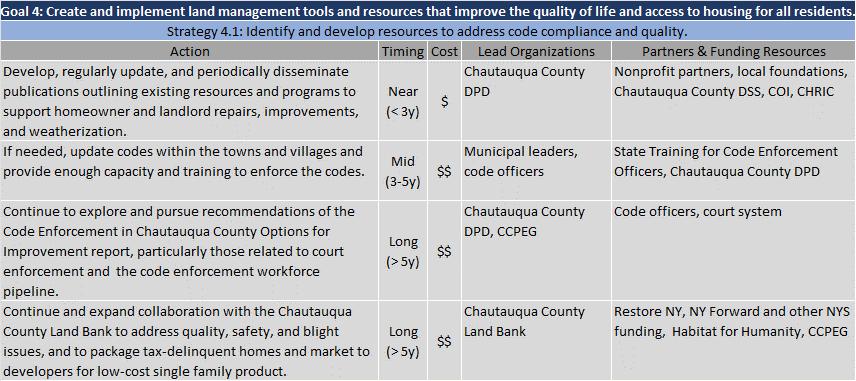
Partner Continue and expand collaboration with the Chautauqua County Land Bank to address quality, safety, and blight issues, and to package tax-delinquent homes and market to developers for low-cost single family product.
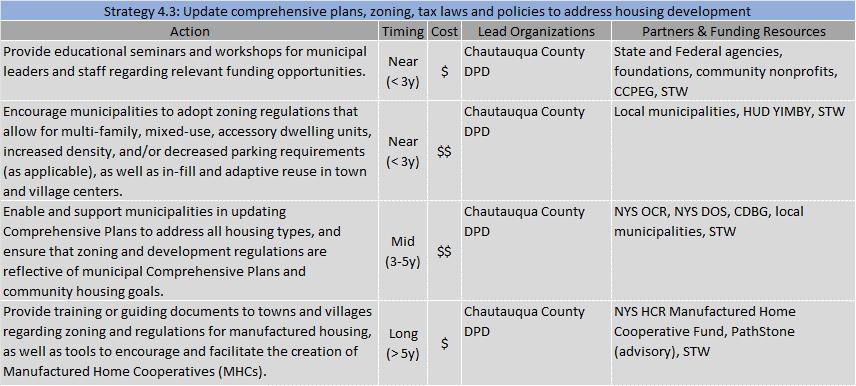
Partner Provide educational seminars and workshops for municipal leaders and staff regarding relevant funding opportunities.
1. Align community partners and incentives to streamline the development process
2. Identify, prepare, and market top sites for development
3. Proactive relationship building with developers
4. Enhance engagement with individual municipalities around housing needs and development
a. Improve understanding of, and assist in application for, Pro Housing Communities certification
b. Assist with efforts that will facilitate housing development, such as zoning policy/process updates, infrastructure improvements, and/or site identification
5. Public outreach to improve understanding of what housing affordability means and who it impacts in the community
6. Create better engagement with and organiztion among private landlords
7. Ensure a smooth roll out of the rental registry process so that it can be used as a model for other parts of the county, a tool for communicating with landlords, and an opportunity for partner organizations and entites to document and assist with a range of conditions
8. Continue with phase two of the county-wide code enforcement exploration
9. Respond to the increasing need and decreasing availability of supportive housing for seniors
The actions in the plan that best represent the first steps in these priorities are as follows:
Identify vacant and underutilized sites and buildings in areas within and near downtowns, villages, hamlets, and main streets. Assess viability of these sites for housing development, as well as pre-development work that would be needed.
County Land Bank, CCPEG
County DPD, local municipalities, CCIDA
2
2
Identify available sites over 10 acres in proximity to downtowns and hamlets, then coordinate with property owners on pre-planning and marketing of those sites for potential micro-development. Ensure appropriate zoning and infrastructure capacity as part of pre-planning.
Identify sites between 1 and 5 acres for new multi-family development and begin predevelopment work to ensure streamlined environmental review, permitting processes, and access to infrastructure. Consider zoning updates, infrastructure planning and engineering, and conducting archeological and environmental studies.
County Land
local municipalities 2, 3 Market sites in hamlets and downtown-adjacent areas for multi-family and townhome development.
and other trade associations 3 Engage with trade organizations, such as regional home builders associations, to build new relationships with developers and familiarize them with Chautauqua County.
Assist municipalities seeking development to submit for certification as Pro-Housing Communities to better leverage key discretionary NYS funding programs (e.g. Downtown Revitalization Initiative, NY Main Street, Market NY, etc.).
Enable and support municipalities in updating Comprehensive Plans to address all housing types, and ensure that zoning and development regulations are reflective of municipal Comprehensive Plans and community housing goals.
5 Design a series of shareable digital media visuals providing facts and figures about who would benefit from housing in the 60-120% AMI range, including categories of workers and seniors.
municipalities,
5
6
Educate the public about supportive, affordable, low-income, and attainable housing. Leverage information about the benefits cliff and ALICE populations, as well as occupation and wage data, to demonstrate the human aspects for each housing type. COI, Chautauqua County DPD Housing authorities, Chautauqua County Land Bank, Chautauqua County DPD, CCPEG, Chautauqua County DSS
Engage with landlords to identify opportunities for collaboration to improve unit quality (e.g. collective purchasing, concurrent projects) and challenges that could be eased by greater technical assistance or communication.
Facilitate discussions with landlords to identify apartments for homeless families with children.
6
6
Develop, regularly update, and periodically disseminate publications outlining existing resources and programs to support homeowner and landlord repairs, improvements, and weatherization.
7 Collaborate to ensure a smooth roll out of the rental registry and lead inspection process, and leverage that process to improve understanding of unit conditions more generally.
Chautauqua County Health Department, local codes departments, Resource Center, housing authorities, Chautauqua County DPD
Chautauqua County MHSS, Chautauqua County Homeless Coalition Landlords, Chautauqua County Land Bank
Chautauqua County DPD Nonprofit partners, local foundations, Chautauqua County DSS, COI, CHRIC
Chautauqua County Health Department COI, Chautauqua County DSS, CHRIC, Resource Center
7 Utilize rental inspection processes to confirm that units claiming accessibility are truly accessible. Chautauqua County Health Department Resource Center
8
Continue to explore and pursue recommendations of the Code Enforcement in Chautauqua County Options for Improvement report, particularly those related to court enforcement and the code enforcement workforce pipeline.
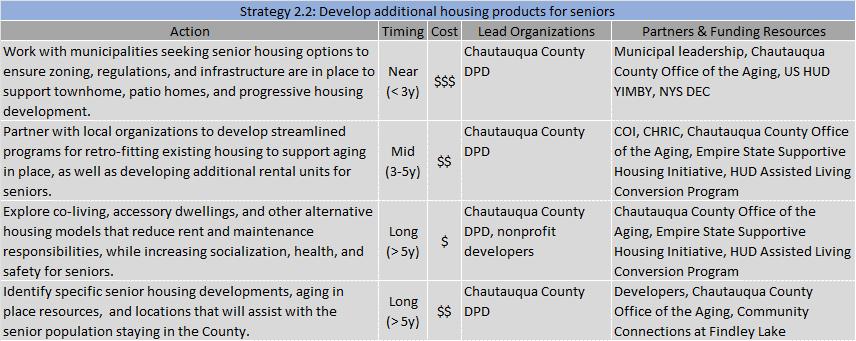
9 Partner with local organizations to develop streamlined programs for retro-fitting existing housing to support aging in place, as well as developing additional rental units for seniors.
9 Explore co-living, accessory dwellings, and other alternative housing models that reduce rent and maintenance responsibilities, while increasing socialization, health, and safety for seniors.
Chautauqua County DPD, CCPEG Code officers, court system
Chautauqua County DPD COI, CHRIC, Chautauqua County Office of the Aging
Chautauqua County DPD, nonprofit developers Chautauqua County Office of the Aging
Prepared by:
Prepared for: May 2023
The Action Plan Matrix that follows lays out steps that CCPEG, Chautauqua County, local municipalities, and key community partners can take to improve and expand the housing stock. Lead organizations for each action are identified, but not committed, along with potential partners and resources. This matrix is designed to serve as a living document that can be updated and adapted by CCPEG as it makes additional strides in housing development. The matrix consists of four Goal Areas that were identified through data analysis, stakeholder input, and a review of existing conditions and resources. These goals are worded to reflect the desired outcome, even if ambitious:
1. Chautauqua County residents have access to a diversity of quality housing options that contribute to community vibrancy.
2. Appropriate housing and supports are available to all residents, including seniors, individuals with disabilities, and those who are homeless or housing vulnerable.
3. Residents of Chautauqua County are not spending more than 30% of their household income on housing costs.
4. Land management tools and resources are in place to create and improve the quality of and access to housing for all residents
This plan reflects the following trends and challenges that arose during the planning process:
• Housing rehabilitation, upgrading, and modernization.
• Increased quantity and quality of rental units.
• Focused attention on affordability for workforce households.
• Ensuring quality and availability of units for special populations, such as seniors and individuals with disabilities.
• Infill development and adaptive reuse.
Various goals identify municipal leaders as the lead organization or a participating partner. However, it is worth noting that not every action is going to be appropriate for every municipality given the distinct needs in different areas of the County. Each municipality should consider their own conditions, community needs, and desired housing outcomes to identify the actions that make the most sense within the context of their community. Furthermore, the CCPEG and Chautauqua County DPD are prepared to assist municipalities with various planning, zoning, and resource activities within this plan.
Acronyms & Definitions
While reviewing the Action Plan Matrix, the following acronyms and definitions may be useful.
Acronyms
• ARPA: American Rescue Plan Act
• CCPEG: Chautauqua County Partnership for Economic Growth
• CDBG: Community Development Block Grants – typically administered through NY Homes & Community Renewal
• Chautauqua County DPD: Chautauqua County Department of Planning & Development
• CHRIC: Chautauqua Home Rehabilitation & Improvement Corporation
• COI: Chautauqua Opportunities, Inc.
• DEC: Department of Environmental Conservation
• DOS: Department of State
• DSS: Department of Social Services
• HCR: Homes and Community Renewal (a division of the Office of Community Renewal)
• HUD: Housing and Urban Development
• IDA: Industrial Development Agency
• Jamestown BPU: Jamestown Board of Public Utilities
• LMI: Low- and Moderate-Income
• OCR: Office of Community Renewal
• OMH: Office of Mental Health
• OTDA: Office of Temporary and Disability Assistance
• RPTL: Real Property Tax Law
• SONYMA: State of New York Mortgage Agency
• STW: Southern Tier West Regional Planning and Development Board
• UCAN: United Christian Advocacy Network
• USDA: United State Department of Agriculture
• WNY EPP: Western New York Eviction Prevention Program
• YIMBY: new HUD funding program - “Yes In My Back Yard” – to assist municipalities with zoning updates that allow for more diverse housing development
Definitions
Affordable Housing: Housing affordability is a function of both cost and income. Officially, government funding programs related to affordable housing rely on very specific definitions and thresholds, which are often calibrated to local or regional conditions. Unofficially, ”affordable” is also sometimes used more generally to refer to housing options that are attainable for certain groups of people. Households are considered “cost burdened” if foundational shelter costs (rent, mortgage, utilities) exceed 30% of the household income.
ALICE populations: Asset Limited Income Constrained Employed - individuals and households that are working, but not making a living wage or enough to cover normal living expenses. Think "living paycheck to paycheck."
Non-permanent housing unit types:
• Short-Term Rentals: housing units that are rented out for less than 30-day increments, such as AirBNB/VRBO vacation rentals. This would not include traditional hotel, motel, inn, or B&B rooms that are categorized under zoning as such.
• Temporary Housing: emergency housing provided to low-income and homeless individuals and families, generally for 30 days or less.
Manufactured Home: a factory-built housing unit that is transported to and placed on a site, as opposed to a stick-built home that is built on site. These units are built in compliance with the 1976 HUD Manufactured Home Construction and Safety Standards (the “HUD code”), which sets federal standards related to design, materials, fire safety, mechanicals, etc. in the construction of manufactured homes. Depending on the foundation and structural details, these units could be relocated if necessary.
Mobile Home: a factory-built housing unit that is transported and placed on a site, built prior to 1976. These units were not required to comply with the HUD code. Many of these units were built on wheels and could be fairly easily relocated.
Modular Home: Modular homes are also prefabricated off site but are built to comply with the local building codes that apply to on-site, stick-built homes rather than the HUD code. Generally, they are placed on permanent foundations.
Goal 1: Ensure Chautauqua County residents have access to a diversity of quality housing options that contribute to community vibrancy.
Strategy 1.1: Address challenges related to the aging housing stock (lead, deterioration, efficiency, etc.)
Action
Explore the use and promotion of incentives like RPTL 444a and residential state and federal historic tax credits as a means of incentivizing rehabilitation investments by owners of historic homes.
Facilitate financing and technical assistance to support renovations, weatherization, replacement and upgrades to mobile and manufactured housing stock. Identify communities where the scope of this need is the greatest.
Promote and expand funding programs for energy efficiency and weatherization improvements.
Identify and pursue federal and state funding for housing rehabilitation, including homeowner rehab programs for LMI households.
Add community capacity to manage and expand lead response, mitigation, and remediation programming.
Work with communities to identify areas of the County that might qualify for and benefit from the establishment of a historic district and/or concentrated efforts to map historic register eligible buildings.
Timing Cost Lead Organizations Partners & Funding Resources
Near (< 3y) $
Near (< 3y) $
Near (< 3y)
$
Mid (3-5y) $
Mid (3-5y) $$
Long (> 5y) $
Chautauqua County Housing Market Analysis and Development Strategy
Chautauqua County DPD
Local municipalities, COI, CHRIC
Chautauqua County Real Property Services, Local municipalities, CCIDA, CCPEG
Chautauqua County DPD, COI, NYSERDA and local weatherization programs, NYS manufactured program, US HUD PRICE Act, PathStone (advisory)
COI, CHRIC NYSERDA, PUSH Green, Jamestown BPU
Chautauqua County DPD, Local municipalities
Chautauqua County Health Department
Chautauqua County DPD, CCPEG
COI (USDA 504), CHRIC, NYS HCR programs (CDBG, NYS HOME funds, NYS Rural Area Revitalization Program funds)
COI, Local municipalities
Local municipalities
Strategy 1.2: Develop a diversity of new housing (infill, adaptive reuse, etc.)
Review Chautauqua County IDA's Unified Tax Exemption Policy and update as needed to support multi-family and mixed-use development.
Engage with trade organizations, such as regional home builders associations, to build new relationships with developers and familiarize them with Chautauqua County.
Assist municipalities seeking development to submit for certification as Pro-Housing Communities to better leverage key discretionary NYS funding programs (e.g. Downtown Revitalization Initiative, NY Main Street, Market NY, etc.).
Promote the adoption and use of RPTL 485a to incentivize mixed-use development in downtowns and town centers that have concentrations of buildings with redevelopment challenges.
Identify vacant and underutilized sites and buildings in areas within and near downtowns, villages, hamlets, and main streets. Assess viability of these sites for housing development, as well as pre-development work that would be needed.
Identify available sites over 10 acres in proximity to downtowns and hamlets, then coordinate with property owners on pre-planning and marketing of those sites for potential micro-development. Ensure appropriate zoning and infrastructure capacity as part of pre-planning.
Near (< 3y) $
Near (< 3y) $
County of Chautauqua IDA (CCIDA)
CCPEG
CCPEG, CCIDA Builders Exchange of the Southern Tier (BEST)
Near (< 3y) $
Mid (3-5y) $
Chautauqua County DPD NYS HCR, Chautauqua County Real Property Services, local municipalities, CCPEG
Chautauqua County DPD, CCIDA
Local municipalities
Mid (3-5y) $$
Chautauqua County Land Bank, CCPEG
Chautauqua County DPD, local municipalities, CCIDA
CCPEG, CCIDA Chautauqua County DPD, Chautauqua County Land Bank
Long (> 5y) $$
Chautauqua County Housing Market Analysis and Development Strategy
Strategy 1.3: Expand rental housing and tenant supports
Market sites in hamlets and downtown-adjacent areas for multi-family and townhome development.
Engage with landlords to identify opportunities for collaboration to improve unit quality (e.g. collective purchasing, concurrent projects) and challenges that could be eased by greater technical assistance or communication.
Work with regional partners to provide better access to legal assistance and advocacy for tenants, particularly vulnerable populations.
Identify sites between 1 and 5 acres for new multi-family development and begin predevelopment work to ensure streamlined environmental review, permitting processes, and access to infrastructure. Consider zoning updates, infrastructure planning and engineering, and conducting archeological and environmental studies.
Collaborate to ensure a smooth roll out of the rental registry and lead inspection process, and leverage that process to improve understanding of unit conditions more generally.
Near (< 3y) $
Near (< 3y) $
Mid (3-5y) $
Chautauqua County DPD, Builders Exchange of the Southern Tier (BEST) and other trade associations
Chautauqua County Health Department, local codes departments, Resource Center, housing authorities, Chautauqua County DPD
Resource Center, Legal Assistance of Western NY, WNY EPP, Center for Elder Law & Justice
Chautauqua County DPD, Chautauqua County Land Bank, local municipalities
Mid (3-5y) $$
Long (> 5y) $$
Chautauqua County Health Department
COI, Chautauqua County DSS, CHRIC, Resource Center
Chautauqua County Housing Market Analysis and Development Strategy
Goal 2: Facilitate the availability of appropriate housing and supports to all residents, including seniors, individuals with disabilities, and those who are homeless or housing vulnerable. Strategy 2.1: General
Partner with Community Connections at Findley Lake to expand or replicate their existing senior support programming (e.g. transportation, legal assistance, R.U.O.K, etc.) to additional geographic areas and populations.
Create an MLS-style database for listing available apartments to assist residents in finding safe, quality apartments and avoid scams that can occur with other online listing platforms. Vet landlords prior to allowing them to list units to ensure only those who have a good track record with vulnerable populations are included.
Facilitate the development of a HUD compliant modular home development that is family-oriented and in a safe location near employment opportunities. Incorporate accessibility considerations so that the development could serve people with disabilities, seniors, and low-income families.
Mid (3-5y) $$
Community Connections at Findley Lake COI, Chautauqua County Health Department, Chautauqua County DSS, Office of the Aging
Mid (3-5y) $$
Chautauqua County MHSS, Chautauqua County Office of Aging COI, Chautauqua County Health Department
Long (> 5y) $$
nonprofit developers CCPEG, Chautauqua County DPD
Chautauqua County Housing Market Analysis and Development Strategy
Utilize rental registry inspection processes to confirm that units claiming accessibility are truly accessible. Mid (3-5y) $ Chautauqua County Health Department Resource Center
Adapt successful senior housing models to serve people with disabilities throughout the County, particularly in Dunkirk. Long (>5y) $$$ nonprofit and private developers Resource Center, NYS OMH Empire State Supportive Housing Initiative (ESSHI), NYS HCR
Chautauqua County Housing Market Analysis and Development Strategy
Strategy 2.4: Expand programming and opportunity for the housing insecure and homeless, particularly families
Facilitate discussions with landlords to identify apartments for homeless families with children. Near (< 3y) $
Continue to communicate clear definitions around affordable, subsidized, and supportive housing. Near (< 3y) $
Support community agencies in identifying and assessing underutilized or vacant properties that might be appropriate for conversion to emergency housing (e.g. un- or underutilized multi-family, hotels or motels, nursing homes, medical facilities, etc.), particularly for whole families and/or women with children. Further, partner in accessing funding and establishment of such shelters.
Mid (3-5y) $$$
Chautauqua County MHSS, Chautauqua County Homeless Coalition Landlords, Chautauqua County Land Bank
Chautauqua County MHSS, Chautauqua County Homeless Coalition Chautauqua County DPD
COI, UCAN, Salvation Army, Chautauqua County Land Bank, Local Churches, Chautauqua County Homeless Coalition
Chautauqua County MHSS, Chautauqua County DPD, CCPEG, NYS OMH Empire State Supportive Housing Initiative (ESSHI), NYS OTDA Homeless Housing and Assistance Program (HHAP), NYS HCR ARPA HOME or CDBG, Section 8 Housing
Chautauqua County Housing Market Analysis and Development Strategy
3: Reduce the number of Chautauqua County residents spending more than 30% of their household income on housing costs. Strategy 3.1: Workforce housing (60-120% AMI)
Work with County and local municipal staff to identify areas ideal for this type of development, as well as vacant properties within those areas.
Engage with employers to identify private-public partnership opportunities for housing development and/or employer-assisted housing programs (e.g. shared predevelopment costs, collaborative grant applications, matching down payment/rehab grants, etc.).
Identify potential gap funding or cost reduction resources, particularly for any development that involves rental or owner-occupied units for households making less than 120% of the AMI.
Near (< 3y)
Mid (3-5y)
Chautauqua County DPD, Chautauqua County Land Bank Local municipalities, CCPEG
CCPEG, CCIDA Employers, Local municipalities
Long (> 5y)
Chautauqua County Land Bank, CCPEG
Chautauqua County DPD, NYS HCR, US HUD, developers
Chautauqua County Housing Market Analysis and Development Strategy Page 22
Partner with lenders, local real estate professionals, and human services agencies to provide, package, and/or expand education, credit counseling, technical assistance, and promotion of financing resources available to homebuyers.
Assess feasibility of partnering with a nonprofit developer to construct a manufactured home community with the intention of converting to a resident-owned cooperative once all of the units are sold.
Create a Community Land Trust to implement an "affordable homeownership" program that makes a home permanently affordable by indexing and capping the sale price to LMI affordability standards.
Near (< 3y)
COI, CHRIC NYS HCR SONYMA programs, United Way, PathStone, housing authorities, Consumer Credit Counseling Service of Buffalo, lenders
Long (> 5y) $$
Nonprofit developer Chautauqua County DPD, PathStone (advisory)
Long (> 5y) $$$
Chautauqua County Land Bank NYS OCR, NY Forward, Restore NY, Chautauqua County DPD
The strategies outlined in the Action Matrix hinge upon the specific characteristics and needs of the County and local communities. While current demographic, housing inventory, and housing market characteristics, as well as existing plans and initiatives, will be explored more thoroughly in later chapters, it is critical to understand current and projected gaps in the housing landscape.
The table below provides an overview of households that are cost burdened. A household is considered cost burdened if its housing expenditures are more than 30% of the household income. This is further broken down by renter- and owner-occupied households. Chautauqua County has a lower proportion of cost burdened households than the State (26.6% and 36.9% respectively), but a higher proportion than the Western NY region (18.5%). There are particularly high levels of cost-burdened households in Dunkirk (31.2%) and Jamestown (35.6%). The cost burden is primarily concentrated among renters, with nearly 50% of renters County-wide and over 50% in the cities being cost burdened. In contrast, less than 17% of owner-occupied households in the County are cost-burdened.
Source: American Community Survey 5-year Estimates, MRB Group
In 2021, average gross rent was $755 in Chautauqua County and over 60% of units throughout the County had rents of less than $800. CoStar data outlined in the attached Market Analysis indicate that market rents have likely increased since then to a figure closer to $850900. The average monthly expenditure on utilities for areas with a population the size of Chautauqua is about $330.2 A monthly housing expenditure of $1,2303 is only affordable (below 30% of household income) for households making at least $49,200. As shown in the Demographic Analysis, over 46% of Chautauqua County households make less than $50,000 and the median household income is only $55,109.
Meanwhile, the average home value in Chautauqua County is $150,047, although 63.5% of homes in the region are valued at amounts lower than this average. The estimated average monthly mortgage in Chautauqua County is $1,194. A monthly housing expenditure of $1,524 is only affordable for households earning $60,960 annually. Roughly 53% of Chautauqua County residents earn less than this threshold, and the median household income is $5,000 less. The majority of occupations (58%) in Chautauqua County make under 50% of the Area Median Income (AMI) of $76,300, earning from about $31,440 to $39,200.4 These jobs are concentrated in the occupations of: transportation and material moving; personal care and service; building and grounds cleaning and maintenance; food preparation and serving related; and farming, fishing, and forestry. Jobs that earn between 60% and 80% of the AMI make up 27% of jobs in the County, which fall within educational instruction and library occupations, construction and extraction occupations, community and social service occupations, and arts, design, entertainment, sports, and media occupations. Jobs that earn, on average, between 80% and 120% of the AMI make up a small fraction of jobs (7%), and are concentrated in legal occupations, computer and mathematical occupations, business and financial operations occupations, and life, physical, and social science occupations. The chart on the next page shows how the average annual earnings for different occupations compare to AMI.
2 US Bureau of Labor Statistics, Consumer Expenditure Surveys 2021, Table 2400. Population size of area of residence.
3 Monthly housing expenditure was calculated by adding average monthly spending on utilities to the upper-bound of rent costs, $900.
4 Area Median Income (AMI)/Median Family Income (MFI) is used by the US Department of Housing and Urban Development to assess affordability in relation to its funding programs. This calculation is different from Median Household Income.
Chautauqua County Housing Market Analysis and Development Strategy
Not every household looks the same. It is expected that some individuals will be living alone or with a spouse or partner, while others will be living with roommates, friends, or other family. Underhoused individuals are those who would be expected to be living alone or with a spouse/partner, but instead are living with others. To identify underhoused populations, this analysis compares the proportion of young adults (aged 18-34) and seniors (aged 65+) living with others that are not a spouse/partner in Chautauqua County to the proportions for the Western NY Region. By applying the regional proportion to Chautauqua County populations, we then estimate the number of individuals in these age groups expected to be living with others and compare that against the actual number of individuals.
This analysis did not show any indication of individuals within these age groups being underhoused. In both cases, there was a greater proportion of individuals living alone or with a spouse/partner than at the regional level. While this indicates there is not necessarily unmet demand from this group for housing generally, it does not speak to demand for specific housing types.
Source: American Community Survey 5-year Estimates, MRB Group
A review of comprehensive plans and initial stakeholder conversations indicated that some areas of Chautauqua County may struggle with housing quality and maintenance issues. In addition to reviewing revitalization strategies prepared by Dunkirk and Jamestown, we analyzed data from the American Community Survey to identify the number of properties that are functionally obsolete or substandard. It is generally accepted that 3% of all units built before 1939 are functionally obsolete, and units without complete plumbing and/or kitchen facilities5 are considered substandard. These figures are provided in the table below. Note that there is likely overlap between these two categories of units (substandard and obsolete), so they cannot be added together without potential duplication.
Housing units considered functionally obsoloete (3% of those built before 1939)
Source: American Community Survey 5-year Estimates, MRB Group
The County as a whole has a higher concentration of obsolete and substandard units than the region or state. The elevated concentration of incomplete kitchen facilities is likely driven by units within the two cities, while the elevated concentration of units without complete plumbing is likely driven by housing outside of the cities.
5 “Complete plumbing” requires the presence of hot and cold running water, a flush toilet, and a bathtub or shower. “Complete kitchen facilities” requires the presence of a sink with a faucet, a stove or range, and a refrigerator.
Chautauqua County Housing Market Analysis and Development Strategy Page 30
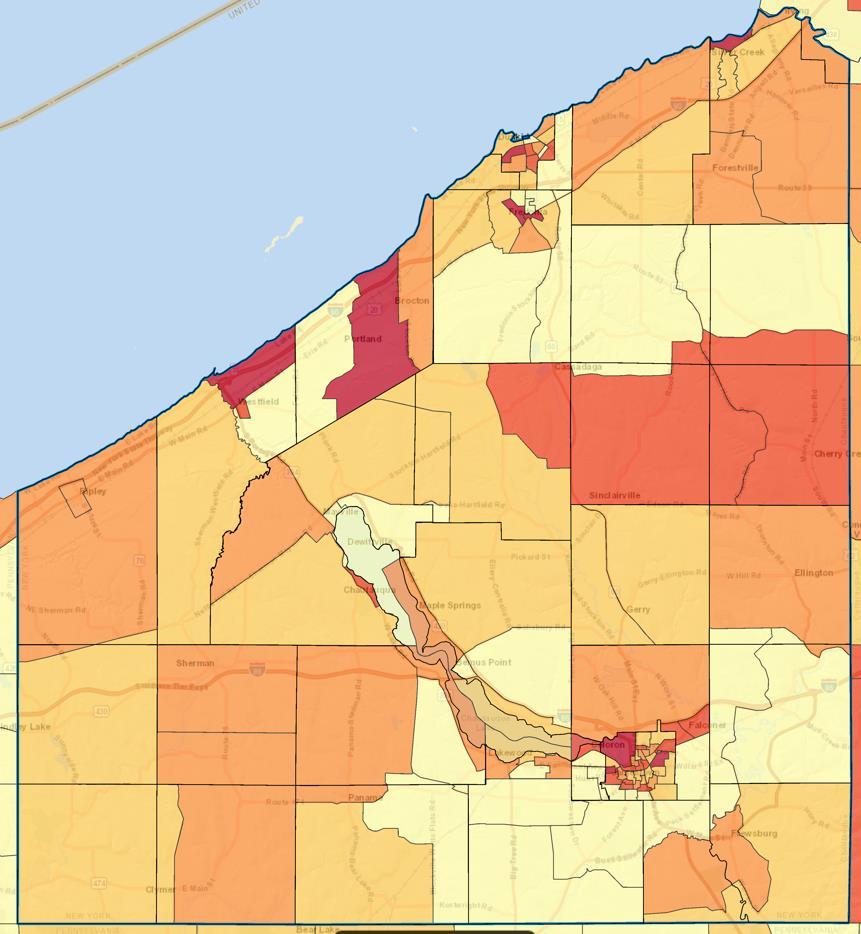
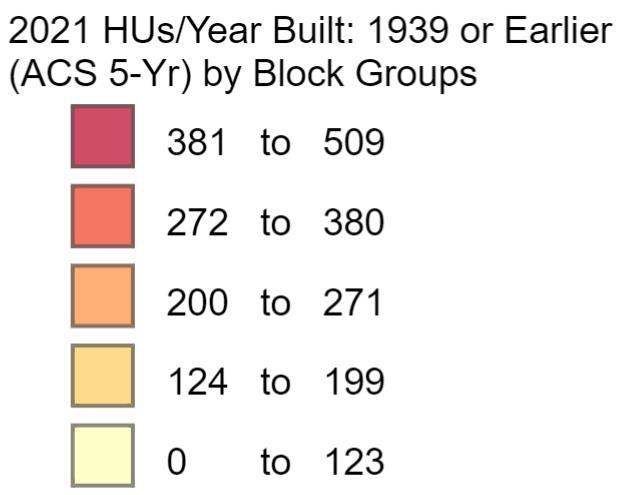
The map to the left shows the number of housing units in each Census block group built prior to 1940. The dark red areas have the highest number of pre1940 units, and thus are likely to need the most resources focused on property maintenance and upgrades.
Note that Jamestown, Silver Creek, Dunkirk, and Westfield are areas with high rates of lead poisoning, and have older housing stock as indicated by the map.
Source: Esri
Lead paint is a highly toxic metal, and exposure to even low levels can cause irreversible damage over time in people of any age. Children in particular are at high risk of complications due to lead exposure. Some known long-term consequences for children include damage to the brain and nervous system, delayed growth, hearing problems, headaches, trouble learning and behavioral issues, vomiting, and hyperactivity.6 Housing units built after 1970 have a 40% chance of lead paint being present, and that percentage increases as units get older, with housing built before 1940 having a 70-80% chance of containing lead paint. Over 87% of Jamestown’s housing stock and nearly 70% of the County’s housing stock was built prior to 1970. In Jamestown, nearly 55% of housing units were built prior to 1940.
The Jamestown zip code (14701) designated as a high-risk area by the state has the second highest number of children with lead poisoning in New York State. Within the County, Jamestown makes up 60% to 70% of lead poisoning cases, congruent with the zipcode’s higher share of old housing. Within NYS, Chautauqua County has the 6th most lead poisoned children – four times the incidence rate of NYS as a whole. In the first three quarters of 2023, the Chautauqua County Health Department conducted 73 prevention inspections and 71 children had elevated blood lead level. This was up from the 58 children in all of 2022 with elevated blood lead levels.7 It is important to note that there is no safe level of lead to have in our bodies – damage can occur even at low levels.8
The prevalence of lead in Chautauqua County not only has direct health consequences, but also has implications for the long-term economic health of individuals in the area, as attaining education is made more difficult when contending with ill-health, thus limiting economic well-being. The lifetime economic burden of childhood lead exposure in NYS is $6.4 billion. Over half of that burden ($3.5 billion) is shouldered by the private sector and households.9
6 Why Lead Is Dangerous: 4 Health Concerns – Cleveland Clinic
7 Elevated blood lead levels are anything above 5 ug/dL, though the County offers prevention services and an inspection for any child that tests between 3.5 and 4.9 ug/dL.
8 There is evidence to suggest that long-term low-level exposure is more damaging than a one-time high-level exposure.
9 Value of Lead Prevention. Calculated for the 2019 birth cohort. Includes costs of reduced lifetime productivity; increased health care, education, and social assistance spending; and premature mortality.
County Housing Market
In addition to current housing gaps and needs, we considered projected demographic information and what types of housing might be needed to address different populations.
Across all geographies in the table below, population figures are projected to decline over the next five years. Average household size is projected to increase slightly in the County as a whole, but decrease in the cities. In all cases, the decline in the number of households is projected to be less severe than population loss.
Source: Esri, MRB Group
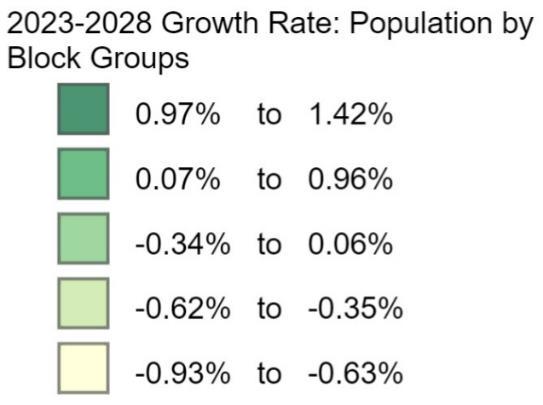
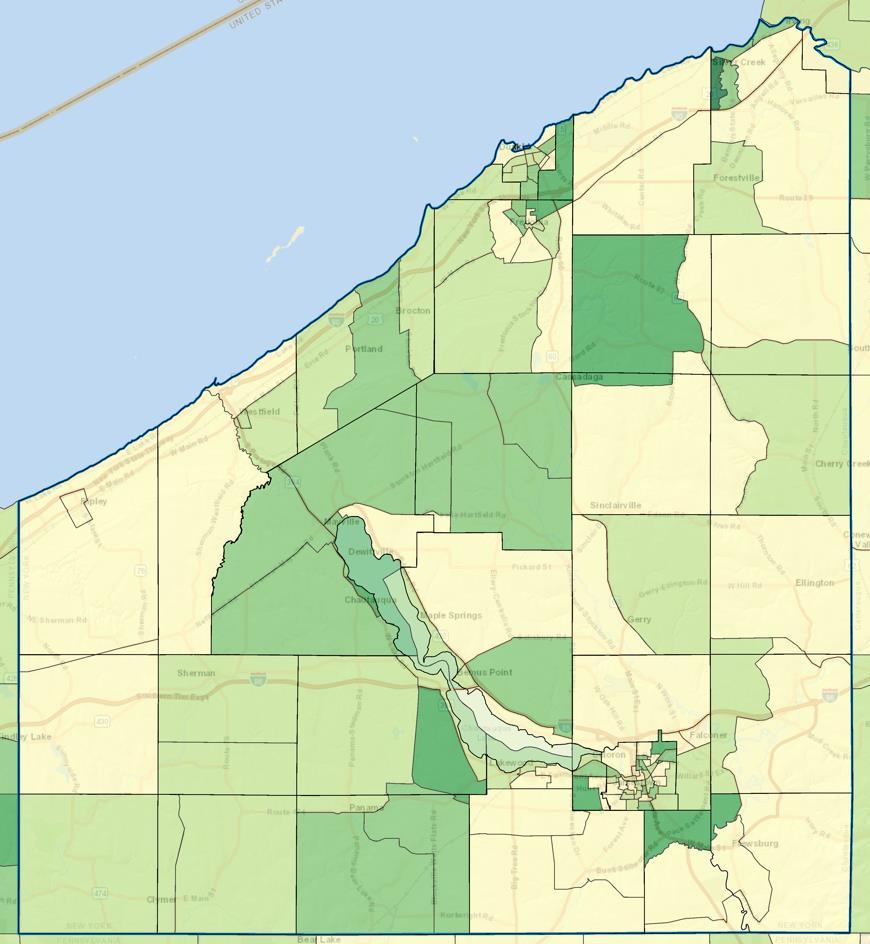
The map to the right shows the projected rate of population change from 2023 to 2028 by Census Block Group. Again, most geographies are projected to decline or hold steady in population. However, there are about a dozen block groups anticipated to see modest population growth. The largest growth is projected southwest of Silver Creek in the Town of Hanover at 1.42%, an increase of 73 people to a 2028 population of 1,074.
While the population is projected to decline overall, the County’s senior population is projected to increase nearly 10% over the next 5 years. By 2027, it is anticipated that there will be more than 2,500 additional seniors in the County as compared to current levels. This suggests a need to expand senior housing options. Assuming current trends among seniors in Chautauqua County, this additional senior population will demand 1,243 single family units and 346 rental units. However, not all of this will be new demand, as many of these future seniors are likely already in homes that they will continue to occupy.
As individuals age, they become more susceptible to long-term injury and illness, aligning some of their housing needs with those of the disabled community. Improving accessible homes benefits seniors as well as individuals with disabilities. 2022
Age Cohort Projections
Anticipated Senior Housing Demand by 2027
Chautauqua County Dunkirk Jamestown
Source: MRB Group
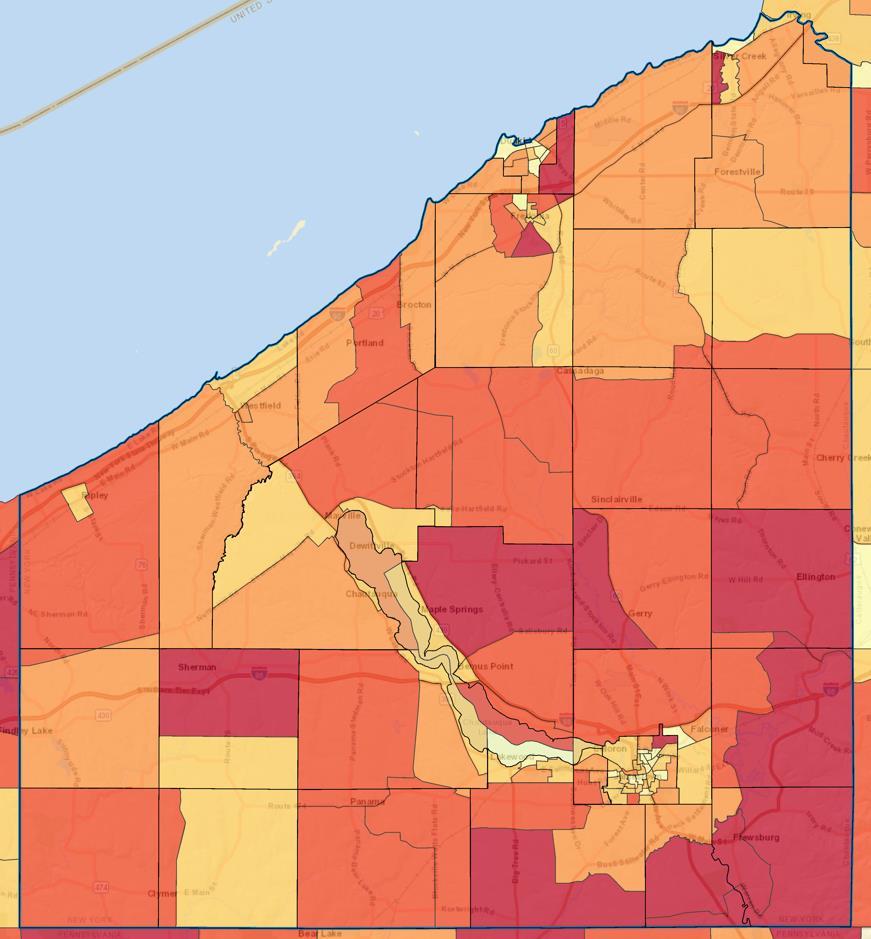
The map to the left shows the anticipated change in senior (65+) population within each block group in the County from 2023 to 2028. This could help to target areas for future senior housing development.
The demographic overview section of this report showed relatively high concentrations of households with people with disabilities in some areas of the County, compared to the State and the Western NY region. To assess the potential future need for specialized and supportive housing, the table below shows the number of individuals with disabilities, including those with independent living difficulty, for 2015 and 2021. An estimated number of individuals in 2027 is provided by applying the same growth rate.
• The City of Dunkirk saw a 106.3% increase in population with independent living difficulty from 2015 to 2021. This could be the result of programming or specialized housing that was developed during that timeframe, and thus may not be a natural growth rate
• The County overall saw a 30% increase in population with independent living difficulty, which is likely partially driven by the growth in Dunkirk. The increase in the County’s level of working age individuals with disabilities is likely also driven by trends in Dunkirk.
• On the other hand, the County also saw a 16.5% increase in seniors with disabilities (compared to just 9.7% growth in Dunkirk), indicating that there is growing need for assisted and supportive housing for seniors in other areas of the County.
Interviews with the Chautauqua County Resource Center revealed that low-quality housing persists despite high—and increasing—housing costs, and disabled communities within the County feel this burden acutely. Even with the stipends some residents receive through the Office for People with Developmental Disabilities (OPWDD), housing costs remain burdensome. The past three years have seen dramatic housing cost increases. In the Resource Center’s experience, an apartment that may have
for $500 in 2020 now
of
$950. The cost of utilities has also increased, adding to the housing cost burden. Additionally, individuals with disabilities face limits for spending based on regulations and their Supplemental Security Income (SSI). Increasing rents, and requirements that income must be thrice the rent, means that individuals on SSI cannot qualify for the housing stipend.
The Resource Center noted that finding employment for the people they serve is already difficult, but the real challenge is in finding safe, accessible, and affordable housing near that employment. Housing units often claim to be accessible, but frequently have door frames that are too small, bathroom layouts that are hard to navigate, and kitchens that are not usable for many individuals with disabilities.
Transportation and location are other noted barriers to housing accessibility. Public transportation throughout the County is limited, and in some areas is nonexistent. This makes commuting, running errands, and emergency transportation difficult for individuals who may not be able to afford a car, or who physically may not be able to drive. The lack of adequate public transportation for the disabled community highlights the importance of housing locations. Ideally, individuals would be able to secure safe and affordable housing in close proximity to a store that carries necessities (e.g. dollar general, pharmacies), as well as employment and other necessary services.
The Resource Center’s average client receives approximately $800 each month in SSI, and if they are enrolled in Self Directed Services through OPWDD, they may receive rent stipends of $50 to $614. However, receipt of housing stipends requires that the apartment is HUD compliant, a larger stock of which would be helpful to addressing affordability and enhancing consumer choice.
It is incredibly challenging to accurately quantify homelessness. There are many reasons for this, including that not all homelessness looks the same and that homeless and housing vulnerable people often move regularly. For this reason, they tend to be hard to count, track over time, and sometimes even to see. As such, it is often primarily the homeless who are receiving some sort of services or assistance who are counted. However, programming changes from year to year based on resources and capacity, which impacts the data available. In Chautauqua County, there is also an annual, on the ground survey conducted by local organizations and volunteers. While incredibly helpful for tracking trends and increasing our understanding of scale, this count is not perfect and likely undercounts the homeless population. All of that is to say that data about homelessness should be analyzed carefully, focusing more on trends than distinct numbers.
The number of individuals who were homeless or at risk of homelessness has increased from 995 in 2015 to 1,487 in 2022. The number of literally homeless (also sometimes referred to as “street homeless”) increased from 155 in 2015 to 816 in 2022. During that time, numbers dipped slightly in 2019 and 2020, but then began to rise again in 2021 and 2022. These dips are likely tied to programmatic differences from year to year, as well as COVID-era regulations (e.g. eviction moratoriums). This data trend generally aligns with the on-the-ground experience of service agencies working with these populations.
in Chautauqua County
Source: Chautauqua Opportunities, Inc.
These trends also align with Temporary Housing costs, which have increased drastically since the 2020-21 fiscal year (year start October 1). Temporary housing costs in 2020-21 were $448,006. For fiscal year 2022-23 through June 9, 146 families and 350 individuals were placed in temporary housing at a year to date cost of $1,366,532. Increased demand, shifting regulations, and inflation are all likely impacting these costs. This does not include Code Blue costs. 10
From 2020 through 2022, homeless adults were more likely to be men than women. However, the gap has been shrinking. In 2020, females made up 34.4% of the adult homeless population for which data was available, compared to 43.5% by 2022. The opposite was true of
10 Code Blue warnings are issued by the Chautauqua County Department of Mental Hygiene and Social Services when temperatures fall below 32 degrees. During the duration of a warning, additional warming centers are made available and no individual seeking shelter access is denied.
children over the same time period. In 2020 and 2021, there were only slightly more female children (78 and 76 respectively) than male children (76 and 71 respectively). In 2022, that gap had widened with 141 female children compared to 109 male children.
Over 23% of literally homeless individuals in 2022 had a mental health disorder (190). There were also high instances of chronic health disorders (112) and physical disabilities (133) among the homeless population, although one individual could be counted in more than one of these categories. These figures indicate only a correlation, not causation, and as such does not indicate that homelessness is determinative of these conditions or vice versa.
Population projections are not set in stone. Any number of circumstances, such as the location of a new major employer, could lead to an unanticipated influx (or exodus) of population. As such, it is worth assessing the housing need for potential new residents are not captured in the current projections. To accomplish this, we applied the current housing tenure trends of young adults, other working age, and senior age cohorts. Specifically, we applied the percentage that are householders (head of households), followed by the percentage of householders in each cohort that are homeowners and renters. This yielded the number single family and rental units per 100 new residents in each cohort, as shown in the table to the right.
County, outside of cities
Source: American Community Survey 5-year Estimates, MRB Group
The above needs assessment indicates the following:
• Approximately 50% of renters in the County are cost burdened, meaning that they spend more than 30% of their incomes on housing costs.
• The County’s housing stock is aging, with a higher proportion of units built prior to 1940 than the Western NY Region or State. As such, it is anticipated that the County has higher than average instances of obsolete housing units. There are pockets of older housing units in Jamestown, Dunkirk, and Fredonia, but also in Brocton and Westfield.
• The County’s residents are also aging, with the senior (65+) cohort being the only age group consistently projected to grow in the next five years. This indicates a likely need for smaller, easier to maintain housing options, both rental and owner-occupied.
• There is a high concentration of individuals with disabilities in the Dunkirk area, and as such the need for and availability of accessible housing options should be explored in greater detail.
• Homelessness and individuals at risk of homelessness have been trending up in recent years. Further, temporary housing costs are rising exponentially, more than tripling from fiscal year 2020-21 to 2022-23.
• Additional units are needed along the entire housing continuum, from affordable rental units that are attractive to young professionals, to low maintenance coops, condos, and townhomes that would allow seniors to age in the community. Addressing availability and quality along any or all of the stages within this continuum will also likely help to address affordability.

Prepared by:
Prepared
The Chautauqua County Partnership for Economic Growth engaged MRB Group to undertake an analysis of housing needs and to develop an implementation strategy to address those needs. The first step in that process was to review existing plans, strategies, partners, and programs to ensure that any future strategy aligns with, but does not duplicate, what already exists in the community.
This memo includes two sections. The first section provides an overview of various regional, County, and local community plans and strategies, highlighting common themes impacting or related to housing. The second section of this memo provides an overview of existing partners and programs that support housing development, quality, and access within Chautauqua County.
There are two regional organizations with plans that are particularly relevant for accessing funding and resources for housing projects: the Western NY Regional Economic Development Council (WNY REDC) and the Southern Tier West Regional Planning and Development Board (STW RPDB).
There are two WNY REDC plans that are relevant and current: the 2022 Progress Report and the 2020 Recovery Strategy. Neither of these plans has a strong focus on housing per se, but both refer to placemaking and talent attraction in the form of investing in downtowns, villages and neighborhoods. In the 2022 Progress Report, housing assistance is also mentioned in relation to wrap-around services for the workforce, while the 2020 Recovery Strategy calls specifically for the development of, “… remote offices and new remote worker housing options, building on the density of the region’s cities, towns, and villages, and reducing suburban sprawl.”
The STW RPDB Comprehensive Economic Development Strategy (CEDS) likewise does not focus on housing directly, but does include some housing-related strategies for reversing population decline and improving quality of life. One strategic focus of the plan centers on downtown revitalization and creating sustainable and walkable communities. Looking at the specific strategies in the CEDS, there are four related to housing development, two of which specifically refer to housing. These are summarized:
• Retain and stabilize the regional population by creating economic opportunity, investing in infrastructure, maintaining an affordable cost of living, and offering a high quality of life.
• Maintain and improve utility infrastructure, particularly in line with smart growth and green infrastructure principles.
• Invest in initiatives focused on downtown and neighborhood revitalizations, building renovation and adaptive reuse, increasing and improving the housing stock, and other efforts to create a more connected community and vibrant quality of life.
• “Develop, maintain, and promote a range of housing choices and opportunities for all residents…” and other infrastructure, services, and amenities that support a high quality of life.
The above plans are critical to accessing certain state and federal funds, and future housing initiatives should, to the extent possible, consider how to communicate alignment with these goals and strategies.
Chautauqua County has undertaken a number of county-wide plans. Those most relevant to this housing effort are:
• Chautauqua 20/20 County Comprehensive Plan (2011) and Status Report (2017)
• Economic Development Organizational Plan (2018)
• Shared Services Plan (2021)
• Visualizing Our Options – County Design Principles Guidebook (2009)
• Code Enforcement in Chautauqua County Baseline of Current Conditions and Options Reports (2023)
The Chautauqua 20/20 County Comprehensive Plan identifies a number of challenges the County was facing at the time, as well as a series of goals, strategies and actions to address those challenges. While many of the challenges identified are related to or have impacts on housing, the most relevant included a declining and aging population; lower incomes and higher poverty; high vacancy and fair/poor conditions among housing stock; high levels of cost burden for renters in particular; aging infrastructure; and high reliance on second-home owners for revenue and community vitality. The most relevant goals outlined include maintaining a distinctive sense of place through the preservation of historic villages, working farms, and scenic rural landscapes; implementing regionalization and resource sharing to provide cost-effective services and infrastructure; and encouraging continued investment in homes by permanent and seasonal residents. The strategies building upon these goals focus on limiting sprawl, right sizing the County’s housing stock, and repositioning the County’s role in leveraging housing for economic development. The plan included a specific set of housing-related actions, broken down into the highest priority actions and other actions. The high priority actions focused on building capacity for housing development through empowering the County Housing Task Force, training educational institutions to provide related instruction, and implementing a tax incentive program through the IDA. The other actions primarily focus on marketing, regulatory streamlining, and compliance.
The 2017 Status Report of Chautauqua 20/20, “On the Move and Thriving”, noted several relevant infrastructure updates, but explained that funding continues to be a barrier for both new development and maintenance of infrastructure. In terms of housing, municipalities were still struggling with blight and abandoned properties. However, the Chautauqua County Land Bank was established to address problem properties and stabilize neighborhoods, and there were a number of housing developments planned or proposed in the Cities of Dunkirk and Jamestown through Citizen’s Opportunity for Development and Equality (CODE),Chautauqua Home Rehabilitation & Improvement Corp. (CHRIC), and Southern Tier Environments for Living (STEL). The update noted a housing market study, being undertaken as part of this strategy, and more consistent code enforcement county-wide as the next critical steps.
In 2018, Chautauqua County and the Chautauqua County Industrial Development Agency commissioned an Economic Development Organizational Plan to provide insights and best practices on how to support and streamline the provision of economic development services. This report was delivered in January 2019 and outlined a series of traits, roles, recommendations, and priorities to consider in the creation of a successful Economic Development Organization (EDO). While this plan is highly focused on business attraction, expansion, retention, and creation, there are elements that point to housing as a potential role for an EDO to play as a partner. In particular, the plan points to the fact that Chautauqua’s EDO could aim to get involved in “a broader set of community development initiatives, including
housing…” in the mid-term (2020-2023), although the pandemic likely impacted the timeline for short- and mid-term objectives. Stakeholder engagement undertaken during the development of the plan also confirmed a need to improve the housing stock.
The County-Wide Shared Services plan did not have any particular focus on housing, but did include a shared code enforcement personnel project for the Village of Mayville and Town of Chautauqua that could impact code enforcement and compliance in those communities.
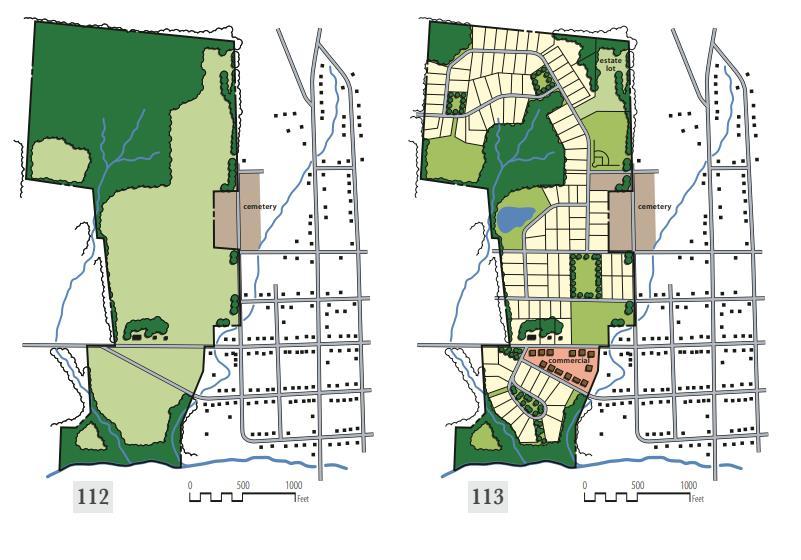
Source: Visualizing our Options – Chautauqua County Design Principles Guidebook (June 2009)
The Visualizing our Options – County Design Principles Guidebook was developed in 2009 and outlines a series of guiding design principles for various types of future development in the County. While this guidebook should probably be revisited, confirmed, and/or updated, it does offer some insight into community priorities at the time that may still be relevant today. For residential properties in particular, the guidebook encourages several strategies that promote dense, walkable neighborhoods, as well as street patterns and site layouts that match existing local character.
The Code Enforcement reports from 2023 identify key issue areas for Chautauqua County code enforcement, including: “completing required annual inspections, needing expert advice on complex issues, and challenges dealing with problem properties and holding chronic violators accountable.” While these issues do not necessitate an overhaul in the County’s code enforcement, they do require increased support from the County. Additionally, a highlighted concern is dwindling code enforcement staffing due to low pay a lengthening job description. To improve conditions, the report outlines options Chautauqua County can take. The first of these is the provision of background support to code enforcement by the County, offering expert advice where needed, and helping municipalities overcome common roadblocks. Another option involves the County taking over a small fraction of code enforcement responsibilities. It should be noted that “less than 10% of municipal leaders want the County to take over code enforcement,” which is the final option presented in the report.
For the purpose of this report, twenty-two local community plans were reviewed including two neighborhood housing market studies, thirteen local comprehensive plans, and one regional comprehensive plan. These plans were reviewed with particular attention paid to housing related goals and strategies.
In 2017 and 2018, the cities of Jamestown and Dunkirk conducted studies to better understand the critical role of neighborhoods and the housing market on their fiscal capacity and ability to compete regionally for residents and resources. Within both communities, the prevalence of distressed properties creates the following issues: (1) undermining the tax base while burdening city services, (2) diminishing values of neighboring properties, (3) discouraging existing owners from investing in their own properties, and (4) putting the cities at a competitive disadvantage in the region.
In 2017, the City of Jamestown completed the “Neighborhood Revitalization Progress Report” as a follow up to the “Reinvesting in Itself” neighborhood revitalization plan from 2010. At the time of the 2017 report, Jamestown had reached its constitutional taxing limit and was at a critical crossroads to reverse the erosion of its fiscal capacity. The City commissioned the report to take a hard look at the impacts of downtown and neighborhood revitalization.
The report examined the effectiveness of the strategies developed as part of the previous neighborhood revitalization plan. The aim was to find whether the areas that received intensive intervention since 2010 saw improvements in the average sale price and housing quality. The findings suggest that intensity of intervention matters, but that not all strategies and policy recommendations had been carried out. In 2017, the rental market remained saturated with marginally inhabitable housing stock.
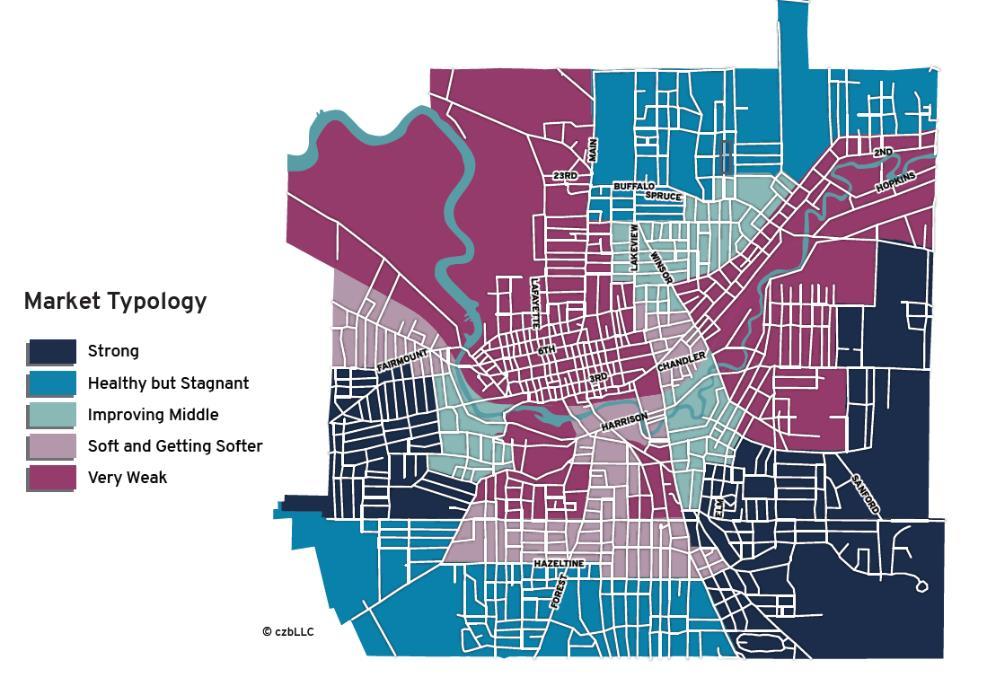
Learning from the prior plan, the 2017 report identified four focus areas for targeted intervention: (1) Northside/Lakeview, (2) Western Gate, (3) Hazeltine/Forest, and (4) Allen Park/Hospital. The suggested targeted interventions included small grants, cultivating resident leadership capacity, aggressive blight removal, prioritization of homeowner and rehab programs, street beautification projects, partnerships with the local Land Bank, and targeted code enforcement.
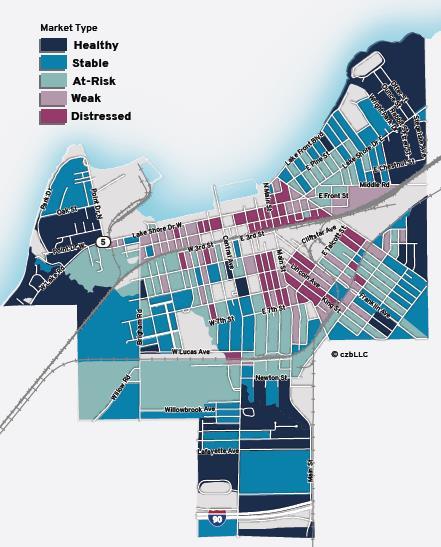
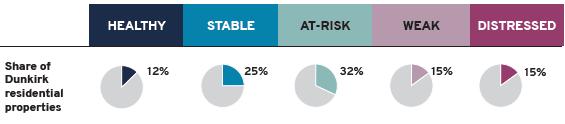
In 2018, the City of Dunkirk commissioned the “Choosing Dunkirk: A Strengths-Based Strategy for Problem Properties in Dunkirk, NY” which found that 725 residential properties (approximately one out of every six houses) in the City displayed some combination of outward signs of distress and disinvestment. The study found that the majority of problem properties in the City fell into three categories:(1) vacant or high risk of vacancy, (2) troubled rentals, and (3) owner-occupied “slipping or distressed” properties.
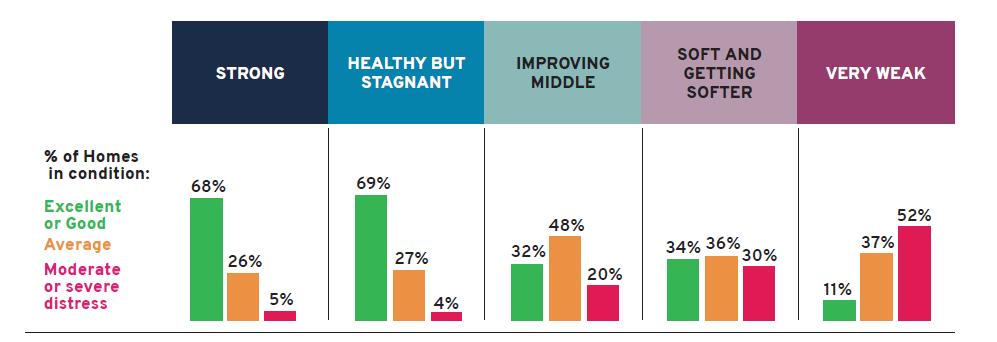
The study also divided the City into sub-markets classified as healthy (12% of residential properties), stable (25%), at-risk (32%), weak (15%), and distressed blocks (15%). Healthy markets generally had homes in excellent to good condition, while blocks in the distressed category mostly contained homes in moderate to serve distress. Of Dunkirk’s 725 problem properties, 12% were in the critical at-risk blocks and 34% of all problem properties were found outside of the weak and distressed markets.
The study emphasized the need to stabilize neighborhoods by targeting problem properties on blocks that already contain healthy properties to prevent the spread of disinvestment, neglect, and blight. Strategies identified to address the three problem property types include (1) creating an Inter-agency Vacant Property Task Force, (2) demolishing blighted properties, (3) partnering with the Land Bank for acquisition or sale, (4) creating a citywide rental registry and conducting inspections, (4) expansion of strategic code enforcement and compliance assistance, (5) homeownership assistance, (6) property owner engagement and neighborhood leadership cultivation, and (7) resources for home rehab and repair.
According to these reports, decades of population decline and shrinking households in Jamestown and Dunkirk coupled with rising vacant property rates, stagnant home values, and persistent deferred maintenance continue to soften the housing market, lower the tax base, and erode the fiscal capacity of the government. Consequently, both studies encouraged the cities of Jamestown and Dunkirk to
be proactive and follow targeted strategies to address blight and distress in their housing markets to make the most of their limited fiscal capacity, dwindling resources, and community partnerships.
Thirteen local comprehensive plans were reviewed to ascertain housing priorities throughout the County. While a number of themes emerged, nine of the 13 plans noted a need for senior housing and a desire to see housing development tactics that would limit sprawl (i.e. in-fill, high density, etc.). Eight of the plans expressed a desire to preserve community character and/or resources (e.g. historic, agricultural, natural, aesthetic, etc.). Seven of the plans envisioned expanding the variety of housing options to meet the needs of diverse populations, as well as challenges with and maintenance of an aging and/or deteriorating housing stock. Other reoccurring themes included neighborhood and downtown revitalization/stabilization, affordable housing, and infrastructure to support housing and residents.
In addition to the thirteen individual and joint comprehensive plans, the Chadwick Bay Regional Comprehensive Plan was also reviewed. This plan includes the City of Dunkirk, Village of Fredonia, Town of Dunkirk, Town of Pomfret, Town of Portland, and Town of Sheridan. There is a series of housing actions within this plan, which generally aligns with the common themes noted above. Additionally, the region puts a focus on attractions of new residents, specifically from Erie County, NY and Erie County, PA.
In addition to various County departments offering services related to housing, there are a number of existing partners and programs addressing housing and residential real estate in Chautauqua County. Most of these partners and programs focus on the availability, affordability, and maintenance of housing.
• Chautauqua County Land Bank Corporation – acquires vacant, abandoned, condemned, and foreclosed properties and then demolishes or sells them to combat blight. Some properties are converted into affordable or market rate housing.
• Jamestown Housing Authority – public housing, Section 8 housing, and the Family Self-Sufficiency program. Three properties, one specifically for seniors and only one allows children.
• Dunkirk Housing Authority – public housing, Section 8 housing – two properties
• Citizens Opportunity for Development & Equality (CODE) – non-profit community revitalization. Primary focus is developing, owning, and managing apartments. Over 200 affordable units.
• Southern Tier Environment for the Living (STEL) – provides rehabilitative and support services to persons with mental illness and other disabilities, including residential treatment group homes and apartments, supported housing, and single room occupancy housing. Developer of affordable housing for people with special needs.
• Chautauqua Opportunities, Inc. (COI) – Apartments and rental properties, Section 8 housing, homeownership programming (assistance with affordable mortgage products, counseling for homebuyers), free and reduced cost energy audits, limited energy efficiency improvements, homelessness prevention services, housing assistance for people living with HIV/AIDS, financial education and asset development.
• Chautauqua County Homeless Coalition – coalition addressing needs related to homelessness and providing intervention and prevention services.
• Chautauqua Housing Rehabilitation & Improvement Corporation (CHRIC) – home repair financial assistance for income-eligible homeowners (geographic eligibility and repair types may be restricted), accessibility modifications for seniors and people with disabilities, first time homebuyer education and counseling.
• Jamestown Urban Renewal Agency (JURA) – coordinates an assortment of housing, development, and economic development activities on behalf of the City of Jamestown.
• County of Chautauqua Industrial Development Agency (CCIDA) – offers enhanced PILOT schedule for adaptive reuse projects.
• Jamestown Renaissance Corporation – provides funding to groups of neighbors who collaborate to make exterior improvements to their properties.
Chautauqua County’s economic development efforts are ongoing, supported by dedicated organizations like the Chautauqua County Industrial Development Agency (CCIDA), the Chautauqua County Partnership for Economic Growth (CCPEG), and the Chautauqua Region Economic Development Corporation (CREDC). These organizations tackle issues and opportunities related to business and workforce development, infrastructure, housing development, and placemaking. New employment, entertainment, and housing options attracted to the area by these and other community partners has stymied a decades long trend of population decline. Now, those who have chosen to live and/or work in Chautauqua County enjoy a low cost of living, the full spectrum of the seasons, parks and forested land with hundreds of miles of trails, the National Comedy Center, and the Chautauqua Institute, which welcomes over 100,000 visitors each year.
The success of these organizations’ economic development efforts in 2023 is a testament to the building blocks laid over the past decade. Some of those building blocks include documents like the Chautauqua County Economic Development Organizational Plan (EDOP), the Chautauqua County Comprehensive Plan, and a variety of grant applications. In 2023, CCIDA assisted businesses committed to retaining over 2,300 full-time equivalent jobs and creating another 574 in the coming years. Further, CCPEG provided $459,250 of financial support to 26 projects that further the goals of the EDOP. CCPEG also received $1.2 million in grants for another 11 projects, and various municipalities and organizations throughout the County secured over $28.3 million of grant funding to advance additional economic development projects. A breakdown of these grants is shown in the tables on the next page.
Chautauqua County Housing Market Analysis and Development Strategy Page 50
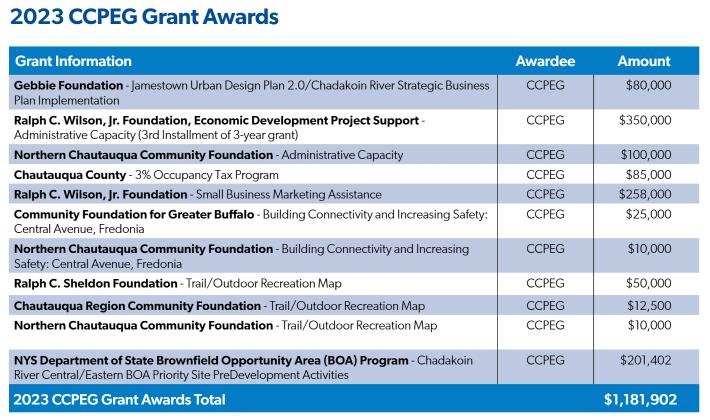
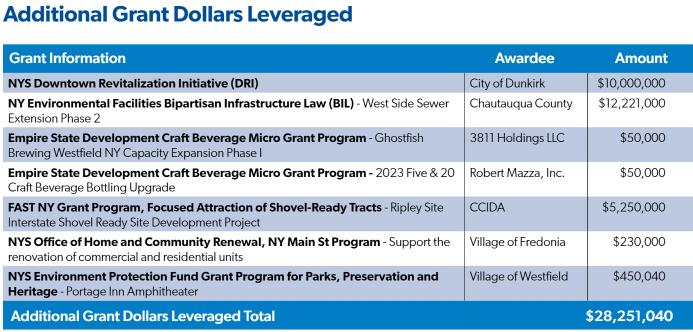
Project Funding
Cummins Engine Internal expansion
Wells Ice Cream expansion
Creation of shovel-ready site in Ripley
Weber Knapp purchase by local ownership
Refresco acquisition of Conagra/CCIDA facility in Dunkirk for NE distribution center
Creation of Brownfield Remediation Revolving Loan fund
ARPA Business Assistance Program
Broadband expansion to un- and under-served communities
$452 million
$250+ million
$16 million
$21.4 million
$13 million
$720,000
$650,000
$60 million
The table to the right lists some key accomplishments in 2023, including business expansions, creation of new funding programs for local businesses and developers, and infrastructure improvements. Recently, the CCIDA also announced it will assist with the redevelopment of the former Silver Creek High School property. This property has been a frequent topic of conversations with local social assistance organizations, municipal leaders, and developers. These and other community projects offer new economic opportunity that are likely to attract new residents to Chautauqua County Continued investment in placemaking and housing, as guided by the dedicated work groups, can make individuals’ and families’ decision to relocate to (or stay in) Chautauqua County easier
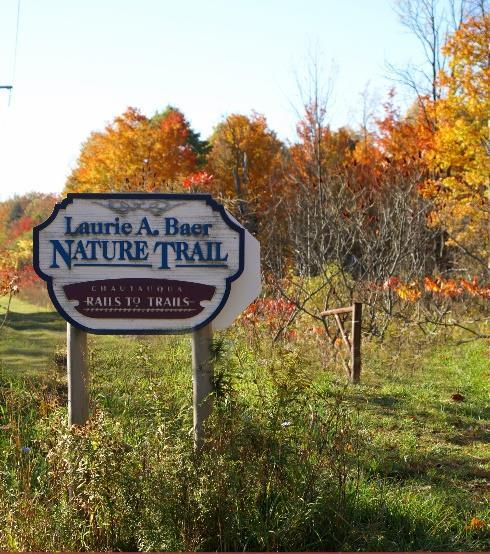
The expanding business environment in Chautauqua County necessitates additional workforce housing, and the need for workforce housing is only expected to grow as attraction strategies take effect and draw more people to the County to live and work. This growth will necessitate a diversity of quality housing units. The Chautauqua County Land Bank has made strides in improving housing in the County through ongoing work to reduce blight and vacancies, and thus the trend of declining property values. The CCIDA also provides tax abatement initiatives that have contributed to housing market improvements.
Placemaking is another facet of economic development that attracts and retains residents and businesses. The County has expanded its efforts to improve the quality of life with consistent improvements to recreation, housing, employment, and infrastructure. This is particularly evident in downtown areas like Dunkirk, which was awarded the NYS Downtown Revitalization Initiative (DRI) in 2023 to fund transformative business, renovation, and placemaking initiatives.

In April of 2024, the CCIDA and CCPEG plan to unveil a two-pronged marketing and branding strategy that aims to fully reverse the County’s population decline. “Live CHQ” and “Choose CHQ” will work to attract and retain talent by advertising quality of life and the many opportunities available throughout the County. A “relocation guide” is already available for potential businesses and residents, which
Due to the County’s generally rural landscape and abundance of farms, vineyards, and livestock rearing operations, economic development partners provide dedicated support to the agricultural and tourism industries. Their work has paid off: data from USDA’s 2022 Census of Agriculture shows that the number of Chautauqua County’s farms have increased amid statewide declines.11 The revitalization of the agricultural industry, and specifically small, family-owned farms, can be attributed to passionate stakeholders, economic incentives, and development efforts championed by the County.

Chautauqua County and its component communities recognize the importance of diverse, affordable housing to quality of life and community vibrancy. Many want to maintain their community’s character and resources, but also see the need to accommodate a variety of residents at all income levels, ages, and backgrounds. A number of organizations throughout the County align with these needs by focusing efforts on housing rehabilitation, development, maintenance, access, and affordability. However, there is most likely opportunity to expand and/or replicate programming related to rehabilitation, senior housing, and in-fill development.
11 According to the U.S. Census of Agriculture, between 2017 and 2022 the total number of farms in Chautauqua County increased by 63, to 1,291. Comparatively, NYS saw an overall 2,788 decline in the number of farms.
Chautauqua County Housing Market Analysis and Development Strategy Page 53 highlights entertainment and recreation options; proximity to urban centers and airports; diverse natural amenities; prominent industries and available sites for development; and notable figures from the area, like Lucille Ball. By attracting new residents, these efforts will help to grow the workforce pipeline for businesses.
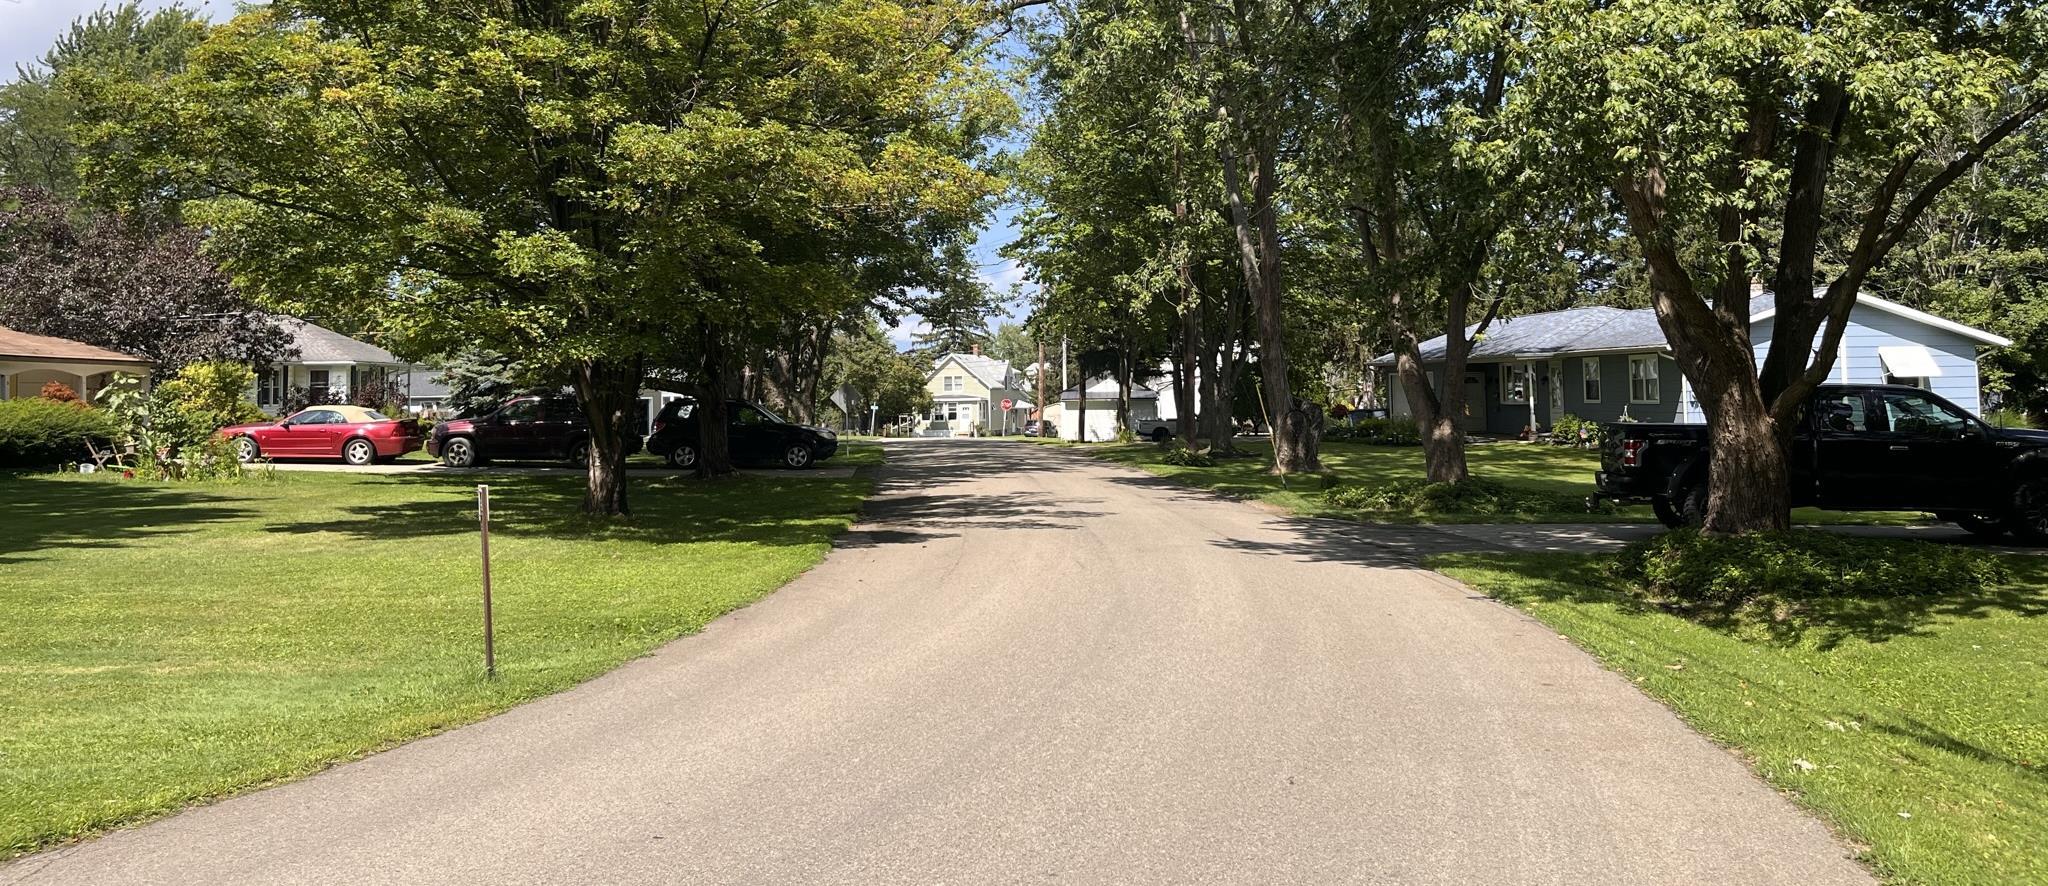
The following is a demographic overview of Chautauqua County, as well as the cities of Dunkirk and Jamestown, and New York State for comparison and context. Data is primarily drawn from American Community Survey (ACS) estimates, as reported by Esri, and Lightcast industry and workforce data.
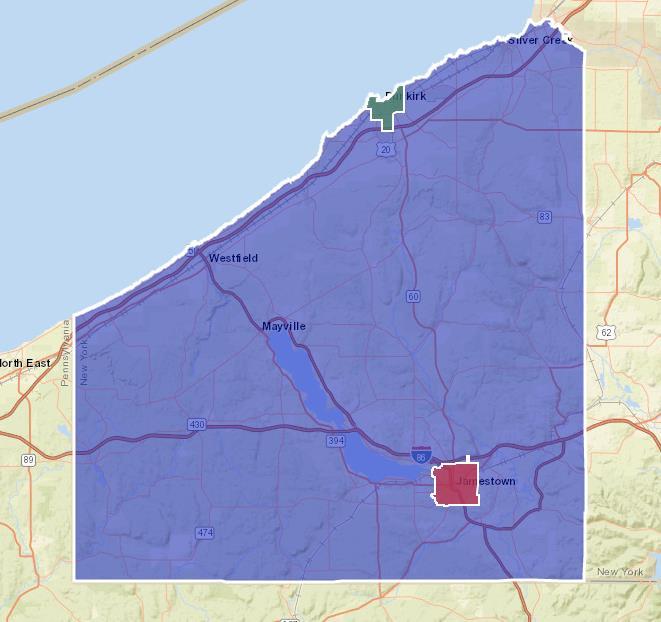
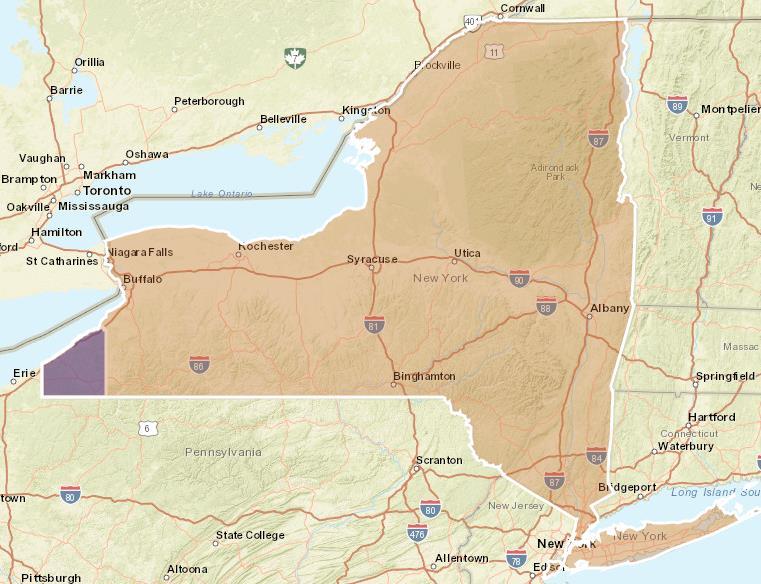
Chautauqua County Housing Market Analysis and Development Strategy Page 56
• The County’s population is estimated at 125,021 for 2022.
• Approximately 10% of the County’s population lives in the City of Dunkirk and just under 23% of the County’s population resides in the City of Jamestown.
• Over the last twelve years, the County’s population has declined by 7.3% and is projected to decline an additional 2.2% over the next five years. Dunkirk and Jamestown saw less drastic declines since 2010 (-.08% and -1.3%).
• The County’s household size has declined by 3.2% since 2010 and is expected to decline another 1% by 2027.
• Average household size for all four geographies is projected to continue to decline through 2027.
• Across all four geographies, median age continues to rise. Between 2010-2022, the County’s median age rose 5.1% from 40.9 to 43. By 2027, the County’s median age is projected to rise to 43.6. The median age in Dunkirk and Jamestown is lower, closer to the State median age.
Source: Esri Communtiy Profile
The map to the right shows the population density of Chautauqua County (2022 estimate) by Census Block Groups. The darkest areas have the highest population density, and the light-yellow areas have the lowest population density. The main population centers in the County are in and around Dunkirk, Fredonia, Westfield, and Jamestown. There is also increased density at the north end of Chautauqua Lake.
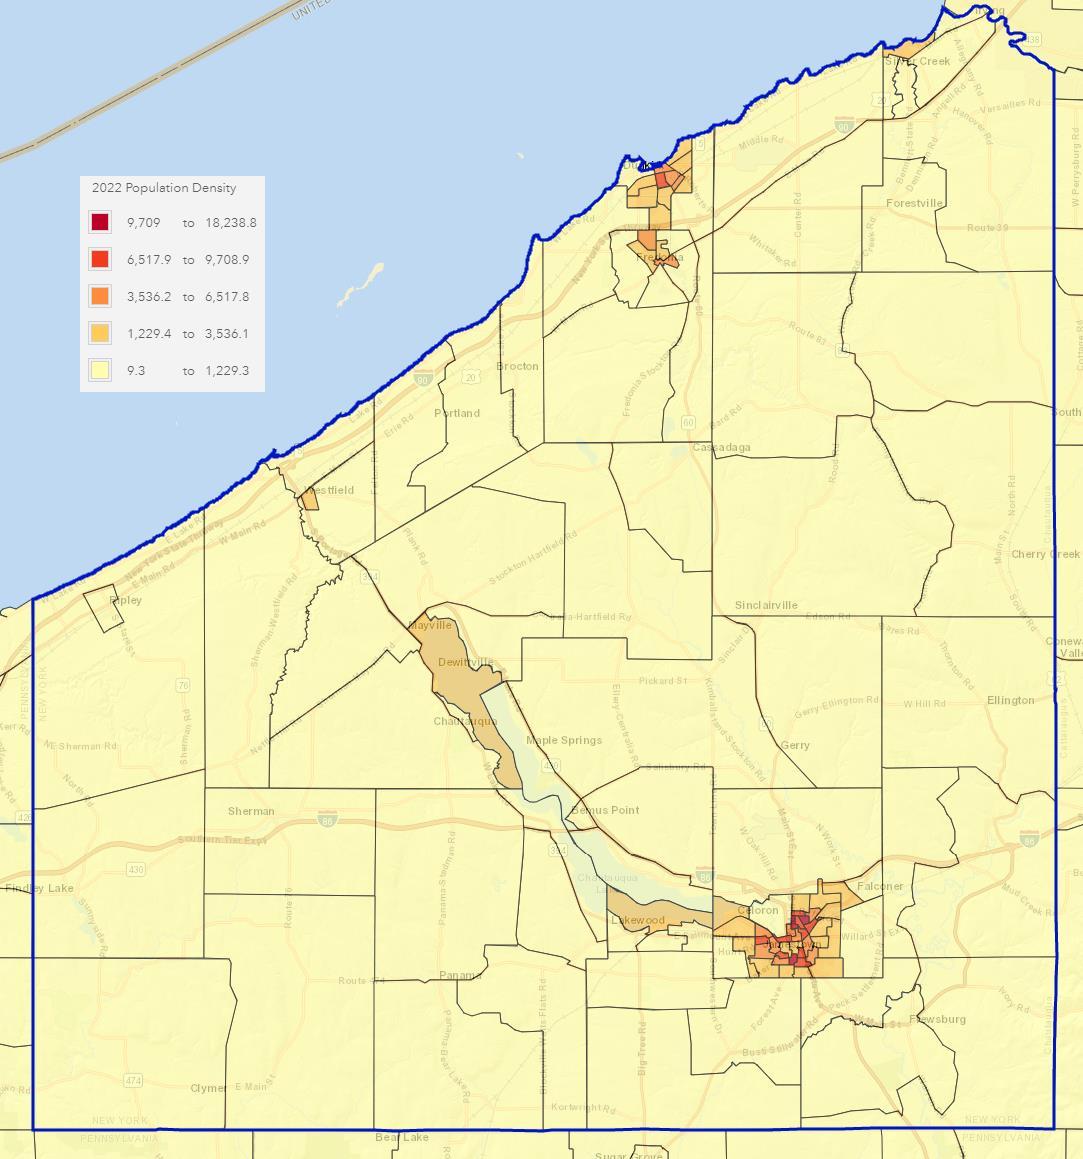
Source: Esri, Here, GarminSafeGraph
This table shows the difference between the daytime population and the total population for each City, the County and the State.
• The County has a very slight net out-commuting population, with approximately 773 residents, or less than 1%, that work elsewhere.
• The City of Jamestown has a significant in-commuter population where the daytime population exceeds residential population by over 3,800 people.
• Workers commuting to Chautauqua County are primarily coming from Allegany and Cattaraugus Counties in New York and Warren and Crawford Counties in Pennsylvania.
• In comparison, Chautauqua County residents are primarily commuting to Erie, Cattaraugus, Monroe, and Genesee Counties in New York and Erie and Warren County in Pennsylvania.
Daytime Population, 2022
Source: Esri Communtiy Profile
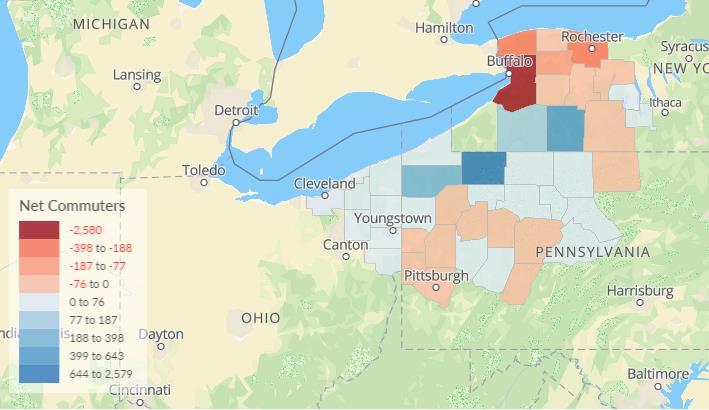
Source: Lightcast
• Median Household Income (MHI) in the County is estimated at $55,109 for 2022, which is over $15,000 more than the City of Dunkirk and over $20,000 more than the City of Jamestown.
• However, MHI for the State is more than $20,000 greater than it is for the County.
• MHI in the County is projected to grow 19.6% over the next 5 years. This is in line with the State projected growth.
• Future growth of MHI in the Cities is projected to be slower, around 11%.
• The City of Jamestown has the highest percentage of the population earning an annual income less than $50,000 at 61.5% compared to the City of Dunkirk at 56.9%, the County at 46.1%, and the State as 33%.
• 25.9% of the City of Jamestown’s population earns less than $15,000 annually, which is substantially higher than the proportion for the County as a whole (15.2%) and more than double the proportion for the State (10.2%).
• The City of Jamestown also has the lowest percentage of the population earning an annual income of more than $100,000 at 13.7%, compared to the City of Dunkirk at 19%, the County at 27.3%, and the State as 40.8%.
Source: Esri Communtiy Profile
$200,000+
Source: Esri Community Profile
The map below displays the median household income (MHI) of Chautauqua County by Census Tracts. In general, MHI is greater on the northeast and southern borders of the County. MHI is lowest in the Census Tracts in the cities of Dunkirk and Jamestown.
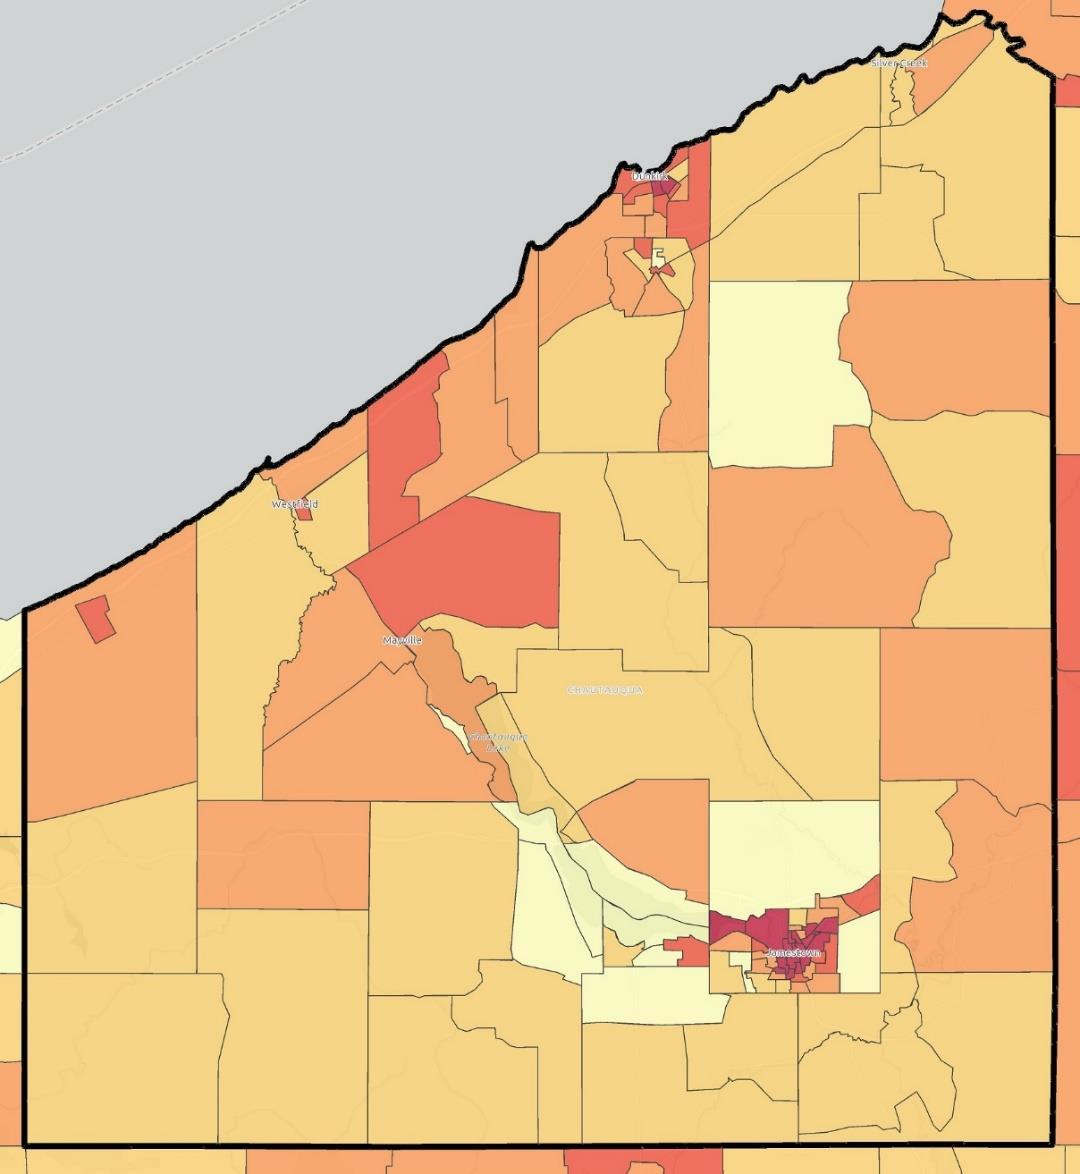
Source: Esri, Here, GarminSafeGraph
Chautauqua County Housing Market Analysis and Development Strategy
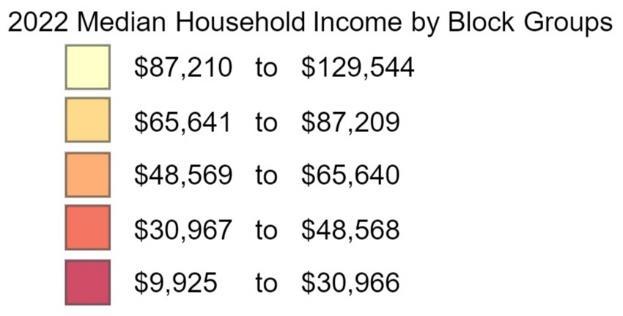
The percentage of total households living below the poverty line ranges from 13% to 25% across the four geographies. Both the City of Dunkirk and City of Jamestown have significantly higher percentages of households living below the poverty line, at 25% and 24% respectively, compared to 17% of County households and 13% of State households.
Source: ACS 2017-2021 Estimates
Source: Esri Community Profile
For all four geographies, over 30% of the population is currently over the age of 55. The County has the largest portion of the population over 55 at 35.9%. Through 2027, the share of the population over the age of 55 is projected to increase for all four geographies. The County’s population of residents 55+ is projected to increase by 1.1% over the next 5 years. However, this is slightly less than the State’s projected growth of 1.4%.
Nearly one in three households in the County include at least one person with a disability. In the City of Dunkirk, nearly 40% of households have a person with a disability. This concentration, in part, may be due to supportive housing units that exist within Dunkirk, particularly developments of STEL and the Dunkirk Housing Authority. The maps on the next page show the percentage of households with at least one person with a disability by Census block group. The highest concentrations are in the central sections of Dunkirk and Jamestown, shown in the call out maps.
Households
Source: ACS 2017-2021 Estimates
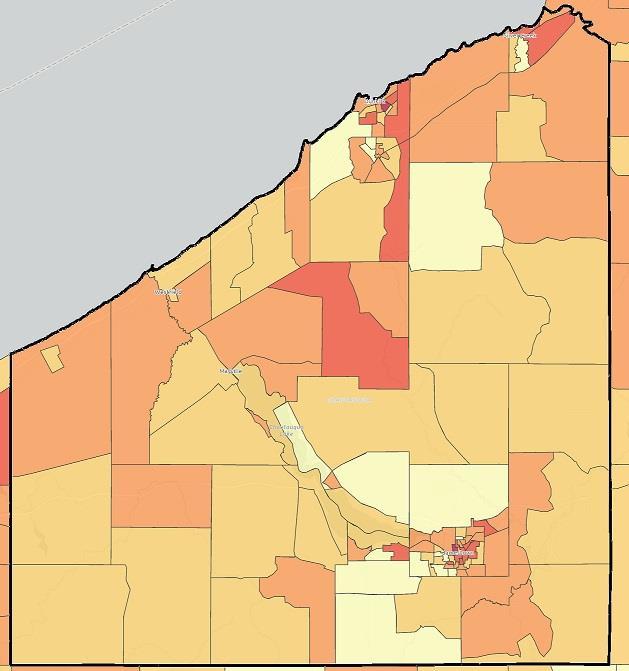
Source: Esri, Here, GarminSafeGraph
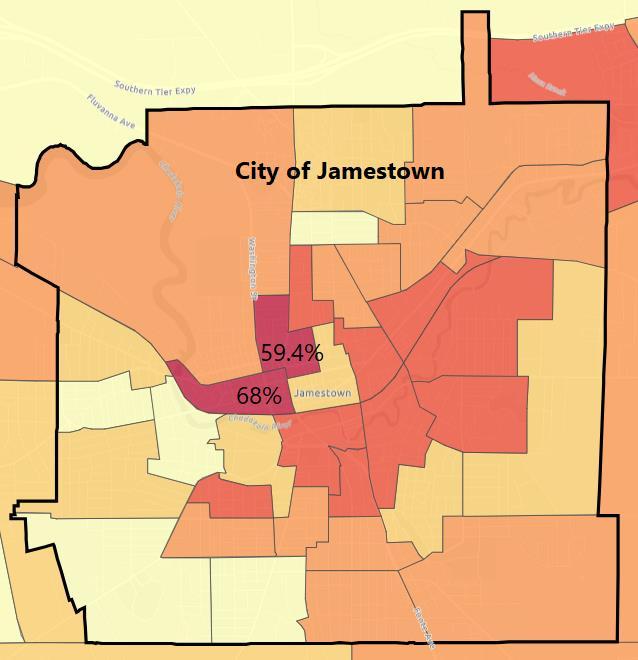
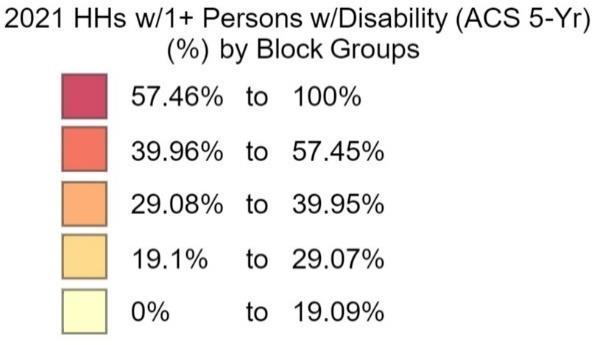
County Housing Market Analysis and Development Strategy
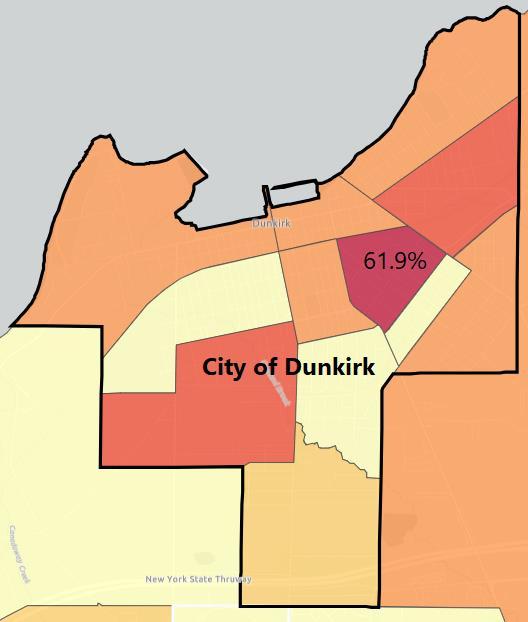
The table below shows the count of single-headed households with children across the four geographies. Roughly 49% of households in Chautauqua County are single headed households, and 6% of households are headed by a single parent. This is in line with the state percentage. However, the Cities of Dunkirk and Jamestown have higher percentages of single parent led households, 9% and 10.5% respectively.
Source: ACS 2021 5-year Estimates, US Census Bureau
Some of Chautauqua County’s key demographic indicators relating to housing include:
• Approximately one-third of the County’s population lives in either the City of Dunkirk or the City of Jamestown.
• Over the last twelve years, the County’s population has declined by 7.3% and is projected to decline an additional 2.2% over the next five years, although the Cities of Dunkirk and Jamestown saw much less drastic declines.
• The County has a very slight net out-commuting population, with approximately 773 residents (net) that work elsewhere. However, the City of Jamestown has a net in-commuter population of over 3,800 people. This would indicate that most towns see substantial commuting out of the County for work.
• Median Household Income (MHI) in the County is estimated at $55,109 for 2022, but was only $39,388 for the City of Dunkirk and $33,626 for the City of Jamestown. The Cities also have higher poverty rates, around 25%, compared to the County at 17%.
• Nearly one in three households in the County include at least one person with a disability. In the City of Dunkirk, nearly 40% of households have a person with a disability.
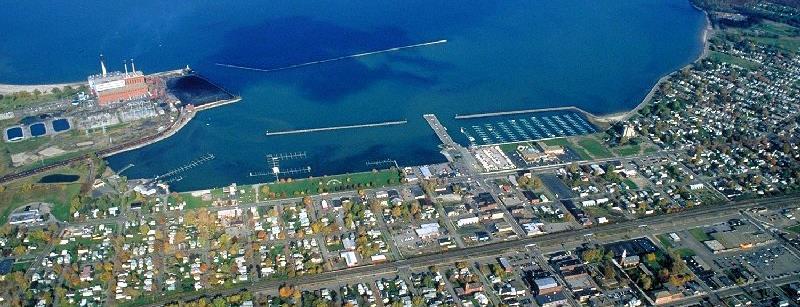
Prepared by:
The following housing market overview includes data for Chautauqua County as a whole, the Cities of Dunkirk and Jamestown, and for the Western New York region.
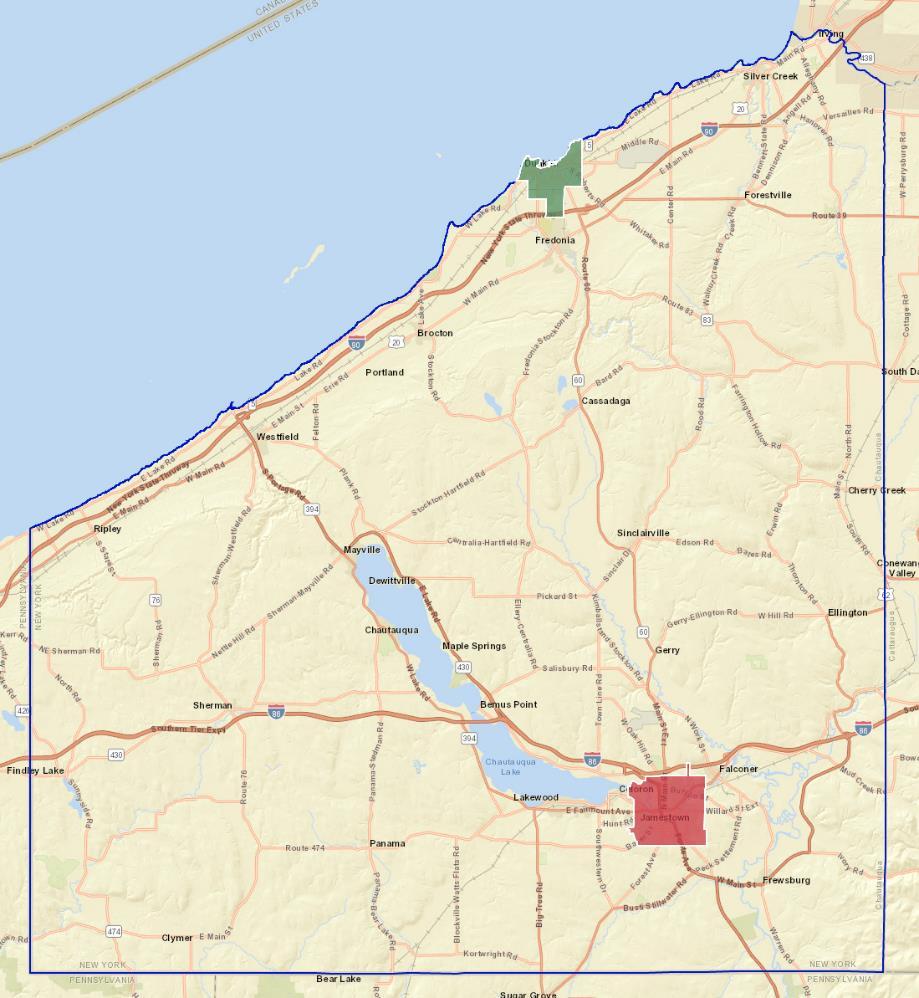
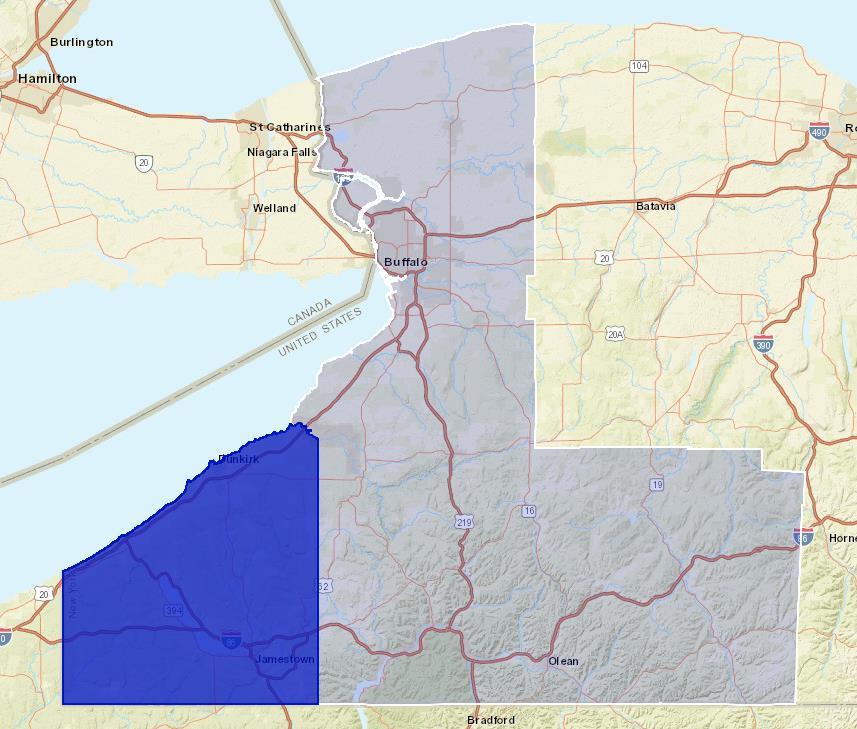
Chautauqua County Housing Market Analysis and Development Strategy Page 67
The following table shows activity in the single-family home market in Chautauqua County, the Western NY region, and New York State over a one- and four-year period. This data is sourced from the New York State Association of Realtors (NYSAR).
Compared to five years ago, the supply of houses for sale is dramatically less in all market areas. In Chautauqua County, there were 15.6% fewer new listings and 63.7% fewer homes of sale in 2022 than 2018, while closed sales increased 12.5% in the same timeframe. As a result, time on the market has substantially decreased compared to four years ago. The median sale price of a home in Chautauqua County also increased 61.4% since 2018, which is higher proportional growth than the State as a whole (48.3%). All of this indicates increasing demand and decreasing supply.
Chautauqua County Western NY NYS
Source: New York State Association of Realtors
*For Western NY, the Median Sale Price and Months Supply are weighted averages of the figures for each county in the region.
County Housing Market
Compared to 2021, the data on single-family homes tells the same story of dwindling supply, increasing prices, and strong demand for housing in Chautauqua County. In the last year, the median sale price for homes has increased 11.7%, outpacing high inflation. However, months supply did increase slightly – about 2 days – and closed sales decreased 4% year-over-year, possibly indicating a slight slowdown in the market.
Chautauqua County Western NY NYS
Source: New York State Association of Realtors
*For Western NY, the Median Sale Price and Months Supply are weighted averages of the figures for each county in the region.
The following section examines multifamily residential real estate data from CoStar, an extensive database of commercial real estate data. The map below displays the location of multifamily properties in Chautauqua County that are captured in the CoStar database. The distribution of multifamily units in the County generally correlates with the population distribution.
As of March 2023, CoStar captured approximately 3,648 units within the County. The average monthly rent of those units was $877. Vacancy rates declined from 2017 through Q2 2022, but since have been slowly increasing again to 6.2%. This is still well below 2017 levels. Rental rates have steadily increased over time going back to Q2 2010.
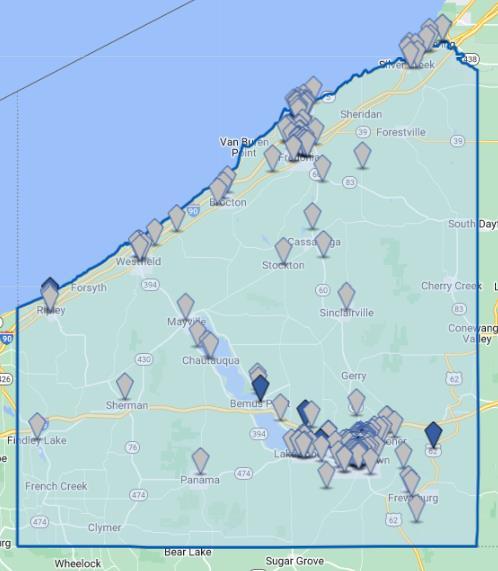
Until late 2022, demand for multifamily units has been relatively strong over the last five years with consistent positive net absorption. More units were leased than vacated in nearly every quarter since 2017, driving vacancy rates down. Vacancy rates hit a historic low of 4.4% in Q2 2022, and have since risen to 6.2%.
The supply of new multifamily units has remained relatively unchanged in the last ten years, with the exception of a large delivery in Q1 2017 when 116 senior units came online at Connect55+ Lakewood. The vacancy rate for these units has been less than 1% since Q4 2018.
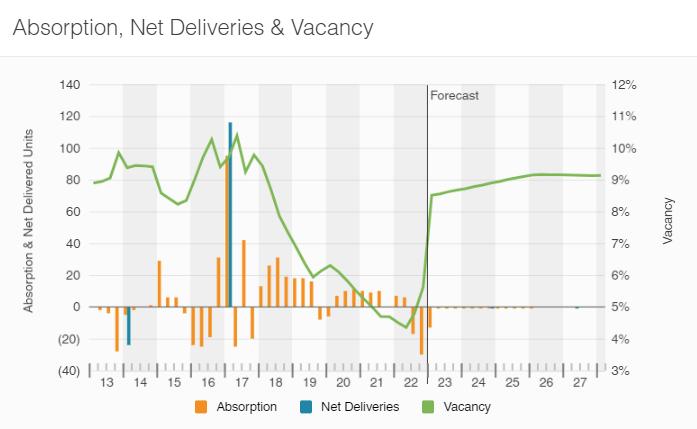
Current market rent for the captured units is anestimated average of $877 per month. Market rate rent has grown steadily since at least 2018. The rate spike in 2016 appears to be caused by a data anomaly.
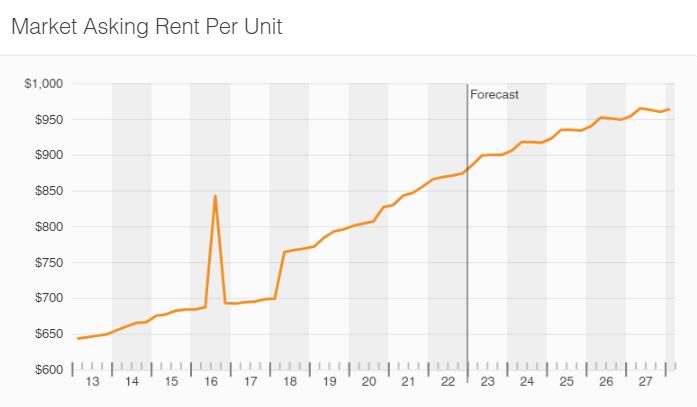
The Western New York Region (WNY) is comprised of 5 counties – Chautauqua, Alleghany, Cattaraugus, Erie, and Niagara Counties. The map below displays the location of multifamily real estate for WNY. Real estate trends in the region are somewhat divided between the northern and southern portions of the region, with a more robust multifamily rental market in Niagara and Erie Counties, particularly in and around the City of Buffalo.
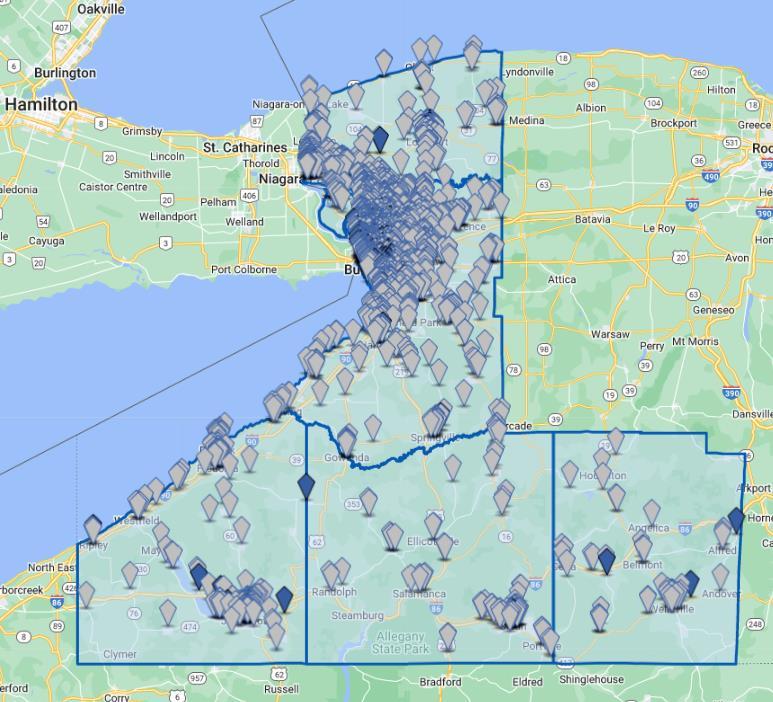
The multifamily real estate market regionally is fairly active, with consistent deliveries to the market eachquarter. These deliveries are mostly absorbed, but the vacancy rate has been climbing over the last 18 months. The market, however, is still tight as the regional vacancy rate is only about 4%. This indicates that other areas of the region have near 0% vacancy. Over time, this pressure could start to push into the northern area of Chautauqua County. However, while deliveries are anticipated to continue in the region, at this point very little of the new construction is anticipated in Chautauqua County.
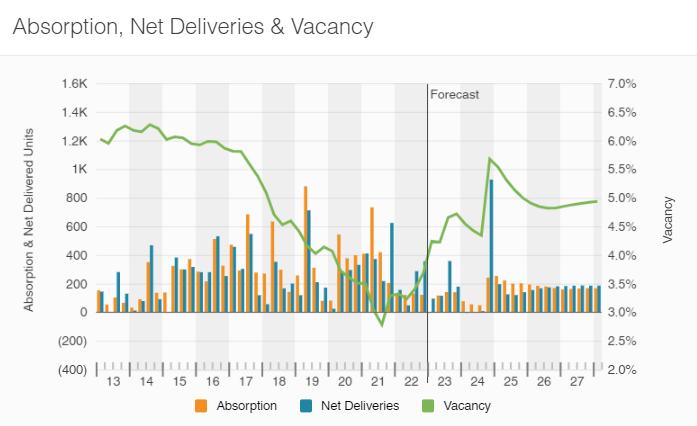
Very low vacancy and strong demand over the last three years have led to increasing rental rates. Rate growth has accelerated from less than 2% in 2019 to over 4% in 2022. Currently, the average market rent in the region is just over $1,100 per month, notably above the current market rate of $877 for Chautauqua County.
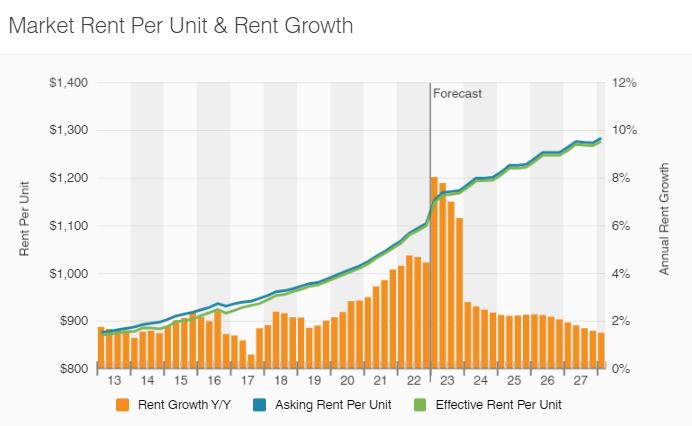
Building permit data shows trends in housing development over time. Chautauqua County as a whole has seen a declining trend in residential building permits over time. In the 1990s, communities in the County consistently issued more than 200 permits annually, and there was a peak in the early 2000s with 446 permits issued in 2005. There was then a drastic decline and permit levels have been in the 75-175 range for most years since 2010. In 2021, there were 88 permits in Chautauqua County. There have been no multifamily units permitted in the county since 2018.
The graph to the right shows total permitted housing units in Chautauqua County, broken down by single family units and multifamily units.
Since 2010, Jamestown and Dunkirk have made up a small portion of single-family permits in the County. During those years, Jamestown never had more than one single-family permit in a year. Dunkirk had fewer than five most years, but 33 and 16 in 2018 and 2019 respectively.
Most years, the Cities had no multifamily units permitted. The exceptions are 2011 and 2012, when Jamestown had 35 and 53 multifamily units permitted respectively, and 2017, when Dunkirk had 28 units permitted. This makes up the majority of permitted multifamily units in the County, with the exception 143 units in 2014.
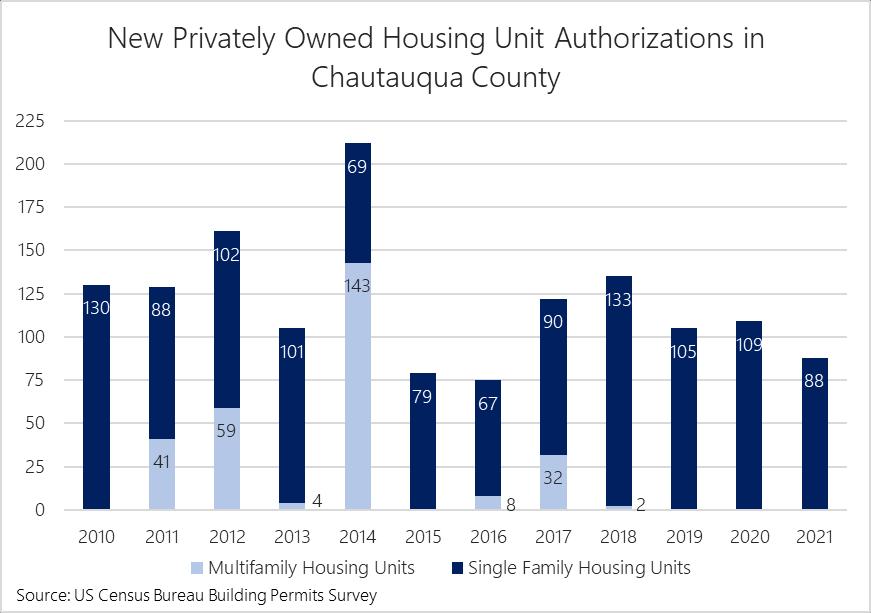
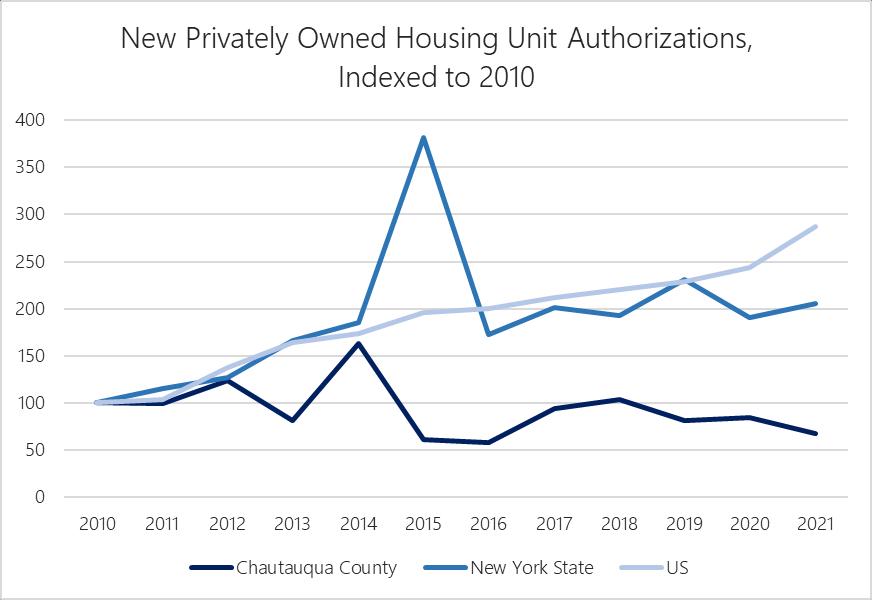
The graph to the left shows residential building permit trends, indexed to 2010 levels, for Chautauqua County, New York State,12 and the United States. Nationally, residential unit permits have grown consistently. In New York State, there has been a slight upward trend as well. In contrast, permits have been relatively stable, but with a slight downward trend in Chautauqua County.
12 The spike in New York State in 2015 is likely a data anomaly.
Chautauqua County Housing Market Analysis and Development Strategy
Projected employment growth in the County will have an impact on future housing needs. Understanding the income levels anticipated will help determine the appropriate types of housing that the market will require. The chart below shows the income level of jobs expected to grow from 2023-2028, based on projections for occupational growth. The shaded area of the chart indicates the income level needed to reasonably afford a home at the current median home value for a single income household. It is estimated that 42% of the growth in occupations through 2028 will have annual earnings sufficient for home ownership on a single income. 58% of the growth in occupations in Chautauqua County from 2023-2028 will be jobs that would not be able to individually support homeownership of a median priced home, but 12% of these new jobs will fall within $6,000 of this threshold. This will shift over time depending on trends in wages and home values, but this offers a reasonable guidepost for policy and programming purposes. Generally, households that expend more than 30% of their income on housing (rent or mortgage, plus utilities) are considered cost-burdened. The table below shows the cost-burden thresholds for different income levels.
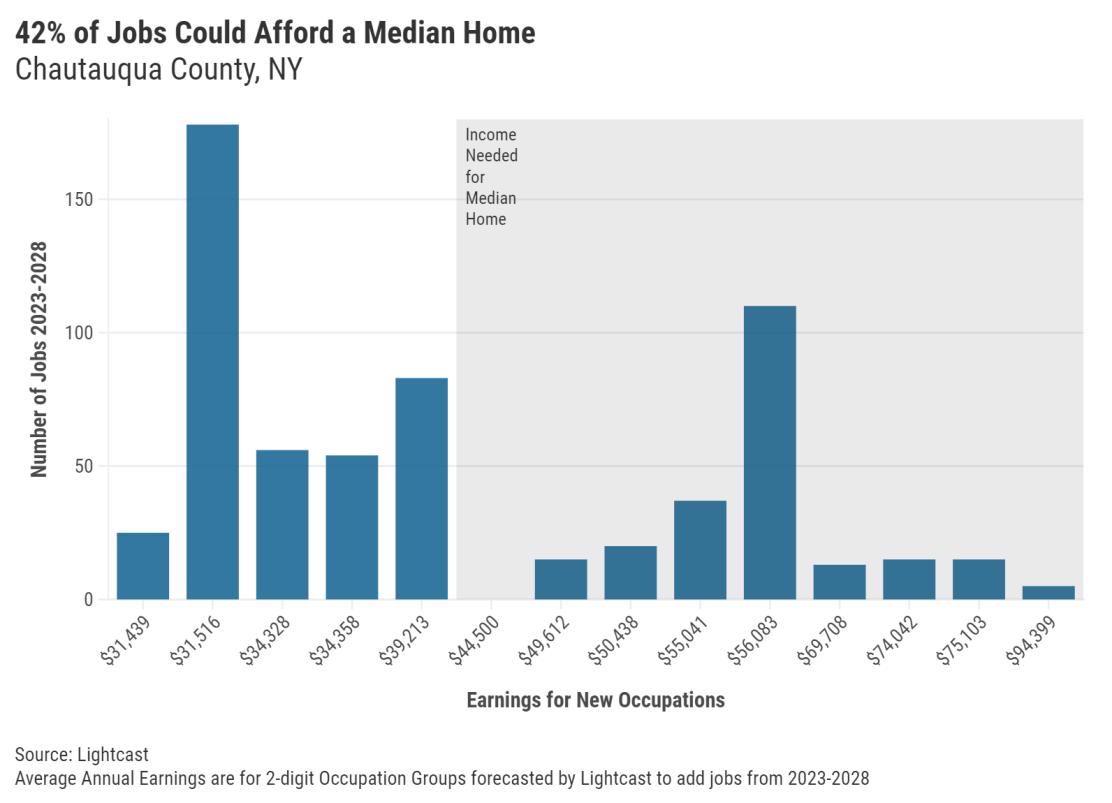
Thresholds
$25,000 $7,500 $625
$26,000 $7,800 $650
$27,000 $8,100 $675
$28,000 $8,400 $700
$29,000 $8,700 $725
$30,000 $9,000 $750
$31,000 $9,300 $775
$32,000 $9,600 $800
$33,000 $9,900 $825
$34,000 $10,200 $850
$35,000 $10,500 $875
$36,000 $10,800 $900
$37,000 $11,100 $925
$38,000 $11,400 $950
$39,000 $11,700 $975
$40,000 $12,000 $1,000
Source: MRB Group
According to data from the US Census (2021 American Community Survey 5-year Estimates), the current median contract rent in Chautauqua County is $562 per month. When taking utilities into account, the average gross rent is $695 per month. The above data indicates that approximately 395, or 58%, of the projected jobs will offer $31,439 to $39,213 in annual earnings. If living in single income households, these workers can afford $775 to $900 per month on housing costs without being considered cost-burdened. Under current conditions, these households would likely be able to afford rental housing, but not necessarily homeownership.13
13 Note that this analysis only considers income, cost and affordability, it does not account for availability and quality of housing units.
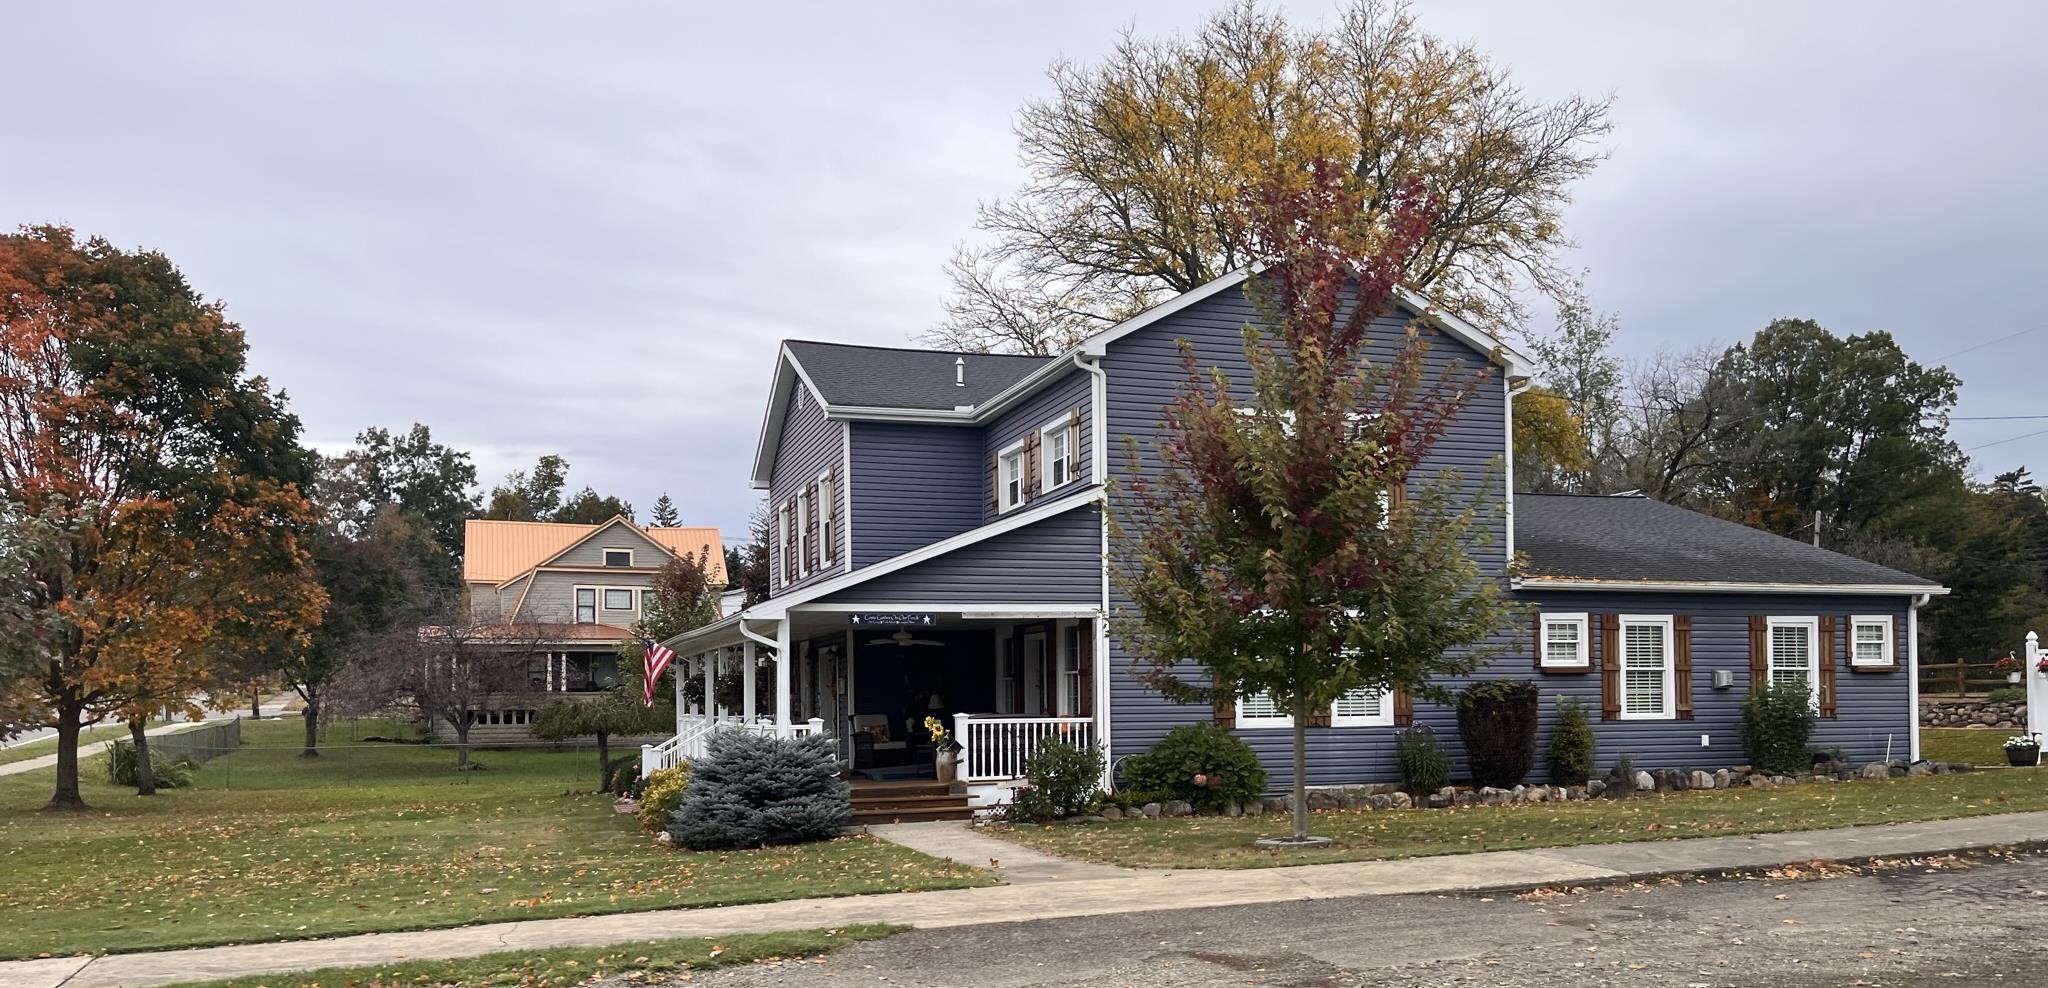
Prepared by:
Prepared for:
May 2023
The following housing inventory overview includes data for Chautauqua County as a whole, the Cities of Dunkirk and Jamestown, and the State of New York. Data is primarily drawn from American Community Survey (ACS) estimates as reported by Esri.
Chautauqua County Housing Market Analysis and Development Strategy Page 81
• There are an estimated 66,062 housing units in Chautauqua County, over 14,000 (21.8%) of which are in Jamestown and over 6,000 (9.2%) of which are in Dunkirk.
• Only 79.5% of the housing units inthe County are occupied, but this is a result of a high level of seasonal homes (see next section). Occupancy rates are higher in Jamestown (86.9%) and Dunkirk (88.1%), indicating that the more rural areas of the County have lower occupancy rates.
Source: Esri Housing Profile, *Esri Community Profile
• 55.5% of the County’s housing units are owner occupied, with higher owner-occupation in the rural areas and higher levels of renter-occupation in the cities.
• All areas of Chautauqua County have higher vacancy on average than New York State.
• There are 13,320 vacant housing units in Chautauqua County, 17.3% of which are in Jamestown and 3.1% of which are in Dunkirk. This means the cities account for a lower proportion of vacant units than overall units, as indicated above.
• Well over half (57.2%) of the vacant units in the County are Seasonal/Recreational units. These kinds of units account for only 22.2% of vacant units in Dunkirk and a mere 1.4% of units in Jamestown.
Source: Esri Housing Summary, ACS 2017-2021 Estimates
• 15.9% of vacant units in Dunkirk are rented but not occupied, and 14.7% of vacant units in Jamestown are vacant but actively
rent.
• “Other Vacant” refers to any vacancy reason other than those otherwise identified. According to the Census Bureau, the most common reasons for a unit to be labeled “other vacant” are that the owner does not want to sell/rent, is using the unit for storage,
or is living in a nursing home or with family. This category also captures units that are being held for settlement of an estate or being repaired or renovated, as well as some foreclosures.

• Seasonal/Recreational/Occasional Use vacant units are highly concentrated around Chautauqua Lake. The map to the right shows Census block groups color-coded by the number of vacant units classified as Seasonal/Recreational/Occasional Use. The red areas have the highest number of these units. A small block group in the Town of Chautauqua, on the northwest side of the Lake, has the most seasonal units with 1,368. This makes up 98.3% of vacant units and 91% of total housing units in that block group. Many of these seasonal units are associated with the presence of the Chautauqua Institution within that area. The next highest number of these units is in the block group at the northeast end of the lake, with 635.
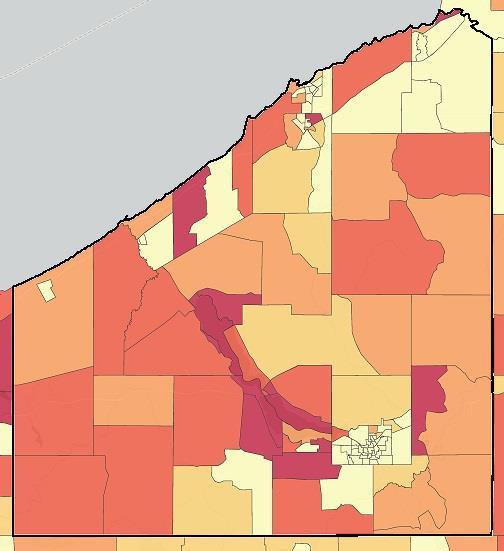
The map to the left shows Census block groups color coded by
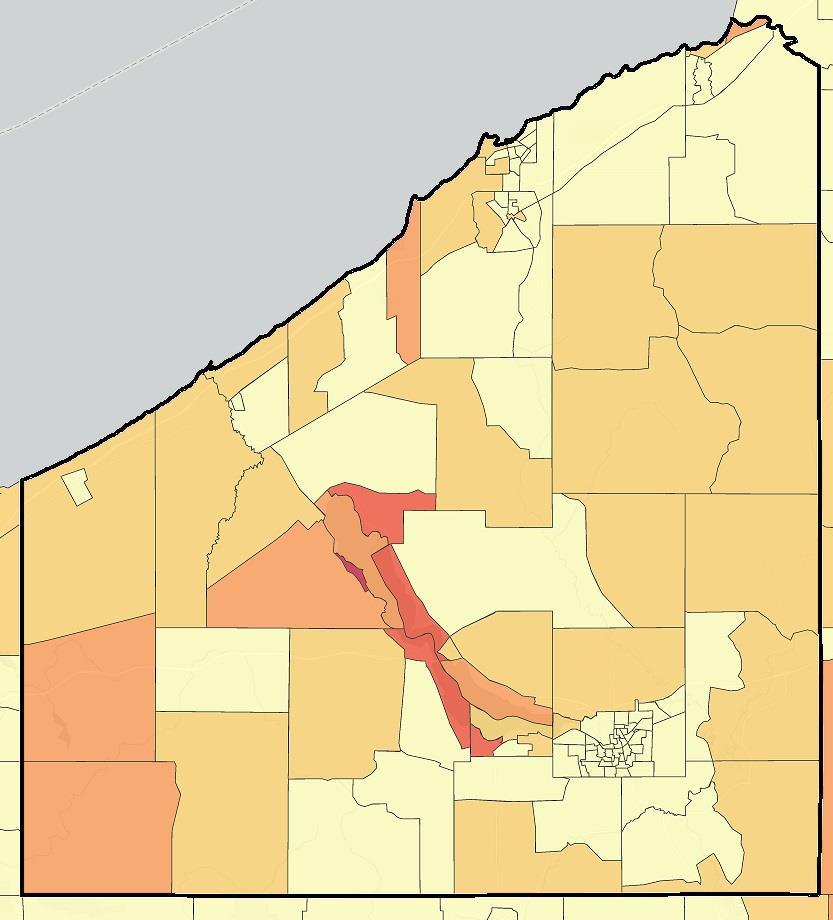
Seasonal/Recreational/Occasional Use units as a percentage of all vacant units. This is helpful in showing the areas where vacancy is driven by vacation and second homes as opposed to other factors, like market forces or quality.
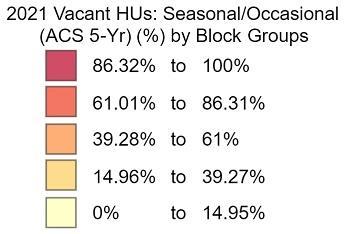
• Over two-thirds (68.4%) of the housing units throughout Chautauqua County are single-family, detached residences. This is a higher proportion of units than the State has on average.
• Single-family detached residences are more prevalent in the rural areas of the County, multi-family units generally make up a greater share of the total housing stock in the cities.
• Mobile homes make up 6.2% of the housing units in the County, but very few of them are in the cities.
• The housing stock in Chautauqua County on average is slightly older than the stock of New York State as a whole.
• The largest proportion of housing units in the County were built prior to 1940. These older homes tend to have higher maintenance needs and potential health hazards like lead paint.
• Only 4,417 housing units in the County were built after 2000.
Source: Esri Housing Summary, ACS 2017-2021 Estimates
Median Year Structure Built 1953 1944 not
Source: Esri Housing Summary, ACS 2017-2021 Estimates
The map below shows the percentage of housing units built prior to 1939 by Census block group. As shown in the data above, there are high concentrations of older housing stock in the Cities of Dunkirk and Jamestown, but there are also pockets in Fredonia and in more rural areas of the County.
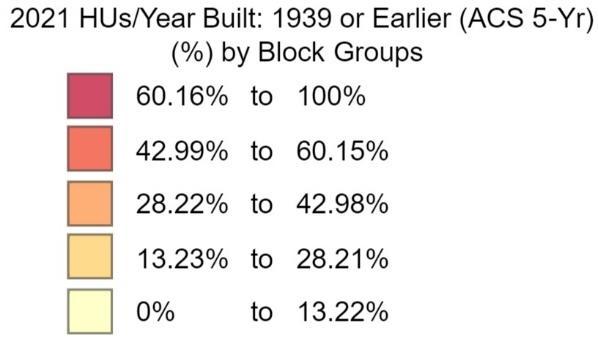
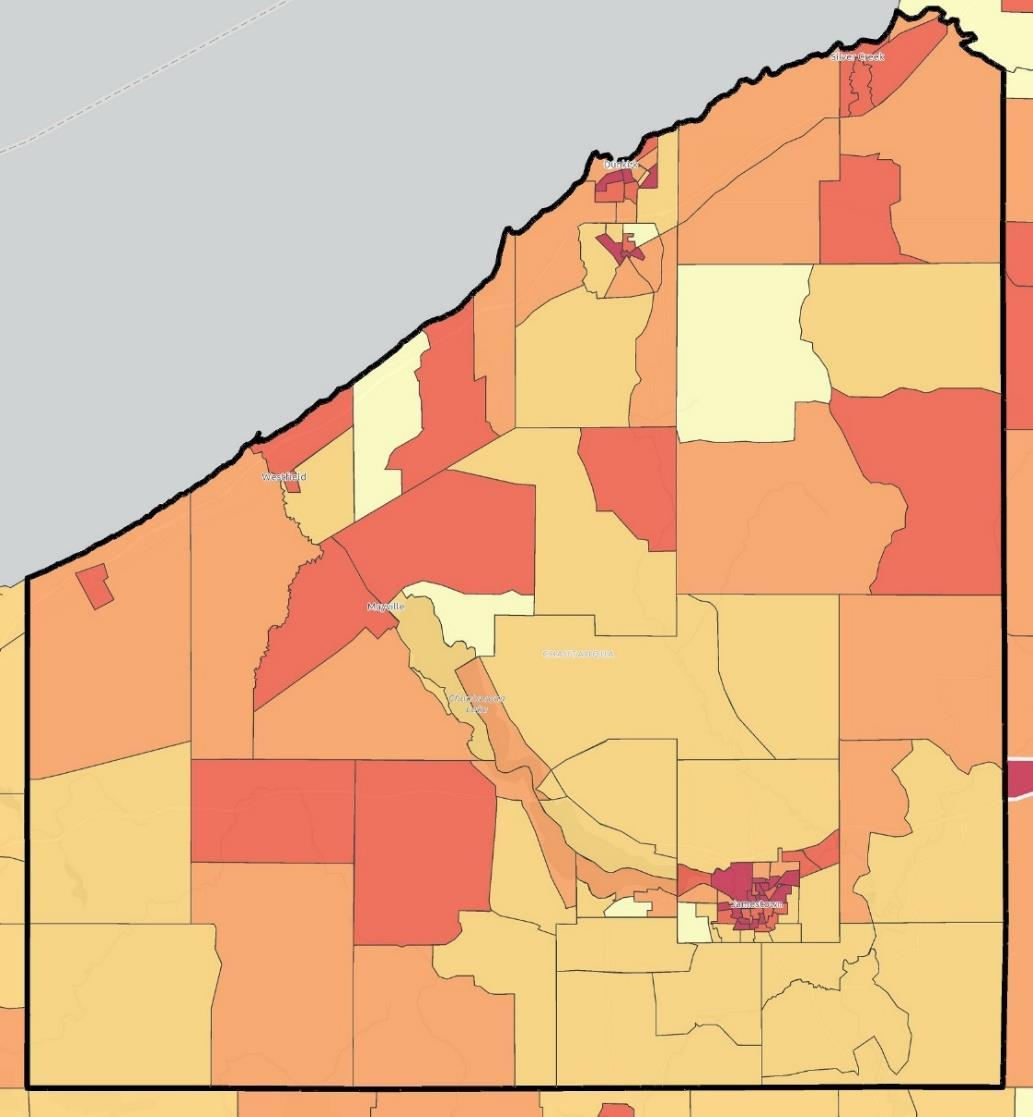
Source: Esri, Here, GarminSafeGraph
Chautauqua County Housing Market Analysis and Development Strategy
• The median home value in Chautauqua County is $112,483, while the median home value in the cities are around $76,000. This indicates that home values in the rural areas of the County are higher than those in the cities. There could be many reasons for this, including that rural homes tend to have more land and tend strongly towards single-family detached homes (as opposed to multi-unit structures).
• Esri’s Housing Affordability Index14 assesses the likelihood that residents of an area are able to purchase a typical home in that area Scores above 100 indicate an increasing likelihood that the residents are able to purchase a home in the area without being cost burdened. The County has an Affordability Index score of 170, compared to 76 in New York State as a whole. The score is slightly higher, 178, in Dunkirk, and a bit lower, 150, in Jamestown. This index, however, does not speak at all the quality or availability of a median priced home.
$250,000-$299,999
$750,000-$999,999
$1,000,000+
Source: Esri Housing Summary, ACS 2017-2021 Estimates
o According to the Housing Affordability Index, homeownership is more affordable in Chautauqua County than Erie County, NY and Erie County, PA, but less affordable than in Cattaraugus County, NY and Warren County, PA.
• Only 2.7% of homes in the County are valued at $500,000 or more, compared to 45.5% of homes that are valued at less than $100,000. In both of the cities, over 76% of the homes are valued under $100,000.
14 To derive the Housing Affordability Index score, an area’s median household income is compared to the annual cost of purchasing a home in the area. The latter is calculated to include mortgage and property tax expenses for a median value home, but not homeowners insurance, private mortgage insurance, or utilities. A score of 100 indicates that the median household income for the area is exactly sufficient to afford the purchase of a median value home.
• The high proportion of homes valued under $100,000 could indicate an overall lower cost of living, but could also be an indicator of housing quality issues or low market demand.
• Average gross rent in Chautauqua County is roughly half of that for New York State, again indicating affordability.
• Median gross rent for the County is $694. Rents in Dunkirk trend higher (median $731), while rents in Jamestown are lower (median $646).
• Over 60% of rental units in the County have a gross rent below $800. Nearly 75% of rental units in Jamestown have a gross rent of less than $800.
Source: Esri Housing Summary, ACS 2017-2021 Estimates
In recent years, the cities of Jamestown and Dunkirk have conducted studies to better understand the critical role of neighborhoods and the housing market on their fiscal capacity and ability to compete regionally for residents and resources. Within both communities, the prevalence of distressed properties creates the following issues: (1) undermining the tax base while burdening city services, (2) diminishing values of neighboring properties, (3) discouraging existing owners from investing in their own properties, and (4) putting the cities at a competitive disadvantage in the region.
In 2017, the City of Jamestown completed the “Neighborhood Revitalization Progress Report” as a follow up report examining the effectiveness of the strategies outlined in the “Reinvesting in Itself” neighborhood revitalization plan from 2010. The report found overall improvements in the average sale price and house quality inthe identifiedtarget areas that received intensive intervention following the 2010 report.
From the report, the map and chart to the right breakdown Jamestown’s housing market into the following five market types: “strong”, “healthy but stagnant”, “improving middle”, “soft and getting softer”, and “very weak”. The report found that in the City’s “strong” market type, 68% of homes were in excellent condition. This contrasts the City’s “very weak” housing market, where 52% of homes were in moderate to severe distress. Homes in moderate to serve distress were found across all five market types, suggesting that the City continues to struggle with extensive neglect despite intensive interventions over the past few years.
Additionally, Jamestown’s “very weak” housing market is home to approximately one-third of the City’s population and has a poverty rate over 45%.The “very weak” housing market also has the lowest home ownership rates at 31.5% and the highest abandonment rates at 12.2%.

In 2018, the City of Dunkirk commissioned the “Choosing Dunkirk: A Strengths-Based Strategy for Problem Properties in Dunkirk, NY” which found that 725 residential properties (approximately one out of every six houses) in the City displayed some combination of outward signs of distress and disinvestment.
The study found that the majority of problem properties in the City fell into three categories: (Type 1) vacant or high risk of vacancy, (Type 2) troubled rentals, and (Type 3) owner-occupied slipping or distressed. The Type 1 problem properties accounted for 183 residential units that were either vacant or had a high risk of vacancy. Type 1 properties made up approximately 4.2% of the City’s residential housing stock. The Type 2 problem properties accounted for 372 rental properties that exhibited numerous signs of deferred maintenance and prolonged neglect. Type 2 rental units made up 8.4% of the City’s residential properties. Type 3 properties accounted for 170 owner-occupied units that were either slipping into disrepair or were already distressed. Type 3 properties made up 3.9% of the City’s residential housing stock. All three types were found throughout the City; however, the largest concentrations of problem properties were along the edges of the downtown and the lakefront.
Additionally, the study divided the City into housing blocks and found that all blocks fell into the following sub-market categories: 12% “healthy”, 25% “stable”, 32% “at-risk”, 15% “weak”, and 15% “distressed”. The study found that in the City’s “healthy” market type, 80% of homes were in excellent condition. This contrasts the City’s “distressed” housing market, where 50% of homes were in moderate to severe distress. Problem properties were found in all of Dunkirk’s sub-markets with the following breakdown: 20 problem properties in the “healthy” market, 66 problem properties in the “stable” market, 167 problem properties in the “at-risk” market, and 183 problem properties in the “weak” market, and 289 problem properties in the “distressed” market.
The above analysis begins to revealsome trends and key factors that will be important toconsider in the development of a housing strategy. These include:
• There are an estimated 66,062 housing units in Chautauqua County, nearly one-third of which are in Jamestown and Dunkirk. This generally aligns with population trends.
• All areas of Chautauqua County have higher vacancy on average than New York State. However, over half (57.2%) of the vacant units in the County are Seasonal/Recreational units, particularly in areas outside of the Cities of Dunkirk and Jamestown.
• Over two thirds (68.4%) of the housing units in Chautauqua County are single-family, detached residences, compared to only 41.7% in the State overall.
• The housing stock in Chautauqua County is aging. The largest proportion of housing units in the County were built prior to 1940, so consideration should be given to the higher maintenance needs and potential health hazards of older homes.
• Home ownership is relatively affordable in the County, with a median home value in Chautauqua County of $112,483 and over 76% of the homes in Dunkirk and Jamestown valued under $100,000. However, this does not provide an indication of quality.
• As expected, in Dunkirk and Jamestown distressed properties tend to be concentrated in the weakest market areas. However, distressed properties are found throughout the Cities.
CCPEG engaged MRB Group to develop a Housing Market Analysis and Development Strategy addressing identified gaps. While the assessment is grounded in data, stakeholder input was also a critical step in the planning process. Through engaging with a committee and interviews with partners, local experts, and local municipal leaders, MRB Group was able to gather a better understanding of capabilities and capacity of partners, similarities and differences between communities, and the local challenges for housing development
The Project Steering Committee met four times throughout the planning process. They reviewed the various sections of this report and provided feedback. At and in between meetings, they also provided input about community partners, potential challenges to research, and information about programming that is already in place. The makeup of the committee, representing communities and key housing development partners, meant that they could act as a first line of information for the project team. In addition to providing information about existing programs, community organizations, and development opportunities, the Steering Committee stressed the need to clearly define and educate the public about the meaning of “affordability” in the current market. This led to additional investigation and focus on outlining specifically which populations and job categories tend to fall within the 60-120% AMI range, as well as developing language that can be easily referenced and used by implementation partners when communicating about affordability.
Outreach was conducted to Town Supervisors and Village and City Mayors, with a significant number of responses. Municipal officials were asked to identify and describe challenges their communities face in the housing market. The following themes were noted:
Chautauqua County’s housing stock is aging and in need of repair, especially the rental stock. However, local leaders report that landlords are unable or unwilling to make the necessary investments in their properties to improve housing quality. They indicated that rising costs and downward pressures on rents contribute to the hesitancy of property owners to invest in maintenance and upgrades. Low wages across the County make it difficult to finance property maintenance for both rentals and homeowners. Additionally, Mayors agreed that absentee landlords, who are not emotionally invested in the community, are out of touch with the maintenance needs of their properties and unconcerned with the well-being of their tenants. Complex ownership issues, like estate, probate, and LLCs add another layer of challenges for code enforcement.
Mayors expressed frustration with mandates surrounding what code enforcement is allowed to address (i.e. inspection frequency, property access, etc.). There is currently a disconnect between local courts and code enforcement personnel on the issues facing local governments
and how to address these issues. Moreover, local governments struggle to attract and retain qualified talent to work in code enforcement, reducing municipal enforcement capacity. However, there is opportunity here to create a culture of collaboration between courts, code enforcement, and local government to perfect case development, as many cases are currently thrown out of court for incomplete or noncompliant case presentation. Officials noted that local governments would be more able to contend with an aging housing stock if they received funding (i.e. ARPA) to manage programs and deploy resources, particularly to underserved communities in rural areas and communities with unsafe housing, such as Jamestown.
Local leaders report that there are few new builds in the County despite reasonable land costs. Development is restricted to existing properties, which are demolished for redevelopment, turned into short-term rentals, or repurposed as lower rent properties. Along the lakefront, land is more expensive and has attracted more outside investment compared to the rural and low-income properties beyond the lakeshore. This outside investment has prioritized large, high-end housing over smaller cottages and homes. High costs of labor and materials are making new development costly. Municipal officials identified struggles in attracting quality investors to facilitate new development that reflects the housing needs of the community. The lack of new development and reduced full-time resident population has concentrated the tax burden on fewer residents, many of whom are of lower income.
Despite a large low-income population and significant need for workforce housing in many communities, there is a lack of interest in lowincome and multi-family housing. Some single-family homes have been converted to duplexes and apartments, but the overwhelming preference among residents for single-family detached homes.
The growing need for senior housing has made it a priority in many communities, followed by workforce housing. Clustered, single-floor living targeted to seniors is proposed to meet this need. Workforce and senior housing developments were identified as targets for community development and resident attraction, since both types of housing are in demand and would retain current residents while also potentially attracting new residents from neighboring counties. In addition to new, quality housing stock, improvements in health care and quality of life will also be required to attract and retain residents, particularly seniors and families, who have greater health care needs.
The City of Dunkirk, which recently won a DRI, is an exception to the lack of new development seen elsewhere in the County. A number of housing projects are in development and there is growing investment and development interest. The City is also preparing to undertake a zoning update that would encourage new housing development.
Investors from outside of the County, who drive new development, have enabled the growth of short-term rentals along with a growing visitor and seasonal population. Short-term and traditional seasonal residents diminish the “neighborhood feel” in some communities and
subsequently reduce interest in broader community issues. Despite the prevalence of seasonal and short-term rentals, there are very few traditional rental housing options for residents.
The Chautauqua Institution, a nonprofit education center and summer resort, faces unique challenges largely brought on by the seasonal nature of their operations. The Institution needs housing for artists, staff, and visitors, and currently fills that need by renting rooms and homes since dedicated housing is currently unattainable due to costs and part-time occupancy.
Water and sewer infrastructure is generally felt to be adequate for community needs. Some municipalities are in the process of improving this infrastructure with the creation of sewer districts to reduce the dominance of septic systems in the County. Most communities are interested in creating or expanding their sewer systems but are unable to locally fund such a project.
The Planning Roundtable discussed local housing challenges, opportunities, and programs, and identified partners and funding resources available to address some of those challenges. Currently, Chautauqua County IDA’s Uniform Tax Exemption Policy (UTEP) does not specifically provide housing benefits, but the IDA does offer an adaptive reuse PILOT that housing could fit into. Developers struggle to navigate and layer the timing and requirements of the different programs offered by the County and State. To facilitate development, the County could look to do predevelopment work at target sites, improve zoning, and create an IDA-supported program that targets specific areas in the County for affordable housing.
Primary partners identified during the Roundtable include: the Chautauqua County Land Bank, Habitat for Humanity, the Department of Housing Human Services, a Housing Work Group, and various housing agencies including STEL. Current funding is largely provided by grants. Both Jamestown and Dunkirk have Community Development Block Grant (CDBG) entitlements to leverage for housing improvements and development. Jamestown also has a HOME program allocation. The rest of the County has not been active in the space of housing grants, largely due to a lack of capacity within component municipalities to find and apply for funding opportunities. A housing conditions inventory would help to provide a future basis for grant applications.
There are a number of housing projects in the pipeline, representing a mix of interests from upscale to senior to affordable housing. In Dunkirk, there is the Reagan Development, a workforce housing project with up to 80 units, as well as another 11-unit mixed-income adaptive reuse project. In Westfield, the Welch Building will provide senior housing with commercial development on the first floor, with potential to expand the project to vacant site in the Village of Falkner. In Jamestown a 9-story, 100,000 square foot building will be transformed into a mix of affordable, market rate, luxury, and hotel space.
Chautauqua County Housing Market Analysis and Development
Prime housing development sites that were identified in the Roundtable were the Silver Creek School in Silver Creek, which has been undergoing restoration for several years but currently sits unactive as agencies are unable to finance forward movement with SHPO requirements. Another site is the former Sunset Valley Golf Course, which has a conceptual plan but no developer. In Dunkirk, the 18-acre Meadows property and the Brookes Memorial Hospital offer opportunities for housing and mixed-use development. However, capacity to leverage these sites is limited across the board.
Five developers well-versed in Chautauqua County housing challenges and opportunities were interviewed to provide greater insight into the County’s housing efforts. As in other parts of the state and country, the rural nature of much of Chautauqua County can bring construction cost surprises that inhibit quality housing development at achievable rents, for both residents and developers. Incentives and aid to tackle these surprises, including tax abatements, PILOTS, and grants, should be considered in addition to flexible zoning that allows for denser housing development that developers need for financial feasibility.
Developers highlighted that single-family homes were not the primary target for development. Instead, they place emphasis on condos, patio homes with small yards, duplexes, triplexes, quadplexes, pentaplexes, and apartments. Developers expect to get $300,000 to $350,000 per unit. Rents for a 1-bedroom apartment range from $850 to $1,200 a month. Rents for 2-bedroom 2-bathroom residences on the nicest end of the spectrum reach $2,000 a month.
Seniors, homeless, and low-income are focus populations for housing development; there is a substantial need for supportive and transitional housing, which STEL, a housing provider for people with mental illness, is working to address with a 110-unit development in Jamestown. Current shelters in Chautauqua County are not enough to meet demand, and are concentrated in Jamestown, which means that some individuals are displaced when seeking shelter.
Housing rebuilds and renovations are another facet of the housing development market in Chautauqua County, which is characterized by an old and deteriorating housing stock. However, developers note that redevelopment of this older housing stock can often go awry with the varied remediation costs and structural issues. Infrastructure is another piece of the puzzle. While it is relatively decent in more urban areas like Dunkirk and Jamestown, infrastructure does not reach the many, more rural areas of the County, which contributes to some of the surprise construction costs developers face as they attempt to build new homes in rural areas, inhibiting development where it is needed most.
Overall, developers are most interested in the County looking at a PILOT and tax credits/abatements, any financial contributions they can make for housing development projects, and better zoning. Specifically, developers mentioned developing in Silver Creek, potentially demolishing the abandoned and deteriorated Silver Creek School to create around 24 new housing units.
Interviews with Chautauqua County agencies reinforced the challenges and opportunities identified in the Planning Roundtable and developer interviews. They highlight the need for more rental housing in rural and small-town areas like Silver Creek, the need for more supportive and transitional housing, and lead remediation and housing safety and affordability.
Chautauqua County residents struggle with the rising cost of living that is accompanied by rising housing costs, driven by out-of-county purchasers and developers, who are suspectedto suck the value out of properties, leaving them dilapidated and unsafe whenthey inevitably go to auction. While rents have increased, housing quality has not, and community agencies urge for improved conditions, which may be achievable through increased funding, code enforcement, and housing inspections. However, the agencies note that the current political landscape in the County is not conducive to more regulation.
There is a justified County-wide focus on Jamestown, which struggles with a large population of homeless, disabled, and aging individuals, all of whom need housing support. A crucial part of that process is ensuring that individuals have access to employment opportunities in the area. As it stands, it is difficult for organizations to find employment for the people they serve, and still harder to find safe and appropriate housing near that employment. Additionally, Jamestown boasts the second highest rate of lead poisoning for kids in the state, largely driven by the old housing stock that needs lead remediation. The Jamestown Housing Authority a HUD-funded public authority that manages 248 apartments at full capacity has a long waiting list, currently at 160 individuals, down from a peak of over 300, demonstrating the demand and need for more housing in Jamestown.
Stakeholder engagement was critical in the development of the strategies within this plan. The project team successfully gathered valuable insights and information through committee meetings and interviews. The findings from these engagements revealed key thematic areas, opportunities, and challenges.
The Steering Committee stressed the importance of clearly communicating about what housing affordability looks like today. This will be critical to garner buy-in from communities and residents for projects that aim to provide affordable housing for the workforce. Interviews with local municipal leaders highlighted a shared desire to preserve community character while still allowing for needed development, particularly of workforce and senior housing. Additionally, common challenges were identified, including an aging housing stock, non-local landlords, challenges with code enforcement, and a lack of traditional rental housing. Developers identified zoning, construction costs, and the rural nature of much of the County as challenges. Meanwhile, community partner agencies stressed housing safety and affordability as critical issues to address.